Embed Size (px)
Citation preview
EUROPEAN UNIVERSITY STUDENTS’ ENVIRONMENT 79
Learning Environments Research 2: 79–98, 1999. © 1999 Kluwer Academic Publishers. Printed in the Netherlands.
RONNY F. A. WIERSTRA, GELLOF KANSELAAR, JOS L. VAN DER LINDENAND HANS G. L. C. LODEWIJKS
LEARNING ENVIRONMENT PERCEPTIONS OF EUROPEANUNIVERSITY STUDENTS
Received 24 April 1998; accepted (in revised form) 17 February 1999
ABSTRACT. This article describes a study of the experiences of 610 Dutch students and 241European students who studied at least three months abroad within the framework of aninternational exchange program. The Dutch students went to a university in another Europeancountry and the foreign students went to a Dutch university. Using a new questionnaire calledthe Inventory of Perceived Study Environment (IPSE), students’ perceptions of eightcharacteristics of the university learning environment were measured concerning the homeuniversity, the host university and the ideal learning environment. With this instrument, thelearning environment can be described in terms analogous to the learning strategies performed.Large differences were found between the different countries in university learningenvironments, but students from different countries had strikingly similar opinions concerningtheir desired learning environment. There was a strong preference for activating instructionwith a low threshold in teacher-student interaction and more room for student alternatives.
KEY WORDS: higher education, instructional preferences, learning environment,questionnaire development, student exchange, teaching style
1. INTRODUCTION
In this article, we report results of a study of the experiences of Dutchstudents and other European students who have studied at least three monthsabroad within the framework of international exchange programs. The Dutchstudents went to a university in another European country and the foreignstudents went to a Dutch university. The project was carried out at therequest of the Dutch Organization for International Cooperation in HigherEducation (NUFFIC). The motive for the project was that studying at aforeign university makes on students unknown demands that are differentfrom what students are used to at their own university. It is important toknow to what extent these discrepancies occur, how they are looked uponby the student, and whether these discrepancies give rise to problems andchanges in learning strategies.
Research into the influence of the learning environment on the way oflearning (the ‘learning strategy’) is relatively new. There certainly is someexperience in the field of investigation in terms of relationships betweenlearning environment and learning outcomes (see Fraser, 1998), but the
WIERSTRA, KANSELAAR, VAN DER LINDEN AND LODEWIJKS80
learning strategy used by students in this research usually functions as a blackbox. In order to investigate the influence of learning environment perceptionson learning strategies, Wierstra and Beerends (1996) tried to describe learningenvironment perceptions in the same terms as used for learning strategies.They devised the Inventory of Process Aspects of the Learning environment(IPAL) in close connection with the Inventory of Learning Styles (ILS)(Vermunt, 1992, 1993, 1998). Indeed, using the IPAL, it was possible todescribe learning environments in the same terms as learning strategies. Forexample, a learning strategy can be oriented towards reproduction, but thisreproduction-centredness can also apply to the learning environment(Hollanders, 1995; Wierstra & Beerends, 1996). An interesting questioninvolves the extent to which the reproduction-centredness of the learningenvironment encourages a student to learn in a reproductive way. Someindications for this relationship are reported in literature (Meyer & Muller,1990; Meyer & Parsons, 1989; Ramsden, 1992), but learning environmentperceptions interact with other factors. The model of Wierstra andBeerends (1996) mentions some of these factors, such as the cognitiveand affective entering characteristics of the student with regard to theinstructional content.
The present study concerned cross-cultural aspects of learning environ-ments and learning strategies. In the literature, hardly any starting points forinvestigating this can be found. It is remarkable that some cross-culturalresearch on learning strategies (Entwistle et al., 1989; Volet et al., 1994)speculates about the influence of learning environment perceptions, but thatthis variable itself hardly ever has been measured in this research. In ourinvestigation, we considered it wise to measure the learning environmentperceptions of students explicitly.
The project started with a pilot study involving interviews with 18 foreignstudents in The Netherlands and 60 Dutch students who had participatedin an exchange program. The interviews indicated, among other things, largedifferences in university learning environment between The Netherlands andSouth European countries. South European students experienced theuniversity learning environment in The Netherlands as more directed in termsof the learning of meaningful relations instead of mere reproduction, whencompared with the learning environment at their own university. In theopinion of the South European students, the learning environment at theirown university was oriented more towards knowledge transmission byteachers and knowledge reproduction by students (Evers, 1995). Further-more, there were large differences in the psychological distance between theteacher and student. In the South European situation, the teacher is generallymore difficult to approach than in the Dutch and North European situation
EUROPEAN UNIVERSITY STUDENTS’ ENVIRONMENT 81
(Evers, 1995; Huijbregts & Roepers, 1995). In the main study, to whichwe restrict our attention in this article, we collected questionnaire data on alarger group of exchange students. In the questionnaire, learning strategiesand learning environment perceptions were measured in a standardised andquantitative way. This article is restricted to the learning environmentpart of the survey. For an overall report of the investigation, includingthe learning strategy results, refer to Wierstra et al. (1997) andKanselaar et al. (1998).
The general problem in the present learning environment study involvedthe extent to which students experience a change in learning environmentduring the exchange and how they perceive it. This question was dividedinto three subquestions:
1. How do students of different countries experience the learningenvironment at their (home) university?
2. Do students experience discrepancies between the learning environmentat their own (home) university and the learning environment at the hostuniversity?
3. How satisfied are the students with the home and host learningenvironment? What type of learning environment do the studentsconsider desirable (ideal environment)? Is the ideal learning environmentdifferent for students of different countries and is it similar to the homeenvironment in certain respects?
2. METHOD
2.1. Procedure
The Nuffic organisation and several Dutch universities assisted us incollecting the addresses of Dutch and foreign exchange students. Thequestionnaire, which has an optically-readable answer sheet, and a self-addressed envelope were sent out to 998 foreign students, who were studyingin The Netherlands during the exchange period (at least three months), andto 2449 Dutch students studying abroad.
The Dutch students received a questionnaire in the Dutch language,whereas the foreign students’ questionnaire was in the English language. Alarge part of the questionnaire refers to the measurement of learningstrategies (borrowed from the Inventory of Learning Styles of Vermunt,1992) and to the measurement of learning environment aspects. The closedquestions on learning environment constitute the Inventory of PerceivedStudy Environment (IPSE). In the IPSE, the student is asked about the
WIERSTRA, KANSELAAR, VAN DER LINDEN AND LODEWIJKS82
learning environment at the home university and at the foreignuniversity, and about the desired learning environment. In addition tothe closed questions making up the scales, some separate openquestions are included in the questionnaire. In this article, we restrictourselves to a description of the learning environment questions: boththe IPSE and the open questions about the learning environment.
2.2. Subjects
We received data from 610 Dutch students and 241 foreign students. Of theserespondents, 76% had studied three years or more before they participated inthe exchange program. Probably, the low response rate of 20–25% is largelydue to the extensiveness of the questionnaire (with remarks made by studentson the questionnaire confirming this hypothesis) and the mobility of studentsafter four years of study, which rendered invalid many initial addresses.
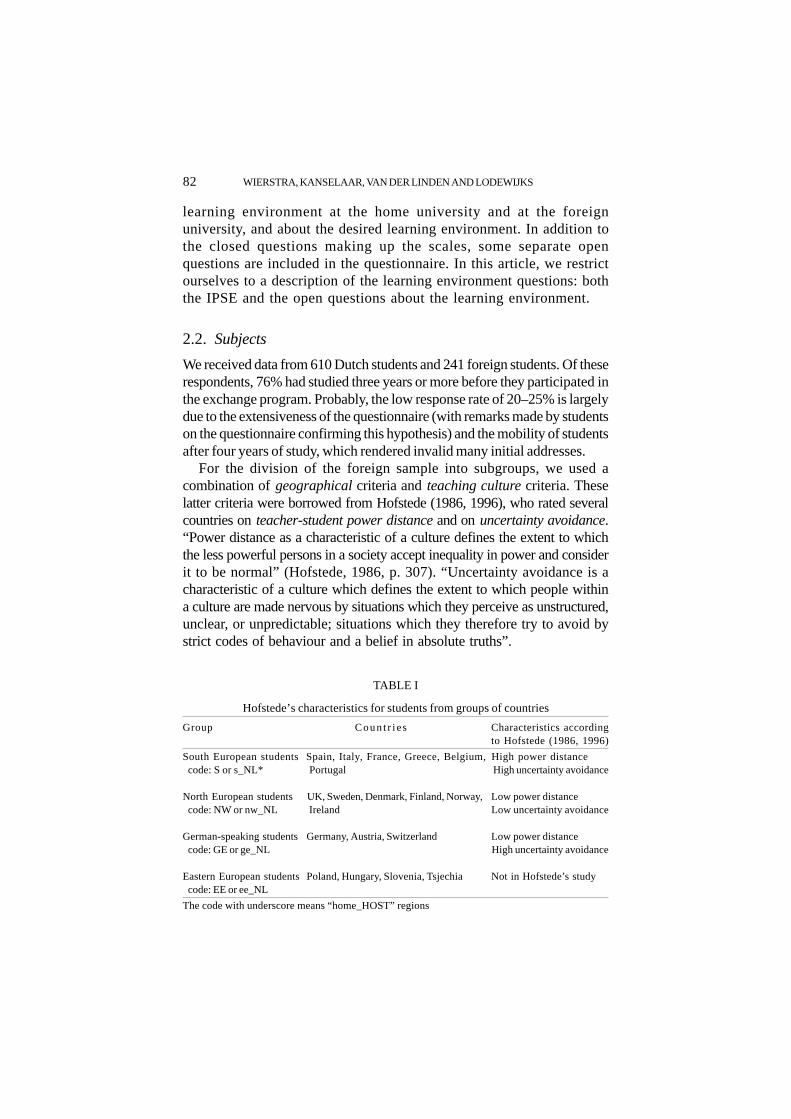
For the division of the foreign sample into subgroups, we used acombination of geographical criteria and teaching culture criteria. Theselatter criteria were borrowed from Hofstede (1986, 1996), who rated severalcountries on teacher-student power distance and on uncertainty avoidance.“Power distance as a characteristic of a culture defines the extent to whichthe less powerful persons in a society accept inequality in power and considerit to be normal” (Hofstede, 1986, p. 307). “Uncertainty avoidance is acharacteristic of a culture which defines the extent to which people withina culture are made nervous by situations which they perceive as unstructured,unclear, or unpredictable; situations which they therefore try to avoid bystrict codes of behaviour and a belief in absolute truths”.
TABLE I
Hofstede’s characteristics for students from groups of countries
Group Count r ies Characteristics accordingto Hofstede (1986, 1996)
South European students Spain, Italy, France, Greece, Belgium, High power distancecode: S or s_NL* Portugal High uncertainty avoidance
North European students UK, Sweden, Denmark, Finland, Norway,Low power distancecode: NW or nw_NL Ireland Low uncertainty avoidance
German-speaking students Germany, Austria, Switzerland Low power distancecode: GE or ge_NL High uncertainty avoidance
Eastern European students Poland, Hungary, Slovenia, Tsjechia Not in Hofstede’s studycode: EE or ee_NL
The code with underscore means “home_HOST” regions
EUROPEAN UNIVERSITY STUDENTS’ ENVIRONMENT 83
On the basis of geographical criteria and power distance anduncertainty avoidance, the group of foreign students can be subdividedinto the four groups shown in Table I.
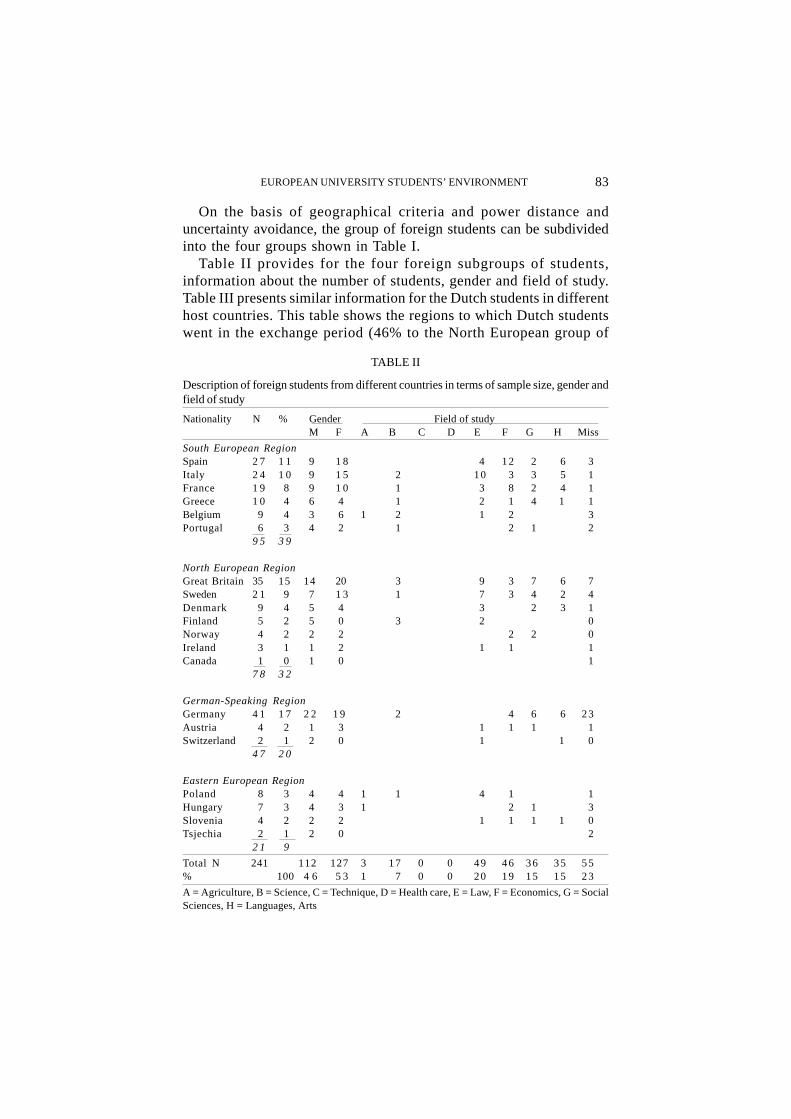
Table II provides for the four foreign subgroups of students,information about the number of students, gender and field of study.Table III presents similar information for the Dutch students in differenthost countries. This table shows the regions to which Dutch studentswent in the exchange period (46% to the North European group of
TABLE II
Description of foreign students from different countries in terms of sample size, gender andfield of study
Nationality N % Gender Field of studyM F A B C D E F G H Miss
South European RegionSpain 2 7 1 1 9 1 8 4 12 2 6 3Italy 2 4 1 0 9 1 5 2 10 3 3 5 1France 1 9 8 9 1 0 1 3 8 2 4 1Greece 1 0 4 6 4 1 2 1 4 1 1Belgium 9 4 3 6 1 2 1 2 3Portugal 6 3 4 2 1 2 1 2
9 5 3 9
North European RegionGreat Britain 35 15 14 20 3 9 3 7 6 7Sweden 2 1 9 7 1 3 1 7 3 4 2 4Denmark 9 4 5 4 3 2 3 1Finland 5 2 5 0 3 2 0Norway 4 2 2 2 2 2 0Ireland 3 1 1 2 1 1 1Canada 1 0 1 0 1
7 8 3 2
German-Speaking RegionGermany 4 1 1 7 2 2 1 9 2 4 6 6 23Austria 4 2 1 3 1 1 1 1Switzerland 2 1 2 0 1 1 0
4 7 2 0
Eastern European RegionPoland 8 3 4 4 1 1 4 1 1Hungary 7 3 4 3 1 2 1 3Slovenia 4 2 2 2 1 1 1 1 0Tsjechia 2 1 2 0 2
2 1 9
Total N 241 112 127 3 17 0 0 49 46 36 35 55% 100 4 6 5 3 1 7 0 0 20 19 15 15 23
A = Agriculture, B = Science, C = Technique, D = Health care, E = Law, F = Economics, G = SocialSciences, H = Languages, Arts
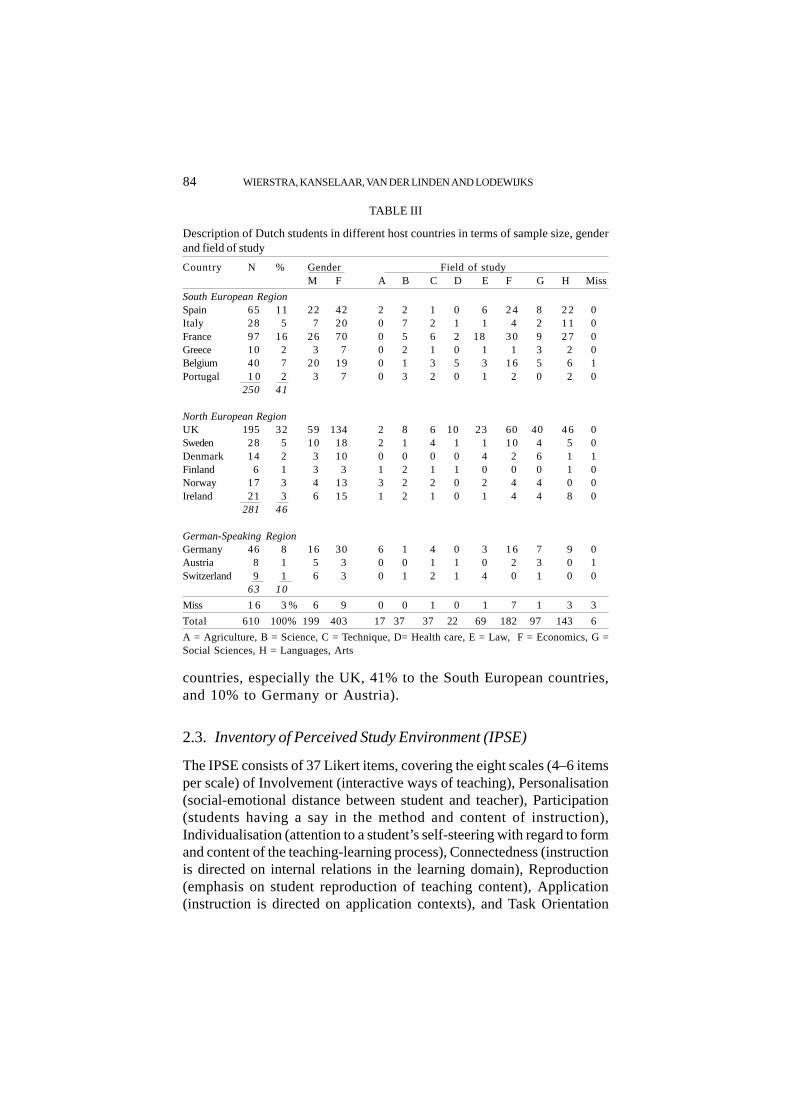
WIERSTRA, KANSELAAR, VAN DER LINDEN AND LODEWIJKS84
countries, especially the UK, 41% to the South European countries,and 10% to Germany or Austria).
2.3. Inventory of Perceived Study Environment (IPSE)
The IPSE consists of 37 Likert items, covering the eight scales (4–6 itemsper scale) of Involvement (interactive ways of teaching), Personalisation(social-emotional distance between student and teacher), Participation(students having a say in the method and content of instruction),Individualisation (attention to a student’s self-steering with regard to formand content of the teaching-learning process), Connectedness (instructionis directed on internal relations in the learning domain), Reproduction(emphasis on student reproduction of teaching content), Application(instruction is directed on application contexts), and Task Orientation
TABLE III
Description of Dutch students in different host countries in terms of sample size, genderand field of study
Country N % Gender Field of studyM F A B C D E F G H Miss
South European RegionSpain 65 11 22 42 2 2 1 0 6 24 8 22 0Italy 28 5 7 20 0 7 2 1 1 4 2 11 0France 97 16 26 70 0 5 6 2 18 30 9 27 0Greece 10 2 3 7 0 2 1 0 1 1 3 2 0Belgium 40 7 20 19 0 1 3 5 3 16 5 6 1Portugal 1 0 2 3 7 0 3 2 0 1 2 0 2 0
250 41
North European RegionUK 195 32 59 134 2 8 6 10 23 60 40 46 0Sweden 28 5 10 18 2 1 4 1 1 10 4 5 0Denmark 14 2 3 10 0 0 0 0 4 2 6 1 1Finland 6 1 3 3 1 2 1 1 0 0 0 1 0Norway 17 3 4 13 3 2 2 0 2 4 4 0 0Ireland 21 3 6 15 1 2 1 0 1 4 4 8 0
281 46
German-Speaking RegionGermany 46 8 16 30 6 1 4 0 3 16 7 9 0Austria 8 1 5 3 0 0 1 1 0 2 3 0 1Switzerland 9 1 6 3 0 1 2 1 4 0 1 0 0
63 10
Miss 1 6 3 % 6 9 0 0 1 0 1 7 1 3 3
Total 610 100% 199 403 17 37 37 22 69 182 97 143 6
A = Agriculture, B = Science, C = Technique, D= Health care, E = Law, F = Economics, G =Social Sciences, H = Languages, Arts
EUROPEAN UNIVERSITY STUDENTS’ ENVIRONMENT 85
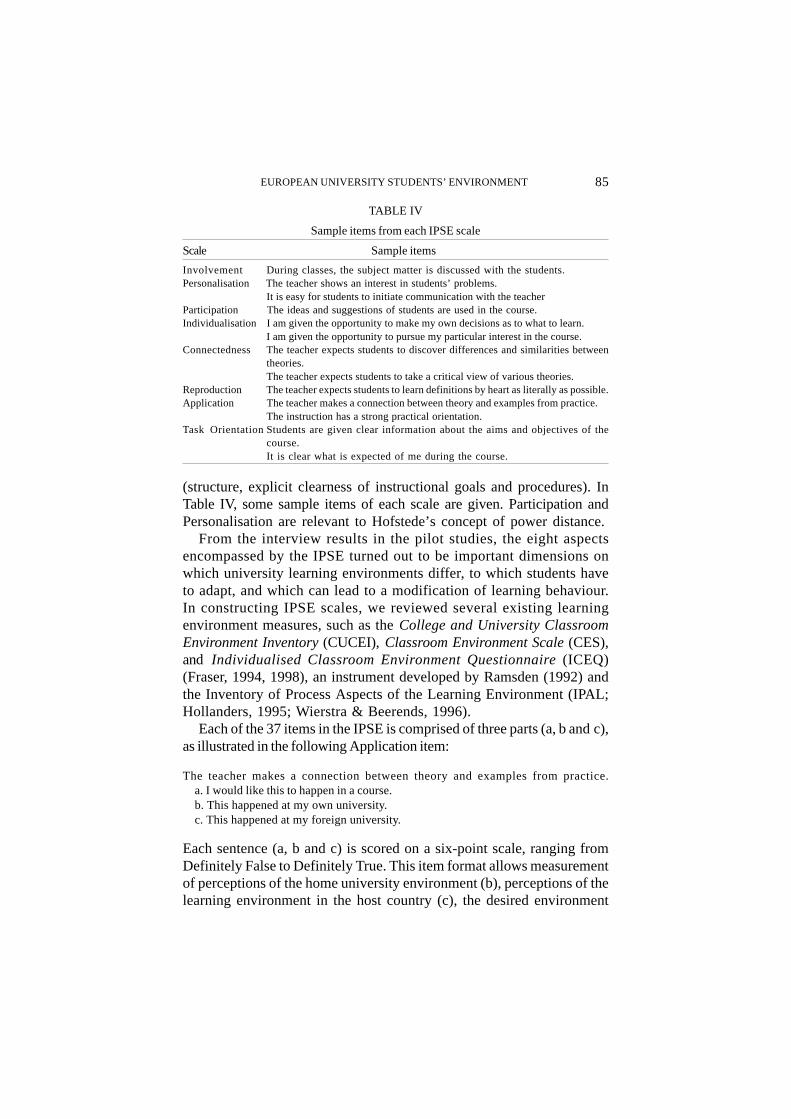
(structure, explicit clearness of instructional goals and procedures). InTable IV, some sample items of each scale are given. Participation andPersonalisation are relevant to Hofstede’s concept of power distance.
From the interview results in the pilot studies, the eight aspectsencompassed by the IPSE turned out to be important dimensions onwhich university learning environments differ, to which students haveto adapt, and which can lead to a modification of learning behaviour.In constructing IPSE scales, we reviewed several existing learningenvironment measures, such as the College and University ClassroomEnvironment Inventory (CUCEI), Classroom Environment Scale (CES),and Individualised Classroom Environment Questionnaire (ICEQ)(Fraser, 1994, 1998), an instrument developed by Ramsden (1992) andthe Inventory of Process Aspects of the Learning Environment (IPAL;Hollanders, 1995; Wierstra & Beerends, 1996).
Each of the 37 items in the IPSE is comprised of three parts (a, b and c),as illustrated in the following Application item:
The teacher makes a connection between theory and examples from practice.a. I would like this to happen in a course.b. This happened at my own university.c. This happened at my foreign university.
Each sentence (a, b and c) is scored on a six-point scale, ranging fromDefinitely False to Definitely True. This item format allows measurementof perceptions of the home university environment (b), perceptions of thelearning environment in the host country (c), the desired environment
TABLE IV
Sample items from each IPSE scale
Scale Sample items
Involvement During classes, the subject matter is discussed with the students.Personalisation The teacher shows an interest in students’ problems.
It is easy for students to initiate communication with the teacherParticipation The ideas and suggestions of students are used in the course.Individualisation I am given the opportunity to make my own decisions as to what to learn.
I am given the opportunity to pursue my particular interest in the course.Connectedness The teacher expects students to discover differences and similarities between
theories.The teacher expects students to take a critical view of various theories.
Reproduction The teacher expects students to learn definitions by heart as literally as possible.Application The teacher makes a connection between theory and examples from practice.
The instruction has a strong practical orientation.Task OrientationStudents are given clear information about the aims and objectives of the
course.It is clear what is expected of me during the course.
WIERSTRA, KANSELAAR, VAN DER LINDEN AND LODEWIJKS86
(a), dissatisfaction with the home environment, which is the absolutevalue of |a – b|, dissatisfaction with the host environment, |a – c|,and preference for the home environment relative to host en-vironment, namely, (|a – c| – |a – b|). The latter preference measureindicates how much closer the desired learning environment is tothe home learning environment than to the host learning en-vironment. A preference score greater than zero indicates that astudent is more content with the home learning environment thanwith the host learning environment, whereas a preference score ofless than zero indicates the reverse.
The a priori distinctions between the eight study environmentconstructs in Table IV were confirmed by factor analysis on the 37items and by correlational analysis at the scale level. Most of thecorrelations between the eight scales of the home university en-vironment (and of the host university environment, and of the desiredenvironment) were rather low, which indicates satisfactory dis-criminant validity for the eight constructs. Only for the construct ofInvolvement were there some high correlations with other constructs.Both in the Dutch group (610 students) and in the foreign group (241students), Involvement in the home environment was positivelycorrelated with Personalisation (0.65 and 0.74), Application (both0.58), Individualisation (0.43 and 0.56) and Connectedness (0.41and 0.52).
For each of the eight constructs, we also calculated the three correlationsbetween the scales for the home, host, and desired environment. The averagecorrelation was rather low (0.13) in the entire group, indicating thatthe assessments of home, host and desired environment can beconceived as independent (in agreement with our intentions and withresults of Wierstra et al., 1987 and Wierstra & Beerends, 1996).
The internal consistency of the 24 scales (eight scales each for home, hostand desired perceptions) were high. For the entire group of 851 students,Cronbach alpha reliability coefficients ranged from 0.88 to 0.97.
2.4. Open Questions About Comparisons of Home and HostUniversity Learning Environments
Apart from the closed IPSE questions, we also asked some open questionsfor which the students were asked to describe differences between theirhome university learning environment and the host university learningenvironment. We also asked students which aspects of each learningenvironment they prefer and for what reasons.
EUROPEAN UNIVERSITY STUDENTS’ ENVIRONMENT 87
3. RESULTS
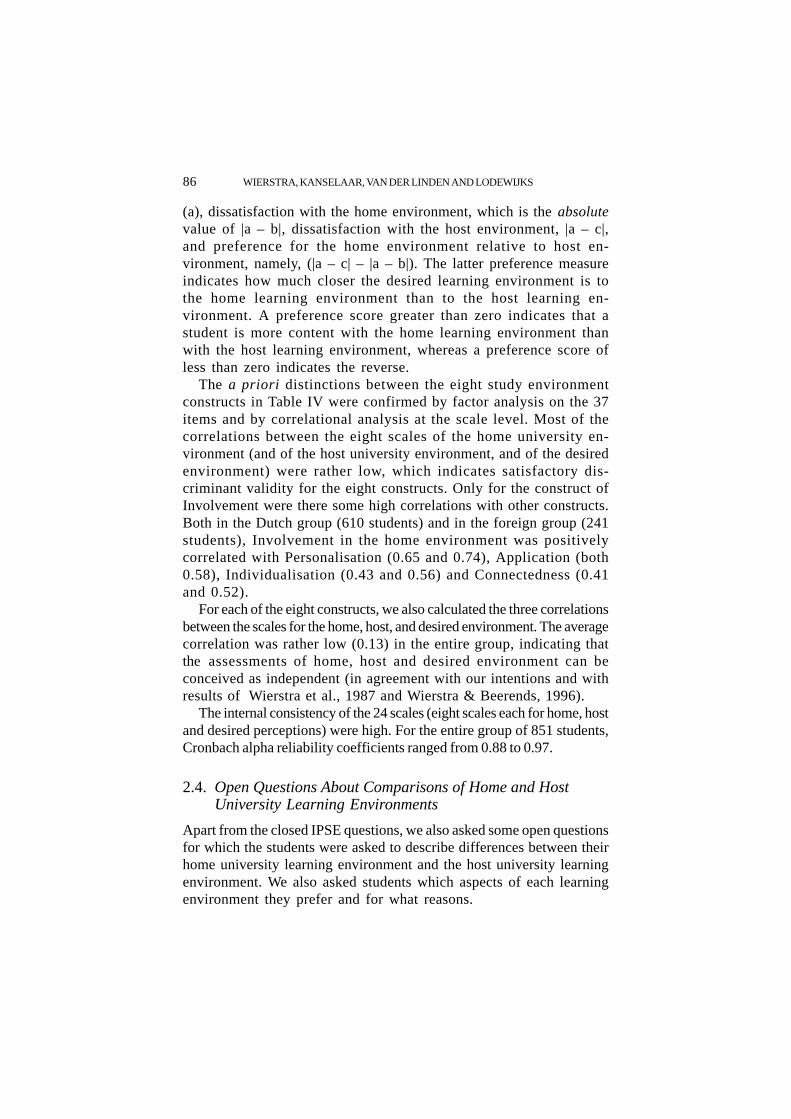
3.1. Learning Environment Means for Seven Groups
For the 24 IPSE scales (home, host and desired learning environment oneight constructs), the mean scores for seven groups of students werecalculated. The seven groups refer to the three Dutch groups from TableIII and the four non-Dutch groups from Tables I and II. The results forPersonalisation for six groups are graphed in Figure 1. The scores aremean scale scores at the item level (i.e. the student scale score dividedby the number of completed items). In Figure 1, for the oppositeexchange groups (e.g. for Dutch students going to South Europe andSouth European students going to The Netherlands), the home andthe host environment graphs intersect. This is what we expect for apair of strongly contrasting learning environments. This issue iselaborated in section 3.3.
3.2. Perception of the Home University Learning Environment
Figure 1. Personalisation means for six exchange groups: nl_S: Dutch students going toSouth Europe; s_NL: South European students coming to The Netherlands; nl_NW: Dutchstudents going to North Europe; nw_NL: North European students coming to TheNetherlands; nl_GE: Dutch students going to German speaking countries; ge_NL: studentsfrom German speaking countries coming to The Netherlands.
WIERSTRA, KANSELAAR, VAN DER LINDEN AND LODEWIJKS88
We tried to find out whether the perceived learning environment atthe home university was different for the Dutch group and the fournon-Dutch groups distinguished in Tables I and II, namely, the SouthEuropean group, the North European group, the group of German-speaking countries and the Eastern European group (research question1). The use of MANOVA revealed that there were large and statisticallysignificant differences between the five groups. The South Europeanstudents appeared to have the highest score on Reproduction and thelowest scores on all other variables (with the exception of Connectednessfor which the East European group scored the lowest). Thus, in theeyes of the South Europeans, the learning environment at theiruniversity was not very activating.
Because the student exchange was from The Netherlands to aforeign country and vice versa, we were especially interested in thedifferences between the Dutch learning environment on the one handand the four foreign learning environments on the other hand. For eachof the eight learning environment aspects, we conducted t-tests for thestatistical significance of the differences in the home universityenvironment between the Dutch group and each of the four other groups.We found strong and statistically significant differences between theDutch group and the South European group on all learning environmentdimensions. The Dutch learning environment seems much moreactivating than the South European one. Furthermore, we foundsignificant differences between the Dutch group and the group of German-speaking countries on Personalisation, Involvement, Application and TaskOrientation (all higher for the Dutch learning environment), and betweenthe Dutch group and the East European group on Personalisation,Individualisation, Connectedness and Task Orientation (all higher forthe Dutch environment). There were smaller differences between theDutch and the North European learning environment (i.e. the profileswere close together). The Dutch group and the North European groupdiffered significantly only on Connectedness, in favour of the Dutchlearning environment.
3.3. Changes in Learning Environment: Discrepancies ExperiencedBetween Home and Host University Learning Environment
In view of the above results for the home university environment (researchquestion 1), we expected that Dutch students studying in a South Europeancountry and South European students coming to The Netherlands wouldexperience a change in learning environment. In order to investigate
EUROPEAN UNIVERSITY STUDENTS’ ENVIRONMENT 89
whether this experience occurs (research question 2), we computed foreach student for each of the eight learning environment constructs alearning environment change score which is the difference scoreobtained by subtracting the home learning environment score from thehost learning environment score. For Dutch students who studied in aSouth European country, this change score turned out to be greaterthan zero for Reproduction, and less than zero for the other learningenvironment aspects. According to our expectation, the eight changescores of South European students were significantly different fromthe change scores of the Dutch students and opposite in sign.
For Dutch students going to a German-speaking country, the changescores for six of the eight learning environment aspects were oppositein sign to the change scores of students from those countries coming toThe Netherlands. The differences between the two groups werestatistically significant for change scores on Personalisation,Involvement, Application and Task Orientation. These results areconsistent with the results for research question 1.
Furthermore, we found statistically significant differences for all learningenvironment aspects except Involvement for the change scores of Dutchstudents going to a North European country and North European studentsgoing to The Netherlands, in the direction of a stronger activating environ-ment at the North European universities. Both Dutch students and studentsfrom the North European countries experienced the North European learningenvironment to be more activating than the Dutch learning environment.Except for Connectedness, we did not expect this result because of the similarprofiles of the North European and Dutch universities (research question 1).This result could have arisen because the analysis was carried out withstudents who had experienced both the Dutch and the North Europeanlearning environment.
Next we consider the results of the open question to the students aboutwhat differences they experienced between the teaching at the home andthe host university. Above all, students mentioned aspects of StudentInvolvement and Personalisation in response to this question.
3.3.1. Extent of Student InvolvementDutch students who had studied in France, Italy, Spain, Portugal and Belgiumhad the impression that little student involvement is expected with regardto decisions about the study program and expressing opinions. In France,Italy and Spain, almost the only way of teaching is giving lectures. Especiallyin France and Spain, Dutch students experienced the teaching as verytraditional with an emphasis on taking notes. Learning from notes is
WIERSTRA, KANSELAAR, VAN DER LINDEN AND LODEWIJKS90
more important than reading books. Respondents from southerncountries assessed their own courses as being more formal, morecrowded, less personal, more passive and more theoretical than theDutch courses. They were of the opinion that, in The Netherlands,there is more independent self-study and the universities have goodfacilities, such as library, computers and up-to-date books.
In England, Scotland, Ireland, Sweden and Norway, the student isexpected to work more independently than in the Dutch situation. This wasthe opinion both of the native students of these countries and of theDutch exchange students. In England, there is frequent use of tutorialsand much attention (according to Dutch students) for conceptualrelations and for the relation between theory and practice. In theScandinavian countries, projects and group assignments are frequentlyused. In Sweden, there is much attention to theory-practice relations.In Denmark, there is an emphasis on conceptual relations. In Englandand the Scandinavian countries, students are also asked for essays andmuch opportunity for discussion is offered.
3.3.2. Extent of PersonalisationThe Dutch students who had studied in a country of the SouthEuropean group (Spain, Italy, France, Greece, Portugal and Belgium)considered the teachers in those countries to be authoritarian,impersonal, detached and inaccessible for questions or problems whencompared with teachers in The Netherlands. This opinion was sharedby the South-European students who study there. Students fromSouthern countries found the contact between teacher and studentmore personal in The Netherlands and asserted that teachers are lessauthoritarian and that there is more consideration for students’opinions.
Dutch students who had been in Germany, Austria, Switzerland, Irelandand Scotland were confronted in the host country with a learning environ-ment which has less personalisation than they are used to. Many studentsfrom Germany, Sweden, Finland, Norway and Ireland judged the teacher-student contact in The Netherlands to be more personal and the Dutchteachers to be very student-centred.
Many Dutch students experienced stronger personalisation in Denmarkand England. This is consistent with reports of students from these countrieswho find the teacher-student contact in The Netherlands less personal thanin their own country.
In the next section, we concentrate on the learning environment as desiredby the students (research question 3).
EUROPEAN UNIVERSITY STUDENTS’ ENVIRONMENT 91
3.4. Learning Environment Appraisal
3.4.1. Similarity Between Nationalities in Learning EnvironmentDesires
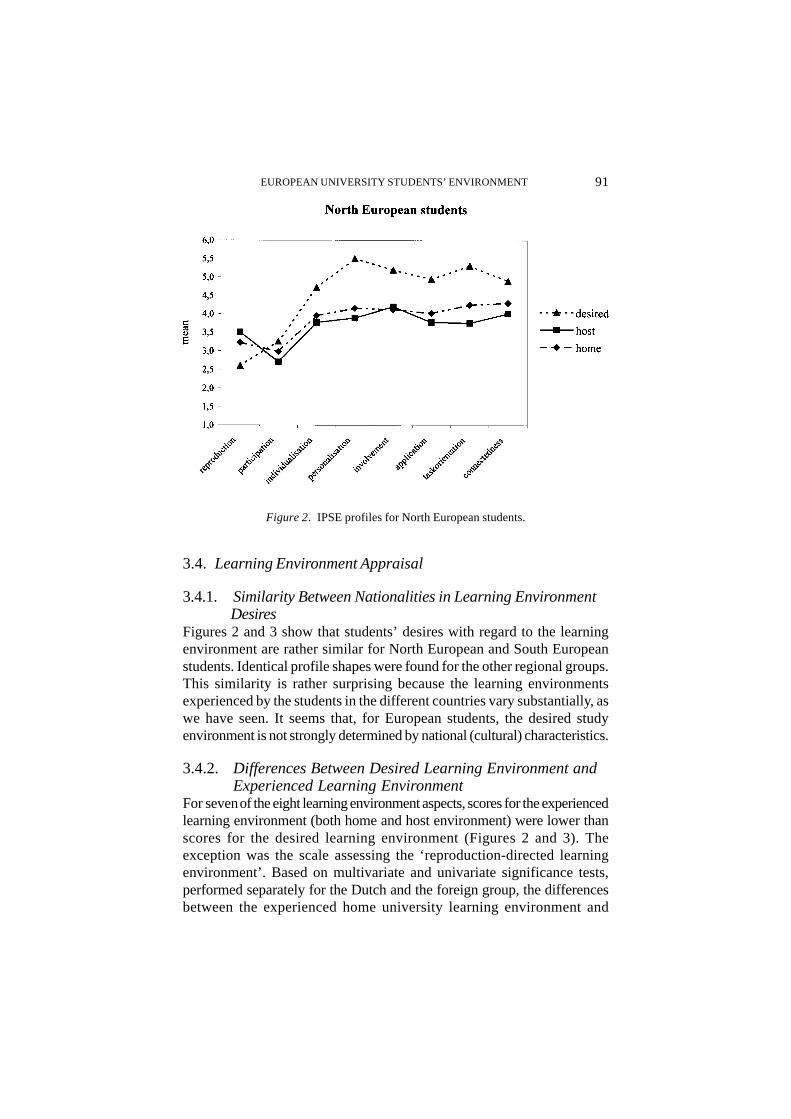
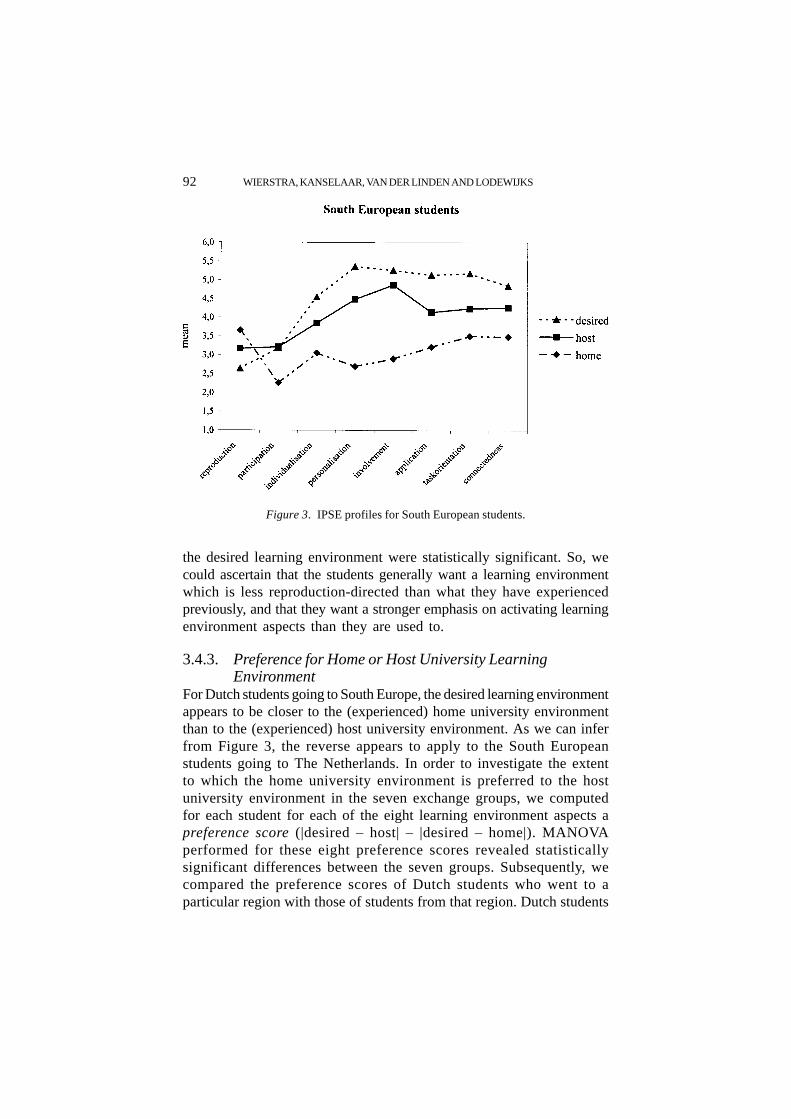
Figures 2 and 3 show that students’ desires with regard to the learningenvironment are rather similar for North European and South Europeanstudents. Identical profile shapes were found for the other regional groups.This similarity is rather surprising because the learning environmentsexperienced by the students in the different countries vary substantially, aswe have seen. It seems that, for European students, the desired studyenvironment is not strongly determined by national (cultural) characteristics.
3.4.2. Differences Between Desired Learning Environment andExperienced Learning Environment
For seven of the eight learning environment aspects, scores for the experiencedlearning environment (both home and host environment) were lower thanscores for the desired learning environment (Figures 2 and 3). Theexception was the scale assessing the ‘reproduction-directed learningenvironment’. Based on multivariate and univariate significance tests,performed separately for the Dutch and the foreign group, the differencesbetween the experienced home university learning environment and
Figure 2. IPSE profiles for North European students.
WIERSTRA, KANSELAAR, VAN DER LINDEN AND LODEWIJKS92
the desired learning environment were statistically significant. So, wecould ascertain that the students generally want a learning environmentwhich is less reproduction-directed than what they have experiencedpreviously, and that they want a stronger emphasis on activating learningenvironment aspects than they are used to.
3.4.3. Preference for Home or Host University LearningEnvironment
For Dutch students going to South Europe, the desired learning environmentappears to be closer to the (experienced) home university environmentthan to the (experienced) host university environment. As we can inferfrom Figure 3, the reverse appears to apply to the South Europeanstudents going to The Netherlands. In order to investigate the extentto which the home university environment is preferred to the hostuniversity environment in the seven exchange groups, we computedfor each student for each of the eight learning environment aspects apreference score (|desired – host| – |desired – home|). MANOVAperformed for these eight preference scores revealed statisticallysignificant differences between the seven groups. Subsequently, wecompared the preference scores of Dutch students who went to aparticular region with those of students from that region. Dutch students
Figure 3. IPSE profiles for South European students.
EUROPEAN UNIVERSITY STUDENTS’ ENVIRONMENT 93
going to a South European country preferred the Dutch learningenvironment on all eight aspects to the South European learningenvironment. South European students preferred the Dutch learningenvironment too. For Dutch students, the mean preference score foreach aspect was greater than zero and, for the South European students,it was less than zero. The two groups differed significantly on alleight preference scores. Analyses for the North European grouprevealed that both Dutch students going to a North European countryand North European students themselves preferred the North Europeanlearning environment to the Dutch learning environment on Per-sonalisation, Reproduction, Connectedness and Application. Dutchstudents going to a German-speaking country, and students from thesecountries themselves, preferred the Dutch learning environment onPersonalisation, Involvement, Application and Task Orientation.
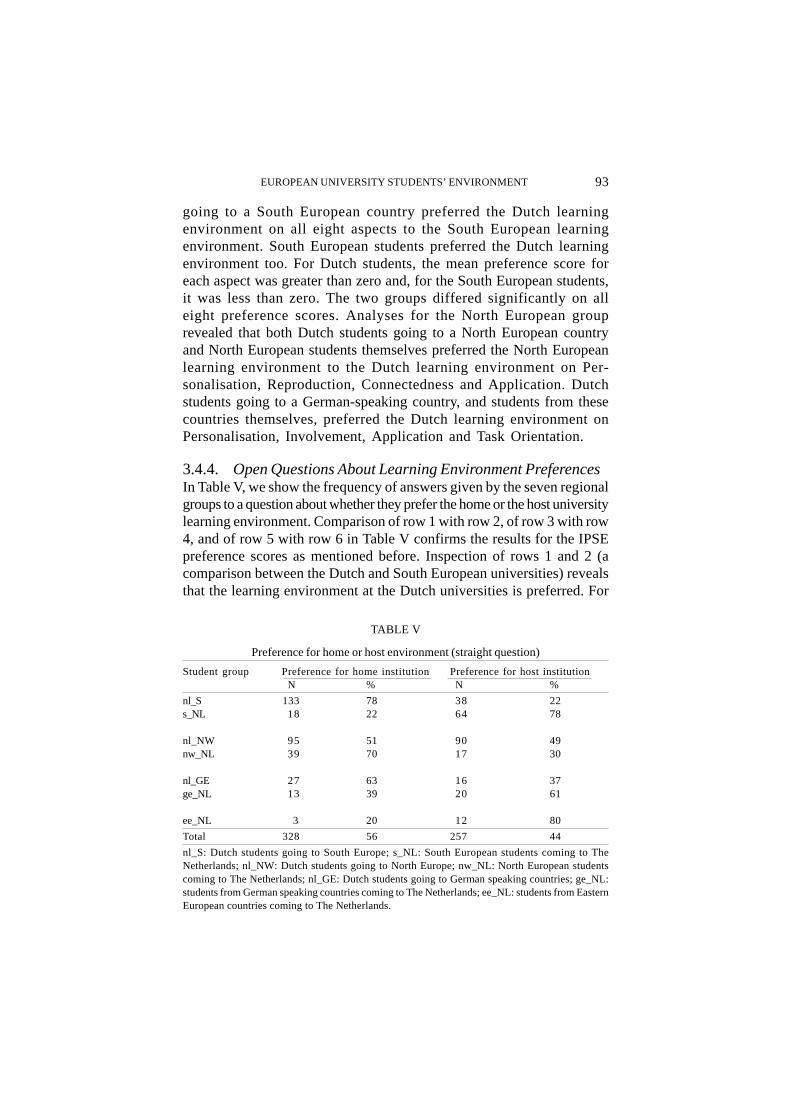
3.4.4. Open Questions About Learning Environment PreferencesIn Table V, we show the frequency of answers given by the seven regionalgroups to a question about whether they prefer the home or the host universitylearning environment. Comparison of row 1 with row 2, of row 3 with row4, and of row 5 with row 6 in Table V confirms the results for the IPSEpreference scores as mentioned before. Inspection of rows 1 and 2 (acomparison between the Dutch and South European universities) revealsthat the learning environment at the Dutch universities is preferred. For
TABLE V
Preference for home or host environment (straight question)
Student group Preference for home institution Preference for host institutionN % N %
nl_S 133 78 38 22s_NL 18 22 64 78
nl_NW 95 51 90 49nw_NL 39 70 17 30
nl_GE 27 63 16 37ge_NL 13 39 20 61
ee_NL 3 20 12 80
Total 328 56 257 44
nl_S: Dutch students going to South Europe; s_NL: South European students coming to TheNetherlands; nl_NW: Dutch students going to North Europe; nw_NL: North European studentscoming to The Netherlands; nl_GE: Dutch students going to German speaking countries; ge_NL:students from German speaking countries coming to The Netherlands; ee_NL: students from EasternEuropean countries coming to The Netherlands.
WIERSTRA, KANSELAAR, VAN DER LINDEN AND LODEWIJKS94
each student who prefers the South European learning environment,there are more than three students who prefer the Dutch learningenvironment.
We also asked the students in an open question for the reasons fortheir preferences. An interesting and convincing result was that thereasons given were the same irrespective of the country preferred.These are the same reasons as for the seven groups in Table V andcan be conceived as indicators of an ideal study environment. Fivereasons are:
• the small distance between teacher and student;• opportunity for student involvement (e.g. discussion/expression of
opinions);• less servile and passive top-down instructions and more freedom of
choice;• an appeal to deep and critical study;• little emphasis on reproducing facts.
On the basis of these five aspects, Dutch students who have studied in thesouthern countries and many southern students themselves prefer Dutchlearning environments. Dutch students who have studied in the Northerncountries (especially England, which scores high on all five aspects) oftenprefer the education in Northern countries, just as many students fromthose countries themselves do.
4. CONCLUSION AND DISCUSSION
In this study, large differences between countries were found in universitylearning environments as perceived by students. The group of SouthEuropean countries scored relatively highly on reproduction-centrednessof the learning environment and relatively low on seven other characteristicsrelated to activating (process-oriented) instruction and which are muchappreciated by students. The profile of North European countries was theopposite to that of the South European countries.
In principle, our learning environment measurements refer to perceptionsof the students. To what extent do student perceptions refer to a real situation?Our approach involving the student as a source of data can be contrastedwith an external observer’s assessment of classroom communication andevents (Brophy & Good, 1986; Fraser, 1998). Partly, the two contrastingapproaches measure two different constructs, which Murray (1938) and laterStern (1970) called ‘beta press’ and ‘alpha press’, respectively. Althoughstudent perceptions refer primarily to beta press, we can assume on the basis
EUROPEAN UNIVERSITY STUDENTS’ ENVIRONMENT 95
of the literature that these perceptions also provide much informationabout alpha press, or the real teaching-learning situation. Thus, Wierstraand Wubbels (1994) report that the within-class variance in learningenvironment perceptions is considerably lower than the between-classvariance. Further, in studies in which both classroom observation andquestionnaires are used, often high correlations are found betweenthree different measures: the externally-observed learningenvironment; teacher perceptions as measured by a questionnaire; andaggregated student perceptions (Tobin et al., 1990). In addition, ourinvestigation revealed convergence in the results of the differentexchange groups. So, Dutch students who went to South Europeancountries judged the differences between the Dutch and the SouthEuropean learning environments in the same way as did SouthEuropean students who went to The Netherlands. This also supportsthe value of students’ perceptions.
In this study, the university exchange confronted students with alearning environment which differed considerably from what they wereused to. This pattern emerged consistently from the open and closedquestions. In spite of these large discrepancies between home and hostuniversity learning environment, there were many cases of greatappreciation for the foreign learning environment to this extent thatstudents sometimes preferred this environment to their own. So, SouthEuropean students mostly preferred the Dutch host environment andDutch students, who were guests in England, often preferred theEnglish study environment. That does not alter the fact that manystudents, such as Dutch students who went to a South Europeancountry, were confronted with a learning environment which not onlydiffered considerably from the environment to which they are accustomed,but which they considered to be far from ideal (as they reported on the scalesfor the desired learning environment). From the interview part of the study(Kanselaar et al., 1998), it appears that students were not prepared for thiscontrast. Therefore, it seems advisable to pay attention to this aspect instudent information and counselling.
This study showed once more that the desires which students have aboutthe learning environment are not related to the specific long-term experienceswhich they have with a particular type of learning environment (see alsoFraser, 1994, 1998; Fraser & Fisher, 1983a, 1983b; Wierstra et al., 1987).Students from different countries with strongly contrasting learningenvironments agree in their opinions about the desired learning environment.In the students’ opinions, the learning environment should certainly not bereproduction-centred and it should involve much personalisation (small
WIERSTRA, KANSELAAR, VAN DER LINDEN AND LODEWIJKS96
distance between teacher and student) and much student involvement.However, we should remember that the question about the ideal learning
environment was asked after the exchange. Thus, students could form an(ideal) image of a learning environment which reaches further than theenvironment to which they are accustomed in their own country. Maybesuch a comparison becomes activated by the research design, because weasked students in each IPSE item not only about the desired learningenvironment, but also, immediately afterwards, about the real learningenvironment as experienced at their own university as well as at the hostuniversity. Therefore, it would be interesting to replicate research into thedesired learning environment among students who did not participate in anexchange. Anyhow, our research seems to reveal that, for Europeanstudents, the desired learning environment is not strongly determined bynational (cultural) characteristics. Obviously, it concerns relatively generallyand valid ideals which students have nowadays with regards to the universitylearning environment. But, it is possible that exchange students constitute avery select group as far as their way of learning is concerned. This mightbe a second reason to replicate this part of the study among students whodo not participate in an exchange program. Also non-European students couldbe a part of the research population in this new investigation.
Finally, we would like to emphasise some benefits of the research.A new research tool, the Inventory of Perceived Study Environment(IPSE), was developed for measuring eight distinct learning environmentaspects in higher education and in upper secondary education. Itconcerns learning environment aspects which are phrased in the sameterms as learning strategies. We expect that the utility of the IPSE willincrease when the questionnaire is written for all students in theirnative language and not only (like it is in our research) for the Dutchstudents and students of English-speaking countries. Several findingssupported the validity of the IPSE, including correlational analysesat the item and scale levels, the convergence of results across thethree types of scales (home, host and desired university learningenvironment) and the convergence of the results for the IPSE scalesand for the open questions.
5. ACKNOWLEDGEMENT
We are indebted to Jan Vermunt (Leiden University) for his participationin the initial stages of the project.
EUROPEAN UNIVERSITY STUDENTS’ ENVIRONMENT 97
REFERENCES
Brophy, J. & Good, T.L. (1986). Teacher behavior and student achievement. In M.C.Wittrock (Ed.), Handbook of research on teaching (3rd ed.; pp. 328–375). New York:Macmillian.
Entwistle, N., Kozeki, B. & Tait, H. (1989). Pupils’ perception of schools and teachers:relationships with motivation and approaches to learning. British Journal of Educa-tional Psychology, 59, 340–350.
Evers, B. (1995). Learning environments perceptions and learning strategies ofexchange students in the Netherlands [in Dutch]. Tilburg, The Netherlands: Departmentof Psychology, Tilburg University.
Fraser, B.J. (1994). Research on classroom and school climate. In D. Gabel (Ed.),Handbook of research on science teaching and learning (pp. 493–541). New York:Macmillan.
Fraser, B.J. (1998). Science learning environments: assessment, effects and determinants.In B.J. Fraser & K.G. Tobin (Eds.), International handbook of science education(pp. 527–564). Dordrecht, The Netherlands: Kluwer.
Fraser, B.J. & Fisher, D.L. (1983a). Student achievement as a function of person-environ-ment fit: a regression surface analysis. British Journal of Educational Psychology,53, 89–99.
Fraser, B.J. & Fisher, D.L. (1983b). Use of actual and preferred classroom environment scalesin person-environment fit research. Journal of Educational Psychology, 75, 303–313.
Hofstede, G. (1986). Cultural differences in teaching and learning. International Journalof Intercultural Relations, 10, 301–320.
Hofstede, G. (1996). Differences and danger: cultural profiles of nations and limits to toler-ance. Higher Education in Europe, 21(1), 73–94.
Hollanders, N. (1995). Steering of learning processes [in Dutch]. Utrecht, The Nether-lands: Department of Education, Utrecht University.
Huijbregts, S.M. & Roepers, H. (1995). Studying abroad [in Dutch]. Utrecht, The Neth-erlands: Department of Education, Utrecht University.
Kanselaar, G., van der Linden, J.L., Lodewijks, J.G.L.C., Vermunt, J.D.H.M. & Wierstra,R.F.A. (1998). Studying abroad – experiences of exchange students, UtrechtUniversity, The Netherlands, unpublished manuscript.
Meyer, J.H.F. & Muller, M.W. (1990). Evaluating the quality of student learning I: an unfoldinganalysis of the associations between perceptions of learning context and approaches tostudying at an individual level. Studies in Higher Education, 15, 131–154.
Meyer, J.H.F. & Parsons, P. (1989). Approaches to studying and course perceptions usingthe Lancaster Inventory – a comparative study. Studies in Higher Education, 14, 137–153.
Murray, H.A. (1938). Explorations in personality. New York: Oxford University Press.Ramsden, P. (1992). Learning to teach in higher education. London: Routedge.Stern, G.G. (1970). People in context: measuring person-environment congruence in
education and industry. New York: Wiley.Tobin, K., Kahle, J.B. & Fraser, B.J. (Eds.). (1990). Windows into science classes:
problems associated with higher level cognitive learning. London: Falmer Press.Vermunt, J.D.H.M. (1992). Learning styles and regulation of learning in higher
education – towards process-oriented instruction in autonomous thinking [in Dutch].Lisse, The Netherlands: Swets & Zeitlinger.
WIERSTRA, KANSELAAR, VAN DER LINDEN AND LODEWIJKS98
Vermunt, J.D.H.M. (1993). Constructive learning in higher education. In J.K. Koppen &W.D. Webler (Eds.), Strategies for increasing access and performance in highereducation (pp. 143–157). Amsterdam, The Netherlands: Thesis Publishers.
Vermunt, J.D. (1998). The regulation of constructive learning processes. British Journalof Educational Psychology, 68, 149–171.
Volet, S.E., Renshaw, P.D. & Tietzel, K. (1994). A short term longitudinal investigation ofcross-cultural differences in study approaches using Biggs’ SPQ questionnaire. BritishJournal of Educational Psychology, 64, 301–318.
Wierstra, R.F.A. & Beerends, E.P.M. (1996). Learning environment perceptions and learn-ing strategies of first year social sciences students [in Dutch]. Journal for EducationalResearch, 21, 306–322.
Wierstra, R.F.A., Jörg, T.G.D. & Wubbels, Th. (1987). Contextual and individually perceivedlearning environment in curriculum evaluation. In B.J. Fraser (Ed.), The study of learn-ing environments, Volume 2 (pp. 31–41). Perth, Australia: Curtin University ofTechnology.
Wierstra, R.F.A., Kanselaar, G. & van der Linden, J. (1997, December). Changes inuniversity learning environment and in learning strategy of European exchangestudents. Paper presented at the annual conference of the Australian Association forResearch in Education, Brisbane, Australia.
Wierstra, R.F.A. & Wubbels, Th. (1994). Student perception and appraisal of the learningenvironment: core concepts in the evaluation of the PLON physics curriculum. Studiesin Educational Evaluation, 20, 437–455.
RONNY F.A. WIERSTRA, GELLOF HANS G.L.C. LODEWIJKS
KANSELAAR, JOS L. VAN DER LINDEN Department of PsychologyDepartment of Educational Sciences Tilburg UniversityUtrecht University TilburgP.O. Box 80.140 The Netherlands3508 TC UtrechtThe Netherlands(Correspondence to: Ronny F.A. Wierstra)