Embed Size (px)
Citation preview
LEARNING CLASSIFICATION ALGORITHMS IN DATA MINING
A Project
Presented to the faculty of the Department of Computer Science
California State University, Sacramento
Submitted in partial satisfaction of the requirements for the degree of
MASTER OF SCIENCE
in
Computer Science
by
Swetha Rajendiran
SPRING 2015
ii
LEARNING CLASSIFICATION ALGORITHMS IN DATA MINING
A Project
by
Swetha Rajendiran Approved by: __________________________________, Committee Chair Dr. Meiliu Lu __________________________________, Second Reader Dr. Ying Jin ____________________________ Date

iii
Student: Swetha Rajendiran
I certify that this student has met the requirements for format contained in the University
format manual, and that this project is suitable for shelving in the Library and credit is to
be awarded for the project.
__________________________, Graduate Coordinator ___________________ Dr. Jinsong Ouyang Date Department of Computer Science
iv
Abstract
of
LEARNING CLASSIFICATION ALGORITHMS IN DATA MINING
by
Swetha Rajendiran
Classification algorithms are used in data mining to classify data based on class
labels. It involves building a model using training data set, and then using the built model
to assign given items to specific classes/categories. In the model building process, also
called training process, a classification algorithm finds relationships between the attributes
of the data and the target. Different classification algorithms use different techniques for
finding relationships. These relationships are summarized in a model, which can then be
applied to a new data set in which the class assignments are unknown.
This project’s objective is to create a courseware that focuses on creating materials
to achieve the goal of helping the students get deeper understanding of the most used
classification algorithms in data mining. The existing materials on the classification
algorithms are completely textual and students find it difficult to grasp. By using interactive
examples and animated tutorials provided in the courseware, students should be able to
intuitively learn these classification algorithms easily.

v
With the help of this courseware, students will be able to learn the algorithms using
flash animations and then visualize the steps with the help of interactive examples that can
be modified in many ways by the student to get a complete understanding of the algorithms.
There is also information provided on how to make practical use of these algorithms using
data mining tools such as Weka and RapidMiner where students can apply the algorithms
on real datasets available. Implementation of the courseware is done with technologies
such as HTML, JavaScript, and Bootstrap CSS.
_______________________, Committee Chair Dr. Meiliu Lu _______________________ Date

vi
ACKNOWLEDGEMENTS
My heartfelt thanks to Dr. Meiliu Lu for providing me the opportunity to work on
this project. I would also like to thank her for all the encouragement and guidance she has
provided throughout each phase of the project. Her patience, valuable suggestions, and
detailed comments were invaluable and without which the success of the project would be
impossible.
My sincere thanks to Dr. Ying Jin for being my second reader. I would also like to
thank Dr. Jinsong Ouyang for his review of the project.
My special thanks to my husband and my parents for their patience, support and
motivation throughout the entire process. I would also like to thank all my friends who
have been there for me throughout my graduate program at California State University,
Sacramento.

vii
TABLE OF CONTENTS Page
Acknowledgements .............................................................................................................. vi
List of Figures ....................................................................................................................... ix
Chapter
1. INTRODUCTION .......................................................................................................... 1
2. BACKGROUND ............................................................................................................. 4
2.1 Scope of the Project......................................................................................... 5
2.2 Technology ....................................................................................................... 6
3. RESEARCH AND ANALYSIS ................................................................................... 8
4. COURSEWARE DESIGN AND ARCHITECTURE ............................................. 10
5. COURSEWARE IMPLEMENTATION .............................................................. 18
5.1 OneR Classifier ....................................................................................... 18
5.2 K-NN Classifier ...................................................................................... 22
5.3 Naïve Bayes Classifier ............................................................................ 26
5.4 ID3 Classifier .......................................................................................... 31
5.5 Data Mining Tools .................................................................................. 36
5.5.1 RapidMiner Tutorial ................................................................ 38
5.5.2 WEKA Tutorial ........................................................................ 40
5.6 Quiz Implementation .............................................................................. 42
6. CONCLUSION ..................................................................................................... 43
viii
6.1 Future Enhancements ............................................................................... 44
Appendix A. OneR Algorithm Source Code .................................................................. 45
Appendix B. Quiz.js Source Code ............................................................................ 56
Bibliography ............................................................................................................... 76
ix
LIST OF FIGURES
Figures Page
1. Overview of the Data Mining Process…………….………………………………. 2
2. Courseware Sitemap ................................................... ……………………………. 11
3. Screenshot of Home Page ................. ………….…………………………………. 12
4. Screenshot of Flash Animations.…….…………………………………………… 13
5. Screenshot of Algorithm Implementation.…….………………………………… 14
6. Screenshot of Data Mining Tools .... ………….…………………………………. 15
7. Screenshot of Quiz ............................. ………….…………………………………. 16
8. Screenshot of References .................. ………….…………………………………. 17
9. Flowchart of OneR Algorithm…….………….………………………………….. 19
10. Screenshot of OneR Algorithm Animation…….………………………………... 20
11. Screenshot of OneR Classification Tool..…….………………………………….. 21
12. Flowchart of k-NN Algorithm……..………….………………………………….. 23
13. Screenshot of k-NN Algorithm Animation…….……………………………..….. 24
14. Screenshot of k-NN Classification Tool..…….………………………………….. 25
15. Flowchart of Naïve Bayesian Algorithm…..….……………………………...….. 28
16. Screenshot of Naïve Bayesian Algorithm Animation…………………………... 29
17. Screenshot of Naïve Bayesian Classification Tool..…………………………….. 30
18. Flowchart of ID3 Algorithm……….…………………………………………….... 32
19. Screenshot of ID3 Algorithm Animation……….………………………………... 34
x
20. Screenshot of ID3 Classification Tool..……….……………………………….... 35
21. Screenshot of Data Mining Tools Tutorial…….……………………………….. 39
22. Screenshot of Rapid Miner Tutorial ………….…………………………………. 40
23. Screenshot of Weka Tutorial ............ ………….…………………………………. 41
24. Screenshot of Weka Video Tutorial. ………….…………………………………. 41
25. Screenshot of Quiz Score Page......... ………….…………………………………. 42
1
Chapter 1
INTRODUCTION
According to Jiawei Han [1], “Data mining is the process of discovering interesting
patterns and knowledge from large amounts of data. The data sources can include
databases, data warehouses, the Web, other information repositories, or data that are
streamed into the system dynamically”. Data mining, one of the most important parts of
the knowledge discovery process, is used to analyze data from different perspectives and
summarize it into useful information. This information can be used by the industry to
increase revenue, cuts costs or both. This allows users to analyze data from various
dimensions or angles, categorize it, and summarize the relationships identified. Thus, data
mining is the process of finding different correlations or patterns among many different
fields in large relational databases [2].
Data mining is primarily used today by many companies with a strong consumer
focus such as financial, communication, retail, and marketing organizations. This enables
these companies to determine relationships among internal factors such as product
positioning, price, or staff skills and external factors such as competition, economic
indicators, and customer demographics. It also helps them to determine the impact on
customer satisfaction, sales, and profits. Finally, it enables them to drill down into summary
information to view detailed data. With data mining, a retailer could use point-of-sale
records of customer purchases to send targeted promotions based on a person’s purchase
2
history. By mining demographic data from comments or warranty cards, the retailer could
create products and promotions to appeal to a particular customer segments [2].
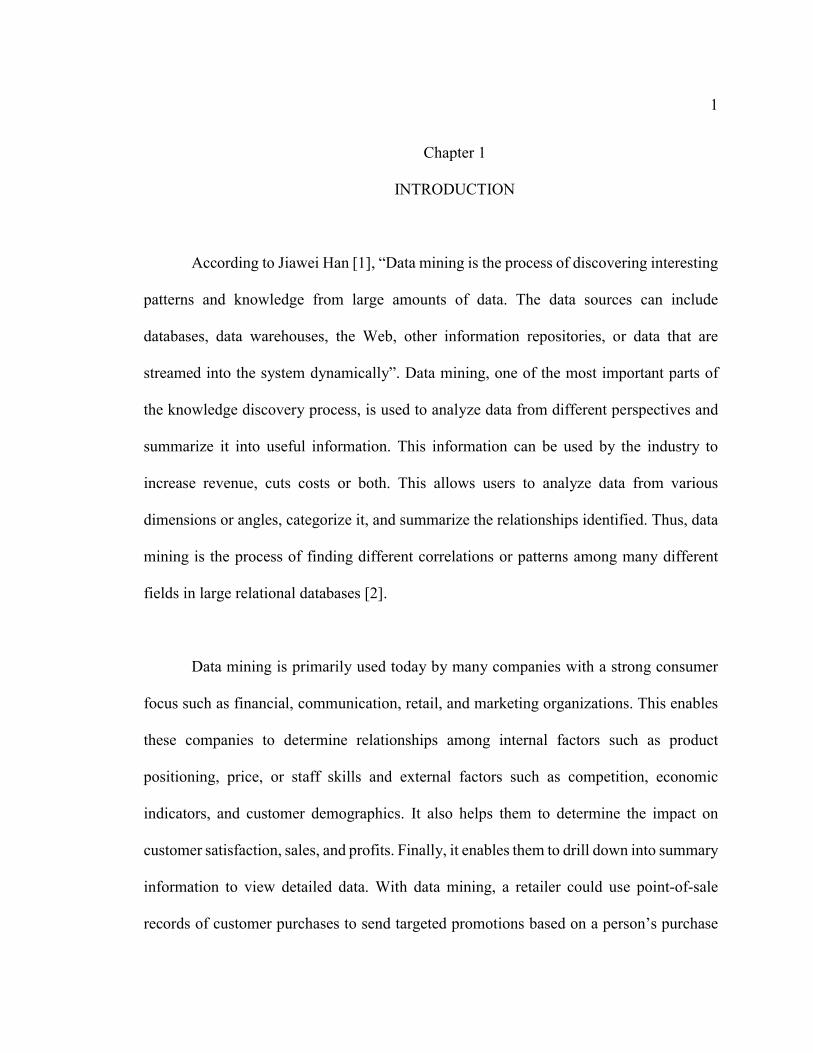
Figure 1. Overview of Data Mining Process
Figure 1 shows the different steps in data mining process, and classification
algorithms play a key role in the step of building the model. As shown in the figure, the
data can be in different forms and if there is some sample data available to develop the
model from, the classification algorithms can be used to build the model. Classification
algorithms are therefore known as supervised learning algorithms, which is the machine
learning task of inferring a function from labeled training data. The training data consists
of a set of training examples. In supervised learning, each example is a pair consisting of
an input object (typically a vector) and a desired output value (also called the supervisory
signal). A supervised learning algorithm analyzes the training data and produces an inferred
3
function, which can be used for mapping new examples [3]. There are many different types
of classification algorithms based on the type of data and input that is being processed. The
output of the classification algorithms can be different based on the algorithm. The later
chapters include a more detailed explanation of the different types of classification
algorithms and also elaborate of how students can make use of the different components of
the project to effectively learn these algorithms.
The entire report is organized into 6 chapters. Chapter 1 presents an introduction to
data mining and the role of data mining in today’s world of big data. Chapter 2 discusses
the background and provides a brief introduction to classification algorithms. It discusses
the need for the courseware, the scope of the project and the details of the relevant
technology. Chapter 3 overviews the requirement gathering process and also details the
way background research was done. The design of entire courseware is detailed in Chapter
4. The site diagram, the navigation, and the contents of the courseware are discussed from
a design perspective. Chapter 5 focuses on the implementation of courseware. The
courseware contains materials which a user should know in order to understand the
implementation of the algorithms. All the different algorithms are explained in detail.
Chapter 6 provides the summary and conclusion of the entire report and also includes the
learning experience and future enhancements that can be made to the courseware.
4
Chapter 2
BACKGROUND
Though the term "Data mining" was introduced in the 1990s, data mining is the
evolution of a field with a long history and the roots are traced back to three different fields:
classical statistics, artificial intelligence, and machine learning. Statistics is the foundation
of most technologies on which data mining is built, e.g. regression analysis, standard
distribution, standard deviation, standard variance, discriminant analysis, cluster analysis,
and confidence intervals. All of these are used to study data and data relationships.
Artificial intelligence, also known as AI is built upon heuristics instead of statistics and
thus it attempts to apply human thinking type of processing to statistical problems. Certain
AI concepts were also adopted by commonly used commercial software’s, such as query
optimization modules for Relational Database Management Systems (RDBMS). Machine
learning is the union of statistics and AI. It could be considered an evolution of AI as it
blends AI heuristics with advanced statistical analysis. Machine learning attempts to let
computer programs learn about the data they study, such that programs make different
decisions based on the qualities of the studied data, using statistics for fundamental
concepts, and adding more advanced AI heuristics and algorithms to achieve its goals [4].
Data mining, in different ways, is how the machine learning techniques was adapted
to business applications. Data mining is best explained as the combination of historical and
recent developments in statistics, AI, and machine learning. These techniques are then
5
combined and used together to help study the data and find the unknown hidden trends or
patterns within the data [4].
Thus, we see that data mining has been revolutionizing the way data is used and
classification algorithms playing a major role in the data mining process was a good
candidate for more exploration and research.
2.1 Scope of the Project
Classification algorithms in data mining are not very intuitive, very complex in
nature, and just reading through the textual or pictorial explanations of these algorithms
makes it difficult to comprehend for beginners. Ensuring that the students understand the
classification algorithms clearly is a significant challenge. A courseware with animations
and interactive tutorials of the most used classification algorithms can lessen the learning
curve and aid students in intuitively understanding classification algorithms. The main
focus of the project is to create such a courseware that contains all information required by
the student to clearly understand the specified classification algorithms.
The beginning of courseware focusses on the explanation of the basic concepts and
the algorithms that students typically find difficult to comprehend are animated. The
students can play or pause the animation, move between different steps of the algorithm
and also change the speed at which the animations runs. After learning the theory behind
6
these algorithms, students can get hands-on experience by using the interactive example
provided for each of the algorithms and see how the classification algorithms and the input
values impact the result. This helps to reinforce the theoretical concepts with practical
knowledge giving them a strong foundation in classification algorithms
For example, in ID3 algorithm there are different cases available and the output is
generated based on the input which can be explored in various ways. The classification
algorithms being dealt with in this courseware are the following:
a. Naïve Bayesian algorithm
b. ID3 classification algorithm
c. 1R classification algorithm
d. KNN classification algorithm
A self-evaluation quiz module is provided for students to test how well they grasp
the different concepts they learn in the courseware. In addition to the quiz module, there
are tutorials showing the usage of data mining tools such as Weka and RapidMiner.
2.2 Technology
The various pieces of technology used in creating the courseware are discussed in
this section.
7
Front End: The front end design was created using HTML and Bootstrap CSS. The
webpage design was done with HTML and CSS (Cascading Style Sheets) was used to style
the webpage. In this project bootstrap CSS by twitter is used because Bootstrap is the most
popular HTML, CSS, and JavaScript framework for developing responsive, mobile-first
web sites.
Programming: These web pages created are static and if we need to add dynamic
functionality, we had to use some kind of scripting or programming language. JavaScript
was chosen as the client side scripting language since it was lightweight and compatible
with all major browsers.
Animations: The animations were created using Adobe flash software and the
interactive buttons in the animation used ActionScript 3. The flash software has been well
known for creating animations for long time and is very efficient to use.
In summary, the background of data mining is discussed in this chapter. We also
discussed the need for this project on classification algorithms, and the scope of the project
is listed showing which specific algorithms will be implemented. Finally the various pieces
of technology used to create the courseware is mentioned. Having provided an introduction
to the project and its scope, we can move on to discussion of design and implementation
details in the upcoming chapters.
8
Chapter 3
RESEARCH AND ANALYSIS
Requirements gathering is a very important beginning step of any project that
should not be overlooked. Thereby, the first step in this project was to gather requirements.
As a student of the data mining and data warehousing course, I was aware of the need for
a courseware on classification algorithms. With the help of the advisor and fellow students,
I gathered more data on what would help the students the most in the learning process.
After understanding the requirements, the scope of the project was set and the
technologies to implement were chosen. After a lot of research on the available
technologies, the technologies mentioned in chapter 2 were chosen. Having little
knowledge about these technologies at the outset, extensive research was done on the
chosen technologies using the internet. The abundant tutorials and video lectures available
online helped me learn the technologies. In this process, I also learned how data mining
tools such as Weka and RapidMiner are used with real world data.
The next step was to gather the information required for the courseware. Detailed
information about classification methodology was gathered with the intent that it would be
self-explanatory and less wordy. Next I had to decide on which problems to use as sample
problems for each of the algorithm illustrations. The problems were chosen with the intent
of being simple and also elaborate enough such that students can get a good insight for

9
each algorithm.
After being equipped with all the required information, I moved on to design the
architecture for the courseware, and the steps of the design process are elaborated in chapter
4.
10
Chapter 4
COURSEWARE DESIGN AND ARCHITECTURE
This project is intended to be used as a courseware which is an educational material
intended as kits for teachers or trainers or as tutorials for students, usually packaged for use
with a computer. Courseware can encompass any knowledge area, but information
technology subjects are most common. Courseware is frequently used for delivering
education about the personal computer and its most popular business applications, such as
word processing and spreadsheet programs [5]. Knowing the purpose of a courseware, the
classification courseware was designed to not only to provide textual theoretical
information, but also to provide animated tutorials, interactive examples, and self-
assessment quizzes.
The courseware’s homepage has theoretical information about classification
algorithms. Each algorithm is explained with detailed steps in the next few pages. There
are three parts to learning the algorithms with this courseware. The first part is using flash
animations which learn the algorithm in a step by step manner using an example. In the
second part of the learning process, students can make use the interactive examples
provided to see how the different classification algorithms and input impact the result. The
third part to learning these algorithms is for students to test themselves using the self-
evaluation model.
11
In addition to the above, there is a set of tutorials on algorithm implementation
using data mining tools such as WEKA and RapidMiner. These tutorials show how the
classification algorithms are used in the real world for data mining. Following the tutorial
of the tools, there is a video captured using Tinytake[6] that shows step by step instructions
on how both the tools work. Showing both the tools will help students understand the
differences between the tools and their uses, thereby helping with making the decision on
choosing the right tool based on the given requirements. There is also a set of references
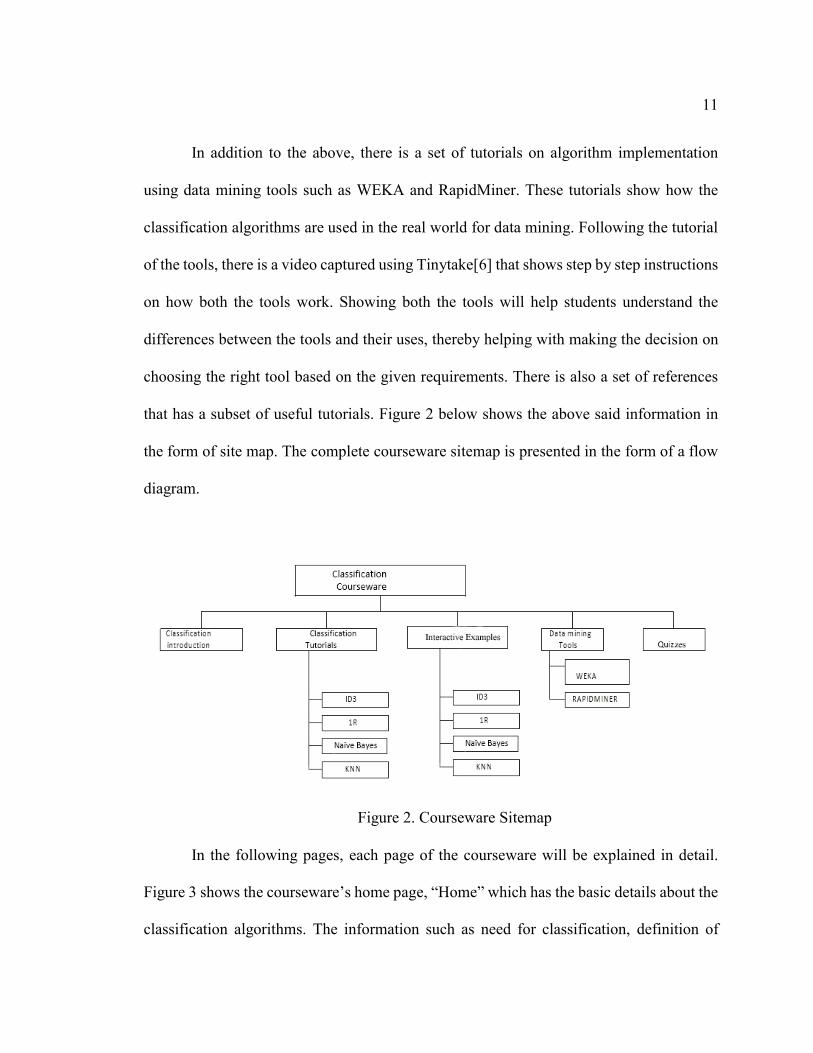
that has a subset of useful tutorials. Figure 2 below shows the above said information in
the form of site map. The complete courseware sitemap is presented in the form of a flow
diagram.
Figure 2. Courseware Sitemap
In the following pages, each page of the courseware will be explained in detail.
Figure 3 shows the courseware’s home page, “Home” which has the basic details about the
classification algorithms. The information such as need for classification, definition of
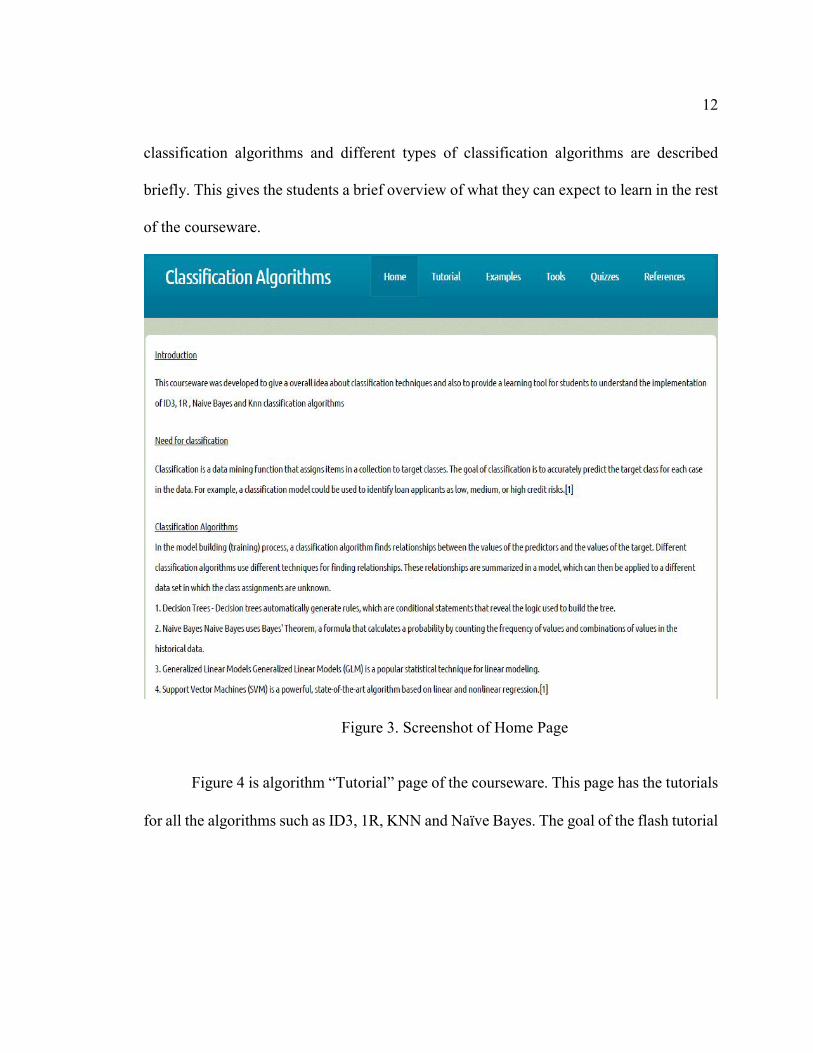
12
classification algorithms and different types of classification algorithms are described
briefly. This gives the students a brief overview of what they can expect to learn in the rest
of the courseware.
Figure 3. Screenshot of Home Page
Figure 4 is algorithm “Tutorial” page of the courseware. This page has the tutorials
for all the algorithms such as ID3, 1R, KNN and Naïve Bayes. The goal of the flash tutorial
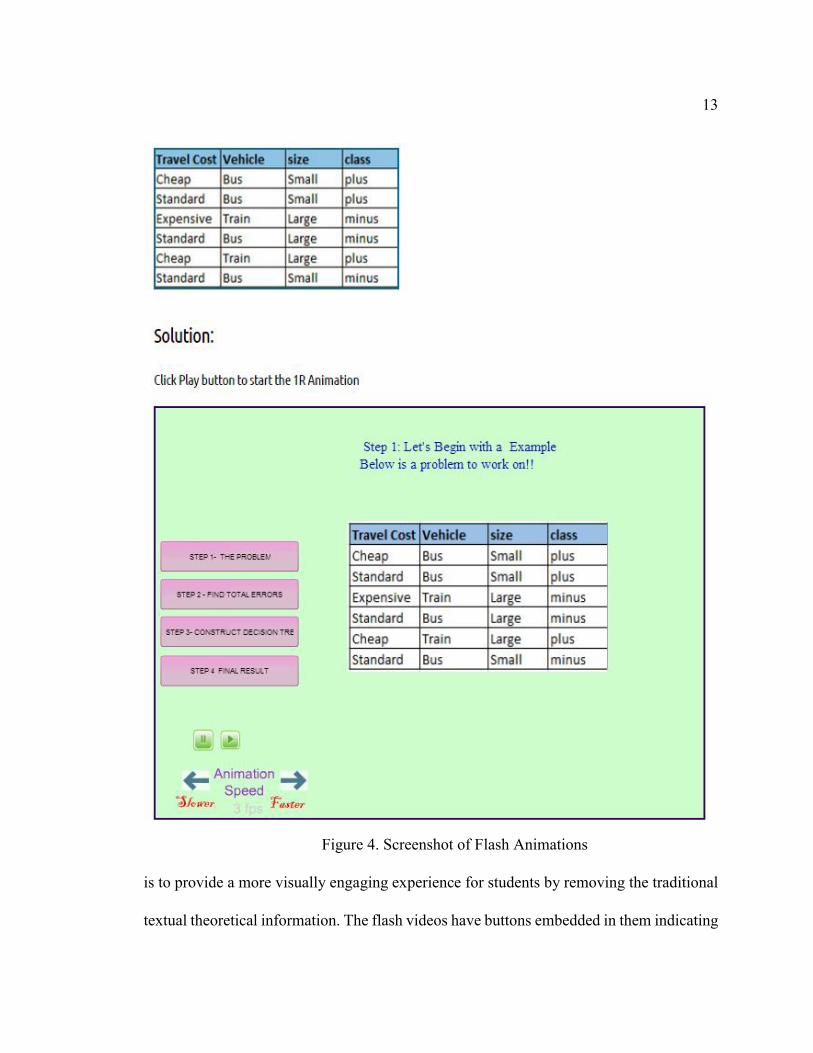
13
is to provide a more visually engaging experience for students by removing the traditional
textual theoretical information. The flash videos have buttons embedded in them indicating
Figure 4. Screenshot of Flash Animations
14
the various steps in the algorithms and students can easily move between them by clicking
on the appropriate button. Another useful feature provided is the ability to change the flash
animation speed, thereby enabling students to tailor the speed of the animation to match
their grasping capacity.
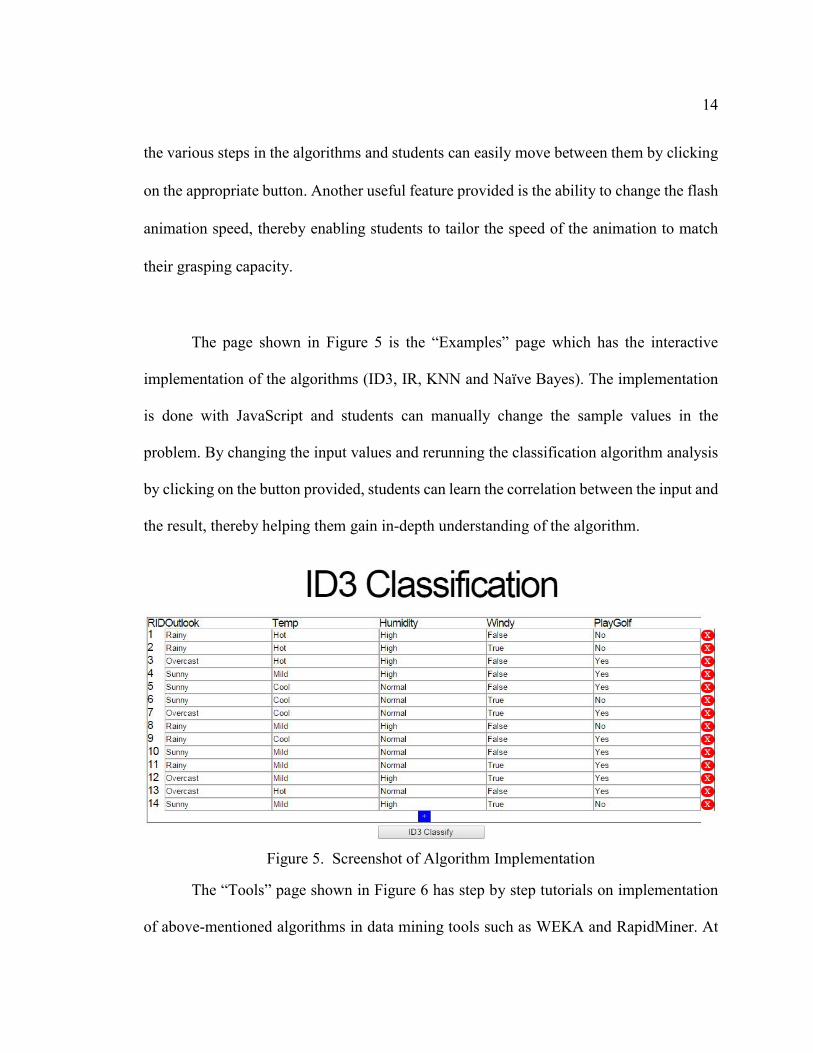
The page shown in Figure 5 is the “Examples” page which has the interactive
implementation of the algorithms (ID3, IR, KNN and Naïve Bayes). The implementation
is done with JavaScript and students can manually change the sample values in the
problem. By changing the input values and rerunning the classification algorithm analysis
by clicking on the button provided, students can learn the correlation between the input and
the result, thereby helping them gain in-depth understanding of the algorithm.
The “Tools” page shown in Figure 6 has step by step tutorials on implementation
of above-mentioned algorithms in data mining tools such as WEKA and RapidMiner. At
Figure 5. Screenshot of Algorithm Implementation
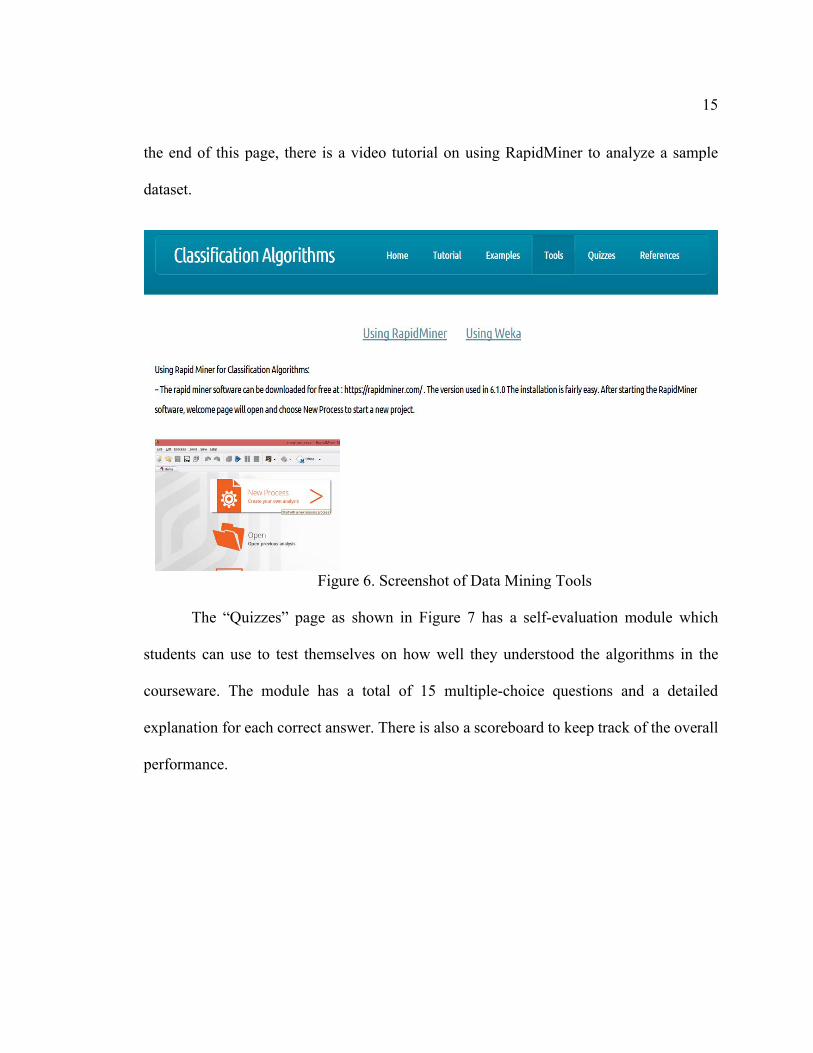
15
the end of this page, there is a video tutorial on using RapidMiner to analyze a sample
dataset.
Figure 6. Screenshot of Data Mining Tools
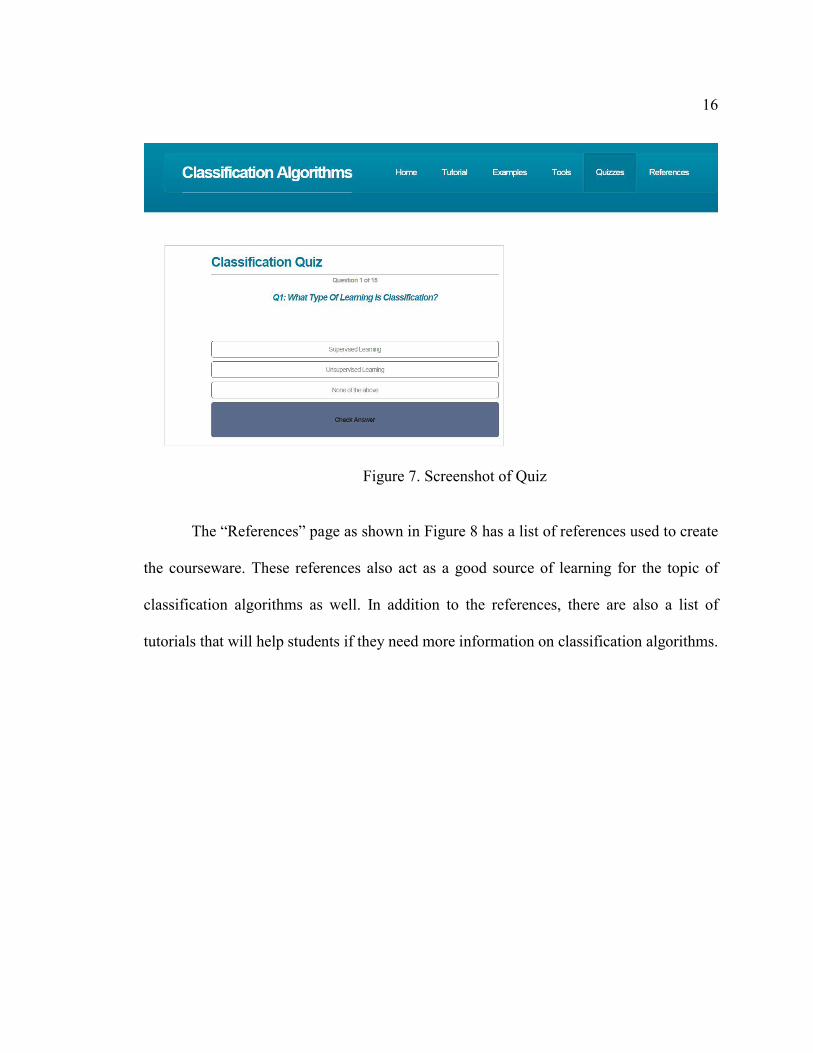
The “Quizzes” page as shown in Figure 7 has a self-evaluation module which
students can use to test themselves on how well they understood the algorithms in the
courseware. The module has a total of 15 multiple-choice questions and a detailed
explanation for each correct answer. There is also a scoreboard to keep track of the overall
performance.
16
Figure 7. Screenshot of Quiz
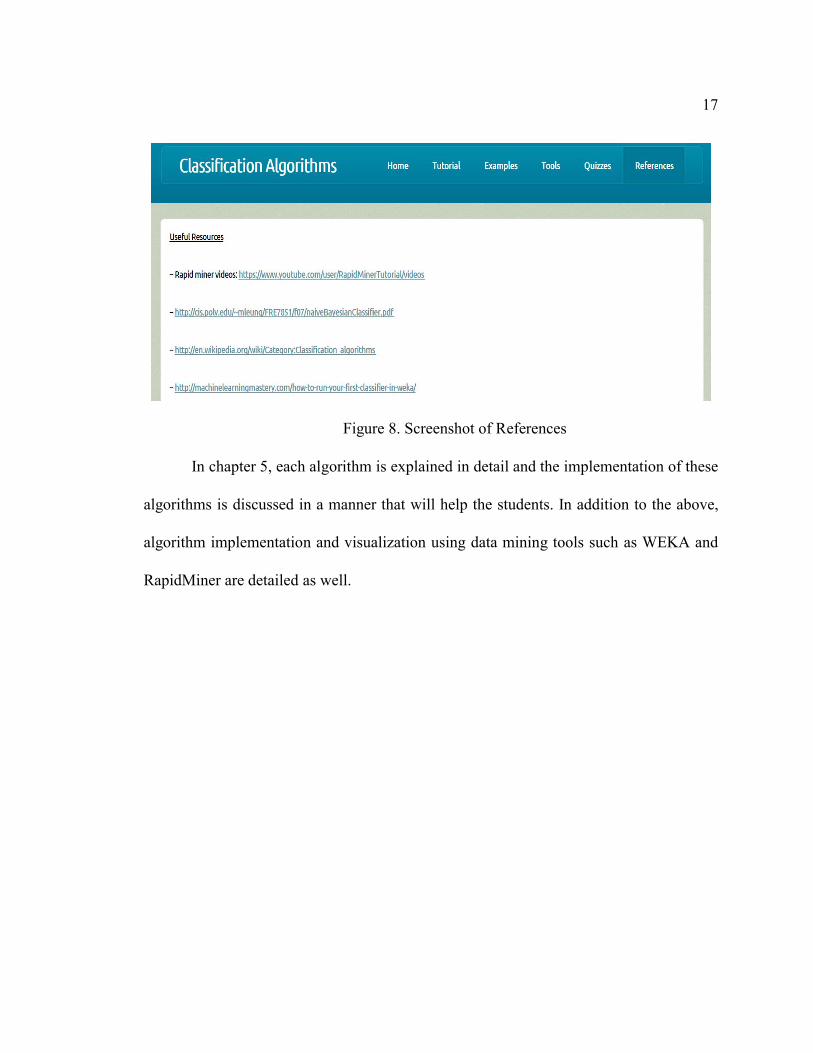
The “References” page as shown in Figure 8 has a list of references used to create
the courseware. These references also act as a good source of learning for the topic of
classification algorithms as well. In addition to the references, there are also a list of
tutorials that will help students if they need more information on classification algorithms.
17
Figure 8. Screenshot of References
In chapter 5, each algorithm is explained in detail and the implementation of these
algorithms is discussed in a manner that will help the students. In addition to the above,
algorithm implementation and visualization using data mining tools such as WEKA and
RapidMiner are detailed as well.
18
Chapter 5
COURSEWARE IMPLEMENTATION
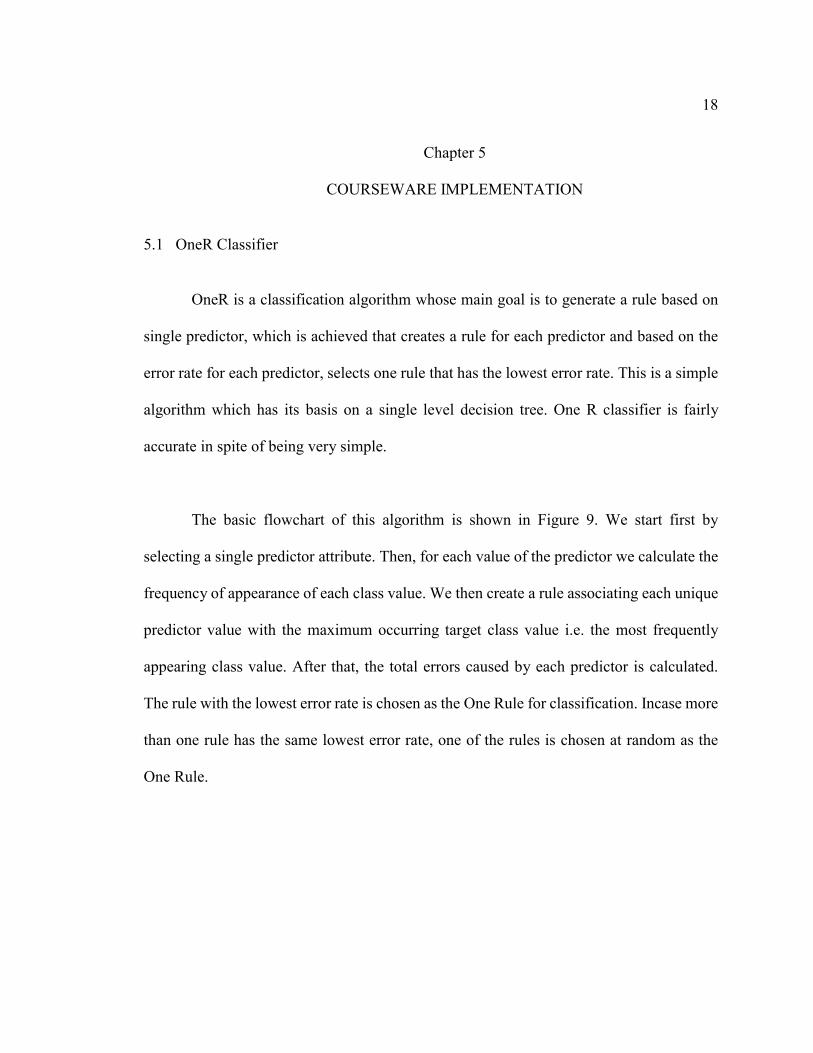
5.1 OneR Classifier
OneR is a classification algorithm whose main goal is to generate a rule based on
single predictor, which is achieved that creates a rule for each predictor and based on the
error rate for each predictor, selects one rule that has the lowest error rate. This is a simple
algorithm which has its basis on a single level decision tree. One R classifier is fairly
accurate in spite of being very simple.
The basic flowchart of this algorithm is shown in Figure 9. We start first by
selecting a single predictor attribute. Then, for each value of the predictor we calculate the
frequency of appearance of each class value. We then create a rule associating each unique
predictor value with the maximum occurring target class value i.e. the most frequently
appearing class value. After that, the total errors caused by each predictor is calculated.
The rule with the lowest error rate is chosen as the One Rule for classification. Incase more
than one rule has the same lowest error rate, one of the rules is chosen at random as the
One Rule.
19
START
END
Multiple Row(s) of Input Data
consisting of Predictors and Target
If PredictorIndex < TotalPredictors
Count how often each value of target
(class) appears
Find the most frequent class
Make the rule assign that class to this
value of the predictor
PredictorIndex = PredictorIndex + 1
Calculate the total error of the rules of
each predictor
Choose the predictor with the
smallest total error.
PredictorIndex = 0
YES
NO
Figure 9. Flowchart of OneR Algorithm
20
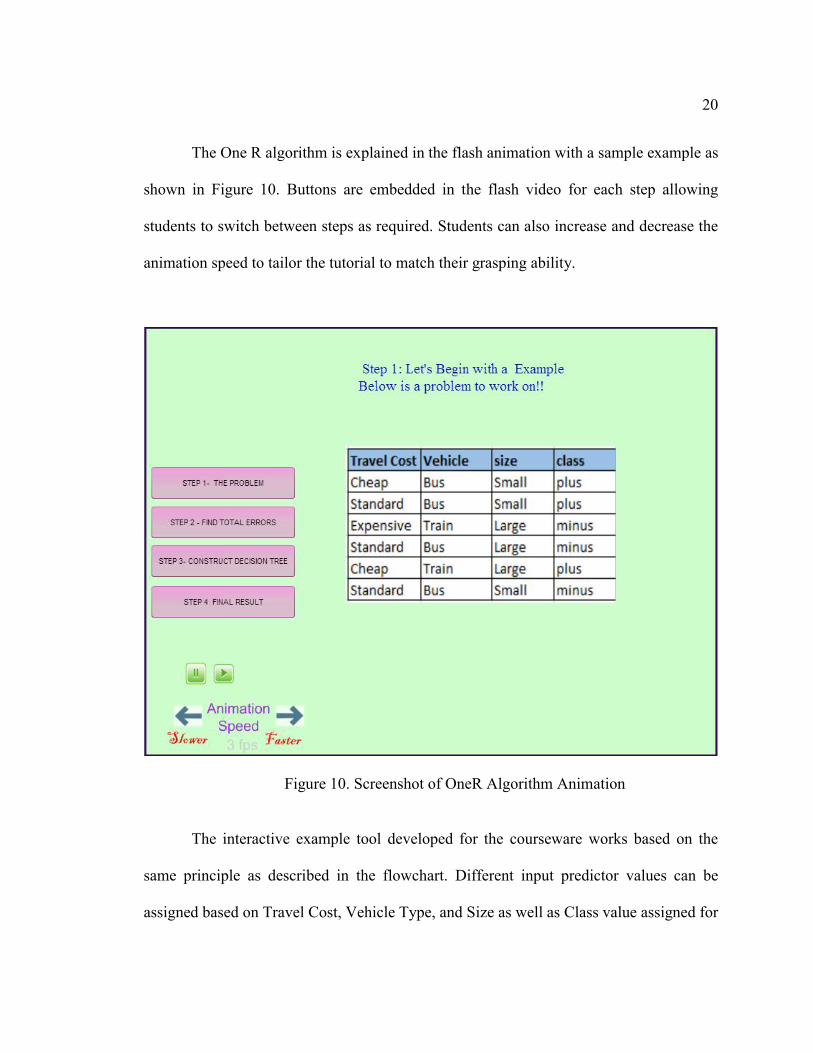
The One R algorithm is explained in the flash animation with a sample example as
shown in Figure 10. Buttons are embedded in the flash video for each step allowing
students to switch between steps as required. Students can also increase and decrease the
animation speed to tailor the tutorial to match their grasping ability.
Figure 10. Screenshot of OneR Algorithm Animation
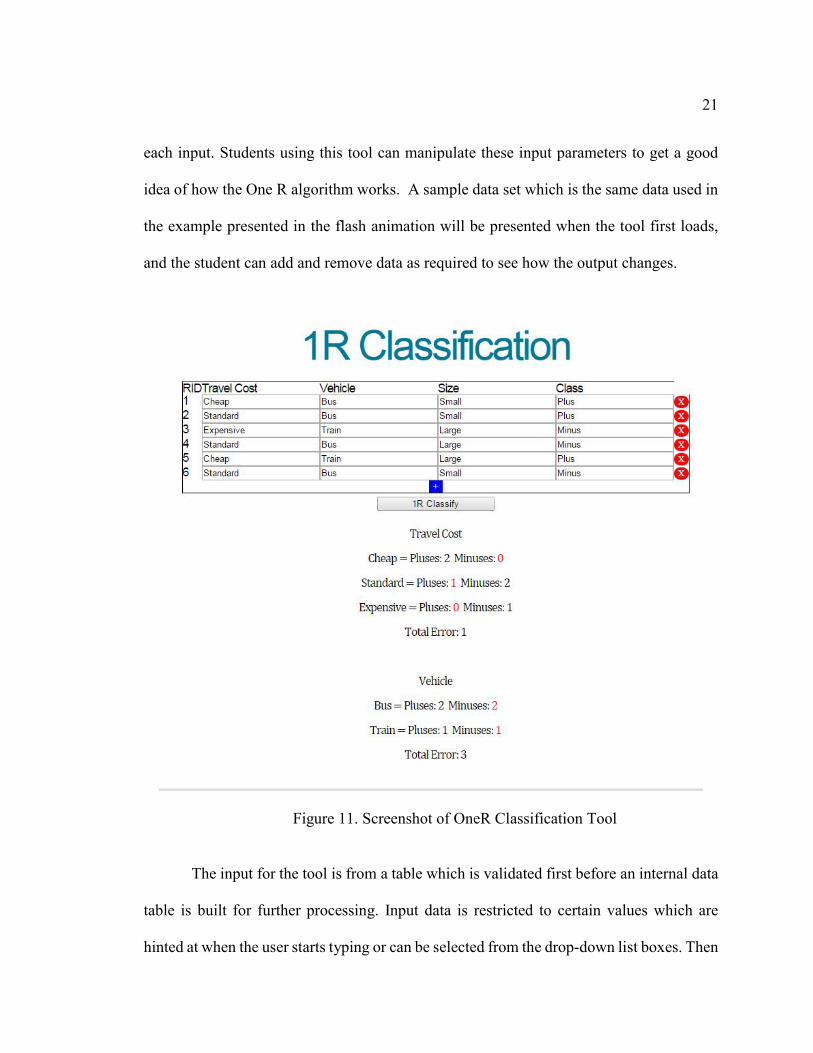
The interactive example tool developed for the courseware works based on the
same principle as described in the flowchart. Different input predictor values can be
assigned based on Travel Cost, Vehicle Type, and Size as well as Class value assigned for
21
each input. Students using this tool can manipulate these input parameters to get a good
idea of how the One R algorithm works. A sample data set which is the same data used in
the example presented in the flash animation will be presented when the tool first loads,
and the student can add and remove data as required to see how the output changes.
Figure 11. Screenshot of OneR Classification Tool
The input for the tool is from a table which is validated first before an internal data
table is built for further processing. Input data is restricted to certain values which are
hinted at when the user starts typing or can be selected from the drop-down list boxes. Then
22
as indicated above, the idea presented in the flowchart is executed to derive the final rule.
In addition to deriving the final rules, step-by-step detailed explanation of how the final
rule is obtained. Addition and deletion of new rows are handled dynamically using
JavaScript and HTML5.
5.2 K-NN Classifier K-NN which is short for k-Nearest Neighbors is a non-parametric lazy
classification algorithm. It is one of the simplest data-mining algorithms where if there are
N given training samples and a sample point S is given, the algorithm identifies k closest
neighbors to S. The algorithm is lazy because it doesn’t have any training phase before
making decisions and it is non-parametric because it does not make any assumptions of the
input data. Classification (generalization) using an instance-based i.e. lazy classifier can be
a simple matter of locating the nearest neighbor in instance space and labelling the
unknown instance with the same class label as that of the located (known) neighbor. This
approach is often referred to as a nearest neighbor classifier. The downside of this simple
approach is the lack of robustness that characterize the resulting classifiers. The high
degree of local sensitivity makes nearest neighbor classifiers highly susceptible to noise in
the training data. More robust models can be achieved by locating k, where k > 1, neighbors
and letting the majority vote decide the outcome of the class labeling. A higher value
of k results in a smoother, less locally sensitive, function [7].
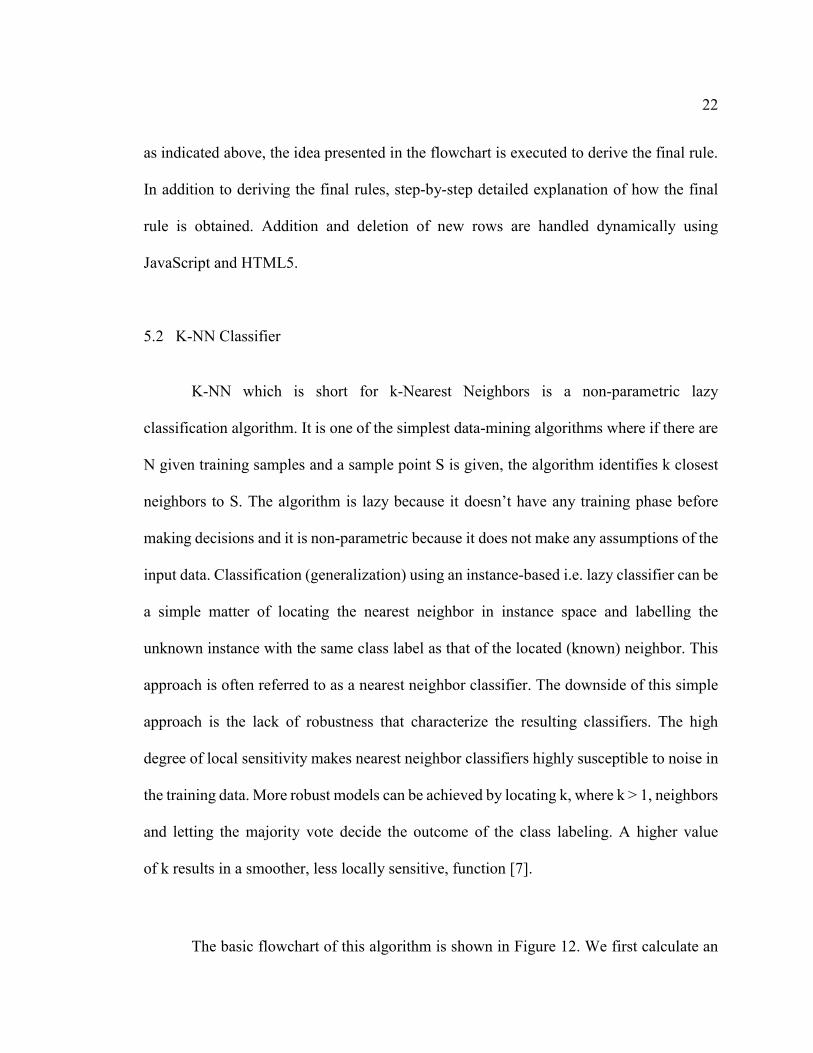
The basic flowchart of this algorithm is shown in Figure 12. We first calculate an
23
array of distances between the sample point S and every element in the training data N.
After this is done, the array is sorted and the k elements in the array with the smallest
distances are then chosen.
START
END
Dataset (D)Sample (X)Distance(k)
DistanceArray[N]
Index = 0
Is Index < N
Select k smallest elements from DistanceArray
DistanceArray[Index] = Distance between X and D[N]
Index = Index + 1
YES
NO
Figure 12. Flowchart of k-NN Algorithm
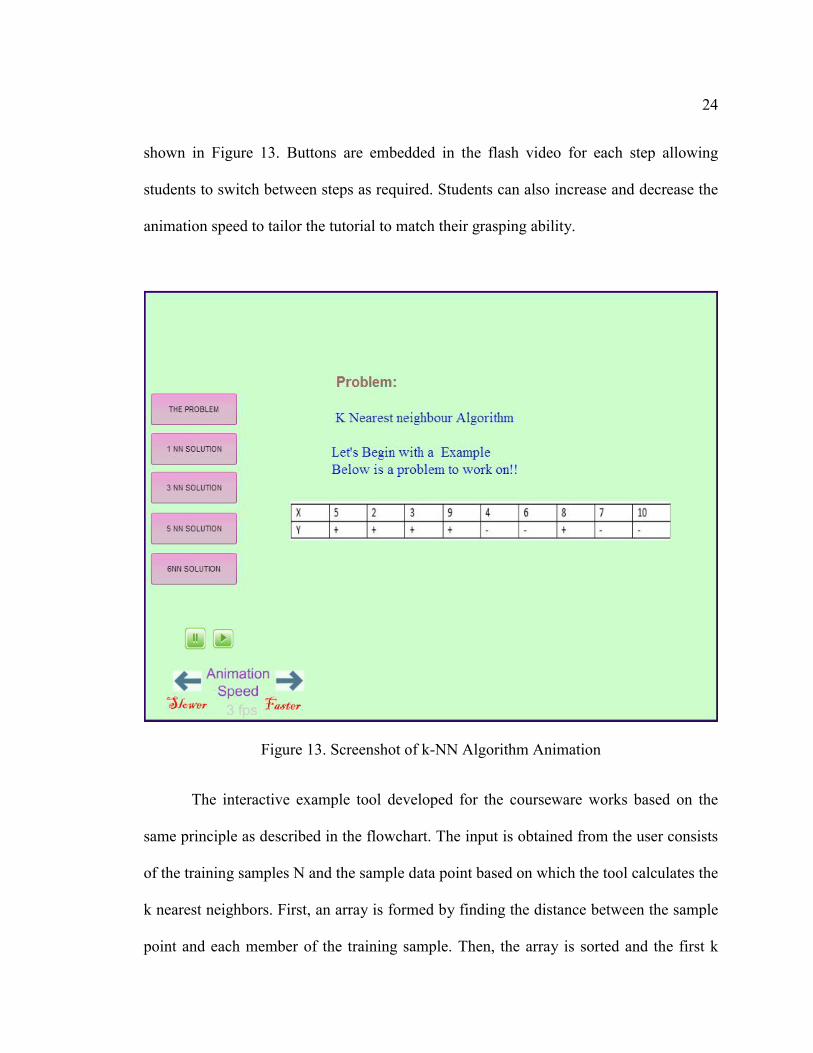
The k-NN algorithm is explained in the flash animation with a sample example as
24
shown in Figure 13. Buttons are embedded in the flash video for each step allowing
students to switch between steps as required. Students can also increase and decrease the
animation speed to tailor the tutorial to match their grasping ability.
Figure 13. Screenshot of k-NN Algorithm Animation
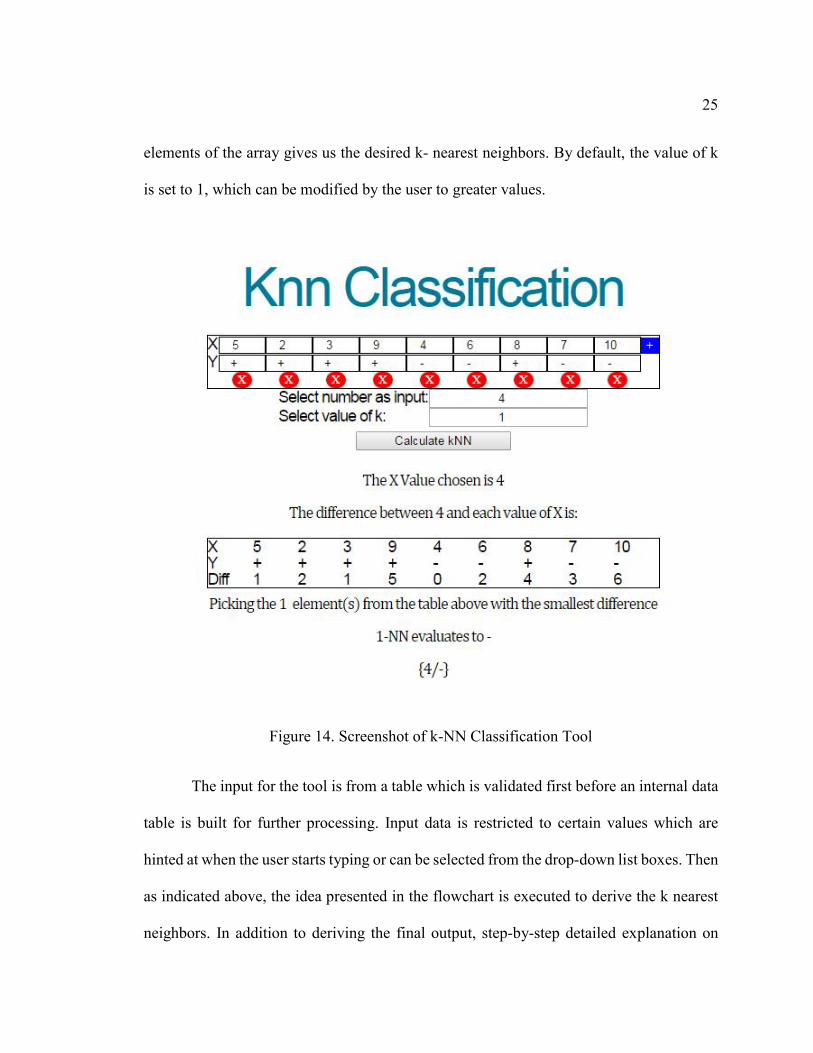
The interactive example tool developed for the courseware works based on the
same principle as described in the flowchart. The input is obtained from the user consists
of the training samples N and the sample data point based on which the tool calculates the
k nearest neighbors. First, an array is formed by finding the distance between the sample
point and each member of the training sample. Then, the array is sorted and the first k
25
elements of the array gives us the desired k- nearest neighbors. By default, the value of k
is set to 1, which can be modified by the user to greater values.
Figure 14. Screenshot of k-NN Classification Tool
The input for the tool is from a table which is validated first before an internal data
table is built for further processing. Input data is restricted to certain values which are
hinted at when the user starts typing or can be selected from the drop-down list boxes. Then
as indicated above, the idea presented in the flowchart is executed to derive the k nearest
neighbors. In addition to deriving the final output, step-by-step detailed explanation on
26
how the k nearest neighbors are obtained is presented. Addition and deletion of new rows
are handled dynamically using JavaScript.
5.3 Naïve Bayesian Classifier
Naïve Bayesian is a probabilistic classification algorithm based on Bayes’ theorem
with a naïve assumption that all the features are independent of each other. Naive Bayes is
a simple technique for constructing classifiers: models that assign class labels to problem
instances, represented as vectors of feature values, where the class labels are drawn from
some finite set. It is not a single algorithm for training such classifiers, but a family of
algorithms based on a common principle: all naive Bayes classifiers assumes that the value
of a particular feature is independent of the value of any other feature, given the class
variable. For example, a fruit may be considered to be an apple if it is red, round, and about
3" in diameter. A naive Bayes classifier considers each of these features to contribute
independently to the probability that this fruit is an apple, regardless of any
possible correlations between the color, roundness and diameter features [8]. Although the
assumption that the predictor (independent) variables are independent is not always
accurate, it does simplify the classification task dramatically, since it allows the class
conditional densities to be calculated separately for each variable, i.e., it reduces a
multidimensional task to a number of one-dimensional ones. In effect, Naive Bayes reduces
a high-dimensional density estimation task to a one-dimensional kernel density estimation.
Furthermore, the assumption does not seem to greatly affect the posterior probabilities,
especially in regions near decision boundaries, thus, leaving the classification task
27
unaffected [9].
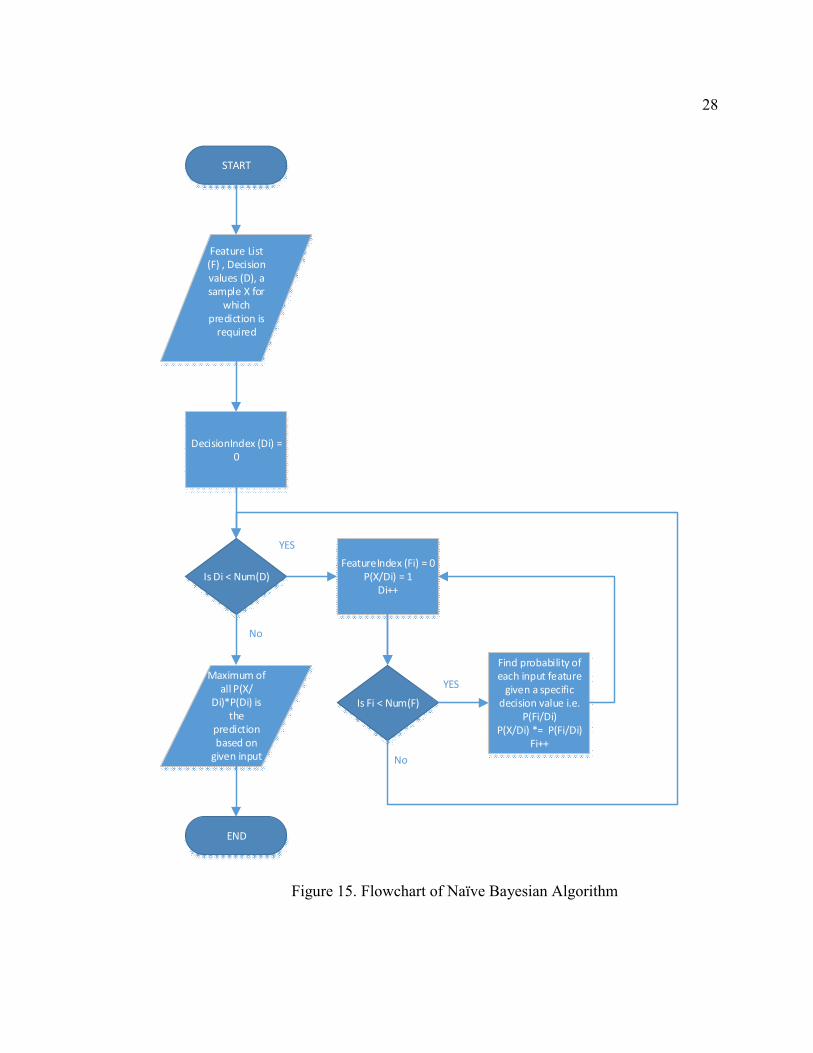
The basic flowchart of this algorithm is shown in Figure 15. We first calculate the
probability of the output occurring based on already occurring training data. This
probability is called the ‘prior’ probability as it based on what we know. We then calculate
the likelihood of the output being a certain value based on the data we have. Then by
combining both the prior probability and the likelihood in the previous steps, we calculate
the posterior probability for each attribute column value given the output is the decision
node value chosen. This is done by using the Bayes’ rule.
28
START
END
Feature List (F) , Decision values (D), a sample X for
which prediction is
required
Is Fi < Num(F)
FeatureIndex (Fi) = 0P(X/Di) = 1
Di++
Find probability of each input feature
given a specific decision value i.e.
P(Fi/Di)P(X/Di) *= P(Fi/Di)
Fi++
DecisionIndex (Di) = 0
Is Di < Num(D)
Maximum of all P(X/
Di)*P(Di) is the
prediction based on
given input
YES
No
No
YES
Figure 15. Flowchart of Naïve Bayesian Algorithm
29
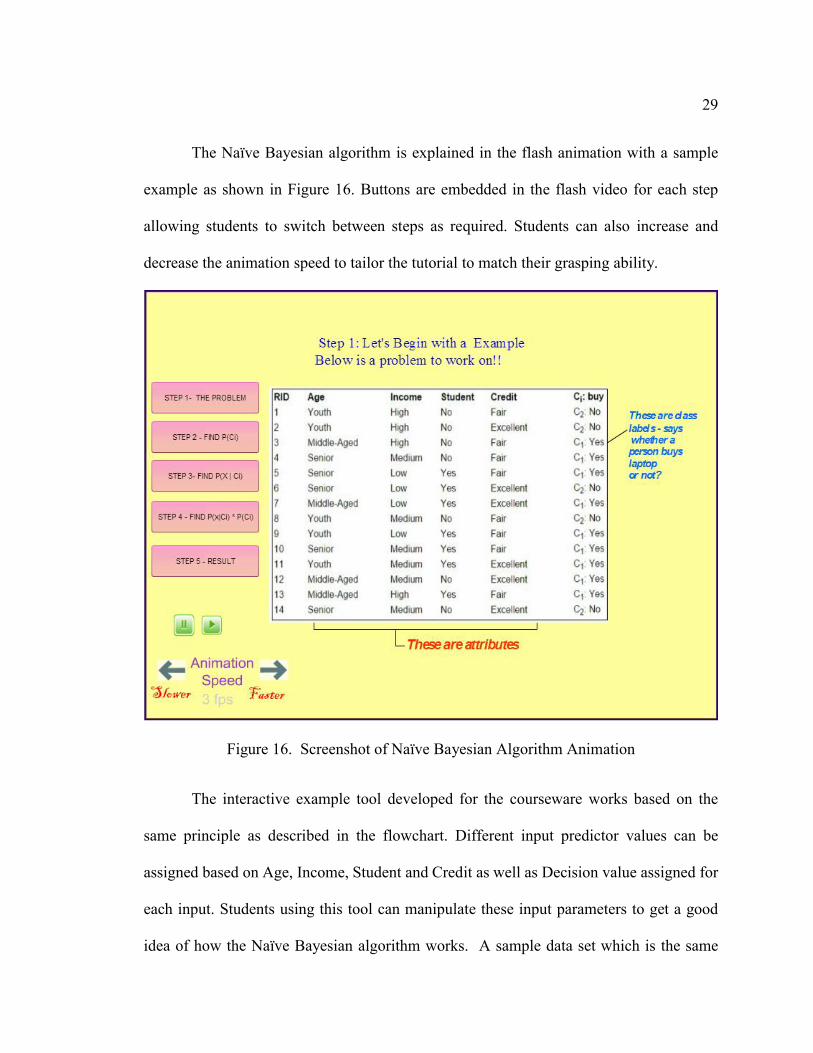
The Naïve Bayesian algorithm is explained in the flash animation with a sample
example as shown in Figure 16. Buttons are embedded in the flash video for each step
allowing students to switch between steps as required. Students can also increase and
decrease the animation speed to tailor the tutorial to match their grasping ability.
Figure 16. Screenshot of Naïve Bayesian Algorithm Animation
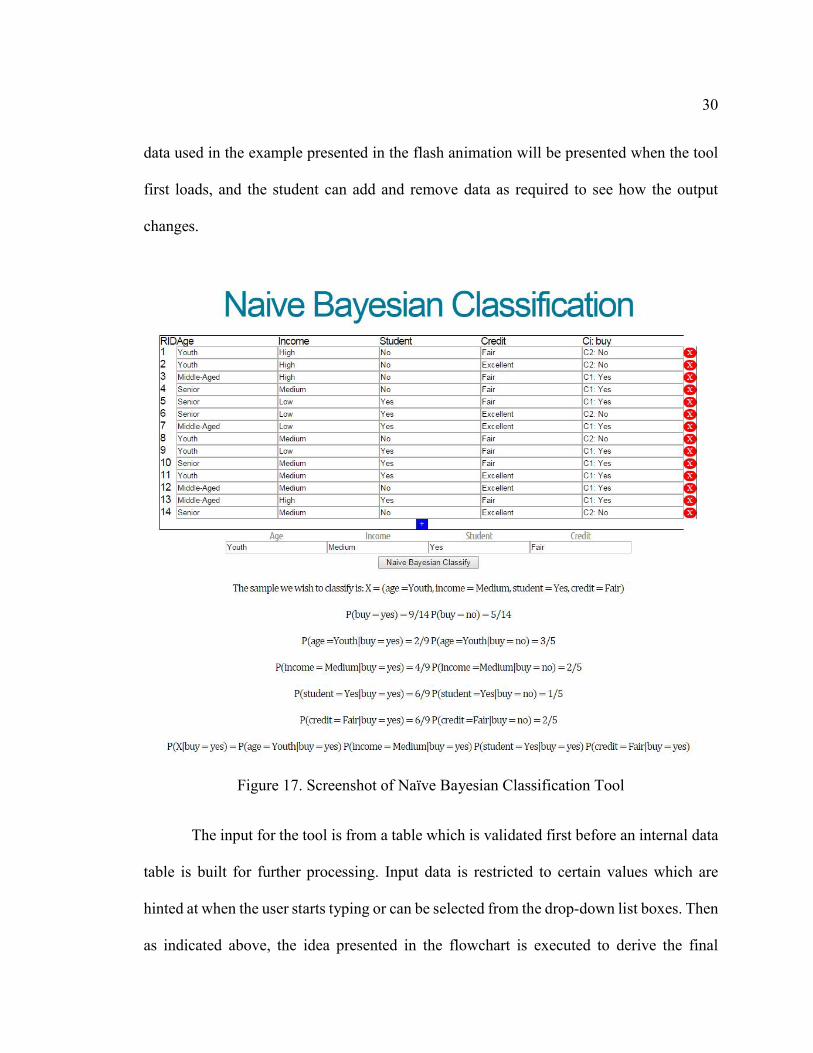
The interactive example tool developed for the courseware works based on the
same principle as described in the flowchart. Different input predictor values can be
assigned based on Age, Income, Student and Credit as well as Decision value assigned for
each input. Students using this tool can manipulate these input parameters to get a good
idea of how the Naïve Bayesian algorithm works. A sample data set which is the same
30
data used in the example presented in the flash animation will be presented when the tool
first loads, and the student can add and remove data as required to see how the output
changes.
Figure 17. Screenshot of Naïve Bayesian Classification Tool
The input for the tool is from a table which is validated first before an internal data
table is built for further processing. Input data is restricted to certain values which are
hinted at when the user starts typing or can be selected from the drop-down list boxes. Then
as indicated above, the idea presented in the flowchart is executed to derive the final
31
posterior probability. In addition to deriving the posterior probability, the calculation of the
prior probability and likelihood is shown which helps explain the value of the posterior
probability. Addition and deletion of new rows are handled dynamically using JavaScript.
5.4 ID3 Classifier
ID3 is a decision tree based classification algorithm. Very simply, ID3 builds a
decision tree from a fixed set of examples. The resulting tree is used to classify future
samples. The example has several attributes and belongs to a class (like yes or no). The
leaf nodes of the decision tree contain the class name whereas a non-leaf node is a decision
node. The decision node is an attribute test with each branch (to another decision tree)
being a possible value of the attribute. ID3 uses information gain to help it decide which
attribute goes into a decision node. The advantage of learning a decision tree is that a
program, rather than a knowledge engineer, elicits knowledge from an expert [10].
In figure 18, it shows the basic flowchart of this algorithm. First, the entropy of the
target is calculated. Then the information gain of the different attributes are calculated by
subtracting the entropy of each attribute from the target entropy and the attribute with the
largest information gain is selected as the decision node. If the entropy of any node is zero,
then it treated as a leaf node. If the entropy of any node is not zero, then the node is further
split as specified above till only leaf nodes exist in the decision tree i.e. all the data has
been classified and converted to a decision tree. It can be inferred from the above statement
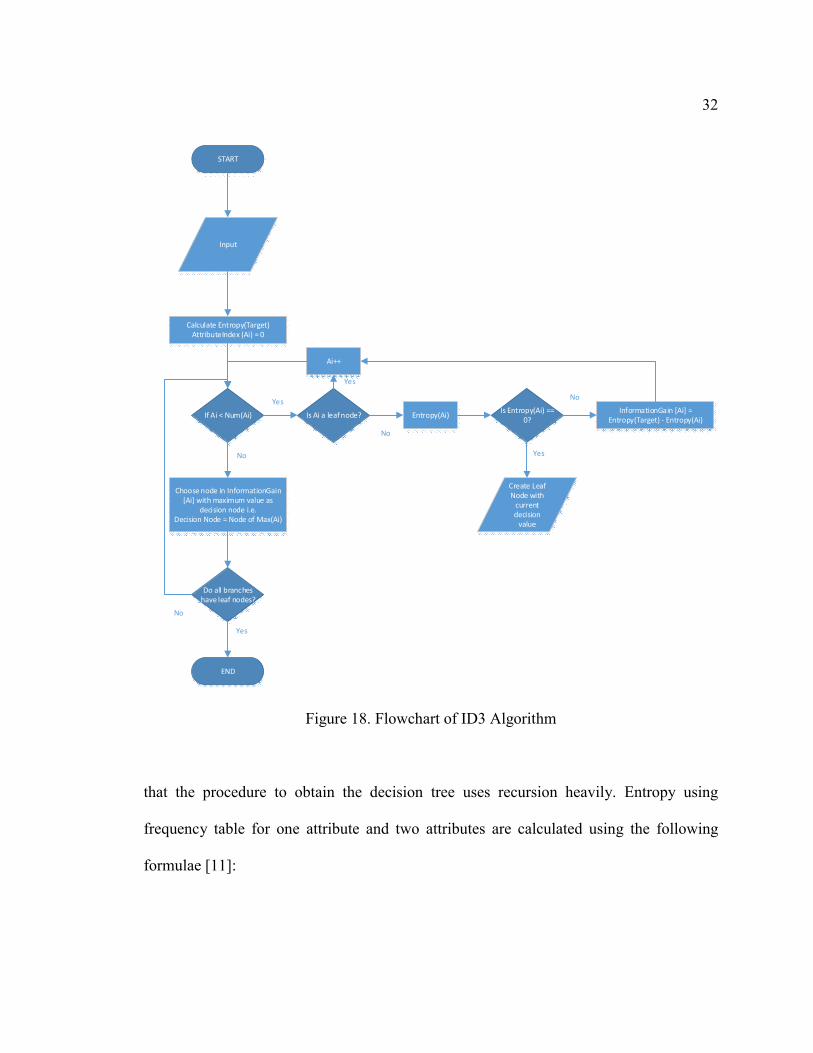
32
START
END
Input
Calculate Entropy(Target)AttributeIndex (Ai) = 0
If Ai < Num(Ai) Entropy(Ai)InformationGain [Ai] =
Entropy(Target) - Entropy(Ai)
Choose node in InformationGain [Ai] with maximum value as
decision node i.e.Decision Node = Node of Max(Ai)
Is Entropy(Ai) == 0?
Create Leaf Node with
current decision
value
Is Ai a leaf node?
Do all branches have leaf nodes?
Ai++
No
Yes
No
YesNo
Yes
No
Yes
Figure 18. Flowchart of ID3 Algorithm
that the procedure to obtain the decision tree uses recursion heavily. Entropy using
frequency table for one attribute and two attributes are calculated using the following
formulae [11]:
33
Entropy using the frequency table of one attribute:
E(S) =�−p�log�p�
�
���
Entropy using the frequency table of two attributes: [16]
E(T, X) =�P(c)E(c)
���
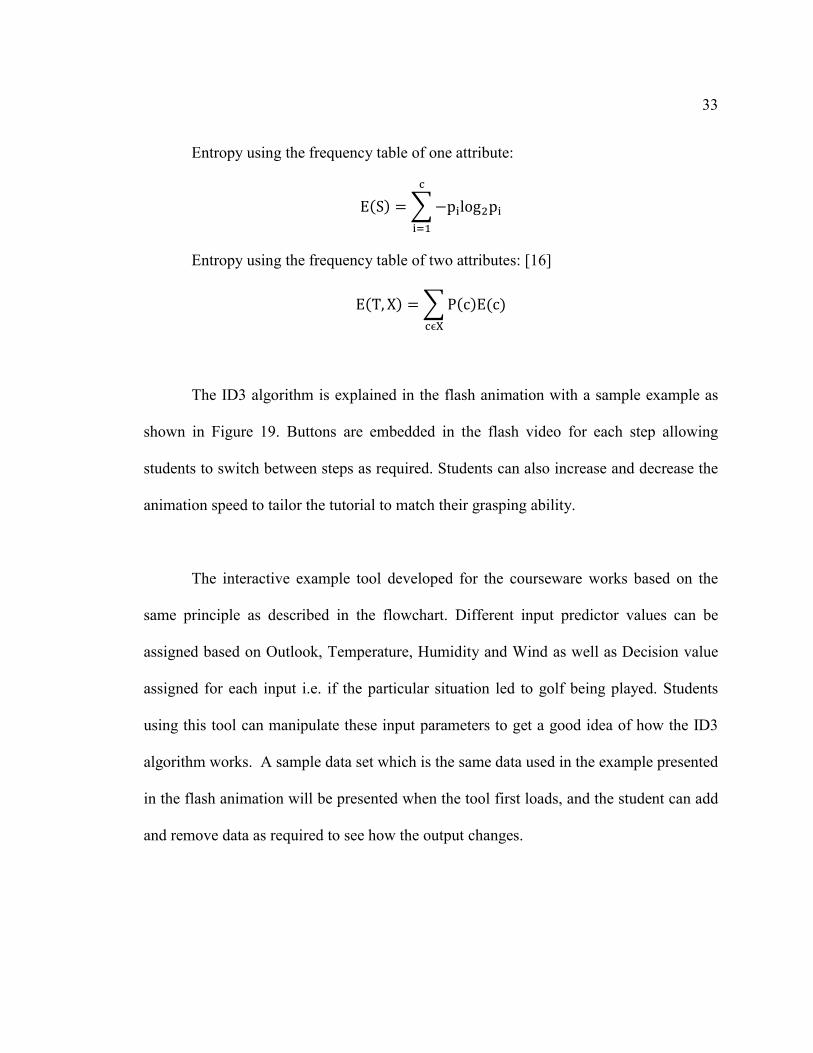
The ID3 algorithm is explained in the flash animation with a sample example as
shown in Figure 19. Buttons are embedded in the flash video for each step allowing
students to switch between steps as required. Students can also increase and decrease the
animation speed to tailor the tutorial to match their grasping ability.
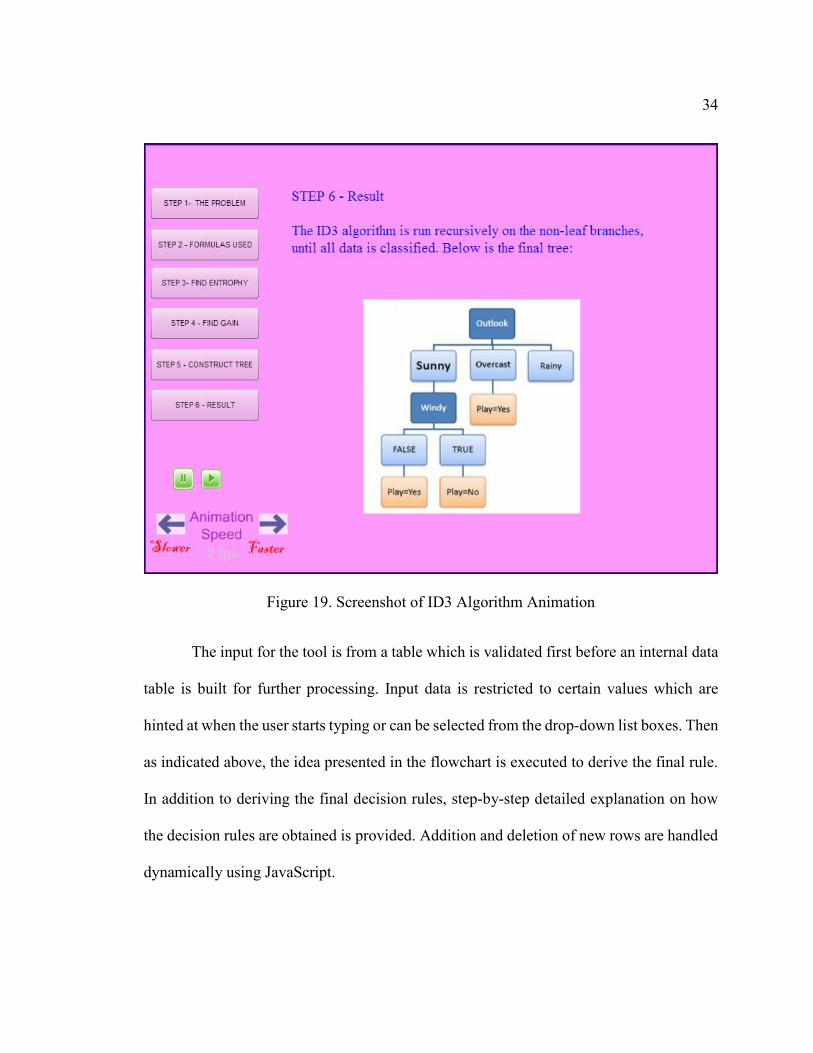
The interactive example tool developed for the courseware works based on the
same principle as described in the flowchart. Different input predictor values can be
assigned based on Outlook, Temperature, Humidity and Wind as well as Decision value
assigned for each input i.e. if the particular situation led to golf being played. Students
using this tool can manipulate these input parameters to get a good idea of how the ID3
algorithm works. A sample data set which is the same data used in the example presented
in the flash animation will be presented when the tool first loads, and the student can add
and remove data as required to see how the output changes.
34
Figure 19. Screenshot of ID3 Algorithm Animation
The input for the tool is from a table which is validated first before an internal data
table is built for further processing. Input data is restricted to certain values which are
hinted at when the user starts typing or can be selected from the drop-down list boxes. Then
as indicated above, the idea presented in the flowchart is executed to derive the final rule.
In addition to deriving the final decision rules, step-by-step detailed explanation on how
the decision rules are obtained is provided. Addition and deletion of new rows are handled
dynamically using JavaScript.
35
Figure 20. Screenshot of ID3 Classification Tool
36
5.5 Data Mining Tools
Organizations that wish to use data mining tools can purchase mining programs
designed for existing software and hardware platforms, which can be integrated into new
products and systems as they are brought online, or they can build their own custom mining
solution. For example, sending the output of a data mining exercise to another computer,
such as a neural network, is very common and can give the mined data much more value
by providing much more information. This is a useful methodology because the data
mining tool gathers the required data, and then the neural network or similar program
makes decisions based on the data collected [12].
In today’s data mining world, many types of data mining tools are available, each
with their own positives and negatives. Most data mining tools can be classified into one
of the following three categories: traditional data mining tools, dashboards, and text-mining
tools [12]. Below is a description of each of these type of tools.
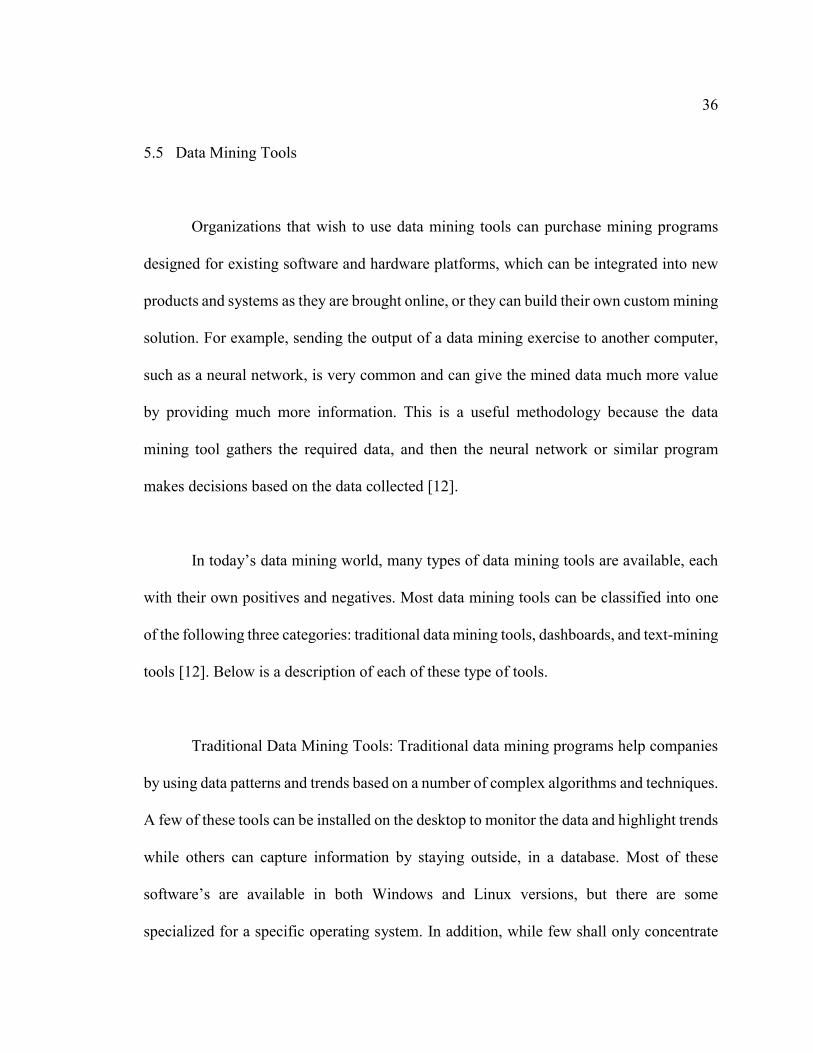
Traditional Data Mining Tools: Traditional data mining programs help companies
by using data patterns and trends based on a number of complex algorithms and techniques.
A few of these tools can be installed on the desktop to monitor the data and highlight trends
while others can capture information by staying outside, in a database. Most of these
software’s are available in both Windows and Linux versions, but there are some
specialized for a specific operating system. In addition, while few shall only concentrate
37
on one database type, most will be able to handle any data using online analytical
processing or a similar technology [12].
Dashboards: Dashboards are usually used in systems to monitor information in a
database. These dashboards detect changes in data and immediately update the onscreen
interface with an indication of the change that occurred. Mostly these changes are displayed
as a form or a chart, to help users see how the business is performing in an intuitive way.
Also, historical data can be used for dashboards, which would assist the user to see where
things have changed (e.g., increase in profit from the same period last year). This
functionality makes dashboards very user-friendly. It is very useful for managers and other
higher level heads in the organization to understand the performance of the business sectors
[12].
Text-mining Tools: The third type of data mining tool is called a text-mining tool
because of its efficiency to mine data from different types of text such as simple test files
to PDF files to word documents and many more. These tools scan through the content of
the provided file and converts the selected data into a format that is compatible with the
tool's database, thus providing users with an easy and convenient way of accessing data
without the need to open different applications. Scanned content can be unstructured (i.e.,
information can be scattered almost randomly across the document, including e-mails,
Internet pages, audio and video data) or structured (i.e., the data's form and purpose is
known, such as content found in a database). Capturing these inputs can provide
38
organizations with a wealth of information that can be mined to discover trends, concepts,
and attitudes [12].
There are many data mining tools available in market such as Databionic ESOM
Tools, GNU Octave, CMSR Data Miner, Mlpy, Mallet, Shogun, scikit-learn, LIBSVM,
LIBLINEAR, Lattice Miner, Orange, Weka , Rattle GUI , Apache Mahout, SCaViS,
RapidMiner, R, ML-Flex, DLib, Jubatus, KEEL, Gnome-datamine-tools, Natural
Language Toolkit, SenticNet API, ELKI, UIMA, KNIME, Chemicalize.org, Vowpal
Wabbit are some of the free data mining tools available in the market[6].With so many
tools available, I chose to use RapidMiner and Weka for the courseware as these tools are
widely used for this course [13].
5.5.1 RapidMiner Tutorial
RapidMiner is a free software used for data mining. The advantages of this tool are
strong visualizations, multiple interfaces, accurate preprocessing and complete toolbox.
The tool is also compatible with all major platforms and is very quick to set up and use.
After doing complete research about the software, I wrote a step by step tutorial for the
courseware. The steps included are opening the software, preprocessing data, connecting
input and output based on an algorithm and visualizing the output. In addition to the above
I have included a video tutorial making use of the above steps using a “Black Friday”
dataset, which will be helpful for students to see how the software works with real-world
39
dataset. A screenshot of steps is shown in Figure 21, and a screenshot of the video tutorial
is in figure 22.
Figure 21. Screenshot of Data Mining Tools Tutorial
40
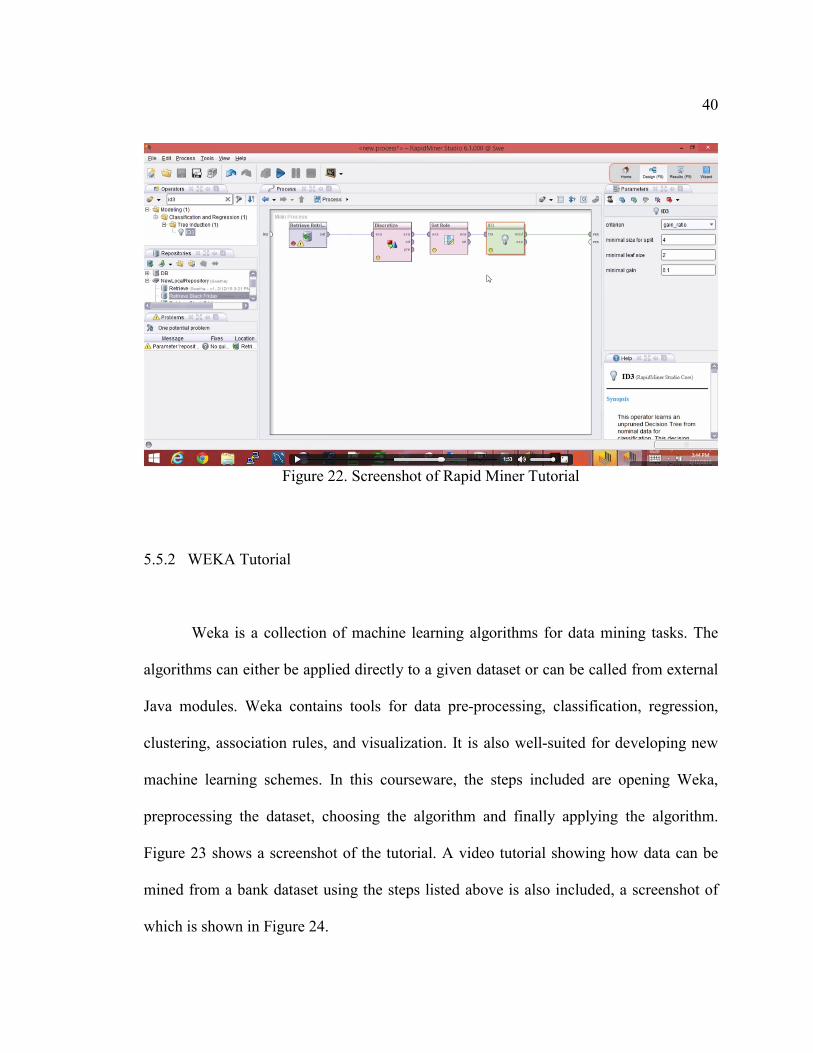
Figure 22. Screenshot of Rapid Miner Tutorial
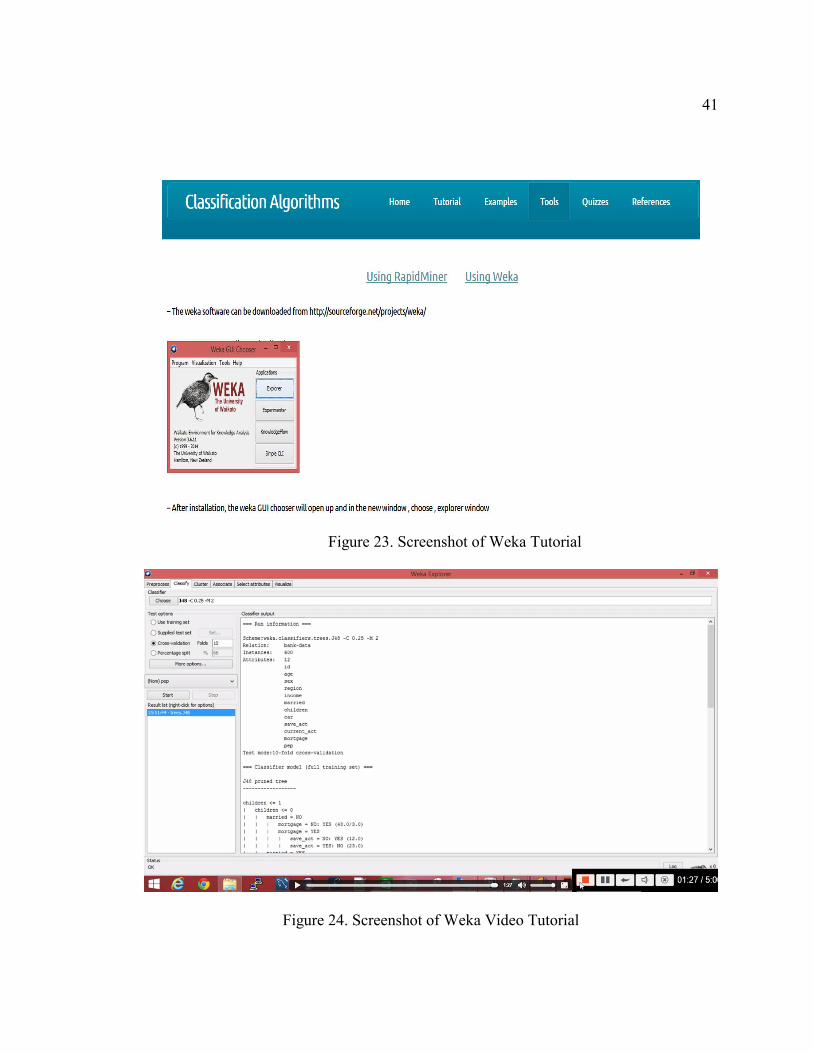
5.5.2 WEKA Tutorial
Weka is a collection of machine learning algorithms for data mining tasks. The
algorithms can either be applied directly to a given dataset or can be called from external
Java modules. Weka contains tools for data pre-processing, classification, regression,
clustering, association rules, and visualization. It is also well-suited for developing new
machine learning schemes. In this courseware, the steps included are opening Weka,
preprocessing the dataset, choosing the algorithm and finally applying the algorithm.
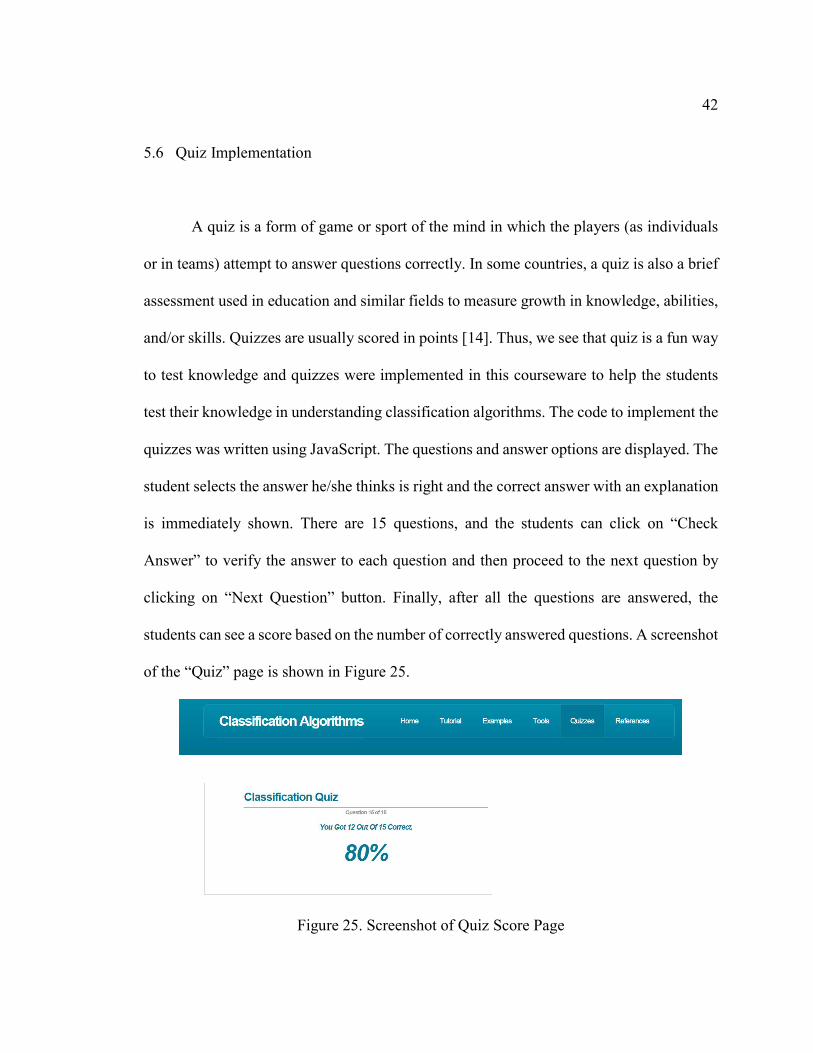
Figure 23 shows a screenshot of the tutorial. A video tutorial showing how data can be
mined from a bank dataset using the steps listed above is also included, a screenshot of
which is shown in Figure 24.
41
Figure 23. Screenshot of Weka Tutorial
Figure 24. Screenshot of Weka Video Tutorial
42
5.6 Quiz Implementation
A quiz is a form of game or sport of the mind in which the players (as individuals
or in teams) attempt to answer questions correctly. In some countries, a quiz is also a brief
assessment used in education and similar fields to measure growth in knowledge, abilities,
and/or skills. Quizzes are usually scored in points [14]. Thus, we see that quiz is a fun way
to test knowledge and quizzes were implemented in this courseware to help the students
test their knowledge in understanding classification algorithms. The code to implement the
quizzes was written using JavaScript. The questions and answer options are displayed. The
student selects the answer he/she thinks is right and the correct answer with an explanation
is immediately shown. There are 15 questions, and the students can click on “Check
Answer” to verify the answer to each question and then proceed to the next question by
clicking on “Next Question” button. Finally, after all the questions are answered, the
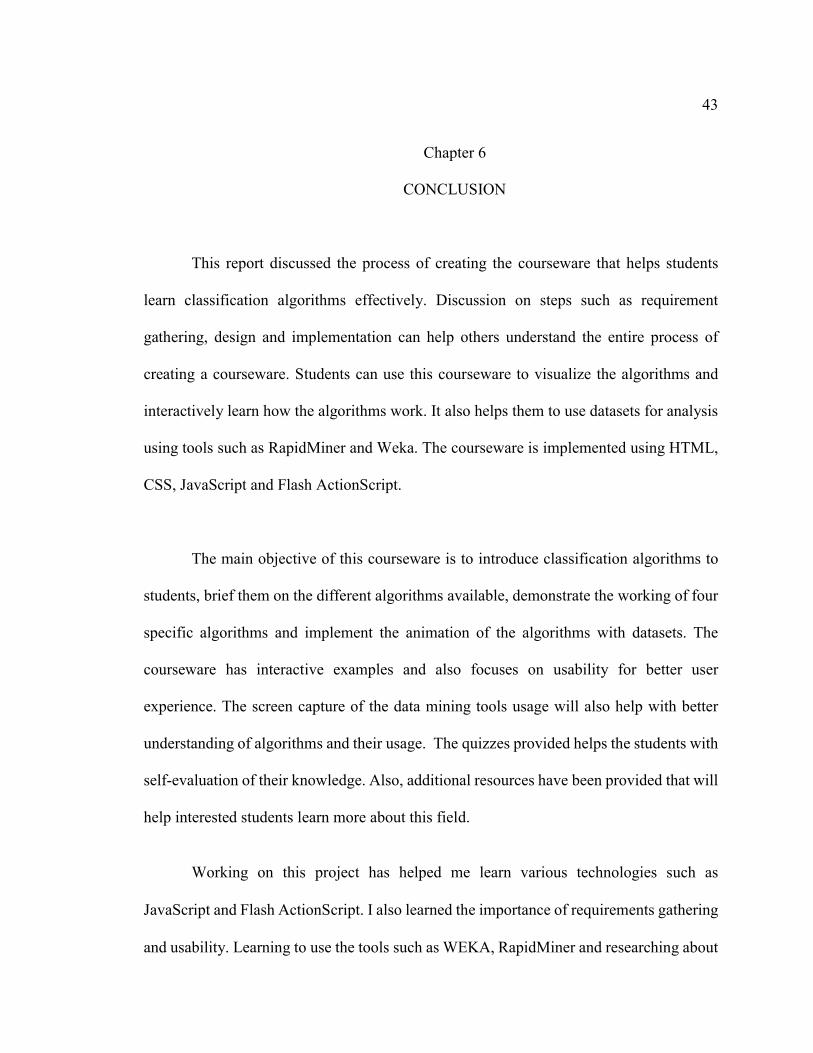
students can see a score based on the number of correctly answered questions. A screenshot
of the “Quiz” page is shown in Figure 25.
Figure 25. Screenshot of Quiz Score Page
43
Chapter 6
CONCLUSION
This report discussed the process of creating the courseware that helps students
learn classification algorithms effectively. Discussion on steps such as requirement
gathering, design and implementation can help others understand the entire process of
creating a courseware. Students can use this courseware to visualize the algorithms and
interactively learn how the algorithms work. It also helps them to use datasets for analysis
using tools such as RapidMiner and Weka. The courseware is implemented using HTML,
CSS, JavaScript and Flash ActionScript.
The main objective of this courseware is to introduce classification algorithms to
students, brief them on the different algorithms available, demonstrate the working of four
specific algorithms and implement the animation of the algorithms with datasets. The
courseware has interactive examples and also focuses on usability for better user
experience. The screen capture of the data mining tools usage will also help with better
understanding of algorithms and their usage. The quizzes provided helps the students with
self-evaluation of their knowledge. Also, additional resources have been provided that will
help interested students learn more about this field.
Working on this project has helped me learn various technologies such as
JavaScript and Flash ActionScript. I also learned the importance of requirements gathering
and usability. Learning to use the tools such as WEKA, RapidMiner and researching about
44
the data mining tools has helped me gain a lot of knowledge in this field.
6.1 Future Enhancements This courseware implementation is limited to classification techniques and their
implementation. This project can be enhanced by implementing more details:
• There are many more classification algorithms available and they can be
included in the courseware such as Decision tree algorithms, Rule-based algorithms,
Distance-based algorithms, and Support Vector Machine algorithms
• The type of input is restricted and the courseware can be extended to include
more types of input.
• A version of this courseware can be built as a mobile application that can be
used by students on the go.
• More datasets can be used to show different uses of the data mining tools. Also,
tutorials on other data mining tools can be included.
• The tools implemented are for one-dimensional data, one can implement the
same tools for a two-dimensional dataset.
45
APPENDIX A
OneR Algorithm Source Code
<!DOCTYPE html>
<html lang="en">
<head>
<meta charset="utf-8">
<title>Classifier</title>
</head>
<body>
<article>
<h1>Classification</h1>
<h2>1R</h2>
<table id="data">
<tr>
<th>RID</th>
<th>Travel Cost</th>
<th>Vehicle</th>
<th>Size</th>
<th>Class</th>
</tr>
<script language="javascript" type="text/javascript">
46
var Entry = new Array();
Entry = [["1", "Cheap", "Bus", "Small", "Plus"],
["2", "Standard", "Bus", "Small", "Plus"],
["3","Expensive","Train","Large",Minus"],
["4", "Standard", "Bus", "Large", "Minus"],
["5", "Cheap", "Train", "Large", "Plus"],
["6", "Standard", "Bus", "Small", "Minus"]];
for (var i=0; i<6; i++) {
document.write("<tr>");
document.write("<td>" + Entry[i][0] + "</td>");
document.write("<td><input list=\"travelcosts\"
type=\"text\" id=\"travelcost" + (i+1) + "\" autocomplete=\"on\" value=\"" + Entry[i][1] +
"\"</td>");
document.write("<td><input list=\"vehicles\" type=\"text\"
id=\"vehicle" + (i+1) + "\" autocomplete=\"on\" value=\"" + Entry[i][2] + "\"</td>");
document.write("<td><input list=\"sizes\" type=\"text\"
id=\"size" + (i+1) + "\" autocomplete=\"on\" value=\"" + Entry[i][3] + "\"</td>");
document.write("<td><input list=\"classes\" type=\"text\"
id=\"class" + (i+1) + "\" autocomplete=\"on\" value=\"" + Entry[i][4] + "\"</td>");
document.write("<td><button type=\"button\"
onclick=\"DeleteRow(" + (i+1) + ")\" class=\"deleteclass\"> X
</button></td>");
47
document.write("</tr>");
}
document.write("<tr><td colspan=\"6\"><button type=\"button\"
onclick=\"AddRow()\" class=\"addclass\"> + </button></td></tr>");
</script>
</table>
<datalist id="travelcosts">
<option value="Cheap">
<option value="Standard">
<option value="Expensive">
</datalist>
<datalist id="vehicles">
<option value="Bus">
<option value="Train">
</datalist>
<datalist id="sizes">
<option value="Small">
<option value="Large">
</datalist>
<datalist id="classes">
<option value="Plus">
<option value="Minus">
48
</datalist>
<h3><button type="button" onclick="OneRClassify()"
class="bitboxclass"> 1R Classify </button></h3>
<h4><label id="BestPredictorValue"></label></h4>
<script language="javascript" type="text/javascript">
var RowCount = 6;
function OneRClassify() {
var EntryList = [];
var PredictorAnalysis = "";
var TravelCost = "";
var Vehicle = "";
var Size = "";
var Class = "";
var ColumnList = [1,2,3];
var NodeMeaning = ["Leaf", "Travel Cost", "Vehicle", "Size"];
var BestPredictor = undefined;
var MinErrorList = {};
var ColumnHash = {};
var PredictorHash = {};
var PlusHash = {};
var TableRef = document.getElementById("data");
for(var i=1; i <= RowCount; i++) {
49
if(document.getElementById("travelcost" + i)!= undefined)
{
TravelCost = document.getElementById("travelcost" + i).value;
Vehicle = document.getElementById("vehicle" + i).value;
Size = document.getElementById("size" + i).value;
Class = document.getElementById("class" + i).value;
EntryList.push([i, TravelCost, Vehicle, Size, Class]);
}
}
for (var i=0; i < ColumnList.length; i++) {
for (var j=0; j < EntryList.length; j++) {
if(PredictorHash[EntryList[j][ColumnList[i]]] == undefined) {
ColumnHash[EntryList[j][ColumnList[i]]] = ColumnList[i];
PredictorHash[EntryList[j][ColumnList[i]]] = 0;
PlusHash[EntryList[j][ColumnList[i]]] = 0;
}
PredictorHash[EntryList[j][ColumnList[i]]] = PredictorHash[EntryList[j][ColumnList[i]]]
+ 1;
if(EntryList[j][4] == "Plus") {
PlusHash[EntryList[j][ColumnList[i]]] = PlusHash[EntryList[j][ColumnList[i]]] +
1;
50
}
}
}
keys = Object.keys(PredictorHash);
for(var i=0; i < keys.length; i++) {
if(MinErrorList[ColumnHash[keys[i]]] == undefined) {
MinErrorList[ColumnHash[keys[i]]] = 0;
}
MinErrorList[ColumnHash[keys[i]]] =
MinErrorList[ColumnHash[keys[i]]] + Math.min(PlusHash[keys[i]],
PredictorHash[keys[i]] - PlusHash[keys[i]]);
}
var PredictorString = "";
for (var i=0; i < ColumnList.length; i++) {
PredictorString=PredictorString+NodeMeaning[ColumnList[i]].bold() +
"</br>"
for(varj=0;j<keys.length;j++)
{
if (ColumnList[i] == ColumnHash[keys[j]])
{
if(PlusHash[keys[j]]<(PredictorHash[keys[j]] - PlusHash[keys[j]])) {
51
PredictorString = PredictorString + keys[j] + " = Pluses:<b><font color=\"red\"> " +
PlusHash[keys[j]] + "<\/font></b> Minuses: <b><i>" +
(PredictorHash[keys[j]] - PlusHash[keys[j]]) + "</b></i></br>";
}else
{
PredictorString = PredictorString + keys[j] + " = Pluses:<b><i> " + PlusHash[keys[j]] +
"</b></i> Minuses: <b><font color=\"red\">" +
(PredictorHash[keys[j]] - PlusHash[keys[j]]) + "<\/font></b></br>";
}
}
}
PredictorString = PredictorString + "Total Error: " + MinErrorList[ColumnList[i]] +
"</br></br>"
}
keys = Object.keys(MinErrorList);
for(var i=0; i < keys.length; i++) {
if(BestPredictor == undefined) {
BestPredictor = keys[i];
}
if(MinErrorList[keys[i]] < MinErrorList[BestPredictor]) {
BestPredictor = keys[i];
}
52
}
document.getElementById("BestPredictorValue").innerHTML =
NodeMeaning[BestPredictor];
keys = Object.keys(PredictorHash);
for(var i=0; i < keys.length; i++) {
if(ColumnHash[keys[i]] == BestPredictor) {
PredictorAnalysis = PredictorAnalysis + "</br>" +
"<b><i>IF</i></b> " + NodeMeaning[BestPredictor] + "=" + keys[i] + "
<b><i>THEN</i></b> Class = ";
if(Math.floor(PredictorHash[keys[i]]/PlusHash[keys[i]]) > 1.0) {
PredictorAnalysis = PredictorAnalysis +
"Minus";
} else {
PredictorAnalysis = PredictorAnalysis +
"Plus";
}
}
}
PredictorString = PredictorString + "The best predictor the column
with the lowest total error count </br>";
53
PredictorString = PredictorString + "</br>" + "Therefore the best
predictor is <b>" + NodeMeaning[BestPredictor] + "</b> which gives us the
following decision rules:</br>" + PredictorAnalysis;
document.getElementById("BestPredictorValue").innerHTML =
PredictorString;
}
function AddRow(){
RowCount = RowCount + 1;
var TableRef = document.getElementById("data");
// Insert a row in the table at the last row
var newRow = TableRef.insertRow(TableRef.rows.length-1);
// Insert a cell in the row at index 0
newCell = newRow.insertCell(0);
newCell.innerHTML = TableRef.rows.length-2;
newCell = newRow.insertCell(1);
newCell.innerHTML = "<td><input list=\"travelcosts\"
type=\"text\" id=\"travelcost" + RowCount + "\" autocomplete=\"on\"
value=\"Cheap\"></td>";
newCell = newRow.insertCell(2);
newCell.innerHTML = "<td><input list=\"vehicles\" type=\"text\"
id=\"vehicle" + RowCount + "\" autocomplete=\"on\" value=\"Bus\"></td>";
newCell = newRow.insertCell(3);
54
newCell.innerHTML = "<td><input list=\"sizes\" type=\"text\"
id=\"size" + RowCount + "\" autocomplete=\"on\" value=\"Small\"></td>";
newCell = newRow.insertCell(4);
newCell.innerHTML = "<td><input list=\"costs\" type=\"text\"
id=\"class" + RowCount + "\" autocomplete=\"on\" value=\"Plus\"></td>";
newCell = newRow.insertCell(5);
newCell.innerHTML = "<td><button type=\"button\"
onclick=\"DeleteRow(" + RowCount + ")\" class=\"deleteclass\"> X </button></td>";
}
function DeleteRow(RowNum){
var TableRef =
document.getElementById("data");
var RealRowCount = 1;
for(var i=1; i<=RowNum; i++){
if(document.getElementById("size" + i) !=
undefined){
if((document.getElementById("size" + i).id) ==
("size"+RowNum)) {
TableRef.deleteRow(RealRowCount);
break;
}
RealRowCount = RealRowCount + 1;
55
}
}
var Row;
for(var i=1; i<TableRef.rows.length; i++){
Row = TableRef.rows[i];
Row.cells[0].firstChild.nodeValue = i;
}
ChildNodes = TableRef.rows[2].childNodes;
}
</script>
</article>
</body>
</html>
56
APPENDIX B
Quiz.js source code
<!DOCTYPE HTML>
<!--
Minimaxing 1.0 by nodethirtythree + FCT
http://nodethirtythree.com | @nodethirtythree
Released under the Creative Commons Attribution 3.0 license
(nodethirtythree.com/license)
-->
<html>
<head>
<title>Classification courseware</title>
<meta http-equiv="content-type" content="text/html; charset=utf-8" />
<meta name="description" content="" />
<meta name="keywords" content="" />
<!--5grid--><script
src="css/5grid/viewport.js"></script><!--[if lt IE 9]><script
src="css/5grid/ie.js"></script><![endif]--><link rel="stylesheet"
href="css/5grid/core.css" />
<link rel="stylesheet" href="css/style.css" />
<!--[if IE 9]><link rel="stylesheet" href="css/style-
57
ie9.css" /><![endif]-->
<script
src="http://ajax.googleapis.com/ajax/libs/jquery/1.9.1/jquery.min.js"></script>
<script type="text/javascript">
var quiztitle = "Classification Quiz";
var quiz = [
{
"question" : "Q1: What type of learning is classification?",
"choices" : [
"Supervised Learning",
"Unsupervised Learning",
"None of the above"
],
"correct" : "Supervised Learning",
"explanation" : "Classification uses Supervised Learning where the training data
are accompanied by labels indicating the class of the observations.New data is classified
based on the training set.",
},
{
"question" : "Q2: Which of these is decision tree based classification algorithm?",
58
"choices" : [
"Knn algorithm",
"Naive Bayesian algorithm",
"Support Vecor Machine algorithm",
"ID3 algorithm"
],
"correct" : "ID3 algorithm",
"explanation" : "ID3 uses Decision trees which are trees that classify instances by
sorting them based on feature values.Given a set S of cases, it first grows an initial tree
using the divide-and-conquer algorithm and continues to create the tree ",
},
{
"question" : "Q3: Which algorithm can be extended to ternary classification
whithout any modifications?",
"choices" : [ "Knn algorithm",
"Naive Bayesian algorithm",
"Support Vecor Machine algorithm",
"ID3 algorithm"
],
"correct" : "Knn algorithm",
"explanation" : "Knn algorithm can be extended to ternary classification",
59
},
{
"question" : "Q4: ID3 attempts to make the ------- decision tree out of a set of
learning data?",
"choices" : [ "Shortest",
"Longest",
"Widest",
"None"
],
"correct" : "Shortest",
"explanation" : "ID3 attempts to make the shortest decision tree out of a set of
learning data, shortest is not always the best classification.",
},
{
"question" : "Q5: ID3 Requires learning data to have ------- patterns ",
"choices" : [ "Irrelevant ",
"Sequential ",
"completely consistent ",
" All of the above "
60
],
"correct" : "completely consistent ",
"explanation" : " ID3 Requires learning data to have completely consistent patterns
with no uncertainty.",
},
{
"question" : "Q6:In ID3 , at a time how many attributes are tested? ",
"choices" : [ " One",
" Two",
" Three",
" Four"
],
"correct" : " One",
"explanation" : " Only one attribute at a time is tested for making a decision in the
algorithm.",
},
{
"question" : "Q7: Naive Bayes Algorithm is useful for : ",
"choices" : [ "indepth analysis ",
" Slow scanning",
61
" Fast to classify ",
" None of the above "
],
"correct" : " Fast to classify ",
"explanation" : " Naive Bayes is Fast to train (single scan)and also Fast to classify
",
},
{
"question" : "Q8: Naive Bayes handles which data well: ",
"choices" : [ " real data",
" Discrete data",
" Streaming data",
" All the above"
],
"correct" : " All the above",
"explanation" : " Explanation: Naive Bayes handles all the three kind of data well",
},
{
"question" : "Q9:Categorization in Naive Bayes , produces a -------- probability
distribution over the possible categories ",
62
"choices" : [ " posterior",
" Interior",
" Both",
" None"
],
"correct" : " posterior",
"explanation" : " Categorization in Naive Bayes , produces a posterior probability
distribution over the possible categories given a description of an item.",
},
{
"question" : "Q10: All instances in Knn corresponds to: ",
"choices" : [ " 1-dimensional Euclidean space",
" 2-dimensional Euclidean space",
" 3-dimensional Euclidean space",
" n-dimensional Euclidean space"
],
"correct" : " n-dimensional Euclidean space",
"explanation" : " All instances correspond to points in an n-dimensional Euclidean
space",
},
63
{
"question" : "Q11: In KNN , the classification is ------- a new instance arrives: ",
"choices" : [ " advanced before",
" delayed till",
" Both",
" None"
],
"correct" : " delayed till",
"explanation" : " In Knn Classification is delayed till a new instance arrives",
},
{
"question" : "Q12: The target function in Knn should be",
"choices" : [ " real",
" discrete",
" discrete or real-valued",
" Streamlined"
],
"correct" : " discrete or real-valued",
"explanation" : " In Knn Target function may be discrete or real-valued",
},
64
{
"question" : "Q13: OneR calculates ------ based on creating a simple rule for the
attribute",
"choices" : [ " Error Rate",
" entropy",
" Bayes Classifier",
" none"
],
"correct" : " Error Rate",
"explanation" : " The algorithm uses OneR classifier to find out the attributes'
weights. For each attribute it creates a simple rule based only on that attribute and then
calculates its error rate.",
},
{
"question" : "Q14: Which algorithm picks one attribute to use that makes fewest
prediction errors?",
"choices" : [ " ID3",
" OneR",
" kNN",
65
" NaiveBayesian"
],
"correct" : " OneR",
"explanation" : " The OneR algorithm creates one rule for each attribute in the
training data, then selects the rule with the smallest error rate as its one rule.",
},
{
"question" : "Q14:Which algorithm treats all numerically valued features as
continuous and uses a straightforward method to divide the range of values into several
disjoint intervals?",
"choices" : [ " ID3",
" OneR",
" kNN",
" NaiveBayesian"
],
"correct" : " OneR",
"explanation" : " OneR treats all numerically valued features as continuous and uses
a straightforward method to divide the range of values into several disjoint intervals.",
},
];
66
var currentquestion = 0,
score = 0,
submt = true,
picked;
jQuery(document).ready(function ($) {
function htmlEncode(value) {
return $(document.createElement('div')).text(value).html();
}
function addChoices(choices) {
if (typeof choices !== "undefined" && $.type(choices) == "array") {
$('#choice-block').empty();
for (var i = 0; i < choices.length; i++) {
$(document.createElement('li')).addClass('choice choice-box').attr('data-index',
i).text(choices[i]).appendTo('#choice-block');
}
}
67
}
function nextQuestion() {
submt = true;
$('#explanation').empty();
$('#question').text(quiz[currentquestion]['question']);
$('#pager').text('Question ' + Number(currentquestion + 1) + ' of ' + quiz.length);
if (quiz[currentquestion].hasOwnProperty('image') &&
quiz[currentquestion]['image'] != "") {
if ($('#question-image').length == 0) {
$(document.createElement('img')).addClass('question-image').attr('id',
'question-image').attr('src', quiz[currentquestion]['image']).attr('alt',
htmlEncode(quiz[currentquestion]['question'])).insertAfter('#question');
} else {
$('#question-image').attr('src', quiz[currentquestion]['image']).attr('alt',
htmlEncode(quiz[currentquestion]['question']));
}
} else {
$('#question-image').remove();
}
addChoices(quiz[currentquestion]['choices']);
setupButtons();
68
}
function processQuestion(choice) {
if (quiz[currentquestion]['choices'][choice] == quiz[currentquestion]['correct']) {
$('.choice').eq(choice).css({
'background-color': '#50D943'
});
$('#explanation').html('<strong>Correct!</strong> ' +
htmlEncode(quiz[currentquestion]['explanation']));
score++;
} else {
$('.choice').eq(choice).css({
'background-color': '#D92623'
});
$('#explanation').html('<strong>Incorrect.</strong> ' +
htmlEncode(quiz[currentquestion]['explanation']));
}
currentquestion++;
$('#submitbutton').html('NEXT QUESTION »').on('click', function () {
69
if (currentquestion == quiz.length) {
endQuiz();
} else {
$(this).text('Check Answer').css({
'color': '#222'
}).off('click');
nextQuestion();
}
})
}
function setupButtons() {
$('.choice').on('mouseover', function () {
$(this).css({
'background-color': '#e1e1e1'
});
});
$('.choice').on('mouseout', function () {
$(this).css({
'background-color': '#fff'
});
70
})
$('.choice').on('click', function () {
picked = $(this).attr('data-index');
$('.choice').removeAttr('style').off('mouseout mouseover');
$(this).css({
'border-color': '#222',
'font-weight': 700,
'background-color': '#c1c1c1'
});
if (submt) {
submt = false;
$('#submitbutton').css({
'color': '#000'
}).on('click', function () {
$('.choice').off('click');
$(this).off('click');
processQuestion(picked);
});
}
})
}
71
function endQuiz() {
$('#explanation').empty();
$('#question').empty();
$('#choice-block').empty();
$('#submitbutton').remove();
$('#question').text("You got " + score + " out of " + quiz.length + " correct.");
$(document.createElement('h2')).css({
'text-align': 'center',
'font-size': '4em'
}).text(Math.round(score / quiz.length * 100) + '%').insertAfter('#question');
}
function init() {
//add title
if (typeof quiztitle !== "undefined" && $.type(quiztitle) === "string") {
$(document.createElement('h1')).text(quiztitle).appendTo('#frame');
} else {
$(document.createElement('h1')).text("Quiz").appendTo('#frame');
}
72
//add pager and questions
if (typeof quiz !== "undefined" && $.type(quiz) === "array") {
//add pager
$(document.createElement('p')).addClass('pager').attr('id', 'pager').text('Question 1
of ' + quiz.length).appendTo('#frame');
//add first question
$(document.createElement('h2')).addClass('question').attr('id',
'question').text(quiz[0]['question']).appendTo('#frame');
//add image if present
if (quiz[0].hasOwnProperty('image') && quiz[0]['image'] != "") {
$(document.createElement('img')).addClass('question-image').attr('id',
'question-image').attr('src', quiz[0]['image']).attr('alt',
htmlEncode(quiz[0]['question'])).appendTo('#frame');
}
$(document.createElement('p')).addClass('explanation').attr('id',
'explanation').html(' ').appendTo('#frame');
//questions holder
$(document.createElement('ul')).attr('id', 'choice-block').appendTo('#frame');
//add choices
addChoices(quiz[0]['choices']);
73
//add submit button
$(document.createElement('div')).addClass('choice-box').attr('id',
'submitbutton').text('Check Answer').css({
'font-weight': 700,
'color': '#222',
'padding': '30px 0'
}).appendTo('#frame');
setupButtons();
}
}
init();
});
</script>
</head>
<body>
<div id="header-wrapper">
<div class="5grid">
<div class="12u-first">
<header id="header">
74
<h1><a href="#">Classification Algorithms</a></h1>
<nav>
<a href="index.html" >Home</a>
<a href="tutorial.html">Tutorial</a>
<a href="Examples.html" > Examples</a>
<a href="Tools.html" >tools</a>
<a href="Quizzes.html" class="current-page-item">Quizzes</a>
<a href="References.html">References</a>
</nav>
</header>
</div>
</div>
</div>
<div id="main">
<div class="5grid">
<div class="main-row">
<div class="12u-first">
<section>
<div align="center" style="padding-left:100px;" id = "frame"
role = "content" ></div>
75
</section>
</div>
</div>
</div>
</div>
<div id="footer-wrapper">
<div class="5grid">
</div></div>
</div></body>
</html>
76
BIBLIOGRAPHY
[1] J. Han, M. Kamber and J. Pei, Data Mining: Concepts and Techniques, 3rd
edition. Amsterdam: Elsevier/Morgan Kaufmann, 2012.
[2] Data Mining: What is Data Mining?, From:
http://www.anderson.ucla.edu/faculty/jason.frand/teacher/technologies/palace/dat
amining.htm. [Accessed: 22- Apr- 2015].
[3] Supervised learning, From: http://en.wikipedia.org/wiki/Supervised_learning.
[Accessed: 22- Apr- 2015].
[4] Data Mining, From: http://www.unc.edu/~xluan/258/datamining.html#history.
[Accessed: 22- Apr- 2015].
[5] What is courseware? - Definition from WhatIs.com, From:
http://whatis.techtarget.com/definition/courseware. [Accessed: 22- Apr- 2015].
[6] Best Free Windows Screen Capture & Video Recording Software | TinyTake,
From: http://tinytake.com/. [Accessed: 22- Apr- 2015].
[7] kNN classifiers 1. What is a kNN classifier?, From:
http://www.fon.hum.uva.nl/praat/manual/kNN_classifiers_1__What_is_a_kNN_c
lassifier_.html. [Accessed: 22- Apr- 2015].
[8] Naive Bayes classifier, From:
http://en.wikipedia.org/wiki/Naive_Bayes_classifier. [Accessed: 22- Apr- 2015].
[9] Naive Bayes Classifier, From: http://www.statsoft.com/textbook/naive-bayes-
classifier. [Accessed: 22- Apr- 2015].
[10] ID3, From: http://www.cise.ufl.edu/~ddd/cap6635/Fall-97/Short-papers/2.htm.
[Accessed: 22- Apr- 2015].
[11] Decision Tree, From: http://www.saedsayad.com/decision_tree.htm. [Accessed:
22- Apr- 2015].
[12] IT Audit - The Institute of Internal Auditors, From:
http://www.theiia.org/ITAuditArchive/index.cfm?catid=21&iid=484. [Accessed:
22- Apr- 2015].

77
[13] 34 Top Free Data Mining Software - Predictive Analytics Today, From:
http://www.predictiveanalyticstoday.com/top-15-free-data-mining-software/.
[Accessed: 22- Apr- 2015].
[14] Quiz, From: http://en.wikipedia.org/wiki/Quiz. [Accessed: 22- Apr- 2015].


![Minsoo Kang Vitae 102518 - University of Mississippi...SPSS Answer Tree – Classification algorithms [Data Mining] WEKA – Association rule analyses [Data Mining] Comprehensive Meta](https://img.pdfslide.us/doc/110x75/5e7df04c4f8fa64e901e878e/minsoo-kang-vitae-102518-university-of-mississippi-spss-answer-tree-a-classification.jpg)