Embed Size (px)
Citation preview
http://abs.sagepub.com/American Behavioral Scientist
http://abs.sagepub.com/content/57/10/1500The online version of this article can be found at:
DOI: 10.1177/0002764213479363
2013 2013 57: 1500 originally published online 28 FebruaryAmerican Behavioral Scientist
Katrien Verbert, Erik Duval, Joris Klerkx, Sten Govaerts and José Luis SantosLearning Analytics Dashboard Applications
Published by:
http://www.sagepublications.com
can be found at:American Behavioral ScientistAdditional services and information for
http://abs.sagepub.com/cgi/alertsEmail Alerts:
http://abs.sagepub.com/subscriptionsSubscriptions:
http://www.sagepub.com/journalsReprints.navReprints:
http://www.sagepub.com/journalsPermissions.navPermissions:
http://abs.sagepub.com/content/57/10/1500.refs.htmlCitations:
What is This?
- Feb 28, 2013OnlineFirst Version of Record
- Sep 10, 2013Version of Record >>
at UNIV MASSACHUSETTS AMHERST on May 10, 2014abs.sagepub.comDownloaded from at UNIV MASSACHUSETTS AMHERST on May 10, 2014abs.sagepub.comDownloaded from
American Behavioral Scientist57(10) 1500 –1509
© 2013 SAGE PublicationsReprints and permissions:
sagepub.com/journalsPermissions.nav DOI: 10.1177/0002764213479363
abs.sagepub.com
Article
Learning Analytics Dashboard Applications
Katrien Verbert1,2, Erik Duval1, Joris Klerkx1, Sten Govaerts1,3, and José Luis Santos1
AbstractThis article introduces learning analytics dashboards that visualize learning traces for learners and teachers. We present a conceptual framework that helps to analyze learning analytics applications for these kinds of users. We then present our own work in this area and compare with 15 related dashboard applications for learning. Most evaluations evaluate only part of our conceptual framework and do not assess whether dashboards contribute to behavior change or new understanding, probably also because such assessment requires longitudinal studies.
Keywordslearning analytics, information visualization, learning dashboards
Increasing motivation, autonomy, effectiveness, and efficiency of learners and teachers is an important driver for learning analytics research (Buckingham Shum, Gašević, & Ferguson, 2012). In our work, we focus on the microlevel of individual learners and teach-ers as well as on learning communities that form around courses, mostly in an open learn-ing context (Govaerts et al., 2011). We do not consider the mesolevel of the organization (school, university, training department) or the macrolevel of society at large.
More specifically, we deploy information visualization techniques in dashboard applications for learners, on both mobile devices and desktop as well as tabletop devices. Adopting a “modest computing” approach that tries to empower people, rather than automating decisions on their behalf (Dillenbourg et al., 2011), we focus on approaches that rely on visualization of these traces to assist users.
1Department of Computer Science, KU Leuven, Leuven, Belgium2Department of Computer Science, Eindhoven University of Technology, Eindhoven, the Netherlands3Department of Computer Science, EPFL, Lausanne, Switzerland
Corresponding author:Erik Duval, Departement Computerwetenschappen, KU Leuven, Celestijnenlaan 200A, B-3001 Leuven, Belgium. Email: [email protected]
479363 ABS571010.1177/0002764213479363American Behavioral ScientistVerbert et al.research-article2013
at UNIV MASSACHUSETTS AMHERST on May 10, 2014abs.sagepub.comDownloaded from
Verbert et al. 1501
Background
Learning dashboards can be considered as a specific class of “personal informatics” applications (Li, Dey, & Forlizzi, 2010). These typically support users in collecting personal information about various aspects of their life, behavior, habits, thoughts, and interests (Li, Dey, Forlizzi, Höök, & Medynskiy, 2011). Personal informatics applica-tions help users to improve self-knowledge by providing tools for the review and anal-ysis of their personal history. Self-knowledge has many benefits, such as fostering insight, increasing self-control (O’Donoghue & Rabin, 2003), and promoting positive behavior (Seligman & Darley, 1977).
At the same time, there is a growing related movement, termed “quantified self,” across several domains, including medicine (Purpura, Schwanda, Williams, Stubler, & Sengers, 2011), sports, and learning (Duval, 2011). The focus of quantified self is on collecting traces that users leave behind and using those traces to improve their experi-ences (Duval & Verbert, 2012). Traces are left through online activities, such as blog posts and Twitter messages; by web navigation captured in log files; through registra-tions from sensors (GPS, accelerometer, etc.); or by self-reporting (for instance on individual’s emotional state).
Process Model
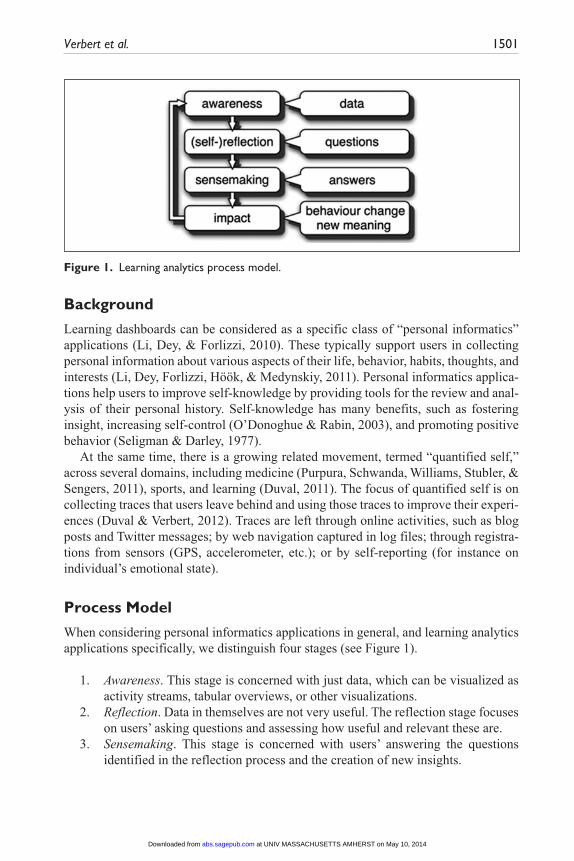
When considering personal informatics applications in general, and learning analytics applications specifically, we distinguish four stages (see Figure 1).
1. Awareness. This stage is concerned with just data, which can be visualized as activity streams, tabular overviews, or other visualizations.
2. Reflection. Data in themselves are not very useful. The reflection stage focuses on users’ asking questions and assessing how useful and relevant these are.
3. Sensemaking. This stage is concerned with users’ answering the questions identified in the reflection process and the creation of new insights.
Figure 1. Learning analytics process model.
at UNIV MASSACHUSETTS AMHERST on May 10, 2014abs.sagepub.comDownloaded from
1502 American Behavioral Scientist 57(10)
4. Impact. In the end, the goal is to induce new meaning or change behavior if the user deems it useful to do so.
When data can be related to goals and progress toward these can be tracked, mean-ingful feedback loops can be created that can sustain desired behavior. This idea is also at the core of the quantified self approach (Li et al., 2011). Our process model draws on ideas from alternative models, such as Li et al.’s (2010) stage-based model of per-sonal informatics systems and the “information foraging” theory (Piroli, 2007). However, as illustrated in Figure 1, the process model adds greater detail between the reflection and action steps of Li et al.’s (2010) stage-based model and generalizes the action stage to impact. The impact stage may or may not involve action or change behavior, depending on the answers and insights created in the sensemaking stage. The sensemaking step can be seen as part of the information foraging theory (Piroli, 2007), which applies an ecological approach to human information processing.
Learning Dashboards
In recent years, several dashboard applications have been developed to support learn-ing or teaching. Such dashboards (Few, 2006) provide graphical representations of the current and historical state of a learner or a course to enable flexible decision making. Most of these dashboards are deployed to support teachers to gain a better overview of course activity (Stage 1, awareness), to reflect on their teaching practice (Stage 2), and to find students at risk or isolated students (Stage 3). Few, if any, address Stage 4 of actual impact.
These dashboards are used in traditional face-to-face teaching, online learning, or blended learning settings. Examples include Classroom View (France, Heraud, Marty, Carron, & Heili, 2006), which shows current activity in a classroom, and the dash-board implemented in the learning management system Moodle (Podgorelec & Kuhar, 2011), which tracks online activities to support teachers. A few dashboards were developed specifically to support learners. CALMSystem (Kerly, Ellis, & Bull, 2007) is an example of a dashboard that was developed on top of an intelligent tutoring sys-tem to give a learner insight into the learner model as a basis to support awareness, reflection, and sensemaking. Performance indicators on different topics are visualized and can be adjusted by the learner as well. Tell Me More (Lafford, 2004) is a com-mercial language-learning application that tracks results of exercises as a basis to visu-alize progress of learners. GLASS (Leony, Pardo, de la Fuente Valentín, Sánchez de Castro, & Delgado Kloos, 2012), Student Activity Meter (SAM; Govaerts, Verbert, Duval & Pardo, 2012), StepUp! (Santos, Govaerts, Verbert, & Duval, 2012), and Student Inspector (Zinn & Scheuer, 2007) were developed to support both teachers and learners.
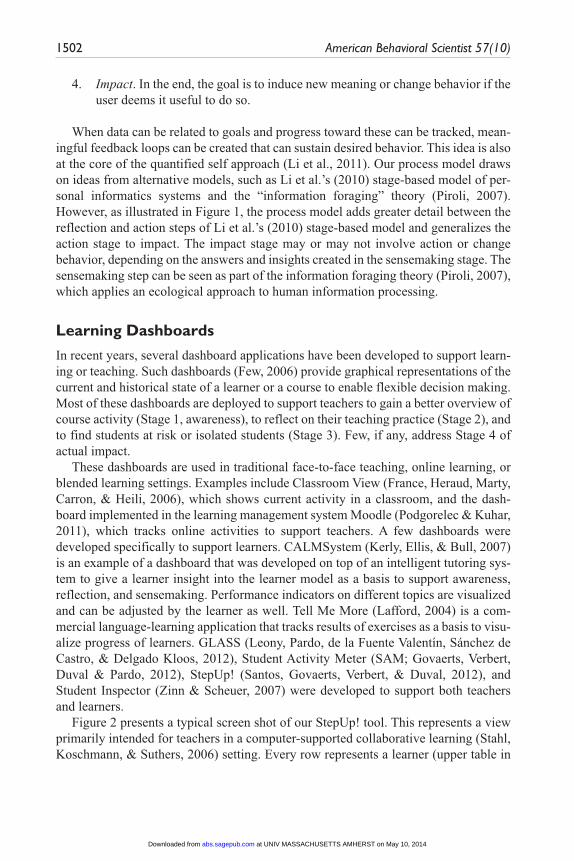
Figure 2 presents a typical screen shot of our StepUp! tool. This represents a view primarily intended for teachers in a computer-supported collaborative learning (Stahl, Koschmann, & Suthers, 2006) setting. Every row represents a learner (upper table in
at UNIV MASSACHUSETTS AMHERST on May 10, 2014abs.sagepub.comDownloaded from
Verbert et al. 1503
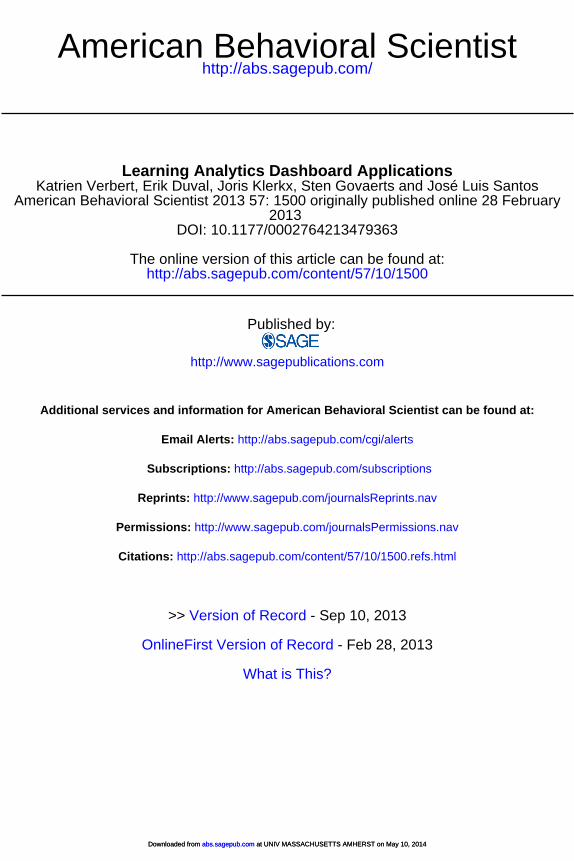
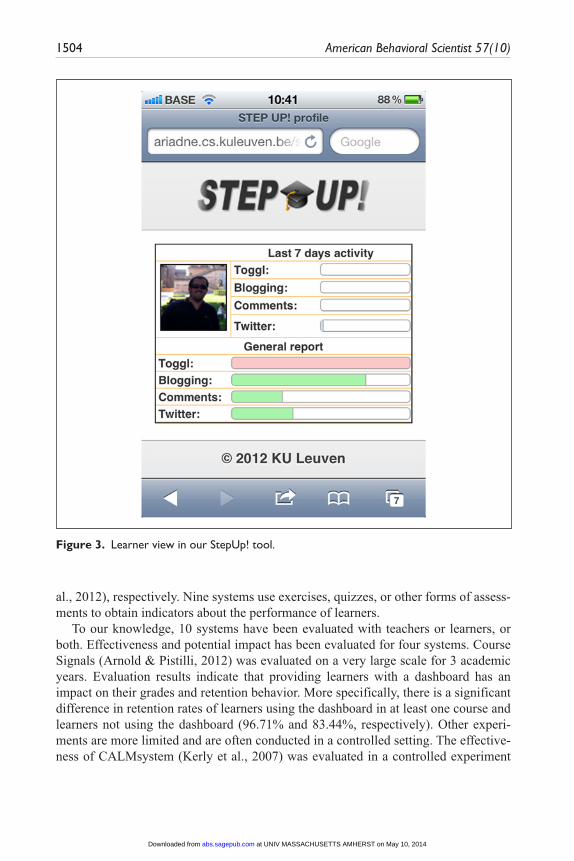
Figure 2) or an external person (lower table in Figure 2) involved in an open learning setting (Govaerts et al., 2011) who has interacted with the learners. Figure 3 illustrates the mobile learner-oriented view of the same tool. The top section of Figure 3 repre-sents learner efforts in the current week, and the lower part represents overall effort to date. Toggl is a tool for time tracking (https://www.toggl.com/); blogging is used by the learners to report on their activities, and comments on the blogs of other learners as well as Twitter messages are used to facilitate collaboration among students.
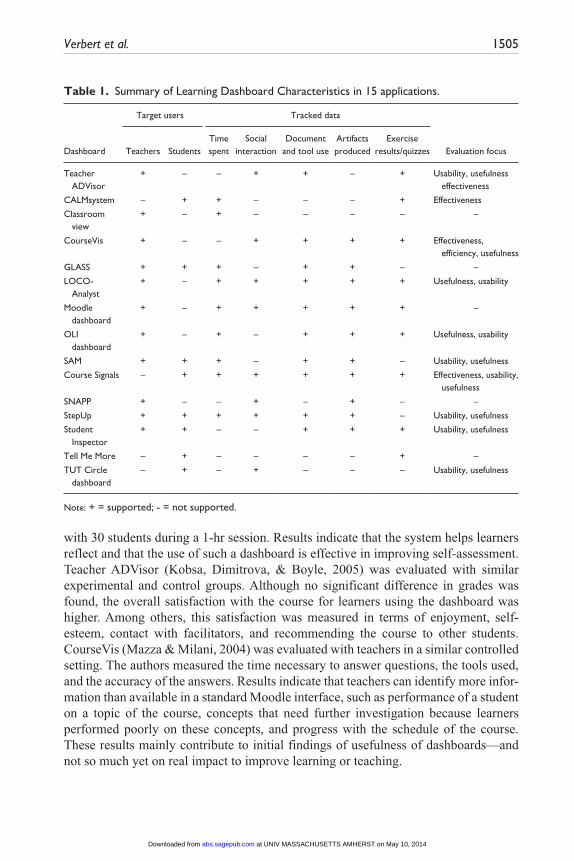
An overview of these and related learning dashboards is presented in Table 1, which summarizes characteristics of 15 such applications, for whom they are intended, what data they track, and whether and how they have been evaluated in practice.
As indicated above, most of these dashboards support teachers or both teachers and learners. Four of the 15 dashboards were designed specifically for learners. These dashboards rely on a variety of data that are tracked from the learning environment or by manual tracking tools. Nine of 15 systems keep track of time spent. Social interac-tion is tracked by eight systems, mainly to gain insight in collaboration (Ali, Hatala, Gašević, & Jovanović, 2012; Dawson, Bakharia, & Heathcote, 2010) and to detect isolated students (Dawson et al., 2010). Document and tool use is tracked by 10 sys-tems and is used to obtain effort indicators of students (Govaerts et al., 2012; Mazza & Milani, 2004) and to find popular documents (Ali et al., 2012; Govaerts et al., 2012). Produced artifacts are also captured by 10 systems. Such artifacts include, for example, blog or forum posts in StepUp! (Santos et al., 2012) and GLASS (Leony et
Figure 2. Teacher view in our StepUp! tool.
at UNIV MASSACHUSETTS AMHERST on May 10, 2014abs.sagepub.comDownloaded from
1504 American Behavioral Scientist 57(10)
al., 2012), respectively. Nine systems use exercises, quizzes, or other forms of assess-ments to obtain indicators about the performance of learners.
To our knowledge, 10 systems have been evaluated with teachers or learners, or both. Effectiveness and potential impact has been evaluated for four systems. Course Signals (Arnold & Pistilli, 2012) was evaluated on a very large scale for 3 academic years. Evaluation results indicate that providing learners with a dashboard has an impact on their grades and retention behavior. More specifically, there is a significant difference in retention rates of learners using the dashboard in at least one course and learners not using the dashboard (96.71% and 83.44%, respectively). Other experi-ments are more limited and are often conducted in a controlled setting. The effective-ness of CALMsystem (Kerly et al., 2007) was evaluated in a controlled experiment
Figure 3. Learner view in our StepUp! tool.
at UNIV MASSACHUSETTS AMHERST on May 10, 2014abs.sagepub.comDownloaded from
Verbert et al. 1505
with 30 students during a 1-hr session. Results indicate that the system helps learners reflect and that the use of such a dashboard is effective in improving self-assessment. Teacher ADVisor (Kobsa, Dimitrova, & Boyle, 2005) was evaluated with similar experimental and control groups. Although no significant difference in grades was found, the overall satisfaction with the course for learners using the dashboard was higher. Among others, this satisfaction was measured in terms of enjoyment, self-esteem, contact with facilitators, and recommending the course to other students. CourseVis (Mazza & Milani, 2004) was evaluated with teachers in a similar controlled setting. The authors measured the time necessary to answer questions, the tools used, and the accuracy of the answers. Results indicate that teachers can identify more infor-mation than available in a standard Moodle interface, such as performance of a student on a topic of the course, concepts that need further investigation because learners performed poorly on these concepts, and progress with the schedule of the course. These results mainly contribute to initial findings of usefulness of dashboards—and not so much yet on real impact to improve learning or teaching.
Table 1. Summary of Learning Dashboard Characteristics in 15 applications.
Dashboard
Target users Tracked data
Evaluation focusTeachers StudentsTime spent
Social interaction
Document and tool use
Artifacts produced
Exercise results/quizzes
Teacher ADVisor
+ – – + + – + Usability, usefulness effectiveness
CALMsystem – + + – – – + Effectiveness
Classroom view
+ – + – – – – –
CourseVis + – – + + + + Effectiveness, efficiency, usefulness
GLASS + + + – + + – –
LOCO-Analyst
+ – + + + + + Usefulness, usability
Moodle dashboard
+ – + + + + + –
OLI dashboard
+ – + – + + + Usefulness, usability
SAM + + + – + + – Usability, usefulness
Course Signals – + + + + + + Effectiveness, usability, usefulness
SNAPP + – – + – + – –
StepUp + + + + + + – Usability, usefulness
Student Inspector
+ + – – + + + Usability, usefulness
Tell Me More – + – – – – + –
TUT Circle dashboard
– + – + – – – Usability, usefulness
Note: + = supported; - = not supported.
at UNIV MASSACHUSETTS AMHERST on May 10, 2014abs.sagepub.comDownloaded from
1506 American Behavioral Scientist 57(10)
Similar evaluations were conducted with LOCO-Analyst (Ali et al., 2012), OLI Dashboard (Dollár & Steif, 2012), TUT Circle Dashboard (Silius et al., 2010), Student Inspector (Zinn & Scheuer, 2007), SAM (Govaerts et al., 2012), and StepUp! (Santos et al., 2012) to assess perceived usefulness. These evaluations often focus on asking teachers questions related to finding learners at risk or asking learners how well they think they are performing in a course. In addition, questionnaires were used to gain an indication of perceived usefulness for improving learning and teaching. Perceived use-fulness of Student Inspector (Zinn & Scheuer, 2007) and LOCO-Analyst (Ali et al., 2012) was evaluated with teachers and was high for both dashboards. Results of our evaluations with SAM and StepUp! indicate that perceived usefulness is often higher for teachers than for students (Govaerts et al., 2012). In addition, we measured and compared usefulness with different kinds of tracked data in seven case studies. Results indicate that students perceive higher usefulness if dashboards present a more com-plete description of their learning activities. For instance, in case studies where we visualized social interaction, perceived usefulness was lower than in case studies where we also tracked time spent. Evaluation results of LOCO-Analyst (Ali et al., 2012) also indicate that perceived usefulness was significantly higher in a case study where more data visualizations were used to provide insight in learning activity.
Although these results are interesting and encouraging, so far, only evaluation results of Course Signals (Arnold & Pistilli, 2012) demonstrate actual impact of dash-boards on learning. Similar longitudinal studies with other learning dashboards are required to assess to what extent dashboards can contribute to behavior change or new meaning (Stage 4 of our process model) and improve learning or teaching.
Conclusion
This article gave a brief introduction to the exciting new class of applications that we call learning analytics dashboards. We are very excited about the opportunities for awareness, reflection, sensemaking, and impact that such dashboards provide and, above all, about the potential to improve learning, that is, to get better at getting better. Impact remains especially hard to demonstrate in evaluation studies. Thus, an active area of our future research is to explore how that stage can be better supported.
Acknowledgments
We thank all evaluation participants for their most valuable feedback.
Declaration of Conflicting Interests
The author(s) declared no potential conflicts of interest with respect to the research, authorship, and/or publication of this article.
Funding
The author(s) disclosed receipt of the following financial support for the research, authorship, and/or publication of this article: The research leading to these results has received funding from
at UNIV MASSACHUSETTS AMHERST on May 10, 2014abs.sagepub.comDownloaded from
Verbert et al. 1507
the European Community Seventh Framework Program (FP7/2007-2013) under Grant Nos. 231396 (ROLE) and 231913 (STELLAR). Katrien Verbert is a postdoctoral fellow of the Research Foundation–Flanders (FWO).
References
Ali, L., Hatala, M., Gašević, D., & Jovanović, J. (2012). A qualitative evaluation of evolution of a learning analytics tool. Computers and Education, 58(1), 470-489.
Arnold, K. E., & Pistilli, M. D. (2012). Course signals at Purdue: Using learning analytics to increase student success. In S. Buckingham Shum, D. Gašević, & R. Ferguson (Eds.), Proceedings of the 2nd International Conference on Learning Analytics and Knowledge (LAK ′12) (pp. 267-270). New York: ACM.
Buckingham Shum, S., Gašević, D., & Ferguson, R. (Eds.). (2012). Proceedings of 2nd International Conference on Learning Analytics and Knowledge, LAK12. New York, NY: ACM.
Dawson, S., Bakharia, A., & Heathcote, E. (2010). SNAPP: Realising the affordances of real-time SNA within networked learning environments. In L. Dirckinck-Holmfeld, V. Hodgson, C. Jones, M. de Laat, D. McConnell, & T. Ryberg (Eds.), Proceedings of the 7th International Conference on Networked Learning (pp. 125-133). Lancaster, UK: University of Lancaster.
Dillenbourg, P., Zufferey, G., Alavi, H., Jermann, P., Do-Lenh, S., Bonnard, Q., & Kaplan, F. (2011). Classroom orchestration: The third circle of usability. In CSCL2011 proceedings (Vol. 1, pp. 510-517). Hong Kong: International Society of the Learning Sciences.
Dollár, A., & Steif, P. S. (2012, June). Web-based statics course with learning dashboard for instructors. Paper presented at Computers and Advanced Technology in Education (CATE 2012), Napoli, Italy.
Duval, E. (2011). Attention please! Learning analytics for visualization and recommendation. In Proceedings of the 1st International Conference on Learning Analytics and Knowledge, LAK ’11 (pp. 9–17). New York, NY: ACM. doi:10.1145/2090116.2090118
Duval, E., & Verbert, K. (2012). Learning analytics. ELEED: E-Learning and Education, 8(1). Retrieved from https://eleed.campussource.de/archive/8/3336
Few, S. (2006). Information dashboard design: The effective visual communication of data. Sebastopol, CA: O’Reilly Media.
France, L., Heraud, J.-M., Marty, J.-C., Carron, T., & Heili, J. (2006). Monitoring virtual class-room: Visualization techniques to observe student activities in an e-learning system. In Proceedings of the Sixth International Conference on Advanced Learning Technologies (pp. 716–720). New York, NY: IEEE.
Govaerts, S., Verbert, K., Dahrendorf, D., Ullrich, C., Schmidt, M., Werkle, M., & Law, E. (2011). Towards responsive open learning environments: The ROLE interoperability frame-work. In C. Delgado Kloos, D. Gillet, R. M. Crespo García, F. Wild, & M. Wolpers (Eds.), Proceedings of the 6th European Conference on Technology Enhanced Learning: Towards Ubiquitous Learning, EC-TEL’11 (pp. 125-138). Berlin, Germany: Springer Verlag.
Govaerts, S., Verbert, K., Duval, E., & Pardo, A. (2012). The Student Activity Meter for aware-ness and self-reflection. In Proceedings of the 2012 ACM Annual Conference on Human Factors in Computing Systems extended abstracts (pp. 869–884). New York, NY: ACM.
Kerly, A., Ellis, R., & Bull, S. (2007). CALMsystem: A conversational agent for learner model-ling. In R. Ellis, T. Allen, & M. Petridis (Eds.), Applications and Innovations in Intelligent Systems XV: Proceedings of AI-2007, 27th SGAI International Conference on Innovative
at UNIV MASSACHUSETTS AMHERST on May 10, 2014abs.sagepub.comDownloaded from
1508 American Behavioral Scientist 57(10)
Techniques and Applications of Artificial Intelligence (pp. 89-102). Berlin, Germany: Springer Verlag.
Kobsa, E., Dimitrova, V., & Boyle, R. (2005). Using student and group models to support teach-ers in web-based distance education. In Proceedings of the 10th International Conference on User Modeling (pp. 124-133). Berlin, Germany: Springer Verlag.
Lafford, B. A. (2004). Review of Tell Me More Spanish. Journal on Language Learning and Technology, 8(3), 21-34. Retrieved from http://llt.msu.edu/vol8num3/review1/default.html
Leony, D., Pardo, A., de la Fuente Valentín, L., Sánchez de Castro, D., & Delgado Kloos, C. (2012). GLASS: A learning analytics visualization tool. In S. Buckingham Shum, D. Gašević, & R. Ferguson (Eds.), Proceedings of the 2nd International Conference on Learning Analytics and Knowledge LAK ‘12 (pp. 162-163). New York, NY: ACM.
Li, I., Dey, A., & Forlizzi, J. (2010). A stage-based model of personal informatics systems. In Proceedings of CHI10: 28th International Conference on Human Factors in Computing Systems (pp. 557-566). New York, NY: ACM.
Li, I., Dey, A., Forlizzi, J., Höök, K., & Medynskiy, Y. (2011). Personal informatics and HCI: Design, theory, and social implications. In Proceedings of the 2011 Annual Conference on Human Factors in Computing Systems, CHI EA ’11 (pp. 2417-2420). New York, NY: ACM. doi:10.1145/1979482.1979573
Mazza, R., & Milani, C. (2004, November). GISMO: A graphical interactive student monitor-ing tool for course management systems. Paper presented at TEL’04 Technology Enhanced Learning ’04 International Conference, Milan, Italy.
O’Donoghue, T., & Rabin, M. (2003). Self-awareness and self-control. Time and decision: Economic and psychological perspectives on intertemporal choice. New York, NY: Russell Sage Foundation.
Pirolli, P. L. T. (2007). Information foraging theory: Adaptive interaction with information. New York, NY: Oxford University Press.
Podgorelec, V., & Kuhar, S. (2011). Taking advantage of education data: Advanced data analy-sis and reporting in virtual learning environments. Electronics and Electrical Engineering, 114(8), 111-116.
Purpura, S., Schwanda, V., Williams, K., Stubler, W., & Sengers, P. (2011). Fit4life: The design of a persuasive technology promoting healthy behavior and ideal weight. In Proceedings of the 2011 Annual Conference on Human factors in Computing Systems, CHI ’11 (pp. 423-432). New York, NY: ACM. doi:10.1145/1978942.1979003
Santos, J. L., Govaerts, S., Verbert, K., & Duval, E. (2012). Goal-oriented visualizations of activity tool tracking: A case study with engineering students. In S. Buckingham Shum, D. Gašević, & R. Ferguson (Eds.), Proceedings of the 2nd International Conference on Learning Analytics and Knowledge LAK ′12 (pp. 143-152). New York, NY: ACM.
Seligman, C., & Darley, J. (1977). Feedback as a means of decreasing residential energy con-sumption. Journal of Applied Psychology, 62(4), 363-368.
Silius, K., Miilumaki, T., Huhtamaki, J., Tebest, T., Merilainen, J., & Pohjolainen, S. (2010). Students’ motivations for social media enhanced studying and learning. Knowledge Management and E-Learning: An International Journal, 2(1), 51-67.
Stahl, G., Koschmann, T., & Suthers, D. (2006). Computer-supported collaborative learning: An historical perspective. In R. K. Sawyer (Ed.), Cambridge handbook of the learning sci-ences (pp. 409-426). Cambridge, UK: Cambridge University Press.
Zinn, C., & Scheuer, O. (2007). How did the e-learning session go? The student inspector. In R. Luckin, K. R. Koedinger, & J. Greer (Eds.), Proceeding of the 2007 Conference on Artificial Intelligence in Education: Building Technology Rich Learning Contexts That Work (pp. 487-494). Amsterdam, Netherlands: IOS Press.
at UNIV MASSACHUSETTS AMHERST on May 10, 2014abs.sagepub.comDownloaded from
Verbert et al. 1509
Author Biographies
Katrien Verbert is an assistant professor at the Eindhoven University of Technology. She obtained a doctoral degree in Computer Science in 2008 at the University of Leuven (KU Leuven), Belgium. She was a post-doctoral researcher of the Research Foundation - Flanders (FWO) from 2009 until 2012 at KU Leuven. Her research interests include content models, content reusability, context-aware recommendation, visualisation and personalisation, and applications thereof in healthcare, science information systems and technology enhanced learn-ing. In that respect, she is currently involved with the RAMLET IEEE LTSC standardization project that has developed a standard to enable interoperability of content packaging specifica-tions for learning resource aggregations. She was involved in the EU FP7 project ROLE that is focused on contextual recommendation in responsive open learning environments. She co-organised several workshops and special issues in this area. She also co-established the dataTEL Special Interest Group of EATEL that is focused on data-driven research for learning analytics.
Erik Duval chairs the Human-Computer Interaction research unit in the Computer Science Department of KU Leuven, Belgium. His research focuses on open learning, information visu-alization, and personal informatics. His group typically applies research results to technology-enhanced learning, access to music, “research 2.0,” and personal health. His current research obsession is massive hyperpersonalization (the snowflake effect) and learning analytics. He is a fellow of the AACE, a member of ACM, the IEEE Computer Society, and the informatics sec-tion of the Academia Europeae. He is on the board of editors of IEEE Transactions on Learning Technologies and Journal of Universal Computer Science.
Joris Klerkx is a research expert at the Human Computer Interaction Lab in the Computer Science Department of KU Leuven, Belgium. His research interests include user experience design, data visualization, open data, infographics, multitouch displays, mobile devices, and their applications in the fields of technology-enhanced learning, science 2.0, music, and (per-sonal) health. In that sense, he has contributed to several European research projects, such as MACE, ASPECT, ICOPER, and STELLAR. He is currently involved in the INTERREG IVa project EMuRgency, on increasing awareness about the problem of cardiac arrest; the FP7 proj-ect weSPOT, on inquiry-based learning; and the IWT-SBO project PARIS, on personalized advertisements.
Sten Govaerts is a postdoctoral researcher at the REACT research group of EPFL, Switzerland. His research interests include user experience design, information visualization, and findability applied to both the technology-enhanced learning domain and contextualized music. Currently, he is working on the ROLE project (http://www.role-project.eu) and the Go-Lab project (http://www.go-lab-project.eu/).
José Luis Santos is a PhD student in the Computer Science Department of KU Leuven in the research group Human-Computer Interaction. Before, he worked at Atos Research and Innovation, R+D+I Department, at the multinational company ATOS as a research consultant, and previously, he also contributed to the group GTI at Universitat Pompeu Fabra. Currently, he also teaches learning management systems and technological resources at the Universidad Internacional de la Rioja. His research interests include user experience design, standardization, and accessibility. He has contributed to several European- and Spanish-founded projects, such as UNFOLD, TENCOMPETENCE, AGENT-DYSL, GRAPPLE, ASPECT, ROLE, and weS-POT as European projects and SUMA and FLEXO as Spanish-founded ones.
at UNIV MASSACHUSETTS AMHERST on May 10, 2014abs.sagepub.comDownloaded from
![GOOGLE ANALYTICS CUSTOM DASHBOARD...GOOGLE ANALYTICS CUSTOM DASHBOARD] WHITEPAPER: If you’re using Google Analytics, you might find yourself lost in data. In Eric Ries book “The](https://img.pdfslide.us/doc/110x75/5f14c9113656356dc80074c7/google-analytics-custom-dashboard-google-analytics-custom-dashboard-whitepaper.jpg)