Embed Size (px)
Citation preview

Funded by The National Science Foundation
Photographs courtesy of Global Education Resources and Mills College Lesson Study Group
Learning Across Boundaries: U.S.-Japan Collaboration in Mathematics, Science and Technology Education

TABLE OF CONTENTS INTRODUCTION ……………………………..…………………………...……….......... SECTION 1: FRAMING THE CHALLENGES
Mathematics, Science and Technology Education in Japan: A History and Overview of Recent Issues. Eizo Nagasaki ……………..………. Lifelong Learning: Our Future in a Global Society. Cathy Seeley ……….…………. TIMSS, NCLB and Lesson Study: Challenges and Opportunities. Patsy Wang-Iverson ……………………………………………………….……… Learning from the International Achievement Studies: Where Do We Go From Here? Yoshinori Shimizu ………………………….……
SECTION 2: SCIENCE AND TECHNOLOGY EDUCATION Science Education in Japan: An Overview. Atsushi Yoshida …..…………………… Technical and Technology Education in Japan: An Overview. Kazuyoshi Natori ………………………...…………………………………..…… How Japanese Expert Teachers Evaluate Science Lesson: Development and Testing of Framework. Yasushi Ogura ……………………….. Science Education: Promising Areas of U.S.-Japan Collaboration. Panel Discussion ………….……………………..………………………...……… Technology Education: Promising Areas of U.S-Japan Collaboration. Panel Discussion ……………………………………………………...………… SECTION 3: MATHEMATICS EDUCATION
Mathematics Education in Japan: An Overview. Shizumi Shimizu ……………….. Improving Mathematics Teaching and Learning: The U.S. Context. Karen Fuson …………………………………………………………………….....
4
7
17
30
45
56
73 83 95 102 106 122
2
SECTION 3: MATHEMATICS EDUCATION (CONT.) Reflections on U.S.-Japan Collaborative Research in Mathematics Education. Jerry Becker and Judith Epstein ……………………………………………….. Fostering Algebraic Thinking Through Problem Solving: A Japanese Approach. Toshiakira Fujii …………………….………………. Issues in Teaching and Learning Algebra in the Primary Grades. Tad Watanabe ………………………………………………………………….. Coherent In-depth Curricular Paths: Early Number Sense in a Japanese Classroom. Aki Murata …………………..……………………. Coherent In-depth Curricular Paths: Early Number Sense in a Japanese Classroom. Panel Discussion ..................................................... The Increasing Role of Data Analysis, Mathematical Modeling, and Technology in High School Classrooms. Daniel Teague …………...…… Educating the Professional Mathematics User. Harvey Keynes ……………….... Mathematics Education: Promising Areas of U.S.-Japan Collaboration. Panel Discussion ……………………………………………………………… What We Can Learn About Teaching and Learning Mathematics Through U.S.-Japan Collaboration. Panel Discussion ………………………………….. SECTION 4: LESSON STUDY AS AN EXAMPLE OF CROSS-NATIONAL
LEARNING Lesson Study in Japanese Mathematics Education. Yoshishige Sugiyama ……………………………….………………………... Instructional Improvement Through Lesson Study: Progress & Challenges. Catherine Lewis and Rebecca Perry ………………………………………….. Lesson Study: U.S.-Japan Panel Discussion Panel Discussion ……………………..………………………………………..
130 146 161
178 189 196
210 214 218 233 239 254
3

LEARNING ACROSS BOUNDARIES:
U.S.-JAPAN COLLABORATION IN MATHEMATICS, SCIENCE AND TECHNOLOGY EDUCATION
INTRODUCTION
Catherine Lewis and Akihiko Takahashi
In the “flat world” of the 21st century, advances in science and technology must compete in a global marketplace. Yet even as hi-tech goods and knowledge flow with increasing ease across national borders, knowledge of the educational practices that build mathematical and scientific expertise are too often trapped within national borders. In both Japan and the United States, international studies of mathematics and science education have sparked interest in learning across national boundaries. Videos from the Third International Mathematics and Science Study (TIMSS) opened a window into eighth grade mathematics classrooms around the world, providing U.S. viewers with tantalizing images of Japanese students actively solving problems carefully designed to build high-level mathematical understanding, and sparking interest in the “lesson study” process through which Japanese teachers design and improve their instruction. Despite the enviable showing of Japanese students on most international tests of mathematics and science achievement, international assessments have sparked enormous public debate within Japan about Japanese students’ dislike of mathematics and science. This volume includes proceedings from two conferences that brought together U.S. and Japanese educators in the fields of mathematics, science, and technology (MST) education. The first conference, Exploring Collaborations in Science and Mathematics Education, took place in March 2003 in San Francisco, with funding from the National Science Foundation and Ministry of Education, Culture, Sports, Science and Technology. The second conference, Improving Mathematics Teaching and Learning Through Lesson Study took place in Chicago, in May 2005, with support from DePaul University, McDougal Family Foundation, Global Education Resources, Inc., Japan Society for the Promotion of Science and the National Science Foundation.
4

The conferences provided an opportunity for educators and researchers from the U.S. and Japan to share views about promising new approaches in mathematics, science, and technology education. Precisely because the issues faced by MST educators in the two countries differ so sharply, the possibilities for cross-national learning are enormous. Presentations in this volume move beyond the ”horse race” of achievement comparisons to illuminate key educational features of the two systems and promising directions for cross-national collaborative research. The volume begins with overviews that frame some of the challenges facing MST education in Japan and the U.S. The second section of the volume focuses on science and technology education, and the third section on mathematics education. The final section examines lesson study, the approach to on-the-job learning used by teachers in Japan that has recently spread within the United States. Lesson study is explored both as a means of professional learning for teachers and as an approach to connecting research and practice more closely. Cross-national flow of goods may happen inevitably. But cross-national learning about mathematics and science education takes careful groundwork. This volume is designed to help lay some of that groundwork by providing key background information on each country’s educational system and examining promising directions for cross-national collaboration. ACKNOWLEDGEMENTS This volume was made possible through conference funding from DePaul University, Global Education Resources LLC, Japan Society for the Promotion of Science, and the National Science Foundation. Writers Robyn Perry Coe, Judith Epstein, Robert Hass, and Cathy Kessel took on the difficult task of editing the proceedings, and Shelley Friedkin ably oversaw the entire writing and production process. This material is based upon work supported by the National Science Foundation under Grant No. 0309388. Any opinions, findings, and conclusions or recommendations expressed in this material are those of the authors and do not necessarily reflect the views of the National Science Foundation.
5

SECTION 1
FRAMING THE
CHALLENGES
6
MATHEMATICS, SCIENCE AND TECHNOLOGY EDUCATION IN JAPAN:
A HISTORY AND OVERVIEW OF RECENT ISSUES1
Eizo Nagasaki
National Institute of Educational Policy Research, Japan
ABSTRACT
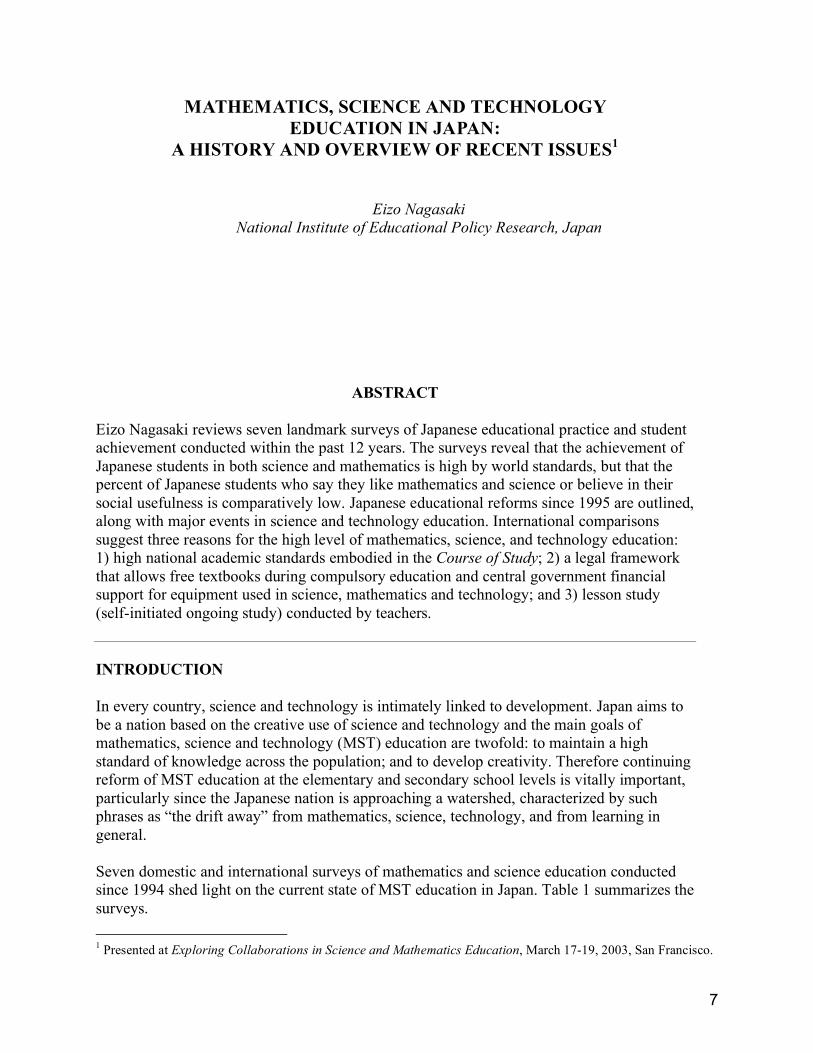
Eizo Nagasaki reviews seven landmark surveys of Japanese educational practice and student achievement conducted within the past 12 years. The surveys reveal that the achievement of Japanese students in both science and mathematics is high by world standards, but that the percent of Japanese students who say they like mathematics and science or believe in their social usefulness is comparatively low. Japanese educational reforms since 1995 are outlined, along with major events in science and technology education. International comparisons suggest three reasons for the high level of mathematics, science, and technology education: 1) high national academic standards embodied in the Course of Study; 2) a legal framework that allows free textbooks during compulsory education and central government financial support for equipment used in science, mathematics and technology; and 3) lesson study (self-initiated ongoing study) conducted by teachers. INTRODUCTION
In every country, science and technology is intimately linked to development. Japan aims to be a nation based on the creative use of science and technology and the main goals of mathematics, science and technology (MST) education are twofold: to maintain a high standard of knowledge across the population; and to develop creativity. Therefore continuing reform of MST education at the elementary and secondary school levels is vitally important, particularly since the Japanese nation is approaching a watershed, characterized by such phrases as “the drift away” from mathematics, science, technology, and from learning in general. Seven domestic and international surveys of mathematics and science education conducted since 1994 shed light on the current state of MST education in Japan. Table 1 summarizes the surveys. 1 Presented at Exploring Collaborations in Science and Mathematics Education, March 17-19, 2003, San Francisco.
7
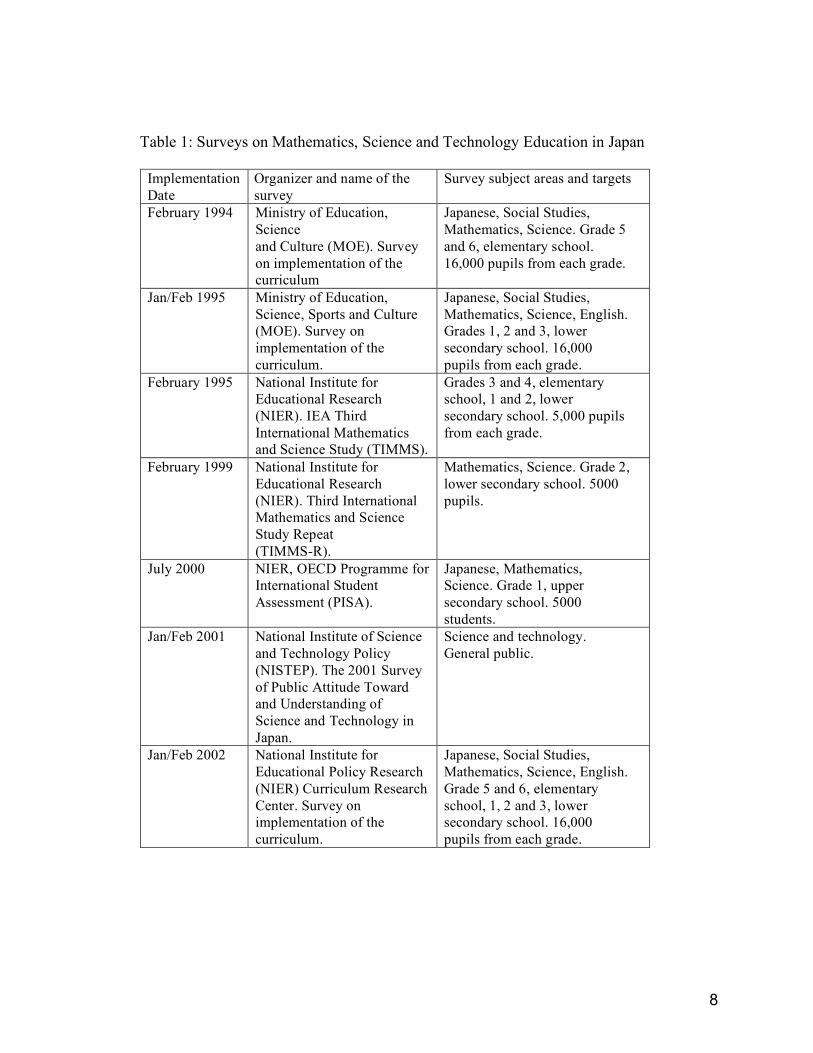
Table 1: Surveys on Mathematics, Science and Technology Education in Japan
Implementation Date
Organizer and name of the survey
Survey subject areas and targets
February 1994 Ministry of Education, Science and Culture (MOE). Survey on implementation of the curriculum
Japanese, Social Studies, Mathematics, Science. Grade 5 and 6, elementary school. 16,000 pupils from each grade.
Jan/Feb 1995 Ministry of Education, Science, Sports and Culture (MOE). Survey on implementation of the curriculum.
Japanese, Social Studies, Mathematics, Science, English. Grades 1, 2 and 3, lower secondary school. 16,000 pupils from each grade.
February 1995 National Institute for Educational Research (NIER). IEA Third International Mathematics and Science Study (TIMMS).
Grades 3 and 4, elementary school, 1 and 2, lower secondary school. 5,000 pupils from each grade.
February 1999 National Institute for Educational Research (NIER). Third International Mathematics and Science Study Repeat (TIMMS-R).
Mathematics, Science. Grade 2, lower secondary school. 5000 pupils.
July 2000 NIER, OECD Programme for International Student Assessment (PISA).
Japanese, Mathematics, Science. Grade 1, upper secondary school. 5000 students.
Jan/Feb 2001 National Institute of Science and Technology Policy (NISTEP). The 2001 Survey of Public Attitude Toward and Understanding of Science and Technology in Japan.
Science and technology. General public.
Jan/Feb 2002 National Institute for Educational Policy Research (NIER) Curriculum Research Center. Survey on implementation of the curriculum.
Japanese, Social Studies, Mathematics, Science, English. Grade 5 and 6, elementary school, 1, 2 and 3, lower secondary school. 16,000 pupils from each grade.
8

INTERNATIONAL SURVEYS International surveys reveal the following. 1. Japanese elementary and lower secondary students show levels of achievement in
mathematics and science that are high compared with other countries. 2. For lower secondary students, there has been no great change in mathematics or science
achievement from 1995 to 2000. 3. At all levels of schooling, the number of Japanese students who report liking mathematics
and science is relatively small. 4. The number of lower secondary students who see mathematics and science as socially
useful is relatively small. 5. A relatively small number of elementary and lower secondary students think studying is
important. 6. Lower secondary students have a low self-evaluation of their own achievement. 7. Between 1995 and 2000, lower secondary students decreased the time spent studying
outside school, reading, helping with family chores, and playing with friends; they increased time spent playing video games.
The surveys indicate that Japanese mathematics and science instruction is characterized by: • heavy use of textbooks by teachers • little classroom use of computers or calculators • large number of experiments carried out by students.
SURVEYS WITHIN JAPAN A review of surveys within Japan that focused on cognitive aspects of mathematics-science achievement showed:
• a slight achievement drop (1995-2002) among pupils of certain grades • no great change in the achievement of 9th graders (last year of compulsory education)
between 1995-2002 • an increase in students’ negative feelings toward science and mathematics with age • a decline in the perceived social usefulness of science and mathematics with age • a decline in classroom use of computers and calculators with age.
Table 2: Subjective Feelings of Pupils Toward Science and Mathematics (in 2002)
Items G5 G6 G7 G8 G9 Social Usefulness of Science 54% 49% 40% 39% 36% Social Usefulness of Mathematics 76% 76% 64% 57% 48% Like visiting museums 74% 69% 60% 54% 52%
9

Table 3: Computer Use in Science and Mathematics (in 2002)
Items G5 G6 G7 G8 G9
Computer Usage Science 26% 30% 9% 11% 12% Computer Usage Mathematics
20% 21% 5% 6% 5%
The 2001 Survey of Public Attitudes toward Science and Technology in Japan showed that in the society at large:
• The level of interest in science and technology is low compared to interest in economics
or other issues, and compared to other countries. • The level of understanding of science and technology has increased over time, but is still
low compared to other countries. • The percentage of citizens who read science and technology magazines, or visit public
science and technology facilities, is very small.
Japanese Educational Policy In Japan, national standards for education are set within frameworks that define content, objectives, and evaluation. These frameworks are shaped by the Central Council for Education (CCE) and the Curriculum Council. On the basis of recommendations from the Curriculum Council, national curriculum criteria are given concrete form in the official Courses of Study; evaluation criteria are given concrete form in the Cumulative Records. In 1995, the Minister of Education, Science, Sports, and Culture requested that the CCE deliberate on “The Pattern of Japanese Education in the 21st Century,” noting that:
Our society is undergoing tremendous changes, including internationalization,
the proliferation of information-related devices, the development of science and technology, the rapid aging of society, a declining birthrate and economic restructuring…against this background...we are faced with demands to rethink the pattern of education in this new age and at the same time…tackle a range of educational problem issues, including intensification of the so-called “examination war,” bullying, persistent non-attendance…how to tackle the implementation of a 5-day school week, the drift of young people away from science and technology, and other similar issues.
In July 1996, the Central Council for Education made an interim report, setting “zest for living” as the basic objective of education.
10
We consider that from now on, what is required of children is that, no matter
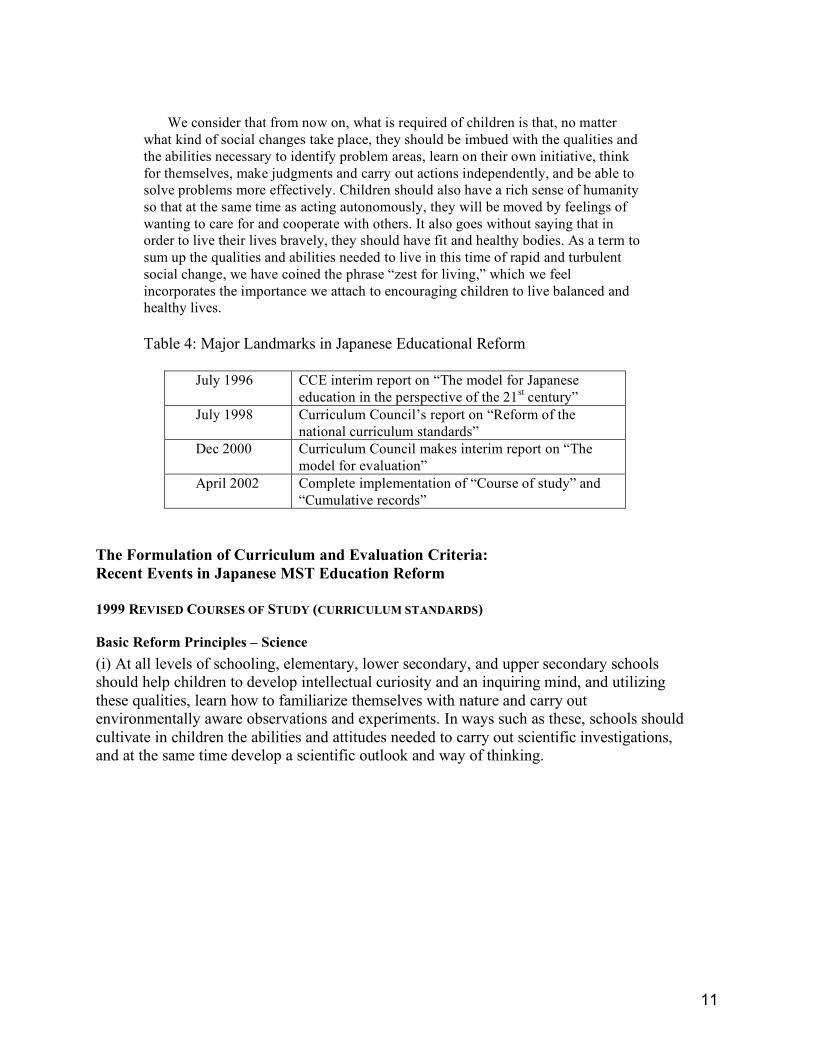
what kind of social changes take place, they should be imbued with the qualities and the abilities necessary to identify problem areas, learn on their own initiative, think for themselves, make judgments and carry out actions independently, and be able to solve problems more effectively. Children should also have a rich sense of humanity so that at the same time as acting autonomously, they will be moved by feelings of wanting to care for and cooperate with others. It also goes without saying that in order to live their lives bravely, they should have fit and healthy bodies. As a term to sum up the qualities and abilities needed to live in this time of rapid and turbulent social change, we have coined the phrase “zest for living,” which we feel incorporates the importance we attach to encouraging children to live balanced and healthy lives.
Table 4: Major Landmarks in Japanese Educational Reform
July 1996
CCE interim report on “The model for Japanese education in the perspective of the 21st century”
July 1998 Curriculum Council’s report on “Reform of the national curriculum standards”
Dec 2000 Curriculum Council makes interim report on “The model for evaluation”
April 2002
Complete implementation of “Course of study” and “Cumulative records”
The Formulation of Curriculum and Evaluation Criteria: Recent Events in Japanese MST Education Reform
1999 REVISED COURSES OF STUDY (CURRICULUM STANDARDS)
Basic Reform Principles – Science (i) At all levels of schooling, elementary, lower secondary, and upper secondary schools should help children to develop intellectual curiosity and an inquiring mind, and utilizing these qualities, learn how to familiarize themselves with nature and carry out environmentally aware observations and experiments. In ways such as these, schools should cultivate in children the abilities and attitudes needed to carry out scientific investigations, and at the same time develop a scientific outlook and way of thinking.
11
(ii) With the above aims in mind, additional emphasis should be put on encouraging learning that is related to daily life and experiences of nature, as well as learning concerned with such topics as the relationship between human beings and the environment. At the same time, emphasis should also be put on enabling children to engage in observations and experiments in a stress-free way, and on developing problem-solving abilities and the ability to look at phenomena from different angles, in a comprehensive way. The contents of learning should be reviewed so as to enable these aims to be realized.
Basic Reform Principles – Mathematics (i) At elementary, lower secondary, and upper secondary school level, children should be helped to acquire the basic knowledge and skills related to quantity and geometrical figures, and on the basis of the acquired knowledge and skills, develop foundations of creativity such as the ability to look at things from many different angles and to think in a logical way. At the same time, more emphasis should be placed on enabling children to learn the pleasure of thinking about and grasping things and phenomena in a numerical way, and thereby becoming able to move forward and make use of their abilities on their own initiative.
(ii) With the above in mind, emphasis should be put on encouraging children to think about the connections with various events and phenomena that occur in real life, and through activities that enable them to identify issues and solve problems using their own initiative, letting them experience the joy of learning and savor a sense of fulfillment. The contents of learning should be reviewed so as to enable these aims to be realized.
2000 REVISED ASSESSMENT METHODS FROM NORM-BASED SYSTEM TO A CRITERION-REFERENCED SYSTEM • The broad objective of encouraging a “zest for living” should focus on developing in
children the ability to study and think for themselves. “It is important that increased emphasis is put on an evaluation system that shows the actual situation achieved in reference to the objectives set out in the Courses of Study (a criterion-referenced evaluation system) and that, taking the evaluation of children’s learning situation from different perspectives as the basis, evaluates in an appropriate manner each child’s learning achievements.” —from Revised Courses of Study
• Children’s achievement of knowledge and skills are evaluated along with qualities and abilities such as eagerness to learn, ability to think, ability to make judgments, power of expression, etc.
12

2002 REVISED EVALUATION CRITERIA (CUMULATIVE RECORD) 2002 Ministry of Education, Culture, Sports, Science, and Technology Launches “Science Literacy Enhancement Initiative”
Table 5: Subjects and Standard Class Hours for Elementary Schools
Class hours for each subject
Grade List
Japa
nese
Soci
al S
tudi
es
Mat
hem
atic
s
Scie
nce
Life
Env
ironm
ent
Mus
ic
Dra
win
g an
d C
raft
Hom
e-m
akin
g
Phys
ical
Edu
catio
n
Mor
al E
duca
tion
Spec
ial A
ctiv
ities
Inte
grat
ed S
tudy
Per
iod
Tota
l cla
ss h
ours
Grade 1 272 … 114 … 102 68 68 … 90 34 34 … 782
Grade 2 280 … 155 … 105 70 70 … 90 35 35 … 840
Grade 3 235 70 150 70 … 60 60 … 90 35 35 105 910
Grade 4 235 85 150 90 … 60 60 … 90 35 35 105 910
Grade 5 180 90 150 95 … 50 50 60 90 35 35 110 945
Grade 6 175 100 150 95 … 50 50 55 90 35 35 110 945
N: There are 35 weeks in a year, and 1 class hour time unit is 45 minutes.
Table 6: Subjects and Standard Class Hours for Lower Secondary Schools: Through the End of Compulsory Education
Class hours for compulsory subjects
Grade List
Japa
nese
Soci
al S
tudi
es
Mat
hem
atic
s
Scie
nce
Mus
ic
Art
Hea
lth a
nd P
.E.
Indu
stria
l Arts
, H
ome-
mak
ing
Fore
ign
Lang
uage
Mor
al E
duca
tion
Spec
ial A
ctiv
ities
H
our r
ange
for e
lect
ives
Inte
grat
ed S
tudy
Per
iod
Tota
l cla
ss h
ours
Grade 1 140 105 105 105 45 45 90 70 105 35 35 0-30 70-100 980
Grade 2 105 105 105 105 35 35 90 70 105 35 35 50-85 70-105 980
Grade 3 105 85 105 80 35 35 90 35 105 35 35 105-160 70-130 980
N: There are 35 weeks in a year, and 1 class hour time unit is 50 minutes.
13

Table 7: Subject Areas, Subjects and Standard Credit Units for Upper Secondary Schools
Standard Subject Areas
Subjects (Standard credit units) Required subjects
Japanese Japanese language expression I (2), Japanese language expression II (2), General Japanese (4), Modern Japanese literature (4), Japanese classics (4), Reading of classics (2)
1 subject from Japanese language expression I (2) and General Japanese (4)
World history
World history A (2), World history B (4), Japanese history A (2), Japanese history B (4), Geography A (2) Geography B (4)
1 subject from World history A (2) and World history B (4); 1 subject from Japanese history A (2), Japanese history B (4), Geography A (2) and Geography B (4)
Civics Modern society (2), Ethics (2), Politics / Economics (2)
Modern society (2) or Ethics (2) and Politics / Economics (2)
Mathematics Basic Mathematics (2), Mathematics I (3), Mathematics II (4) Mathematics III (3), Mathematics A (2), Mathematics B (2), Mathematics C (2)
1 subject from Basic Mathematics (2), Mathematics I (3)
Science Basic Science (2), Comprehensive Science A (2), Comprehensive Science B (2), Physics I (3), Physics II (3), Chemistry I (3), Chemistry II (3), Biology I (3), Biology II (3), Earth Science I (3), Earth Science II (3)
2 subjects from Basic Science (2), Comprehensive Science A (2), Comprehensive Science B (2), Physics I (3), Chemistry I (3), Biology I (3), Earth science I (3) (including 1 subject or more from Basic Science, Comprehensive Science A and Comprehensive Science B)
Health & Physical Education
Physical Education (7-8), Health (2) Physical Education (7-8) and Health (2)
Arts Music I (2), Music II (2), Music III (2), Fine Arts I (2), Fine Arts II (2), Fine Arts III (2), Industrial Arts I (2), Industrial Arts II (2), Industrial Arts III (2), Calligraphy I (2), Calligraphy II (2), Calligraphy III (2)
1 subject from Music I (2), Fine Arts I (2), Industrial Art I (2), Calligraphy I (2)
Foreign Language
Oral Communication I (2), Oral Communication II (4), English I (3), English II (4), Reading (4), Writing (4)
1 subject from Oral Communication I (2) and English I (3)
Home Economics
Basic Home Economics (2), Integrated Home Economics (4), Home Life Techniques (4)
1 subject from Basic Home Economics (2), Integrated Home Economics (4), Home Life Techniques (4)
Information Study
Information A (2), Information B (2), Information C (2)
1 subject from Information A (2), Information B (2), Information C (2)
N: 1 school year consists of 35 weeks, and 1 week consists of 30 credit time units. 1 credit time unit is 50 minutes. Time allotted for Integrated Study Period is from 105-210 credit time units. 1 credit consists of 35 credit time units. A total of 74 or more credits are required for graduation.
14

Table 8: Major Events in Science and Technology Education in Japan
Date Events November 1995 Promulgation of the Science and Technology Basic Law. August 1996 Cabinet Decision on the “Basic Plan for Science and Technology”. January 1998 The Science Council of Japan was asked to deliberate on “A
comprehensive proposal for promoting scientific research aimed at making Japan a nation based on the creativity of science and technology”.
June 1999 Report from The Science council of Japan on “A comprehensive proposal for promoting scientific research aimed at making Japan a nation based on the creativity of science and technology”.
January 2001 The Ministry of Education, Science, Sport and Culture merges with the Science and Technology Agency to become the Ministry of Education, Sports, Culture, Science and Technology.
January 2001 Establishment of the Council for Science and Technology Policy within the Cabinet Office.
April 2002 The Ministry of Education, Sports, Culture, Science and Technology launches a new “Science Literacy Enhancement Initiative”.
Recent Trends in Science, Mathematics, and Technology Education in Japan
The “Science and Technology Basic Law” gave every Japanese citizen the basic right to encounter a wide range of opportunities to deepen their understanding of and interest in science and technology. In 1996 the Cabinet Office formulated its first “Basic Plan for Science and Technology,” which included provisions for:
1. schools
• an increased opportunity for discovery and practical activities such as observations, experiments, practical work sessions and constructions
• use of team teaching • increased research opportunities for teachers • introducing outside experts • installation and improvement of equipment for experiments • development and enrichment of science software • installation of science learning centers • facilities for joint use by education and industry • improvement of selection methods for entrance to higher education.
2. hands-on experience at all levels of society 3. information dissemination to increase social interest in science and technology. In 2002 the Ministry of Education, Culture, Sports, Science, and Technology launched its “Science Literacy Enhancement Initiative.” Its purpose was to counter the “drift away from science and technology” by young people and the society-at-large, and to engender among its people an eagerness to learn, creativity, and intellectual curiosity. Specifically, the initiative includes the following projects:
15

• “Super Science” High School • “Science Partnership Program” (SPP), which promotes partnerships between schools and
research institutes/private companies • Science-e Initiative, which aims to develop advanced digital study materials for science
and technology education • a new “National Center of Data and Information on the History of Industrial Technology” • comprehensive program to promote science and technology education • “Green Plan” to promote environmental education • subsidies for equipment and facilities for science and technology education. CONCLUSION The average level of science, mathematics, and technology education in Japan is high on an international scale due to:
• high national academic standards (courses of study) • a legal framework that provides support for science, mathematics, and technology
education, including half the cost of MST equipment borne by the central government and free textbooks
• Lesson study (“jugyou kenkyu”), i.e., active, self-motivated collaborative improvement by teachers, including publication of lesson plans and lesson records so they are available to a large number of teachers.
However, there remains a need for improvement, and for further international comparative analysis in the following areas: • providing for individual needs or special needs, including highly talented students • relationship between schools and society (e.g., Why doesn’t science interest continue into
adulthood?) • integration of information technology, computers, and digital content into MST education • training system in universities for future teachers of science, math, and technology.
16

LIFELONG LEARNING OUR FUTURE IN A GLOBAL SOCIETY1
Cathy Seeley President, National Council of Teachers of Mathematics
ABSTRACT The spread of technology has contributed to the creation of a global society. As a result, students from the United States will collaborate with and compete with workers from all over the world for a wide range jobs, many of which are easily outsourced. Many of the jobs that today’s students will have don’t even exist yet. Consequently, teachers must prepare students with adaptable problem solving skills, based on a well-balanced education anchored in mathematics and science. Teachers will only be able to prepare their students for lifelong learning by becoming lifelong learners themselves.
INTRODUCTION I would like to thank Akihiko Takahashi for the invitation to speak at this conference and for the generous use of his slides. I have enjoyed our discussions and finding a kindred spirit. I want to talk about lifelong learning and to set the stage for the discussions that you’re going to have, as we think about what it means to be a teacher and what our responsibilities are as educators throughout our career. I’ve been realizing that as educators, whether we’re in a K--12 classroom, a university classroom, a research facility, or some other venue, we sometimes see only part of the picture. We tend to see our classroom, our school, and not far beyond. I’ve been thinking more and more about how important it is for us to connect globally, and this conference is a perfect opportunity to do that. We have many participants from Japan as well as from the United States, and many of you work in a variety of settings. So I thought I’d talk about our future in a global society and what that means in terms of our lifelong professional growth. FLATTENING I’m going to start by referring to a book called The World is Flat (Friedman, 2005) by New York Times columnist Thomas Friedman. When he talks about the world flattening, he’s talking about leveling the playing field. Our vertical modes of communication and our hierarchies, which we’ve structured in societies, countries, and companies -- and even in school districts, I would argue -- are becoming less effective and less necessary. Increasingly, we’re recognizing that our colleagues, our competitors, and the people with whom we interact are more horizontally 1 Presented at Improving Mathematics Teaching and Learning Through Lesson Study, May 20-21, 2005, Chicago. This is a transcript prepared from a video recording of the presentation and approved by the author, not a written paper by the author.
17

accessible to us. They may be down the hall, in a school district nearby, a state on the other side of the country, or a country on the other side of the world. This is a result of many factors, but especially the spread of technology; as we enable people to use the technology, we connect them to information and with each other. Consider the common experience of calling for technical support. Whether we have a computer made in the United States, Japan, China, Taiwan or Malaysia when we call for technical support, we’re likely to be talking to someone in a place far away from the company where the computer was manufactured or sold. Moreover, the point about the world flattening is not just about technology, it’s mostly about people and the fact that this flattening allows us to connect people to each other, to work with colleagues and to have exchanges, such as the opportunity here at this conference. People don’t have to be face-to-face to be working together and to be colleagues. What this flattening world means is that globalization is taking place, with all kinds of connections. I think that word “connections” is really important. It means that we have virtual connections, where there may not have been wires in the past. We have wireless capabilities, where there hadn’t been communication in the past. We’re also seeing that some of the developing nations can skip over some of the steps that the rest of the world has had to go through in accessing modern technologies. During the dot com boom, fiber optic cables were laid around the world to open up access to information. As a result, we see shifting jobs, in terms of where jobs are located as well as the levels and kinds of jobs available. We also have what I would call almost equitable access to information. Many more people have access to information without having to ask anyone above them for permission; this is what I mean by horizontal structures rather than vertical or hierarchical structures. We recognize that this makes a difference internally, as well as globally. As a result, we have colleagues and competitors in more places than ever before. Consequently, students who graduate from our schools, whether they graduate from schools in Japan or the United States, compete for jobs with people around the world. In this environment, we can learn lessons from what is being done in other countries. This weekend in particular, we’re learning a lot of lessons from our Japanese colleagues, which is very welcome. Lately, I’ve been doing a little experiment about globalization and the effect that it has on our lives and our schools. For a day or two before any presentation, I look at all the newspapers that I can find for evidence of the flattening world and what those changes are. Here are a few examples that give you the sense of what I found just in yesterday’s and today’s newspapers. The Wall Street Journal has one article about India taking on the world, another about President Bush signing a trade pact with Egypt, and a third about the trend towards the acquisition of companies by new owners in China. The New York Times has more stories about China, including one on limits imposed by the United States on apparel from China and another on the Chinese rejecting a call for currency changes. My favorite was a headline in the edition of USA Today that was left at my hotel room door, this morning. It said simply, “Koreans shake up stem cell research.” Right now, workers in the United States and Japan are competing with workers in countries with emerging economies, such as India and China, for technical jobs, which can easily be
18
outsourced. The commitment in these countries is towards higher levels of innovation. We see research and development coming from all over the world, which is a very important thing to recognize, because in the United States, in particular, we have been complacent in believing that we’ve got an edge. Our edge had been in research and development –- creativity -- but we are living in an era when the federal government intends to slash its investment in basic scientific research, rather than increase it. We are seeing a discussion at the federal level about whether or not the National Science Foundation should even fund educational research, as we are preparing a generation of students for a future in which more learning will be required of them than of any previous generation. HOW A NATION SURVIVES As a nation, we must make two critical investments. First, we must expand the nation’s investment in basic scientific research, by which, I mean research and development. We must continue to invest in discovering things. Secondly, and maybe more important, we must invest in a well-balanced education anchored in mathematics and science. As a mathematics educator, I’m a strong advocate of a well-balanced and broad education. We have to have strong mathematics and science, but this cannot mean that we kill off the arts and social studies programs and the electives. Students learn important lessons from these other disciplines, and they gain broader perspectives and are more likely to see how knowledge fits together if they receive a balanced education. Nevertheless, students need far more math and science than we ever thought in the past if they are to make sense of the quantitative world in which they live. I believe that the education commitment has got to be strong, and that we may even be looking at a future in which we, as a society, believe in education so much that we’re actually going to require more of it and for longer periods of time. Maybe we need to be asking parents to help our students realize that hard work is something that will be necessary for our future and theirs. In addition to these two critical investments, there is one overriding critical commitment that must be made, and that is to close what we call the achievement gap. I’m going to give you a new term to substitute for achievement gap, and it is, “untapped potential.” We say that we are trying to educate all students, and yet, what we discover is that in classrooms across this nation, particularly in schools of poverty, inner city schools, and rural schools, we have a huge number of students with untapped potential. I would argue that the challenge to close the achievement gap and actualize this untapped potential must be our utmost national priority. We often ask ourselves what seem to be two conflicting questions. Should we bring all of our students up to some minimum level of achievement, or should we accelerate our most able students to prepare them to become scientists and engineers? I would argue that we should do both. Actually, I think they’re two sides of the same coin. If we really do our jobs, and we allow students the opportunity to learn mathematics and science -- I’m talking about every student -- if we teach well in ways that help students “get it” and have the opportunity to learn, then we’re going to discover many more stars. We’ll find students who are among our brightest, most gifted, and most talented, many of whom are undiscovered now.
19

By all means, let us nurture and support our most able students—but first let’s be sure we know who they all are, because right now we’re missing a whole lot of them. This untapped potential is a huge societal problem, and we have to marshal all of our resources around the effort to actualize it. That’s how a nation survives. How Citizens Survive We have to be looking at more education for more people and to higher levels, rather than the idea that a high school dropout might be able to get by with a service job. I read the other day that there are MacDonald’s restaurants where the drive-through window is staffed by somebody in another state. Farming out to call centers, whether it’s to a state next door or to a country far away, actually may save time and money. We recognize that there are fewer and fewer low-level jobs, and more and more jobs that call for diverse kinds of technical training. The kind of training that we need to offer should provide a foundation for our students’ lifelong learning in a changing world; Friedman calls it “versatilizing.” We’ve talked for a long time about whether we should educate people to be specialists or generalists. However, there may be a different level altogether to which we need to educate people, and that’s with a broad knowledge that includes a deep understanding of certain skills that can be transferred to new situations. In other words, we would be training students for jobs that may not exist yet. Most of the jobs that our students will have don’t even exist right now. If we really want to prepare our students for those kinds of jobs, we’d better be giving them some very rich, deep problem-solving skills, based on a good, solid education, anchored in mathematics and science. This has tremendous implications for mathematics teaching, because, if we accept the idea that students need transferable problem solving skills, then how can we justify teaching students to simply practice procedures? We can’t afford to have students enter the workforce prepared to ask only whether the answer they found is correct. Business and industry build teams of people to solve problems that nobody ever thought of and that nobody knows the answer to ahead of time. So we have to be looking at a different kind of teaching and a different kind of learning if we’re going to prepare students to survive in this sort of a world. Moreover, we need to be teaching problem solving, critical thinking, decision making, and the use of imagination on top of that solid foundation. These are the skills that really help advance thinking and are likely be transferable to new situations. THINKING ABOUT THINKING; THINKING ABOUT TEACHING Several years ago, Gail Burrill and I were discussing teaching experiences. She said that she had asked her students to reflect on their own thinking, to think about what they had done in order to solve a particular problem, and one of her students said to her, “Gee, Ms. Burrill, I never thought about thinking before.” I thought that this student’s observation was really interesting, and so I’d like to suggest that we think about this entire episode of lesson study as thinking about teaching, maybe in ways that
20
we’ve never thought of before. This is an opportunity for us to think about teaching with an eye towards what it’s doing for student learning. VALUE ADDED Our focus in education right now, and mathematics education in particular, should be to ask “What is the value added?” What value are we adding to our students’ education, beyond what we may have expected in the past, in order to equip them to be global citizens and to have good jobs in the future? We want students to be able to understand mathematics, make sense of it, know how to do it, and be able to use it. We’ve heard dialogues in this country about whether we should teach students to do procedures or to understand mathematics. I don’t think there’s much to discuss. We want students to know skills and procedures, and we want students to understand the mathematics that underlies them. Furthermore, we want students to be able to use mathematics. What that means is that students also need to know how to think, how to make decisions, and how to solve problems that really lead to solutions. Finally, I think that students have got to be able to create, innovate, question, connect, relate, reason, and imagine. This is how we educate people who will be prepared to make contributions in their daily lives or to society as a whole. If our students are lucky enough to someday find themselves in a nice, supportive work environment, where they can really work effectively with a team, then they may have the opportunity to come up with the best solution to the next problem. Solving the problems of tomorrow starts with an education today that fosters creativity, teamwork, and being able to visualize solutions. Fortunately, in mathematics, we have a guide for what this kind of mathematics program looks like: Principles and Standards for School Mathematics (National Council of Teachers of Mathematics, 2000). COMPELLING COMPARISONS One way to gain insight into the reasons for the relatively unsatisfactory mathematics performance of the United States internationally is to take a look at teaching practices in other countries. I’d like to share just a couple of results from the research that was conducted as part of The Third International Mathematics and Science Study (TIMSS, 1995)2 video study of 8th grade mathematics classes. We have some slides, courtesy of Akihiko Takahashi, which illustrate a comparison of some of the data from Germany, Japan, and the United States; the data come from The Teaching Gap (Stigler & Hiebert, 1999). Figure 1 shows a comparison of the levels of the quality of mathematics content in lessons in these countries. The mathematics content was categorized as low, medium, or high, and the percentage of each was noted. In Germany, there was more medium level content than either high or low level content. However, the differences were not that great: 34% of the content was considered to be at the low level, 38% was considered to be at the medium level, and 28% was 2 In order to refer to continuing studies, TIMSS has recently been renamed Trends in Mathematics and Science Studies.
21

considered to be at the high level. In Japan, by comparison, 38% of the content was considered to be at the high level, and slightly over half of the content was considered to be at the medium level. Significantly less content -- only 11% -- was considered to be at the low level. By contrast, in the United States, 11% of the content was determined to be at the medium level, and there was virtually no high level content, while 89% of the content was determined to be low level content.
Figure 1. Focused on Important Mathematics
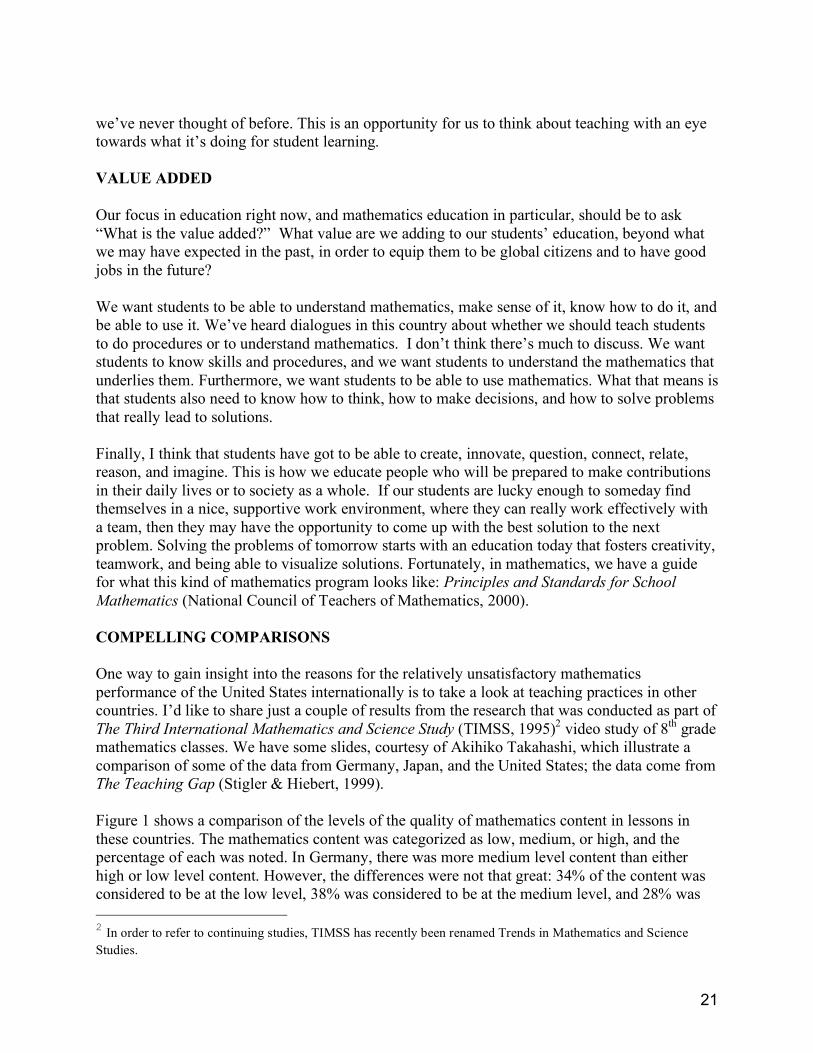
Figure 2 is concerned with notion of teaching itself, and how material is presented. It illustrates the proportion of concepts that are developed versus stated. “Stated” means that the teacher just tells it to students, and “developed” means that there’s some kind of development occurring, either with the students being involved or with the teacher doing the development. In German classrooms, less than 23% of the content was stated, and approximately 77% was developed. Japanese classes had even higher developed content -- 83%. In the United States, it was exactly the opposite. Researchers found that more than 78% of the content presented was considered to be stated, as if to say to the students, “Here’s the rule for the day, now go practice it.” Afterwards, we say, “Here’s a couple of word problems; now guess what procedure you’re supposed to use to solve them?”
3438
28
11
51
39
89
11
0
0
20
40
60
80
100
Germany Japan United States
Low Medium High
Low, medium, high quality of mathematicalLow, medium, high quality of mathematical
content in lessons (%)content in lessons (%)
22
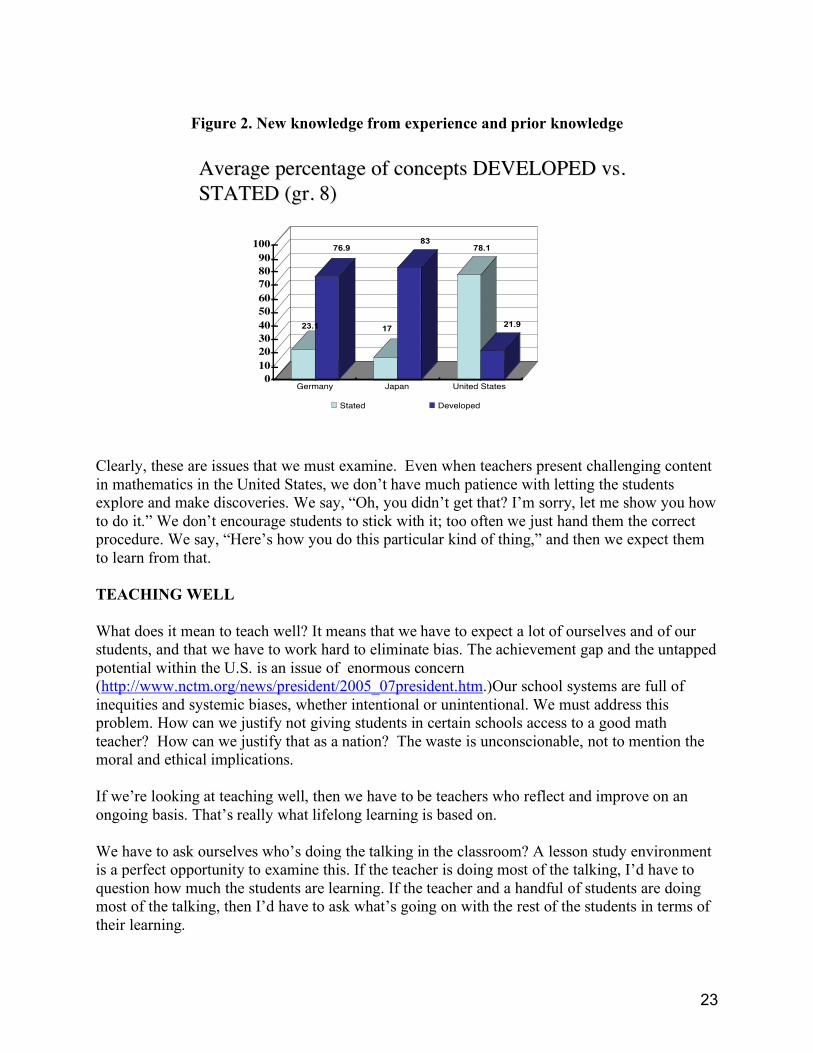
Figure 2. New knowledge from experience and prior knowledge
Clearly, these are issues that we must examine. Even when teachers present challenging content in mathematics in the United States, we don’t have much patience with letting the students explore and make discoveries. We say, “Oh, you didn’t get that? I’m sorry, let me show you how to do it.” We don’t encourage students to stick with it; too often we just hand them the correct procedure. We say, “Here’s how you do this particular kind of thing,” and then we expect them to learn from that. TEACHING WELL What does it mean to teach well? It means that we have to expect a lot of ourselves and of our students, and that we have to work hard to eliminate bias. The achievement gap and the untapped potential within the U.S. is an issue of enormous concern (http://www.nctm.org/news/president/2005_07president.htm.)Our school systems are full of inequities and systemic biases, whether intentional or unintentional. We must address this problem. How can we justify not giving students in certain schools access to a good math teacher? How can we justify that as a nation? The waste is unconscionable, not to mention the moral and ethical implications. If we’re looking at teaching well, then we have to be teachers who reflect and improve on an ongoing basis. That’s really what lifelong learning is based on. We have to ask ourselves who’s doing the talking in the classroom? A lesson study environment is a perfect opportunity to examine this. If the teacher is doing most of the talking, I’d have to question how much the students are learning. If the teacher and a handful of students are doing most of the talking, then I’d have to ask what’s going on with the rest of the students in terms of their learning.
23.1
76.9
17
8378.1
21.9
0
10
20
30
40
50
60
70
80
90
100
Germany Japan United States
Stated Developed
Average percentage of concepts DEVELOPED vs.Average percentage of concepts DEVELOPED vs.
STATED (gr. 8)STATED (gr. 8)
23

Perhaps the most powerful question for each of us to ask ourselves is, “What’s going on in my classroom?” We don’t want students to just talk, but structured, purposeful, mathematical conversation can be a very powerful learning tool. In the United States, we have a fairly common model: the teacher demonstrates a procedure and shows what the students are supposed to learn. We give similar problems to the students and say, “Now you go try it for a while.” If we’re good teachers, we monitor and adjust our lesson as the students work. Finally, we follow up with homework. Basically, we demonstrate how we solve a problem or do a certain procedure. Conversely, in a Japanese lesson, more often than not, a problem is likely to be presented without the teacher first demonstrating how to do it. The students may work individually or in small groups to solve the problem and then as a group, the teacher guides them in comparing and discussing the various methods they used. Finally, the teacher summarizes the lesson and assigns homework. That’s a different dynamic from ours. It engages students in a very different way from having them passively watch the teacher do something that may not even make sense for some of them (see Figure 3).
Figure 3. Typical flow of a mathematics class
At first, it may seem that the teacher is doing less when a problem is given without initially doing so much presentation of procedure, but everybody in this room knows that’s simply not the case. In fact, it takes much more work and a more skillful approach for a teacher to do less talking and less explaining than what is typically done in classrooms in the United States. We have to be able to let students do more of the work in order for students to do more of the learning. The good news is that more and more I’m seeing this kind of model appearing in the United States, especially with teachers using some of the more innovative curricula and especially when they have had appropriate professional development and support for teaching that curriculum.
!! Demonstrates aDemonstrates a
procedureprocedure
!! Assigned similarAssigned similar
problems to studentsproblems to students
as exercisesas exercises
!! HomeworkHomework
assignmentassignment
!! Presents a problemPresents a problem
without firstwithout first
demonstrating how todemonstrating how to
solve itsolve it
!! Individual or groupIndividual or group
problem solvingproblem solving
!! Compare and discussCompare and discuss
multiple solutionmultiple solution
methodsmethods
!! Summary, exercisesSummary, exercises
and homeworkand homework
assignmentassignment
U.S. Japan
24

TEACHING FOR STUDENT LEARNING Teaching for student learning begins with choosing engaging tasks. Then, we have to talk less and listen more. This is a fundamental shift in the teaching approach. Every teacher I know who does this really begins to see the power of it and realizes that much more learning and teaching goes on if the students engage in more mathematical conversation. Finally, one of the things that good or effective teachers do is to ask good questions. They ask questions that probe, that push students’ thinking a little bit further for understanding. I believe that student engagement, having students do mathematics, is, in fact, the key to equity and the key to learning. It’s about making sure that in my classroom, every student -- if possible -- is taking part in the mathematical activity. The questioning becomes a tremendously important part of the activity; the teacher’s questioning facilitates mathematical understanding and then strengthens it. My favorite question in all of mathematics teaching is “How do you know?” Variations include ”What makes you think so? Can you convince me? Have you convinced your colleagues in your group?” These are powerful questions, because they cause students to stop and think. If students are unfamiliar with this process, they may explain their thinking in very superficial ways that don’t seem to have anything to do with the mathematics involved. The challenge is to push them a little bit further and to ask them to reflect on their thoughts. So we might ask, “Can you say more about that? What did that tell you? What made you come to that? What did you notice that made you think of this?” Once we get students to explain their thinking, we can help to bring them to the next level of understanding with another kind of questioning. We can change some of the conditions of the problem and ask, “Now, what would happen if …(a certain condition were different)? How might your approach change?” This really helps students to solidify their understanding. To me, engaged students are students who are discussing mathematics. They’re justifying, writing, modeling, and reflecting. They’re doing problems. They’re really involved in the mathematics; they’re not just completing exercises. Working through problems, and not just completing exercises, should be our focus. TEACHING EFFECTIVELY AND EFFICIENTLY When I think about teaching for student learning, in some sense, I am talking about making an investment in our students and ourselves. The way we accomplish this is by teaching effectively and teaching efficiently. These are closely related concepts. Teaching effectively is teaching for learning that makes sense, lasts, and works; it is teaching for understanding and usefulness, and it stays with students. It means spending the time to make sure that students understand and retain the mathematics. It’s going to be teaching that actually helps
25

students, because at some point, they’re going to know these procedures well enough to understand how to approach new problems. Furthermore, teaching effectively is about teaching balanced with what I would call, “grounded practice.” It’s not that we don’t want students to practice skills, but I’m talking about practice on things that make sense to them when they have enough experiences to form a solid understanding that will stay with them. If we teach effectively, then we will be able to teach more efficiently. We won’t have to engage in this typical practice found in the Unites States of taking the first six weeks to two or three months of every school year to review everything that was done in the school previous year, which students have already forgotten. It’s a horrible waste of our time. It’s not efficient to teach the same things over and over again, but so superficially that students still don’t understand or retain it. Teaching efficiently means teaching without wasting our students’ or our own time, energy, or resources to do something that they’ve already done before. What’s the most important resource we have? Most teachers say it’s time and that the biggest impediment to doing the kind of teaching that they think their students need is a lack of it. We can buy back a lot of time if we teach efficiently. Teaching efficiently means that we’re teaching for connections, so that what we are teaching today relates to last week’s topic and sets a foundation for next week’s topics. The teacher may ask, “What is the same and what is different about what we’re doing today, as compared to what we learned last week?” That’s powerful; that’s efficient; that’s how students “get it.” Furthermore, teaching efficiently is teaching based on communication and articulation across the grade levels. The way we get real growth from students is by building year after year on what’s been done before and by extending it, not repeating it. The only way that this can happen is for teachers talk to each other, work together, collaborate with each other, and carve out who’s doing what. It’s only when we talk to each other and trust each other that we realize that, even if the students don’t immediately recall something on the first day of school, that doesn’t mean that we have to teach it to them all over again. It means that, instead, we may give them a problem that advances their thinking and helps them to remember what they’ve already learned. INVESTMENTS VERSUS EXPENSES This brings us to the notion of investments versus expenses. Most of us have been through the experience of reading about something new or seeing something innovative in a workshop or program and wishing that we had the time to implement it. Maybe we’ve got to be covering the FCAT, TAKS, TEKS, SAT-9, or whatever acronyms you may have for standardized tests in your state. In this country, every state administers tests, and teachers find themselves focusing on how much they’ve got to cover in order to prepare for them.
26

Here’s a secret that we all know. The best way to prepare students for a test -- I don’t care what initials it’s got -- is to teach a good mathematics program well to every student. It’s not about trying to guess what will be on the test, using the right test preparation materials, or practicing items that look exactly like the ones that are supposed to be on test. Instead, teaching good mathematics is how we invest now, so that students learn not just for the present, but for three months from now, six months from now, next year, and the rest of their lives. That doesn’t mean -- and this is a very important distinction -- that we hold students back until they master everything that is supposed to be a prerequisite. In fact, I think that we make some faulty assumptions about prerequisites. One of them is believing that students have to know all of their arithmetic before they can tackle more challenging topics or solve complex problems. I’d like to see some scientifically-based research that says a student must know arithmetic before doing anything else. I haven’t seen any. I do believe that we should teach skills and procedures, but I think one of the ways in which we motivate students to learn is by giving them other kinds of mathematics along the way. If we work hard and we’re good mathematics teachers, effective with what we do, then we can fill those gaps without holding students back. We have to invest if we’re going to add value to education. Making an investment in students means taking the time to develop mathematical ideas and thinking. It may initially seem that that we are spending more time, but it pays off in the long run, because effective teaching leads to understanding that lasts and heads off the need to continually re-teach. We have to adopt a fundamental philosophy that says that investment is about teaching well and continuing to teach better and better. If we can do that, then our students will understand, learn, and be able to move on. It’s not enough to just invest in students; we must also invest in teachers. That’s why you’re here. Investing in teachers is about helping teachers to know more mathematics and better ways of teaching it. It’s about continuing our professional learning throughout our careers. It’s about reflecting on our practices and improving on what we do. LEADERSHIP We talked about teachers being able to survive in a global society. It means that teachers have to continually be more versatile; this is how we expand in new directions. It’s really all about leadership; the fact that you made the commitment to be here today means that you’re a leader. Leadership begins on the personal level. Personal leadership is about is about seeing beyond one’s own perspective. That’s one of the reasons why conversations with our colleagues from Japan are so valuable. Furthermore, personal leadership is about seeing beyond today, and even beyond tomorrow. It’s thinking about what our students are likely to need many years from now. It’s understanding that we can’t predict what challenges our students may face, but knowing that we can prepare them with very adaptable skills. Essentially, it’s about thinking beyond what we can see.
27

If we want to think about the future, we have to notice what is going on right now; that’s why we pick up the newspaper. Many good mathematics teachers pick up the newspaper to look for mathematical content in the news, but I’m encouraging you to also look for evidence of changes in our world and consider the likely impact on our students’ future lives. Finally, it’s about imagining what can be. Personal leadership means implementing new things in our classrooms, schools, and communities. This works so much more effectively in a collaborative community. It can be done alone, but it’s a lot richer when done through a community. It’s about working together to create or to instigate change, which is important, because our educational system tends to get mired in what we think of as tradition. Some traditions are meaningful, but sometimes saying that we’re following tradition is just a fancy way of saying that we’re stuck. Professional leadership means taking personal leadership to a level that we’ve never imagined before, and that’s challenging for us as educators. We’re not used to doing it. It means exercising leadership within learning communities and taking the initiative to organize conversations among our colleagues. Additionally, it means leadership within the profession; it’s really participating in our communities. NCTM is a beautiful learning community, but it’s a big one. We need learning communities on multiple levels. We need our own little learning communities, in which to work on a day-to-day basis. We need broader learning communities, in which we can expand our thinking, and beyond that, we need professional learning communities. Our profession, mathematics education, needs your voices. It needs to know what you think, what’s going on, and what can you contribute to this discussion. Our greatest challenge is to tap untapped potential and to close the achievement gap. We want to accelerate the learning of the students who are our very brightest, but only after we really can assure ourselves that we’re discovering who they are. This will take a great deal of leadership. There’s been a lot of discussion about the need for scientifically-based research. I think that we have a major opportunity to link research and practice, so that we’re continually improving what students are learning. We have not done a good job of connecting what we know to inform what we do. NCTM is taking this on, and I would argue that every one of us should be taking this on, too. Making good decisions about what’s going on in classrooms can be enhanced by what we know from research, whether it’s learning about approaches that seem to be promising or the effectiveness of particular programs. Leadership is fundamentally concerned with improving teacher knowledge; this is a great challenge, and there are many ways to address it. We have partners. I love the diversity of the people in this room. We have teacher educators, researchers, mathematicians, classroom teachers, administrators, and supervisors. Our collaborative efforts can contribute to improving teacher knowledge.
28

CONCLUSION So, what can you do? I like ending with, “What can you do?” I want you to think globally. This is a challenge for many of us. We are all familiar with the slogan, “Think globally and act locally.” So I would say, think globally and then act in your classroom. Teach for tomorrow. Don’t get stuck in what we have always done, because that doesn’t serve our students. Moreover, continue to reflect and improve, through being part of an extended community. Finally, just commit to professional learning. How can students become lifelong learners if their teachers are not? If our students are going to be citizens of the world and survive in a global economy, then won’t they need to be lifelong learners? Is there any profession in which it’s more important to both be a lifelong learner and to demonstrate it, than teaching? Teaching is the first and foremost place in which we should demonstrate lifelong learning, both for our own survival and as role models for our students. I believe that it’s possible to learn to love a flattening world. Education is the key to our students’ future -- whoever those students are. Mathematics clearly opens doors for students. Our students’ future is in our hands. REFERENCES Friedman, T. L.(2005). The world is flat: A brief history of the twenty-first century. New York:
Farrar, Straus and Giroux. National Council Teachers Mathematics (2000). Principles and standards for school
mathematics. Reston: National Council of Teachers of Mathematics. Seeley, C. Untapped potential. NCTM News Bulletin, July/August 2005. Retrieved 4/22/06 from
http://www.nctm.org/news/president/2005_07president.htm. Stigler, J. W. & Hiebert, J. (1999). The teaching gap. New York: The Free Press.
29

TIMSS, NCLB, AND LESSON STUDY: CHALLENGES AND OPPORTUNITIES1
Patsy Wang-Iverson
Gabriella and Paul Rosenbaum Foundation
ABSTRACT
How can TIMSS and lesson study help schools achieve the goals of the No Child Left Behind (NCLB) legislation? This presentation reviews the relationship between TIMSS and lesson study and discusses how the data from TIMSS and implementation of lesson study have the potential to help schools achieve the goals of NCLB.
INTRODUCTION It was my work with TIMSS that led me to lesson study (jugyoukenkyuu), so I would like to begin with a brief history of TIMSS, as summarized in Figure 1. (U.S. Department of Education (USED), 1992). These international assessments have been conducted under the auspices of the International Association for the Evaluation of Educational Achievement (IEA; http://www.iea.nl/) in partnership with participating countries. Both the U.S. Department of Education and the National Science Foundation have provided significant funding to support the studies and the publication of the data.
1 Presented at Improving Mathematics Teaching and Learning Through Lesson Study, May 20-21, 2005, Chicago.
30

Figure 1. TIMSS chronology
1964 First International Mathematics Study (FIMS 13-year-olds and end of secondary: 10 countries
1970-71
First International Science Study (FISS) 10-year-olds: 16 countries 14-year-olds and end of secondary: 18 countries
1980-82
Second International Mathematics Study (SIMS) 13-year-olds: 18 countries End of secondary: 13 countries
1983-84
Second International Science Study (SISS) 10-year-olds: 15 countries 14-year-olds: 17 countries End of secondary: 13 countries
1994-95
Third International Mathematics and Science Study (TIMSS) 41 countries
1999 TIMSS-Repeat (TIMSS-R) 38 countries
2002 No Child Left Behind (NCLB) legislation signed into law
2003 Trends in International Mathematics and Science Study (TIMSS 2003) 46 countries
2007 Trends in International Mathematics and Science Study (TIMSS 2007) 68 countries (http://isc.bc.edu/TIMSS2007/countries.html)
The First International Mathematics Study (FIMS) was published in 1964; it assessed thirteen-year-olds and students at the end of their secondary education in ten countries. The first science study (FISS), which was performed separately, was published six years later; participating students included ten-year-olds, fourteen-year-olds, and students at the end of their secondary education. In 1980, the Second International Mathematics Study (SIMS) was conducted, with an increase in participating countries, with assessment of 13 year olds (18 countries), and students at the end of their secondary education (13 countries). This time, the science study (SISS) was conducted just a year later. However, it is important to note that the first two studies didn’t examine the same students in the mathematics and science portions. The Third International Mathematics and Science Study (TIMSS 1995), the first combined study of mathematics and science, was conducted in 1994-1995, over 30 years after the first mathematics study. Based upon lessons learned from the earlier studies (Medrich and Griffith, 1992), TIMSS 1995 was more rigorous and comprehensive in scope. In addition to student assessments, it included: student, teacher and school surveys; video and case studies of three countries: Germany, Japan, and the United States (USED, 1999; 2003); and curriculum analyses of the participating countries (S. Cathy Seeley [[link to her presentation at the Chicago Lesson Study Conference]] discussed some of the compelling statistics from these specialized studies in her presentation.
31

To examine longitudinal progress, the IEA decided to conduct the studies at four-year intervals. TIMSS-Repeat (TIMSS-R), conducted in 1999, allowed countries to study the performance of grade 8 students, who were in grade 4 for the 1995 assessment. Thirty-eight countries participated in TIMSS-R. In 2003, 46 countries participated in the study of grade 8 students. Twenty-six of these countries also participated in the study of grade 4rs. For 2007, 68 countries currently are registered to participate in TIMSS (http://isc.bc.edu/TIMSS2007/countries.html). The TIMSS 2007 Frameworks, which will serve as the basis for designing test items, were developed collaboratively among the participating countries and are available at http://isc.bc.edu/TIMSS2007/frameworks.html. TIMSS and lesson study share the fact that the student is the unit of analysis. All the data in TIMSS are based on the student. Lesson study focuses on a better understanding of student thinking through the collaborative development of lesson plans based upon intensive study of curriculum materials, standards, and student learning (Wang-Iverson, 2002). In 2002, No Child Left Behind (NCLB) was signed into law; it is not part of TIMSS, but it is useful to see where it fits into the chronology, since we will be asking ourselves how TIMSS and lesson study may help to accomplish the goals set by NCLB. The stated goals of NCLB are:
Ensure students are learning: Raising overall achievement and closing the achievement gap Make the school system accountable: Including all students; providing statistics on student achievement by subgroup Improve teacher quality: Ensure all students are taught by highly-qualified teachers
One of these goals is to ensure that all students are learning. This goal really synergizes with what Cathy Seeley said2 in her talk about equity, closing the achievement gap, and tapping the untapped potential. A second goal of NCLB is to hold the school system accountable for the performance of its students. A positive impact of NCLB (as well as a negative one) is that it forces states, districts, and schools to disaggregate their data, look at all students, and provide statistics on student performance by sub-group. As an example, districts previously viewed across the board as high performing now have to acknowledge the performance gap between different groups of students. To attain the goal of highly-qualified teachers, I agree with Cathy Seeley’s ideas about ongoing professional learning. We’re not going to achieve this objective by any set time, because the real goal is to be constantly improving. TIMSS 2003 allows us to examine the performance gap for grade 8 students within participating countries. Frequently, we say, “we can’t teach these kids, because of their family background. We 2 Section 1 of this volume - Lifelong Learning: Our Future In A Global Society.
32
can’t teach these kids, because their parents aren’t educated. We can’t teach these kids, because they just don’t behave the way we want them to.” So let’s look at the statistics for parent education and economic status. This is such a rich data set, because they have tried to respond to negative reactions to international assessments in this country. TIMSS 2003 (Mullis et al., 2005) has longitudinal data that allow a country to look at its student performance in different mathematics topics and compare itself to its own average performance in the study. For example, grade 4 and grade 8 student performance in the United States is summarized in Table 1.
Table 1. U.S. student performance in different mathematics topics compared with average performance across the topics
Grade Number/
quantity Algebra/change & relationships
Measurement GeometryShape & Space
Data/ Uncertainties
4 -5 3 -21 -3 28
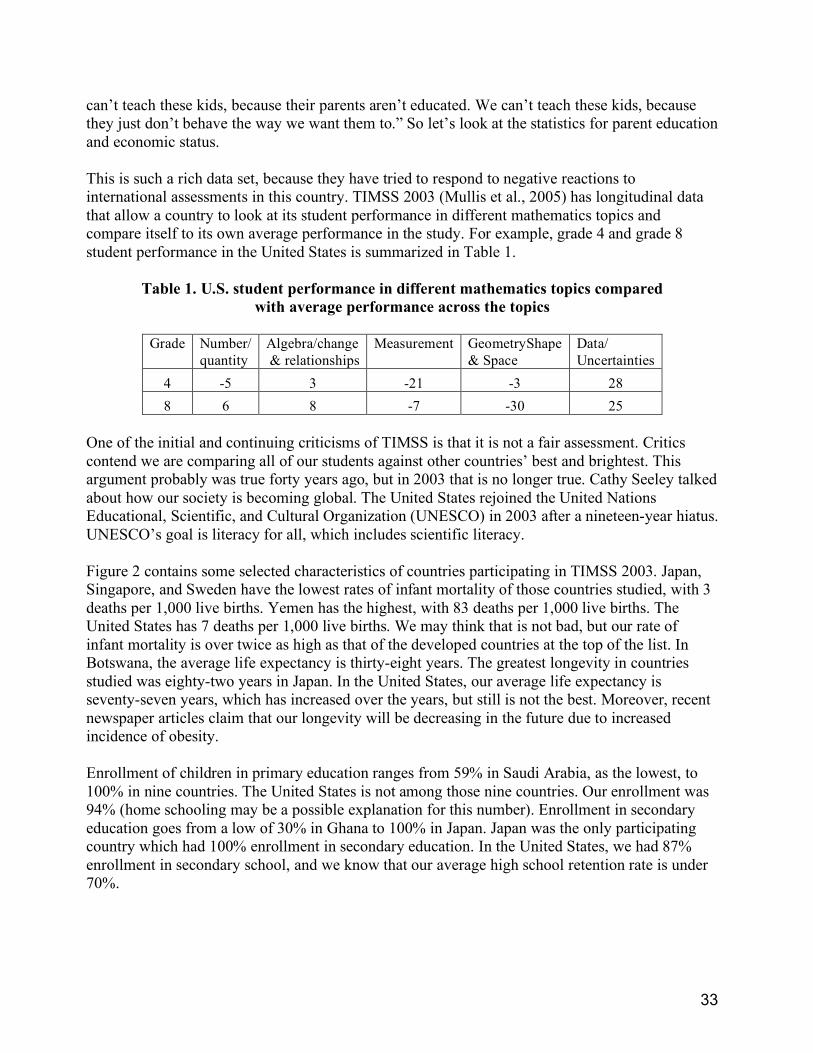
8 6 8 -7 -30 25 One of the initial and continuing criticisms of TIMSS is that it is not a fair assessment. Critics contend we are comparing all of our students against other countries’ best and brightest. This argument probably was true forty years ago, but in 2003 that is no longer true. Cathy Seeley talked about how our society is becoming global. The United States rejoined the United Nations Educational, Scientific, and Cultural Organization (UNESCO) in 2003 after a nineteen-year hiatus. UNESCO’s goal is literacy for all, which includes scientific literacy. Figure 2 contains some selected characteristics of countries participating in TIMSS 2003. Japan, Singapore, and Sweden have the lowest rates of infant mortality of those countries studied, with 3 deaths per 1,000 live births. Yemen has the highest, with 83 deaths per 1,000 live births. The United States has 7 deaths per 1,000 live births. We may think that is not bad, but our rate of infant mortality is over twice as high as that of the developed countries at the top of the list. In Botswana, the average life expectancy is thirty-eight years. The greatest longevity in countries studied was eighty-two years in Japan. In the United States, our average life expectancy is seventy-seven years, which has increased over the years, but still is not the best. Moreover, recent newspaper articles claim that our longevity will be decreasing in the future due to increased incidence of obesity. Enrollment of children in primary education ranges from 59% in Saudi Arabia, as the lowest, to 100% in nine countries. The United States is not among those nine countries. Our enrollment was 94% (home schooling may be a possible explanation for this number). Enrollment in secondary education goes from a low of 30% in Ghana to 100% in Japan. Japan was the only participating country which had 100% enrollment in secondary education. In the United States, we had 87% enrollment in secondary school, and we know that our average high school retention rate is under 70%.
33

Figure 2. Selected characteristics of countries participating in TIMSS 2003
Infant mortality: 7/1000: U.S. 83/1000: Yemen 3/1000: Japan, Singapore, Sweden Life expectancy: 77 yrs: U.S. 38 yrs: Botswana 82 yrs: Japan Enrollment in primary education: 94%: U.S. 59%: Saudi Arabia 100%: Nine countries, including Japan Enrollment in secondary education: 87%: U.S. 30%: Ghana 100%: Japan
Seventeen of the countries participating in TIMSS 2003 had greater secondary enrollment than the United States (Table 2). Seven of these countries (shown highlighted), Japan, Chinese Taipei, Estonia, the Republic of Korea, the Netherlands, Latvia, and Australia, had higher performance on TIMSS 2003 than the United States (average scale score = 504). So, simply having higher secondary education enrollment does not ensure higher performance.
Table 2. Countries with greater secondary education enrollment rates than the United States
Country Percentage
secondary enrollment Student mathematics
performance Japan 100% 570 Slovenia
96% 493 Sweden
96% 499 England
95% 498 Norway 95% 461 Scotland
95% 498 Chinese Taipei
93% 585 Estonia
92% 536 Lithuania
92% 502 New Zealand 92% 494 Republic of Korea
91% 589 The Netherlands
90% 536 Latvia
89% 508 Australia
88% 505 Cyprus
88% 459 Israel
88% 496 Italy
88% 484
The international average of TIMSS 2003 students who had at least one parent with a university degree was 28% (Table 3). The lowest was in Indonesia with 9%, and the highest was in Norway with 66%. However, Norway’s performance was below the international average. In the United States, 56% of those students who participated had at least one parent with a university degree.
34

In Japan, 45% of the participating students had at least one parent with a university degree. The international average of students with parents whose maximum level of education did not exceed primary school is 12% The range is from zero percent in six countries, of which Japan is one, to 50% in Morocco. In the United States, 3% of our students have parents with no more than a primary education. These statistics are shown in Table 3.
Table 3. Selected statistics about parents’ education
A parent with university
degree or higher Parents with no more than
primary education
Norway
66% Morocco 50% United States 56% United States 3% Japan 45% Indonesia 9%
Six countries, including Japan 0%
International average 28% International average 12%
Table 4 summarizes statistics about the overall performance of grade 8 students in selected countries that outperformed the United States. The cut-off for advanced is a score of 625. The cut-off for high is 550. The cut-off for intermediate is 475, and the cut-off for low is 400. Singapore is at the very top with 44% of its students scoring at the advanced level, a repeat of what we saw in TIMSS 1995. It should be noted that Singapore did not participate in international mathematics assessment until the Third International Mathematics and Science Study.
Table 4. Performance of selected countries, which outperformed the United States, at grade 8 in TIMSS 2003.
Country Advanced
(625) High (550)
Intermediate (475)
Low (400)
Singapore 44% 77% 93% 99% Hong Kong 31% 73% 93% 98% Japan 24% 62% 88% 98% Netherlands 10% 44% 80% 97% United States 7% 29% 64% 90%
Range 0%–44% 0%–77% 2%–93% 9%–99% One of the most remarkable things about these countries, which outperformed the United States, was how few of their students were unable to reach at least the lowest level of achievement, just 1% to 3%. In the United States, 10% of the students failed to make the cut-off for a low score of 400. If one examines the intermediate level, one sees Singapore had 93% of its grade 8 students scoring at or above the intermediate level. Japan had 88% of its grade 8 students scoring at or above the intermediate level. Sixty-four per cent of U.S. grade 8 students scored at or above the intermediate level. This means that more than a third of our students scored below the intermediate level. The bottom row of Table 4 provides the range in each category, instead of the average score. In some countries, there were no students who were either advanced or high performers. The United States was right at the international average of 7% scoring at the advanced level.
35
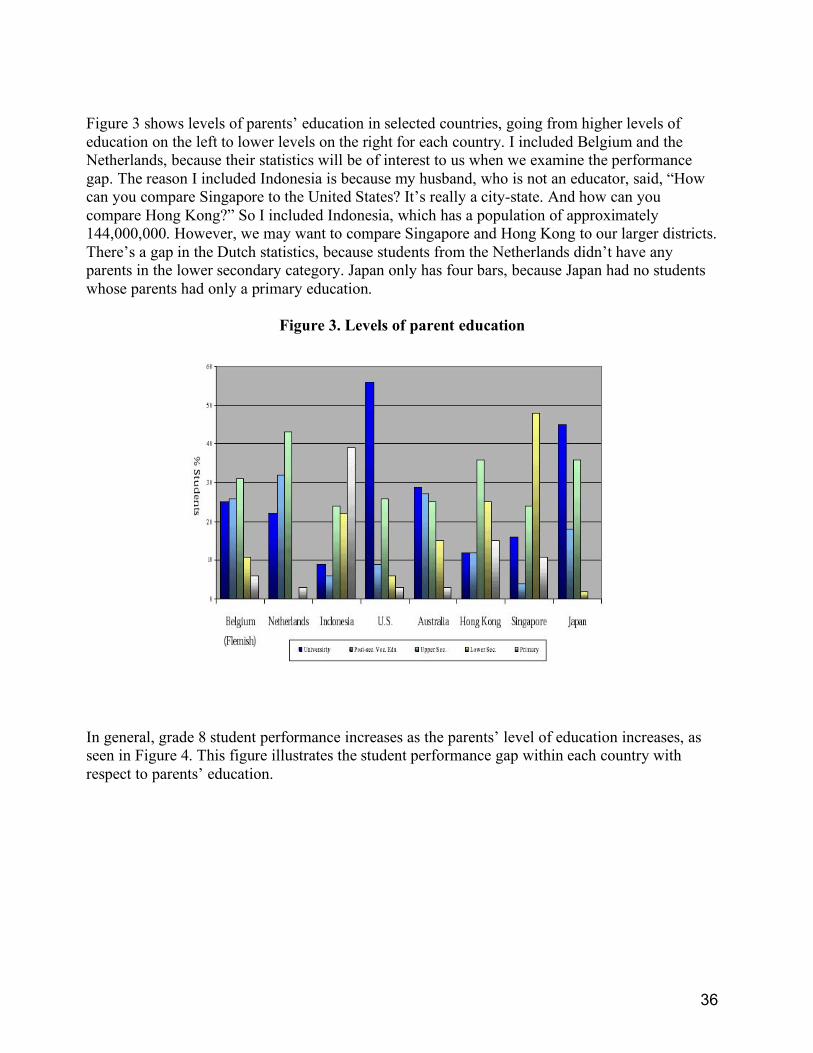
Figure 3 shows levels of parents’ education in selected countries, going from higher levels of education on the left to lower levels on the right for each country. I included Belgium and the Netherlands, because their statistics will be of interest to us when we examine the performance gap. The reason I included Indonesia is because my husband, who is not an educator, said, “How can you compare Singapore to the United States? It’s really a city-state. And how can you compare Hong Kong?” So I included Indonesia, which has a population of approximately 144,000,000. However, we may want to compare Singapore and Hong Kong to our larger districts. There’s a gap in the Dutch statistics, because students from the Netherlands didn’t have any parents in the lower secondary category. Japan only has four bars, because Japan had no students whose parents had only a primary education.
Figure 3. Levels of parent education
In general, grade 8 student performance increases as the parents’ level of education increases, as seen in Figure 4. This figure illustrates the student performance gap within each country with respect to parents’ education.
36

Figure 4. Level of parent education versus student scores in
selected countries
The United States and Australia had fairly similar student performance profiles, although the parent education profiles were not similar. Hong Kong did not have as pronounced a performance gap as the other countries shown. Students from Singapore, who had parents at all educational levels, were still able to perform quite well, although the children of more highly educated parents demonstrated higher performance. Some of the same statistics occur in numerical form in Table 5. The difference shows the performance gap between children of parents with university degrees and children of parents whose only education was primary school.
Table 5. The achievement gap in selected countries
Country University Primary Difference
Australia 543 429 114
Belgium 586 462 104
United States 530 436 90
Singapore 651 571 80
Netherlands 569 502 67
Indonesia 457 406 51
Hong Kong 612 578 34
37
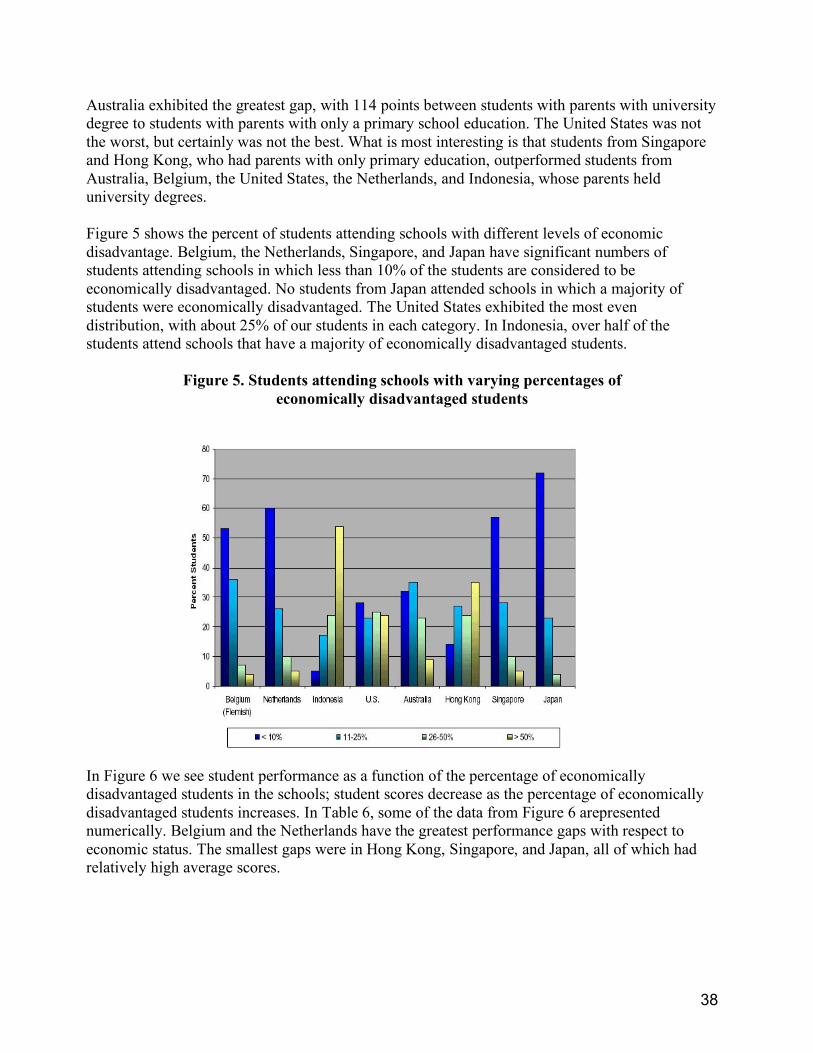
Australia exhibited the greatest gap, with 114 points between students with parents with university degree to students with parents with only a primary school education. The United States was not the worst, but certainly was not the best. What is most interesting is that students from Singapore and Hong Kong, who had parents with only primary education, outperformed students from Australia, Belgium, the United States, the Netherlands, and Indonesia, whose parents held university degrees. Figure 5 shows the percent of students attending schools with different levels of economic disadvantage. Belgium, the Netherlands, Singapore, and Japan have significant numbers of students attending schools in which less than 10% of the students are considered to be economically disadvantaged. No students from Japan attended schools in which a majority of students were economically disadvantaged. The United States exhibited the most even distribution, with about 25% of our students in each category. In Indonesia, over half of the students attend schools that have a majority of economically disadvantaged students.
Figure 5. Students attending schools with varying percentages of
economically disadvantaged students
In Figure 6 we see student performance as a function of the percentage of economically disadvantaged students in the schools; student scores decrease as the percentage of economically disadvantaged students increases. In Table 6, some of the data from Figure 6 arepresented numerically. Belgium and the Netherlands have the greatest performance gaps with respect to economic status. The smallest gaps were in Hong Kong, Singapore, and Japan, all of which had relatively high average scores.
38

Figure 6. Average student performance as a function of the percentage of economically disadvantaged students
Table 6. The performance gap in selected countries measured against economic status
Country Less than 10% More than 50% Difference
Belgium 559 404 155
Netherlands 563 465 98
Indonesia 485 395 90
United States 593 464 75
Hong Kong 619 571 48
Australia 521 473 48
Singapore 617 578 39 Table 7 shows curriculum differences among countries participating in TIMSS 2003. Thirty-three out of 46 countries had one curriculum for all students at grade 8. Twenty-one out of 26 countries had one curriculum at grade 4. Nine of the 46 countries had varying difficulty levels for different students at grade 8, while four out of 46 do so at grade 4. Finally, no countries had multiple curricula for grade 4, but four out of 46 had multiple curricula at grade 8.
39

Table 7. Mathematics curriculum and student differences
One curriculum for all students Grade 8 33 of 46 countries Grade 4 21 of 26 countries
Varying difficulty levels for different students
Grade 8 9 of 46 countries Grade 4 5 of 26 countries
Multiple curricula for different students Grade 8 4 of 46 countries Grade 4 0 of 26 countries
The countries not using a single curriculum at each grade are identified in Table 8. The United States offers varying difficulty levels for different students in both grade 4 and grade 8. (I disagree with this self-report; I would suggest that the United States actually has multiple curricula for different students.) Of the four countries with multiple curricula at grade 8. two are Belgium and the Netherlands, which also exhibited the greatest performance gaps with respect to economic status. One may ask if there is a relationship between increasing performance gap and numerous mathematics curricula offered, but Singapore is also in this group. However, Singapore also has policies and programs to identify and support slower students (Ginsburg et al., 2005).
Table 8. Mathematics curriculum and student differences
Varying difficulty levels for different students
Grade 8 9 of 46 countries Australia, England, Hong Kong, Republic of Korea, New Zealand, Scotland, Serbia, Slovenia, United States
Grade 4 5 of 26 countries Australia, England, New Zealand, Scotland, United States
Multiple curricula for different students Grade 8 4 of 46 countries Belgium (Flemish), Netherlands, Russian Federation,
Singapore Grade 4 0 of 26 countries
Now, I want to return to the performance gap of grade 8 students who participated in TIMSS 2003. In Table 9, we again have the performance gap as a function of the parents’ level of education, but here I have indicated which countries have varied and multiple curricula at the grade 8 . In Table 10, I have made the same modifications to the statistics about performance and economic status. A single asterisk indicates that the country’s curriculum has different difficulty levels, and a double asterisk indicates that the country has multiple curricula.
40

Table 9. Student performance versus parent education
Country University Primary Difference Australia* 543 429 114 Belgium** 586 462 104 United States* 530 436 90 Singapore** 651 571 80 Netherlands** 569 502 67 Indonesia 457 406 51 Hong Kong 612 578 34
Table 10. Student performance versus family economic status
Country Less than 10%
Economic disadvantage More than 50%
Economic disadvantage Difference
Belgium** 559 404 155 Netherlands** 563 465 98 Indonesia 485 395 90 United States 593 464 75 Hong Kong 619 571 48 Australia* 521 473 48 Singapore** 617 578 39
The two countries with the smallest gap as a function of parents’ education had a single curriculum. On the other hand, Singapore, which offers two curricula for grade 8 students, had the smallest performance gap as a function of economic status, while Belgium and Netherlands, the two other chosen countries having multiple curricula, have the greatest gaps. How can this be explained? In 1992 (before Singapore’s participation in the international studies), a Department of Education report stated, “Use of a differentiated curriculum based on tracking is negatively associated with student performance on international assessments and reduces opportunities for some students to learn” (USED, 1992). This is exactly what Cathy Seeley said, and when she made that comment, I thought of Sheila Tobias and her book, They’re Not Dumb, They’re Different. The quote above was reiterated by Russ Whitehurst at the Mathematics Summit in 2003 (Whitehurst, 2003), where he proposed that perhaps we should not be tracking students through grade 8. Singapore does have tracking, but its tracking practice is very different from the tracking that we have in the United States. In the United States, we have only 25% of our students in advanced courses, but in Singapore, 50% of the students are in advanced courses, and less than 50% are in the slower courses. Beginning in grades 5 and 6, the students who are in need of more support are identified. These students are called “mathematically slower” They are not called “stupid” or “incapable of learning.” They receive 30% more math instruction, but they are exposed to the
41

same content. They are taught by teachers who can provide competent, compensatory assistance (Ginsburg et al., 2005)). Is there a best way to teach grade 8 mathematics? Some of us may be die-hard constructivists, believing all learning needs to be “hands-on.” However there is not just one right way to teach as revealed by the TIMSS 1999 mathematics video study (USED, 2003). The TIMSS 1999 study was conducted, because after 1995 (USED, 1999), there were those who, after viewing the 1995 videos, came to believe there was one right way to teach, and it was the Japanese way. However, as Dr. Akihiko Takahashi said, “Even the Japanese do not always teach in the “Japanese way.” To further understanding of the TIMSS 1999 Video Study findings, a group of mathematicians, mathematics educators, and professional developers came together to discuss their individual analyses of the lessons in the TIMSS 1999 video study. The purpose of this work was to make some of the public release lessons from the 1999 study more useful to pre-service and in-service educators in helping teachers deepen their mathematics and pedagogical knowledge (Askey & Wang-Iverson, 2005). I have been asked to what extent the TIMSS results correlate with Title 1 statistics, because people are always questioning the relevance of TIMSS to U.S. education. In Table 10, we saw the correlation between the performance gap and higher percentages of economically disadvantaged students. In Table 11, I have displayed some Title 1 statistics. On the left, we have the percentage of students who are Title 1 eligible versus the percentage of schools which are Title 1 schoolwide. The national average of schools that are Title 1 schoolwide is 25.4%. This is consistent with the statistics in Figure 5. The extent to which economically disadvantaged students are segregated into schools that are Title 1 schoolwide varies from state to state. Most notable among the selected states is Texas, in which 57.7% of the students are Title 1, and just over half of the students attend schools which are Title 1 schoolwide.
Table 11. Comparing TIMSS and Title 1 statistics
States Title 1 Eligible Title 1 Schoolwide New Jersey 54.8% 10.9% Texas 57.7% 50.5% Iowa 38.6% 8.0% Nebraska 38.6% 13.1% Illinois 56.0% 24.9% Georgia 43.8% 30.3% Reporting States Average 47.1% 25.4%
Can TIMSS and lesson study help to bridge the performance gap and meet the goals of NCLB? Let’s recall that the common focus of both TIMSS and lesson study is the student. Lesson study can help us to set shared goals for student learning, as well as shared strategies for achieving them.
42

We have to be careful about what we mean by lesson study. A colleague was on a plane with a mathematics supervisor, who said that she engages in lesson study. My colleague asked her to explain, and she replied that she assigns the same lesson to all her teachers, and they teach it, but they never observe each other. She calls that lesson study. So we have to be aware that the same term can mean very different things to different people. It’s important for us to clarify the kind of lesson study in which we are engaged. A goal of this conference is for us to continue to clarify and to deepen our understanding of lesson study. Many teachers in U.S. schools never have the opportunity to observe each other or to be observed. As a rule, they work in relative isolation, unlike Japanese teachers, who have the opportunity to partake in a longstanding culture of professional development. Lesson study is a unique tool for ongoing professional learning, because it can help teachers to reach a common understanding of student thinking and then collaboratively develop strategies that raise students to higher levels of understanding and accomplishment. Therefore, lesson study offers a powerful means of helping teachers and administrators learn how to leave no child behind (Wang-Iverson, 2005).
REFERENCES Askey, R., & Wang-Iverson, P.(Eds.). Using TIMSS videos to improve learning of mathematics: A
resource guide. Retrieved March 16, 2006 from http://www.rbs.org/mathsci/timss/resource_guide
Ginsburg, A., Leinwand, S., Anstrom, T., & Pollock, E. (2005). What the United States can learn from Singapore’s world-class mathematics system (and what Singapore can learn from the United States): An exploratory study. Washington, DC: American Institutes for Research. Available at: http://www.air.org/news/documents/Singapore%20Report%20(Bookmark%20Version).pdf
Martin, M. O., Mullis, I. V. S., Gonzalez, E. J., Gregory, K. D., Smith, T. A., Chrostowski, S. J., Garden, R. A., & O'Connor, K. M. (2000). TIMSS 1999 International Science Report: Findings from IEA's repeat of the Third International Mathematics and Science Study at the grade 8 . Boston, MA: International Study Center.
Mullis, I. V. S., Martin, M. O., Gonzalez, E. J., Gregory, K. D., Garden, R. A., O'Connor, K.M., Chrostowski, T. A., Smith, T. A. (2000). TIMSS 1999 International Mathematics report: Findings from IEA's repeat of the Third International Mathematics and Science Study at the grade 8 . Boston, MA: International Study Center.
Tobias, S. (1990). They're not dumb, they're different: Stalking the second tier. Tucson, AZ: Research Corporation.
U.S. Department of Education, National Center for Education Statistics (1992) International mathematics and science assessments: What have we learned, NCES 92011, by Medrich, E.A. & Griffith, J.E.. Washington, DC: U.S. Government Printing Office. Available at: http://nces.ed.gov/pubsearch/pubsinfo.asp?pubid=92011
43

U.S. Department of Education, National Center for Education Statistics. (1999). The TIMSS Videotape Classroom Study: Methods and findings from an exploratory research project on eighth-grade mathematics instruction in Germany, Japan, and the United States, NCES 99-074, by James W. Stigler, Patrick Gonzales, Takako Kawanaka, Steffen Kroll, and Ana Serrano. Washington, DC: U.S. Government Printing Office. Available at: http://nces.ed.gov/programs/quarterly/Vol_1/1_2/6-esq12-a.asp
U.S. Department of Education, National Center for Education Statistics. (2003). Teaching Mathematics in Seven Countries: Results from the TIMSS 1999 Video Study, NCES (2003-013), by James Hiebert, Ronald Gallimore, Helen Garnier, Karen Bogard Givvin, Hilary Hollingsworth, Jennifer Jacobs, Angel Miu-Ying Chiu, Diana Wearne, Margaret Smith, Nicole Kersting, Alfred Manaster, Ellen Tseng, Wallace Etterbeek, Carl Manaster, Patrick Gonzales, and James Stigler. Washington, DC: Author. Retrieved March 16, 2006 from http://nces.ed.gov/pubsearch/pubsinfo.asp?pubid=2003013
Wang-Iverson, P., (2002). What makes lesson study unique? in Wang-Iverson, P. & Yoshida, M., Ed. (2005) Building our understanding of lesson study. Philadelphia, PA: Research for Better Schools.
44

LEARNING FROM THE INTERNATIONAL ACHIEVEMENT STUDIES:
WHERE DO WE GO FROM HERE?1
Yoshinori Shimizu
Faculty of Education, Tokyo Gakugei University
ABSTRACT
The recent release of two large-scale international comparative studies of students’ achievement in mathematics, the OECD-PISA2003 and the TIMSS2003, has the potential to influence educational policy and practice. While a careful examination of their findings, theoretical frameworks, and methodologies provides mathematics education researchers with opportunities for exploring research possibilities of learners and learning environments, the release of such studies also offers classroom teachers an opportunity to deepen their understanding of learning environments for their own students and to reflect upon their teaching. BEYOND THE COMPETITIVE EMPHASIS The release of results of the OECD-PISA2003 (Programme for International Student Assessment, OECD, 2004) and the TIMSS2003 (Trends in International Mathematics and Science Study, Mullis, et al., 2004) in December 2004 received huge publicity in the Japanese media. The purposes of international studies such as PISA and TIMSS include providing policymakers with information about the educational system. Policymakers, whose primary interest is in such information as their own country’s relative rank among participating countries, welcome a simple profile of student performance. Also, there is a close match between the objectives of PISA, in particular, and the broad economic and labor market policies of host countries. The match naturally invites a lot of public discussion on the results of the study from both a competitive and evaluative point of view. Such was the case in Japan. There was one additional large-scale study of mathematics achievement in 2004, which focused on student performance in Japan. In the National Survey of the Implementation of the Curriculum, which has also been released recently (NIER, 2005), students from grades 5 through 9 (N>450,000) worked on items closely aligned with the specific objectives and content of the Japanese mathematics curriculum. TIMSS2003 sought to derive achievement measures based on the common mathematical content as elaborated with specific objectives, whereas PISA2003 was explicitly intended to measure how well 15-year-olds can apply what
1 Presented at Improving Mathematics Teaching and Learning Through Lesson Study, May 20-21, 2005, Chicago.
45
they have learned in school within real-world contexts. The recent release of these studies should offer new insights into learners and learning from multiple perspectives. These large-scale international and national studies, provide a profile of a population of students from their own perspectives. We need to go beyond competitive emphasis in the reports of such studies to understand more about the students’ performance and to explore the possibilities of further research that such studies provide. This brief report draws upon a few released items from PISA2003 to propose specific research questions that mathematics education researchers might examine more carefully. Also, studies such as PISA2003 and TIMSS2003 offer classroom teachers opportunities to learn more about the learning environments of their own students, and if they wish, to use the released items in their own classrooms. What is PISA? The Programme for International Student Assessment (PISA) is an international standardized assessment in reading literacy, mathematical literacy, problem-solving, and scientific literacy. It started in 1997 when OECD countries began to collaborate in monitoring the outcomes of education and, in particular, assessed the performance of 15-year-old students according to an agreed upon framework. Tests have typically been administered to 4,500-10,000 students in each country. The first assessment in 2000 surveyed students in 32 countries and focused mainly on reading literacy, while the second assessment in 2003 involved 41 countries and focused mainly on mathematics and problem solving. The third assessment in 2006 will largely emphasize scientific literacy and is expected to include participants from 58 countries. In describing their approach to assessing mathematical performance, PISA documents (OECD, 2004) highlight the need for citizens to enjoy personal fulfilment, employment, and full participation in society. Consequently they require that “all adults—not just those aspiring to a scientific career—be mathematically, scientifically, and technologically literate” (OECD, 2004, p. 37). This key emphasis is manifest in the PISA definition of mathematical literacy: “…an individual’s capacity to identify and understand the role that mathematics plays in the world, to make well-founded judgments, and to use and engage with mathematics in ways that meet the needs of that individual’s life as a constructive, concerned, and reflective citizen” (OECD, 2004, p. 37). Reflecting this view of mathematical literacy, PISA documents (OECD, 2004) note that real-life problems, for which mathematical knowledge may be useful, seldom appear in the forms characteristic of “school mathematics.” The PISA position in assessing mathematics was therefore designed “to encourage an approach to teaching and learning mathematics that gives strong emphasis to the processes associated with confronting problems in real-world contexts, making these problems amenable to mathematical treatment, using the relevant mathematical knowledge to solve problems, and evaluating the solution in the original problem context” (OECD, 2004a, p.38).
46

Sample Items from PISA2003 Students’ mathematics knowledge and skills were assessed according to mathematical content, the processes involved, and the situations in which problems were posed. Four content areas were assessed: space and shape, change and relationships, quantity, and uncertainty. The various processes to be assessed included: thinking and reasoning; argumentation; communication; modeling; problem posing and solving; representation; and using symbolic, formal, and technical language and operations. The competencies involved in these processes were clustered into three areas: reproduction, connections, and reflection. The situations assessed were of four types: personal, educational or occupational, public, and scientific. Assessment items were presented in a variety of formats from multiple-choices to open-constructed responses. A closer look at the profile of students’ responses to the released items raises questions for Japanese mathematics educators, in particular, and for mathematics researchers, in general. Even the results of a few released items from PISA2003 suggest possibilities for conducting a secondary analysis and further research studies. Such research is likely to lead to a deeper understanding of learners and learning. An Illuminating Example: SKATEBOARD One of the items on which Japanese students scored less well than students in other countries is Question 1 of the item called SKATEBOARD (OECD, 2004, p.76).
47

This short constructed response item asks the students to find the minimum and the maximum price for self-assembled skateboards using the price list of products given in the stimulus. The item is situated in a personal context, belongs to the quantity content area, and is classified in the reproduction competency cluster. The results show that the item has a difficulty of 464 score points when the students answer the question by giving either the minimum or the maximum, which locates it at Level 2 proficiency. On the quantity scale, 74% of all students across the OECD community can perform tasks at least at Level 2. The full credit response has a difficulty of 496 points, which places it at Level 3 proficiency. On the quantity scale, 53% of all students across the OECD community can perform tasks at Level 3 or above. When we look at the data on the students’ response rate in each country, a different picture appears. Japan’s mean score was significantly lower than the OECD average for the item (See Table 1) and the pattern in the percentages for students’ responses look different from their counterparts in other countries. Of note among the numbers in Table 1 is the lower percentage of correct responses from Japanese students than from their counterparts, as well as the higher no response rate. Students can find the minimum price by simply adding lower numbers for each part of the skateboard and the maximum price by adding larger numbers.
Table 1. The Percentage of Students’ Response s for SKATEBOARD, Question 1
Countries Full Credit Partial Credit No Response Correct Australia 74.1 9.3 1.8 78.7 Canada 74.9 9.1 2.0 79.4 Germany 71.7 11.5 5.2 77.5 Japan 54.5 8.0 10.6 58.5 United States 57.7 8.9 6.2 62.2 OECD Average 66.7 10.6 4.7 72.0
Source: National Institute for Educational Policy Research, 2004, p. 102.
However, the results are quite different for Question 2 of the same item (Table2). Question 2 (“Question 13” in the international report) is a multiple-choice task that asks students to find the number of possible combinations under the given condition. This task looks more like those typically found in mathematics textbooks.
There is a sharp contrast between Table 1 and 2. It is interesting to note that Japanese students perform better on Question 2 than Question 1. The results suggest that Japanese students may have greater difficulty in handling multiple numbers where some judgment is
48

required, assuming that they have little trouble in the execution of the addition procedure. However, further research is needed to pinpoint the reasons for this response.
Table 2. The Percentage of Students’ Responses for SKATEBOARD, Question 2
Response Rate Countries A B C D No Res.
Australia 23.1 14.3 6.8 53.7 2.0
Canada 20.7 14.0 6.0 57.7 1.6
Germany 24.2 19.3 6.5 44.9 5.1
Japan 11.8 12.2 5.7 67.0 3.3
United States 23.3 17.0 7.3 49.9 2.6
OECD Average 25.4 18.3 6.3 45.5 4.5
Source: National Institute for Educational Policy Research, 2004, p. 104.
Another Example from PISA2003: NUMBER CUBES Another example comes from the item called NUMBER CUBES (OECD, 2004, p.54). This item asks students to judge whether the rule for making a dice (i.e., that the total number of dots on two opposite faces is always seven) applies or not when each of the four different shapes is folded together to form a cube. The item is situated in a personal context, belongs to the space and shape content area, and is classified in the connection competency cluster. The results show that the item has a difficulty of 503 score points, which places it at Level 3 proficiency. On the space and shape scale, 51% of all students across the OECD community can perform tasks at Level 3 or above.
Table 3. The Percentage of Students’ Responses for NUMBER CUBES
Students’ Choice of Correct Judgments Countries Four (Full) Three Two One None No Res.
Australia 68.6 14.1 7.2 6.4 2.4 1.2
Canada 69.6 14.0 7.3 6.3 2.1 0.6
Germany 69.0 13.9 7.3 5.6 2.3 1.9
Japan 83.3 8.9 4.2 2.0 0.9 0.7
United States 52.8 19.6 13.3 10.7 2.9 1.0
OECD Average 63.0 16.0 8.9 7.2 2.7 2.3 Source: National Institute for Educational Policy Research, 2004, p. 108.
49

The result shows that Japan’s mean score was significantly higher than the OECD average, as well as being higher than other participating countries (See Table 3). Also, the pattern of students’ choice is slightly different from other countries. In order to complete the item correctly, students need to interpret the two-dimensional object back and forth by mentally “folding” it to make the four planes of the cube as a three-dimensional shape. The item requires the encoding and spatial interpretation of two-dimensional objects. Why did a group of students, once again Japanese students, perform well on this particular item? Does the result suggest that those students have a cultural practice with number cubes, or Origami, inside and outside schools? Additional research is needed to explain the similarities and differences in students’ responses among participating countries.
50

Sample Items from TIMSS2003 The Trends in International Mathematics and Science Study (TIMSS, formerly known as the Third International Mathematics and Science Study) also announced the results of its 2003 survey. (For further information, see http://timss.bc.edu/timss2003.html.) Japanese students in grades 4 and 8 took part in the survey. An Example from TIMSS2003: The Meaning of a Fraction The following simple item, which requests students to identify the decimal representation for a fraction with a denominator of 10 in the multiple-choices format, belongs to the “Number” content area.
Percentages of those students who got full credit varied among the participating countries (Table 4) . Of particular interest here is that there was a revision of the national curriculum standards between 1995 and 2003. Table 4. Percent Full Credit for the Item, “Identifies the Decimal Representation for a
Fraction With a Denominator of 10” for Grade 4
Countries Full Credit Singapore 95 (0.8) Japan 60 (2.2) United States 62 (1.8) International Average 43 (0.4)
Standard errors appear in parentheses. Source: Mullis, et al., 2004, p.87.
TIMSS2003 shows the trends in the result of common items between 2003 and 1995. In the current national curriculum, both the concepts of and representation for common fractions and decimal fractions are taught in the fourth grade, whereas that content was taught in the third grade in the former curriculum. This appears to be a significant change that warrants further study.
51

Table 5. A Comparison of the Response Rates of Japanese students for the Item, “Identifies the Decimal Representation for a Fraction With a Denominator of 10”
Between Year 1995 and 2003
Code TIMSS2003 TIMSS1995 A 16.6 15.2 B 15.7 14.9 C 60.2 65.3 D 4.0 3.9
Other 3.4 0.7 Percent Correct 60.2 65.3
Another Example from TIMSS2003: Missing Number in a Proportion The following item is from Algebra as the content area, which has a description of “Solves equation for missing number in a proportion” for Grade 8. The students can find the answer, without solving an equation, by the reduction.
Table 6. Percent Full Credit for the Item, “Missing Number in a Proportion” for Grade 8
Countries Full Credit
Singapore 93 (0.7) Japan 79 (1.6) United States 80 (1.1) International Average 65 (0.3)
Standard errors appear in parentheses. Source: Mullis, et al., 2004, p.81.
The linear equation is a topic that has been taught for a long time in seventh grade in the Japanese curriculum, so more students were expected to solve this task than actually did. Again, we need more information about student thinking on multiple-choices tasks such as this.
52

STUDENT LEARNING: ATTITUDES, ENGAGEMENT, AND STRATEGIES Besides the issues identified above taken from specific assessment items, results from recent international studies point to the need for additional research on a number of other topics. The TIMSS2003 collected information about teacher characteristics and about mathematics curricula. The PISA2003 also collected a substantial amount of background information through the student questionnaire and the school questionnaire. These data on contextual variables, as well as performance data related to the cognitive test domain, give us rich descriptions of the learning environments of the learners. The results from both studies tell us that Japanese students tend to have negative attitudes toward mathematics and mathematics learning. Also, a majority of them think that mathematics is not useful in their lives. When we look at these trends in mathematics achievement together with the trends in “I Enjoy Learning Mathematics,” (see Table 7), there is a lesson here about the tension between the cognitive domain and the domain of students’ learning (See Table 7). As the average score in England increased from 1995 to 2003 (much more than in other participating countries), the percentage of students who enjoy learning mathematics fell. On the other hand, although the average scores of Japanese students remain almost the same between the two assessment years, students responses to “I Enjoy Learning Mathematics” seem to be increasingly divided. Furthermore, while the average mathematics achievement scores of the United States remained the same between 1995 and 2003, students’ opinions about enjoying mathematics became more positive.
Table 7. Trends in Mathematics Achievement as Aligned With Trends in “I Enjoy Learning Mathematics” for Grade 4.
“I Enjoy Learning Mathematics” Agree A Lot Agree A Little Disagree
Countries Average Score in 2003
Average Score in 1995 2003 1995 2003 1995 2003 1995
England 531(3.7) 484(3.3) 43(1.2) 53(1.4) 27(0.8) 31(1.0) 30(1.3) 16(1.0) Japan 565(1.6) 567(1.9) 29(1.0) 16(0.8) 36(0.8) 56(1.0) 35(1.2) 28(1.1) United States 518(2.4) 518(2.9) 54(0.9) 47(1.6) 25(0.5) 38(1.0) 20(0.6) 15(0.9)
International Average 50(0.2) 46(0.4) 28(0.2) 38(0.3) 22(0.2) 16(0.3) Standard errors appear in parentheses. Source: Mullis, et al., 2004, pp. 45, 160.
CONCLUDING REMARKS As was mentioned above, the recent release of two large-scale international achievement studies provides mathematics education researchers with new opportunities for investigating issues related to learners and learning. While we need to examine the results from each study
53

carefully, we also need to synthesize the results from different perspectives in an attempt to arrive at a coherent body of knowledge. Although the dissemination of PISA2003 has been slow to take root in the mathematics education community, the findings certainly impact national and local governments, educational systems, and even the business community in each country. While the public media are well aware of the relative ranking of their own country, they understand little of the intent and limitations of such studies. As mathematics educators, it is incumbent upon us to identify ways in which PISA can connect with and stimulate our own research and practice. The recent international studies offer classroom teachers opportunities for gaining a deeper understanding of learning environments for their own students, and even for using the released items from these studies in their own classrooms. REFERENCES Mullis, I. V. S., Martin, M. O., Gonzalez, E. J., & Chrostowski, S. J. (2004). TIMSS 2003
international mathematics report: Findings from IEA’s Trends in International Mathematics and Science Study at the fourth and eight grades. Chestnut Hill, MA: Boston College, TIMSS & PIRLS International Study Center.
National Institute for Educational Policy Research (2003). The report of 2002 national survey of the implementation of the curriculum: Mathematics. Tokyo: Author.
National Institute for Educational Policy Research (2004). Knowledge and skills for life II: OECD- Programme for International Student Assessment 2003. Tokyo: Gyosei
National Institute for Educational Policy Research (2005). A summary of 2004national survey of the implementation of the curriculum: Mathematics. Tokyo: Author.
Organisation for Economic Co-operation and Development (2003). The PISA 2003 assessment framework: Mathematics, reading, science and problem solving knowledge and skills. Paris: Author.
Organisation for Economic Co-operation and Development (2004). Learning for tomorrow’s world: First results from PISA 2003. Paris: Author.
54

SECTION 2
SCIENCE AND
TECHNOLOGY EDUCATION
55

SCIENCE EDUCATION IN JAPAN: AN OVERVIEW1
Atsushi Yoshida Aichi University of Education, Japan
ABSTRACT Since 1947, the Japanese science curriculum has been revised every 10 years. Today’s centralized science curriculum, as spelled out in the policies of the 1998 Course of Study, is characterized by cross-disciplinary study based on students’ interests and the distinctive characteristics of local schools. Science instruction relates to children’s daily life experiences, and encourages independent thinking and learning. In 1998, the number of class hours devoted to science was reduced by 30%. Textbook content corresponds to the Course of Study and is evaluated by the Ministry of Education. Because national and municipal governments shoulder the cost of supplying and improving science equipment and facilities at all levels, schools tend to be well-equipped. This paper also outlines in detail current science teaching practices across school levels, and both pre-service and in-service teacher education practices. A majority of current science education research is undertaken by public school teachers as members of an academic society, and not by universities or research institutes. While a majority of research conducted by teachers is focused on instructional materials, most research into students’ understanding of science or improvements in teaching methods occurs at the universities. THE EDUCATION SYSTEM The Japanese education system is made up of elementary school (6 years), lower secondary school (3 years), upper secondary school (3 years), junior college (2 years), and university (4 years). Compulsory education extends to the end of lower secondary school. Almost all elementary and lower secondary schools are public and co-educational; tuition and textbooks are free-of-charge. Over 95% of students go on to upper secondary school, over half of which are in the public sector; many are co-educational. (Among private upper secondary schools, many are single-sex schools.) Students enter upper secondary school based on the results of an examination and their grades acquired in lower secondary school. About 40% of upper secondary school graduates go on to university, which is comparable to the U.S. University admission is based on entrance exams set by the university and/or faculty. “Juku” or “cram schools” exist to prepare students for the entrance examinations to upper secondary school or university, and 50% of students undertake supplementary study in a “juku” for 1 to 2 1 Presented at Exploring Collaborations in Science and Mathematics Education, March 17-19, 2003, San Francisco.
56

hours a day after completing their school classes. (The remaining 50% do not undertake any form of supplementary study outside school.) Prior to elementary school, kindergartens and day nurseries accept children between 2 and 4 years, but these do not fall within the scope of compulsory education. Tables 1, 2, and 3 below show the number of school hours allotted to each subject and each grade in elementary, lower secondary, and upper secondary school, respectively.
Table 1: Standard class hours for elementary schools (1 class hour time unit is 45 minutes)
Table 2: Standard class hours for lower secondary schools (1 class hour time unit is 45 minutes)
School hours for compulsory subjects Grade
List
Japa
nese
Soci
al S
tudi
es
Mat
hs
Scie
nce
Mus
ic
Arts
Hea
lth &
P.E
.
Indu
stria
l Arts
, H
omem
akin
g
Fore
ign
Lang
.
Mor
al E
d.
Spec
ial A
ctiv
ities
Hou
r ran
ge
for e
lect
ives
Inte
grat
ed S
tudy
Pe
riod
Tota
l cla
ss h
ours
1 140 105 105 105 45 45 90 70 105 35 35 0-30 70-100 980 2 105 105 105 105 35 35 90 70 105 35 35 50-85 70-105 980 3 105 85 105 80 35 35 90 35 105 35 35 105-16 70-130 980
Class hours for each subject Grade List
Japa
nese
Soci
al S
tudi
es
Arit
hmet
ic
Scie
nce
Life
and
En
viro
nmen
t St
udie
s M
usic
Art
& H
andc
raft
Hom
e- m
akin
g
Phys
ical
Ed
ucat
ion
Mor
al E
duca
tion
Spec
ial A
ctiv
ities
Inte
grat
ed S
tudy
Pe
riod
Tota
l cla
ss h
ours
Grade 1 272 114 102 68 68 90 34 34 782
Grade 2 280 155 105 70 70 90 35 35 840
Grade 3 235 70 150 70 60 60 90 35 35 105 910
Grade 4 235 85 150 90 60 60 90 35 35 105 945 Grade 5 180 90 150 95 50 50 60 90 35 35 110 945
Grade 6 170 100 150 95 50 50 50 90 35 35 110 945
57

Table 3: Standard credits of subjects for upper secondary schools
(1 credit is 50 minutes by 35 weeks)
Subject Subject Credits Subject area Subject Credits Subject area
Subject Credits
Japanese language expression I
2 Basic Mathematics
2 Physical Education
7-8
Japanese language expression II
2 Mathematics I 3
Health and
Physical Education Health 2
General Japanese
4 Mathematics II 4 Music I 2
Modern literature
4 Mathematics III 3 Music II 2
Classics 4 Mathematics A 2 Music III 2
Japanese
Reading of Classics
2 Mathematics B 2 Fine Arts I 2
World history A
2
Mathematics
Mathematics C 2 Fine Arts II 2
World history B
4 Basic Science 2 Fine Arts III 2
Japanese history A
2 Comprehensive Science A
2 Industrial Arts 2
Japanese history B
4 Comprehensive Science B
2 Industrial Arts 2
Geography A 2 Physics I 3 Industrial Arts 2
Geography History
Geography B 4 Physics II 3 Calligraphy 2 Modern society 2 Chemistry I 3 Calligraphy 2 Ethics 2 Chemistry II 3
Arts
Calligraphy 2
Civics Politics / Economics
2 Biology I 3 Oral communication I
2
Basic Home Economics
2 Biology II 3 Oral communication II
4
Integrated Home Economics
4 Earth Science I 3 English I 3
Home-making
Home Life Techniques
4
Science
Earth Science II 3 English II 4
Information A 2 Reading 4 Information B 2
Foreign language
Writing 4
Information Information C 2
TRENDS IN SCIENCE EDUCATION Japanese science education, established in the 19th century, has undergone many changes over the course of its 100-year history. Since 1947 (post-World War II), the Ministry of Education has issued official Course of Study as the basis of the curriculum, with objectives and content prescribed for elementary, lower secondary, and upper secondary subjects. Since 1947, the curriculum has been revised every 10 years, with 5 revisions up to the present time. The main characteristics for each revision in science education are given below. 1947 Course of Study Under U.S. direction, “Science for daily life experience” tried to interest students in a wide range of everyday natural phenomena. This child-centered curriculum emphasized problem solving in daily life.
58

1958 Course of Study Shifting from the prior child-centered approach to a systematic understanding of natural science, content focused on the ordered nature of learning and a systematic teaching approach. From elementary through upper secondary school, content was arranged in order of basic scientific concepts concerned with organisms, matter, and other issues. 1969 Course of Study Taking as its model the U.S. science education modernization of the 1960s, this revision attempted to close the gap between schools and modern natural science. It placed an emphasis on inquiry learning, including a careful selection of teaching materials designed to provide the structure for basic science concepts and a focus on scientific methods. This curriculum provided abundant content, based on hands-on activities such as observation and experiment. 1977 Course of Study This curriculum used careful content selection to create “Yutori” (stress-free) education, or “education that allowed time for reflection.” Social problems such as pollution and environmental conservation were raised, and emphasis was on developing students’ rich sense of humanity. Curriculum aims included promoting enjoyable science, emphasizing a hands-on approach and developing creativity and a spirit of inquiry. 1989 Course of Study Science was abolished as a separate subject in the early elementary grades, to be replaced by Life and Environment Studies, concerned with both science and social science. Emphasis was placed on familiarizing students with the natural world, while in lower secondary school, additional consideration was given to raising students’ interest in the natural world, including environmental conservation and respect for life. In continued emphasis on “Yutori,” both school hours for science and content were reduced, although focus was placed on developing the capacity for objective understanding and rational judgment, as well as a scientific way of thinking and looking at the world. SCIENCE CURRICULUM TODAY The current 1998 curriculum revision is characterized by the following components: • A period for “integrated study” was introduced, starting in elementary Grade 3. The
goal of the “Period for Integrated Study” was to enable schools to use their creative ingenuity to develop cross-disciplinary, comprehensive study programs based on students’ interests and the distinctive characteristics of students, schools, and locations.
• With a view to achieving “stress-free” learning, the shift was made to a five-day school week, with a consequent 10% reduction in school hours allocated for each subject, and a 30% reduction in content. In science, the content reduction was made by moving content to higher grades or eliminating content that contained difficult to
59

teach concepts, could not be easily understood by students, or was particularly abstract.
• The aim of these revisions was to imbue students with a “zest for living.” Rather than quantitative learning, the new curriculum 1) promoted a rich sense of humanity and social sensibilities, 2) cultivated students’ ability to learn and think for themselves, and 3) encouraged students to realize their individuality within an educational environment that allowed time for thought and reflection. At the lower secondary level, time was allocated for elective subjects, and there was a uniform reduction of school hours for each subject.
Table 4 below shows the change in the number of school hours allocated for science
education since 1977
Elementary schools Lower secondary schools Total Year Total
school hours
Science % Total school hours
Science % Total School hours
Science %
1977 5,785 558 9.65 3,150 350 11.11 8,935 908 10.16 1989 5,785 410 7.09 3,150 350 11.11 8,935 760 8.51 1998 5,367 350 6.52 2.940 290 9.86 8,307 640 7.70
30 years ago (1977 Course of Study), 10% of lower secondary school class hours were devoted to science. In 1998, there was a 7% overall reduction in class hours, but the number of hours allocated to Science was reduced by 30%, so that science courses represented 7.7% of total class hours. In particular, hours devoted to science in elementary school were very heavily reduced (37%), with learning content markedly diluted or advanced to the lower secondary school level. This reduction in class hours and content is linked to the “drift away” from science in lower secondary schools, and to the reduction in the numbers of students hoping to pursue further science studies. Basic Principles of Science Reform (1998 Course of Study) • Science classes should relate to children’s daily life experiences, and should
encourage children to make observations and experiments on their own. Emphasis is placed on the development of intellectual interest and inquisitiveness in the environment, and problem-solving ability.
• Elementary school topics considered difficult for students at a particular grade will be taught in the next grade, upper grades, or eliminated. Content that relates closely to the local environment and daily life will be prioritized.
• Lower secondary schools will conduct more outdoor observations and exploratory observations. Complex material (e.g., composition/decomposition of force, characteristics of the Japanese climate, biological evolution) will be taught in upper secondary school.
60
• Upper secondary schools will establish three new subjects as electives, of which one will be required: Basic Science – content includes science history and the relationship between human life and science, and carries the overarching goal of developing scientific perception and thinking. Comprehensive Science A – content includes the study of natural phenomena closely related to daily life, including material and energy. Comprehensive Science B – content includes the study of biological and natural phenomena in the global environment.
Overall Objectives in Science Education In the Course of Study for Science, general objectives are established for each level of schooling, as well as by grade year, specialist field, and subject. Consistency is maintained in the objectives across the range of schooling from elementary through upper secondary school. Core “perspectives” that all levels of schooling work to develop are: • a heightening of students’ sense of familiarity with and interest in the natural world • the facilitation of direct experience through observation and experiment • the development of problem-solving abilities and attitudes, in order to undertake
investigations in a scientific way • the ability to understand natural things and phenomena • the adoption of scientific views and thinking. These five perspectives are all interrelated, and this mutual interrelationship with the general objectives also holds true for grade, field, and subject objectives. ELEMENTARY SCIENCE OBJECTIVES • heighten students’ interest in nature • develop, through hands-on activities, the abilities and attitudes necessary to carry out
investigations in a scientific manner • enable students’ understanding of natural things and phenomena • foster scientific view and thinking • equip students with basic scientific literacy. LOWER SECONDARY SCIENCE OBJECTIVES • class activities investigate natural things and phenomena • establish links with everyday life • develop a scientific way of thinking • cultivate students’ desire to preserve the natural environment and respect life • enable students to see the natural world in a comprehensive way • develop the relationship between students’ knowledge of science and technology and
everyday human life and the environment.
61

UPPER SECONDARY SCIENCE OBJECTIVES In “Basic Science,” Comprehensive Science A” and “Comprehensive Science B,” students: • study the relationship between science and human lifestyles, and between human
beings and the natural world • master the development of science and technology and its effect on human lifestyles,
before proceeding to specialized study (e.g., physics, chemistry, biology) • achieve a correct understanding of science, which can be maintained throughout their
lives. Science Content
Table 5: Elementary Science Content
Content at the elementary level is divided into A, B and C. A: “LIVING THINGS AND THEIR ENVIRONMENT” Aim: To cultivate in students, through raising plants and animals, the love of living things and an understanding of their characteristics and particular growth mechanisms. Grades 3 & 4: The changing bodies of living things. Grades 5 & 6: Internal body mechanisms of living creatures and their interface with the environment. B: “MATTER AND ENERGY” Grades 3 & 4: Light and magnetism, fundamental qualities of electricity, the nature of air and water, etc. Grades 5 & 6: The way solids dissolve, levers and the motion of objects, water solutions, how objects change when they burn, electromagnetism, etc. C: “EARTH AND THE UNIVERSE” Grades 3 & 4: Movements of the sun, moon, and stars; changes that water undergoes in the air. Grades 5 & 6: Effects of the passage of time and space; e.g., weather changes and the appearance of rivers, the way land is formed.
62

Table 6: Lower Secondary Science Content
Content at the lower secondary level is divided into First and Second Fields. FIRST FIELD: MATTER AND ENERGY Grade 1 (7th): “Familiar Physical Phenomena,” e.g., light, sound, and pressure, and “Familiar Substances,” e.g., the nature of gas and water vapor. Grade 2 (8th): “Electric Waves and Their Use,” e.g., the regularity of electric current and voltage, with reference to static electricity, circuits, etc., as well as electric current and magnetic fields; “Chemical Change, Atoms, and Molecules:” With the help of experiments and models, students study chemical compounds, decomposition, and the mass of substances in the context of chemical change. Grade 3 (9th): “The Regularity of Motion:” the regularity of motion, conservation of energy, reciprocal transformation, etc.; “The Uses of Chemical Reactions:” energy changes involved in such processes as oxidation and reduction, etc.; “Human Beings and Science/Technology:” the problem of energy resources and environmental conservation, the relationship between human beings and the uses of science and technology. SECOND FIELD: LIVING ORGANISMS, THE EARTH, AND SPACE Grade 1 (7th): “The Behavior and Classification of Plants:” e.g., observing plants to see how they grow and function, learning how they are classified; “Changes in the Earth,” including observations of topographical features, strata and different kinds of rocks, learning to identify from strata formation and fossils what the earth looked like in the past, as well as earthquakes, volcanoes, etc. Grade 2 (8th): “The Life Pattern and Classification of Animals:” the formation of the body of animals (vertebrates) and how they are classified; “Weather and Climate Change:” climate observation and changes in the weather. Grade 3 (9th): “Cells and Reproduction of Living Creatures:” types and varieties of cells, the means by which living creatures reproduce; “The Earth and Space:” earth’s axial rotation, orbital motion, and the solar system, movement of the planets, etc.; “Human Beings and Nature:” interactions between living creatures, e.g., the functioning of microorganisms, and the interface between human beings and the natural world.
63

Table 7: Upper Secondary School Science Content
Students choose one subject from “Basic Science,” “Comprehensive Science A,” and “Comprehensive Science B,” and one or more from “Physics I,” “Chemistry I,” “Biology I,” and “Earth Science I.” “Basic Science” includes the beginnings of science, scientific discovery and development, scientific issues, and human lifestyles in the future. Through these topics, students learn how the history of science has furthered cultural development, how scientific concepts are formed through observation and experiment, and how to address future problem areas, including matter, energy, and life. “Comprehensive Science A” includes scientific quests, the relationship between human lifestyles and energy resources, and the relationship between human lifestyles and the development of science/technology. “Comprehensive Science B” includes the discovery of the natural world, the changing nature of life and the earth, balance in nature and a range of living creatures, and changes in human activity and the global environment. “Physics I” includes fundamentals such as electricity, light and sound waves, motion, and energy. “Physics II” includes force and motion, electricity and magnetism, matter and atoms, atomic nuclei, and topic-based research. “Chemistry I” includes fundamentals such as the composition of substances, different substances and their qualities, and changes in substances. “Chemistry II” includes the composition of substances and chemical equilibrium, substances and life, and topic-based research. “Biology I” includes such fundamental content as the continuity of life, the environment, and the reactions of living creatures. “Biology II” includes matter and biophenomena, the classifications and evolution of living creatures, groups of living creatures, and topic-based research. “Earth Science I” includes fundamental content such as the composition of the earth, of the atmosphere, the sea, and space. “Earth Science II” includes exploration of the earth, the earth’s crust and space, and topic-based research.
Science Textbooks Japan is a centralized society, and Japanese education is centralized around the educational policies established by the Ministry of Education. The Course of Study are designed according to educational policy. Textbook content corresponds to the Course of Study, and at all levels of schooling textbooks are examined and evaluated by the Ministry of Education to confirm that they meet the requirements established in the Course of Study.
64

Table 8: School Education in Japan
SCHOOL EDUCATION IN JAPAN Textbooks are provided free-of-charge to elementary and lower secondary students. The value of textbooks is set at a fixed price, so there is almost no difference between the number of pages or content in textbooks produced by different publishers. Six Japanese publishers supply science textbooks for elementary and lower secondary level study, whereas a large number supply textbooks for study at upper secondary school. In elementary schools, one class teacher covers all subjects, so teacher guides are available for those who are not science specialists. In lower secondary school, a science specialist teaches the subject, so they usually do not use teacher guides. Upper secondary school teachers select the textbooks to be used at their school. Textbook publishers do not provide student workbooks (like the kind found in the U.S). Instead, students use workbooks edited by teachers in the local area. Upper and lower secondary school students also use collections of photographs and data, as well as reference books and published test problems.
CHARACTERISTICS OF SCIENCE TEXTBOOKS:
Elementary
• Written by experienced elementary school teachers, with some university staff members
• Comparatively few pages – less than 110 • Compilation follows lines of scientific process: the formulation of a problem or issue
from everyday life serves as the entry point to each unit, from which students formulate a hypothesis
• Ample photographs and diagrams explain the methodology of carrying out observations and experiments
• Little text, no attempt to explain scientific knowledge
Lower Secondary
• Textbooks are divided into First Field and Second Field, with two volumes issued for each of the three grade levels
• Physics, chemistry, biology, and earth science in each field for the same grade level is collected in one book
• Less than 160 pages per year • As with elementary textbooks, learning activities are developed in line with the
problem-solving process • Observational and experimental methods are explained with photographs and
diagrams • Contain ample data concerned with scientific concepts • Include detailed explanations of how to keep records and summarize material
Upper Secondary
• Textbooks are compiled on the basis of specific subject areas
65

• For “Basic Science,” “Comprehensive Science A,” and “Comprehensive Science B,” specific hands-on experience relates to the history of science and to basic observations and experiments, with material related to everyday life
• “Biology I,” “Chemistry I,” “Earth Science I,” and “Physics I” textbooks consist of fundamental content; IA-level subjects relate to everyday natural events and phenomena (for students who do not require science for university-level study), while 1B-level subjects, for students preparing for university study, range from concrete natural events and phenomena to abstract concepts, providing a foundation for further study in “Biology II,” “Chemistry II,” “Earth Science II,” and “Physics II.”
SCIENCE EQUIPMENT AND FACILITIES The 1953 Science Education Promotion Law has played a major role in providing equipment and facilities at all levels of science education in Japan, as science-related equipment is supplied and improved at the expense of national and municipal governments. Many schools have science laboratories in which 40 students can conduct experiments. A science laboratory is fitted out with laboratory tables, and equipped with gas and water ducts at which four students can carry out experiments as a group. Even at the elementary school level, each school is likely to have ten or more microscopes (relatively high-cost items), and all the equipment and apparatus necessary for virtually every child to carry out science experiments. In many elementary schools, Grades 3 to 5 have their own gardens in which to cultivate plants. In lower secondary schools, hands-on activities involving observation and experimentation are further emphasized, so science-related equipment and apparatus (from beakers and plastic cups to power instruments and optical devices) is of a higher level than that found in elementary schools. In upper secondary schools, laboratories are equally well equipped, allowing students to carry out observations and experiments in physics, chemistry and biology. Many upper secondary schools with more than 20 classes employ laboratory assistants. Recently, there has been a proliferation of computer rooms, with 20 or more computers connected to the Internet. However, only a small number of schools have the same kind of computers in students’ home classrooms. Computers are currently used in science teaching for Internet information searches, data processing, or simulation experiments, but there are insufficient websites with content that is appropriate for science teaching, and digital science content is still in development. SCIENCE TEACHING PRACTICE: CHANGES ACROSS SCHOOL LEVELS Elementary • Science content is connected with everyday objects and phenomena. • Learning is active, based on observation and experimentation, although classroom
teachers who are not particularly proficient in science do not encourage children to conduct experiments themselves, but carry out demonstration experiments and explain scientific facts and rules.
• The many kinds of equipment available in school labs tends to be underutilized. • Classes are developed in an exploratory way in accordance with the textbooks.
66

• Expert teachers develop teaching materials adapted to students’ abilities, and devise suitable teaching methods.
• Individualized instruction allows students to maintain a high interest in science. Lower Secondary • Most science teachers are specialists who majored in science at the university and
earned a teaching certificate. • Due to the transfer of staff between elementary and lower secondary schools, teachers
can have experience at both levels. • Emphasis is placed on observations and experiments carried out by students. • A great deal of scientific knowledge is transmitted to students during the course of the
following typical science lesson: The teacher presents a problem and students explore hypotheses, after which the students divide into groups to conduct experiments, under the teacher’s instruction. Each group records and presents its results to the class, whereupon the teacher summarizes the content and draws conclusions (scientific knowledge). Students then make a record of what has happened during the lesson, and write up the scientific knowledge. The teacher evaluates their worksheets, judging whether the results have been appropriately recorded.
• Teachers teach many classes in different grades, and many have additional administrative duties such as running after-school club activities and giving daily life or career guidance to students (on top of grading the previous lessons and planning the next ones), so while most teachers are capable of researching and developing new teaching materials, in practice they have little time to deepen their research.
• Consequently, there is a strong tendency for their teaching to follow a set pattern, and it is very difficult for them to develop individualized instruction.
• Students show strong achievement in, but low liking for, science when measured on an international scale.
Upper Secondary • Most teachers have graduated from faculties of science, agriculture, or engineering. • There is no movement of staff between lower and upper secondary schools, so most
upper secondary teachers have little interest in or understanding of the pedagogy or teaching methodology of their lower secondary peers.
• Upper secondary teachers’ interest is focused on ensuring their students acquire large amounts of knowledge and the abilities necessary to advance to university.
• Since entrance to upper secondary school is based on academic ability, there is a discrepancy between high-level upper secondary schools, where most of the students want to proceed to a high-ranking university, and low-level upper secondary schools, where many of the students drop out midway through the course.
• Consequently, there is a big difference in science teaching from school to school. High-level schools aim to develop knowledge and abilities beyond what is written in the textbook. Low-level schools teach only the easy sections of the science content, with the main focus on observation and experiment, to attract students’ interest.
• The “drift away” from science observed in lower secondary schools continues as a
67

serious malaise in upper secondary schools. • Students must choose one subject from three basic science courses (“Basic Science,”
“Comprehensive Science A.” and “Comprehensive Science B”) and one or more subjects from advanced courses (“Physics I,” “Chemistry I,” “Biology I.” and “Earth Science I”). Many science-related university faculties (such as the Faculties of Medicine, Science, Agriculture, and Engineering) include physics and chemistry as subjects on their entrance examinations. Students hoping to enter one of these faculties choose to study two science subjects at upper secondary school, but many students who do not intend to proceed to a science-related faculty choose biology and earth science .
TEACHER EDUCATION In Japan, the number of people who want to enter the teaching profession is very large, about 10 to 20 times greater than the need. Teaching is a popular profession because it is perceived as a stable and comparatively well-paid one. According to the 1997 report of the Council of Teacher Education, the qualities and abilities deemed necessary for a teacher include: • a global perspective: an appropriate understanding of the world, nation states, and
human beings, and a rich sense of humanity • skills to live in an era of rapid change: problem-solving, cultivating good human
relations, adapting to social change • teaching skills: an appropriate understanding of students and of education; dedication
to the teaching profession; the knowledge, skills, and abilities needed to teach students, including a sense of pride, unity, and subject-teaching ability.
Both pre-service and in-service education is deemed necessary to realize the above qualifications. Pre-Service Education Pre-service education and teacher training occur in universities. Eleven Japanese national universities are specially designated teacher training facilities, although Faculties of Education are also found in the other national universities located in each prefecture throughout Japan. Elementary and lower secondary school teachers train in these universities. Educational credits required to obtain teaching qualification are stipulated in the Educational Personnel Certification Law. In the 1998 revision, this law stressed the need for lower secondary school teachers to develop practical teaching skills. In the past, lower and upper secondary school training emphasized the educational content of teaching subjects (e.g., physics, chemistry, biology). Under the revised law, education-related subjects are given preference in training, with teaching practice doubled to four or more weeks. Despite the change in the law, there has been no discernible improvement in the
68
awareness of responsible university personnel regarding the need for teacher training, or in the quality of the training itself. Taking the teacher training curriculum at Aichi University of Education as an example, • 53 credits are allocated for subjects concerned with education as a profession, e.g.,
pedagogy, psychological counseling, subject education, and teaching practice; • 14 credits are allocated for subject-related courses for elementary school teachers; or • 30 or more credits are allocated for subject-related specialist education for lower
secondary school teachers, with 20 of the total credits for basic subjects, e.g., chemistry, earth science and physics, and 10 credits allocated for advanced subjects in specialist areas.
It is difficult to acquire the specialized education needed to become a teacher in the four years of undergraduate education. In-Service Training for Science Teachers Upon initial engagement as a teacher, there is a 60-day in-service training program in the first year. This program aims to enhance the basic qualities and abilities required by a teacher, with particular attention focused on study designed to supplement university education in such areas as teaching skills, basic research on teaching materials, and lesson plan preparation. Teachers are also required by law to undertake professional development after five and ten years of teaching experience. Teachers frequently make voluntary efforts to improve their abilities on a self-study basis. They take part in seminars organized by education centers, where experienced teachers provide guidance and instruction for young teachers. There are many cases of group study and training organized by teachers in a particular area. For example, when a research theme is set by a given school, some teachers within the school work to research and evaluate their own teaching. Textbook publishers and teachers’ unions also provide support for study and training. However, while elementary school teachers are very enthusiastic about self-study and research and have the time to do it, the same is not true of lower and upper secondary school teachers. Many are very involved in numerous voluntary activities such as after-school clubs or daily life guidance for students. Consequently they have little or no spare time available to undertake sufficient self-study and training. Recently, the Ministry of Education, Culture, Sports, Science, and Technology has promoted in-service training via university graduate schools, but this program has yet to be systematized.
69

SCIENCE EDUCATION RESEARCH There are approximately 100 science educators attached to universities or research institutes, about one-fifth the number of university staff dedicated to pre-service teacher training. As scientists, however, they are concerned with research into specialized areas such as biology, chemistry, physics, and so on, and have very little interest in science education. Around 2,000-3,000 teachers from elementary through upper secondary school undertake research in science education as members of an academic society, although the number of these who participate actively in national science education conventions is about 500. Most teachers do not belong to any academic society, but promote research conducted with the support of local schools and boards of education, where the presentation of their research results is limited to local educators. There are two national academic societies concerned with science education in Japan:
The Society of Japan Science Teaching – Founded 50 years ago, with members ranging from elementary school teachers to university staff. The Japan Society for Science Education - Primarily comprised of university staff or researchers, who conduct studies in science education, mathematics education, educational technology. or related fields. Both societies issue research bulletins three times a year, and convene on a national basis annually, with local meetings throughout the year. At the elementary and lower secondary school level, additional societies arrange open classes and carry out practice-oriented research on teaching methods and materials. At the upper secondary level, there are specific societies concerned with biology education, chemistry education, and earth science and physics education. Their membership includes upper secondary school teachers and university staff, and their research is focused on teaching materials. All these societies issue a research bulletin approximately once a year. Research by academic societies of teachers: • helps develop teaching materials • studies students’ understanding, perspectives, and interest in science • helps develop teaching plans and assess actual science instruction. TRENDS IN SCIENCE EDUCATION RESEARCH Thirty years ago, the greater part of research involved studying teaching materials at elementary, and lower and upper secondary school levels. Specifically, science research
70
studied demonstration lectures and experiments in order to develop experiments and life-size models that students could easily understand. Such research is quite commonplace today, as trends in science research increase in complexity. Research into students’ understanding of science, or improvements in teaching methods, is conducted mainly by university researchers or graduate students. Here is an overview of the trends: • European and American science education research has had a long history, and many
of its consequent programs and ideas have been introduced in Japan. Science education research has begun among ASEAN (Association of Southeast Asian Nations) countries, particularly with regard to studying the means to disseminate Japanese-style science education throughout ASEAN countries.
• During the past ten years, constructivist research, which investigates the perspectives or ways of thinking students acquire through their studies, has become quite popular.
• Environmental education is a contemporary topic, dealt with not only in science classes but also in periods for integrated study. It is of active interest to researchers, ranging from elementary school teachers to university staff.
• As computers have proliferated in schools, there has been a rapid upsurge in the development of digital content. The Ministry of Education, Culture, Sports, Science, and Technology has allocated a budget for the development of digital content for mathematics and science education.
• Curriculum research on the preparation of lesson plans in lower secondary schools or on curriculum development has become popular, but research concerning curriculum theory for science education is rare.
• Research into educational evaluation and assessment, as well as teaching methods, is actively carried on by elementary and lower secondary school teachers, within the context of practical science teaching in schools. A number of university researchers have conducted analyses of teaching methods based on video recordings, but research into the principles or philosophy of science education or teacher education is unusual.
• In recent years, the number of school hours allocated to science education has decreased, while there has been a simultaneous increase in science education via museums and other facilities. Attention has been focused on the possibilities of promoting science content in facilities outside school, and this topic has won attention as a research field.
• Research from a sociocultural perspective on the formation of science education has also attracted attention from a number of researchers.
71

RECOMMENDATIONS TO IMPROVE SCIENCE EDUCATION IN JAPAN • Qualitative improvement of science teaching methods, especially at the secondary
education level • Increasing use of computers, and the development of digital content to improve
science education • Development of science programs for students of high academic ability • Development of science learning programs outside schools (i.e., connections between
museums and schools) • Participation in science education by parents and society-at-large, including
improvements in the education of science teachers that connect them with arenas outside school
• Science education policy (e.g., deregulation in education, and the expansion of educational standards).
72

TECHNICAL AND TECHNOLOGY EDUCATION IN JAPAN: OVERVIEW AND RECENT ISSUES1
Kazuyoshi Natori, National Institute for Educational Policy Research, Japan
ABSTRACT
In his presentation, Kazuyoshi Natori provides a context for technology education within present day Japan. Technology has played and will continue to play a major role in Japanese society, and children’s attitudes toward technology are for the most party quite positive. However, to-date technology education in Japan has received comparatively little emphasis compared to other core subjects because the high school entrance exams do not test technological learning. Even so, new educational technology policies outlined in the 1998 Course of Study for Lower Secondary Schools and implemented beginning in 2002, provide a solid basis for comprehensive technology learning. The author describes in detail those policies here. INTRODUCTION Japan’s 1998 Course of Study for Lower Secondary Schools defines the specific objectives of technology/technical education2 as follows:
To enable children, by means of practical, hands-on activities, to acquire basic knowledge and skills concerned with making things and the use of energy as well as computer usage… to deepen their understanding of the role of technology, and cultivate the abilities and attitudes with which children can make appropriate use of what they have learned.
In Japanese public schools, technology education is not an independent subject. Technology education is integrated into life environment studies, science, and arts and crafts at the elementary level, and into information study and home economics at the upper secondary level. The most systematic treatment of technology occurs in the context of lower secondary school industrial arts / homemaking, which includes subsections on “Technology and Making Things,” and “Information and Computers.” Industrial arts / homemaking made its debut in the 1958 Courses of Study and became a firmly established part of the Japanese curriculum in the decades that followed. It emerged in response to the very rapid technological “revolution” that occurred on a global scale in the late 1950s, and played an important historical role in Japan by helping students understand the recent changes and future trends in daily life. As technology plays an ever-increasing role in Japanese society in the coming years, technology education will also continue to increase in importance. The challenge is to
1 Presented at Exploring Collaborations in Science and Mathematics Education, March 17-19, 2003, San Francisco. 2 Hereafter referred to as technology education
73

devise educational content that meets the pressing issues of the age in which we live. When industrial arts / homemaking was launched in 1958, the main items of electrical equipment in Japanese homes were the radio and incandescent lamp, and fewer than 50% of lower secondary school graduates went on to high school. In contrast, computers and a wide range of electrical goods are widely available today, and virtually all lower secondary students go on to attend high school. At a time when we face challenging social problems within Japanese society and globally, it is essential to think about the goals of technology education in ways that go beyond building skills and vocational capacity. We need to develop a Japanese workforce that can work effectively in the current social climate, and to prepare young people with the requisite skills to address the environmental issues that they and their children will face. Given recent reductions in both the number of hours students spend in school and the depth of course content, the time has come for educators to scrutinize closely the objectives and content within math, science, and technology (MST) education, and to become conscious of the important educational issues within these subject areas. CHILDREN’S PERCEPTIONS OF TECHNOLOGY EDUCATION Technology education has played an important role in the development of Japanese industry, particularly manufacturing. However, in recent years technology education has received relatively little attention in the classroom, as the emphasis has shifted to subjects needed for university entrance examinations. Despite the low priority given to technological training within the current school curriculum, we need to keep in mind the importance of technological learning for our future. Figure 1. Students’ Attitudes Toward Making Things: Results From 1999 Survey of
4260 Elementary, Lower-Secondary, and Upper-Secondary Students (Doi et al.)
As shown in Figure 1, Japanese students have a positive attitude toward making things. Despite the focus on examination-oriented education in contemporary Japanese society, elementary, lower-secondary, and upper secondary students all place a high value on learning to make things. Students’ evaluation of their technical-technology learning experiences decline somewhat with age: 73.6% of elementary students, 64.6% of lower
70.0%
19.3%
10.7%
74

secondary students, and 63.2% of upper secondary students positively evaluate their technology studies. To attain a high level of education, students must pass successive levels of examinations. The high school entrance exams do not test technological learning, so students have no forum in which to demonstrate their competency in this area. Hence, parents are not very interested in having their children take technological subjects. Technological Education Policies Two technology policies provide the context for current technology education. 1) THE BASIC PLAN FOR SCIENCE AND TECHNOLOGY (1996) This plan is designed:
to increase, in science and technology education, opportunities for familiarization with nature and for discovery-type and practical activities such as observations, experiments, practical work sessions and construction projects, and at the same time, by means of such initiatives as team teaching, to promote a form of teaching that enables children to display their individuality. Also, as well as providing increased opportunities for teachers to undertake study and research, positive efforts should be made to bring outside specialists into the school.
The plan also recommends that:
on the basis of criteria relating to facilities and equipment for industrial education, efforts should be made to install facilities and equipment aimed at promoting industrial education in upper secondary schools, and at the same time, to aim at the installation of facilities which can be used jointly by education and industry, and which are equipped with state of the art, sophisticated information equipment and technological devices.
2) THE BASIC PLAN FOR FUNDAMENTAL SKILLS IN MAKING THINGS (1999) This plan specifies that:
the Japanese Government should formulate policies which will help young people in particular and the Japanese people in general to use all kinds of opportunities to deepen their knowledge of, and interest in, the basic skills needed in making things, and at the same time, so that the mood of respect for the abilities related to these basic skills is cultivated in society generally, promote the learning of these skills in school education at elementary and secondary levels and in the framework of social education, and carry out programs designed to disseminate knowledge of basic skills as well as of their importance.
TECHNOLOGY EDUCATION IN THE CURRENT COURSES OF STUDY The current Course of Study for lower secondary schools was revised in 1998 and implemented beginning in April 2002. The general objectives in “Industrial Arts /Homemaking” are as follows:
To enable children, by acquiring the basic knowledge and skills needed for
75

everyday living, to deepen their understanding of how these skills and everyday living relate to each other, and to cultivate in children practical attitudes and abilities such that they will want to use ingenuity and creativity in their lives.
In order to cultivate human beings who respond on their own initiative to social change, schools are encouraged to have students: display independence in managing everyday life; display ingenuity; and to apply what they learn to real life situations. Figures 2–4 provide details of the technology content in the Courses of Study for Lower Secondary Schools. The standard number of teaching hours for industrial arts/ homemaking is 70 unit hours in lower secondary grade 1, 70 unit hours in lower secondary grade 2, and 35 unit hours in grade 3. Individual schools are responsible for deciding the specific time allocation for different items, and the grade at which required subjects should be studied. Items included in points 1 to 4 from both Technology and Making Things and Information and Computers are required for all students.
Figure 2. Content A: Technology and Making Things 1) Provide guidance and instruction respecting the following items concerned with the role of
technology in industry and everyday life: a) Think about the role played by technology in the development of industry and the raising
of living standards. b) Know about the relationship between technology on the one hand and the environment,
energy, and resources on the other. 2) Provide guidance and instruction respecting the following items concerned with the design of
manufactured objects: a) Think about the function and structure of manufactured items in terms of their purpose
and the conditions under which they are used. b) Know about the characteristics and methods of use of the materials used in manufactured
products. c) Know about methods of expression of underlying concepts of a manufactured product,
and be able to draw the plans and diagrams needed for the production process. 3) Provide guidance and instruction respecting the following items concerned with methods of
using tools and instruments used in manufacturing and the production techniques to which they are applied: a) Know about processing methods that are appropriate for the materials being used. b) Be able to use the tools and instruments in an appropriate manner, and be able to carry
out the processing, assembly, and finishing of the parts of manufactured products. 4) Provide guidance and instruction respecting the following items concerned with the
mechanism and ways of maintaining the equipment used in production: a) Know about the basic mechanisms of equipment. b) Be able to maintain the equipment and prevent accidents arising from its use.
5) Provide guidance and instruction respecting the following items concerning the design and production of manufactured items that use energy conversion: a) Know about the laws of energy conversion and the mechanism of power transmission,
and be able to design products that make use of these. b) Be able to assemble and adjust manufactured items, and assemble and check electrical
circuits. 6) Provide guidance and instruction respecting the following items concerned with the
cultivation of crops: a) Know about different kinds of crops and the process of growth, as well as about what
conditions are appropriate for cultivation. b) Be able to draw up a plan for crop cultivation and cultivate crops.
76

Figure 3. Content B: Information and Computers
1) Provide guidance and instruction respecting the following items concerned with the role of information devices in daily life and industry: a) Know about the relationship between computers, on the one hand, and the characteristics
of information devices in daily life. b) Know about the influence that the growth of information has had on society and daily life,
and think about the need for information morality. 2) Provide guidance and instruction respecting the following items concerned with the basic
structure and function of computers: a) Know about the basic structure and function of computers and be able to manipulate them. b) Know about the functions of software.
3) Provide guidance and instruction respecting the following items concerned with the use of computers: a) Know about the patterns of computer use. b) Be able to carry out basic processing, using software.
4) Provide guidance and instruction respecting the following items concerned with information communication networks: a) Know about the characteristics of information transmission methods and ways of using
them. b) Be able to assemble, evaluate, process, and transmit information.
5) Provide guidance and instruction respecting the following items concerned with the application of computer multimedia: a) Know the function of programs, and ways of using them. b) Be able to select software, and make use of it for purposes of expression and
communication. 6) Provide guidance and instruction respecting the following items concerned with programs and
with measurement and control: a) Know about the function of programs and be able to write simple programs. b) Using a computer, be able to implement simple measurement and control functions.
Figure 4. Methods For Content A and B
1) The content of Technology and Making Things should be dealt with as follows:
a) With regard to 1b, deal with the way in which the development of technology has contributed to the efficient use of energy and resources, and to the preservation of the environment.
b) With regard to 2, 3, and 4, take as examples mainly products that have used wood and/or metal in their manufacture. For 2c, deal with either an equiangular or cabinet diagram.
c) With regard to 4, deal with the basic electrical circuits of electrical items used in production, and with short circuits and electric shocks.
d) With regard to 6, deal in principle with standard items such as flowers and vegetables, but use can also be made of indoor cultivation, depending on existing conditions of school or area.
2). The content of Information and Computers should be dealt with as follows. a) With regard to 1a, deal in an easily understandable way with the development of
information devices, using everyday examples. With regard to 1b, using the Internet as an example, deal with the protection of personal information and copyright, as well as questions of responsibility in terms of transmitting information.
b) With regard to 3b, having regard to the actual situation of pupils, choose your examples from among text processing, database processing, spreadsheet processing, diagram processing, etc.
c) With regard to 4, deal with networks that use computers. d) With regard to 6b, do not go deeply into the mechanisms of the interface.
77

A new Period for Integrated Study has been established in the current Course of Study, in order to encourage a move away from distinct subject-based principles and toward a cross-disciplinary perspective that links different subject areas. Comprehensive knowledge and understanding is expected to be built through hands-on activities and learning that builds children’s initiative and capacities. Technological education is intrinsically concerned with both vocational and moral development, through its focus on making things. For this reason, it includes the ideal elements for consideration of the new integrated approach to learning. THE PROMOTION OF INFORMATION EDUCATION Information education in Japan, included in industrial arts/ homemaking in lower secondary school and in information study in upper secondary school, is a required subject for all students. At the elementary level, too, learning with the use of computers is encouraged in various subject areas. According to the Ministry of Education, Culture, Sports, Science, and Technology, 99.4% of all public lower secondary schools are connected to the Internet, and many schools have implemented teaching that makes use of the Internet. As of 2003, information study was established as a required subject in all upper secondary schools. The objectives are: • To enable the learning of the knowledge and skills needed to apply information and
information technology, and in this way cultivate a scientific approach and way of thinking in connection with information, at the same time, enabling children to understand the influence of…information and information technology in society.
• To equip them with attitudes and abilities…to respond, using their own initiative, to the development of an information-oriented society.
• Specifically, students must choose one subject from • Information A, which aims at the acquisition of basic abilities concerned with
assembling, processing, and transmitting information; • Information B, which aims at the acquisition of a scientific way of thinking and
scientific methods that can be applied to the efficient use of information; and • Information C, which aims at the acquisition of the abilities needed to make efficient
use of a computer for expression and communication. As teaching hours have been reduced for technology education centered on making things, information education has been increased, and is designed to facilitate a wide range of learning from elementary through upper secondary school. Information education is undeniably important as we move into a new age. However, there is also a vital need for comprehensive technology education that includes making things, if we are to support continued development of the manufacturing that is at the core of Japanese industry.
78
CURRENT ISSUES IN TECHNOLOGICAL EDUCATION The small number of hours currently allotted for students to make things in lower secondary schools leaves little time beyond that needed for their actual physical construction. Children have little chance to reflect, to try and solve problems for themselves, to add to their own ideas, or to extend their individuality and creativity. Instead, we are seeing an increase in the number of schools that depend on packaged teaching materials. In this sort of “canned” teaching environment, the opportunities for children to savor the fascination of technological creation is very limited. This trend has become more marked with each successive revision of the Courses of Study, as reflected in Figure 5. As shown in Figure 5, the 1998 lower secondary Course of Study allocates to Technology Education only 105 hours, or one-third of the time allocated to technical studies in the 1958 Courses of Study. This time reduction strikes a severe blow to the content of technology education. Good technology education includes a number of facets, including attention to the scientific basis and practice of production, the practical activities, and the preparation and management of activities; it is quite different from simply imparting knowledge in a classroom, and very difficult to do.
79

Figure 5. Change in Content and Required Hours for Industrial Arts/ Homemaking in Lower Secondary School 1958 START;
1965 REVISION 1969 REVISION
1977 REVISION
1989 REVISION
GENDER Boys Girls Boys Girl Co- Educational
Gender Divided
Co-Educational
Homemaking Homemaking COURSE OF STUDY
Industrial Arts
Homemaking Industrial Arts
Homemaking
Industrial Arts Industrial Arts
Technology and Homemaking
HOURS (Note 1)
Grade 1 to 3: 105 hrs per grade. Total 315 hrs.
Grade 1 to 3: 105 hrs per grade. Total 315 hrs.
Grade 1 to 3: 105 hrs per grade. Total 315 hrs.
Grade 1 to 3: 105 hrs per grade. Total 315 hrs.
Grade 1 and 2: 35 hrs each course per grade. Total 140 hrs.
Grade 3: 105 hrs per course. Total: 210 hrs.
Grade 1 and 2: 70 hrs per grade. Grade 3:70~105hrs. Total: 210~245 Note
CONTENT(INDUSTRIAL ARTS OR TECHNOLOGY)
Design/drafting (1) Wood processing/Metal processing (1) Cultivation (1) Design/drafting (2) Wood processing/Metal processing (2) Machinery (2) Machinery (3) Electricity (3) Integrated practice (3)
Drafting (1) Wood processing (1) Metal processing (1) Wood processing (2) Metal processing (2) Machinery (2) Electricity (3) Machinery (3) Electricity (3) Cultivation (3)
Wood processing I (1) Wood processing II (1 or 2) Metal processing I (1 or 2) Metal processing II (2) Machinery I (2) Machinery II (3) Electricity I (2 or 3) Electricity II (3) Cultivation (2 or 3)
Wood processing I (1) Electricity (2) Metal processing Machinery Cultivation Information Basics
CHANGES Same number of hours for boys and girls educated separately. Surface total: 630 hrs.
Toward co-education, 20-35 hrs out of total 245 hrs. Actual hrs for technology side: 210 - 225 hrs.
Grades 1 and 2 co-ed (Grade 1: timber processing, Grade 2: electricity – both required items). Surface total 245 hrs, but in practice 175 hrs. Hardening of content due to time reduction.
All students required to take wood processing and electricity from the technology area and homemaking and food from the homemaking division. 3 electives from technology area (metal processing, machinery cultivation, information basics) or homemaking area (clothing, home, childcare). For each area, 20-30 hours instead of 35 hours.
Note 1. 1 unit hour is 50 minutes Note 2. Combined time of technology and homemaking. 35 hours for grades 1 & 2, elective for grade 3. Consequently total hours for whole technology area is 140-175 hours. In practice, generally 140 hours. Co-Educational, Technology and Homemaking, Grade 1 and 2: 70 hrs per grade. Grade 3:35hrs. Total:105, Technology and Making Things, Information and Computers 70 hrs each for Grades 1 and 2. Technical side subjects divided into “Technology and making things” and “Information and computers”. Actual total: 105 hrs, one-third of 1958 total.
80

In an international comparison, as Figure 6 shows, Japan is clearly lagging behind other countries in the number of teaching hours allocated to technology education. Figure 6. 9-Country Comparison of Technology Education Within General Education.
Grade Country
1 2 3 4 5 6 7 8 9 10 11 12
Notes (Subject name)
U.K.
Technology
France
Technology others
Sweden
Sloyd Studies Technical Studies
U.S.A.
Wide variation by state
Germany
Wide variation by “Land”
Russia
Technology
Taiwan
Daily life technology and others
S. Korea
Practical Studies, Technical/ Industrial Studies, Technology and others
Japan
Technology /Homemaking from 2002
Required
Required to choose from a number of options
Elective
Merged with other subject(s) and implemented
What is the proper relationship between science education and technology education, as we move into a new century and a new era? How do we realize the important educational content of each? Just what form should a new (perhaps combined) subject take? With regard to science, which is concerned with understanding nature and natural phenomena, knowledge acquisition is the primary classroom activity in Japan. Given this emphasis, it is unlikely that simply increasing the number of hours allocated to science will solve the problem of the “drift away from science.” In the current curriculum, the lack of technical activities (concrete, production-type activities) is a key problem. Technology education, because it is concerned with exerting an effect on nature or natural resources for a specific purpose and bringing about change through one’s own initiative, provides an effective means for promoting children’s cognitive
81
development and their character. A child is far more likely to be moved, interested, and excited by actually making a cogwheel and accomplishing an objective in the context of practical work than learning about it in the abstract. Technology is a practical, hands-on approach that can open the door to science, and it is important that we recognize technology education’s role as a means to this end.
82
HOW JAPANESE EXPERT TEACHERS EVALUATE SCIENCE LESSONS: DEVELOPMENT AND TESTING OF A FRAMEWORK1
Yasushi Ogura National Institute for Educational Policy Research
Tokyo, Japan
ABSTRACT
Since the mid-1990s, Japanese researchers have been studying the common features of lessons by “expert” Japanese science teachers in an effort to establish a framework that describes superior science teaching. It is thought such a framework will help in the training of science teachers by guiding their self-development, and will provide a basis to assess their levels of expertise. It may also shed light on the discrepancy between Japanese students’ achievement in the cognitive versus the affective domains. This paper describes in detail the initial study that led to the development of this framework, and then looks at three subsequent studies that helped to test and refine it. It concludes with suggestions for further research, including the need to take a cross-cultural approach to expanding what is known about science teaching expertise. BACKGROUND In the 1980s, many cognitive science studies focused on the differences between novices and experts in disciplines as diverse as physics problem solving, computer programming, and medical diagnosis. Research on expertise concludes that “expert problem solvers must acquire a great deal of domain-specific knowledge, a feat that requires many years of intensive experience” (Mayer, 1992, p. 390). Berliner (1986) outlined the process of teachers’ development from novice to expert. However, teaching expertise differs from expertise in scientific problem solving. In teaching, there is not just one way to attain a goal; there are multiple approaches and answers. Expert teachers differ from one another in teaching methods. Expertise in teaching is multi-dimensional, and each teacher develops his or her own pattern. An investigation of 46 nominated science teachers from seven U.S. states documented multiple dimensions of expertise and indicated that few teachers are expert in all of the dimensions (Burry-Stock, 1993). For example, the majority of “expert” science teachers nominated to the study were not constructivist science teachers. A detailed picture of the multidimensional structure of science teaching expertise would be useful in the education of science teachers, by giving teachers a framework to guide self-development and providing a basis to assess their levels of expertise. A detailed
1 Presented at Exploring Collaborations in Science and Mathematics Education, March 17-19, 2003, San Francisco.
83
framework could also, for example, illuminate causes of the comparatively low success of Japanese science education in the affective domain, compared with its higher success in the cognitive domain (see TIMSS, Beaton et al., 1996; and SISS, Keeves et al., 1992) and suggest alternative effective methods of teaching. DEVELOPMENT OF FRAMEWORK TO EVALUATE SCIENCE TEACHING In 1995, a National Institute for Educational Policy Research (NIER) team conducted a study to identify the common features of lessons by “good” Japanese science teachers, and to establish a framework for describing expert science teaching in Japan (Sawada, 1996). “Good” science teachers were identified on the basis of their students’ understanding and liking for the subject. Using a questionnaire, five science teachers were selected from among twenty-six local elementary and lower secondary schools in six prefectures, as science teachers whose students demonstrated higher levels of understanding and liking of science than other teachers’ students. As the head of the research team, I videotaped five science lessons by each of the five selected teachers. Previous methods of video analysis were inadequate, so a new method of analysis was developed. The challenge in the methodology of this study was to extract a pattern from each lesson video, and to integrate multiple patterns into a whole structure that represents science teaching expertise. The original method created for this purpose is described in Table 1 below. It is based on the “KJ” method (invented by Dr. Jiro Kawakita; Kawakita, 1967), which is popular in Japan as a heuristic method, and is based on the assumption of expertise. That is to say, the methodology assumes that expert teachers know more about teaching than novices do. Literature (see Mayer, 1992) supports this assumption. So the person who analyzes the video lesson should be an expert, not a novice, in the content area that the video addresses. But experts differ in their views. Therefore, I chose to use many expert science teachers to analyze the science lesson videos, and to collect different views so as to build a whole set of views. Ten Japanese experts in science teaching participated in the video analysis. They included an experienced teacher, a teacher trainer under a local educational board, college professors of teacher education, and researchers at NIER. Each expert was asked to view two or three lesson videos and fill out evaluation cards (about 30 were included with each video). The task was to fill out the cards while watching the lesson video, noting “good teaching points” or “not good teaching points,” with as many specific comments as possible. Then these experts met in groups of five, all of whom had watched the same video, with their completed evaluation cards in hand.
84

Figure 1. Example of “Evaluation Card.” Evaluation Card Entry
1. Evaluation ( + - ) Card No. SJP021-06-02 2. Time 1 min 10 sec 3. Evaluation code I-4 4. Comment: Confirmation of previous lesson, to establish that
content has been understood.
The “KJ” method of evaluation can be used to integrate different ideas and find a large structure for a given topic. Applying this method produced a hierarchical structure of each expert group’s teaching evaluation, for each lesson video, in the following way: 1) Experts explained their own cards and classified them into small groups, grouping
related ideas. 2) Each small group of cards was named to represent its core set of ideas. 3) Medium-size groups were then made from the small groups, and named according to
relations among the ideas. 4) Large groups were made from the medium groups, and named according to relations
among the ideas. 5) The whole structure was mapped. I integrated the results of the five science lesson evaluations into one whole structure, to construct a general framework called the “Expert Teachers’ Science Teaching Evaluation Framework,” since it reflects multiple experts’ evaluation viewpoints. Forty-five small groups of evaluation viewpoints were derived from the video analyses. These small groups were incorporated into medium and large groups, as shown in Table 1. The resulting constructs identified points throughout the lesson video that contributed positively or negatively to the lesson’s success. It is important to note that this science teaching evaluation framework was not theoretically deduced, but derived from ten experts’ subjective views on five science lesson videos. It was developed as a working model, to be revised in practice.
85

Table 1. Japanese Science Experts’ Framework to Evaluate Science Teaching
I. Is what is to be learned apparent? I-A Is the theme of the learning apparent?
I-A-1 Clarity of today’s lesson theme I-A-2 Proficiency in establish the theme I-A-3 Clarity of the purpose of experiment I-A-4 Summary of the lesson, introduction of succeeding theme
I-B Is the method to be learned apparent? I-B-1 Appropriate direction for preparing and conducting an experiment I-B-2 Confirmation of the method of experiment I-B-3 Direction of how to learn
I-C Is the relation to the previous learning apparent? I-C-1 Review of previous lesson I-C-2 Checking basic knowledge
II. Are effective teaching techniques used?
II-A Is the mode of teaching effective? II-A-1 Effective student experiment II-A-2 Effective teacher demonstration II-A-3 Experiment in small size groups II-A-4 Use of blackboard II-A-5 Use of worksheet and/or student notes II-A-6 Use of audio-visual equipment II-A-7 Use of other teaching aids
II-B Is the blackboard used effectively? II-B-1 Effective letters on blackboard II-B-2 Effective writing on blackboard in student presentation or summarizing II-B-3 Effective drawing on the blackboard II-B-4 Consideration of students when using blackboard
II-C Is the time effectively used? II-C-1 Effective use of free time II-C-2 Quick action for saving time
II-D Is assessment of student learning appropriate? II-D-1 Assessment of student learning status (for teaching) II-D-2 Evaluation of students learning status (for grading)
III. Is there any effort activate student learning?
III-A Is there any effort to stimulate student thinking? III-A-1 Advising student or group by walking around the room III-A-2 Noticing evaluation of student ideas III-A-3 Confirmation of student ideas III-A-4 Consideration of student ideas III-A-5 Skills for promoting student concentration III-A-6 Supports for student consideration III-A-7 Supports for scientific thinking
III-B Is there any support for student creativity? III-B-1 Conducting experiment based on student ideas III-B-2 Respect for questions or skepticism III-B-3 Encouragement of new ideas III-B-4 Supports for student independence III-B-5 Interactions among students
III-C Is there enough time for student learning? III-C-1 Adequate time for experimenting III-C-2 Adequate time for thinking
86

III-C-3 Adequate time for summarizing III-C-4 Adequate time for discussing
IV. Is the situation for learning appropriate?
IV-A Is the teacher-student relationship trustful? IV-A-1 Intimacy between student and teacher, among students IV-A-2 Heartfelt teacher talking IV-A-3 Humane teacher expressions (appearance)
IV-B Is the physical environment for science learning good? IV-B-1 Effective physical environment in laboratory room IV-B-2 Effective physical environment out of laboratory room
TESTING AND REVISION OF THE EVALUATION FRAMEWORK The framework to evaluate science teaching was tested and revised over the course of four studies, summarized in Table 2. In Study 1, the teaching evaluation framework was introduced in pre-service and in-service teacher training courses, for the purpose of assessing and enhancing participants’ teaching evaluation skills. Participants watched and evaluated science lesson videos using the following basic procedure (Ogura, 1997): 1) Each participant receives about 30 blank index cards. 2) Directions are given by an investigator: “If you feel that this is a ‘good teaching
point’ or ‘not a good teaching point’ while watching the video, write down what is or is not good teaching on a separate card, one card per point, being as specific as you can. At the same time, check (+) or (-) on the card, according to your positive or negative opinion.”
3) A lesson video is shown, after which some minutes are given to complete the evaluation.
4) A coded list of the forty-five groups of evaluation points is given 5) Participants are asked to code each of their cards. If no appropriate code exists, it may
be left blank. 6) Cards from all participants are classified by code. 7) Participants learn and understand the opinions expressed by other participants, and
discuss the similarities and differences of opinion between participants. Table 2 summarizes data from two pre-service teacher-training courses (at Utsunomiya University) and an in-service session (Shizuoka prefecture, 14 teachers with an average 15.9 years experience, mainly from the lower secondary school level). The mean number of cards completed by the practicing teachers was 14.6, considerably greater than the number for pre-service students (7.1 for undergraduate and 8.1 for graduate students). The 14 experienced teachers used a total of 38 different codes, suggesting they viewed the lesson from a wider perspective than did graduate and undergraduate students.
There were also many differences in the codes selected by practicing teachers as compared to students. The nine codes that appeared strictly in practicing teachers’ cards were: confirmation of the method of experiment (I-B-2); use of worksheet and/or student notes (II-A-5); evaluation of students’ learning status (for grading; II-D-2); noticing
87

evaluation of student ideas (III-A-2); supports for scientific thinking (III-A-7); interactions among students (III-B-5); adequate time for thinking (III-C-2); humane teacher expressions (IV-A-3); and effective physical environment in laboratory room (IV-B-1). For inexperienced teachers or students, these viewpoints seem to be relatively difficult to recognize as important in an actual teaching situation. On the other hand, there were two codes that students identified which the teachers did not, namely, review of the previous lesson (II-C-1) and adequate time for discussion (III-C-4). In each session, the participants explained the views noted on their cards and discussed similarities and differences among participants. They recognized that each participant has a limited view of science teaching, that other participants hold different views, and that interaction among session participants can extend individual views. Analysis of participant interaction also reveals different or alternative evaluations of teaching. By discussing negative and positive views of the same situation, understanding of teaching can be deepened. The experienced teachers pointed out the following methodological problems in the evaluation task: 1) Viewers need to see the lesson objectives and the teacher’s lesson plan before
watching the lesson video, in order to properly evaluate teaching effectiveness.
2) One lesson alone cannot provide a broad enough perspective of the teaching situation. In some cases, information on previously covered material and the role of the lesson within the unit of study are needed, as well.
3) Teachers want to see the students in the classroom as well as the teacher. Teacher-student interaction is important when judging teaching effectiveness.
88
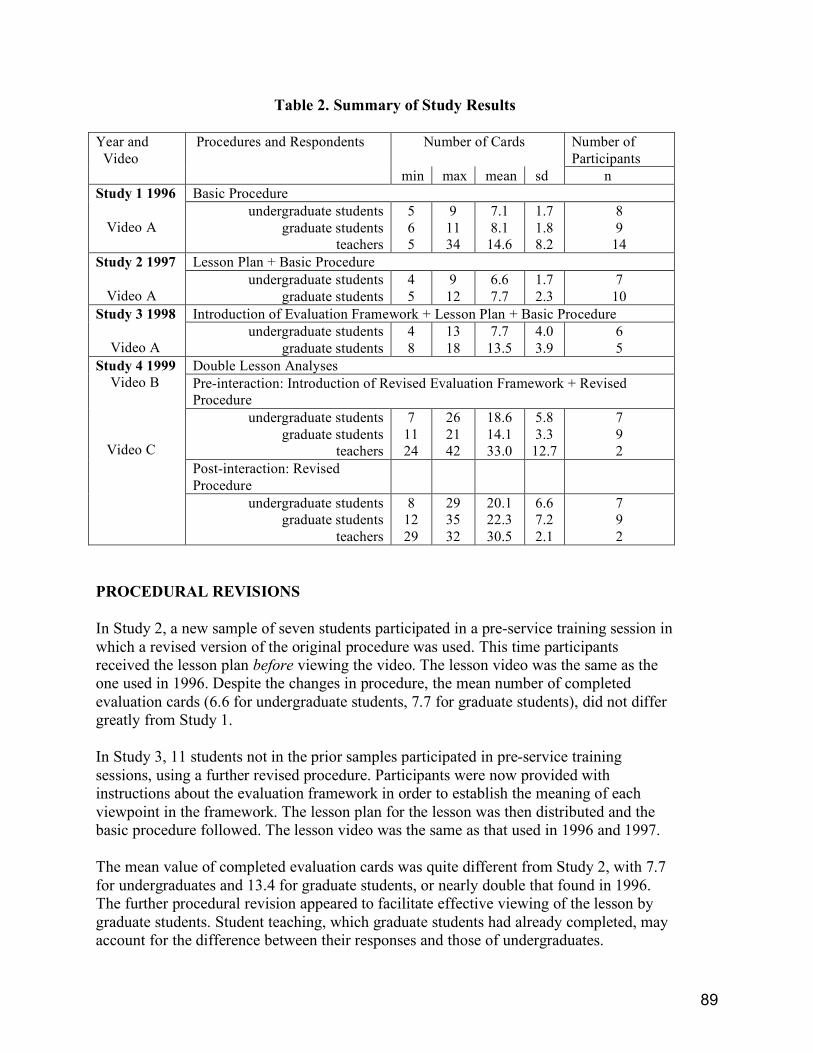
Table 2. Summary of Study Results
Number of Cards Number of Participants
Year and Video
Procedures and Respondents
min max mean sd n Basic Procedure Study 1 1996
Video A
undergraduate students graduate students
teachers
5 6 5
9 11 34
7.1 8.1
14.6
1.7 1.8 8.2
8 9
14 Lesson Plan + Basic Procedure Study 2 1997
Video A
undergraduate students graduate students
4 5
9 12
6.6 7.7
1.7 2.3
7 10
Introduction of Evaluation Framework + Lesson Plan + Basic Procedure Study 3 1998 Video A
undergraduate students graduate students
4 8
13 18
7.7 13.5
4.0 3.9
6 5
Double Lesson Analyses Pre-interaction: Introduction of Revised Evaluation Framework + Revised Procedure
undergraduate students graduate students
teachers
7 11 24
26 21 42
18.6 14.1 33.0
5.8 3.3 12.7
7 9 2
Post-interaction: Revised Procedure
Study 4 1999 Video B Video C
undergraduate students graduate students
teachers
8 12 29
29 35 32
20.1 22.3 30.5
6.6 7.2 2.1
7 9 2
PROCEDURAL REVISIONS In Study 2, a new sample of seven students participated in a pre-service training session in which a revised version of the original procedure was used. This time participants received the lesson plan before viewing the video. The lesson video was the same as the one used in 1996. Despite the changes in procedure, the mean number of completed evaluation cards (6.6 for undergraduate students, 7.7 for graduate students), did not differ greatly from Study 1. In Study 3, 11 students not in the prior samples participated in pre-service training sessions, using a further revised procedure. Participants were now provided with instructions about the evaluation framework in order to establish the meaning of each viewpoint in the framework. The lesson plan for the lesson was then distributed and the basic procedure followed. The lesson video was the same as that used in 1996 and 1997. The mean value of completed evaluation cards was quite different from Study 2, with 7.7 for undergraduates and 13.4 for graduate students, or nearly double that found in 1996. The further procedural revision appeared to facilitate effective viewing of the lesson by graduate students. Student teaching, which graduate students had already completed, may account for the difference between their responses and those of undergraduates.
89
EVALUATION FRAMEWORK REVISION Studies 1–3 suggested that 45 categories were too many for efficient use and that the 12 middle level categories did not successfully capture the content. In 1999, a group of 12 science teaching experts revised the framework. The 45 small group codes were removed from the list, and the 12 middle-level groups of the framework were restructured into 13 groups. The new list of 13 groups was further refined during in-service training sessions with teachers from Gifu and Tochigi prefectures, to clarify explanations of each category. Table 3 shows the revised science teaching evaluation framework. It has the same four large categories as the previous iteration: design of teaching content, teaching technique, student learning, and learning situation. In this framework, each of the 13 categories includes an explanation with examples.
90

Table 3. Framework to Evaluate Science Teaching (Revised in 1999) Categories Code I Design of Teaching Content 1. Was the learning task apparent? ---------------------------------- I-1
Task presentation needed by learners, making the task clear in introduction and summary, providing information laying groundwork for next lesson, etc.
2. Was the treatment of content well-planned? ---------------------------------- I-2 Devising lecture, observation and experiment for effective treatment of
content. 3. Was the learning method directed appropriately? --------------------------- I-3 Preparing and conducting observation or experiment, directing
learning method in groups and in individuals, etc. 4. Was the previous learning reinforced? --------------------------------------- I-4 Review of previous lessons, confirmation of basic knowledge and skills.
II Teaching Techniques 1. Was the lesson mode effective? ------------------------------------------- II-1
Effective lesson modes in observation, experiment and group learning, effective use of time, etc.
2. Were the teaching materials, aids and media effective? ------------------- II-2 Effective materials in observation and experiment, worksheet and
note, use of blackboard, audio visual aid and computer, voice, etc. 3. Did the teacher grasp students’ conditions of learning? ------------------ II-3 Accurate grasp of individual student or group learning situation, advice and support according to the situation. III Facilitation of Student Activities and Thinking 1. Did the teacher facilitate student thinking? ------------------------------ III-1
Device for having students present ideas and concentrate, and taking student ideas into account, device for facilitating scientific thinking, consideration and scientific attitudes, etc.
2. Did the teacher facilitate student independence or originality? ---------- III-2 Respect for having questions and predictions, facilitating
independence, original ideas, and interaction between students, etc. 3. Did the teacher secure enough time for students to learn? --------------- III-3 Enough time for experiment, thinking, summarizing, discussing, presenting, etc. IV Construction of A Good Learning Situation Through Daily Practices 1. Has the rapport been built among the teacher and students? -------------- III-1
Familiar relationship between teacher and student, and between students, teacher’s humanistic talks, cares and expressions, etc.
2. Has the class been developed as a learning community? ------------------- III-2 Attitudes for learning, developing student roles or responsibility,
positive and cooperative atmosphere for learning, etc. 3. Has the environment been maintained well for science learning? --------- III-3 Device of environmental maintenance in and out of laboratory room
91

STUDY 4: FURTHER PROCEDURAL REVISIONS In Study 4, a new sample of 18 students and 2 teachers (each with over 20 years of experience) analyzed two lesson videos taken from the TIMSS-R Video Study, accompanied by supplemental data. Before watching the first lesson video, the revised framework for evaluation of science teaching was explained to participants so that they would thoroughly understand the 13 categories. Participants then watched the first lesson video and analyzed and discussed it according to the revised procedure described earlier. After discussion, the participants watched and analyzed the second lesson video, following the same procedure. Results are shown in Table 2. The mean number of evaluation cards completed for the first video was 18.6 for undergraduates, 14.1 for graduate students, and 33.0 for teachers. For the second video, the mean number completed rose to 20.1 for undergraduates, 22.3 for graduate students, and 30.5 for teachers. Especially for undergraduate students, the procedure used in this study appeared to expand their views on science teaching. (The video used in Study 4 also differed from prior studies.) Graduate students showed a big increase in the number of evaluation cards completed after interaction. Qualitative improvements as a result of post-lesson video interaction have yet to be analyzed. The two experienced teachers created a large number of cards both before and after interaction. They had broader views on science teaching than the students did. CONCLUSIONS Over the five years during which this framework for Japanese expert teachers’ science teaching evaluation has been investigated, developed, and refined, science lesson videos have been used in many ways to facilitate teacher training, and the framework for evaluation of science teaching has been introduced in teacher training sessions and tested. Table 2 shows improvement of the method over the years of the study with respect to its capacity to elicit critical views of science teaching. Presumably the framework and procedure achieved through this study could be applied to the assessment of a teacher’s level of science teaching expertise, although the validity of such a presumption is untested, and the question remains how to represent “expertness” in science teaching in the existing framework. This is a task for future studies. The question of reliability is also problematic, since there is more than one way to be an expert science teacher, and experts differ from one another in their responses to the lesson videos. However, based on responses to a lesson video, we can deduce each science teaching expert’s construction of science teaching that has been built over years of professional experience in the classroom. The multi-dimensional framework developed through the course of this study represents the constructs created thus far. Science teaching novices can use this framework to guide the expansion of their views about teaching science. However, a qualification should be noted, in that this framework was developed from the responses of Japanese teaching experts. The answers would not necessarily be the same
92

among educators in other countries. A cross-cultural approach is called for, in order to learn about the cultural biases in science teaching expertise, and this is another task for future collaborative research. REFERENCES Beaton, A. E., Martin, M. O., Mullis, I. V. S., Gonzalex, E. J., Smith, T.A. & Kelly, D.L.
(1996). Science achievement in the middle school years: IEA’s third international mathematics and science study. Boston College: Chestnut Hill, MA.
Berliner, D. C. (1986). In pursuit of expert pedagogue. Educational Research, 15(7), pp.5-13. Burry-Stock, J. A. and Oxford, R. L. (1993) Expert science teaching educational evaluation
model (ESTEEM) for measuring excellence in science teaching for professional development. ERIC document (ED 366633),
Kawakita, J. (1967). Hassoho (In Japanese). Tokyo: Chuo-koron. Keeves, J. P. (Ed.) (1992) The IEA study of science III: Changes in science education and
achievement: 1970 to 1984. Pergamon Press: Oxford, England. Mayer, R. E. (1992). Thinking, problem solving, cognition (2nd edition). W. H Freeman and
Company: New York. National Institute for Educational Research (NIER). (2000) International meeting on
videotaped science lesson analysis. February 14-18, 2000. Research Project Report # 11694044.
Ogura, Y. (1997). Rika, girai no kaizen wo mezashita jyugyo bunsekiho no kaihatsu to sono kyoshi kyoiku eno tekiya, in Sawada T. (Ed.) Sugaku, rika no kyoshi kyoiku no kaihatsu ni kansuru kenkyu (in Japanese). National Institute for Education Research, study report of agran-in-aid scientific research of the Ministry of Education, Sports and Culture, project #: 05401023.
Sawada, T. (Ed.) (1996). Sansu, sugaku, rika jyugyo no bunseki kenkyu (in Japanese). National Institute for Education Research, study report of agran-in-aid scientific research of the Ministry of Education, Sports and Culture, project #: 05401023.
93

APPENDIX A: REVISED PROCEDURE FOR LESSON VIDEO ANALYSIS 1. Read through the printed materials.
Read through the printed materials including a copy of the teacher questionnaire and other (lesson plan, copy of textbook, worksheet used, copy of other reference materials, if given), then understand the outline of the lesson
2. Fill in the Evaluation Card while watching the video. While watching the lesson video, write on a separate Evaluation Card every time you notice something positive or negative in the teacher’s teaching in the following manner:
(1) Circle “+” for positive evaluation or “–“ for negative evaluation when you fill out the Evaluation Card.
(2) Write down the time of your evaluation, using the video time code. If there was not a specific time for the evaluation, leave it blank.
(3) Describe your evaluation in the Comments Section. (4) Write as many cards as possible. (Do not make exactly the same card.)
3. Put a code on each Evaluation Card (after watching the video).
Select the most appropriate code from the 13 codes in the Framework to Evaluate Science Teaching and write it on the Evaluation Card. If two or more categories overlap, use multiple codes. If there is no appropriate code, leave it blank.
Evaluation Card Entry
1. Evaluation ( + - ) Card No. SJP021-06-02 2. Time 1 min 10 sec 3. Evaluation code I-4 4. Comment Confirmation of previous lesson, to establish that content has been understood. ____________
The video number, evaluator number, and card series number (up to 50) are pre-printed on the card.
94

SCIENCE EDUCATION PROMISING AREAS OF U.S.-JAPAN COLLABORATION1
DISCUSSION
David Henry Feldman, Tufts University
Marcia Linn, University of California, Berkeley Hayashi Nakayama, University of Miyazaki, Japan
Yasushi Ogura, National Institute of Educational Research. Japan Susan Sclafani, U.S. Department of Education∗
Nancy Songer, University of Michigan Daniel Teague, North Carolina School for Science and Mathematics
Atsushi Yoshida, Aichi University of Education, Japan
ACCELERATED SCIENCE EDUCATION FOR TALENTED STUDENTS Daniel Teague: What is the purpose of the new Japanese “super science high schools,” and how do they differ from regular high schools? Atsushi Yoshida: Compulsory education in Japan (through lower secondary) is very uniform across settings. Upper secondary schools differ. The very high-level upper secondary schools require a considerable knowledge base and ability, and these schools go well beyond the textbook. Only students from high-level upper secondary schools will enter the elite Japanese universities, like Tokyo University or Kyoto University, which require more knowledge and higher achievement for admission. In general, Japan has a very centralized curriculum. Individual teachers may prepare more advanced content, beyond the Course of Study, for students who require it, but this does not occur in a standardized fashion. Advanced content standards for talented students are needed. Some private high schools have created a good system, but public schools are more limited in this regard. For example, supplemental schooling (juku) is well-developed in some regions but not universally. I believe there are also many good programs for talented students available in the United States. Diverse approaches should be developed, in order to create a system that successfully educates talented students.
1 Presented at Exploring Collaborations in Science and Mathematics Education, March 17-19, 2003, San Francisco. ∗ Now at Chartwell Education Group.
95

Marcia Linn: U.S. educators are grappling with the question of whether to intensify the content provided to talented students, or enable them to apprentice in research projects. There are schools that have emphasized each of these opportunities, but probably a combination of both makes the most sense. At least in the U.S., students become discouraged when they find that the content keeps coming and coming, which results in their continually having to wait to engage in research. In the Engineering College at Berkeley, we’ve introduced freshman design projects for engineering students, although we’re not yet sure of the consequences. So far, after one year, we appear to have a higher retention rate, especially among under-represented students in engineering. Frequently students refer to these opportunities as a major factor in their decision to persist in the field. So this seems to be a meaningful line of applied research that perhaps Japanese and U.S. researchers could pursue jointly. TEACHER EDUCATION Susan Sclafani: Regarding the question of preparing teachers to be effective in their particular teaching context, should new elementary and middle school teachers begin with a fairly high-level understanding of mathematics and science so that they are able to work collaboratively and teach at a higher level, or does this occur naturally as part of in-service education? What did you do as researchers to prepare elementary and middle school teachers to respond to the new teaching strategies you introduced, which required a more complex understanding of mathematics and science to ensure that the students were brought to a higher level? Atsushi Yoshida: Teacher education is a critical means to improve the education system as a whole. The qualifications of teachers in Japan are high, enabling them to collaborate with their colleagues and develop their own ideas. But, as in the U.S., elementary school teachers teach all subjects. So there are many teachers who do not understand basic science or have a scientific education. To promote a more advanced or higher level of science education, elementary school teachers must themselves learn more. Junior and senior high school teachers in Japan have a high level of science knowledge and ability, since they are specialists. Junior high school teachers are able to develop their own approaches, but I suspect that senior high school teachers are focused on pushing knowledge (to help students succeed at university entrance exams). I believe that junior and senior high school teachers should share ideas with each other, as happens in the United States where there are cooperative systems in place. In Japan, formal in-service training in science is organized by the Board of Education, and often each school also has its own research objectives and projects. The Ministry of Education sponsors in-service training on occasion, too, so there are many kinds of in-service training in Japan, and the system works well. With my colleagues, I visit elementary schools to observe research lessons and interact with teachers who are improving their science instruction. This is a worthwhile practice. The kinds of science workshops I have seen at junior high and senior high schools in the U.S. are less common in Japan, but would also be useful there.
96

Nancy Songer: A key issue in U.S. science education today is how to prepare teachers to champion the methods of science learning researchers advocate, when teachers haven’t necessarily learned such methods themselves. In our programs (for example, http://www.biokids.umich.edu/) we have a long-term, multi-year relationship with teachers. Every summer there are in-depth workshops for all the teachers who are participating in the programs the following academic year. We bring in scientists from our research team, and have them conduct sections of the workshop where teachers get firsthand opportunities to work with science content from the upcoming curriculum, to ask their own questions of the scientists prior to guiding children through these learning experiences. Then throughout the academic year we hold teacher workshops once a month on Saturdays to continue this learning process and to give teachers the opportunity to work with a wider range of activities than they could during the summer workshops. This in-service approach affords teachers ongoing opportunities to share teaching methods and activities and discuss why they are or are not working. These activities remind me of the lesson study activities I observed when I was in Japan in 1996. The U.S. is working on this, although we still don’t have the widespread opportunity for teachers to learn from colleagues as an integral part of their teacher preparation or teacher in-service programs. Marcia Linn: One of the interesting things we’ve done in the Web-based Inquiry Science Environment (“WISE”; http://wise.berkeley.edu) is to contrast the teachers who participate with us in an active professional development program with those teachers whom we let choose how much professional development they want. In the beginning, many of the teachers put too much trust in the technology. They didn’t really interact with the students and weren’t quite sure what was going on. We had one teacher say, “My students are arguing about genetically modified foods, and I really didn’t understand that was going to happen as a result of your bringing this unit in here. I’m not sure what to do.” We took this as an opportunity to say, “Well, you could join the online conversation your students are having. They are searching the Internet and bringing in new resources that you’re not familiar with, but all those get recorded in the pointer section, so you could look at them, too.” And that was a good opportunity; the teacher was quite excited to pursue it. We’ve also found that customization of the web-based science environment is a difficult challenge. Some teachers make wonderful, evidence-based customizations. But others, in the heat of the moment or because five assemblies suddenly got added to the schedule, cut the curriculum back, just eliminate things randomly because they don’t have the time to cover it. One of the great things about the assessments we use is that teachers get to learn the consequences of making these random modifications to the curriculum. For example, in one school where we worked with three teachers, two of them followed the curriculum fully while one eliminated material due to time constraints. This was the teacher of the gifted class, and she was horrified to discover that the gifted students did far worse on the outcome measure than the
97
traditional students. That was gratifying to us as researchers, because the outcome proved that students need to learn from the materials, not just be present in the classroom. But it was also helpful to the teachers, who in the future would be more likely to consider carefully the possible consequences of any customizations they made to the curriculum. Customization, teaching for inquiry, and being critical of science source material is the backbone of our approach. Many teachers were shocked at the thought of debating in science class, having students reveal potentially inaccurate information, or dealing with epistemological issues. These were all dramatic departures from teaching primarily from the textbook. We’ve found a mentoring approach is the most appropriate way to get whole schools to convert to an inquiry model of science instruction. Typically, what we’ve done is to bring in a mentor teacher who has experience using this method. This teacher works with the school—intensively during the first year, on an as-needed basis the second year, and on an on-call basis the third year. This approach has worked well in many of the schools that we work with, because, over time the teachers become resources for each other. As you saw in my example, teachers Gilbert and Sandra both made tremendous progress in understanding malaria from year one to year two. The materials are rich and complex; and there are many more resources in the activity than are necessary to teach the material, so the teachers can learn from those as well. This is a big time sink, however, and not all teachers have this kind of time or feel that it’s part of their professional work. Ultimately we need to provide the opportunity for teachers to be professionals. They need to feel that not only do they have the right but also the obligation to be lifelong learners, and that if new materials are given to them, it is up to them to decide how to use them and when they will be able to use them effectively. During the first year after receiving new materials, when teachers are learning along with their students, they need to be given the opportunity to gather evidence on student learning and not be held accountable for their students’ outcomes. Finally, rapid changes in textbooks, standards, curriculum, and expectations are fundamental problems for U.S. teachers. They cause huge drops in student outcomes, and we can document the cause-and-effect quite easily, as a result of having extensive online information about what goes on in the classroom.
A mentoring approach to in-service training offers a major advantage over typical professional development: researchers know whether a teacher taught a given part of the curriculum because it’s recorded. We know how many notes the teacher’s students wrote because they’re recorded. We know how much time the teacher was logged on to the inquiry science environment. We know which external resources the students looked at. We know an enormous amount of information about what went on in the classroom, and that is very helpful for professional development, but it’s also a new source of information and one that we, as researchers, are still learning to use.
98

THE ROLE OF THE TEACHER Yasushi Ogura: There are different images of the role of “teacher” in the two countries. One big question is: Who organizes the learning? In Japan, we are quite selective about our teachers; they need to be able to teach students at various levels in a very tailored way. We are able to hire very talented, skillful people to become teachers, whereas in the United States, this may be more difficult. This results in a different approach to teacher education and a different role for textbooks. In the U.S. the textbooks are very thick and very informative, and the assumption is that students will learn from them, and not from the teacher. In Japan, however, students can’t learn from the textbooks because they are intended to be used by teachers to arrange and structure the learning. In Japan, student learning is heavily dependent on the teacher, who is the main source of information. So the teacher is very important in Japan. Of course it is important in the U.S., but materials are built with the assumption that students will learn from the materials, not the teacher. The two countries also have different perspectives on the use of digital learning resources. The same sorts of learning materials that are most often used by students in the U.S. are more likely to be used by teachers in Japan. Such different approaches to teaching and learning call attention to the differences between the teacher’s role in the two countries, a question that lends itself to joint collaborative research. Atsushi Yoshida: These points are indeed very important to the collaboration between the United States and Japan. As I understand it, the U.S. team proposes that we collaborate on the more practical aspects of teacher education. However, we want to focus on the curriculum and materials development, so there is a gap in our goals. I invite the U.S. researchers to propose a means by which we might collaborate in both areas. Marcia Linn: One of the ways that we might look at this more systematically would be to look at the curriculum and materials in the context of teacher professional development. Otherwise the problem becomes too huge, at least in the U.S., where the curriculum and the activities are less consistent than they are in Japan. We’ve had some very valuable learning experiences by implementing the technique I briefly alluded to of “walking in each other’s shoes.” In the water quality curriculum we used the materials that had been developed at Vanderbilt, and they used ours. And we all used materials that had been developed at the University of Michigan, and they used the ones that we had developed. Then we all came together to talk about the experiences that resulted from taking advantage of other people’s materials. What came out of the whole experience was the idea that we needed to come up with design principles that synthesize what is effective.
99

We needed to think hard about our assessments because we were actually teaching different things, and we benefited dramatically from really understanding how other people’s ideas work in schools and classrooms. Too often it’s very hard to understand how programs really work because we only look at them superficially. It would be wonderful if we could all visit Japan. I can’t tell you how much I learned by observing the students, the teachers, and the lesson study groups, and by thinking about the curriculum. It would also be beneficial if we could record the materials in each setting. Finding a way to collaborate that involves understanding what goes on systemically is crucial at this point. Otherwise there is the risk of superficial thinking, quick fixes, or applying a program without realizing all of its ramifications. TECHNOLOGY-BASED COLLABORATIVE LEARNING Hayashi Nakayama: A major difference between the U.S. and Japan is that Japanese science learning emphasizes observation and experiment. This has been a strong emphasis ever since Japan started modernizing 150 years ago. In the Japanese system, the teacher uses the blackboard to discuss the observations and experiments. Now we are entering an age of digital content. The WISE project concentrates on collaborative learning. In Japan, there is interest in experiments and observation, but little interest in building collaborative, technology centered learning. There is a strong belief that if content is on a computer, one isn’t looking at nature directly. Therefore since this is not direct observation, it’s not scientific. Because the Japanese people place so much importance on the value of observation and experimentation, they view computer use rather negatively. Perhaps that’s the reason why the Japanese educational system is not using digital technology as much as it should. The method of collaborative learning mirrors the society of academic scientists: to pose it that way might make collaboration more acceptable to the Japanese. Marcia Linn: When one expands the classroom resources to include the internet, there’s a tendency and opportunity to bring more text into the classroom, and not necessarily to maintain the emphasis on investigation. In the project that I chose to illustrate today, I focused on the text-based materials, rather than the investigative component, but many of our projects do have a strong investigative component. For example, in the course of WISE projects students grow plants and study and compare plant growth, and conduct experiments with light and record their results. I even learned techniques for doing this better when I visited Japan, because I observed some classrooms using the Itakura method, which I believe is an experimental method. The students were contrasting three or four possible outcomes for an experiment, and debating in the classroom why one or the other offered the right explanation.
100

That is part of the motivation for the discussion activities that occur in the WISE project. We have a lot to learn, though, about how to make these activities consistent with the way we’d like students to think about science throughout their lives. Science education is not just reading materials; it’s not just conducting experiments. It’s really putting all this together. One of the effects we hope would come out of these projects is that students would become more independent in gathering and evaluating their own sources of information. Nancy Songer’s work clearly illustrates how that can unfold. This is a great opportunity for us to collaborate because there are techniques in both countries that, if melded, could improve science education for everybody.
101

TECHNOLOGY EDUCATION PROMISING AREAS FOR U.S.-JAPAN COLLABORATION1
DISCUSSION
Kazuyoshi Natori, National Institute for Educational Policy Research (Japan) Nancy Songer, University of Michigan Namio Nagasu, University of Tsukuba
Eizo Nagasaki, National Institute for Educational Policy Research (Japan)
MEANINGFUL USES OF TECHNOLOGY Nancy Songer: With regard to Professor Natori’s comment about the need to increase educational content within technology education activities, we have noticed in the U.S. that to create meaningful uses of technology, first we need to look at how it’s used across other institutions. How, for example, is it used among scientists? How is it used in medicine, or business and commerce? The next step is then to draw from those meaningful uses experiences that could be modeled in the classroom as learning with technology. In one of our U.S. research groups, we had a strong push towards meaningful uses of technology as a result of this approach. What this means is that we’re not interested in standalone technology, or building skills with technology. We’re looking carefully at, and asking a lot of questions about, what learning gains result from using technology. Professor Natori spoke about the time trade-off between making a cog wheel or doing an activity with technology: how might you be giving up valuable time in science education by directing some of the science time towards technology? The lesson we learn from studying how technology is used in the professions, is that as educators we want to ask careful questions about technology usage first, and determine what the purpose is, then build educational activities toward that goal. If the technology isn’t bringing something new to the learning outcome, then it’s probably not a good use of technology.
1 Presented at Exploring Collaborations in Science and Mathematics Education, March 17-19, 2003, San Francisco.
102
When Professor Natori showed us the chart in Figure 6, which laid out all the different countries side by side, with how much technology is integrated into their curricular programs, what was fascinating to me was not necessarily the total amount or time that the different countries are spending using technology, but what the U.S. diagram looks like. There are a very high number of dots there, which show integrated technology, or as it says in the figure legend, “merged with other subjects.” And I agree; I think this is where America really is right now. Even in our PhD. programs at the University of Michigan, students in what we call “learning technologies” are not allowed to specialize only in technology, they have to study it within a content area, such as mathematics education or language and literacy or science education. The Japanese integrated study courses might be a marvelous place to add in these meaningful uses of technology, integrated with other content areas. That way the educators might not need to feel that they were losing in a trade-off between the use of technology and other science, math or industrial arts education activities. Namio Nagasu: As Dr. Natori mentioned, our society introduced the new subject of technology after World War II, and this was from the United States. I would like to know the status of technology as a subject in the United States. There are a variety of curricula in the U.S., but what are the details, by state, as to subject, teaching methods and content? As much as possible, we’d like to know this information on a state-by-state basis. Recent technology education in Japan introduced new content including bio-technology and human genome. In this case, our discussions are in terms of the society or ethics or human science. We’ve discussed two basic ideas of science, technology and society up to this point, and science education develops around issue-oriented content. Mathematics and technology education, likewise, need to involve real, everyday life and real-world situations. Eizo Nagasaki: In preparation for this conference, we talked about the importance of integrating mathematics, science and technology, but in Japan the three subjects are quite distinct. We have specialists and innovate in separate areas. That all these individual specialists came together for this conference is a rather rare case. We read the information and technology standards, as they were actually translated into Japanese, and they take a very, very different point of view, one that completely integrates mathematics, science and technology. That’s a real eye opener for the Japanese, who are used to thinking of technology education as entirely separate. I think it is key for the Japanese to begin to think about these three areas as a unit. Kazuyoshi Natori: In Japan, in junior high school education, we focus on making things. Students need to know that making something is contributing to society. We haven’t needed a technological relationship to focus on making things in this context.
103

The skills involved in making something are based on technology or science, so we need to think about both these issues together. In the U.S., technology is usually accomplished in science education, but when we teach computer science and use computerized learning, we need to integrate technology into different subject areas. There are several places that are implementing curricula such as the one from the University of Michigan that integrates mathematics, science and technology, and I hope that we can learn more about these sorts of approaches, and that it can be a subject of our collaboration. TRENDS IN TECHNOLOGY EDUCATION IN THE UNITED STATES Nancy Songer: In our earlier presentations, Marcia Linn and I tried to capture some of the major issues we’re facing in the U.S. with regard to technology education. Clearly, there’s an issue with having a lot of information but not knowing how to make meaningful use of it. Marcia Linn’s program, the WISE Program (Web-based Inquiry Science Environment), guides children through gathering information from the Internet and other resources, then learning to make sense of that information. This is one important goal right now for the United States. The amount of available information is only going to increase, and one of the scientific critical thinking skills that children and anyone will need to develop is how to select appropriate information and how to make good use of it. So while this isn’t a form of scientific or critical thinking that we would commonly classify as science – because it doesn’t involve nature or beakers or the traditional trappings of science – it is a critical skill to develop in order to facilitate scientific problem-solving in an information-oriented world. These kinds of issues are at the forefront of much of the technology research that’s in progress now in the U.S. By not being early adopters, Japanese classrooms have been saved from many “educational tools” that are not in fact very educational. The U.S. has some history of putting those into classrooms and not seeing much meaningful usage or learning come from them. So the good news is that, by waiting, the Japanese have saved themselves some of the growing pains. Hopefully we can all proceed now in a more selective way with using technology to transform good resources into powerful learning tools.
104
SECTION 3 MATHEMATICS
EDUCATION
105

MATHEMATICS EDUCATION IN JAPAN: AN OVERVIEW1
Shizumi Shimizu Institute of Education, University of Tsukuba
ABSTRACT
In order to distill contemporary trends and issues in Japanese mathematics education, this paper provides an overview of specific features of the Course of Study, revised in 1998-99 and implemented since 2002. It also includes the results of research undertaken in 2002 by the National Institute for Educational Policy Research (NIER) in a project commissioned by the Ministry of Education, Culture, Sports, Science, and Technology (MEXT) to analyze children’s attitudes toward studying and issues for improving mathematics education. The paper identifies two major changes in mathematic education: 1) allowing the teaching of advanced content not in the Course of Study to children who learn more quickly; and 2) a shift from norm-based evaluation to goal-based evaluation for students. It also highlights significant changes in mathematics education that have taken place in Japan since 2002. INTRODUCTION In Japan, significant changes have taken place, both in the educational policies formulated during the process of rapid economic growth and those in place immediately before the bursting of the economic bubble of the 1980s. Despite the search for an educational constant, a “golden mean,” Japan has been unable to agree on a formula for the future. In this context, comparative research projects between the U.S. and Japan in science and mathematics education have the potential to both open the stifled atmosphere within Japanese mathematics education and offer a fresh perspective for the future.
1 Presented at Exploring Collaborations in Science and Mathematics Education, March 17-19, 2003, San Francisco.
106

MATH EDUCATION IN THE NEW “COURSE OF STUDY”
Table 1: Lower Secondary School Mathematics (1990s)
1st Grade 2nd Grade 3rd Grade
Educational Subject Matter
O Positive & negative numbers
O Formula expressions and values integrated here
O Linear equations O Symmetric
displacement O Cutting space
figures O Drawing
geometrical figures
O Ratios and inverse proportions
O Solving formulas O Solving inequalities O Linear equations with
two unknowns O Congruence and
similarity O Linear functions Frequency distribution
and relative frequency, correlation
O Square roots of numbers O Expanding and factoring
expressions O Solving simple quadratic
equations Ratios of similarity and
their relationship to ratios of area and volume
O Relationship of the angle of circumference and the central angle
O Pythagorean theorem O Simple quadratic functions O Samples and parent
populations O Probability
Key characteristics of the most recent (Phase VI) Course of Study include: • instituting a five-day school week at all levels of schooling • nurturing students’ capacity to prosper in a less regimented environment • careful selection of teaching content • major reduction in school hours. School hours for compulsory education have been reduced by 15%, with a 30% reduction in teaching content, and approximately 20% of school time dedicated to activities with greater flexibility.
Table 2: Reduction in Hours of Instruction
Grade 1998 Revisions 1989 Revisions % Less 1st 114 136 16% 2nd 155 175 11% 3rd 150 175 14% 4th 150 175 14% 5th 150 175 14% 6th 150 175 14%
Elementary School
Mathematics (arithmetic)
Total I 869 1011 14% 1st 105(117) 105(117) 0% 2nd 105 (117) 140(156) 25% 3rd 105 (117) 140(156) 25%
Lower Secondary
school mathematics Total II 315 (350) 385(428) 18%
Total III
1219
(45 minutes)
1439
(45 minutes)
15%
107
Table 2 shows the reduction of class hours for mathematics instruction. Arithmetic and lower secondary school mathematics have been reduced by 14% and 18%, respectively. The reduction for elementary school and lower secondary school mathematics in the nine years of compulsory education, calculating on the basis of one class hour = 45 minutes, is 220 class hours, a reduction of almost two class years. The Course of Study for the 2000s continue the emphasis of the prior phase on a qualitative improvement in education, stressing in particular the “ability to learn by oneself and think for oneself” and the comprehensive integration of knowledge. To that end, an “integrated learning” period has been established, and other measures instituted to stress comprehensive learning, where students take a proactive approach with previously learned material. Another characteristic of the current Course of Study is the emphasis on “activity” and “enjoyment.” In school mathematics, there is an increase in active learning by the children, through the incorporation of mathematical activities into course objectives, for example. In lower secondary schools, individualized instruction was improved by increasing the number of elective hours. To create a suitable educational environment, the Course of Study emphasized the following perspectives: • Schools must be enjoyable places where children can be at ease. • Children must have the freedom to thoroughly explore those things that attract their care
and interest. • Schools must teach in an easy to understand manner and create an environment in which
it is natural for students to speak out when they do not understand, and in which mistakes and trial and error learning are expected as part of the learning process.
• Schools must make it possible for students to feel secure and develop their capabilities. The most recent Course of Study called for a fundamental change in the tone of education:
Schools must teach from a toddler or child’s perspective. They must encourage students to have a sense of intellectual curiosity and a spirit of inquiry. They must train students to have the will to learn by themselves and the ability to learn proactively, and, through a trial and error process, to think logically for themselves. [Schools] must nurture the capacity to make one’s own decisions, to accurately express one’s own thoughts and feelings, and to detect and resolve problems. They must cultivate the foundation for creativity and foster the ability to act while responding proactively to social changes. In addition, schools must emphasize the connection between knowledge and daily life, and they must promote experiential learning, learning that stresses the fostering of techniques for learning and problem solving capabilities in order to achieve the richness of self-realization.
Based on these goals, the basic policy for improving school mathematics is divided roughly into two parts: 1. Matters related to the objectives of school mathematics, including:
• acquiring basic knowledge and skills with regard to quantities and figures, and, based
108

on this knowledge and skill • cultivating creative thinking, such as the ability to look at things from multiple
perspectives and think logically • learning the benefits of considering phenomena mathematically • fostering an increased willingness to make progress and use these skills by oneself.
2. Perspectives for improving teaching content:
• enabling students to consider the relationship of various phenomena in real life and have the latitude to discover issues and problems for themselves
• through the act of resolving issues and problems proactively, experiencing the pleasure and fulfillment of learning as they pursue their studies.
Below are the teaching objectives for elementary mathematics (arithmetic) and lower and upper secondary school mathematics. Elementary School Through mathematical activities regarding numbers, quantities, and geometrical figures, to: • help children develop the ability to consider their daily life phenomena with insight and
logic • acquire fundamental logic and skills • develop pleasure in mathematical activities and appreciate mathematical coping with
phenomena, using it willingly to make sense of their lives. Lower Secondary School • to help students deepen their understanding of the basic concepts, principles, and rules
governing numbers, quantities, and geometrical figures • to develop skills of mathematically representing and coping with phenomena • to enhance students’ ability to consider things mathematically and appreciate the
mathematical way of viewing and thinking • so students willingly apply this knowledge to their daily lives. Upper Secondary School • to help students deepen their understanding of basic concepts, principles and laws of
mathematics • to develop their abilities to think and cope mathematically with various phenomena • to cultivate their creativity through mathematical activities and an appreciation of
mathematical viewing and thinking • thereby fostering attitudes that encourage the use of such abilities.
109
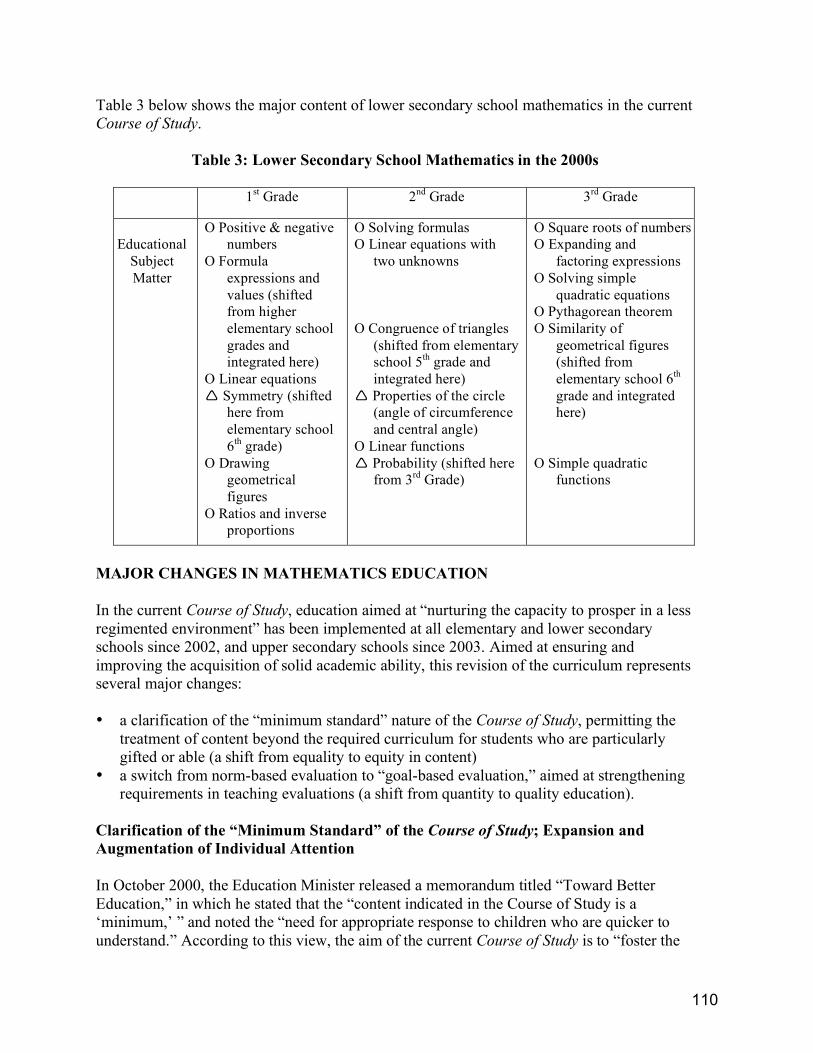
Table 3 below shows the major content of lower secondary school mathematics in the current Course of Study.
Table 3: Lower Secondary School Mathematics in the 2000s
1st Grade 2nd Grade 3rd Grade
Educational
Subject Matter
O Positive & negative numbers
O Formula expressions and values (shifted from higher elementary school grades and integrated here)
O Linear equations Symmetry (shifted
here from elementary school 6th grade)
O Drawing geometrical figures
O Ratios and inverse proportions
O Solving formulas O Linear equations with
two unknowns O Congruence of triangles
(shifted from elementary school 5th grade and integrated here)
Properties of the circle (angle of circumference and central angle)
O Linear functions Probability (shifted here
from 3rd Grade)
O Square roots of numbers O Expanding and
factoring expressions O Solving simple
quadratic equations O Pythagorean theorem O Similarity of
geometrical figures (shifted from elementary school 6th grade and integrated here)
O Simple quadratic
functions
MAJOR CHANGES IN MATHEMATICS EDUCATION In the current Course of Study, education aimed at “nurturing the capacity to prosper in a less regimented environment” has been implemented at all elementary and lower secondary schools since 2002, and upper secondary schools since 2003. Aimed at ensuring and improving the acquisition of solid academic ability, this revision of the curriculum represents several major changes: • a clarification of the “minimum standard” nature of the Course of Study, permitting the
treatment of content beyond the required curriculum for students who are particularly gifted or able (a shift from equality to equity in content)
• a switch from norm-based evaluation to “goal-based evaluation,” aimed at strengthening requirements in teaching evaluations (a shift from quantity to quality education).
Clarification of the “Minimum Standard” of the Course of Study; Expansion and Augmentation of Individual Attention In October 2000, the Education Minister released a memorandum titled “Toward Better Education,” in which he stated that the “content indicated in the Course of Study is a ‘minimum,’ ” and noted the “need for appropriate response to children who are quicker to understand.” According to this view, the aim of the current Course of Study is to “foster the
110
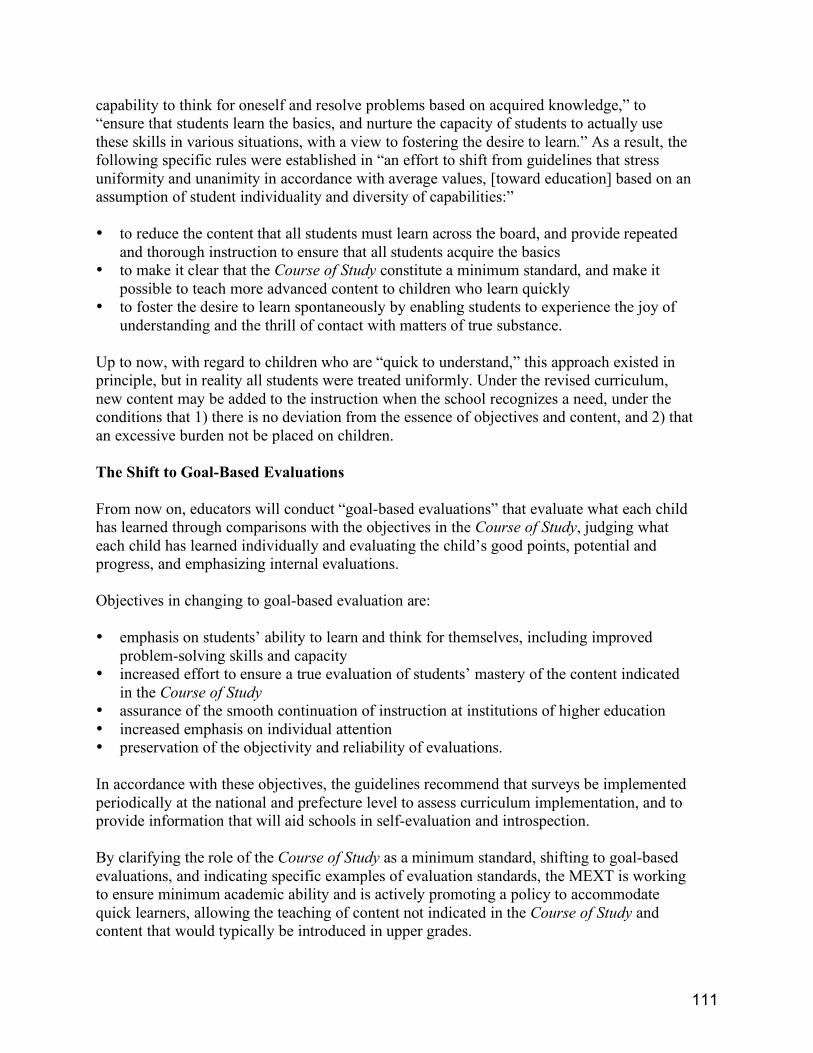
capability to think for oneself and resolve problems based on acquired knowledge,” to “ensure that students learn the basics, and nurture the capacity of students to actually use these skills in various situations, with a view to fostering the desire to learn.” As a result, the following specific rules were established in “an effort to shift from guidelines that stress uniformity and unanimity in accordance with average values, [toward education] based on an assumption of student individuality and diversity of capabilities:” • to reduce the content that all students must learn across the board, and provide repeated
and thorough instruction to ensure that all students acquire the basics • to make it clear that the Course of Study constitute a minimum standard, and make it
possible to teach more advanced content to children who learn quickly • to foster the desire to learn spontaneously by enabling students to experience the joy of
understanding and the thrill of contact with matters of true substance. Up to now, with regard to children who are “quick to understand,” this approach existed in principle, but in reality all students were treated uniformly. Under the revised curriculum, new content may be added to the instruction when the school recognizes a need, under the conditions that 1) there is no deviation from the essence of objectives and content, and 2) that an excessive burden not be placed on children. The Shift to Goal-Based Evaluations From now on, educators will conduct “goal-based evaluations” that evaluate what each child has learned through comparisons with the objectives in the Course of Study, judging what each child has learned individually and evaluating the child’s good points, potential and progress, and emphasizing internal evaluations. Objectives in changing to goal-based evaluation are: • emphasis on students’ ability to learn and think for themselves, including improved
problem-solving skills and capacity • increased effort to ensure a true evaluation of students’ mastery of the content indicated
in the Course of Study • assurance of the smooth continuation of instruction at institutions of higher education • increased emphasis on individual attention • preservation of the objectivity and reliability of evaluations. In accordance with these objectives, the guidelines recommend that surveys be implemented periodically at the national and prefecture level to assess curriculum implementation, and to provide information that will aid schools in self-evaluation and introspection. By clarifying the role of the Course of Study as a minimum standard, shifting to goal-based evaluations, and indicating specific examples of evaluation standards, the MEXT is working to ensure minimum academic ability and is actively promoting a policy to accommodate quick learners, allowing the teaching of content not indicated in the Course of Study and content that would typically be introduced in upper grades.
111

ISSUES IN MATHEMATICS EDUCATION When the current Course of Study was announced, there were whispered concerns over the drop in academic performance that might result from the extensive reduction in teaching hours and the strict selection of content. The clarification of the “minimum standard” of the Course of Study led to evaluations based on the goals of the Course of Study and the generous deployment of additional instructors for small group instruction and instruction matching the degree of proficiency. This accommodation for quick learners also led to the teaching of progressive learning content (content beyond the standard). In each case, the shift was a truly momentous one and provided a desirable direction for the future development of school mathematics. The question remains whether the framework of the existing Course of Study is capable of supporting such a major shift. Introduction of a Grade System Starting in Upper Elementary School, and Bold Measures to Ensure Individual Attention The Elementary School Council of the Curriculum explained that “instructional content has been carefully selected to enable it to be taught in approximately 80% of class hours,” providing for a leeway of 20% of total class hours. In the case of arithmetic classes, 20% of the 869 hours in a six-year period, or approximately 170 hours, is secured as leeway in terms of time. Consistency of Elementary, Lower Secondary, and Upper Secondary Schools in Mathematics Instruction When the Course of Study for the 1990s (Phase V) was prepared, 95% of lower secondary school students were going on to upper secondary school, so guidelines did not discuss teaching content at the individual school level, but rather emphasized consistency of the teaching curriculum throughout the ten years of education from the first year of elementary school to the first year of upper secondary school. To assure a smooth transition from one level to the next, content in the final grades of elementary and upper secondary schools that was intended to summarize the content learned at individual schools was eliminated from the guidelines. In the current Course of Study, this approach has been completely reversed, and major divides have been created between elementary and lower secondary schools, and between lower secondary and upper secondary schools. As a result, the continuity between elementary, lower secondary, and upper secondary schools is a major concern. Improvement of the Framework for Describing School Mathematics Content Since the 1960s, school mathematics has been presented in the Course of Study in a two-dimensional way. One dimension concerns numbers and calculations, quantities and measurements, and figures and other content with a mathematical background. The other dimension consists of forms of activity, such as interest, will, attitude, mathematical approach, skill and expression, knowledge and understanding. The latter dimension has been
112
integrated into the teaching objectives, or presented as a standpoint for the evaluation of learning. Judging from the current emphasis on mathematical approach, problem solving, and mathematical activities, and calls for a qualitative change in teaching, it would be desirable to establish a new, third dimension that describes teaching content in structural terms. The analysis framework for basic academic ability, established in the “Basic Academic Ability” survey conducted by NIER, consists of three dimensions: • Behavioral Patterns – knowledge, understanding, conceptualization, skill and attitude • Mathematical Content – numerical formulas, graphic and relational content • Mathematical Processes – mathematization, mathematical processing and mathematical
verification. Development of New Courses That Include the Use of Technology The progress of information technologies in our lives and the development of various informational media outside the schools will have significant impacts on school mathematical instruction as the manner in which children relate to instruction changes. Accordingly, an approach to curricula that includes the use of technology must be clarified. This strategy should include an awareness of the issues of incorporating technology into mathematics education up to the present, as well as a proposal for new curricular approaches completely different from those in the past, and a plan to ensure that these two approaches can coexist. Degree and Scope of School Mathematics Covered in Compulsory Education In constructing the current Course of Study, there seems to have been a fierce debate over the degree and scope of school mathematics to be included in compulsory education. In this debate, whether to teach the “two-dimensional world” (quadratic expressions, square roots, etc.) at the final stage of compulsory education appears to have been in question. There needs to be a through discussion based on fundamental research to determine the degree and scope of school mathematics, and to enable the clarification of these matters. Course Reconfiguration to Accommodate Diverse Student Needs at the Upper Secondary Level To accommodate the diverse needs of students continuing to upper secondary school, a complete reappraisal of the course configuration should be conducted in order to devise a new framework. Some possibilities include mathematics from a user’s perspective, discrete mathematics, mathematics that presupposes the use of technology, and historical mathematics (which focuses on the history of mathematical concepts and the evolution of mathematical theory). Conditions (Especially Teacher Training and Class Size) Supporting the Implementation of the Curriculum
113

There is a great deal of discussion around the issue of reducing class size; however, the question of teacher qualification should be included in this discussion. Rather than reducing class size, it is possible that teacher training, particularly better in-service training, will resolve current concerns, although the training should be from the perspective of school mathematics instruction. CHILDREN’S ATTITUDES TOWARD STUDYING In 2002, MEXT and the NIER Curriculum Research Center published an overview of a survey into the success of curriculum implementation. For the first time, this survey included a questionnaire. Here is a snapshot of children’s attitudes to three aspects of studying: • studying • the purpose of studying school mathematics • problem solving. Overall, children hold surprisingly healthy attitudes about studying. How Children Feel About School Who could have guessed that children are so keen on school? When asked if they liked school, 40% of fifth and sixth grade elementary school children and 35% of lower secondary school children answered “Strongly Agree.” When added to the percentage of children who answered, “Agree,” the number exceeds 70% for all but secondary school second graders.
Common Q 1(1): I like school.
!" #!" $!" %!" &!" '!!"
()*+,-
()*%,-
).*'/,
).*#01
).*231
.,3405678953:: ;53:: <=/953::
.,34056781=/ =953:: <40>,8?04@ A483:/B40/:
114

Children’s Attitudes Toward Studying When asked if they liked studying, the results were not so encouraging, as shown in the following chart.
Common Q 1(2): I like studying. What exactly is the pleasure that children get from going to school? Also, how should we view the large gap between fifth and sixth grade elementary school children? In addition, 40% of lower secondary school children in each grade replied, “Strongly disagree,” representing a sharp rise. However, the situation changes when asked whether studying is important or not. In this case, the percentage of those who answered “Strongly agree,” added to the percentage of those who answered “Agree,” exceeds 80% for all grades. This shows that a high number of children dislike studying but think it is important.
Common Q 1(3): Studying is important.
!" #!" $!" %!" &!" '!!"
()*+,-
()*%,-
).*'/,
).*#01
).*231
.,3405678953:: ;53:: <=/953:: .,34056781=/=953:: <40>,8?04@ A483:/B40/:
!" #!" $!" %!" &!" '!!"
()*+,-
()*%,-
).*'/,
).*#01
).*231
.,3405678953:: 953:: ;</<953::
.,34056781</953:: ;40=,8>04? @483:/A40/:
115

Children’s Attitudes Toward Studying Mathematics When asked if they like studying school mathematics or not, students’ responses were evenly split at 50%. However, when asked if studying mathematics is important or not, 70-85% answered in the affirmative, which is a surprisingly good trend.
Math Q 1(1): I like studying school mathematics.
Math Q 1(2): Studying school mathematics is important.
!" #!" $!" %!" &!" '!!"
()*+,-
()*%,-
).*'/,
).*#01
).*231
.,3405678953:: ;53:: <=/953:: .,34056781=/953:: <40>,8?04@ A483:/B40/:
!" #!" $!" %!" &!" '!!"
()*+,-
()*%,-
).*'/,
).*#01
).*231
.,3405678953:: ;53:: <=/953:: .,34056781=/953:: <00>,8?04@ A483:/B40/:
116

Attitudes About the Purpose of Studying School Mathematics Four statements were presented concerning attitudes toward the purpose of learning school mathematics: • “Want to study school mathematics to help pass entrance examinations.” • “Want to study school mathematics so that I can get a job I like.” • “Want to study school mathematics because it will be useful in everyday life when I
leave school.” • “Want to study school mathematics to develop the ability to think logically.” Here are survey results of children’s attitudes according to grade.
Math Q 1(8): Want to study school mathematics to help pass entrance examinations. Math Q 1(9): Want to study school mathematics so that I can get a job I like.
!" #!" $!" %!" &!" '!!"
()*+,-
()*%,-
).*'/,
).*#01
).*231
.,3405678953:: ;53:: <=/953::
.,34056781=/953:: <40>,8?04@ A483:/B40/:
!" #!" $!" %!" &!" '!!"
()*+,-
()*%,-
).*'/,
).*#01
).*231
.,3405678953:: ;53:: <=/953::
.,34056781=/ =953:: <40>,8?04@ A483:/B40/:
117

Math Q 1(10): Want to study school mathematics because it will be useful in everyday life
when I leave school.
Math Q 1(11): Want to study school mathematics to develop the ability to think logically.
!" #!" $!" %!" &!" '!!"
()*+,-
()*%,-
).*'/,
).*#01
).*231
.,3405 678953:: ;53:: <=/953:: .,3405 6781=/953:: <40>,8 ?04@ A48 3:/B40/:
!" #!" $!" %!" &!" '!!"
()*+,-
()*%,-
).*'/,
).*#01
).*231
.,3405678953:: ;53:: <=/953::
.,34056781=/953:: <40>,8?04@ A483:/B40/:
118

While there are a greater percentage of affirmative versus negative responses regarding the purpose for learning school mathematics, the further children progress in school, the more this percentage declines. In particular, the response to the purpose statement with regard to learning to think logically is a cause for concern. Nevertheless, on the whole children’s attitudes toward learning school mathematics are favorable. Attitudes Toward Problem Solving in School Mathematics Here the questions were of two types: the process of problem solving and the stage where the problem is tentatively solved. PROCESS OF PROBLEM SOLVING Children’s responses to the following two questions are affirmative:
Math Q 2(3): When solving mathematical problems, do you try to identify the similarities with or differences from problems you have solved before?
Math Q 2(7): When you do not know how to solve a mathematical problem, do you keep trying to think of different ways without giving up?
!" #!" $!" %!" &!" '!!"
()*+,-
()*%,-
).*'/,
).*#01
).*231
.,3405678953:: ;53:: <=/953::
.,34056781=/953:: <40>,8?04@ A483:/B40/:
!" #!" $!" %!" &!" '!!"
()*+,-
()*%,-
).*'/,
).*#01
).*231
.,3405678953:: ;53:: <=/953::
.,34056781=/953:: <40>,8?04@ A483:/B40/:
119

AFTER PROBLEM SOLVING (TENTATIVELY COMPLETE) Children’s responses to the following three questions are also affirmative: Math Q 2(5): When you are unable to solve a mathematical problem, do you think back over
why you were unable to solve it?
Math Q 2(6): When you are able to solve a mathematical problem, do you think of a different
way to solve it?
!" #!" $!" %!" &!" '!!"
()*+,-
()*%,-
).*'/,
).*#01
).*231
.,3405678953:: ;53:: <=/953::
.,34056781=/ =953:: <40>,8?04@ A483:/B40/:
!" #!" $!" %!" &!" '!!"
()*+,-
()*%,-
).*'/,
).*#01
).*231
.,3405678953:: ;53:: <=/953::
.,34056781=/953:: <40>,8?04@ A483:/B40/:
120
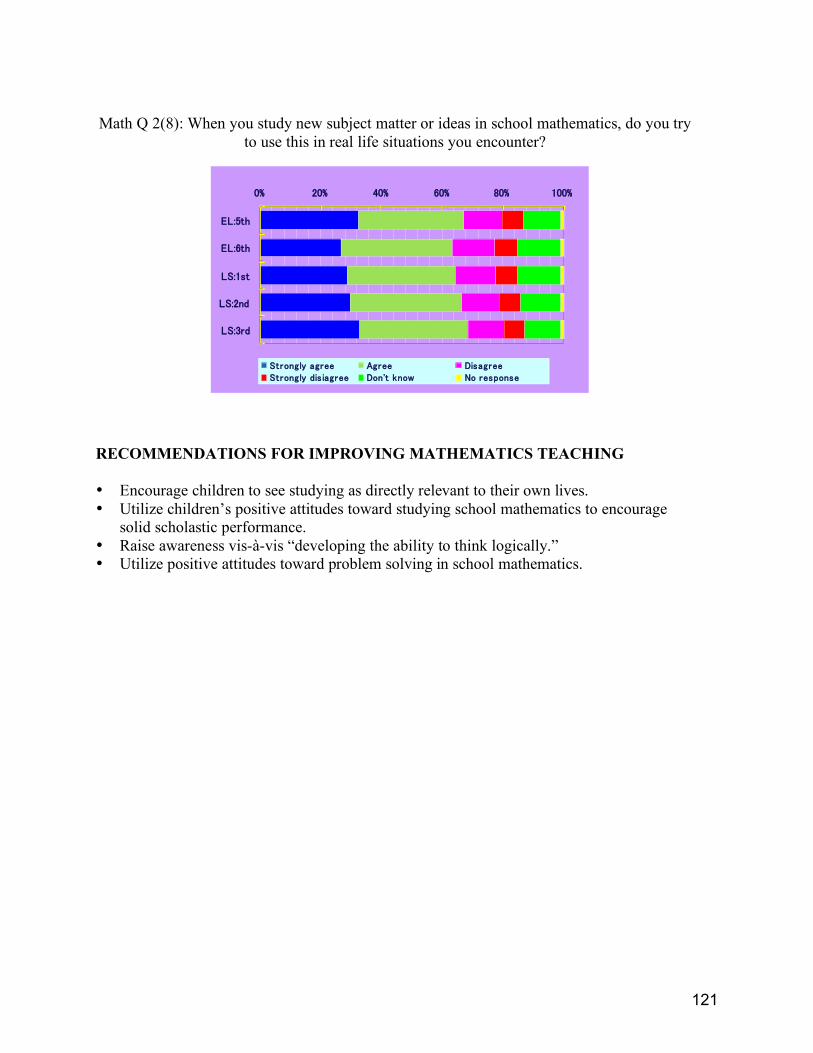
Math Q 2(8): When you study new subject matter or ideas in school mathematics, do you try
to use this in real life situations you encounter? RECOMMENDATIONS FOR IMPROVING MATHEMATICS TEACHING • Encourage children to see studying as directly relevant to their own lives. • Utilize children’s positive attitudes toward studying school mathematics to encourage
solid scholastic performance. • Raise awareness vis-à-vis “developing the ability to think logically.” • Utilize positive attitudes toward problem solving in school mathematics.
!" #!" $!" %!" &!" '!!"
()*+,-
()*%,-
).*'/,
).*#01
).*231
.,3405678953:: ;53:: <=/953::
.,34056781=/ =953:: <40>,8?04@ A483:/B40/:
121

THE U.S. CONTEXT FOR IMPROVING MATHEMATICS TEACHING AND LEARNING1
Karen Fuson Northwestern University
In the U.S., we face the challenge of implementing good ideas in our uniquely diverse classrooms. I will talk about the Kindergarten through Grade 5 math program that I have developed and tested over many years (Fuson, 2006). It is designed to combine ambitious, core grade-level topics with sufficient time for students to learn deeply and also become proficient. Some design elements are similar to those in Japanese programs, and others are stimulated by special conditions in the U.S.
Presented at Exploring Collaborations in Science and Mathematics Education, March 17-19, 2003, San Francisco.
122

Table 1. Phases in Effective Mathematics Teaching
Phase 1: Teacher Begins Where Students Are:
A. Teacher creates interest and accessibility. Begins teaching with one accessible and representative situation with non-identical accessible numbers. B. Individuals solve problems (while the teacher identifies students who are using different levels of solution methods and those who are doing typical errors) C. Teacher asks students to share their solutions, choosing those who will exemplify different levels and typical errors. These methods are discussed by the class; advantages and disadvantages may be identified.
Phase 2: Examining Advantages and Disadvantages (Including Generalizability) of Different Methods:
D. An accessible and general method is described and explained; may be more than one. E. Erroneous methods are analyzed and repaired with explanations. F. Discussions of advantages and disadvantages of various methods may continue.
Phase 3: Students Gain Fluency with a Method: G. All members of the class move to using an accessible and general method while learning to explain it (using a quantitative situated justification, not a deductive proof). These methods are not just a rote procedural sequence of steps. Understanding and fluency develop and relate differently in different students.
Phase 4: Students Retain Fluency and Understanding: H. This involves a much longer period (months) of occasional practice with feedback on a few such problems and occasional discussions to relate method(s) to new topics that might clarify or interfere. This practice becomes farther apart over time.
Table 1 shows key elements in effective mathematics teaching. Elements of the U.S. reform approach are shown in boldface, and elements of traditional teaching are shown in standard type. Neither reform nor traditional approaches consistently include the core elements that are italicized, and these missing core elements are vital parts of successful mathematical proficiency.
123

For example, U.S. proponents of traditional teaching may emphasize D and G, focusing on demonstration and practice, and omitting explanation. U.S. reform approaches may emphasize A, B, and C, but without much mathematical discussion of advantages and disadvantages of methods. C may consist of students sharing solutions in turn, rather than a deep mathematical discussion in which students make sense of the different approaches. Teaching goals in G may not be fully realized if students follow different learning paths and are not helped to a general and efficient enough method. In Japanese elementary classrooms, all steps are likely to occur. This can happen, in part, because grade-level goals are coherent and relatively sparse (and therefore achievable).
Neither the reform nor the traditional approaches include all core elements, and these missing core elements are vital parts of successful mathematical proficiency. The “middle” ground I have sought in my program starts where students are and builds understanding, but goes on to teach one or more accessible, generalizable algorithms. In discussion, Japanese conference participants agreed that Table 1 is a fairly good description of most Japanese elementary mathematics classrooms and a good statement of their mathematics goals. While U.S. educators may share these goals, our mathematics programs typically include some but not all of these steps. Much of the “math war” debate and many of the problems occurring in the U.S. arise from the lack of programs that implement all the steps to mathematics learning described in Table 1.
Critical to mathematics learning, both for Japan and the U.S., is Phase 3. The National Research Council’s report, Adding It Up, defined mathematical proficiency as having five elements: understanding fluency disposition attitude use.
These five elements are intertwined in a spiral. Mathematical proficiency is not a linear process in which a teacher presents a concept, devotes two days to building understanding, three days to discussing methods, and then seven days to practice. In continued practice of all mathematical procedures throughout the year, understanding and fluency in computation develop in an intertwined way. Phase 2, “Examining Advantages and Disadvantages of Particular Methods,” may offer an interesting opportunity for U.S. and Japanese mathematics educators to share their experiences. Japanese teachers elicit methods from students and discuss them. The teacher supports teachers by discussion of the advantages and disadvantages of particular methods. However, this examination is not necessarily “pushed” as much as it might be mathematically. Teachers may
124

need encouragement to push their students more, since advanced students could symbolize additional methods, while less advanced students focus on the accessible research-based method that is the choice in Japan. My work in the U.S. focused on discovering which are the most accessible to students, but still generalizable and efficient mathematical algorithms, since these are the ones that should be used in the classroom. Phase 3, “Gaining Fluency With a Method” might be thought of as individual scaffolding. This process is well illustrated in Aki Murata’s in-depth study of a classroom in the Japanese School outside Chicago, ‘Paths to learning ten-structured understanding of teen sums: Addition solution methods of Japanese Grade 1 students’ (Murata, 2004; Murata & Fuson, in press). In the Japanese classroom studied by Aki Murata, the teacher’s work to build fluency was implicit: “He did these steps and didn’t know he was doing them until we described them to him.” One of the benefits of cross-cultural collaboration is outside observation. Good practice is going on in the U.S. and Japan, but teachers and researchers who are inside the practice benefit from the conscious, explicit description of methods by outside observers. Phase 4, “Retaining Fluency and Understanding,” is a key point in mathematics learning for both countries. In the U.S., a program called Saxon Math has become increasingly popular, despite the negative opinion of math reformers. For the most part, Saxon Math consists of distributed practice, especially in the upper grades. The teacher takes a few minutes on a concept, then students work on problems for the remainder of the class. Problems are mixed, containing everything learned from the beginning of the year. This type of distributed practice is atypical for U.S. classrooms where, usually during the instruction on multiplication, the word problems all concern multiplication. From that point on, however, multiplication is “finished” for the year and will then be covered again the following year. But to enhance fluency and retention, U.S. math reforms would benefit from distributed, mixed practice. In my program, the way we address this need is through a process I call “remembering.” Every night for homework, there’s a “homework of the day” or “homework of the unit” section, and then a “remembering” section, which brings back problems addressed earlier in the year. Students and parents both approve of this practice. U.S. and Japanese math educators need to collaborate on further solutions to retaining fluency and understanding.
125

Table 2. Curricular and Research Requirements for Effective Teaching Supports
1. Aspects of a Mathematical Domain Analysis in Each Specific Math Domain Analysis of classes of situations in the world: Enables books designers and teachers to select appropriate problem situations to ensure generalizable methods and understanding in real-world situations. Analysis of formal mathematical language and notation: Identifies difficulties that need to be addressed with pedagogical supports and classroom discussion (e.g., different order of 5 in written and verbal forms: 15 and fifteen but 50 and fifty; we graph and enter in tables (x,y) but write y = mx + b).
2. Aspects of an Analysis of the Range of Entering Student Knowledge o knowledge of typical student solution methods o knowledge of typical student errors and how to overcome them
3. Pedagogical Design Work o choosing a bridging situation that can facilitate interest and accessibility o choosing drawn quantity representations that can facilitate understanding of the domain situations
or quantities (may also choose or design physical objects) o identifying (often in the classroom) meaningful language that can bridge to the formal
mathematical language (e.g., also use “unmultiplying” for dividing).
Table 2 above describes some proposed areas of collaboration between U.S. and Japanese math educators. In both the U.S. and Japan, researchers have learned a great deal about the three aspects described above, but further cross-cultural interchange, down to the level of specific mathematical topics, could be very useful. For example, Japanese textbooks begin in the early grades with a coherent set of representations that remain constant as students advance into increasingly abstract concepts. Designing such a coherent set for U.S. classrooms has been a major concern in my own research, a topic I would like to extend in collaboration with other U.S. researchers. Japanese math educators are concerned about “Pedagogical Design Work” (Table 2, topic 3), but they are comparatively successful at it, perhaps because they have established a much more systematic program of teacher in-service education, a topic about which it would be helpful to exchange ideas. An important goal in the U.S. now is to develop in-service work (including a
126
model for the continuing reintroduction of mathematical ideas into the classroom) that focuses on compensating for the varied mathematical backgrounds of U.S. teachers, for whom mathematical background tends to be more problematic than it is for teachers in Japan. Note: Appendix A (below) describes a “landscape” of the U.S. National Context for Improving Mathematics Teaching and Learning and Appendix B is a summary of the principles from two major National Research Council Reports, which outline goals shared by the U.S. and Japan.
127

APPENDIX A
National U.S. Context for Improving Mathematics Teaching and Learning
mile-wide, inch-deep curriculum in state goals and in textbook content no coordination across 50 states and the many districts in a state, often little across K-2, 3-5, 6-8, and 9-12 within a
building or district spiral curriculum in which topics are repeated, so that no teacher at any grade is responsible for mastery of a given topic textbooks have to meet sets of goals for all 50 states; excessive time spent on what to teach, not how to teach publishing company takeovers have resulted in few remaining publishers, and those left are part of larger, non-publishing
conglomerates with an excessive focus on profits, low-risk philosophy, smaller staffs, and that outsource for core materials as well as for the many, many required peripheral materials o short time-tables, too short to do anything solid let alone innovative or excellent o ordinarily no field testing and no data at all on student performance o weak teacher understanding of math, socially acceptable not to be good at math (especially for girls), belief in innate
math ability and not in effort-produced ability.
Sources of Innovation Failure Innovations a). New approaches become very diluted Individual teachers Scaling Up before they reach teachers. collecting and adapting b). Insufficient teacher support and time Using Widely to learn new approach result in teachers Government or private diluting the approach. foundation funded (no publishing company $) Preventing Failure university researchers
Reducing and coordinating goals across states New approaches, units, Textbooks implementing all steps in effective teaching Multiyear materials Video/DVD, Web-delivered support for teaching in new ways
128

APPENDIX B
Background Principles for Math
How People Learn, a National Research Council report, advances three principles: eliciting, building on, and connecting student knowledge building learning paths and a network of knowledge building resourceful, self-regulating mathematical thinkers and problem solvers.
In addition, it advances an overarching principle—building the teaching-learning community.
The National Research Council report, Adding it Up: Helping Children Learn Mathematics, identifies mathematical proficiency as a teaching/learning goal. Mathematical proficiency consists of five intertwined strands: conceptual understanding, procedural fluency, strategic competence, adaptive reasoning, and productive disposition (understanding, computing, applying, reasoning, and engaging). To attain mathematical proficiency, these various aspects must develop in a continually intertwined way. For example, research indicates that conceptual understanding and procedural fluency develop together interactively over long periods of time. References
Bransford, J.D., Brown, A.L. & Cocking, R. R. (Eds.) (1999). How people learn: Brain, mind, experience and school. Washington, D.C.: National Academy Press.
Donovan, M.S., Bransford, J.D., & Pellerino, J.W., (Eds.) (1999) ). How people learn: Brain, mind, experience and school. Washington, D.C.: National Academy Press
Fuson, K. C. (2006). Math Expressions Kindergarten through Grade 5. Boston, MA: Houghton Mifflin.
Fuson, K.C. (2006). A research-based framework for Math Expressions. Boston, MA: Houghton Mifflin.
Fuson, K. C. (2005). Children’s Math Worlds Video Research Report. Fallbrook, CA Kilpatrick, J., Sowder, J. , & Findell, B. (Eds.) (2001). Adding it up: Helping children
learn mathematics. Washington, D.C.: National Academy Press. Kilpatrick, J., & Sowder, J. (Eds.) (2002). Helping children learn mathematics.
Washington, D.C.: National Academy Press. National Council of Teaches of Mathematics. (2000). Principles and standards for school
mathematics. Reston, VA: Author. Murata, A. (2004). Paths to learning ten-structured understanding of teen sums: Addition
solution methods of Japanese Grade 1 students. Cognition and Instruction, 22(2). Murata, A., & Fuson, K. (in press). Teaching as assisting individual constructive paths
within an interdependent class learning zone: Japanese first graders learning to add using ten. Journal for Research in Mathematics Education.
129

REFLECTIONS ON U.S.-JAPAN COLLABORATIVE RESEARCH IN MATHEMATICS EDUCATION1
Jerry Becker, Southern Illinois University at Carbondale Judith Epstein, Berkeley, CA
ABSTRACT
The open approach to teaching school mathematics in the United States is an outcome of the collaboration of Japanese and U.S. researchers. We examine the open approach through exercises illustrating its three aspects: open process (there is more than one way to arrive at the solution to a problem; open-ended problems (a problem can be solved in different ways); and what the Japanese call “from problem to problem” or problem formulation (students draw on their own resources to solve the problem, and then guided by their teacher, compare and discuss their solutions). Using our understanding of the Japanese approach to teaching mathematics, we adapt selected methods to teach mathematics more effectively in the United States. Much of this approach is new to U.S. mathematics teachers, in that it has teachers working together in groups on lesson plans, and through a series of discussions and revisions, results in a greatly improved, and very effective plan. It also has teachers actively observing individual students or groups of students as they work on a problem, and later as they discuss it. Teachers can then use these observations to improve teaching as the lesson is being taught.
INTRODUCTION From my personal perspective, collaboration among U.S. and Japanese teachers and professors dates back to at least the late 1960s. That was when I first met Professor Shigeru Shimada, the father of the open approach to teaching school mathematics. On a more comprehensive level, this collaboration has had a variety of outcomes over the years. Of course, a very substantial one is lesson study, the focus of this conference, in which there is a growing interest in the United States. We have also had a number of bi-national seminars in mathematics education, held at the East-West Center at the University of Hawaii in Honolulu. There have been cross-national research projects and exchanges of visits by delegations of mathematics teachers and mathematics teacher-educators from both countries, as well as informal visits—both short and long-term. Additionally, there have been talks given at professional meetings in both countries, and the proceedings of the conferences have been published and disseminated. Of course, many articles have been published in professional journals. There are also a number of books on the
1 Presented at Improving Mathematics Teaching and Learning Through Lesson Study, May 20-21, 2005, Chicago. The first person refernces are to Jerry Becker, who presented this talk.
130

subject, one of which had a very profound impact on me, and led me to develop a different perspective on teaching mathematics. This work with Shigeru Shimada is based on research carried out by the Japanese dating back to the 1970s and, in particular, a project that began in 1971 and ended in 1977. That became the first Japanese research report that was translated into English, titled The Open-Ended Approach: A New Proposal for Teaching School Mathematics (Becker and Shimada, 1997). Published by the National Council of Teachers of Mathematics (NCTM), it is now in its 7th printing. REFORMS My perspective on teaching mathematics is a result of the interactions I’ve had with quite a few mathematics teachers, professors, and researchers in Japan. Incidentally, there’s a rather close connection between some of the remarks that I’m making and the remarks that Cathy Seeley made. There’s also a very close relationship to the NCTM publication, Principles and Standards for School Mathematics (2000). Futurist Joel Barker has said, “Vision without action is merely a dream. Action without vision just passes the time. Vision with action can change the world.” Of course a very important part of the vision for teaching school mathematics that I’ll discuss comes from Principles and Standards for School Mathematics, as well as from some of the work in Japanese mathematics education. Reforming school mathematics is an important goal. Calls for reform are urgent, but they’re not new. In many countries, reform writers have prepared authoritative papers, official reform documents have been published, reform projects have been started, and reform movements have been launched and are underway. In the United States, this impetus for reform culminated in the first three standards documents, which were integrated and published in 2000 as the Principles and Standards for School Mathematics. In many respects, these documents and what they embrace can be regarded as the new vision for school mathematics in quite a few countries. In countries undergoing this reform in mathematics education, we find a common philosophy, which represents a paradigm shift in the way that we think about mathematics teaching. Instead of viewing teaching as treatment and learning as effect, students are viewed as learners who are actively involved in their learning of mathematics. An underlying assumption in all of this is that what we teach and how students experience it are the primary factors that shape students’ understanding of and beliefs about mathematics (NCTM, 1989). In a 1991 talk to the Mathematical Association of America, mathematics educator Alan Schoenfeld said, “Students pick up their sense of a domain from their experience with it.” We’ve seen the results of the approach in which we “break the subject into pieces and then make students master it, bit by bit.” As an alternative, Schoenfeld suggests that we should “create an instructional environment in which students are, at a level appropriate for them, doing mathematics.” In other words, we should “engender selected aspects of mathematical culture in the classroom.” That, of course, is what the NCTM standards are about, and that is what the work of the Japanese, dating way back to the 1970s, is also about.
131

OPENNESS We can characterize the focus of this work of the Japanese as openness in mathematics education, which truly is a profound idea. This openness has three aspects, as shown in Figure 1.
Figure 1. Openness in mathematics education
1. One Problem …………………………………………………One Solution (Answer)
Ways (Process is open)
2. One Problem (Open-Ended)……………….Several or Many Solutions (Answer)
Ways (End products are open)
3. One Problem ……………………………………………………Several Problems
(“From problem to problem ……the developmental approach”)
(Ways to develop are open)
PROBLEM SOLUTION
PROBLEM SOLUTION
SOLUTION
PROBLEM PROBLEM
PROBLEM
PROBLEM
SOLUTION
1st stage
2nd stage
Ways
Analogy Generalization
132

The first is the recognition that although a problem may have exactly one solution, there may be many different ways to get at the answer. So we regard the process as open. I think that there has been quite a long tradition of this in teaching in Japan. Secondly, a single problem may have several or many different solutions. So we say that the end-products are open or that the problem is open-ended. This is the focus of The Open-Ended Approach: A New Proposal for Teaching School Mathematics. Finally, we have the third aspect, which the Japanese refer to as “from problem to problem” or “the developmental approach” It is also sometimes referred to as problem formulation. It begins with a problem, which may or may not have a unique answer, but it doesn’t stop there. Initially the students solve the problem using their own natural ways of thinking, and then discuss their solutions. In the next stage, the students are asked to formulate problems of their own, like the one that they just saw. To do this, they may draw on the use of analogy and generalization, among other processes. We’ll explore examples of each of these three facets of openness, shortly. With just a little bit of reflection, we can see the connection to the NCTM process standards of problem solving and communication. Having students discuss mathematics with each other is very important in this approach. We can also see the relationship with the other process standards, including reasoning, making connections, and students making and using representations (a concept that was added in the 2000 revision of the standards). This addition was based on research carried out in the U.S., Brazil, and Germany, among other countries. One of the things that I noticed the first time I had the opportunity to observe classes in Japan was that there tended to be fairly common ways of approaching lessons, as shown in Figure 2. I won’t say that the teaching was uniform, but rather that common threads of practice ran through the ways the lessons unfolded.
Figure 2. Organization of Some Lessons Using the Open Approach
(Assume a 45-minute class period) 1. Introduce the open-ended problem ………………………… 5 minutes 2. Understanding the problem ………………………………… 5 minutes 3. Problem solving by students, working
individually or in small groups (putting their work on worksheets) …………………… ……………. 20 minutes
4. Comparing and discussing (students put their solutions on the black-board or OHP) ……………….. 8 minutes
5. Summing up by the teacher …………………………………. 5 minutes 6. Ask students to write down what they learned for this lesson ……………………………………….. 2 minutes 7. Homework: Ask student to extend the problem and solve, pose new problems of
their own or give another problem for students to work on. NOTE: Some lesson will require more than one period; some may lead to “Projects” that students do and write up.
133

The lessons typically begin by taking a little bit of time to introduce the open-ended problem, and making sure that students understand the problem and what is expected of them. The next step is crucial; students solve the problem, working either individually or in small groups. During this process, the students draw on their own natural ways of thinking in finding solutions. While they’re doing that, the teacher purposely walks around, looks at the students’ work, and asks various students to put their work up on the board for everyone to see. This is in preparation for the next part of the lesson, which will consist of comparing and discussing the productions of the students, and not of the teacher or of the textbook. At the conclusion of the lesson, the teacher summarizes the lesson. The students may then be asked to write down what they learned, and homework is assigned. USING THE OPEN APPROACH IN THE UNITED STATES As we adapted some of these ideas from our Japanese colleagues, we found that preparing detailed lesson plans is really a very powerful tool in the open approach. A detailed lesson plan is useful professionally. It helps the teacher to get a good handle on the problem and the different ways to solve it, as well as to prepare to conduct and facilitate discussion of the students’ own solutions. A detailed lesson plan begins with choosing a good problem. One characteristic of a good problem is that all students can have some degree of success with it. Then it involves something that is absolutely new to all teachers with whom we’ve worked, and that is working in groups of teachers to write down all of the responses of the students that they can anticipate. Generally when they do that they get a very good list, which means that together they gain some significant insights into the problem and its solutions. This is important, because the heart of this detailed lesson plan is providing an opportunity for students to solve problems using their own natural mathematical ways of thinking. After the detailed lesson plan is developed, then the teacher, who had major responsibility in developing it, teaches the lesson, and the other teachers observe. After the lesson, the teacher who taught it writes a complete record of the lesson, and then the teachers meet to discuss the lesson record and to improve the lesson plan. This is quite novel to U.S. teachers, and they are very skeptical about this. They’re very reluctant to participate, at least in the beginning, until we have a context in which the teachers trust each other. Then things change, and they begin working together and collaborating. Now to my way of thinking, this is almost an ideal way to work towards teacher improvement, because the teacher or the teachers who teach that lesson are going to improve in their ability and confidence to teach the lesson. Moreover, this makes a significant contribution to curriculum improvement, in that the lesson plan improves through a series of discussions and revisions. In our work with teachers at all grade levels, we found that usually by the third revision, the detailed lesson plan is in such an effective form that it is almost good enough for a substitute teacher to use. All the details are there, as well as the rationale and the background.
134

Furthermore, lesson study is crucial in assessing student learning. Unfortunately there is not time here to delve deeply into that. But along with the open approach to teaching mathematics, Japanese researchers devised a quite different way of assessing learning, which also fits very nicely with the thinking in the NCTM documents on assessment. Assessment includes analyzing individual students’ worksheets, or a group’s, and observing the student or groups as they are working on the problem, and later as they are discussing it. As a result, instruction can be adjusted based on these observations, so that the assessment can actually help to improve teaching as the lesson is being taught. Additionally, there are opportunities for assessment related to each of the facets of the open approach. 1. Open Process Let’s consider an example of the open process for a problem at the first grade level. Suppose that there are eight butterflies on a bush, and seven more come to join them. How many butterflies are there all together? After the teacher makes it clear what the problem is and what is expected of the students, they work on the problem using their own natural thinking ability. Ahead of time, the teachers have probably thought out all of these different ways to solve the problem, and they anticipate the students’ points of view. Some solution methods are shown in Figure 3.
Figure 3 Solution Methods for the Butterfly Problem
135

Solution methods may involve counting, decomposing, or doubling. The answer might be found by counting from 1 or counting from 8 or 9, as we see in methods 1 and 2, respectively. The third and fourth examples illustrate methods of solving the problem by using decomposition of numbers, which is a different mathematical feature than counting. In method 3, 8 is decomposed into 5 and 3, while 7 is decomposed into and 5 and 2; then the two 5’s are combined to get 10 and the 3 and 2 are combined to get 5. Finally, the 5 and 10 are combined to get 15. I like method 4 just a little bit more. First, 7 is decomposed into 2 and 5, and that 2 is added to 8 to get 10; finally adding the 5 takes us to the answer, 15. In the last row, we find a third category of solutions: doubling combined with addition or subtraction. There may be other ways that students will actually think of to find the answer. We saw an example of the third category of solution in a kindergarten class at Washington School in Belleville, Illinois. While the demonstration teacher was teaching a lesson, I knelt down next to a little girl and asked, “How much is 7 and 8?” She thought a little bit, and then she said, “15.” So, I said, “How did you get that answer?” She replied, “Well, I doubled 7 and I added 1.” This is a kindergartner, and they were not taught this, but kindergartners and primary school teachers have a lot of what is characterized in the literature now as “informal mathematical knowledge.” Another form of that informal mathematical knowledge is what students learn in a mathematics lesson without the teacher’s awareness of it. Teachers may not be aware of many of the things that the students are learning. One aspect of assessment is concerned with assessing the number of different mathematical ideas that the students present. So once the students have solved the problem, we may ask them to think of all the different ways they can solve it. In this case, we’ve already found three categories: counting strategies, decomposition, and a doubling strategy. The larger the number of categories that get at least one response, the better. That shows more flexibility in thinking; the students are presenting more ideas that are mathematical in nature. 2. Open-Ended Products Some problems may have many solutions, such as the one from perhaps the fourth grade level depicted in Figure 4. We begin with a square piece of paper, and we ask the students to divide it into four equal parts. How many different ways can this be done? First of all, we have to make it clear what the task is for them. We want the four pieces to have equal areas, but we aren’t saying that they have to be congruent. Generally, we use square centimeter paper for a problem like this. Then the students are free to use their own natural thinking abilities in whatever way they want, coming up with whatever kinds of productions that they can.
136

Figure 4. End-Products Are Open
The students can find quite a variety of solutions. Let’s look at the right-hand one in the bottom row. Those little arcs at the end of each side of the square show that line segments are equal in length. This particular way of solving the problem is very different from the other methods. Teachers are surprised; they can’t imagine that kids would do that, but they do. What the students are thinking, of course, is that the center point of the square is fixed, as are the two diagonals of the square, which meet at the center at right angles. Now the diagonals can be rigidly rotated around the center, and wherever they stop, they still divide the square into four equal parts. This introduces another mathematical idea, namely rotation. This problem actually gets into rotational symmetry.
137
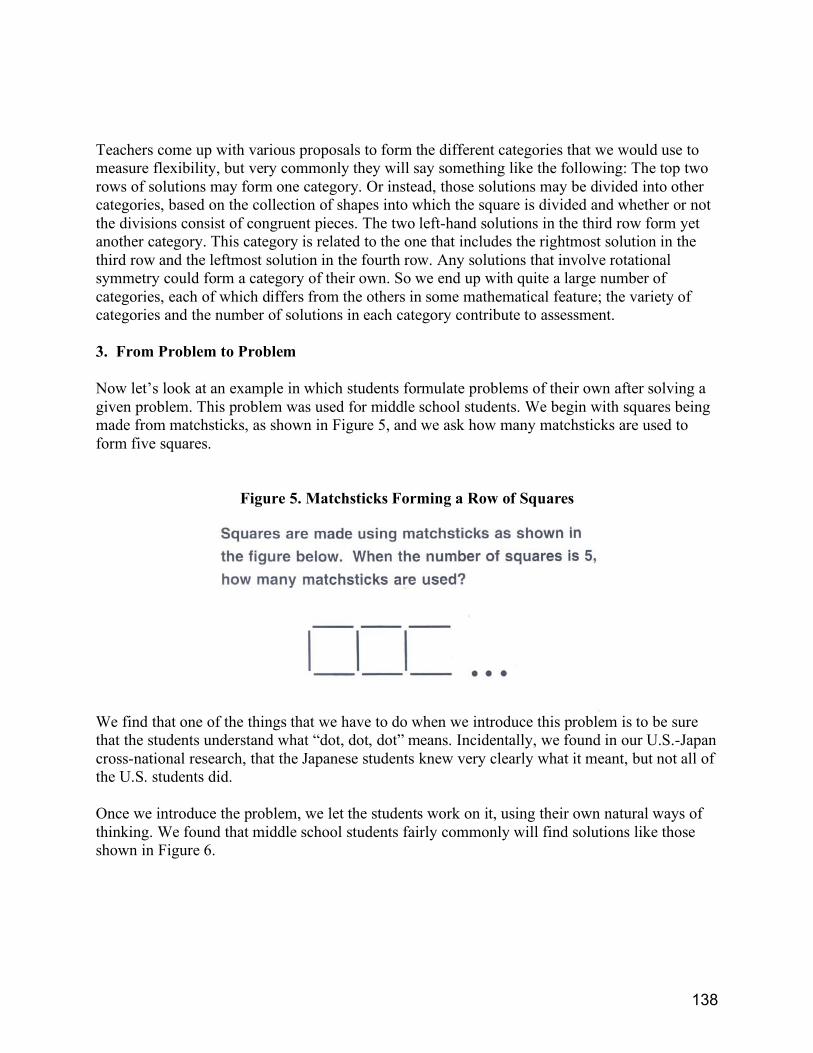
Teachers come up with various proposals to form the different categories that we would use to measure flexibility, but very commonly they will say something like the following: The top two rows of solutions may form one category. Or instead, those solutions may be divided into other categories, based on the collection of shapes into which the square is divided and whether or not the divisions consist of congruent pieces. The two left-hand solutions in the third row form yet another category. This category is related to the one that includes the rightmost solution in the third row and the leftmost solution in the fourth row. Any solutions that involve rotational symmetry could form a category of their own. So we end up with quite a large number of categories, each of which differs from the others in some mathematical feature; the variety of categories and the number of solutions in each category contribute to assessment. 3. From Problem to Problem Now let’s look at an example in which students formulate problems of their own after solving a given problem. This problem was used for middle school students. We begin with squares being made from matchsticks, as shown in Figure 5, and we ask how many matchsticks are used to form five squares.
Figure 5. Matchsticks Forming a Row of Squares
We find that one of the things that we have to do when we introduce this problem is to be sure that the students understand what “dot, dot, dot” means. Incidentally, we found in our U.S.-Japan cross-national research, that the Japanese students knew very clearly what it meant, but not all of the U.S. students did. Once we introduce the problem, we let the students work on it, using their own natural ways of thinking. We found that middle school students fairly commonly will find solutions like those shown in Figure 6.
138

Figure 6. Different Solutions to the Matchstick Problem.
In solution a, the students simply made the prescribed number of squares and counted the matchsticks one-by-one. Solution b has a mistake —4 times 5 equals 20— that will likely come up, but an interesting thing about the open approach is that the teacher rarely has to correct students. Students correct students; when they see a flaw in reasoning they point it out. Solution c is based on counting the contributions of alternating squares in different ways. All 4 matchsticks forming the odd-numbered squares are taken into account, and then only the top and bottom matchsticks of the squares in between are counted to get the total, 16. Solution d groups 4 groups of 4 matchsticks in a different way. The squares on either end of the row each contribute 4 matchsticks to the total.
139

This leaves the square adjacent to the rightmost square with 3 uncounted sides, which are then grouped with the shared side of the next pair of squares to the left to get another 4 matchsticks. Finally, the top and bottom matchsticks of that pair contribute the final 4 matchsticks of the total, 16. In solution e, the 5 matchsticks on the top and the 5 matchsticks on the bottom of the squares are added together to get all of the horizontal matchsticks. Then the 6 vertical matchsticks are added in to get 16. In solution f, the leftmost square contributes 4 matchsticks to the total, and each of the 4 squares to its right contributes 3 matchsticks to the total. Incidentally, without going into any detail now, another component of the assessment approach used in the Japanese research is “a quality,” which translates from Japanese to English as “elegance.” However, it means something a little bit different from what we typically take elegance to mean. What it means is the extent to which students represent their thinking in mathematical notation. When Neal Foland, a mathematician in the Mathematics Department at Southern Illinois University at Carbondale, and I began using this problem in demonstration lessons, we thought, that at the very least, we would want the lesson to end with all students seeing that the number of matchsticks could be calculated by multiplying the number of squares by 3 and then adding 1. This method occurs in solution g, which is to some extent a generalization of the method used for solution f. The method in solution g is a very nice way to solve the problem, because it’s easily generalizable to an arbitrary number of squares in a row. We thought it was the best way. We were proceeding as though we believed this (more or less like it was gospel), but then, using the open approach, interesting things come up that are, to a very large extent, not anticipated by teachers or by professors. For example, Jaymee Major and Khia Azhuz, in two different demonstration classes, came up with a better way. In fact, Jaymee said that it really was a much better way. This is the method that we see in solution h. In solution h, the 10 matchsticks that form the 5 right angles at the upper left corner of each square are taken into account first. This quantity is added to the contribution from the each of the 5 matchsticks on the bottom of the row of squares. Finally, the contribution of the last matchstick, which closes the right-hand square, is added in. Clearly this method works, so we asked Jaymee why she considered this to be a better way. She replied that her way was a much more general way; our problem was just a special case of the more general problem shown in Figure 7.
140

Figure 7. Matchsticks Forming r Rows of c Squares.
She reasoned that by understanding how to calculate the contribution from shared sides, she could now calculate the number of matchsticks needed to form r rows of c squares each with shared sides, as shown in Figure 7. First, she calculated the contribution from the top row; as she had in solution h. She began by counting the upper left pair of matchsticks across c columns, that is, 2 times c. Then she accounted for the single matchstick on the right side of the top right-hand square to get 2c + 1. She then multiplied this entire quantity by r, the number of rows, to get (2c + 1)r. Finally, there are still c uncompleted squares, one at the bottom of each column. Each of these squares requires one more matchstick to be completed, so she added c to the previous quantity to get (2c + 1)r + c. The assignment for the next day was to calculate the number of matchsticks required to construct a 10-by-10-by-10 cube in three dimensions. As I mentioned, there are two stages in this third aspect of openness in mathematics education. After the students have solved the given problem, they make up new problems of their own, based on the original one. In this case, there are a number of ways that the students could make up new problems with different conditions, but first they had to understand what the original conditions were. What were those conditions? We were using matchsticks to make squares; that’s two separate conditions. The squares are in the plane with shared sides; that’s two more conditions. We began
141

by making a construction out of five squares; that’s yet another condition. Now if we change any one or more of those conditions, we have formulated a new problem. Some new problems are shown in Figure 8. We have kept the matchsticks and shared-side characteristic, but we have changed one or more of the other conditions.
First, we might change the number of squares to 8, 20, 100, or generalize to n squares. We could extend the array of squares in the horizontal direction, the vertical direction, or both to have r rows of c columns. We also might try the problem with triangles instead of squares, and then move on to pentagons, hexagons, and polygons with n sides. This might lead to interesting problems about tiling the plane with polygons. Some students might be able to formulate a converse type of problem: given a certain number of matchsticks, how many squares can be made? We can even move from two dimensions to three dimensions and examine lattices of cubes with shared faces, and then modify this new problem in the ways used above to get more new problems. It gets very interesting, and very challenging, as well. In our U.S.-Japan cross-national research study, we found that students in the United States at a number of different grade levels—4, 6, 8, and 11—were writing some new problems, but these problems had nothing to do with the problem that they had just solved. This is so new to some U.S. students, that it’s very hard for them to make sense out of the problems they formulate. That
Figure 8. Variations on the Matchstick Problem.
142
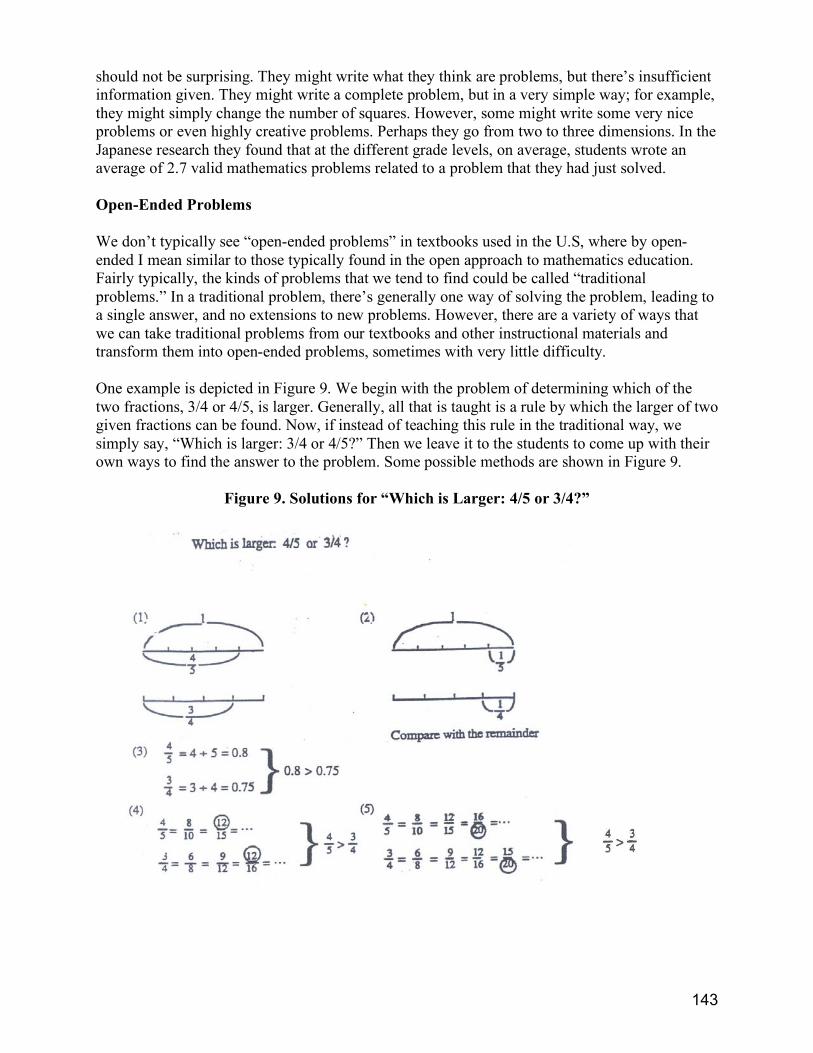
should not be surprising. They might write what they think are problems, but there’s insufficient information given. They might write a complete problem, but in a very simple way; for example, they might simply change the number of squares. However, some might write some very nice problems or even highly creative problems. Perhaps they go from two to three dimensions. In the Japanese research they found that at the different grade levels, on average, students wrote an average of 2.7 valid mathematics problems related to a problem that they had just solved. Open-Ended Problems We don’t typically see “open-ended problems” in textbooks used in the U.S, where by open-ended I mean similar to those typically found in the open approach to mathematics education. Fairly typically, the kinds of problems that we tend to find could be called “traditional problems.” In a traditional problem, there’s generally one way of solving the problem, leading to a single answer, and no extensions to new problems. However, there are a variety of ways that we can take traditional problems from our textbooks and other instructional materials and transform them into open-ended problems, sometimes with very little difficulty. One example is depicted in Figure 9. We begin with the problem of determining which of the two fractions, 3/4 or 4/5, is larger. Generally, all that is taught is a rule by which the larger of two given fractions can be found. Now, if instead of teaching this rule in the traditional way, we simply say, “Which is larger: 3/4 or 4/5?” Then we leave it to the students to come up with their own ways to find the answer to the problem. Some possible methods are shown in Figure 9.
Figure 9. Solutions for “Which is Larger: 4/5 or 3/4?”
143

In solution 1, two line segments of length 1 are partitioned into pieces. The first is partitioned into 5 equal pieces and the second into 4 equal pieces. The fraction 4/5 is represented by 4 of the 5 equal pieces and the fraction 3/4 by 3 of the 4 pieces. Now the students can see which is longer. In method 2, students also partition two line segments into equal pieces, but now they focus on the pieces that remain and decide which is smaller, 1/4 or 1/5. In method 3, the fractions 3/4 and 4/5 are converted to decimals and then compared. In method 4, the given pair of fractions is converted to an equivalent pair with common numerators, and then the larger fraction can be easily determined. Method 5 is similar to method 4, except that in this case the fractions are compared by being converted into an equivalent pair with common denominators. Of course this method is the rationale behind the rule that is generally taught when this problem is presented in a lesson in the United States. CONCLUSIONS The problems that we have seen and problems like them provide a kind of a transition from a traditional approach to what I call the “open approach” in teaching mathematics. There is a great deal of information in Principles and Standards for School Mathematics, but I think it is not the kind of document that one just reads. It has to be studied. One has to see the samples. The open approach is based on Japanese research that goes back to the 1970s, and it helps us to make a transition from the recommendations of reform documents, such as Principles and Standards for School Mathematics, to actually implementing them in a school classroom. I want to close with more of Alan Schoenfeld’s words. He has a lot of very good ideas about mathematics education. In his 1991 talk to the Mathematical Association of America, he made the bold assertion that: “Mathematics is a living, breathing, and exciting discipline of sense-making. Students will come to see it that way, if and only if they experience that way in their classrooms.” We have found that this process of sense-making makes all the difference in working with teachers and students. If the students can make sense out of what we’re teaching, then a large part of the battle is won, so to speak. If they can’t, it’s an entirely different thing. Now, in the open approach, there are ample opportunities for sense-making, because students start from their own natural thinking abilities. They may also find that the product of the thinking abilities of a different student or students actually may provide more mathematically-rich ways of solving the problem. We cannot offer students such opportunities in the context of the traditional approach to teaching mathematics. In Schoenfeld’s words, “Virtually all standard instruction should be enhanced by courses in which students grapple with the subject matter in intellectually honest ways.” This is exactly what happens in the open approach to teaching school mathematics as mathematics. If we can adapt and implement the open approach developed by the Japanese for use in U.S. classrooms, we will have something of great value to mathematics education in the United States. This perspective on teaching mathematics is the ongoing focus of our work.
144

REFERENCES
Becker, J.P. and Selter, C., (1996). Elementary school practices. In A. Bishop, K. Clements, C.
Keitel, J. Kilpatrick, and C. Laborde (eds.), International Handbook of Mathematics Education. (pp. 511-564). Dordrecht: Kluwer Academic Publishers.
Becker, J.P. and Shimada, S., editors (1997). The open-ended approach: a new proposal for teaching mathematics, Reston: National Council of Teachers of Mathematics.
Hashimoto, Y. and Becker, J.P., (1999) The open approach to teaching mathematics—creating a culture of mathematics in the classroom: Japan. In L. Sheffield (ed.) Developing mathematically promising students (pp. 101-110). Reston: National Council of Teachers of Mathematics.
National Council of Teachers of Mathematics (1989). Curriculum and evaluation standards for school mathematics. Reston: National Council of Teachers of Mathematics.
National Council of Teachers of Mathematics (2000). Principles and standards for school mathematics. Reston: National Council of Teachers of Mathematics.
145

FOSTERING ALGEBRAIC THINKING THROUGH PROBLEM-SOLVING ORIENTED
LESSONS: A JAPANESE APPROACH1
Toshiakira Fujii Tokyo Gakugei University
ABSTRACT This paper examines data from a U.S.-Japan cross-national study (Becker, and Shimada, 1997) and focuses on the types of mathematical and verbal expressions used by Japanese and U.S. students. The strategies used by Japanese students are linked to the structure of Japanese lessons. The final section of the paper focuses on the importance of generalizable numerical expressions in fostering algebraic thinking. INTRODUCTION My talk consists of two parts. Part 1 examines students’ work on a particular problem, focusing on their mathematical and verbal expressions and the frequency of various strategies. The structure of Japanese lessons is revealed in Japanese students’ responses. Part 2 addresses students’ use of mathematical expressions and focuses on the importance of generalizable numerical expressions in fostering algebraic thinking. Part 1 uses data from the same U.S–Japan cross-national study (Becker, and Shimada, 1997) discussed by Jerry Becker (this volume). My analysis concerns students’ strategies and their use of mathematical expressions. In the study, five problems were given to Japanese and U.S. students in grades 4 through 11, see Fujii, T. and Miwa, T., (1992) . I analyzed the data from the Matchstick Problem (see Figure 1.) which was given to grade four and six students in the U.S. (Illinois) and Japan.
1 Presented at Improving Mathematics Teaching and Learning Through Lesson Study, May 20-21, 2005, Chicago.
146
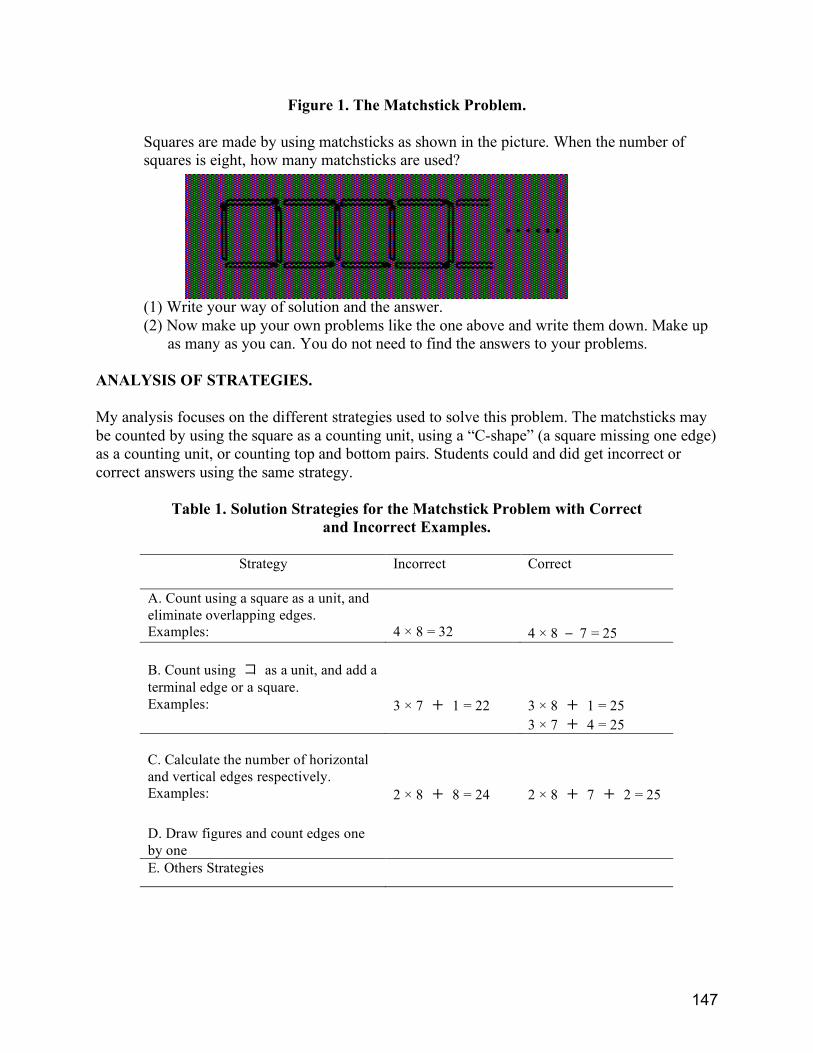
Figure 1. The Matchstick Problem.
Squares are made by using matchsticks as shown in the picture. When the number of squares is eight, how many matchsticks are used?
(1) Write your way of solution and the answer. (2) Now make up your own problems like the one above and write them down. Make up
as many as you can. You do not need to find the answers to your problems. ANALYSIS OF STRATEGIES. My analysis focuses on the different strategies used to solve this problem. The matchsticks may be counted by using the square as a counting unit, using a “C-shape” (a square missing one edge) as a counting unit, or counting top and bottom pairs. Students could and did get incorrect or correct answers using the same strategy.
Table 1. Solution Strategies for the Matchstick Problem with Correct and Incorrect Examples.
Strategy Incorrect Correct
A. Count using a square as a unit, and eliminate overlapping edges.
Examples: 4 × 8 = 32 4 × 8 ‒ 7 = 25
B. Count using コ as a unit, and add a terminal edge or a square.
Examples: 3 × 7 + 1 = 22 3 × 8 + 1 = 25 3 × 7 + 4 = 25
C. Calculate the number of horizontal and vertical edges respectively.
Examples: 2 × 8 + 8 = 24 2 × 8 + 7 + 2 = 25
D. Draw figures and count edges one by one
E. Others Strategies
147

I categorized students’ responses by strategy (see Table 1). Strategy A uses the square as a counting unit. The first example shown in Table 1, 4 × 8 ‒ 7 = 25, is correct. The second, 4 × 8 = 32, is incorrect. But both use the same way to look at the figure. Figure 2 shows two student responses that use Strategy A. The response on the left is: “A square has four sides, so you just take 8 andmultiply.” This is a typical incorrect answer. In the response on the right, the student started from 32, changed his mind, and got 25 on the fourth line.
Figure 2. Two Student Responses That Use Strategy A.
4 x 8 = 32 32-7=25 If you make squares from the matchsticks you need 4 matchsticks for each square, and this is 8 squares so that would be 32. But the squares are attached so there are right side matchsticks that aren’t needed, so you subtract 7
148

Figure 3. Three Responses Using Strategy B. Figure 3 shows three responses that use Strategy B. The コ on the first line on the upper right is the Japanese letter “ko”. The student looked at the matchstick figure using the calculation on the upper right, and got 25. In the response shown on the lower right, using a C-shape, the student got 25. The remaining response uses the same strategy, but unfortunately the student got 21 + 3, which is 24.
If you divide it into 3 sticks each, in the end there is always one extra left.
If the furthest left is 4 sticks, the rest are the shape of the letter , which is 3 sticks, so 3 x 7 =21 21+4=25.
This also seems to go up by 4 each time, but that’s wrong. If it goes up by four each time it would make 8 squares. So if you increase it by 3 each time it you can make it correctly 21+3.
25 sticks
149
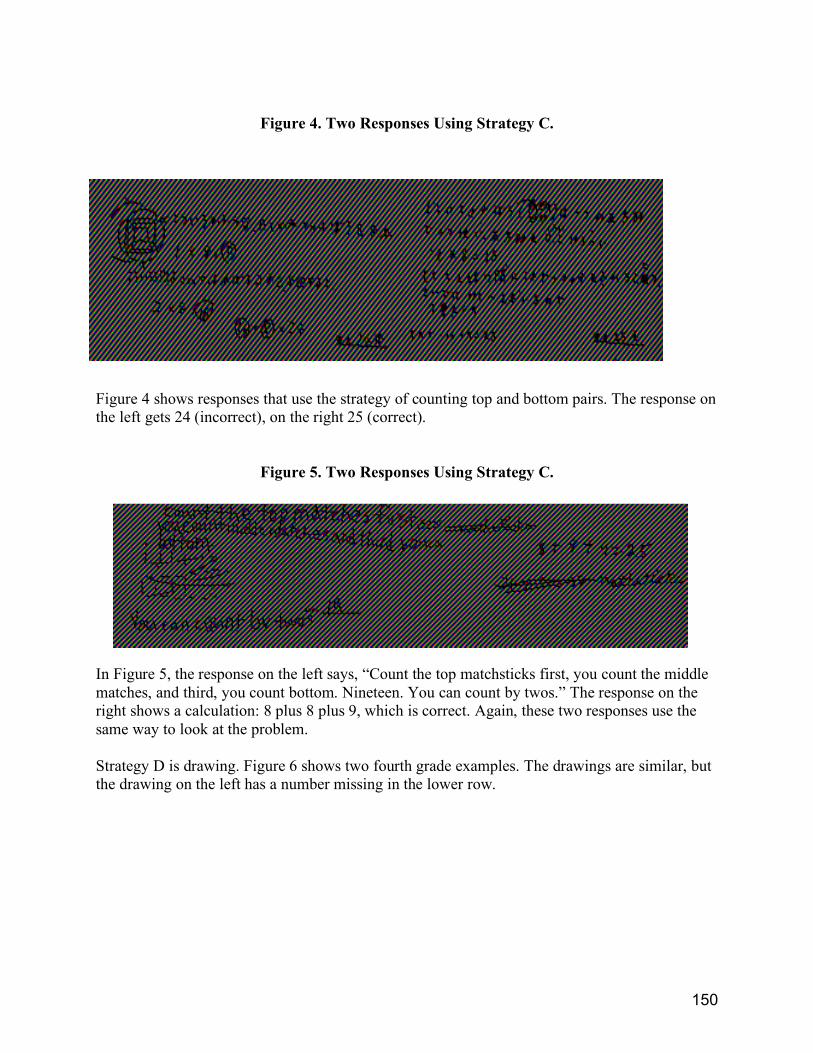
Figure 4. Two Responses Using Strategy C.
Figure 4 shows responses that use the strategy of counting top and bottom pairs. The response on the left gets 24 (incorrect), on the right 25 (correct).
Figure 5. Two Responses Using Strategy C. In Figure 5, the response on the left says, “Count the top matchsticks first, you count the middle matches, and third, you count bottom. Nineteen. You can count by twos.” The response on the right shows a calculation: 8 plus 8 plus 9, which is correct. Again, these two responses use the same way to look at the problem. Strategy D is drawing. Figure 6 shows two fourth grade examples. The drawings are similar, but the drawing on the left has a number missing in the lower row.
150

Figure 6. Drawing and Counting.
Figure 7 shows two examples of the “other” category, which includes strategies like making tables.
Figure 7. Making Tables
Figure 7. Making Tables
Figure 8. Proportion of Different Student Solution Methods: Japan
151
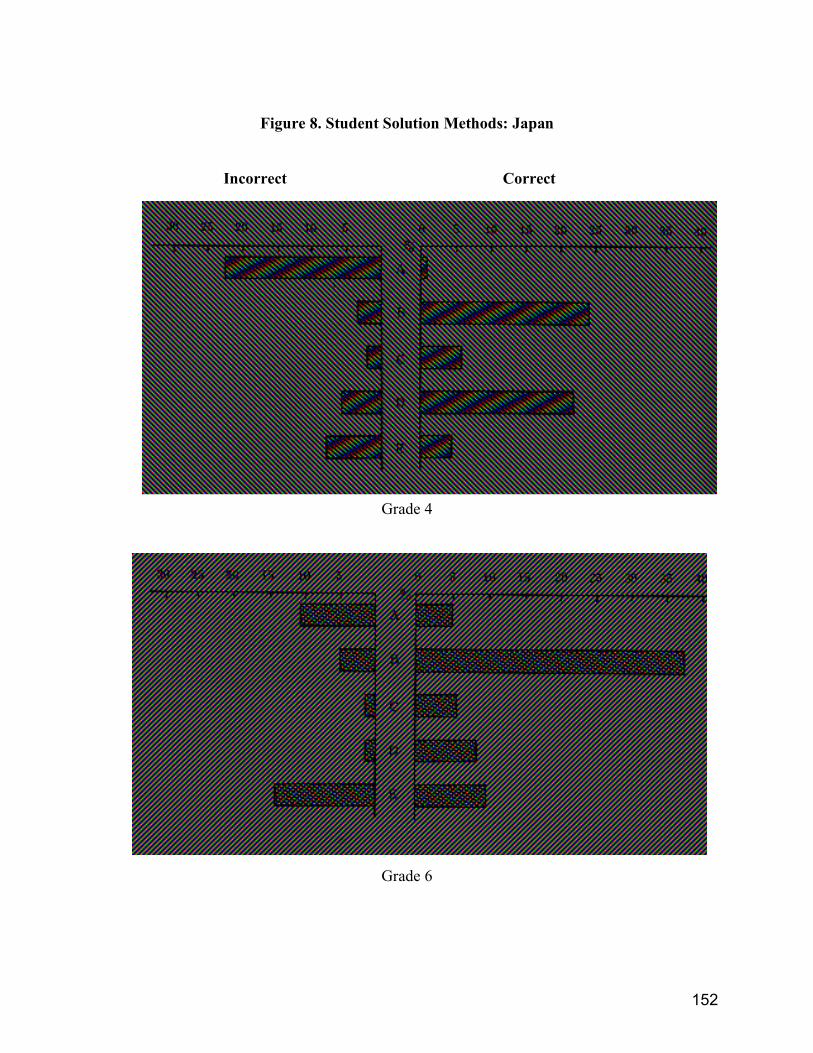
Figure 8. Student Solution Methods: Japan
Incorrect Correct
Grade 4
Grade 6
152

The fourth graders’ use of Strategy A, counting with the square as a unit, resulted in many answers that were incorrect because they didn’t allow for overlapping edges. Drawing was a frequent strategy for the fourth graders. For sixth graders, Strategy B, counting with a C-shape, was most frequent, and often resulted in a correct answer. This result implies that a naïve strategy may get more incorrect answers while a sophisticated strategy may lead to more correct answers. Figure 9 shows the proportions of different strategies used by the U.S. students.
Figure 9. Student Solution Methods: United States
Incorrect Correct
Grade 4
Grade 6 [Q: Why is this here?]
Grade 4
Grade 6
153

U.S. fourth graders most often used the strategy of drawing, but about half were not successful. Sixth graders most frequently used strategies B and D. ANALYSIS OF MATHEMATICAL EXPRESSIONS AND WRITING. Students’ responses to the Matchstick Problem can be analyzed in a different way by looking at students’ use of writing and mathematical expressions. For example, one response that used written explanation only was: “I counted number of matches, in the first square so 4. And then add 3 plus 3 to that number, I kept adding 3.” The corresponding mathematical expression would be 4 + 3 + 3+ 3. Table 2 shows the use of mathematical and verbal expressions in responses to the Matchstick Problem. We found that 64% of Japanese fourth graders used mathematical expressions. Sometimes these were accompanied by figures or verbal expressions, i.e., writing. In addition, 74% of Japanese sixth graders used mathematical expressions. In contrast, 6% of U.S. fourth graders and 49% of U.S. sixth graders used mathematical expressions.
Table 2. Percent of Students Using Mathematical and Other Expressions.
Japan U.S.
Grade 4 Grade 6 Grade 4 Grade 6
Math expression only 20 36 3 14 Math expression and figure 12 17 0 7
Math expression and verbal explanation 20 19 3 14
Math expression, figure and verbal explanation 12 7 0 14
Math expression: Total 64 79 6 49
Verbal explanation only 13 7 35 7 Verbal explanation and figure 11 5 7 21
Figure only 11 8 45 17 Table only 0 1 0 0 Answer only 1 1 3 7
No answer 0 1 3 0
My explanation for these differences is based on the lesson structure described by Jerry Becker.
154
STRUCTURE OF JAPANESE LESSONS. Japanese problem-solving oriented lessons often have the following structure: • understanding the problem (5–10 minutes) • problem-solving by students (15–25 minutes) • comparing and discussing (students put their solutions on the board) (15–20 minutes) • summing up by teacher (5 minutes). The comparing and discussing stage of the lesson is called neriage. Part of the preparation for fruitful discussion in neriage occurs during the problem-solving stage of the lesson. This is hard work for the teacher. During that stage (called kikan-shido), the teacher purposefully scans student work as he or she goes on classroom instructional rounds. The teacher has already prepared for these rounds by knowing typical solutions that students give. For example, if I use the Matchstick Problem, I have a list of categories already. I should have that list prepared, and I find students to present solutions that uses Strategies A, B, C, and D. For strategies in the “other” category E, if I haven’t seen those before, I ask the student how it’s done. At the same time, I’m planning how students will present their solutions on the blackboard. What will be the structure of blackboard writing? Maybe a naïve solution on the left and more sophisticated solutions to its right. I need to plan carefully because later I may want students to compare the difference or similarity of solutions. Also, as the teacher, I have to consider students’ individual needs. If there’s a reserved, quiet student in the class who is doing well that day, then he or she can present a solution and be a star. Also, as I make my rounds and scan student work, I provide suggestions to students. Neriage is a critical part of the lesson because during neriage, students examine and compare proposed solutions under the guidance of the teacher. These solutions are usually presented with mathematical expressions. This gives students the opportunity to become “fluent” in mathematical language, including the use of expressions. Neriage and the structure of problem-solving oriented lessons may explain why Japanese students used mathematical expressions more frequently than U.S. students in their responses to the Matchstick Problem. Generalizable Numerical Expressions in Fostering Algebraic Thinking My current research concerns improvement of students’ use of mathematical expressions. The term “algebraic thinking” is sometimes interpreted as advocating arithmetic first, then algebra. Max Stephens and I (Fujii and Stephens, 2001) propose the notion of “quasi-variable.” A quasi-variable is a number n that occurs in an equation or group of equations that indicates an underlying mathematical relationship that remains true if all instances of n are replaced by another number. In his history of mathematics, Nakamura (1971) uses the term “quasi-general
155

method” with a similar meaning. Two examples of this quasi-general method come from Diophantus and Pascal. Diophantus used the number 16 to express a general solution for the following problem: “We wish to find two square numbers, the sum of which is a square number” (Problem 8, Book 2 of his Arithmetica). Here the number 16 is a quasi-variable. Pascal used n = 4 to show why
C(n, r) ÷ C(n, r + 1) = (1 + r) ÷ (n – r). in what is now known as Pascal’s Triangle. Here the number 4 acts as a quasi-variable. I contend that quasi-variables can help children to identify and discuss algebraic generalizations long before they learn formal algebraic notation. Here is an another example of a quasi-variable. Carpenter and Levi (2000) introduced second grade students to the idea of true and false number sentences, for instance,
78 – 49 + 49 = 78. They asked children, “Is this true or false?” and asked them to explain their answers. To show the sentence was true, some children used arithmetical thinking and calculated from left to right. Other children used relational thinking. They said the sentence was true, because taking away the 49 and adding another 49 is “like getting it back.” These children didn’t need to calculate from left to right. Although Carpenter and Levi do not use this term, I refer to this use of a number as a quasi-variable. In the expression 78 – 49 + 49 = 78, one could substitute other numbers for the two instances of 78 or the two instances of 49 and the expression would remain true. In this equation, 78 acts as a quasi-variable and 49 acts as a quasi-variable. Here is another situation in which quasi-variables can be used. This task is taken from a typical textbook problem in the fifth grade of elementary school in Japan (Tokyo Shoseki, 1994). See Figure 10.
Figure 10. Comparing Perimeters Task.
156

Students have learned to calculate the circumference of a circle using 3.14 as an approximation of π. They are asked to compare the perimeter of the large semicircle with the perimeter of the three smaller semicircles whose diameters are one third of the large semicircle. In this case the diameters of the smaller semi-circles are 20 units. A typical calculation would be:
60 × 3.14 ÷ 2 = 94.2 20 × 3.14 ÷ 2 × 3 = 94.2
If there are four semicircles resting on the large diameter, the calculation becomes
(60 ÷4) ×3.14÷2×4 = 94.2
If there are ten semicircles, the calculation becomes (60 ÷10) ×3.14÷2×10 = 94.2
These uncalculated numerical expressions illustrate the property that, regardless of the number of identical semicircles situated on the diameter of the large circle, the sum of their circumferences is always equal to the circumference of the large semicircle. These quasi-variable relationships allow students to comprehend the general relationship of the type
(60 ÷n) × 3. 14÷2×n = 94.2
where n is the number of identical semicircles situated on the diameter. In order to teach children to make the comparison without calculating, I suggest using 60 units as the diameter of the large semi-circle, so that 60 acts as a quasi-variable.
(60÷3)×3.14÷2×3 (60 n) 3.14 2 n
I think it is important for us to help students learn to solve such problems without calculating, because reasoning without calculation is easy to generalize. For example, returning to the Matchstick Problem, Strategy B is easy to generalize (see Figure 11).
157

Figure 11. Matchstick Problem: Strategy B.
1 + 3 × 8
1 + 3 × n
Relationships between consecutive dot patterns in Figure 12 may be visualized in different ways. Some ways may make generalization easy.
Figure 12. The next dot pattern may be visualized as adjoining a diagonal of four dots (Figure 13). This way of visualizing may be a natural one for most people, but it may not be as easy to express symbolically as those shown in Figures 14 and 15.
Figure 13.
. . .
158

10 10 + 4 × 1 10 + 4 × 2 10 10+ 4 × 1 10+ 4 × 2
then 10 4 (n-1)
Figure 14 shows the dot patterns are composed of a triangle with one, two, or three diagonals adjoined.
Figure 14.
6 + 4 × 1 6 + 4 × 2 6 + 4 × 3 then 6 4 n.
This one is easier to expressed as a generalized formula. If you look at the first pattern as illustrated in Figure 14, it is easier to obtain a generalized formula. This is a good problem for teaching how to look at patterns productively. The way of looking at the pattern shown in Figure 15 also supports generalization, because the nth pattern has n dots in the top row and one dot more in each succeeding row.
Figure 15.
1+(1+1)+(1+2)+(1+3) 2+(2+1)+(2+2)+(2+3) 3+(3+1)+(3+2)+(3+3)
then n (n 1) (n 2) (n 3) Generalizable numerical expressions play a significant role in fostering algebraic thinking. It is important, therefore, to put aside some misconceptions about what we mean by early algebraic thinking, or more succinctly by early algebra.
159

Generalizable numerical expressions can be understood by quite young children. They provide important opportunities for children to focus on the structure of arithmetical sentences. They help children to explore the potentially algebraic nature of elementary mathematics. They can provide a stronger bridge to algebra in the later years of school. They help to strengthen children’s understanding of basic arithmetic. I propose that we look at elementary mathematics to see where numbers and operations can be used to involve a degree of generalization and where this aspect can be used as a useful path into algebra. We should ask what is algebraic in elementary mathematics: What can we find in elementary mathematics that may serve as a basis to develop students’ algebraic understanding? REFERENCES Becker, J.P. and Miwa,T. (Eds.). Proceedings of the U.S.-Japan Seminar on Mathematical
Problem Solving. Board of Trustee of Southern Illinois University, 1987. Becker, J.P. and Shimada, S., editors (1997). The open-ended approach: a new proposal for
teaching mathematics, Reston: National Council of Teachers of Mathematics. Blanton, M. and Kaput, J. J. (2001). Algebraifying the elementary mathematics experience Part
II: Transforming practice on a district-wide scale. In H. Chick, K. Stacey, J. Vincent, and J. Vincent (Eds.), Proceedings of the 12th ICMI Study Conference. The Future of the Teaching and Learning of Algebra (pp.87-95). Melbourne: University of Melbourne.
Carpenter, T. P. and Franke, M. L. (2001). Developing algebraic reasoning in the elementary school: Generalization and proof. In Carpenter, T.P. and Levi, L. (200). Developing conceptions of algebraic reasoning in the primary grades. Research Report Madison, WI: National Center for Improving Student Learning and Achievement in Mathematics and Science. www.weer.wisc.edu/ncisla/publications/index.html
Fujii, T. and Miwa, T. (1992) A Report of U.S.-Japan Cross-cultural Research on Students’ Problem Solving Behaviors. Proceedings of the U.S.-Japan Seminar on Computer Use in School Mathematics. Honolulu, Hawaii, Board of Trustee of Southern Illinois University. pp.5-38 April,1992.
Fujii, T. and Stephens, M. (2001).Fostering an understanding of algebraic generalisation through numerical expressions: The role of quasi-variables. In H. Chick, K. Stacey, J. Vincent, and J. Vincent (Eds.), Proceedings of the 12th ICMI Study Conference. The Future of the Teaching and Learning of Algebra (pp.258-264). Melbourne: University of Melbourne.
Nakamura,K. (1971). Commentary on Euclid’s Elements (in Japanese). Tokyo: Kyoritsu. Radford, L.(1996). The Role of Geometry and Arithmetic in the Development of Algebra:
Historical Remarks from a Didactic Perspective. In N.Bednarz, C.Kieran and L. Lee (Eds.) Approaches to Algebra, pp. 39-53. Dordrecht: Kluwer Academic Publishers.
Schoenfeld, A. and Arcavi, A. (1988). On the Meaning of Variable. Mathematics Teacher, 81, 420-427
Tokyo shoseki (1994). Atarashii Sansu 5th grade mathematics textbook (in Japanese) Tokyo.
160

ISSUES IN TEACHING AND LEARNING ALGEBRA IN THE PRIMARY GRADES1
Tad Watanabe
Pennsylvania State University
ABSTRACT
When the National Council of Teachers of Mathematics suggested that “algebra” is a content strand that must be discussed in elementary schools, many people wondered, and still do, what algebra in elementary school looked like. Although activities related to patterns are commonly found in the US elementary mathematics resources, what specific algebra understandings we should be expecting from elementary school children is not always clearly articulated. An examination of the Japanese elementary school mathematics curriculum presented here provides us some specific ideas on what it means to teach algebra in elementary schools. INTRODUCTION When the National Council of Teachers of Mathematics (NCTM) Principles and Standards for School Mathematics was released in 2000, some people were surprised to see that it was organized according to standards that were common to all grades from prekindergarten through 12. These standards comprise five process standards – “ways of acquiring and using content knowledge” – and five content standards, one of which is algebra. I think there may have been some questions about what algebra meant, especially in elementary school. Principles and Standards describes it as follows:
Instructional programs from prekindergarten through grade 12 should enable all students to—
• understand patterns, relations, and functions; • represent and analyze mathematical situations and structures using algebraic
symbols; • use mathematical models to represent and understand quantitative relationships; • analyze change in various contexts. (p. 37)
An earlier NCTM standards document, the 1989 Curriculum and Evaluation Standards, did not have an algebra standard for the K–4 grade band. It did, however, have a standard for patterns and relationships: 1 Presented at Improving Mathematics Teaching and Learning Through Lesson Study, May 20-21, 2005, Chicago.
161

In grades K–4, the mathematics curriculum should include the study of patterns and relationships so that student can—
• recognize, describe, extend, and create a wide variety of patterns; • represent and describe mathematical relationships; • explore the use of variables and open sentences to express relationships. (p. 60)
In the Curriculum and Evaluation Standards, the discussion of the patterns and relationships standard included activities that could be done with children. One of these activities was representing patterns on a hundred chart (p. 62). Representing Patterns on a Hundred Chart For example, children can be asked to shade in all multiples of 3 as shown in the chart below. (This might be considered a ninety-nine chart, rather than a hundred chart.) Shading multiples of 3 makes a staircase pattern that goes up to the right.
The Curriculum and Evaluation Standards suggests asking students questions like, “What would happen if you extend this hundred chart? What would happen if you extend this hundred chart to two hundred?” Children might be encouraged to look at other number patterns and to examine them on the hundred chart. Another question that can be asked is, what happens when you put the same pattern on different kinds of charts? For example, what would happen if you had the multiples of 3 on a chart that has eight rather than ten columns? The staircase pattern occurs again but now it goes down to the right.
162

Putting the multiples of 3 on a chart that is twelve columns wide yields a very straightforward pattern.
Some children might recognize the pattern of shaded multiples of 3 above as similar to the pattern of multiples of 5 on a hundred chart that is ten columns wide shown below:
163

This suggests the question, “How can we get a different pattern by shading multiples of 5 on a chart?” Here is what happens when multiples of 5 are shaded on a chart that is eight columns wide – a pattern but not like the staircase patterns that we saw before with 3s.
164

Here is what happens when the chart is twelve columns wide and multiples of 5 are shaded:
Can we make multiples of 5 show up as a staircase pattern? (This is a problem with open end-products as discussed in Jerry Becker’s talk.) Here is one possibility:
When multiples of 3 are shaded on the chart above, the staircase goes down to the right:
165

We’ve been looking at 3 and 5, what would happen if we shaded multiples of other numbers? Shading multiples of 4 gives the same pattern as shading multiples of 3. Why is that? Why should shading multiples of 3 and shading multiples of 4 create the same pattern on this chart?
These charts can be the basis for some interesting discussion about the relationship between the patterns and the dimensions of the charts. These ideas and other activities involving patterns are based on the suggestions in the 1989 Curriculum and Evaluation Standards. Treatment of Algebraic Thinking in Japanese Textbooks Next, I will consider how ideas related to algebraic reasoning are treated in problems and activities in elementary school textbooks in Japan. In grade 1, before students study the addition operation formally, there is a chapter on composing and decomposing of numbers. At the end of the unit in which that chapter occurs, students work with the composition and decomposition of 10. The picture below is associated with an activity, in which the students work with counting blocks and a case sized to fit 10 of the blocks.
166

(Sugiyama & Hironaka, 2006a, p. 25)
The children can take turns, one child will cover some of the blocks and the other one has to figure out how many are hidden. At the end the students might write down the different combinations – in adult terms, pairs of numbers whose sum is 10. The teacher’s manual says of this activity:
One of the main objectives of this unit is to help students see a number from multiple perspectives. This is a foundation for functional (algebraic) thinking because, in order to see a number in relationship to others, we must pay attention to any dependency relationship or rule for correspondence. Thus, with decomposition of 10, once you pick “1”, then the other number, “9,” is determined. Furthermore, if the first number increases 1, 2, 3, . . . , the other number will decrease 9, 8, 7, . . . (Tokyo Shoseki, 1998, p. 56, translated by Watanabe)
In connection with this activity, the teacher’s manual notes, “First graders cannot develop such a perspective automatically, and teachers may want to order the (written) combinations or display the blocks so that a pattern might be noticed visually” (Tokyo Shoseki, 1998, p. 57, translated by
167

Watanabe). At the end of the lesson, teachers might organize different number combinations in sequence, so that the students might see a pattern in the combinations. Although the main focus of this unit in which this activity occurs is composition and decomposition of numbers, algebraic ideas also underlie activities involving composition and decomposition. At the end of the introductory unit on addition operation, there is a page that may suggest the U.S. practice of addition facts using flash cards. However, note what is going on in the two lower pictures. In the bottom left picture, we see a girl grouping together combinations that have the same sum. In the bottom right picture, we see three children playing a game. One child picks a number between 2 and 10 and the others try to find all the combinations with that number as the sum. In this activity children are not simply practicing addition facts, but they’re learning to see the numbers from 2 to 10 as the sum of two numbers in many different ways.
(Sugiyama & Hironaka, 2006a, p. 33)
168

Aspects of these activities are related to statements about algebraic thinking in the Principles and Standards for School Mathematics.
When students notice that operations seem to have particular properties, they are beginning to think algebraically. For example, they realize that changing the order in which two numbers are added does not change the result or that adding zero to a number leaves that number unchanged. Students' observations and discussions of how quantities relate to one another lead to initial experiences with function relationships, and their representations of mathematical situations using concrete objects, pictures, and symbols are the beginnings of mathematical modeling. (p. 91)
Another example from Japanese textbooks that may help to make children aware of properties of operations occurs in grade 2 when students are learning multiplication. In Japanese textbooks when multiplication is first introduced, a product is the cardinality of collections of equal sets. The multiplicand is the size of the sets and the multiplier indicates how many sets there are. Students also learn to write multiplication sentences. They begin with multiplication facts for 2s and 5s, starting with 2 as a multiplicand, and eventually develop all of the other facts. (For an outline of the numbers and operations topics in Japanese K–6 textbooks, see Lee, 2001, pp. 80–81.) As with in U.S. textbooks, development of multiplication facts goes in sequence. After students work with facts for 2s and 5s, they look at 3s. We see this question in the textbook:
What number do you need to add to 3 × 4 to get the answer for 3 × 5. Find the answer for 3 × 6 by looking at the answer for 3 × 5.
(Sugiyama & Hironaka, 2006b, p.23)
After 3s facts, students go on to 4s facts. Again, students are asked questions about relationships among the facts, but the questions are not exactly the same. Here the questions are: If you increase the multiplier of 4 × 3 by 1, how much larger will the answer be? What if you increase the multiplier of 4 × 4 by 1? [Note: In the Japanese curriculum, the first factor in a multiplication sentence is the multiplicand and the second factor is the multiplier.] Accompanying these questions is a chart where students can fill in and start thinking about that relationship, when the multiplier increases by 1, the product increases by the multiplicand:
169

(Sugiyama & Hironaka, 2006b, p. 25)
Students have already looked at 5, so the next number is 6. For the 6 tables, students construct the multiplication facts in many different ways. One of the ways is suggested by the picture below, in which the character says “In the 6 table when the multiplier increases by 1, the product increases by 6.”
In the 6 table, when the multiplier increases by 1, the product increases by 6. So, . . .
(Sugiyama & Hironaka, 2006b, p. 33)
This property – when the multiplier increases by 1, then the product increases by the multiplicand – is not always discussed in the United States. It is a special case of the distributive property, that is, when a, b, and c are numbers, then a × (b + c) = a × b + a × c. If the multiplier is 6 and the multiplicand m is increased by 1, then 6 × (m + 1) = 6 × m + 6 × 1. This special case of the distributive property is used to help students develop the multiplication tables. Elementary students are also prompted to think about other kinds of relationships between two numbers. In the relationship just discussed, the multiplier and the product both change. In grade 4, students start studying the idea of covariation – two quantities changing together simultaneously – a little more formally. Here is the opening problem in the unit on covariation: You first fill a one-liter measuring cup half-way. This measuring cup has deciliter marks on the left and right sides. (Students have studied the deciliter and know that one liter is 10 deciliters.) The textbook asks questions like these:
170

(Sugiyama & Hironaka, 2006c pp. 54-55)
• What happens if you tilt the measuring cup?
– When the number on the left increases, the number on the right ________. – When the number on the right increases, the number on the left _______.
If the measuring cup tilts to the right, the number on the right side increases and the number on the left decreases. Note that the sum of the numbers on the left and right remains constant, the sum is always 10. This repeats a theme from grade 1: composition and decomposition of numbers; in particular, composition of 10. It’s an amazing subtlety of the Japanese textbooks that these themes recur. Covariation recurs as well. For example, when students are studying circles and measuring different features of circles there are problems like this:
Let’s look into how the circumferences of the circle change when their diameters change.
(Sugiyama & Hironaka, 2006d, p. 82)
Teachers may consider this problem only as practice in finding the circumference for a given diameter. But that’s not necessarily the only point of this problem. Students also have to think about how the circumference changes when the diameter changes, and what happens to the circumference if the diameter doubles or triples – also about whether there is anything that does not change. So, in this problem, even though the main focus is more about learning about different measurements of a circle, there’s an underlying current of algebraic reasoning. In grade 6, students study proportions more formally. Proportions are an important vehicle for algebraic thinking, but, rather than begin with proportions, the grade 6 unit opens with various
171
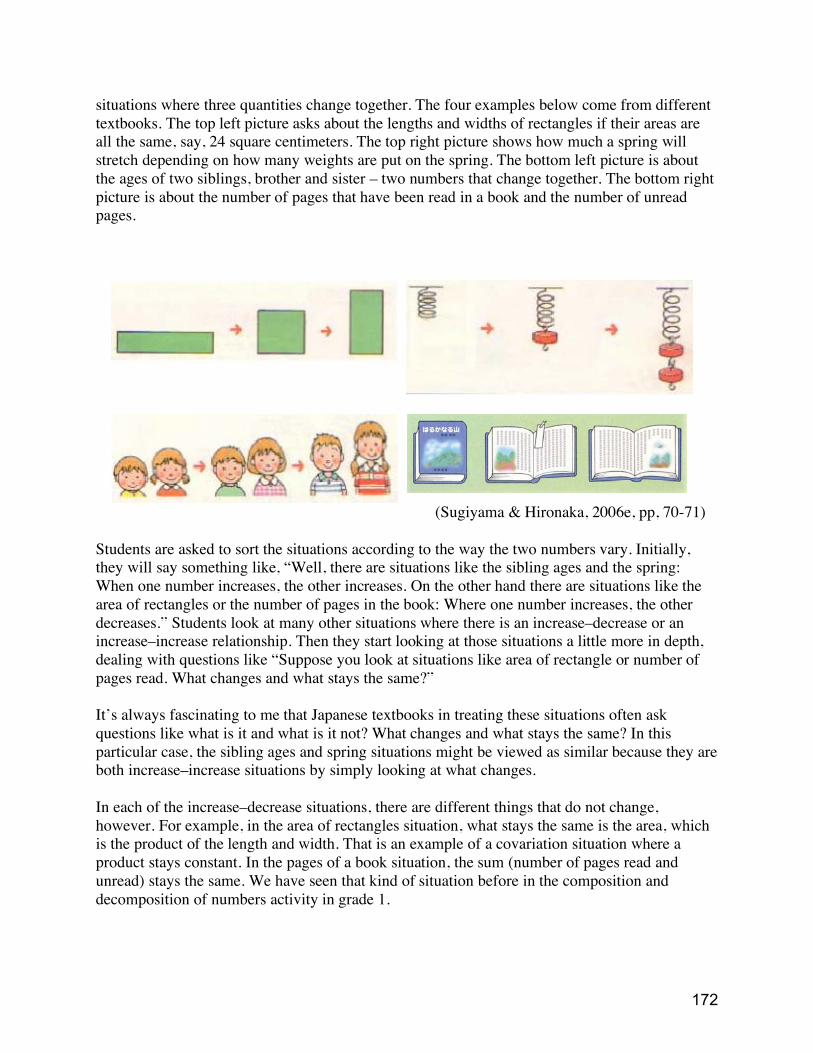
situations where three quantities change together. The four examples below come from different textbooks. The top left picture asks about the lengths and widths of rectangles if their areas are all the same, say, 24 square centimeters. The top right picture shows how much a spring will stretch depending on how many weights are put on the spring. The bottom left picture is about the ages of two siblings, brother and sister – two numbers that change together. The bottom right picture is about the number of pages that have been read in a book and the number of unread pages.
(Sugiyama & Hironaka, 2006e, pp, 70-71)
Students are asked to sort the situations according to the way the two numbers vary. Initially, they will say something like, “Well, there are situations like the sibling ages and the spring: When one number increases, the other increases. On the other hand there are situations like the area of rectangles or the number of pages in the book: Where one number increases, the other decreases.” Students look at many other situations where there is an increase–decrease or an increase–increase relationship. Then they start looking at those situations a little more in depth, dealing with questions like “Suppose you look at situations like area of rectangle or number of pages read. What changes and what stays the same?” It’s always fascinating to me that Japanese textbooks in treating these situations often ask questions like what is it and what is it not? What changes and what stays the same? In this particular case, the sibling ages and spring situations might be viewed as similar because they are both increase–increase situations by simply looking at what changes. In each of the increase–decrease situations, there are different things that do not change, however. For example, in the area of rectangles situation, what stays the same is the area, which is the product of the length and width. That is an example of a covariation situation where a product stays constant. In the pages of a book situation, the sum (number of pages read and unread) stays the same. We have seen that kind of situation before in the composition and decomposition of numbers activity in grade 1.
172

In the two increase–increase situations, different quantities stay constant. In the age of the siblings situation, the difference in ages stays the same. In the spring situation, the quotient of spring length to number of weights stays the same. Of these four situations, the spring situation is the only one that shows a proportional relationship. The students will examine these different situations more closely, for example, they might graph the way the two quantities change or they might use tables to see what kind of things they notice. The bottom situations where either the sum or the difference stay constant are also important situations in algebra, for both are examples of relationships that are linear but not proportional. Treatment of Algebraic Thinking in U.S. Textbooks The problems in the examples just given are not unique to Japanese textbooks. In fact, similar problems occur in U.S. textbooks. This example comes from a textbook series from a large publisher. It occurs in grade 1 in one of the first units, before students formally study addition and subtraction. In this activity, students are asked to make different trains of length 4 in red and blue, and write down the number of red parts, blue parts, and the total. As in the grade 1 Japanese activity involving blocks, the activity involves different combinations with a fixed sum, in this case, 4.
(Clements, Jones, Moseley, and Schulman 1999a, p. 49)
173

In this example from the teacher’s manual, an icon at the left indicates that this activity is connected with algebra, but there’s no further elaboration about the nature of this connection. So in what way is this activity related to algebraic reasoning? What is the algebraic reasoning that’s involved in this particular problem? Unlike the discussion of the blocks activity in the Japanese teacher’s manual, there is no suggestion to write these combinations in sequence so that the students might be able to discover how pairs of numbers with the same sum are related. Instead, the answers shown in red in the teacher’s manual are not written in any sequence. The next example comes from the grade 3 multiplication unit from the same series (the figures in the picture are Barbie dolls). It concerns the idea of adding to obtain a new multiplication fact from a known multiplication fact.
• Look at the facts with 3 as a factor. What patterns do you notice?
(Problem for Ss) • Students identify patterns, which is important in developing algebra sense. Have students make a list of multiplication facts with 3 as a factor to see that they can always add 3 to a fact to find the next fact. (Comments for Teachers)
(Clements, Jones, Moseley, and Schulman 1999b, p. 222) The textbook asks students, “Look at the facts with 3 as a factor, what patterns do you notice?” The teacher’s manual says that identifying patterns is important in developing algebra sense and that students should make a list of multiplication facts with 3 as a factor to see that they can always add three to a fact to find the next fact. One of the problems with this activity is that the textbook series does not make a clear distinction between multiplier and multiplicand, so “multiplication facts with 3 as a factor” include three times four and four times three. Thus, when students to list multiplication facts with 3 as a factor, it’s possible that some students will make a list: 3 times 1 and 1 times 3, 3 times 2 and 2 times 3. If that happens, would students be able to see that 3 can be added to a fact to find the next fact. And what does it mean a fact to be the “next fact”? And what does it mean to “add 3 to a fact”? A fact is not a number.
174

Grade 6 of this series includes proportions. This is one of the opening problems:
The extent to which a spring will stretch depends on the amount of force or weight applied to it. This relationship is known as Hooke’s Law. Look at the illustration to answer the following questions. 1. How long is the coil when a 10-pound weight is applied to it? 2. What weight was applied to the coil if the coil stretched to 6 in.? 8 in.? 3. Make a table that shows the relationship between the weight and the length of the coil. Describe any patterns that you see. (Clements, Jones, Moseley, and Schulman 1999c, p. 341)
This is the same situation used in the grade 6 Japanese textbook. However, the Japanese textbook did not include numbers for this situation, and others. For example, in the ages of children situation, it did not say how many years apart the siblings are. The only situation that included a number was the area of the rectangle situation, and that number stayed constant. In the U.S. treatment, the problem involves two numbers, both of which are changing. Students are asked to make a table and look for a pattern. So there are some differences in the way these two situations are treated in the two textbooks. Perspectives on Algebraic Thinking Principles and Standards for School Mathematics identifies two central themes of algebraic thinking as appropriate for young students: generalizations and using symbols to represent mathematical ideas, and representing and solving problems.
For example, adding pairs of numbers in different orders such as 3 + 5 and 5 + 3 can lead students to infer that when two numbers are added, the order does not matter. As students generalize from observations about number and operations, they are forming the basis of algebraic thinking. (p. 93)
Mark Driscoll (1999) takes the perspective that algebraic thinking is related to habits of mind. In his view, when people think algebraically in order to explore or solve problems, certain habits of thinking come into play. A facility with algebraic thinking includes being able to think about functions and how they work, and to think about the impact that a system’s structure has on calculations. Three of the habits of mind involved in algebraic thinking identified by Driscoll are: building rules to represent functions, doing and undoing, and abstracting from computation.
175

Doing and undoing can come into play in elementary school mathematics. For example, consider the relationship of the four operations – addition and subtraction, multiplication and division. Driscoll points out that building rules for functions and doing–undoing are, in a sense, complementary to each other, because with the deeper understanding you develop about the rules you can think about doing and undoing. Conversely, when you think about doing or undoing that might help you think about the rules. Abstracting from computation, as Driscoll notes, can also come into play in elementary school, because what is abstracted are the structures that underlie arithmetic computations. The word “algebra” does not appear in the Japanese course of study for elementary school mathematics. Instead, the course of study has four content domains: numbers and calculations, quantities and measurements, geometric figures, and quantitative relations. Ideas involving algebraic reasoning are discussed under quantitative relations. The Teaching Guide, a document published by the Ministry of Education to clarify the course of study, lists under quantitative relations, “The objectives of this domain cover a wide range that can be divided into three categories: Idea of function, writing and interpreting mathematical expressions, and statistical manipulations” (Takahashi, Watanabe, & Yoshida, 2004, p. 36). The U.S. algebra standards for the elementary school involve the first two categories: Thinking about the idea of functions, and writing and interpreting mathematical expressions. (Writing mathematical expressions was discussed by Toshiakira Fujii in his talk.) This statement also appears in the Teaching Guide: “The contents of this domain include . . . items which are useful in examining or manipulating contents in other domains. . . . [A]n important aim of this domain is to understand the contents in other domains using the ideas and methods discussed in this domain” (p. 36). So the ideas in this domain of quantitative relations, including ideas of functions or including understanding of mathematical expressions, are supposed to be helpful and useful in understanding numbers and operations, geometry, and measurement. CONCLUSION I have several concluding thoughts after examining Japanese and U.S. materials. One is that algebra in elementary school goes much beyond the study of patterns. I think that we in the United States are really good at helping students look for and study patterns. But, algebra, even in elementary school, must go beyond the study of patterns, which is also suggested by NCTM’s Principles and Standards for School Mathematics. The examples from the Japanese textbooks might give us some concrete ideas about what content beyond patterns are appropriate in elementary schools. Another thought that I had after looking at these materials is that algebra in elementary school is just as much a process standard as a content standard. If you’re teaching algebra in later grades of middle school or high school, algebra is really a content that we want students to understand. But algebra in elementary school is in many ways like a process standard. It’s a way of thinking and it’s a way of thinking that will help students understand many different ideas and other content. You can easily say algebra happens everywhere in school mathematics, but that’s easier said than done. We don’t always articulate that relationship well.
176
I think we need to study instructional materials carefully, kyozaikenkyu, as Makoto Yoshida would say. First, to identify where algebraic reasoning is used as a process to understand something. That may help to identify the main focus of a lesson – and that should help to make a big difference in teaching that lesson. Studying instructional materials can also help us know other important aspects of a lesson and how they are related to algebraic reasoning. Finally, I think lesson study is a really powerful tool for mathematics educators, whether they’re classroom teachers, teacher educators, or mathematics education researchers, to gain deeper insights into this idea of algebra as a process standard. REFERNCES Clements, D. H., Jones, K. W., Moseley, L. G., and Shulman, L. (1999a). Math in My
World, Grade 1: Teacher’s Edition. New York: McGraw-Hill. Clements, D. H., Jones, K. W., Moseley, L. G., and Shulman, L. (1999b). Math in My
World, Grade 3: Teacher’s Edition. New York: McGraw-Hill. Clements, D. H., Jones, K. W., Moseley, L. G., and Shulman, L. (1999c). Math in My
World, Grade 6: Teacher’s Edition. New York: McGraw-Hill. Driscoll, M. (1999). Fostering algebraic thinking: A guide for teachers grades 6–10.
Portsmouth, NH: Heinemann. Lee, S.-Y. (2001). Student curriculum materials: Japanese teachers’ manuals. In Knowing and
learning mathematics for teaching: Proceedings of a workshop (pp. 78–85). Washington, DC: National Academy Press. Retrieved March 18, 2006 from http://books.nap.edu/books/0309072522/html/78.html#pagetop
National Council of Teachers of Mathematics. (1989). Curriculum and evaluation standards for school mathematics. Reston, VA: Author.
National Council of Teachers of Mathematics. (2000). Principles and standards for school mathematics. Reston, VA: Author.
Sugiyama, Y. & Hironaka, H. (2006a) Mathematics 1. [English translation of Shintei Atarashii Sansu.] Tokyo: Tokyo Shoseki.
Sugiyama, Y. & Hironaka, H. (2006b) Mathematics 2B. [English translation of Shintei Atarashii Sansu.] Tokyo: Tokyo Shoseki.
Sugiyama, Y. & Hironaka, H. (2006c) Mathematics 4B. [English translation of Shintei Atarashii Sansu.] Tokyo: Tokyo Shoseki.
Sugiyama, Y. & Hironaka, H. (2006d) Mathematics 5B. [English translation of Shintei Atarashii Sansu.] Tokyo: Tokyo Shoseki.
Sugiyama, Y. & Hironaka, H. (2006e) Mathematics 6A. [English translation of Shintei Atarashii Sansu.] Tokyo: Tokyo Shoseki.
Sugiyama, Y., Itoh, S., & Iitaka, S. (2002). Atarashii Sansu, Grade 6, Vol. 2. Tokyo: Tokyo Shoseki. (in Japanese)
Takahashi, A., Watanabe, T., & Yoshida, M. (2004). Elementary School Teaching Guide for the Japanese Course of Study: Arithmetic (Grades 1-6). [Translation of Sansu Shidosho, by the Ministry of Education (1989).] Madison, NJ: Global Education Resources.
Tokyo Shoseki (1998). Atarashii Sansu: Teacher’s Edition. Tokyo: Tokyo Shoseki. (in Japanese)
177
COHERENT IN-DEPTH CURRICULAR PATHS: EARLY NUMBER SENSE DEVELOPMENT1
Aki Murata, Stanford University
ABSTRACT Japanese teaching practices and curricula differ markedly from those in the U.S. The research results reported here are part of a doctoral dissertation that examined teaching practices of an experienced teacher in a Japanese school in Chicago. The school is staffed entirely by certified teachers from Japan and is run much as are schools in Japan. All instruction is conducted in Japanese, and the school maintains the Japanese way of teaching and learning. The author uses her study of a Grade 1 classroom to illustrate key aspects of Japanese teaching representative of “coherent in-depth curricular paths,” and in particular teacher support for the whole class and individual students over time.
COHERENT IN-DEPTH CURRICULAR PATHS I was born and raised in Japan, and I became a teacher in the United States. By teaching in U.S schools, I came to understand that American teachers face challenges different from those faced by Japanese teachers. One of the biggest challenges I experienced as a U.S. teacher was having to create my own program. There is so much material available, and American teachers are expected to cut and paste different parts of the curriculum together. In the process, we can lose sight of the structure altogether, lose sight of what we are doing, of why we are teaching a topic. On the other hand, Japanese textbooks are so frugal that they provide only the barest structure for teaching. Based on them, Japanese teachers need to create their own teaching path. I had the opportunity to work with Japanese teachers in Chicago at the Japanese school. I experienced how they planned, taught, and assisted children’s learning over several years. My dissertation was based on the data collected in the course of an 11-lesson unit on Grade 1 addition of numbers that sum to a teen number. The unit I studied had the following characteristics: • a conceptually solid, meaningful teaching and learning path, typically for a certain aspect
of a subject • carefully designed curricular scope and sequence
1 Presented at Exploring Collaborations in Science and Mathematics Education, March 17-19, 2003, San Francisco
178

• new learning is an extension of prior learning; experiences build on and support one another from topic to topic, subject to subject, sometimes strand to strand
• coherent theme, may be supported by common representations. I call the curricular design with the above characteristics coherent in-depth curricular path. We think that research on coherent in-depth curricular paths has great potential to help educators learn about effective teaching and learning taking place in both Japan and the U.S. Research Model/Design Japanese teachers’ manuals lay out different mathematics topics as the scope and sequence. Figure 1 illustrates a scope and sequence from the publisher Tokyo Shoseki for numbers and calculations, which includes various topics connected from one grade to another. U.S. manuals and textbooks sometimes also contain a scope and sequence, but the ways in which the different topics and subjects are connected may be very different from those in the Japanese curriculum.
Figure 1. Example of Scope and Sequence for Number Sense (Whole Numbers) in Japanese Mathematics Curriculum (adapted from Tokyo Shoseki, 2000).
Grade 1 Grade 2 Grade 3 Grade 4 Grade 5 Grade 6 • Sets • Numbers
up to 10 • Ordinal
numbers • Numbers
up to 20 • Numbers
up to 100 • Place
values of two-digit numbers
• Counting by grouping
• Seeing a number as a total or a difference of two numbers
• Number lines
• Numbers up to 1000
• Numbers up to 10000
• Place values of three- and four- digit numbers
• Composition and decomposition
• Relative size of quantities
• Large numbers (up to 10000000)
• Numbers multiplied by and divided by 10s
• Relative size of quantities
• Large numbers
• Base ten system
• Rounding • Relative
size of quantities
• Base-ten system with whole and decimal numbers
• Factors and multiples
• Even and odd numbers
• Number system and analysis
179

Our research on “coherent curricular paths” included the following: • analysis of the curricular path • in-depth analysis of the scope and sequence • careful examination of the connections made between different learning stages with
related concepts • how common representations may be introduced to students to help them learn about the
concept • classroom enactment of the curriculum • how the curriculum and students (with different levels of understanding/prior experience)
interact • how various forms of support (teacher, student, curricular) may be provided for student
learning. Analysis of the Coherent Curricular Path With regard to the first part of the model, analysis of the coherent curricular path, I would like to use, as an example, the Japanese teaching-learning trajectory for whole numbers and addition/subtraction in the early elementary grades. For this strand, Japanese classroom teachers start with number embeddedness. Figure 2, again from the Tokyo Shoseki mathematics textbook, shows the representations used in Grade 1 to introduce number embeddedness very early in the school year.
Figure 2. Examples of Representations Used Across Different Grade Levels.
180

In first grade, the teacher might say something like: “Eight is which two numbers? What two numbers make up eight?” Seeing numbers as embedded lays the groundwork for later addition with regrouping, accustoming students to ask themselves what numbers to put together to make ten. For example, when a student is later asked to add nine and four, understanding of embeddedness may enable a student to think, “So, what do we need with nine to make ten? One. Let’s bring one from four, decompose four into one and three, add the one to the nine to make ten, and then add three to ten at the end to make thirteen.” As the students advance in upper grades, they connect this concept with multi-digit addition and subtraction, and with larger numbers in even higher grades. In Japan, the progression of number embeddedness takes the following course: • decomposition of numbers - “ikutsu to ikutsu?” (“how many and how many?” early
Grade 1) • addition and subtraction with totals smaller than 10 (early Grade 1) • 10 -digit addition and subtraction (Grade 2) • addition and subtraction of large numbers (Grades 3 & 4). Coherent Representations Used Across Different Learning Topics in the Sequence In U.S. classrooms, different representations may be used without really helping children make connections between them. In the Japanese curriculum, there is a coherent set of representations for presenting similar concepts across the grades. For example, in the right column of Figure 2, the tape-like representation becomes increasingly simplified as the grade level goes up, but the underlying concept remains the same: There’s a whole, and there’s a part of it. This is how the concept is introduced, and then it is expanded over the grades. Curriculum Enactment in the Classroom There are strong themes running through the Japanese curriculum, especially in the early elementary grades, such as whole number addition and subtraction. The definitive issue is how the curriculum is implemented in the classroom. The study results I’m going to outline here are part of the results of my dissertation study, conducted at Northwestern University, with Karen Fuson as my committee chair. The study participants were 25 Japanese 1st grade students and their classroom teacher at the Japanese School in Chicago. It’s important to note that this is not a weekend school, but a full day school, with classes in session Monday through Friday. The teachers are certified teachers from Japan. They use a Japanese curriculum and they speak in Japanese. The group of Japanese people whose children attend this school are different from other groups of immigrants who come to this country to stay. Knowing that they are here for a limited amount of time, say, two to five years, they choose to send their children to this all-day,
181

official Japanese school, to maintain the Japanese way of teaching and learning. For me, finding this school was like finding a little Japan in the middle of Chicago. The focus of this study was on the unit of teens addition. The goal of this unit was to teach children a particular way of adding numbers to make teen numbers. I observed all 11 lessons of the unit, interviewed the teacher every day after she finished teaching, and collected various classroom artifacts (copies of worksheets, tests, quizzes, etc.). I also chose six target students of various levels of understanding, and tracked their progress in learning the method for adding numbers. Table 1 (below) shows the coding analysis framework I used.
Table 1. Levels of Teacher Support for Learning the Break-Apart-to-Make-Ten Method
182

For Japanese colleagues, this top image will be familiar. I took this image directly from the children’s textbook. Here are the steps students took in the break-apart-to-make-ten method: 1) decomposing, or realizing that 9 needs 1 more to make 10 2) decomposing 4 into two numbers, 1 and 3 3) adding 9 and 1 to make 10 4) adding 10 and 3 to make 13. As I started analyzing the transcript and my field notes, I noticed that teacher support decreased gradually as children became more fluent with the method. The first few lessons, the teacher asked specific questions for all four steps. But as the unit progressed, he stopped supporting the first step, then he stopped supporting the third step, and at the end, he stopped supporting all steps and the kids were on their own. I used the following analysis framework to code my transcripts, so it would reflect the steps the students took to add the numbers by making ten, and the corresponding levels of teacher support. I also analyzed how the structure and activity in the classroom changed from the whole class practice of shouting answers together, to individual students giving answers. ANALYSIS CODING FRAMEWORK • steps students took in the break-apart-to-make-ten method: steps 1, 2, 3 and 4 • teacher support levels: A, B, C, D, and E • whole class and individual students. Shifting Teacher Support Table 2 below describes the teacher’s shifting levels of support across lessons 1 through 11. The teacher’s support levels are shown on the right side of the table (Levels A through E, no support, and varied support). At the beginning of the unit the teacher was providing all the support (Level A). As the unit progressed, the direction was toward not supporting the students at all. There is some going back and forth among the levels, signifying that the teacher varied his level of support as the unit progressed, and adjusted his support to meet the different needs of individual students. For example, the teacher might initially provide Level C support, then realize that the child was not quite ready, and so shift back to Level B support. That happened spontaneously in the classroom. The different types of activities in the lessons are shown on the left side of the table. The participation structure depended on these types of activities and affected support. Sometimes the teacher shifted to give less support during whole class practice, but provided more support when individual students started giving answers. When the teacher support in the whole class context was not sufficient for the slower students, he provided different support during individual work time. And then the students helped each other, too.
183
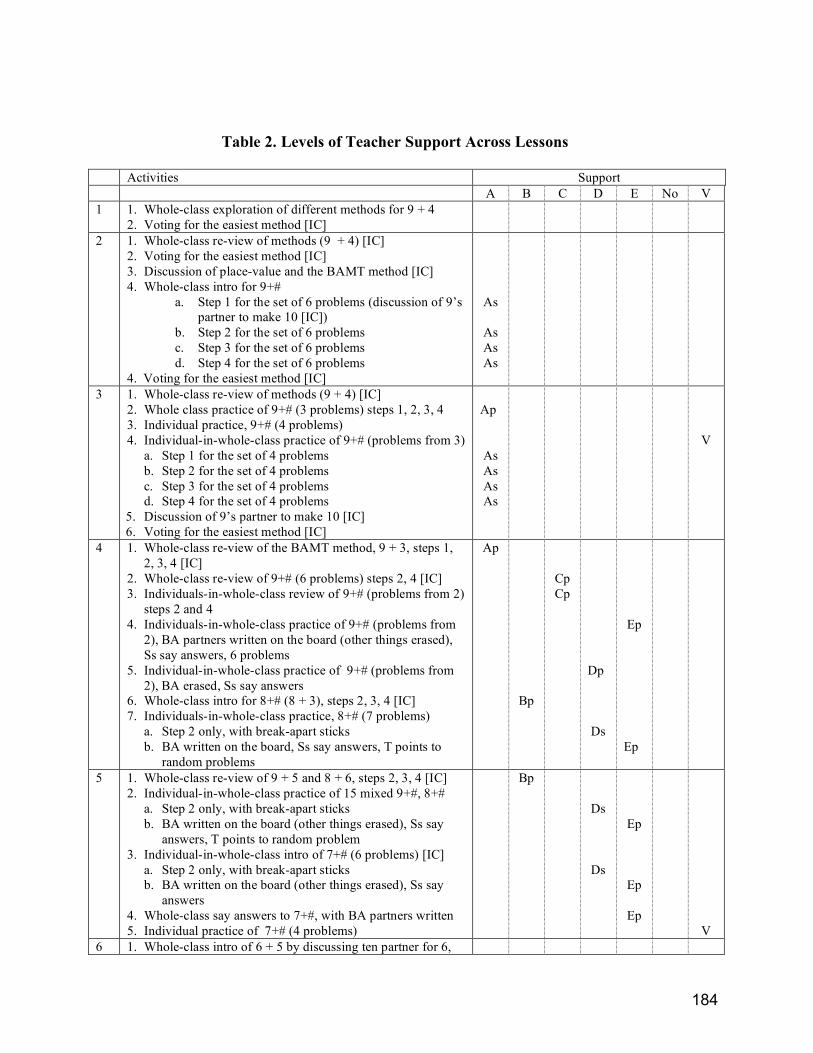
Table 2. Levels of Teacher Support Across Lessons Activities Support A B C D E No V 1 1. Whole-class exploration of different methods for 9 + 4
2. Voting for the easiest method [IC]
2 1. Whole-class re-view of methods (9 + 4) [IC] 2. Voting for the easiest method [IC] 3. Discussion of place-value and the BAMT method [IC] 4. Whole-class intro for 9+#
a. Step 1 for the set of 6 problems (discussion of 9’s partner to make 10 [IC])
b. Step 2 for the set of 6 problems c. Step 3 for the set of 6 problems d. Step 4 for the set of 6 problems
4. Voting for the easiest method [IC]
As
As As As
3 1. Whole-class re-view of methods (9 + 4) [IC] 2. Whole class practice of 9+# (3 problems) steps 1, 2, 3, 4 3. Individual practice, 9+# (4 problems) 4. Individual-in-whole-class practice of 9+# (problems from 3)
a. Step 1 for the set of 4 problems b. Step 2 for the set of 4 problems c. Step 3 for the set of 4 problems d. Step 4 for the set of 4 problems
5. Discussion of 9’s partner to make 10 [IC] 6. Voting for the easiest method [IC]
Ap As As As As
V
4 1. Whole-class re-view of the BAMT method, 9 + 3, steps 1, 2, 3, 4 [IC]
2. Whole-class re-view of 9+# (6 problems) steps 2, 4 [IC] 3. Individuals-in-whole-class review of 9+# (problems from 2)
steps 2 and 4 4. Individuals-in-whole-class practice of 9+# (problems from
2), BA partners written on the board (other things erased), Ss say answers, 6 problems
5. Individual-in-whole-class practice of 9+# (problems from 2), BA erased, Ss say answers
6. Whole-class intro for 8+# (8 + 3), steps 2, 3, 4 [IC] 7. Individuals-in-whole-class practice, 8+# (7 problems)
a. Step 2 only, with break-apart sticks b. BA written on the board, Ss say answers, T points to
random problems
Ap
Bp
Cp Cp
Dp Ds
Ep
Ep
5 1. Whole-class re-view of 9 + 5 and 8 + 6, steps 2, 3, 4 [IC] 2. Individual-in-whole-class practice of 15 mixed 9+#, 8+#
a. Step 2 only, with break-apart sticks b. BA written on the board (other things erased), Ss say
answers, T points to random problem 3. Individual-in-whole-class intro of 7+# (6 problems) [IC]
a. Step 2 only, with break-apart sticks b. BA written on the board (other things erased), Ss say
answers 4. Whole-class say answers to 7+#, with BA partners written 5. Individual practice of 7+# (4 problems)
Bp Ds
Ds
Ep
Ep
Ep
V
6 1. Whole-class intro of 6 + 5 by discussing ten partner for 6,
184

re-views of ten partners for 9, 8, 7 [IC] 2. Individual practice of 6+# (5 problems) 3. Individual-in-whole-class report of 6+# (problems from 2)
while the rest of the class gave feedback, “It is OK!” 4. Individual practice for 16 mixed 6+#, 7+#, 8+#, and 9+#
No
V
V
7 1. Individual-in-whole-class report answers on problems solved in Lesson 6; T writes equation and answer as it is shared, class gives feedback, “It is OK!”
2. Whole-class intro for smaller+larger (4 + 8, equation and answer only) [IC]
3. Individual practice of 12 smaller+larger; teacher notices that many students are counting on, so shifts to 4.
4. Whole-class discussion on smaller+larger, 2 + 9, steps 1, 2, 3, 4, solved from 9 and from 2 [IC]
Ap
No
V
8 1. Individual practice of 11 smaller+larger problems 2. Individual-in-whole-class report answers on problems just
solved (as in Lesson 7, 1 above) 3. Individual practice of 2 word problems 4. Individual-in-whole-class report on problems just solved
(disagreement on quantifiers)
No
No
V
V
9 1. Individual practice on 8 mixed problems 2. Individual-in-whole-class report answers on problems just
solved (as in Lesson 7, 1 above) 3. Individual practice on 8 mixed problems
No
V
V
10 Like Lesson 9 (no observation) V 11 1. Whole-class report answers on 8 mixed problems solved in
previous class (as in Lesson 7, 1 above) 2. Individual practice on 6 mixed problems 3. Individual-in-whole-class report answers on problems just
solved (as in Lesson 7, 1 above)
No
No
V
Notes: The support always involved the drawing on the board and sometimes (especially for individuals) also involved fingers or counters. The support identified is standard support for the class. Some individuals might have received more support. Small “s” and “p” placed after the letter that shows the support level mean “steps” and “problems.” For example, As means Level A support for a step, Ap means Level A support for solving the whole problem. No means no support. V means varied support with students (for individual practice). [IC] means instructional conversation
VARYING LEVELS OF SUPPORT • Shift in support levels as the unit progressed • Shift to meet different needs of individual students • Shift with participation structure: whole-class, individuals in whole-class, individual
work • When the teacher support was insufficient in the whole-class context, the teacher
provided individual support and students also helped one another. Individual Students’ Learning Paths The curriculum and teacher support appeared to be excellent, but the real test of teaching effectiveness is how well students learn. I wanted to know how individual students were doing. Table 3 shows the methods used by six target students and how they develop over time.
185

Table 3. Target Student’s Externally-Supported Steps in Method Use Over 11 Lessons
Shinobu Yuichiro Kensuke Kiyomi Yukiko Akemi 1 C 1&2&3&4 2 3 4
C C
9: 2&4, a 8: a
C C
9: 2&4, a 8: 2, a
C C
9: 2&4, a 8: a
C C
9: 2&4, a 8: a
C C
9:1&2&3&4, a 8: 2, a
C C
9: 2&3&4,a 8: a
5 C C
9/8: 2, a 7: a
C C I
9/8: 2, a 7: 2, a 7: 2&4 [s]
CC I
9/8: 2, a 7: 2, a 7: a
C C I
9/8: 2, a 7: a 7: 2&4 [s]
C C I
9/8: 2, a 7: 2, a 7:1&2&3&4 [d]
C C I
9/8: 2, a 7: a 7:1&2&3&4 [d]
6 I 6: a I I
6: 2&4 [d] Mix L+S: 2&4 [d]
I 6: a I I
6:1&2&3&4 [d] Mix L+S: 2&4 [f, d]
I
6:1&2&3&4 [d]
I I
6: 2&4 [d] Mix L+S: 2&4 [d]
7 I S+L: Ct-On (from larger)
I S+L: Ct-On (from larger)
I S+L: Ct-On (from larger)
I S+L: Ct-On (from first)
I S+L: Ct-On (from larger)
I S+L: Ct-On (from first)
8 I Mix: a I Mix: a I Mix: mixed method (C-O for # less than 5, BAMT for both numbers 5 or more)
I Mix: 2&4 [d] I Mix: a (very long time per problem)
I Mix: a (many mistakes)
9 I Mix: a I Mix: a I Mix: mixed method
I Mix:2&3&4 [d]
I Mix:2&3&4 [d]
I Mix:2&3&4 [f, d]
10 11 I Mix: a I Mix: a I Mix: mixed
method I Mix: a I Mix: 2&4 [d] I Mix: 2&4 [d]
Notes: The table shows the steps supported (1-4, see Table 1) externally, by speech, drawings, and fingers, as students solved problems.
C for individual-in-whole-class practice, I is for individual practice. All class responses were at the support level being used by the whole class except when steps are shown in bold.
# before colon is the problem type (e.g., 9 means 9+# problems), # after colon is the external BAMT steps used by the students. a means only the answer was stated. Ct-On is count-on. For individual practice, external support for steps are noted as [f]: finger support, [d]: drawing, and [s]: speaking. Almost all answers in individual practice were correct except for Lesson 8 where Akemi made many mistakes. Yukiko, for the same practice, took a very long time solving problems. Because Mr. Otani often asked students who were very slow or making mistakes to use the drawings, it is likely that the change for Yukiko and Akemi from Lesson 8 to Lesson 9 stemmed from Mr. Otani directly or indirectly (perhaps via another student).
While the study shows that all the students learned to use the method to a certain fluency level by the end of the unit, what we glean from Table 3 is that there are different learning paths. Not all students learned at the same rate, or in the same way. For example, the teacher told them to do nine plus another number addition first. The next time they progressed to eight plus another number, then seven plus another number. Each time the number changed, some students shifted back to take more steps. The seventh lesson introduced a new problem
186

type of smaller addend plus larger addend. Instead of nine plus four, the problem was four plus nine. All the students went back to counting again. Over the unit, students went back and forth between methods, and sometimes required additional support and time to learn. Focal student number three, Kensuke, was a unique case. After the seventh lesson, he continued to use multiple methods. For the problem with smaller addend he continued to count, whereas for the problem with the larger addend, he made ten. As this illustrates, students displayed individual differences in how they interacted with the material. Some students also invented transitional methods to bridge their emerging understanding, counting part of the problem and then chunking the rest. From this brief study, we can conclude that this coherent in-depth curricular path: • Provided a conceptually sound learning path • Created common learning experiences from which to extend. All the students did
decomposition of numbers. That was the starting point for teens addition. Then all the students used the family of representations, providing another shared, familiar curricular element.
• In the classroom enactment, teachers started where the students were, based on their prior learning, and then
• Supported students with various degrees of scaffolding; and • Interaction between individual and whole class learning enabled students to progress. Finally, it should be noted that students’ learning, from introduction through mastery of a method, passed through three identifiable phases: Phase One: Students share their knowledge or their methods. Phase Two: Students analyze which method is the most efficient to use for a particular problem. Phase Three: Students achieve mastery in gaining fluency with the method. Future Collaborative Research What made this study unusual was the cross-cultural aspect: a Japanese classroom was analyzed from a U.S. teaching perspective. The classroom teacher, while a wonderful teacher, was not an exceptional one. He was an ordinary Japanese teacher. Effective aspects of Japanese teaching that might be invisible within the Japanese cultural context surfaced when viewed from a U.S. perspective. I believe a similar phenomenon will occur when Japanese teachers witness American practice. Future collaborative research could build our understanding of coherent in-depth curricular paths by pursuing issues such as the following: • cases that reveal how a particular curricular path looks across different classrooms and
grade levels • how learning supports differ by grade level, as well as by classroom
187

• how connections are made between concepts across different grade levels on the curricular path
• how representations are used, how they change across grade levels on the curricular path, and what their effectiveness is
• individual differences in student learning and method/strategy uses, and how these differences are treated in the classroom, on the curricular path
• how teachers provide and adapt support • what informal language students use to discuss mathematics concepts • different curricular paths across one grade level or multiple grade levels • adaptation of curricular paths to U.S. classrooms through Lesson Study. One anecdote sums up the benefits of this research. When we started to adapt this curricular path research for U.S. classrooms using lesson study, we worked with a group of elementary school teachers and introduced the idea of number decomposition. The teachers were very excited about it, and I think their excitement has multiple roots, including their feeling that they now understand the concepts better themselves. U.S. teachers are used to teaching kids to memorize addition facts, but the method of number decomposition really challenged them to think about how and what they had been teaching over the years. It was a revelation to them to see students’ learning in a different light. “Oh,” they said, “My students can do it this way instead of just memorizing from flash cards!”
188

COHERENT IN-DEPTH CURRICULAR PATHS:
EARLY NUMBER SENSE DEVELOPMENT1
DISCUSSION
Aki Murata, Stanford University Karen Fuson, Northwestern University
Elizabeth Baker, Mills College Keiichi Shigematsu, Nara University of Education
Namio Nagasu, University of Tsukuba Akihiko Takahashi, DePaul University
Susan Sclafani , U.S. Department of Education JAPANESE TEACHING METHODS Karen Fuson: The Japanese teacher studied by Aki Murata spent the whole first day of the unit eliciting students’ methods. The children tried various things, and all of their methods were validated and equally accepted, including low-level methods like counting. One child did do decomposition of ten. This was not a method that came from the teacher, but from the students, and the students voted three or four times during the course of this unit on which would be the best general method and why. That’s a really important aspect of the engagement and motivation of the students. Elizabeth Baker: Aki, you’re so convincing when you say this is normal Japanese teaching. Can you speak about that a little bit more, given your experience teaching in American schools and your knowledge of Japanese teachers? Aki Murata: This teacher was not particularly innovative, and he often taught from the students’ textbook. But when he started leading the discussion with the students, the fading in and out of scaffolding seemed to occur very naturally. It could be partly because he knew the kids, and had prior experience, even though this was only his second year teaching the first grade; he had always taught upper elementary school through middle school. So it was very impressive, but my awareness of the shifting levels of support really came after I analyzed the data.
1 Presented at Exploring Collaborations in Science and Mathematics Education, March 17-19, 2003, San Francisco
189

Elizabeth Baker: Do you think this technique is something he picked up in the course of his pre-service teacher training program, or as part of in-service training? Aki Murata: This is a question for our Japanese colleagues. Is such scaffolding taught explicitly as part of Japanese pre-service education programs? Keiichi Shigematsu: This scaffolding method is taught at university. But it’s not only that. When teachers actually start teaching in the schools, I think they deepen their understanding of this method. The teachers themselves realize that this really works when the children show a genuine understanding of the material. So the teacher in question probably incorporated this technique as he evolved as a teacher. It is taught in the university, but I think its success as a method has a lot to do with experience teachers gain on the job. Namio Nagasu: In general, the people who are chosen to teach at Japanese schools abroad, such as this Japanese school in Chicago, are from the local prefecture level, and the selection process makes sure that the person who is selected to go abroad is of a higher caliber than the teacher who remains in Japan. So I think he may have a higher level of teaching technique than the average teacher in Japan. Keiichi Shigematsu: It’s not necessarily so. Some of the teachers simply want to teach abroad; they decide on their own that they want to go, so they are chosen. But different prefectures have different methods of selecting, so it does depend on the prefecture. Akihiko Takahashi: Regarding whether the first grade teacher is an excellent teacher or an average teacher, I think he was a rather normal teacher. I also taught at a Japanese school abroad once, and the teachers are not chosen necessarily because they know math and science well, particularly elementary teachers, who have to teach every subject. Instead, this teacher has taught just according to the textbook. The teacher was able to really implement what was put into the text very effectively in the classroom. But I don’t think he’s an outstanding teacher on his own. COHERENT CURRICULAR PATH Susumu Kunimune: The idea of the coherent curricular path presented by Aki Murata is an idea helpful for the science curriculum as well, which I’m involved with. However, I think science content poses some different issues. Mathematics teachers teach proofs, a kind of expression that was discovered several centuries ago. What math teachers
190
learned in their university days they can use in their curriculum development. But science teachers have to incorporate new scientific discoveries that are still taking place. The Japanese textbooks are thin, as you can see. They are very thin because there is this coherence. But since the textbooks are thin, the teachers realize that they really have to teach in a very solid way. If the teacher just explains a concept, the students are not necessarily going to understand it. How the students manage to acquire the knowledge on their own is a very crucial step. I think that’s why we allow the students to do a lot of thinking on their own to try to learn the material. Some people say the textbooks should be really thick. I disagree with them because I think the textbooks, particularly in the early years, should be thin so only the essential things that need to be there are there. But we should also think about this as a collaborative research topic for U.S. and Japanese researchers: What should be presented in textbooks? Aki Murata: Some brilliant people said that when the textbook is thick, that shapes the students’ attitudes. They see the big textbook, and they think, “I can’t do all this in a year anyway.” When you have a thin one you can take home, the way Japanese students do, the students reaction is not only, “This is something that can be achieved in a year” but also, “It’s easily done.” Volume-wise, it’s very intimidating to have a big textbook. Karen Fuson: So there are issues to address. What needs to be in the textbook to support ordinary teachers to teach the way this teacher does? And especially, what might we in the U.S. put in our textbooks to support our teachers to teach this way? Every reform program approaches this in different ways. But the event that changes teachers is when they hear their own students answering a problem in different ways. Once they hear two or three different methods coming from their own students, they can’t teach by just telling any more. They understand that students think differently. Previously, they had this image of right answers and wrong answers, and believed they just needed to change all the minds with wrong answers. They thought they just needed to swap the right methods and the right answers for the wrong ones. But once there’s true comprehension that there are different ways of thinking, a fundamental shift occurs. As a result, there are two issues for the U.S. (and for Japan, in the case of teachers who are not yet using this method): how to help the teacher learn to shift to a different point of view; and how to support teachers after they make that shift to a different vision, and want to teach differently. Catherine Lewis: I think we can imagine in the United States instances in which teachers see students’ different ways of thinking, but do not necessarily include them in the classroom conversation – thinking, “I’ve got to move on, I’ve got to just teach them the algorithms.”
191
What I hear Karen Fuson and Akihiko Takahashi saying is that Aki Murata’s research example is an instance of typical Japanese teaching, and that somehow the teacher is better able to recognize and incorporate student thinking, probably because the curriculum is more educative. The teacher is given various examples of how children are going to think in the teacher’s manual. The teacher sees those same ways of thinking in practice. And therefore the teacher has some structure for incorporating those different ways of thinking into the practice, as opposed to feeling pressure to move on. So, for eleven lessons devoted to the addition of numbers that have a total of teens, there’s a set of materials that enables the teacher to look for what are going to be the student responses and how to draw on those. I’d like to confirm that that’s the process that’s happening, and that it’s something quite different than what’s in a U.S. textbook. Karen Fuson: Yes, and I think the structure of this unit also has the following phases: start with the student’s methods, discuss and introduce the target accessible method, which I call the “accessible efficient generalizable method,” i.e., the method the students are going to use for regrouping when they add multi-digit numbers. Essentially, the method is regrouping for single digit numbers already. So it’s a crucial foundational step, and the textbook orchestrates the numbers. I don’t know if you noticed it, but all the numbers start at nine plus something. It’s easier to think of the partner of nine. Nine and what number make ten? That’s easy. Even the lowest grade children could start with that. Then, for some of the Japanese children, eight plus something was a totally new problem, because eight has a different partner. And then the seven plus – the children aren’t seeing the generalizability of the method. And that’s nicely orchestrated, that’s in the structure of the curriculum, which helps the teachers. When the children switched to the smaller number first, it was fascinating. Even though they’ve had four days of practice, when the teacher switches from nine plus four (where all the children with some support are regrouping to make ten) to four plus nine – all the children revert to counting on: nine, ten, ten one, ten two, ten three. They’re not making the connection. They need support to use the method in this new context. But the curriculum is set up that way, as if this is anticipated. Because they had already spent so many days on the method, it was easy in one session for the teacher to help most of the children make the switch in thinking to making a ten from the larger number even if it is first. The sequence of problems in the book makes the teacher’s teaching task easier. Susan Sclafani: The notion, number one, that eleven days would be spent on this concept, and that on day one the class would do these activities, on day two you would do these, on day three and so on! Or is that specificity what the teacher brings to the textbook, which simply contains the point that you’re going to have to learn how to add two numbers that total more than ten?
192

Karen Fuson: In the curriculum itself, the scope and sequence contains day allocations. So that’s part of the national curriculum that would be in any textbook. Within this topic of addition in the teens, any textbook would teach this carrying method. Most of them would start with eliciting multiple student methods. Then different textbooks would organize the structure of the actual problems in whatever way they chose. I assume this discovery of starting with nine plus numbers came from lesson study and working with teachers, so perhaps not every textbook would start there. That would be the choice of the textbook authors, along with the particular way they orchestrate the practice. The amount of practice might also vary across textbooks. Susan Sclafani: What would happen if none of the students suggested the method that the textbook indicates is the right method to use? Karen Fuson: For most topics, the teacher’s guide will describe what methods children are likely to use, so the teacher won’t be surprised and can be prepared. Typical errors and how to overcome them would also be included. To answer your question, I think fielding the situation you’ve described would be up to the teacher. The teacher might say, “Take a look at this interesting method. Last year some of my students did this,” as opposed to saying, “Well, there is also this method.” Aki Murata: When you look at Japanese teacher’s manuals, it doesn’t only provide the anticipated methods, it explains the thinking behind them, what students might be thinking when they use this kind of method. There are also classroom adaptation variations listed in the teacher’s manual, just like in U.S. classrooms. This unit was written for twelve lessons, and then the textbook suggested some activities for fluency development at the end, which this particular teacher did not use at all. He made his own supplemental worksheets instead. So it’s not dissimilar to U.S. classrooms in that regard. There is a good framework and a good path, but it’s up to each individual teacher to teach. Susan Sclafani: But one of the major differences is that an American classroom would never spend eleven days on one topic. Aki Murata: That is so true. Susan Sclafani: And that is part of our problem. We do something for a couple of days and then say, “Oh, okay, you’ve got that.” Then we move on and the children never learn to master the topic, which seems to be one of the goals of this method.
193
Karen Fuson: Right. And though this is starting to change a little now in the U.S., we would not ordinarily have particular methods that are supported. For us, moving from counting all the things to counting on is the really important step to take because all students can then solve teen addition problems. Also counting on to the total for subtraction is much easier and more accurate than counting down. To learn the make-a-ten method requires three prerequisites, each of which requires automaticity. Children have to know the partner to make ten, be able to separate the smaller number into that partner and the rest, and know all of the problems like 10 + 6 = 16. The method is easier in Japanese because of the teen number words that include the ten: 11 is ten one, 12 is ten two, 13 is ten three. Thus, the third prerequisite is easier in Japanese Even if you wanted to teach a different general accessible method, such as counting on, you could use exactly the same phases and the same explanation in the textbook to support the teachers, helping the teacher back away gradually as students are able to do problems themselves or go in when the students needs help. I think most U.S. teachers could do that. They naturally do it in other areas, but they aren’t thinking strategies, they’re thinking answers in mathematics. Many are not thinking solution methods, they’re just thinking right or wrong. Susan Sclafani: Do you know any American text or programs that take this approach? One of the challenges for many teachers in Everyday Math is that the method is not laid out clearly. It assumes instead that teachers know a great deal more than many of them do, and so they get stuck. Karen Fuson: Right, it does, and it has too much spiral curriculum within a year. What I’ve been trying to do in my Children’s Math Worlds research-based program is exactly this core grade level chunked program that focuses on methods. Students invent first, but that part is very abbreviated. Then the teacher proceeds to a core, research-based accessible algorithm that fits student thinking and for which the program has already built the prerequisites, just as the Japanese books did for the make-a-ten method. That’s what my research has been about: what works across the spectrum of U.S. schools? What are the accessible algorithms that work for students and for teachers? What I’m finding in all areas is that two actually work well, and different students choose different methods from these two. They also relate to the common algorithms so that students and teachers are not confused by these. Aki Murata: To finish up, I’d like to say one more thing to our Japanese colleagues. The value I see in doing research like this is that Japanese education has such a well thought-out path for teaching and learning, developed through years of practice and analysis of the children’s learning. You may take it for granted, but when a U.S. person goes into your classrooms, we are awed. We don’t know where to start. So this research
194

may be a good place to identify the strengths in your teaching and learning, in your whole educational system, so that we can grow together.
195

THE INCREASING ROLE OF DATA ANALYSIS, MATHEMATICAL
MODELING, AND TECHNOLOGY IN HIGH SCHOOL CLASSROOMS1
Daniel J. Teague North Carolina School of Science and Mathematics
ABSTRACT
Technology is playing an increasingly central role in the nature of mathematics education today. Graphing calculators and computer software are now common in middle and high school mathematics programs. Technology is also changing the focus of mathematics instruction, making possible new techniques for solving problems. This paper addresses how new technology, data analysis, and modeling are enabling students to engage in increasingly complex, challenging, and creative mathematical problem-solving activities.
INTRODUCTION Over the last 10 years, technology has played a significant role in mathematics education in the U.S. Today, graphing calculators with analytic capabilities (CAS) are used in every Advanced Placement (AP) Calculus course. Computer software such as Geometer’s Sketchpad are common and graphing calculators like the TI-83, essential for the AP Statistics course, are ubiquitous in middle and high school mathematics programs. Technology is necessary for modeling and working with “real data.” New uses for technology are being found as teachers grow in their comfort and experience with technology for teaching mathematics. There is also an increasing awareness of the importance of data analysis throughout the K-12 curriculum. Most new texts contain some of the principles and techniques of exploratory data analysis. There is great variability in how, and how often, these techniques are used, but the focus on “quantitative literacy” is clear. In addition, applications of mathematics and the creative aspects of mathematical modeling have also had an increased presence in high school mathematics. Applications and modeling offer many opportunities for students to bring mathematical ideas together and provide excellent incentives to learn mathematics. M. S. Klamkin has said that:
Most of mathematics is learned ‘vertically,’ that is, its various subjects are taught separately, neglecting the cross-connections. In applications [modeling], one usually needs more than just algebra alone, or geometry alone. Consequently, courses should be designed ‘horizontally,’ cutting across several different mathematical branches.
1 Presented at Exploring Collaborations in Science and Mathematics Education, March 17-19, 2003, San Francisco.
196

Many new texts include “investigations,” fairly open-ended projects that small groups may work on for a period or two. These investigations require that students think deeply about complex problems and pull together ideas from different parts of the course in creative ways. Interweaving traditional content with model-building projects—which bring together several mathematical concepts and increase in difficulty and complexity as students progress through the mathematics program—engenders an appreciation for what has been learned and intrigue in what remains to be learned. Students become comfortable working with others and coupling technology with old-fashioned mathematical analysis in their solutions. They develop an understanding of the essential roles played by creative insight and diligent attention to detail in mathematical investigations, and, most importantly, reinforce their interest in pursuing mathematics and mathematical challenges once they leave the high school classroom. Through a modeling approach to learning mathematics, students are able to engage in the creative aspects of mathematics early in their mathematical development. Creative problem-solving engenders a high level of task commitment, which in turn enhances and encourages greater creativity. Students gain important skills in presenting their ideas, and in describing their work and the thinking process that led to their solution. They also learn how to develop convincing arguments and mathematical proof to support their conjectures, as they defend their ideas with other members of their work group. A proof is an effort at sense-making. Looking at mathematics as a way of making sense of the world sets the stage for proof as sense-making. DATA ANALYSIS As data analysis brings the world into the classroom, students use techniques of standard mathematics to develop understanding of the world around them. This not only emphasizes the importance of mathematics in describing their world, it also adds great interest and zest to the classroom. Students enjoy gathering and working with data. We have used these kinds of new ideas about teaching math quite successfully at my high school. For example, here is a “cherry blossoms” problem, taken from a Japanese textbook, which studies the correlation between temperature and bloom time. I’ve rewritten it with an American slant: the same data is provided, but with the goal of predicting—given the average temperature Celsius—when the cherry blossoms will appear. The Cherry Blossoms Problem The anticipation of the first blooms of spring flowers is one of the joys of April. One of the most beautiful of the spring blossoms is that of the Japanese cherry tree. Experience has taught us that, if the spring has been a warm one, the trees will blossom early, but if the spring has been cool, the blossoms will arrive later. Mr. Yamada is a gardener who has been observing the date in April when the first blossoms appear for the last 25 years. His son, Hiro, went to the library and found the average temperatures for the month of March during those 25 years. The data are given in Table 1.
197

Table 1 – Average March Temperature and Days in April Until First Bloom, from Atarashi Sugaku 2, page 199
Temperature (°C ) 4.0 5.4 3.2 2.6 4.2 4.7 4.9 4.0 4.9 Days in April to 1st Bloom 14 8 11 19 14 14 14 21 9 Temperature (°C ) 3.8 4.0 5.1 4.3 1.5 3.7 3.8 4.5 4.1 Days in April to 1st Bloom 14 13 11 13 28 17 19 10 17 Temperature (°C ) 6.1 6.2 5.1 5.0 4.6 4.0 3.5 Days in April to 1st Bloom 3 3 11 6 9 11 ?
Figure 1: Linear model fit to the data
Least squares regression D=-4.69T+ 33.12. What is the meaning of the slope? The value of the slope is -4.69. With each additional 1-degree increase in average temperature in March, we expect the cherry blossoms to appear between 4 or 5 days earlier in April. What is the meaning of the D-intercept? The D-intercept (when T = 0) has a value of 33.12. What does this mean? What day is the 33rd of April? This is May 3rd. If the average temperature in March is 0 degrees Celsius, then the cherry blossoms would not be expected until early May. What is the meaning of the T-intercept? The T-intercept has a value of 7.06. This means that if the average temperature in March is 7.06 degrees Celsius (very warm), then we would expect to see the cherry blossoms on the 0th day of April—March 31. This year, Hiro took the daily temperature for each day in March. At the end of the month, Hiro found the average temperature in March to be 3.5. The spring was a cool one. Hiro would like to predict the date in April when the first blooms will appear on
198
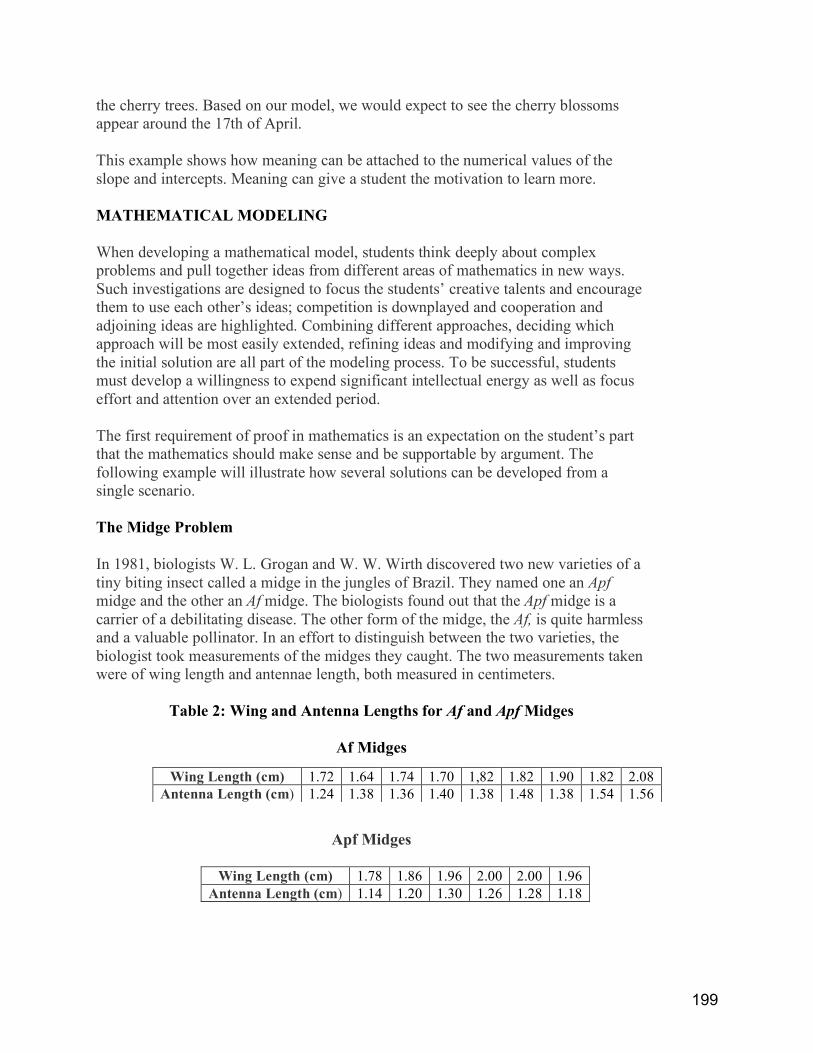
the cherry trees. Based on our model, we would expect to see the cherry blossoms appear around the 17th of April. This example shows how meaning can be attached to the numerical values of the slope and intercepts. Meaning can give a student the motivation to learn more. MATHEMATICAL MODELING When developing a mathematical model, students think deeply about complex problems and pull together ideas from different areas of mathematics in new ways. Such investigations are designed to focus the students’ creative talents and encourage them to use each other’s ideas; competition is downplayed and cooperation and adjoining ideas are highlighted. Combining different approaches, deciding which approach will be most easily extended, refining ideas and modifying and improving the initial solution are all part of the modeling process. To be successful, students must develop a willingness to expend significant intellectual energy as well as focus effort and attention over an extended period. The first requirement of proof in mathematics is an expectation on the student’s part that the mathematics should make sense and be supportable by argument. The following example will illustrate how several solutions can be developed from a single scenario. The Midge Problem In 1981, biologists W. L. Grogan and W. W. Wirth discovered two new varieties of a tiny biting insect called a midge in the jungles of Brazil. They named one an Apf midge and the other an Af midge. The biologists found out that the Apf midge is a carrier of a debilitating disease. The other form of the midge, the Af, is quite harmless and a valuable pollinator. In an effort to distinguish between the two varieties, the biologist took measurements of the midges they caught. The two measurements taken were of wing length and antennae length, both measured in centimeters.
Table 2: Wing and Antenna Lengths for Af and Apf Midges
Af Midges
Apf Midges
Wing Length (cm) 1.78 1.86 1.96 2.00 2.00 1.96
Antenna Length (cm) 1.14 1.20 1.30 1.26 1.28 1.18
Wing Length (cm) 1.72 1.64 1.74 1.70 1,82 1.82 1.90 1.82 2.08 Antenna Length (cm) 1.24 1.38 1.36 1.40 1.38 1.48 1.38 1.54 1.56
199

Is it possible to distinguish an Af midge from an Apf midge on the basis of wing and antenna length? Write a report that describes to a naturalist in the field how to classify a midge he or she has just captured. Student Solutions: Notice that both measurements overlap and separately do not distinguish one midge from another.
Figure 2: Wing and Antenna Lengths for each midge
However, if we look at the scatter plot for both measures, we see the two types of midges clearly.
Figure 3: Scatter plot of midge data
200

There are a number of different solutions to the midge problem, some very sophisticated and others very straightforward; you can check your answers in Appendix B. But the conclusion is that students must use their knowledge of mathematics to describe the “real-world” situation. There are many approaches, so students must decide for themselves what is most important—being accurate or being safe. Regardless of the approach, students enjoy working on the problem and appreciate the many different solutions their classmates create. TECHNOLOGY Rather than relying only on lecture and presentations by the teacher, technology aids students in developing their own ideas about mathematics and in the essential mathematical step of creating conjectures. As an example, we develop a basic derivative formula. In both the US and Japan, the derivation of the derivative of the sine function proceeds analytically. For example, the standard American development of the derivative of the sine function is shown in the sidebar. d sin(x) = lim sin(x+h)sin(x) = lim sin(x)cos(h)+sin(h)cos (x)−sin(x) dx h→0 h h→0 h Students are expected to factor the resulting expression as lim sin(x)[cos(h)-1]+sin(h)cos (x)−sin(x) h→0 h Now students must show that lim cos(h)-1 = 0 and lim sin(h) = 1 h→0 h h→0 h How do students know that the two limits lim cos(h)-1 = 0 and lim sin(h) = 1
h→0 h h→0 h hold the key to the problem? From whence does this inspiration come? Graphing calculators can add new insight into the relationship between a function and its derivative. Students can use the calculator to investigate graphically the convergence of the difference quotient, d (x) = f (x+h)-f (x) as the size of h decreases.
h They can make conjectures based on their observations and then prove their conjectures analytically. By considering the behavior of the graph of the difference quotient when h is small, students can visualize relationships that can then direct their analytical efforts.
201
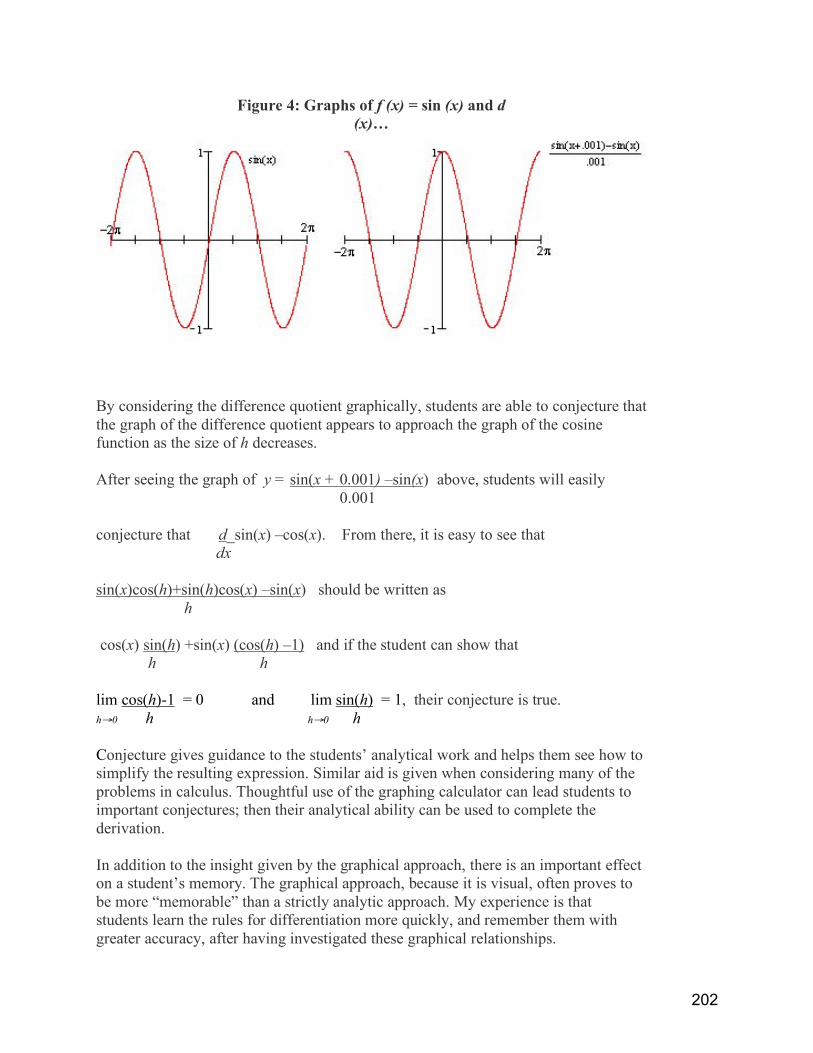
Figure 4: Graphs of f (x) = sin (x) and d (x)…
By considering the difference quotient graphically, students are able to conjecture that the graph of the difference quotient appears to approach the graph of the cosine function as the size of h decreases. After seeing the graph of y = sin(x + 0.001) –sin(x) above, students will easily 0.001 conjecture that d_sin(x) –cos(x). From there, it is easy to see that
dx
sin(x)cos(h)+sin(h)cos(x) –sin(x) should be written as h cos(x) sin(h) +sin(x) (cos(h) –1) and if the student can show that h h lim cos(h)-1 = 0 and lim sin(h) = 1, their conjecture is true. h→0 h h→0 h Conjecture gives guidance to the students’ analytical work and helps them see how to simplify the resulting expression. Similar aid is given when considering many of the problems in calculus. Thoughtful use of the graphing calculator can lead students to important conjectures; then their analytical ability can be used to complete the derivation. In addition to the insight given by the graphical approach, there is an important effect on a student’s memory. The graphical approach, because it is visual, often proves to be more “memorable” than a strictly analytic approach. My experience is that students learn the rules for differentiation more quickly, and remember them with greater accuracy, after having investigated these graphical relationships.
202
NEW TECHNIQUES WITH TECHNOLOGY Technology opens doors to new techniques for solving problems. (For the full working out of the answer to this problem, refer to Appendix A.) Blood Testing Problem You have a large population (N) that you wish to test for a certain characteristic in their blood. Each test will be either positive or negative. Since the number of individuals to be tested is quite large, you wish to reduce the number of tests needed to screen everyone, and thereby reduce the costs. If the blood could be pooled by putting G samples together, and then testing the pooled sample, the number of tests required might be reduced. What is the relationship between the probability of an individual testing positive (p) and the group size (G), that minimizes the total number of tests required? Use your solution to determine the number of tests required to find 100 individuals who will test positive in a population of 1,000,000. The model created in this approach to solving the problem (shown in detail in Appendix A) was not possible before the introduction of technology. Everything we have done on this problem could have been done using techniques of calculus, but such problems do not have to wait for calculus. Moreover, this technique will work in situations where calculus fails. And the model works well, reducing the number of tests dramatically. In the example of finding 100 positive individuals in a population of 1,000,000, testing in groups of 100, 10 and 3, and then individually, requires only 11,634 tests. CONCLUSION The use of technology is well established in American schools, as is the importance of applications for motivating students and showing the importance of mathematics. Data analysis and other tools of “quantitative literacy” are growing in importance. The techniques are now in the texts, but are not universally used by teachers in the classroom. Mathematical modeling is a useful tool for encouraging and developing student creativity, but is under-utilized at the present. Much work needs to be done to develop these ideas into coherent programs and to improve teachers’ comfort level with the principles of modeling. The pressure to include modeling in the curriculum for advanced students is growing. The NRC Committee on Programs for Advanced Study of Mathematics and Science in American High Schools recommends an increased attention to mathematical modeling as part of the AP Calculus course and as part of the AP Calculus exam. Finding an appropriate blend of 1) building and maintaining strong technical skills, 2) understanding and developing essential aspects of proof and argument in mathematical discourse, and 3) utilizing the creative aspects of mathematical modeling, is an important goal for the US mathematics education community in the future. REFERENCES Fujita, N. & Maebara, S. (Eds) Atarashii Suugaku 2 (New Mathematics 2). Tokyo: Tokyo Shoseki, 1993.
203

APPENDIX A: Solution to the Blood Testing Problem In the worst case, if any group tests positive, all members of the group will test positive. If the probability of testing positive is p, then Np in the population are positive. In the worst case, Np groups, each of size G, will test positive and NpG individuals will need retesting. The number of tests needed to test using one group test and then testing everyone remaining individually is
1NT NpG N pG
G G
! "= + = +# $
% &.
Since the factor N produces a vertical stretch in the graph of T, the value of G that minimizes the number of tests will not be affected by N, so we set 1N = for convenience. For a given value of p , we can determine the group size G which minimizes the number of tests, and therefore the costs, by using a graphing calculator to zoom and trace.
Figure 1: Graphs of
1T pG
G= + for 0.25p = and 0.01p =
Repeating the process for different values of p, we generate the table below: p 0.25 0.2 0.15 0.1 0.05 0.03 0.01 0.005 0.001 0.0005 0.00001 G 2.0 2.24 2.58 3.16 4.47 5.77 10.0 14.14 31.62 44.72 100.0
Table 3: The best group size, G, for different values of p
By using techniques of data analysis on the scatterplot for this data, we can create a model relating the best group size G to the probability p.
204

Figure 2: Scatterplot comparing the value of p to the best group size G
By re-expressing the data with a log-log plot, we linearize the data.
Figure 3: Log-log plot of data
The least-squares equation is ( ) ( )ln 0.00005 0.5 lnG p= ! , so 1G
p= . If G
p=1 , the
total number of tests needed is 12
pT N pG N p N p
G p
! "! "= + = + =# $# $ # $% & % &
. In our example,
100 individuals testing positive can be found in a population of one million people in
approximately 20,000 tests. Further, if p ! 14
, then 2N p N! , and it is counterproductive
to test in groups. Problem Extension Of course, there is no reason to re-test everyone individually. Since G is independent of N, we could retest all of the NpG remaining after the first group test in similar groups. We
already know that Gp
=1 . However, since we have already eliminated a large number of
people in the first phase of testing, the value of p will be much larger for the second group test. There are Np people that we expect to test positive and NpG people remaining to be
205
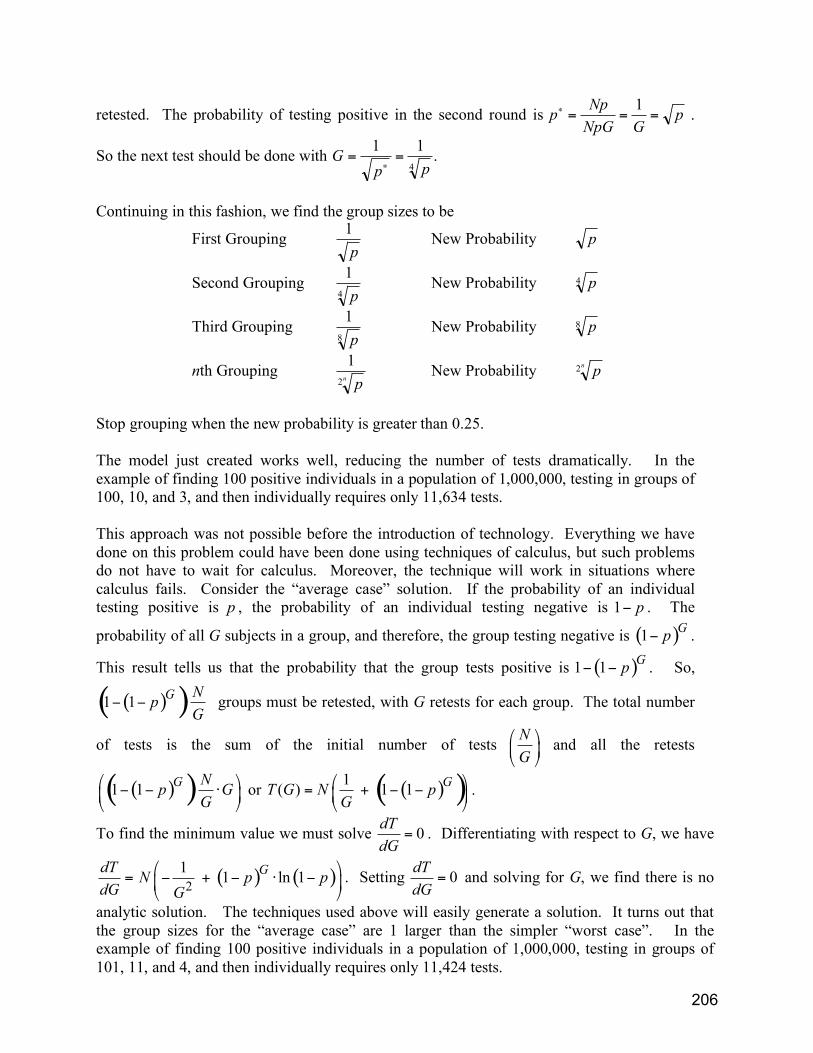
retested. The probability of testing positive in the second round is p Np
NpG Gp
!= = =
1 .
So the next test should be done with Gp p
= =!
1 1
4
.
Continuing in this fashion, we find the group sizes to be
First Grouping 1
p New Probability p
Second Grouping 1
4 p New Probability p4
Third Grouping 1
8 p New Probability p8
nth Grouping 1
2 pn
New Probability pn2
Stop grouping when the new probability is greater than 0.25. The model just created works well, reducing the number of tests dramatically. In the example of finding 100 positive individuals in a population of 1,000,000, testing in groups of 100, 10, and 3, and then individually requires only 11,634 tests. This approach was not possible before the introduction of technology. Everything we have done on this problem could have been done using techniques of calculus, but such problems do not have to wait for calculus. Moreover, the technique will work in situations where calculus fails. Consider the “average case” solution. If the probability of an individual testing positive is p , the probability of an individual testing negative is 1! p . The
probability of all G subjects in a group, and therefore, the group testing negative is ( )1G
p! .
This result tells us that the probability that the group tests positive is ( )1 1G
p! ! . So,
( )( )1 1G N
pG
! ! " groups must be retested, with G retests for each group. The total number
of tests is the sum of the initial number of tests N
G
! "# $% &
and all the retests
( )( )1 1G N
p GG
! "# # $ $% &
' ( or ( )( )1
( ) 1 1G
T G N pG
! "= + # #$ %
& '.
To find the minimum value we must solve 0dT
dG= . Differentiating with respect to G, we have
dT
dG= ( ) ( )
2
11 ln 1
GN p p
G
! "# + # $ #% &' (
. Setting 0dT
dG= and solving for G, we find there is no
analytic solution. The techniques used above will easily generate a solution. It turns out that the group sizes for the “average case” are 1 larger than the simpler “worst case”. In the example of finding 100 positive individuals in a population of 1,000,000, testing in groups of 101, 11, and 4, and then individually requires only 11,424 tests.
206

APPENDIX B: Solutions to the Midge Problem Solution 1: One common solution is to find the two most extreme members of each group and fit lines through these extreme points. For Af midges, the line is 0.778 0.098A W= ! and for Apf midges, 0.889 0.442A W= ! . No Af midge was found whose dimensions placed it below the first line and no Apf midge was found above the second line.
Figure 1: Most extreme midges from each group
Students will “average” the lines creating a boundary half-way between them. This mid-line is 0.8335 0.270A W= ! . Still others will want to weight their average since 3/5 of the midges are Af midges . Almost invariably they will do this incorrectly by taking 3/5 of the Af line and 2/5 of the Apf line, but they are thinking about how likely a midge is to be Af or Apf, which is good. This line is 0.8446 0.304A W= ! . Solution 2: If you do this problem right after you have taught them about regression, they will invariably use regression to find linear functions to model each set of data. For Af midges, this is 0.479 0.549A W= + and for Apf midges, 0.558 0.151A W= + . Students will “average” these lines to get 0.5185 0.350A W= + . They should recognize that there is a problem with this method, since this boundary misclassifies one of the Af midges (see Figure 11). Students may argue that it is OK to consider an Af midge an Apf midge, but not the other way around. Students may use a weighted average using these lines to avoid this misclassification.
207

Figure 2: Regression lines for each midge type
Solution 3: Students may recognize that the Af midges seemed to have generally larger antennae and smaller wings. So, the ratio of antenna length to wing length might tell them
something. Consider the values of .Antenna Length
Wing Length The ratios are:
Af .721 .841 .782 .824 .758 .813 .726 .846 .750 Apf .640 .645 .663 .630 .640 .602 Notice that there is no overlap in these ratios. The smallest ratio for Af midges is 0.721 and the largest for Apf midges is 0.663. This is now a one-dimensional version of the problem. Where in the gap between these groups should you make the division?
Figure 3: Ratios of Antenna to Wing Length
Students will use the midpoint of this interval, 0.692, as well as the smallest Af value for safety, 0.721 for their boundary, or use a point three-fifths through the interval, 0.686, since three-fifths of the midges are Af midges. These ratios can be converted to linear
boundaries by rewriting 0.692A
W= as 0.692A W= . This is simply requiring that the linear
boundary have a 0 intercept.
208

Figure 4: Linear boundary with 0 intercept 0.692A W=
Solution 4: If a linear model is appropriate, we expect that the residuals from a least squares fit should be approximately normally distributed. The residuals are the differences between the actual data and the linear fit, that is, the errors in the least squares fit. This means that close to 68% of the data will fall within one standard deviation of the residuals of the line and 95% within 2 standard deviations of the residuals of the line. The standard deviation of the residuals for the Apf linear fit is 0.036 while for the Af midges is 0.073. We can draw lines 2 standard deviations below the Af line and 2 standard deviations above the Apf line. These lines are 0.479 0.403A L= + (for Af) and
0.558 0.223A L= + (for Apf). It is unlikely for an Af midge to fall below the line 0.479 0.403A L= + and equally unlikely for an Apf Midge to fall above the line 0.558 0.223A L= + . Using the upper boundary “plays it safe” and considers all midges with
antenna and wing lengths below the line 0.479 0.403A L= + to be considered dangerous.
Figure 5: Boundaries 2 standard deviations from each regression line
209

EDUCATING THE PROFESSIONAL MATHEMATICS USER1
Harvey Keynes University of Minnesota
ABSTRACT
This paper addresses some of the central issues in how best to provide mathematically talented learners with a challenging curriculum, given that the core mathematics curriculum in U.S. schools is geared toward general literacy rather than professional mathematics use. The author defines what is meant by a professional mathematics user, distinguishes between a core and non-core mathematics curriculum, and then describes briefly a couple of nontraditional approaches that have been used successfully at the University of Minnesota with such students. INTRODUCTION Given the changes that have occurred in our society and the changes that have occurred in curriculum standards, the critical question that I want to address is: How do we fit in programs for mathematically talented students? Our teachers and schools continue to struggle with this problem. I and a coauthor wrote a paper2 ten years ago that developed one framework for looking at these issues. I looked it over again when this conference came about, and it’s still relevant today. So I would like to raise some of these issues and then offer some of our thoughts in response to them. To begin with, there are two key questions: • What does it mean for every student to be mathematically literate? • What does it mean that a person be prepared to use mathematics in a profession, for
professional use?
We face a number of assumptions when trying to come to grips with these questions. Two key ones are:
• Separating students into groups leads to an upper class and an underclass, and the
underclass suffers in such a scenario. (This assumption was a very critical one when we created the current math standards.)
• The need to prepare students for high performance may not be well served in a heterogeneous classroom that provides only general math literacy.
Presented at Exploring Collaborations in Science and Mathematics Education, March 17-19, 2003, San Francisco. Everybody Counts/ Everybody Else (with T.R. Berger), AMS/CBMS Issues in Mathematics Education, Volume 5
(1995), 89-110.
210

The latter is an assumption that is certainly strongly held among professionals. Let me be precise in my definition of “professional user of mathematics.” I am referring to people who use it in their work: • symbolically • formally • who deal with abstractions with multiple representations • who use complex models, and draw both numerical and qualitative conclusions from
them.
Professional users use mathematics in the abstract on a daily basis. Many people in universities also do this, but that’s not the only group we’re talking about. Many analysts such as actuaries, bankers, and statisticians fall into the “professional user” category. Very complex yield management formulas are used in the American airline industry. Weather prediction requires the use of models, as well. So these are the kinds of people we’re talking about. Obviously not all professional users fall into these categories. However, there’s a real need in our society for these kinds of professional users, and the challenge is how to prepare them for their professional careers in the context of general mathematical literacy. Core Math Literacy Core literacy is not a watered-down curriculum; we have high aspirations for it. Here are some of the qualities and abilities we wrote about ten years ago, and I think they are still relevant for a “mathematically literate person.” • many reasoning skills, including qualitative reasoning • mathematical reasoning skills • analytic methods • appreciation of ideas • curiosity to explore new ideas • willingness to use technology Basically, the reasoning and arguments included in core math literacy are qualitative and not quantitative in nature, and they tend to be less complex than you’d see in real engineering or science. But with that rich a core curriculum, you might wonder, what is not included? Skills Outside the “Core” A mathematical core curriculum probably would not create mathematically literate citizens who: • have a large repertoire of algorithms • implement complex systems more or less on their own • have large expectations for self-learning • have conceptual usage skills or use symbolic reasoning • have mental calculation skills.
211
Expectation for self-learning is key, although that’s one aspect we rarely address in the context of core math literacy. Most professional mathematics users, like all of us these days, face change or obsolescence over time, so they’re expected to engage in high-level self-learning on a constant basis. School is not the only place where learning occurs. If anything, school is where you acquire the ability to learn. Then the real learning takes place after you leave school. Computational skills without use of technology is a subject of debate in our community. I am part of the School of Engineering at the University of Minnesota, so many of the people I work with have good mental computing skills, but that may be a generational attribute. It might be one skill that’s going away, but traditionally it was part of a “professional math user’s” repertoire. These are merely a sampling of the skills that would not necessarily be developed in a core mathematics curriculum. So the big question is, how do you build in these higher-level skills, in order to support the increasing demand for professionals in mathematics and the sciences in the U.S.? I’ve talked to a lot of professional users, and one issue that always comes up is that they started building up ways to think symbolically on their own early on in their schooling, and independently of what they were learning in the classroom. One of the comments we often hear is: “I was always supplementing what I was learning by coming up with more complex ways of dealing with a concept.” How do we encourage and capture that tendency in the classroom? This is not an area of common mathematical literacy, but for talented, incipient “professionals,” it’s important that they learn to deal with symbolism. In a standard mathematics classroom, if the teacher has a limited background or the students aren’t prepared mathematically, you see these professional-level attributes reduced to basic algorithms and simple computational tools, and all the richness inherent in the mathematical content is overlooked. So how do we simultaneously prepare a mathematically literate population, while at the same time providing students likely to be professional users with the background they will need? Meeting the Needs of Students With Different Career Goals Perhaps there is not any one answer. I am glad to hear that many people think we have a rich selection of approaches. In our community, we think we don’t have enough. I live in Minnesota, which was characterized many years ago as a homogeneous place, with just one type of population from Northern Europe. And yet I now deal with districts that are as diverse as any you could see. So there’s been a tremendous change. This is why one idea will never work, and we always have to keep asking these questions: If you’re going to have a common core curriculum, must all students learn the same curriculum at the same time in the same setting? And is it an achievement-based curriculum; is there individualization in where, how, and at what rate students learn?
212

I think misunderstandings arise that create some of the issues within the “math wars” because standards for professional users are not set by the K-12 administration or government policy. Instead they are set by the current professional users: by higher education and the business community. It’s not realistic for the K-12 system to set and monitor those standards. The resulting tension between schools and the community of professional users continues to exist, and creates some of the problems that we’ve seen. We definitely want all students to have a rich base of common mathematics, but what we have to determine is how to change the level, pace, or depth so that the curriculum is rich for students who are capable of doing more, as well as for the core students. The answer that many of us have arrived at is that we need to provide high-end learners with alternative learning situations that extend classroom teaching beyond universal literacy. In U.S. high schools, the AP curriculum has been the answer for some of our high-end learners, and it’s worked extremely well. What our Japanese colleagues face, and what we also face in the U.S., is providing those alternatives without sacrificing core knowledge, while simultaneously recognizing that students have needs beyond the mathematical classroom. At the University of Minnesota, we have addressed these needs in two ways: 1) We have created an array of mathematical enrichments that start as early as the third
grade, and we bring in students who have more curiosity and interest in mathematics than can normally be addressed in the classroom. These enrichment programs provide students with a variety of mathematical opportunities that look different from those taking place in the regular classroom, but are relevant and also key to the type of mathematical thinking we want to develop in professional users. More information can be found at http://www.itcep.umn.edu/.
2) The other type of program that we run for students who are extremely talented
mathematically, is one where we look at the curriculum and go beyond it, by treating these students as though they are already professional users. This program, called the University of Minnesota Talented Youth Mathematics Program (UMTYMP) has a 25-year history. Currently it serves over 500 students each year in classes ranging from high school algebra to courses beyond the university’s honor level calculus courses. For more information on the program, go to www.itcep.umn.edu/umtymp, or consult my paper, Programs for Mathematically Talented Students-Do We Really Need Them? AMS/CBMS Issue Mathematics Education, Volume 5 (1995), 153-169.
213
MATHEMATICS EDUCATION PROMISING AREAS OF U.S.-JAPAN COLLABORATION1
DISCUSSION
Karen Fuson, Northwestern University Eric Hamilton, U.S. Air Force Academy
Harvey Keynes, University of Minnesota Susan Sclafani, U.S. Department of Education♦
Keiichi Shigematsu, Nara University of Education Daniel Teague, NC School of Science and Mathematics
MEASUREMENT OF CREATIVITY GAINS Karen Fuson: Issues or problems perceived as critical in one country or the other could be important areas for research. Eric Hamilton: Karen concluded her presentation by talking about the longitudinal study of Everyday Mathematics, and noting that the engagement and motivation of the students is difficult to detect with current research methods. On the Japanese side, there is an increasing priority of stimulating creativity, interest, and love for mathematics or science. It may be useful to explore ways in which these qualities can be more carefully analyzed and measured. If you are successful in Japan at stimulating student creativity, how will you know? How can we detect and measure changes? We have surveys and self-reports and so on, but what are the instruments that we can use to detect advantages such as the one Karen pointed out for Everyday Mathematics, that otherwise wouldn’t come up in some of the more traditional assessments? And is it important to try to measure them? I think this might be a fruitful area for discussion between the two countries. Karen Fuson: The Japanese are essentially asking if we can help solve this problem. Looking at Japanese classrooms, we know they have some things to teach us about increasing creativity, but measuring improvement is crucially important. Everyone is always worried about children leaving a curriculum. What happens if they move, or switch to a different curriculum? But the teachers of students who have been in Everyday Math for two years say that by the time these students enter grade 3, the teacher doesn’t have to ask students how they solved a problem. Whether you ask them or not, they’re going to tell you.
1 Presented at Exploring Collaborations in Science and Mathematics Education, March 17-19, 2003, San Francisco. ♦ Now at Chartwell Education
214
In my own Children’s Math Worlds Project,i a teacher who happened to be a student in my class went to substitute in a Spanish-speaking classroom in a very low SES school. She elicited from students the methods they had used, discussed them, and was preparing to move on. But the students weren’t done. They were engaged in a deep discussion of two methods and they wanted to finish their conversation. The teacher reported, “I’ve never seen anything like this, and the students are driving it.” So one useful index would be reports from teachers in subsequent years, but we would still need to find other measures. Harvey Keynes: The issue of creativity, interest, and motivation is really the key to all of our programs. One of the signs of our success is whether students retain that creativity or increase it. In my program, the notion of enrichment really means to help students extend their learning, to keep students motivated, but to move beyond the depth of the traditional curriculum. As a result, we’ve moved further down the age scale, so that we are now spending a majority of our time working with third and fourth graders and their teachers. We changed our program’s focus to professional development for elementary school teachers, and are teaching them how to keep up with students’ growing creativity. We are now developing “teacher-leaders,” which in Japan might be regular classroom teachers. We use enrichment to go beyond the curriculum, or to move the curriculum to challenge students. This is an issue that is ripe for collaboration. RIGOROUS MATHEMATICS, SPIRIT OF DISCOVERY Karen Fuson: Both in the U.S. and Japan, two teaching perspectives are in tension: discovery and invention and involvement are wonderful, but where is the mathematics? In this argument, Mathematically Correct is absolutely correct that in many classrooms there’s a lot of playing with objects, but where’s the mathematics? As Harvey Keynes points out, this is also true for gifted children and for teachers who support their exploration. There has to be a vision of the mathematical goal and where one is headed in the process, in order to be able to pull the mathematics out of activities and real-world examples. Both sides are right, and they’re both important. The two perspectives need to be built into an ongoing relationship. We need to say to the people in the middle of the so-called “math wars” in both countries, “You’re both right.” As educators, we’re working hard to find out how to do it all, because we have to have it all. One solution is to reduce the number of topics in the curriculum, as Professor Shimizu discussed in his mathematics overview. That’s the secret: you can only have it all for X number of topics, not for 3X of those topics.
215
CREATIVE TEACHING KEEPS CHILDREN ENGAGED Daniel Teague: The program at my school was designed expressly to induce creativity and activity on the part of students. We have no explicit research basis for what we do, although it would be very interesting to develop that. U.S. teachers don’t decide how they’re going to teach by reading research papers. We teach by looking out into students’ eyes and seeing when the sparkle is there. All that we do is really determined by our interaction with the students and our sense of their level of engagement and activity. When we present an activity that engages students intellectually, we want to do more of it. And this is what has led us to the modeling-based curriculum that we use—it is not based on research but on working to keep students engaged. Keiichi Shigematsu: In Japan, we feel that we have a fairly high level of mathematical development in the lower grades, but that it is lacking beyond junior high school. We had hoped that in the U.S. there would be a good model through high school from which we could learn, but Professor Keynes has suggested that upper level mathematics in the U.S. is insufficient for the development of professional mathematicians. The Japanese have a national level collaborative research mandate, so perhaps we need to consider specific kinds of programs we could investigate. For example, in our case, we’re thinking of showing how museums and other facilities could help to increase student interest and learning, to augment the learning at school. Karen Fuson: There may be potential for web-based programs for accelerated, highly talented youth in math or science, in which there are exchanges among students and perhaps even cross-national exchanges. Harvey Keynes: To clarify, there are U.S. programs that go beyond the common core curriculum. Remember, in the U.S., the common core curriculum is implemented 50 different ways, depending on what state you’re in. Beyond the common core curriculum, we have programs for professional users, the most successful of which is the advanced placement (AP) calculus course. There are other advanced placement courses which have worked well and been very successful for a lot of students. What I aspire to is an even richer, deeper level for those students who move beyond the AP level. For example, consider students in the eighth, ninth, or tenth grade who are completing their AP high school calculus. Where does the instruction go beyond that, and how do you keep exceptional students interested? One other issue that is vitally important is to create a learning community for more advanced mathematics students, and to keep that community intact. This is the hidden agenda in some advanced mathematics programs. In our program, which has about 300 students, 250 school districts are represented. The average school district sends one or two such students to participate. These students want to find a sense of community among their peers, and they
216

form a community by working together. To maintain that sense of community, and to have them work with their peers in active learning sessions, is a very important goal. One of the difficulties that I see with technology-based learning is that it has the potential to isolate these talented young people. We certainly don’t want to teach them that potential discoveries are inevitably between themselves and a machine. Cooperative learning gets the worst rating from students of all that we do in engineering and the sciences. These talented students have spent their careers working on their own, because they’re the only ones working at that high a level. We raise this issue in the classroom, and tell them, “If you think you’re the only one, you’re kidding yourself.” We point to mathematicians and researchers who do collaborative work all the time. The bottom line is, there’s a whole set of learning tools needed, and I think we need to address those. Susan Sclafani: To follow up on the previous question from Professor Shigematsu, you can find good programs worth emulating in many locations across the United States. What we haven’t been able to do in the U.S. is to ensure that a challenging mathematics curriculum is available in every school for all students. Japan has several advantages here. Japan has a highly centralized system, so it is easier to institutionalize programs nationwide. Japan’s mathematics and science teaching force starts with a better education, which makes it easier to implement programs in a broad way. The challenge for us in the U.S. will be to scale up identified programs so that the vast majority of children who are currently being terribly undereducated in mathematics and science have the benefit of these valuable programs. First we have to resolve the “wars” we’re engaged in, hopefully through a new initiative that brings people together to discuss the issues. But we also have to deal with the fact that the level of teacher knowledge and skill varies dramatically across all the kinds of schools that we have. Inner-city, urban schools, and rural schools are at an enormous disadvantage in being able to offer a high-quality education to their students. Through research, however, you will find many models that could be used in Japan very efficiently and effectively in a more centralized way. In fact, the United Kingdom has an agent full-time in the U.S. who identifies promising programs that they can then take back to the U.K. and implement on a broad scale. I believe that through our collaboration we can identify those programs. We can then take what look to be good models, work them to scale in this country as well as in Japan, and make those models accessible and available to more students. i Fuson, K.C. (2006). A research-based framework for Math Expressions. Boston, MA:
Houghton Mifflin. Fuson, K. C. (2005). Children’s Math Worlds Video Research Report. Fallbrook, CA.
217

WHAT WE CAN LEARN ABOUT TEACHING AND LEARNING MATHEMATICS THROUGH U.S.-JAPAN COLLABORATION1
DISCUSSION
Zalman Usiskin, The University of Chicago Keiko Hino, Nara University of Education
Gail Burrill, Michigan State University Keiichi Shigematsu, Nara University of Education
Jerry Becker, Southern Illinois University at Carbondale Koichi Nakamura, Joetsu Education University
Yasuhiro Sekiguchi, Yamaguchi University
Moderated by Tad Watanabe, Pennsylvania State University
We often think of U.S.-Japan collaboration in terms of the benefits to the United States, but the benefits can be mutual, as well as varied.
ZALMAN USISKIN The question that we on this panel were asked to consider was “What can we learn from U.S.-Japan collaborations?” In some sense, the first collaboration was FIMS, the first international mathematics study, which Patsy Wang-Iverson mentioned in her talk. (The studies weren’t called TIMSS until the third study.) 1 Presented at Improving Mathematics Teaching and Learning Through Lesson Study, May 20-21, 2005, Chicago.
218
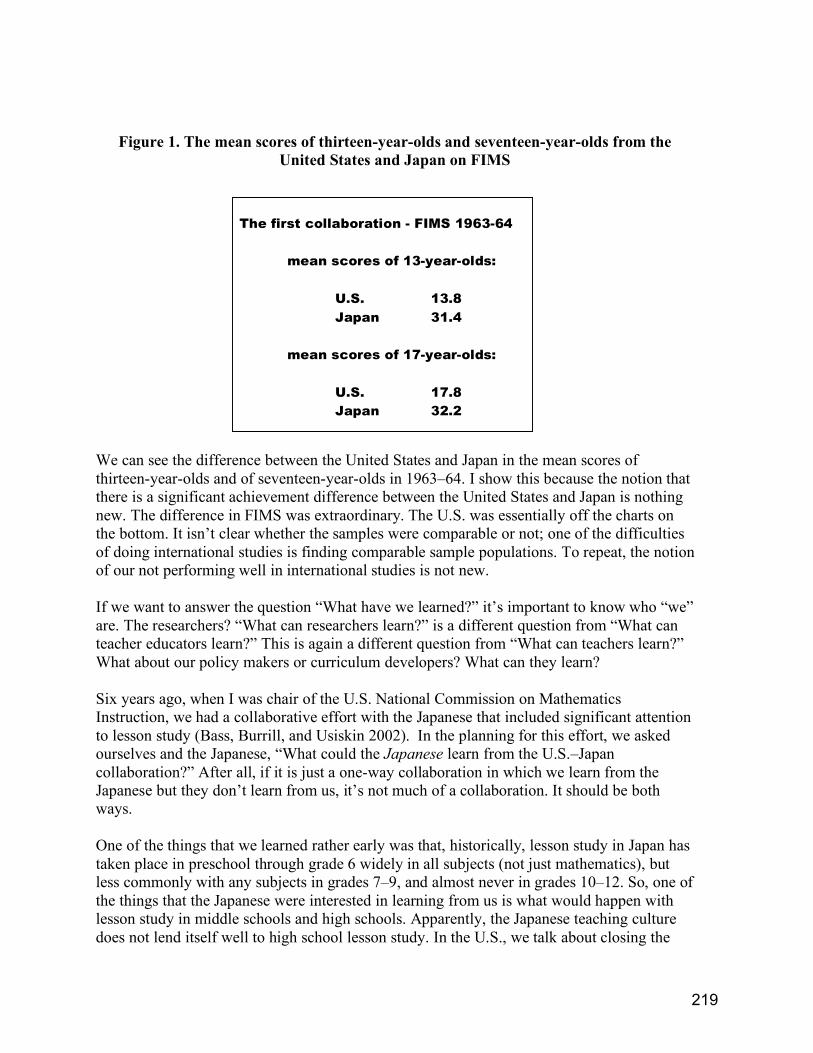
Figure 1. The mean scores of thirteen-year-olds and seventeen-year-olds from the United States and Japan on FIMS
The first collaboration - FIMS 1963-64
mean scores of 13-year-olds:
U.S. 13.8
Japan 31.4
mean scores of 17-year-olds:
U.S. 17.8 Japan 32.2 We can see the difference between the United States and Japan in the mean scores of thirteen-year-olds and of seventeen-year-olds in 1963–64. I show this because the notion that there is a significant achievement difference between the United States and Japan is nothing new. The difference in FIMS was extraordinary. The U.S. was essentially off the charts on the bottom. It isn’t clear whether the samples were comparable or not; one of the difficulties of doing international studies is finding comparable sample populations. To repeat, the notion of our not performing well in international studies is not new. If we want to answer the question “What have we learned?” it’s important to know who “we” are. The researchers? “What can researchers learn?” is a different question from “What can teacher educators learn?” This is again a different question from “What can teachers learn?” What about our policy makers or curriculum developers? What can they learn? Six years ago, when I was chair of the U.S. National Commission on Mathematics Instruction, we had a collaborative effort with the Japanese that included significant attention to lesson study (Bass, Burrill, and Usiskin 2002). In the planning for this effort, we asked ourselves and the Japanese, “What could the Japanese learn from the U.S.–Japan collaboration?” After all, if it is just a one-way collaboration in which we learn from the Japanese but they don’t learn from us, it’s not much of a collaboration. It should be both ways. One of the things that we learned rather early was that, historically, lesson study in Japan has taken place in preschool through grade 6 widely in all subjects (not just mathematics), but less commonly with any subjects in grades 7–9, and almost never in grades 10–12. So, one of the things that the Japanese were interested in learning from us is what would happen with lesson study in middle schools and high schools. Apparently, the Japanese teaching culture does not lend itself well to high school lesson study. In the U.S., we talk about closing the
219
doors to the classrooms and inside the teachers do what they want. Evidently, the high school teachers in Japan do not appreciate it when other people come in to criticize or to comment on their teaching. The second thing we learned is that lesson study occurs in certain kinds of lessons, for example, the introduction of new ideas, and not necessarily under other circumstances. There are lessons focused on the practice of skills, and lesson study does not lend itself to the kind of lesson that is taught on the day before a test. We asked the Japanese what is known from research. Historically, lesson study in Japan has taken place without a research base that connects it with student achievement. That is, lesson study has been so much a part of the culture of teacher education in Japan that it has been assumed to be worthwhile. It may be worthwhile, but it means that when we look for some sort of “scientifically-based evidence,” we are actually developing it here in the United States, some of it for the first time. Research models and connections of lesson study to achievement have not necessarily been established in Japan. What do we know from practice? We now know from what we’ve been doing in the last half a dozen years is that lesson study is a complex process and requires the cooperation of teachers, school administrators, and outside mathematics educators, and I include among those, mathematicians and teacher educators. It may require people from other districts or other schools, but it certainly requires people from outside of the classroom just to be established. Lesson study requires quite a bit of cooperation just to be set up. Secondly, lesson study demonstrates the complexity of the teaching and learning process. Thirdly, I would like to introduce an idea that is seldom looked at in the lesson study literature; lesson study shows the complexity of the mathematics curriculum, not just the mathematics, but the mathematics curriculum. Why do we think lesson study is valuable? It forces us to be introspective about three aspects of teaching mathematics, each of which is related to one of those three things that I just mentioned. The first is the relationships between teachers and their colleagues and how teachers can help each other to improve. The second is the process of teaching, particularly interactions with students, because sometimes we think that teaching is done almost in absentia. Even though there are students in the classroom, we often ignore them in thinking about what the teacher does that counts. Lesson study forces teachers to look at how they interact with their students. Finally, lesson study forces us to examine the intricacies of mathematics curriculum. For instance, it forces us to ask what came before and what is going to come later. We learn things from introspection, and I think that’s one of the reasons that lesson study has become so popular. It’s a vehicle for getting us to look at many of aspects of teaching and learning, curriculum, and the relationships of teachers and their principals and their colleagues, and so on. Many of us in this room approach lesson study from different points of view. We’re really interested in specific parts of the process. I’m interested in the curriculum part of the process. What does lesson study do for curriculum? You can learn more about this from the November, 2005 international conference on textbooks and the curriculum in
220

Japan, Singapore, Korea, and China, organized by the Center for the Study of Mathematics Curriculum (CSMC), one of the National Science Foundation teaching–learning centers, located at the University of Missouri. Presentations from that conference may be found at the CSMC website http://www.mathcurriculumcenter.org.
KEIKO HINO I want to talk about our collaboration in solving the problem of how to capture the quality of understanding of each student in the teaching and learning of mathematics. Professor Shimizu mentioned that, in Japan, we have different problems teaching our students. One of the big issues that we encounter is how to foster the student’s mathematical understanding through classroom teaching. For instance, in our very recent national survey, we found that more of our teachers are choosing to teach in small-size classes or to use team-teaching. Although the number of teachers per student is increasing, the results also show that student performance under these circumstances does not always improve. So our concern is not only with the form of classroom teaching, but also with the quality of teaching. We need to know how to teach in an effective way to develop student understanding. So I think that we can collaborate, especially in regard to the problems of how to capture the quality of understanding of each student, how to respond to students properly, and eventually how to assist in the autonomy of student learning. This should be pursued not only by one country, but also by an international collaboration such as this one. In doing so, I think that there should be at least two fields of study. One is to deepen our understanding of what goes on in the classroom, especially within each student. I think that the classroom is a very special place in which the students meet with mathematics. They deepen and develop their approaches and their conceptions of the mathematics, and we really need to respect this fact. I think that capturing the transformation of each student in different environments, which includes classrooms in different countries, could contribute to such understanding. Secondly, I think there should be multiple perspectives for fostering students’ mathematical understanding; this includes the problem of what mathematical literacy means. Through our collaboration, I think we can extend our perspectives and methods for fostering students’ mathematical literacy, based on actual classroom teaching. In Japan, we emphasize the conversations among the students, the discussions, and I think that’s just one way. There are also problems with such teaching, which is very difficult, not only for the teachers, but also for the students. For example, some low-achieving students might find it difficult to participate in such a classroom. So I think that we can extend our perspective and methods of teaching, based on our collaborations, and we can learn from you, as well.
221
GAIL BURRILL One of the things that I have learned from the Japanese, which I’ve come to value, is the way they translate their language into English, for example, “capture the quality of understanding of each student.” Isn’t that a wonderful way to say what we’re about? They speak to the very heart of things that matter in teaching and learning. I want to talk a little bit about what I am learning through experiences with lesson study. I’m a high school teacher. My perspective is not that of a researcher. What I take away from a learning experience is what it tells me about my own teaching. I want to share some of the experiences that I’ve had in a variety of different lesson study settings, which have actually given me a much better appreciation of the subtle mathematical concepts that underpin central mathematical ideas. This connects back to what Zalman Usiskin said about thinking about the mathematics. If we look at how mathematical ideas fit together and converge or not in the classroom and we collectively examine what happens in the act of teaching, we will start uncovering things we didn’t actually realize students were going to do with the mathematics. This idea may seem trivial, but it’s actually become extremely important in everything I do, especially when I work with pre-service teachers and when I do workshops with other teachers. I stress the importance of being aware of the impact of the choice of displays used to record the mathematical development of the lesson. Thus, while the overhead is a good tool in certain situations, it’s not nearly as powerful as having the student work and major points in the lesson posted in the room so they can be referred to at a later point in the lesson. As part of a teachers’ program at the Park City Mathematics Institute, I had the high school teachers make a field trip down the hall to Deborah Ball’s laboratory classroom for fifth graders to observe how she puts student work around the room and manages the available area so that class records accumulate over the duration of a week’s development of a concept; the work doesn’t disappear and get swallowed up in an overhead. I’ve learned the importance of asking the right question that will lead to the development of the mathematical concept, of crafting language for key points in that development. When I was a classroom teacher, I just walked in and never even thought about the questions that I was going to ask. I would introduce ideas, and then I’d work with students responses. If I didn’t have the right question, the lesson wouldn’t get to the mathematics. It’s important to understand the significance of the language used to put students to work on a task. There has to be a clear link between goals of a lesson and evidence that those goals were met. When the students walk out of the room, I now actually say “How do you know who knew what?” I used to just teach and when the bell rang, the lesson was over. Now I’m very much attuned to asking myself who learned what I taught and how do I know what they learned. One of the things that emerged in an International Congress on Mathematical Education (ICME) workshop in 2000 in Japan was the need for a language to talk about teaching. The Japanese have a language they use to discuss the different facets of teaching. We haven’t
222

come to that in the United States yet. We have no common language to talk about the nuances of the different pieces of teaching and what goes on in the actual act of instruction. As Zal Usiskin mentioned, we also need to develop a deeper appreciation of the curriculum trajectory for key mathematical concepts. For example, the Japanese may talk about what is learned in the fourth grade as an agreed on benchmark. In the United States, we don’t speak about what happened in fourth grade because content is in different places in the curriculum in different states and in different textbooks. One of the things that we’re trying to do is to make people aware of how mathematical ideas evolve within and across grades. That’s very important if we are to maximize the little time we have to teach students important mathematics. Somebody – I think it was Patsy Wang-Iverson – said that lesson study is centered around the students, but I actually think that focusing on the mathematics and the mathematics that the students learn is the core. Lesson study is about both the students and the mathematics. I actually make detailed lesson plans now for the classes I teach, because it makes a difference in how I think about teaching and learning mathematics. I found that this careful thinking provides me valuable opportunities to explore the things that I think are going to happen and to consider I’m going to handle them. I have learned that great ideas don’t always lead to coherence. I have learned that things take a lot longer than anyone would believe. I have learned that we often treat key ideas on the surface level. I have learned something I didn’t know before about the key roles of the facilitator and the outside expert. When we first looked at and thought about lesson study casually, we thought that almost anybody could be a facilitator. Then I watched masterful people do it, and I realized that it takes expertise in order to facilitate the discussion and create the kind of lesson that actually helps teachers deepen their content knowledge and create a better opportunity for student understanding. There’s a real art to being both an outside expert and a facilitator. I’ve learned to think about the lesson as a part of the big picture, and I’ve learned to appreciate shared strategies for doing mathematical tasks. In the United States, we don’t celebrate teaching; we focus on teachers. Good lessons are not preserved or shared in a systematic way. If there’s a really great teacher in a school, the lessons that this teacher has created rarely make it out of her or his classroom. Teaching, by virtue of our school culture, is a private occupation; that’s inherent in the way we think about schools. Teachers go into their classrooms and shut the door. So it’s very hard for us to open up the classrooms and have conversations about our teaching. It’s actually very rewarding when it happens, but we’re flying in the face of our culture. There’s a shift in the research right now. A study presented by Anna Sfard at the ICME 2004 conference found that two thirds of the research focuses on teachers; only one fourth focuses on learners (Sfard, 2004).
223

I think that lesson study is an opportunity for us not only to think about teaching but also about who’s learning what. I’ve learned a lot from lesson study, but it hasn’t been at the global level. It has been about what lesson study can do for me, as a teacher, and for the teachers with whom I work to help them think about what it means to teach. KEIICHI SHIGEMATSU The lesson, that I have learned, is to have profound ideas. I usually suggest to teachers that it’s very important for them to have their own research topics. If teachers focus on their own special interests in the teaching or writing processes, they have a magnet to catch the students’ ideas. In my case, my main research interest is in the area of psychological issues, so I usually want to investigate what’s in the student’s mind. When I observe lessons, I usually want to analyze them from this perspective. It’s very important for a teacher to challenge him or herself and to create new ideas in the practice of lesson study; otherwise, it’s only a demonstration. Many teachers want to come and observe lessons, but it’s not enough to simply observe. It’s very important to think about the points that are the most challenging and let them inspire new ideas.
JERRY BECKER
I have just a few comments. I am looking forward to learning more about lesson study so I am not sure how these few remarks will fit into it. I think that some of the first things I learned about how the Japanese deal with mathematics education, and in particular, problem solving, have a lot to do with lesson study. I’m involved in teacher education primarily at the elementary and middle school levels. Every day when I go to meet my classes, these are the problems that confront me: The vast majority of the students going into elementary teaching are women who have a lot of anxiety about mathematics. Their beliefs about mathematics are, one could almost say, completely wrong. They don’t have confidence in mathematics. Their attitudes towards mathematics are almost strictly negative. Their basic skills – that is, the ability to do addition, subtraction, multiplication, and division of whole numbers, fractions, and decimals – are very bad. Many of these students are only about two years removed from high school. I’ve talked to a considerable number of secondary mathematics teachers in southern Illinois, where these students come from, and I asked them about their perceptions of the students in these regards, when they were in secondary school. With respect to basic skills, for example, they say, “Yes, half of the students cannot do what we used to regard as middle school computation.” It used to be the case that virtually all of us at the seventh and eighth grade level could do these computations. We could do them quickly and accurately, but perhaps not all of us could say we understood all of what we were doing.
224

So one of the questions I ask is what, if anything, does work in lesson study have to do with solving the problems referred to above? I also wonder about the work the Japanese have done with the open approach to teaching mathematics. What implications does that have as a way of teaching and alleviating these problems? We have tried a lot of these things out, including the open approach to teaching mathematics, with teachers in our, for example, National Science Foundation teacher enhancement programs. We found that in a four-week period, we can make some progress with respect to anxiety about mathematics, changing elementary teachers’ beliefs about mathematics, their confidence and in improving their basic skills. Maybe, this is an area on which the two research communities or professional communities could collaborate. We’ve learned from TIMSS – actually I think before that, but it was characterized in TIMSS, that at the eighth grade level our curriculum is a mile wide and an inch deep. But exactly what does that mean? I know that it means we teach a lot of things, and we don’t teach them very deeply. I would like to know what concepts are considered to be the most important at each of the grade levels, and then how deeply they are to be taught and how they are taught. I think that perhaps the Japanese mathematics educators and researchers could help us out a lot in this regard. With respect to the preparation of elementary teachers, what mathematical content should they be taught? The recommendations in the Standards indicate we need to teach them a lot of new content in mathematics (NCTM, 2000). However, we find in our teacher education program that it isn’t necessarily easy to do. For example, it’s recommended that we teach some parts of trigonometry. It’s going to be very, very difficult for us to do that. Where will we find the time? Also, the students either aren’t interested in or they can’t handle studying anything beyond elementary algebra, or beyond quadratic functions. What do we do about things like that? We also have a kind of a tradition in the United States that “more is better.” For example, there are hundreds of exhibits at our professional meetings, and in those hundreds of exhibits, there are a myriad of teaching aids that are available to teachers. But have they been tested? If teachers take them back and use them on Monday morning, will they be able to use them effectively and will kids learn mathematics more effectively from them? I wonder about that. Would it be better to take a look at the Japanese elementary school curriculum and teaching practices instead? For example, what teaching aids do they use and why? Do they tend to focus on a small number of teaching aids, for example, that can be used for all grade levels, say K–6? Then, not unlike the number line, a teaching aid can get to be like an old friend, and it’s something that the student can “hang learning on,” as they go through the various grade levels. One of the things that we have to tackle in the United States is what it takes to improve achievement of students across the board. If we have projects, in-service institutes, and day-long or half-day workshops for teachers, to what extent can what goes on in such activities actually be transformed into improved teaching and learning in the classroom? I tend to be very skeptical about that.
225

On the other hand, we had an experience in Belleville, Illinois, where we had all of the teachers who taught mathematics in grades K–8, including the special education teachers, in our project. The focus was very much on the “open approach” to teaching mathematics. There were some things that happened, consequently. One of the first things was something that the superintendent of schools observed. He’s very different from a typical superintendent; he hardly ever spends time in his office, although he has a beautiful office with very nice carpeting, a nice conference table, and so on. He’s always out in the schools; he walks the hallways and looks at what teachers are doing and what the kids are doing between classes. What he observed in the fall after the teachers’ summer work with us was something he had never seen before: elementary teachers were talking mathematics. It happens that we had all of the teachers who teach mathematics at School District 118 in our project, and therefore they were exposed to some of the new materials that are available to teachers, as well as a different approach to teaching mathematics. When children entered kindergarten, they got a teacher who had been through the project; when they went to first grade, they had a teacher who had been through the project, and when they went to the next grades they had a teacher who had been through the project. We couldn’t predict that there would be huge implications down the line in terms of achievement on the state assessment program, but we learned that within a couple of years after these teachers left the project, they seemed to get very good results. The performance of the students in mathematics on the old Illinois Goals Assessment Program (IGAP) went up dramatically, at each of the grade levels tested. That same thing did not happen in science and the other areas. So Dr. Rosberg’s view was that the project had a lot to do with it. Then we went from the IGAP testing to ISAT in Illinois, and we asked if that trend would continue, and it seems that it did. So I think there are some ways in which we can conceive of teaching and carry it out in a way that fits very well with elementary school teachers. There can be some huge payoffs. While the traditional thinking has always been that secondary teachers know more mathematics than middle school teachers who in turn know more mathematics than elementary school teachers, we found that isn’t always the case, depending on how one conceives of mathematics. If one conceives of it, as we are trying to do in our project, as reasoning about an activity, then a large percentage of the elementary school teachers were very good at mathematics, although they didn’t think they were. They thought that, given any problem situation, they didn’t have a sufficiently large repertoire of formulas to draw on to apply to it in problem solving. Of course, just remembering and applying formulas is not mathematics. I’ll make one other very brief comment, about technology. My observation with respect to Japanese mathematics teachers is that they tend to think very carefully about the use of technology. The fact that it is available doesn’t mean it should be used; they think very carefully about how it should be used and at which points in the curriculum to use it. I think interaction with them in this regard could also be very valuable to us.
226
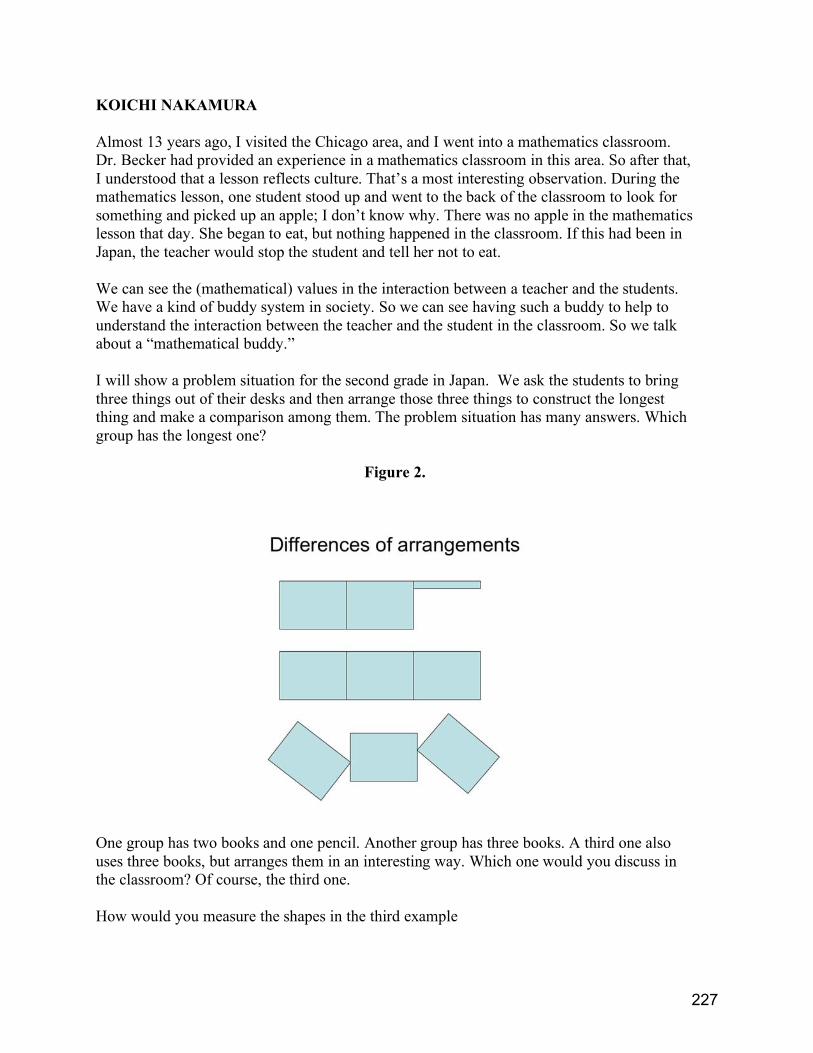
KOICHI NAKAMURA
Almost 13 years ago, I visited the Chicago area, and I went into a mathematics classroom. Dr. Becker had provided an experience in a mathematics classroom in this area. So after that, I understood that a lesson reflects culture. That’s a most interesting observation. During the mathematics lesson, one student stood up and went to the back of the classroom to look for something and picked up an apple; I don’t know why. There was no apple in the mathematics lesson that day. She began to eat, but nothing happened in the classroom. If this had been in Japan, the teacher would stop the student and tell her not to eat. We can see the (mathematical) values in the interaction between a teacher and the students. We have a kind of buddy system in society. So we can see having such a buddy to help to understand the interaction between the teacher and the student in the classroom. So we talk about a “mathematical buddy.” I will show a problem situation for the second grade in Japan. We ask the students to bring three things out of their desks and then arrange those three things to construct the longest thing and make a comparison among them. The problem situation has many answers. Which group has the longest one?
Figure 2.
One group has two books and one pencil. Another group has three books. A third one also uses three books, but arranges them in an interesting way. Which one would you discuss in the classroom? Of course, the third one. How would you measure the shapes in the third example
227

Figure 3.
The first one is measured by a path along the edges of the rectangles. The second one is measured by a piecewise linear path through the rectangles, which is linear within each rectangle. The third one is measured by a single linear path across all of the rectangles. So how do you capture or interpret these solutions? Incorrect, incorrect, correct? I would like to interpret these solutions as “edges,” “insides,” and “invisible.”
“Edges” mean that the students see the length on the edges or sides. “Insides” mean that the students see the length in the inside of the shapes; that’s much better than the first way. “Invisible” means that students see the length in invisible space. In the first interpretation, the mathematical knowledge is rigid. In the next, the mathematical knowledge is developing. It is mathematically rich. So we need to see students’ interpretations in two ways; only one way is not good. We need many buddies to understand students’ interpretations. In order to change teaching practice, we need to change our outlook. So the last point is that we have the same problem in Japan as in the Unites States. It’s difficult to be sensitive to one’s own values in the mathematics classroom, particularly mathematical values.
228

YASUHIRO SEKIGUCHI Our collaboration is a very inspiring experience. As you know, in order to experience something, a person must have experienced something else with which to compare it. Let’s take a look at this figure.
Figure 4. A geometric figure
Now let’s take a look at another one.
Figure 5. The Chicago skyline
This is part of the logo of the Chicago Lesson Study Group. These two poles on the trapezoid are critical in recognizing that this is Chicago – not New York – not Tokyo. U.S. lesson study has made Japanese educators aware of the significance of the Japanese lesson study tradition. U.S. lesson study will widen the variation of lesson study and may create another new tradition. This provides us with a valuable opportunity to reflect on what is critical for successful professional teacher development.
229

Speaking of variation, I would like to touch on another variation on the meaning of lesson study. Just a few months ago, a famous Japanese educator died. Her name was Miss Hana Ohmura. She was a grand-master teacher of the Japanese language. In one of her books, published just last year, she was talking about Kenkyo Jugyo; she said that lesson studies are found in every subject in Japan, not just in mathematics (Ohmura, 2004). I found this very provocative statement in her book: “To keep myself from getting old as a teacher I have continued doing Kenkyu Jugyo throughout my teaching career.” That means a person can stay young, if he or she continues doing lesson study or research lessons. Miss Ohmura was born in 1906, and she had been a schoolteacher for 52 years, until she retired at the age of 74. She lived nearly a century. If you are going to stay young and live long, don’t quit lesson study. What a great formula. When Miss Ohmura was working as a junior high school teacher, she conducted research lessons every month. She developed new teaching materials by herself that are not in textbooks and that she had never used in her lessons before. She had spent a whole month to prepare a research lesson. She said it is very, very tough. Why had she continued such an extraordinary practice? She could have used materials that she had developed before, but she did not. She said, “If I relied on those materials that I have used before, my spirit could get older.” She said, “Whether the teacher is experienced or not, if she loses the spirit of inquiry, she will not be able to reach children. She will be living quite a distance from the children’s world.” She believed that children, by nature, have the spirit of inquiry, and they are very eager to roam. So she said, “To feel sympathy with children, the teacher also has to have the spirit of inquiry and be passionate about her own role.” This is one of the reasons that Miss Ohmura continued lesson study. I don’t want to push you to do monthly research lessons; you might become burned out. The point is that every teacher needs to develop his or her own means of lesson study in order to keep it up. Miss Ohmura developed her own meaning and committed herself to it. We might want to understand and reflect on the meanings Japanese teachers and U.S. teachers have developed about lesson study and the significant variations between them.
TAD WATANABE As an American mathematics educator, I benefit from this collaboration. We always think about what we can learn from Japan, but I think about what Zal Usiskin said about Japanese mathematics educators. What can they learn from us? We are learning from them that they are actually looking to us for ideas, too. They were very inspiring, and they give us a sense of responsibility.
230

REFERENCES Hyman Bass, Gail Burrill, and Zalman Usiskin (eds.) (2002). Studying Classroom Teaching
as a Medium for Professional Development: Proceedings of a Workshop. Washington, DC: National Academy Press.
National Council Teachers Mathematics (2000). Principles and standards for school mathematics. Reston: National Council of Teachers of Mathematics.
Ohmura, H. (2004). Tomoshitsuzukeru kotoba [Lighting words]. Tokyo: Shogakukan. Schmidt, William H., Curtis C. McKnight & Raizen, Senta. (1997). A splintered vision: An
investigation of U.S. science and mathematics education. Boston: Kluwer. Schmidt, W., Houang, R., & Cogan, L. (2002). A coherent curriculum: The case of
mathematics. American Educator 26(1), 1–17. Retrieved March 19, 2006 from http://www.aft.org/pubs-reports/american_educator/summer2002/curriculum.pdf
Sfard, A. (July 6, 2004). What could be more practical than good research? Plenary report for Survey Team I at the 10th International Congress on Mathematical Education, in Copenhagen.
McKnight, C., Crosswhite, F., Dossey, J., Kifer, E., Swafford, J., Travers, K. & Cooney, T. (1987). The under-achieving curriculum: Assessing U.S. schools from an international perspective. Champaign, IL: Stipes Publishing Company.
231
SECTION 4
LESSON STUDY AS AN EXAMPLE OF CROSS-NATIONAL LEARNING
232

LESSON STUDY IN JAPANESE MATHEMATICS EDUCATION1
Yoshishige Sugiyama Wasada University
Translator: Tad Watanabe
ABSTRACT
Some contend that lesson study began in Japan when those responsible for training mathematics teachers began offering demonstration lessons so new teachers could learn by doing. A second explanation is that it developed so that student teachers and new teachers would have opportunities to be observed and to receive advice from more experienced teachers. Regardless, in Japan lesson study has been used as a route to improving instruction. It assumes the best learning occurs when students learn by doing—by “creating mathematics” through problem solving. Lesson study requires that teachers pay very close attention to children: who they are, the way they think, and what they know or understand. Reflection on research lessons and on what is happening in the classroom is an integral part of lesson study. In critiquing the strengths and weaknesses of a particular lesson, participants are also expected to come up with suggestions for future lessons. Most importantly, post-lesson discussions should look for principles of teaching that can be drawn from the observations of specific lessons. INTRODUCTION (Introduction by Tad Watanabe) One of the first talks we heard was Makoto Yoshida’s talk. It made me think that, in Japan, lesson study has become such a routine part of our practice that we often take it for granted. In viewing it in a very systematic and theoretical way, I’m amazed at how complex it looks. I am grateful to Yoshida for his description of what happens in lesson study. However, his description may be daunting to those of you just starting lesson study. If you think about it as such a complex activity, you might be hesitant about embarking on this new practice. Today, I’d like to talk about some of the basic ideas about lesson study and reflect on its history, as I understand it. ROOTS OF LESSON STUDY IN JAPAN In Japan, lesson study did not occur for theoretical reasons. There are two different ways it could have begun.
1 Presented at Improving Mathematics Teaching and Learning Through Lesson Study, May 20-21, 2005, Chicago.
233

Demonstration Lessons About 70 or 80 years ago, many Japanese teachers did not have a good understanding of mathematics, and weren’t able to teach well. Master teachers, teachers at schools affiliated with national universities, and mathematics supervisors in school districts wanted to improve the situation—not by words, but through actions, by giving teachers opportunities to observe lessons. So one reason why lesson study might have started was to provide demonstration lessons. When you are learning something difficult, it can be much easier to learn it by observing than listening to elaborate logical or theoretical explanations. From that perspective, if you’re starting a new lesson study group, instead of having beginning teachers conduct the first research lessons, it’s preferable that more experienced teachers conduct them. Beginning teachers can start their practice by imitating good lessons, then gradually think about improving those lessons. Demonstration lessons still occur in Japan today. Sometimes university professors, or supervisors of mathematics in school districts, as well as very experienced veteran principals teach demonstration lessons for less experienced teachers. A group called Atarashii Sansu Kenkyuu (Study Group for New Elementary School Mathematics) meets annually in November. At this year’s meeting about 10 experienced teachers will be teaching demonstration lessons, and there will about 20 research lessons planned and conducted by regular classroom teachers. It is hoped that the 10 experienced teachers will provide opportunities for novice teachers to see some good mathematics teaching. Opportunities for New Teachers to be Observed A second way that lesson study might have started was in order to provide opportunities for student teachers or new teachers to have their teaching observed by more experienced teachers. So some research lessons would be conducted by student teachers or novice teachers. During the discussion time, the more experienced teachers might point out some areas where these beginning teachers could improve. As the years passed, I think many teachers developed their ability to perfect good mathematics lessons. These teachers wanted to show others their own teaching and also observe good teaching by others. This might also have led to the development of the lesson study of today. LESSON STUDY AS A ROUTE TO INNOVATION Some teachers select topics for their research lessons that they find particularly difficult to teach, so that they have the opportunity to receive feedback from colleagues on these challenging areas of teaching. Other teachers use research lessons as an opportunity to communicate their understandings and their ideas about what it means to learn mathematics. When these teachers plan research lessons, they’re not only concerned about creating a good mathematics lesson. They also try and keep in mind certain topics that they want to present.
234

These might involve key problems for students to work on, new instructional materials that might be used, or ideas on how classroom discourse might develop during a lesson. When teachers include such proposed innovations in their research lessons, this provides lesson study participants with an opportunity to learn new ideas, as well as to provide feedback for the teacher of the lesson. As a result, together the audience and the teacher refine and improve the proposed innovation. ATTENDING TO CHILDREN’S THINKING The main purpose of lesson study is improved instruction. To accomplish that purpose, we pay very close attention to children and children’s activities. We find out what children understand, how children think about the concepts that they don’t understand, and who children are – what they are thinking and feeling. The more you understand what children know and how they think, the more effectively you can plan research lessons. This approach is always important, even in daily lessons, and even for mathematics lectures that you might give—although the image of the good mathematics lesson that we pursue in lesson study is not anything like a lecture. The most fundamental concept about good mathematics lessons is the idea of creating mathematics together with children. This morning, Cathy Seeley discussed the idea of doing mathematics. Through doing mathematics together with children, we create mathematics—that is an important idea we want to keep in mind. LEARNING THROUGH PROBLEM SOLVING To create mathematics, we solve problems. The purpose of problem solving is not just to solve—to find the answer to the problem. Instead, through solving the problem, we create the mathematics. Some might say that if you’re doing problem solving it really doesn’t matter what problems you use. But that’s not the case—we have to think carefully about the quality of the problems we use. It is important for us to select the kind of problems where children can create mathematics by solving the problems. Just because children found correct answers to the problems doesn’t mean that lesson or activity involved problem solving. If you really become serious about the idea of creating mathematics together with children, you also have to think about the way we as human beings created mathematics as a discipline. While we cannot know exactly how mathematics developed historically, a fundamental assumption is: “Because human beings created mathematics, children can create mathematics.” When you’re creating something new, it’s unlikely to go as smoothly as a very organized mathematics lecture. The process of creation will involve trial and error, many failures, and many different kinds of attempts. The Japanese philosopher Miki Kiyoshi used the metaphor of building a house in discussing the idea of creation. If you just look at a building. you don’t
235

necessarily know how the building was built. But when you build a house or a building, you first lay a foundation and then you build a scaffold. The Need to Learn by Doing Listening to a mathematics lecture is like listening to an explanation about a building as you look at the building. However, when you learn by creating mathematics, it’s like you’re building a building. You have to build a foundation and scaffold, try many different things, and in some cases even by trial and error. During the afternoon panel, there was some discussion about why Japanese high school teachers do not often engage in lesson study. Historically, Japanese high school teachers were very much like college or university professors of mathematics. They are very knowledgeable in mathematics and often very skillful in explaining mathematics, in much the same manner as an architect or historian might describe a building as listeners look at it. Many Japanese high school students are satisfied just listening to teachers and following their directions, and in that way manage to do well in mathematics class. But in the United States, if high school students don’t understand something they will raise their hands and ask questions—even when the teacher is in the middle of saying something. I believe that U.S. high school students want to resolve any questions or difficulties they are having with the mathematics as quickly as possible. With students who display that kind of attitude and disposition, lesson study is likely to succeed and flourish in high school. So I’m really hoping that lesson study becomes widely practiced in U.S. high schools. GAINING INSIGHTS FROM CHILDREN’S THINKING As I said before, it’s very important that teachers work together with children to create mathematics. I think that’s crucial for a successful research lesson. Pay close attention to children—the way they think and what they understand. Through that activity you will really improve your lesson study practice. Children think very differently than we do. Paying attention to those differences can help us gain insights and understandings we can apply to our teaching. For example, we have seen children who add one half and two thirds by adding the numerators together and adding denominators together to give the answer of three fifths. It is easy to discredit such an answer as incorrect. If you do, some children might respond to you by saying, “Well, think about a situation where you have two groups of kids: a group of two and a group of three. One group is a girl and a boy. The other group has three kids, two of them are girls. If you think about them all together the fraction of girls in the combined group is indeed three fifths.” That’s not an incorrect answer. But as an answer to the sum of the two fractions, it is incorrect. In this example, children have used what they understood when they thought about the problem of combining one half and two thirds. Thinking about this process, and this kind of experience will provide an opportunity for students to think about the meaning of addition, as
236
well as what they are doing when they add numerators or denominators together. As you probably know, it is OK to add the numerators and denominators if the two fractions represent ratios. As this example demonstrates, it is all too easy to tell students that their answer is incorrect. But what is important is for us to determine why students try their ideas, what they understood, and how that understanding led to the attempt they made. Through such reflection, we can help students develop a deeper understanding of addition, of ratios, and of many other mathematical concepts. USING INSIGHTS ABOUT CHILDREN’S THINKING TO HELP THEM LEARN MATHEMATICS One thing that we should remember is not to be satisfied just noticing how children talk about a particular problem. We also have to figure out how we can help children to think more mathematically, because the way we create mathematics is by seeking a way to solve a problem more effectively, more efficiently, and by generalizing. The purpose of observing children and paying attention to children’s understanding is to improve teaching and help teachers learn what they could do better. In the process of creating mathematics; children are our collaborators. But when we think about improving teaching, children are the mirrors in which our teaching is reflected. Children act according to what they understand and what they think, but they also respond to the kind of problems that teachers pose, the way teachers develop a lesson, and the way teachers interact with them. So by watching children and how they’re responding to a lesson, we can learn about areas where we’re not doing as well as we could or in which we can improve. When you work with children for some time they will pick up a lot of ideas about what teachers believe and the way that teachers teach. So when you reflect on children’s actions or children’s activities during a research lesson, it’s not just about the lesson that was taught that day, but also about how that teacher has been teaching over a period of time. One of the most important principles of lesson study is to remember to come up with suggestions about what to do tomorrow when reflecting on today’s lesson. So in the post-lesson discussion don’t limit yourself to pointing out “we should have done this” or “we could have done that.” Also consider what you can use in the lessons ahead to improve your teaching. I think that’s crucial for lesson study. GENERAL PRINCIPLES In lesson study, even though we only observe one lesson at a time, our larger goal is to improve teaching and to find principles about teaching that will apply to any lesson.
237

Selecting and Designing Problems. For example, in yesterday’s lesson there were some difficulties with the tasks that were given and used during the lessons. In the third grade lesson involving beads and creating necklaces, the way the problem was phrased was problematic (“See how many ways you can make this necklace”). The problem was not directly related to the focus of the lesson, which was understanding one-half, and how one-half and two-fourths are related. If we want children to think about different ways that quantities can be expressed, we need to select problems through which that becomes the main focus. Using Time. We must also look at the structure of research lessons. How much time did the children spend on many different activities during the lessons? Was each segment of time used effectively and appropriately? Was the learning that children got during that time worth the amount of time spent? Sometimes we spend a lot of time with children discussing good ideas, but the end result of the discussion is not too fruitful. If that’s the case, that segment of time was not used efficiently. Posing Problems. We also need to pay attention to how we pose problems: Do the children understand what they are expected to do? Are we posing problems in a way that makes children want to solve the problem? CONCLUDING REMARKS I believe that we can improve our teaching through lesson study by carefully conducting post-lesson discussions. This is the time to identify some of the problems or the challenges that children have had, , and try to generalize from those observations so we can come up with principles of teaching that all participants can benefit from. To develop such general principles it is very important that we become critical of each other. Even though many of us may not like to be critical of others and other’s teaching, we’re not interested in criticizing individuals. Our goal is to develop generalized principles. I hope that you will keep that in mind and be critical as you discuss research lessons. The purpose of lesson study is to improve lessons—improve our teaching. As we engage in lesson study, we want to think not only about the research lesson that we are creating or discussing, but also keep in mind that we are trying to improve our everyday teaching. When developing a research lesson, there is no need to always come up with something new or innovative. We can always use the topics that we teach every day. We conduct lesson study so that we can create good lessons. I hope that you will keep that in mind as you engage in lesson study.
238

INSTRUCTIONAL IMROVEMENT THROUGH LESSON STUDY: PROGRESS AND CHALLENGES IN THE U.S. 1
Catherine Lewis and Rebecca Perry Mills College, Oakland, California
ABSTRACT
This paper provides a brief history of lesson study in the United States, with a focus on areas of progress and challenge. Four areas of progress are identified: growth of interest among educators; growth of tools and resources; growth of understanding; and emerging evidence of effectiveness. Five challenges are identified: lack of access to connected and coherent treatments of school mathematics; premature “expertise”; overly simple views of educational research; limited opportunities for cross-site learning; and inadequate connections from practice to policy. INTRODUCTION Lesson study is the core form of professional development in Japan, and is often credited for the steady improvement of Japanese elementary instruction (Hashimoto, Tsubota, & Ikeda, 2003; Lewis & Tsuchida, 1997; Stigler & Hiebert, 1999). U.S. educators have shown enormous interest in lesson study since the Third International Mathematics and Science Study brought it to public attention in 1999; however, the U.S. has a history of educational faddism and many promising innovations have been discarded before being thoroughly understood or implemented (Burkhardt & Schoenfeld, 2003; Fullan, 2001). Will lesson study suffer a similar fate? This paper examines evidence of lesson study’s progress and challenges in the U.S. to date. LESSON STUDY’S PROGRESS IN THE UNITED STATES Four areas of progress are identified: growth of interest in lesson study among U.S. educators; growth of tools and resources for lesson study; improved understanding of lesson study; and emerging evidence of lesson study’s effectiveness in U.S. settings. Growth of interest in lesson study
This material is based upon work supported by the National Science Foundation under Grant No. 0207259. Any
opinions, findings, and conclusions or recommendations expressed in this material are those of the authors and do not necessarily reflect the views of the National Science Foundation.
1 Presented at Exploring Collaborations in Science and Mathematics Education, March 17-19, 2003, San Francisco.
239

In 1999, discussion of the Third International Mathematics and Science Study brought Makoto Yoshida’s (1999) work on lesson study to a broad public audience (Stigler & Hiebert, 1999), provoking enormous interest in lesson study among U.S. educators and researchers. Within three years, lesson study groups emerged in at least 200 U.S. schools in at least 25 states (Lesson Study Research Group, 2004a), and lesson study became the focus of dozens of conferences, reports and published articles in the U.S. (e.g., Brown et al., 2002; Chokshi & Fernandez, 2004; Lewis 2002a,b; Lewis, Perry, & Hurd, 2004; National Research Council, 2002; North Central Regional Educational Laboratory, 2002; Richardson, 2004; Stepanek, 2001, 2003; Wang-Iverson & Yoshida, 2005; Watanabe, 2002; Wilms, 2003). We are not aware of a systematic source of statistics on public lessons in the US, but we do know that public research lessons, one outcome of lesson study, now occur in many regions. For example, in the first half of 2005 alone, public lessons occurred in several locations in California, Washington, Iowa, Illinois, and several locations in Massachusetts. At least five of these had more than 100 people in attendance. Some interest in lesson study in the U.S. has come from quarters such as universities where lesson study in Japan is infrequent. U.S. interest in lesson study has emerged across grade levels (from preschool to university) and across subject areas, including science, mathematics, language arts, English as a second language, art education, social studies, special education, and no doubt other areas as well (Teaching American History, 2005; University of Wisconsin-LaCrosse, 2005). Growth of tools and resources for lesson study Various tools for the pursuit of lesson study have been developed in the U.S., some based on Japanese practice (e.g, protocols for classroom observation and the post-lesson colloquium), and others in response to challenges that may be more prevalent in the U.S. than in Japan (e.g., how to get started with lesson study, how to develop collaborative norms within a lesson study group). Resources include individual protocols and agendas for parts of the lesson study process; handbooks; practitioner-oriented articles; and videos of lesson study in Japanese settings and in U.S. settings conducted by U.S. practitioners and by Japanese practitioners (Fernandez & Chokshi, 2002; Lesson Study Research Group, 2004b; Lewis, 2002b; Mills College Lesson Study Group, 2005, 2003a,b, 2000, 1999a,b; Wang-Iverson & Yoshida, 2005). Improved understanding of lesson study Figure 1 illustrates two ideas about the mechanism by which lesson study improves instruction. We developed this figure for use in workshops, in response to the conception of lesson study that seemed to underlie frequent questions such as “When do Japanese practitioners decide a lesson is good enough to be used widely?” and “If Japanese teachers spend so much time on one lesson, how do they ever get to all the lessons in the curriculum?” The view of lesson study labeled as Conjecture 1 – that it improves instruction primarily through the improvement of lesson plans – has characterized the early work of some sites that we have studied. For example, the teachers of Bay Area School District (a pseudonym; hereafter “BASD”) initially used the phrase “polishing the stone” (Stigler & Stevenson, 1991) to describe their work, and originally planned to
240

disseminate “polished” lesson plans on the district intranet as a primary outcome of their lesson study work. However, during their first year of work, BASD teacher-leaders began to redefine their work in a way that seems closer to Conjecture 2, and began to regard the lesson plans as an inadequate representation of what they learned from lesson study. As a result, they chose methods other than lesson plans to share their learning, such as open-house research lessons where visitors could participate in the whole process of lesson observation, data collection, and lesson discussion. Emerging evidence of effectiveness of lesson study in the U.S. In 1994, when the first author gave talks about lesson study, it was common for U.S. audience members to make comments like “lesson study will not work in the U.S. because we are not a collaborative culture,” or “Lesson will not work in the U.S. because teachers don’t know as much mathematics as Japanese teachers.” However, U.S. teachers involved in lesson study have expressed appreciation of the opportunities it provides to learn mathematics and to build a collaborative culture:
Until lesson study we never discussed the value of the content being taught. We discussed the different ways students learn (multiple intelligences), how the brain works, how to differentiate. . . . Never had those discussions involved . . . problem-solving techniques, how to develop a particular concept . . . what to expect for outcomes. When we meet, one of the things that we like to do is to first individually solve a math problem and then share our strategies for solving it….Our variety of approaches has led us to think about all the strategies our students use. I like stretching my own brain. I really see this as an opportunity - taking teaching out of the closet… giving it a professional dignity it hasn’t had Great trust has developed over time that allows us to be both teachers and learners with each other. Isn’t that what it’s all about?
I am indebted to Jane Gorman of the Massachusetts Lesson Study Communities for sharing these quotes. These statements suggest that, at least for some U.S. teachers, lesson study provides an opportunity to build both mathematical knowledge to be used in teaching and a collaborative culture. The video “How Many Seats” provides a further “existence proof” of U.S. teachers using lesson study to build collaboration and content knowledge (Mills College, 2005; Lewis, Perry, & Murata, 2006). Knowledge of the curriculum. Other evidence from U.S. settings suggests other types of teacher learning during lesson study. For example, the U.S. kindergarten teachers studied by Murata (2005) made connections between state standards and their own curriculum knowledge in the
241
course of their lesson study work, shifting their view of the state standard in question from “no way our students can do this” to confidence that it can be mastered and knowledge about to how go about it. A technology-based “lesson-study inspired” innovation studied by Ermeling (2005) led U.S. high school science teachers to increase student inquiry in their classroom lessons. Student learning. At one BASD elementary school, teachers voted to conduct lesson study on a school-wide basis in 2002, after volunteer groups of teachers found it to be useful. Since then, this teacher-led lesson study has continued each year, growing from mathematics to include other subject areas at the instigation of the teachers. Figure 2 shows the scale scores for the school on the state mathematics achievement test, along with those for the district and state as a whole. Over 2002–05, the three-year net increase in average mathematics achievement score for students who remained at this school was more than triple that for students who remained elsewhere in the district (90.5 points compared to 25.8 points), a statistically significant difference (F = .309, df = 845, p < .001). Although a causal connection between the achievement results and lesson study cannot be inferred, other obvious explanations (such as changes in student populations served by the school and district) have been ruled out. School-wide lesson study appears to be a primary difference between the professional development at this school and other district schools during the years studied.2 CHALLENGES TO LESSON STUDY IN THE UNITED STATES In addition to areas of progress, five areas of challenge have emerged as lesson study has unfolded in the United States: lack of access to coherent and connected treatments of school mathematics; premature “expertise” about lesson study; limited views of educational research; limited opportunities for cross-site learning about lesson study; and inadequate feedback links between lesson study and changes in curriculum and policy. Access to examples of coherent and connected school mathematics Kyouzai kenkyuu (investigation of teaching materials) is used by Japanese teachers early in the lesson study process to deepen their understanding of the mathematics and its teaching (Hashimoto, Tsubota, & Ikeda, 2003; Takahashi et al., 2005). Visiting Japanese educators often ask U.S. teachers how a particular topic is presented in the textbook, or suggest that U.S. teachers study a topic’s presentation in several textbooks. This may be useful advice if the textbook’s approach reveals interesting features of the topic. Unfortunately, this is not always the case. One group of mathematics coaches in California conducted a lesson study cycle on proportional reasoning. Accounts of Asian treatments of proportional reasoning provided some of the richest material for discussion (see Figure 3, from Lo, Watanabe & Cai, 2004); in contrast, a U.S. textbook might provide few examples for teachers to deepen their thinking about the mathematics or pedagogy of proportional reasoning (see Figure 4).
2 To rule out competing hypotheses about causes of the increasing achievement, we identified other reform efforts that
the school-wide lesson study school participated in during 2001–2005, and identified all other elementary schools (five) that participated these reform efforts. Gains in achievement for students who remained at each of these schools for longer than one year were compared with gains for all students who remained in the district. Only one school other than the lesson study school showed any statistically significant achievement gains relative to the district as a whole, and that school did not show sustained gains over three years.
242

Premature “expertise” Lesson study is a simple idea but a complex process. Even after a decade of studying lesson study in Japan, we are all still learning about lesson study’s many forms and purposes. The two examples of lesson study best known in the United States are (described in the videotape “Can You Lift 100 Kilograms?” and in Fernandez & Yoshida, . However, many other kinds of lesson study are conducted in Japan (Lewis & Tsuchida, 1997; Lewis, Perry, & Hurd, in press). Remarkably, some U.S. educators seem to believe that participation in one or two lesson study cycles qualifies them as lesson study experts who can provide definitive blueprints to others. Premature expertise may pose a substantial threat to lesson study, by generating a “been there, done that” attitude instead of a realistic expectation that, in the words of Antonio Machado, “the road is created as we walk it together.” In contrast, a learning stance seems to characterize the work of settings such as BASD where lesson study has been sustained. During the first year of lesson study work, one of the BASD leaders answered a question about the attitudes essential to lesson study in the following way:
That you can always get better at teaching. That you’re never at the end of the road . . . If you came into [lesson study] and you were [acting] like “I’m the hottest thing out there and I’ve got all these great ideas and I’ll share them with you guys” . . . you’re not going to get anything out of it.
The expectation that teachers will learn about subject matter and its teaching-learning through lesson study has been a steady theme throughout the five years of the lesson study effort. For example, a video shot in 2002 and widely used to introduce BASD’s lesson study work prominently features teachers’ initial struggle to understand the mathematics of a problem and their strategies to build their own mathematical understanding (Mills College Lesson Study Group, 2005). In 2005, as one BASD lesson study group shifted its focus from mathematics to writing instruction, experienced teachers readily volunteered that they did not believe they had effective strategies for teaching writing. Two members commented afterwards on how lesson study fostered and was fostered by a culture in which “You’re learning. You don’t know everything. You’re not busy hiding what you don’t know.” Limited views of educational research When we ask a roomful of U.S. educators to raise their hands if they have ever seen a promising innovation discarded before it has been thoroughly tried, virtually every hand in the room goes up. Simplistic research paradigms may contribute to premature innovation death. For example, lesson study might be regarded as something like aspirin, an easily transported treatment that interacts little with local characteristics. Or lesson study may be regarded as a “recipe” that can be implemented according to some fixed instructions (perhaps with minor adjustments as needed for using a recipe at high altitude). These metaphors suggest that, like aspirin and recipes, lesson study may be studied by control–treatment methods borrowed from agriculture or medicine.
243
Neither the metaphor of aspirin or recipe captures lesson study, because of the extensive interaction between lesson study and its setting (Lewis, Perry, & Murata, 2006). What is needed to practice lesson study in a setting where there is a coherent curriculum, tradition of collaboration, and history of careful study of student learning may be quite different from what is needed where these do not exist. Lesson study might more appropriately be thought of as a system of learning with certain core principles that builds:
Teachers’ knowledge: • Knowledge of subject matter • Knowledge of instruction • “Eyes to see students” • Connection of daily practice to long-term goals
Teachers’ commitment and community: • Motivation to improve • Connection to colleagues who can help • Sense of accountability to community of teachers
Learning resources: • Lesson plans that reveal and promote student thinking • Tools that support collegial learning during lesson study
Limited opportunities for cross-site learning The United States is geographically large. Even though there are many lesson study efforts springing up, many U.S. teachers have little opportunity to experience lesson study outside of their own cultural setting and local site. Isolated sites are eager to learn from one another. For example, the idea of setting group norms and choosing a norm to monitor at each meeting, developed by teachers in one U.S. school district, was eagerly embraced by others when they saw it in a workshop. Opportunities to see research lessons and post-lesson colloquiums conducted at other sites can provide an opportunity for immersion in another culture of lesson study, providing a vantage point on one’s own assumptions, practices, and so forth. Cross-national learning that includes educators from Japan may be a particularly potent form of cross-site learning, judging from U.S. teachers’ reflections on cross-national workshops. Comments from U.S. teachers who engaged in cross-site lesson study with Japanese colleagues in 2001 illustrate the reflections about lesson study and mathematics teaching-learning that may be stimulated by such collaborations:
[I learned that lesson study] is not so much about lesson planning as it is about research and watching children’s learning I love the Japanese teachers’ polite, validating comments to the students. “I don’t require the correct answer.”
244

Effective observation involves skills, knowledge and preparation. This includes a “record of lesson” sheet, a copy of the lesson plan itself, and how effectively you can link teacher action to child’s expression. Create a need (hunger) for mathematical language; don’t just give it to kids. The blackboard is a record of the lesson. I often use the overhead (thus, erasing a lot) or erase what I’ve written on the blackboard due to lack of space. Mr. Takahashi’s use of the blackboard has made me think of how I will use it in the future.
Inadequate connections from practice to policy In Japan, there is an intimate relationship among lesson study, textbooks, and the National Course of Study. Advances in one arena tend to reshape the other arenas as well. For example, Japanese elementary teachers were uncomfortable when, in a time of energy shortage, solar energy was not a part of their curriculum, and they began to create research lessons about this topic. Solar energy research lessons spread through lesson study networks, were noticed by teachers active in national policy matters, and eventually the national Course of Study was revised to include solar energy (Lewis & Tsuchida, 1997). A much broader group of elementary teachers then used lesson study to make sense of this new topic in the elementary science curriculum. New elementary lessons are expected to prove themselves widely in public research lessons before finding their way into textbooks, and teacher-authors of textbooks are typically very active in lesson study, incorporating successful new approaches into textbook revisions (Lewis, Tsuchida & Coleman 2002; Lewis, 2004). In Japan, lesson study also offers a way for topics to be removed from the course of study. At one point, inspired by a U.S. curriculum, the Japanese course of study included the stipulation that all elementary children should hatch eggs. Officials from the national ministry of education came to see lessons – and got an earful from teachers who said, “This may work well in the United States, but we in Japan have kids who live in apartments. They can’t be hatching eggs, they can’t kill something children hatch at school. This is a terrible activity for Japan.” Without waiting for the next official revision, ministry officials took hatching eggs out of the national curriculum. The Japanese Ministry of Education, Culture, Sports, Science and Technology provides funding to schools across Japan that apply to be “designated research schools” for curricular innovations under consideration. Over a period of several years when an innovation is being considered or initiated, teachers at designated research schools engage in repeated cycles of lesson study, often inviting in university-based specialists and nationally known teachers interested in the particular innovation (Bjork, 2004 March; Lewis & Tsuchida 1997, 1998; Tam, 2004 March; Tsuneyoshi, 2001, 2004 March). Teachers at the designated research schools study existing curricula and materials (often including approaches from abroad), adapt or develop approaches they think will work in their own settings, and study students’ responses to the new types of instruction. After cycles of internal lesson study, teachers conduct public research lessons that bring to life the local vision of the innovation, enabling visiting educators to observe the instructional approach and the students’ learning and development, and providing a public forum for lively discussion
245

of the local theory of the innovation. In this way, instruction, textbooks, and standards can evolve in tandem. In contrast, the understanding of a group of U.S. teachers, for example, of how a particular standard might be brought to life for first-graders (Murata, 2005), gained after hard work, may never be communicated to others. The major information conduits linking lesson study, textbooks, and educational policy in Japan are missing or sparse in the U.S.: for example, the well-known educators who travel to many lesson study sites to provide public commentary; the teacher-authors of textbooks who are heavily involved in lesson study; and the regional and national policymakers who attend research lessons and use them as formative evaluations of the strengths and shortcomings of policy and its implementation (Lewis & Tsuchida, 1997; Watanabe, 2002). CONCLUSION Cross-national discussions of lesson study give us a valuable opportunity to share successes and challenges with lesson study, and to work jointly to build progress and overcome obstacles. As the Japanese say, “When three people gather you have a genius.” We hope the many perspectives assembled in this volume will enable progress.
246
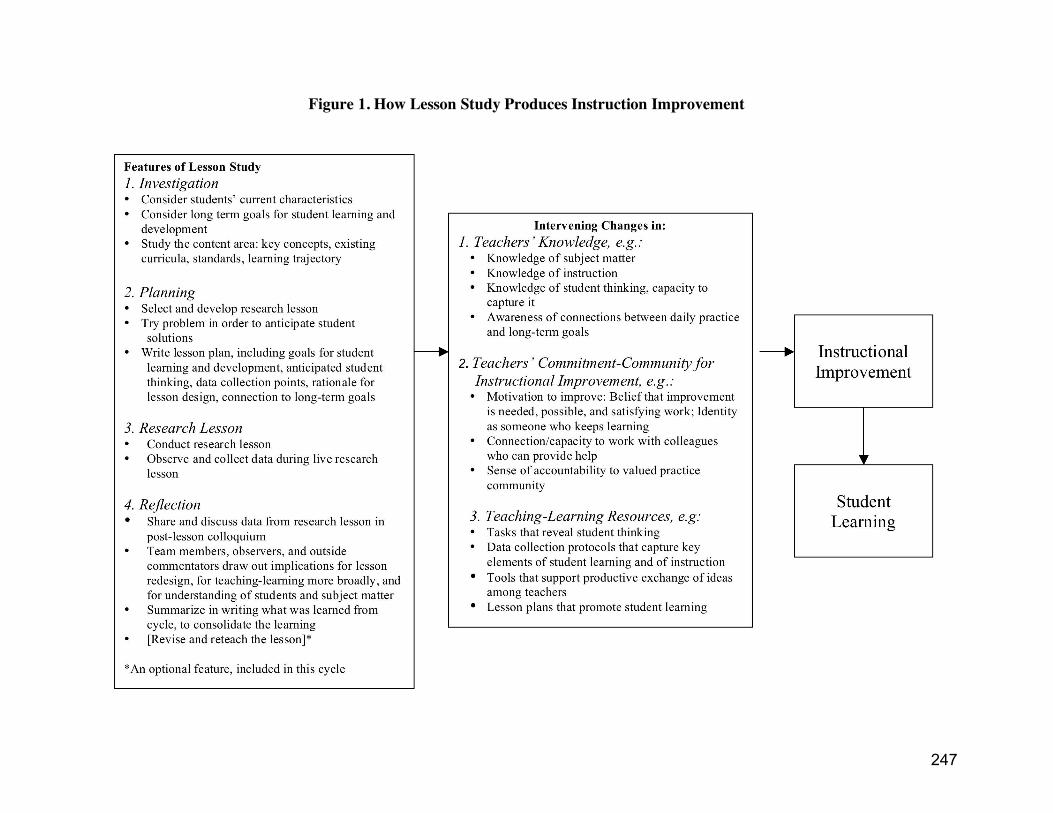
Figure 1. How Lesson Study Produces Instruction Improvement
247

Figure 2. Whole School Lesson Study Site: California Standards Test in Mathematics, Mean Scale Scores, Grades 2-5
248

Figure 3. Ideas from Planning
• Unit rate (value of a ratio) relates equivalent fractions;
• Relates to measurement;
• Uses division;
• Units (e.g., of 1) can be grouped to form larger units (e.g., of 5)
• We typically think in “simplest form” rather than have kids think about units
(Lo, Watanabe, & Cai, 2004) Used with permission of the National Council of Teachers of Mathematics.
249

Figure 4. Showing standard cross-multiply and divide algorithm
(Larson et al., 2001. p.315) Used with the permission of McDougal Littell Inc.
250

REFERENCES Bjork, C. (2004, March 6). Decentralizing the Japanese curriculum: Two case studies. Paper
presented at the Association of Asian Studies Annual Meeting, San Diego. Brown, C., McGraw, R., Koc, Y., Lynch, K. & Arbaugh, F. (2002). Lesson study in secondary
mathematics. In D. S. Mewborn et al. (Eds.), Proceedings of the twenty-fourth annual meeting of the North American chapter of the International Group for the Psychology of Mathematics Education (p. 139). Columbus, OH: ERIC Clearinghouse for Mathematics, Science, and Environmental Education.
Burkhardt, H., & Schoenfeld, A. H. (2003). Improving educational research: Toward a more useful, more influential, and better-funded enterprise. Educational Researcher, 32(9), 3–14.
Chokshi, S., & Fernandez, C. (2004). Challenges to importing Japanese lesson study: Concerns, misconceptions, and nuances. Phi Delta Kappan, 85(7), 520–525.
Ermeling, B. (2005). Transforming professional development for an American high school: A lesson study inspired, technology powered system for teacher learning. Unpublished doctoral dissertation, University of California, Los Angeles.
Fernandez, C. & Chokshi, S. (2002) A practical guide to translating lesson study for a U.S. setting. Phi Delta Kappan, 83, 128–34
Fernandez, C. & Yoshida, M. (2004). Lesson Study: A case of a Japanese approach to improving instruction through school-based teacher development. Mahwah, NJ: Lawrence Erlbaum.
Fullan, M. (2001). The new meaning of educational change (3rd ed.). New York: Teachers College Press.
Hashimoto, Y., Tsubota, K., & Ikeda, T. (2003). Ima naze jugyou kenkyuu ka. [Now, why lesson study?] Tokyo: Toyokan.
Larson, R., Boswell, L., Kanold, T. D., & Stiff, L. (2001) California Middle School Mathematics Concepts and Skills Course 1 and Course 2. McDougal Littell Inc.
Lesson Study Research Group. (2004a). [LSRG maintains a central database of U.S. lesson study groups]. Teacher’s College, Columbia University. Retrieved July, 19, 2004, from http://www.tc.edu/lessonstudy/lsgroups.html
Lesson Study Research Group (2004b) Tools for conducting lesson study. Teacher’s College, Columbia University. Retrieved July, 19, 2004, from http://www.tc.columbia.edu/lessonstudy/tools.html.
Lewis, C., Tsuchida, I., & Coleman S., The Creation of Japanese and U.S. Elementary Science Textbooks: Different Processes, Different Outcomes. In National Standards and School Reform in Japan and the United States, Teachers College, Columbia University. (Chapter 4, pp.46 -66), 2002; Catherine Lewis, What is a Science Text? In Alan Peacock & Ailie Cleghorn’s (Eds.) Missing the meaning: the development and use of print and non-print learning materials. NY: Palgrave-Macmillan, 2004.
Lewis, C. (2002a). Does lesson study have a future in the United States? Nagoya Journal of Education and Human Development 1(1), 1–23.
Lewis, C. (2002b). Lesson study: A handbook of teacher-led instructional change. Research for Better Schools, Philadelphia, PA.
Lewis, C., Perry, R., Hurd, J., & O’Connell, M.P. (in press). Lesson study comes of age in North America. Phi Delta Kappan.
Lewis, C., Perry, R. & Hurd, J. (2004). A deeper look at lesson study. Educational Leadership, 61(5), 18–23.
251

Lewis, C., & Tsuchida, I. (1997). Planned educational change in Japan: The shift to student-centered elementary science. Journal of Education Policy, 12(5), 313–331.
Lewis, C., & Tsuchida, I. (1998). A lesson is like a swiftly flowing river: Research lessons and the improvement of Japanese education. American Educator, 21(3), 12, 14–17, 50–52.
Lewis, C., & Tsuchida, I. (1999). The secret of trapezes: Science research lesson on pendulums [Videotape: 16 min.]. Oakland, CA. Available at http://www.lessonresearch.net/trapeze.html
Lo, J., Watanabe, T., & Cai, J. (2004). Developing ratio concepts: An Asian perspective. Mathematics Teaching in the Middle School, 9(7), 362–367.
Machado, A. (19XX). Proverbios y cantares, XXIX. Retrieved February 26, 2006 from http://www.geocities.com/Athens/Delphi/5205/Proverbios_y_cantares.html
Mills College Lesson Study Group. (2005). How many seats? [Video: 30 min.] Oakland, CA: Mills College Lesson Study Group.
Mills College Lesson Study Group. (2003a). To open a cube. [Video: 49 min.] Oakland, CA: Mills College Lesson Study Group.
Mills College Lesson Study Group. (2003b). Can you find the area? [Video: 47 min.] Oakland, CA: Mills College Lesson Study Group.
Mills College Lesson Study Group. (2000). Can you lift 100 kilograms? [Video: 18 min.] Oakland, CA: Mills College Lesson Study Group. Also viewable at lessonresearch.net
Mills College Lesson Study Group. (1999a). The secret of trapezes [Video: 16 min.] Oakland, CA: Mills College Lesson Study Group.
Mills College Lesson Study Group. (1999b). The secret of magnets [Video: 16 min.] Oakland, CA: Mills College Lesson Study Group.
Murata, A. (2005). How do teachers learn during lesson study? Connecting standards, teaching, and student learning. Paper under review.
National Research Council. (2002). Studying classroom teaching as a medium for professional development. Proceedings of a U.S–Japan workshop. H. Bass, Z. P. Usiskin, & G. Burrill (Eds.). Mathematical Sciences Education Board Division of Behavioral and Social Sciences and Education U.S. National Commission on Mathematics Instruction International Organizations Board. Washington, DC: National Academy Press.
North Central Regional Educational Laboratory. (2002). Teacher to teacher: Reshaping instruction through lesson study. Naperville, IL: Author.
Richardson, J. (2004). Lesson study: Teachers learn how to improve instruction. In Tools for schools (pp. 1–3). National Staff Development Council.
Spillane, J. P. (2000). Cognition and policy implementation: District policymakers and the reform of mathematics education. Cognition and Instruction, 19(2), 141–179.
Stepanek, J. (2001). A new view of professional development. Northwest Teacher, 2(2), 2–5. Stepanek, J. (2003). A lesson study team steps into the spotlight. Northwest Teacher, 4(3), 9–11. Stigler, J. W., & Stevenson, H. (1991). Polishing the stone: How Asian teachers polish lessons to
perfection. American Educator, 14(4), 12, 14–20, 43–47. Stigler, J. W., & Hiebert, J. (1999). The teaching gap: Best ideas from the world's teachers for
improving education in the classroom. New York: Summit Books. Takahashi, A., Watanabe, T. & Yoshida, M., & Wang-Iverson, P. (2005). Improving content and
pedagogical knowledge through kyozaikenkyu. In P.Wang-Iverson & M. Yoshida (Eds.), Building our knowledge of lesson study (pp. ). Philadelphia: Research for Better Schools.
252
Tam, P. S. (2004, March 6). Implementation of English activities in Japanese elementary schools: Implications for global citizenship. Paper presented at the 56th annual meetings of the Association of Asian Studies, San Diego.
Teaching American History. (2005). What is lesson study? Retrieved January 1, 2006, from http://www.teachingamericanhistory.us/lesson_study/index.html
Tsuneyoshi, R. (2001). The Japanese model of schooling: Comparisons with the United States. New York: RoutledgeFalmer.
Tsuneyoshi, R. (2004, March 6). A Japanese vision of 21st century abilities: The integrated period, basics, and the new reforms. Paper presented at the 56th annual meetings of the Association of Asian Studies, San Diego.
University of Wisconsin-LaCrosse. (2005). Lesson study project. Retrieved January 1, 2006, from http://www.uwlax.edu/sotl/lsp/
Wang-Iverson, P. & Yoshida, M. (2005). Building our understanding of lesson study. Philadelphia: Research for Better Schools.
Watanabe, T. (2002). Learning from Japanese lesson study. Educational Leadership, 59(6) 36–39.
Wilms, W. W. (2003). Altering the structure and culture of American public schools. Phi Delta Kappan, 84(8), 606–613.
Yoshida, M. (1999). Lesson study: A case study of a Japanese approach to improving instruction through school-based teacher development. Unpublished doctoral dissertation, University of Chicago: IL.
253

LESSON STUDY U.S.–JAPAN PANEL DISCUSSION1
Makoto Yoshida, Global Education Resources Jane Gorman, Education Development Center
Yoshinori Shimizu, University of Tsukuba Patsy Wang-Iverson, Gabriella and Paul Rosenbaum Foundation
Takashi Nakamura, Yamanashi Universitiy Catherine Lewis, Mills College
Moderator: Akihiko Takahashi, DePaul University
ABSTRACT
This panel focused on identifying ways of conducting lesson study effectively. The panelists are people who have experienced lesson study in the United States and Japan. Included is a brief presentation by each panelist, followed by a question-and-answer period. MAKOTO YOSHIDA The year 2000 marks the beginning of lesson study in the United States. In 1998 and 1999, documents that described lesson study were published in the United States, including Catherine Lewis’s article “A Lesson is Like a Swiftly Flowing River” (Lewis and Tsuchida, 1998) and The Teaching Gap (Stigler and Hiebert, 1999). But I think that the year 2000 is truly the year that lesson study began in U.S. schools. Now lesson study is being used in Paterson, New Jersey (January 2005), Ottawa, Canada (December 2004), and many other places in North America. As Catherine Lewis mentioned, there are over 20 sites actively engaging in lesson study. So there are lots of things happening, and lesson study is widespread.
1 Presented at Improving Mathematics Teaching and Learning Through Lesson Study, May 20-21, 2005, Chicago.
254

One thing that we need to be thinking about is how we can, together, create a lesson study community—a professional learning community. Lesson study has started, but it has been implemented in a very isolated manner. Part of the reason for this conference is that we want to help people engaged in lesson study to come together.
255

Lesson Study Community as a Professional Learning Community
We can think of the first five years beginning in 2000 as a time when people started to learn how to do lesson study. But now—in 2005—we need to improve. One way is to create a lesson study community. How can we bring people together, so that they can influence each other to learn more about lesson study, as well as to do things better? Ineffective Post-Lesson Discussions: Observations and Possible Causes My suggestions for improving lesson study come from observations that Akihiko Takahashi and I have made about post–research-lesson discussions. Some ineffective discussions start and end with “the lesson went well.” Sometimes observers only report what they saw, and there is no further discussion. Sometimes the lesson-planning group is not open to participants’ questions and suggestions, or makes excuses for what occurred in the lesson. We also need to think about what causes ineffective post-lesson discussions. Sometimes it seems that participants forget that the purpose of the post-lesson discussion is to provide an opportunity for learning. The lesson is not done to display a final product or to showcase a “good lesson.” Ingredients for Effective Post–Research-Lesson Discussions Here are some important ingredients for an effective post-lesson discussion. Planning the research lesson is a very important part of doing lesson study more effectively. This involves identifying a research question and the investigation of instructional materials
256

(kyozaikenkyu). The people involved are also important. These include the moderator of the discussion, the advisor for the planning group (who is also the final commentator in the discussion), and the participants—the observers and the planning group. As speakers at this conference have already mentioned, the moderator or advisor has a much bigger role than one might imagine. These are not roles that can be randomly assigned. This discussion of ingredients for an effective discussion is just a beginning. Our observations suggest that there are many issues about which we need to learn in the next five or ten years. Important Ingredients for Preparing a Lesson We consider the following to be important ingredients for preparing a lesson: • subject matter knowledge (Shulman, 1986) • pedagogical content knowledge (Shulman, 1986) • knowledge about student thinking and learning • clear goals and expected outcomes. Studying instructional materials intensively is also important, but what does this really mean? Is it enough to study and understand how to solve problems in the textbook? Is it enough to study and understand the suggestions in the teacher’s manual in order to implement a lesson in a classroom? Akihiko Takahashi, Tad Watanabe, and I often observe that sometimes teachers search for new lessons on the Internet and try to use those lessons without really thinking about whether the lessons fit in the context of their own units and their own curriculum sequence. That is an area where we hope to improve. Japanese teachers think that this area—kyozaikenkyu, the study of instructional materials—is a very important part of lesson study. It involves studying the content, and its scope and sequence. It also involves studying how students learn that content, their processes of thinking about it and understanding or misunderstanding it. Teachers also need to establish clearly what are the goals of the lesson and its outcomes for students. This informs their development of instruction, instructional materials, learning activities, and manipulatives in order to help students. Japanese teachers often say that teachers can only provide as rich of a learning experience for their students as is their own level of understanding of the instructional materials. For this reason, it is important for teachers to carry out kyozaikenkyu every day through classroom practice. I find this perspective very interesting, because when I was conducting research on lesson study in Japan, I asked Japanese teachers, “Are you engaged in lesson study?” Many teachers said, “Yes we are engaged in lesson study.” Then I asked a second question, “Are you engaged in kyozaikenkyu?” Many teachers hesitated, then said, “I don’t think we are engaged in kyozaikenkyu.” So while they may be doing lesson study, they may not be doing kyozaikenkyu. This suggests that there are many issues we need to learn about in the United States—and also that through our interactions with them, Japanese teachers may gain insight and perhaps improve their own lesson study.
257

JANE GORMAN I thought a little bit about how we might talk about effectiveness—and was immediately engulfed in a depression of sorts, because I realized how complex lesson study is and how that would affect my trying to talk about effectiveness with just a quick set of examples. Teachers and teams engaged in lesson study start at different places along many different spectra: collaborative skills, kinds of mathematical knowledge—I could list several of these. This suggests to me that if you’re thinking about effectiveness, you need to consider how teachers or a team had moved along all those spectra. Because there are so many dimensions to consider, it is really hard to think about overall effectiveness. Is effectiveness about moving forward? Is it about achieving certain points along these spectra? Lesson study also has a lot of features—for example, whether the conversation includes a lot of talk about mathematics, what the focus of the team is, and what kind of work they’re interested in doing. And lesson study has phases—are the teachers doing an effective job of observing lessons or of studying materials beforehand? So, as you can see, there’s a lot to think about in terms of what effectiveness means for lesson study. My conclusion is that effectiveness requires being clear about your own teaching goals and your team goals. Every team is unique with respect to all of the characteristics that I mentioned. There may not be one measure that will easily describe effectiveness for everyone. Yet in our work with teams, we tried to articulate elements that contribute to a strong practice, and to encourage teams to reflect on their work regularly. A novice team in their first cycle may not take the time or have the skill to study various textbook approaches, or may not focus their observation on students’ mathematical thinking. Even so, they may learn a great deal from that first cycle about teaching. But if they reflect on their learning and consider some of these elements of strong practice, they can gradually decide on ways to improve. This brings me to the other thing that I wanted to say. Many of us, including teachers who are interested in beginning lesson study or learning more about it, try to load up with as much helpful information as we can get. This reminds me of the first time I went backpacking and I loaded up my pack. It was so heavy that I could barely move. I had everything I could possibly need. Halfway up the first mountain I got rid of most of it. My experience with lesson study is that doing it is the best way to learn about it, and that starting with an almost empty backpack is probably the best strategy. Fill it with some inspiration, which is very light, and maybe a map of the mountain. Make some kind of start and be prepared, if your pack is empty, to add in all that stuff that you will encounter along the way. That seems to me to be a good way to think as a beginner, or as an intermediate, or as anyone who’s just on this path. It’s also a lot more fun to start out this way. If you can get a picture of what going on a hike is about or what the path might look like, then you can begin. This may be one reason why the role of knowledgeable other is so integral to lesson study.
258

YOSHINORI SHIMIZU Takahashi: One of the fascinating things that Japanese professors in mathematics education do is make frequent visits to classrooms to observe lessons. This is a form of professional development for professors. Schools invite professors as outside experts or commentators. If a school really appreciates that professor, then the professor is invited again. As a result, some professors are very busy, which is the case for Professors Nakamura and Shimizu. From them, we can learn a lot about what is going on in Japanese classrooms and in Japanese lesson study. Shimizu: In my case, I just visited a school on Tuesday, May 10—ten days ago. It was an elementary school in Tokyo, which is a ten-minute trip by train and fifteen minutes by foot. I would like to share a story from that visit. Just an aside: I have been feeling that the more I hear from you (and also based on what I learned from Catherine Lewis’ talk), the clearer becomes my image of lesson study at home and lesson study in general. When I visited the elementary school in Tokyo, a research lesson was being taught by a second-grade teacher who had only three years of teaching experience. But that inexperienced teacher was not alone. There were two other second-grade teachers with her. The three teachers were working together, and they had already tried the research lesson in another class. One of the other teachers had more than ten years of teaching experience. Teachers in Japan have to move from one grade to another, sometimes moving up with their whole class. If I am a teacher, then maybe this year I teach third grade, next year, fourth grade, the following year, fifth grade, and so on until I eventually I return to the first grade. By teaching at different grade levels, teachers gain knowledge of the sequence of the curriculum. The experienced teacher involved with the research lesson was very nervous, because she was supposed to help the novice teacher who was going to teach the lesson. In the principal’s room, the experienced teacher said, “I couldn’t sleep.” Although she was not teaching the research lesson, she was still nervous because she was an integral part of the research lesson. The teacher who taught the research lesson handed out a lesson plan. In that lesson plan, I noticed that some sentences were similar to some in the teacher’s manual. So again, we see how the system supports teachers. Those teachers were not working from scratch. They stood on the shoulders of colleagues, and the support system provided by the teacher’s manual, and the system of research lessons. I like the overhead that Catherine Lewis showed us that illustrates differences in focus between the United States and Japan. I have just realized that the story I experienced ten days ago is an example of the support system that she mentioned.
259
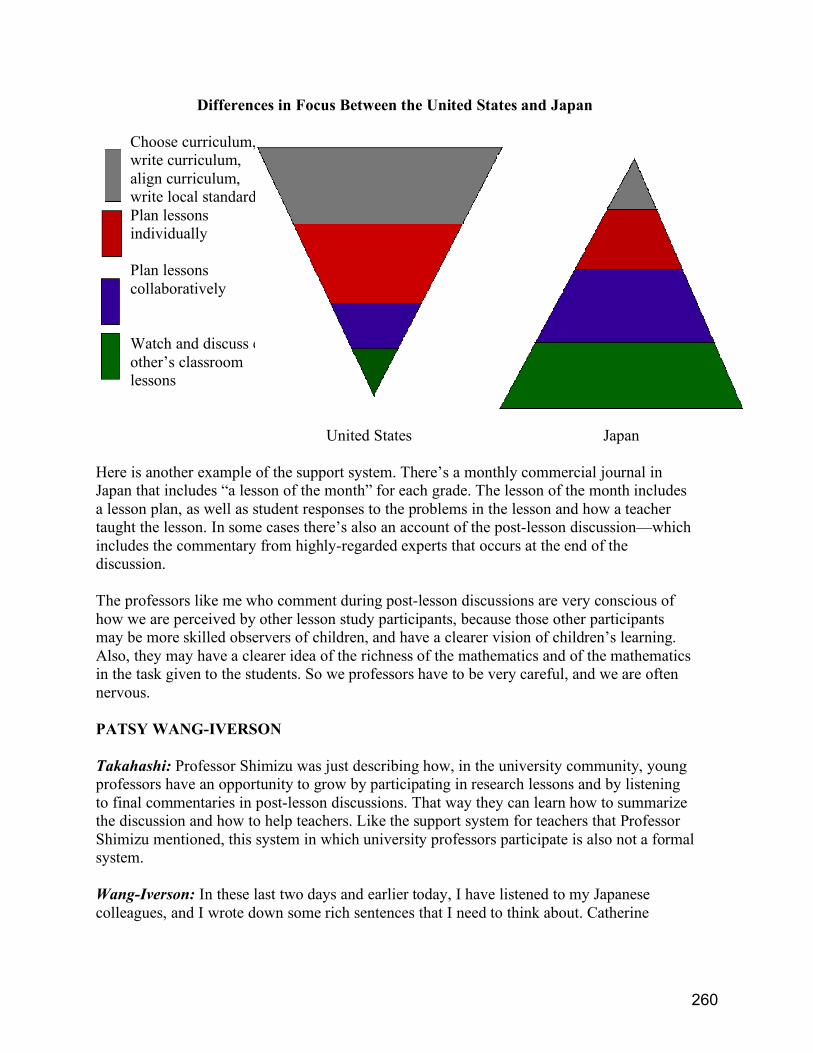
Differences in Focus Between the United States and Japan
Choose curriculum, write curriculum, align curriculum, write local standards
Plan lessons individually
Plan lessons collaboratively
Watch and discuss each other’s classroom lessons
United States Japan Here is another example of the support system. There’s a monthly commercial journal in Japan that includes “a lesson of the month” for each grade. The lesson of the month includes a lesson plan, as well as student responses to the problems in the lesson and how a teacher taught the lesson. In some cases there’s also an account of the post-lesson discussion—which includes the commentary from highly-regarded experts that occurs at the end of the discussion. The professors like me who comment during post-lesson discussions are very conscious of how we are perceived by other lesson study participants, because those other participants may be more skilled observers of children, and have a clearer vision of children’s learning. Also, they may have a clearer idea of the richness of the mathematics and of the mathematics in the task given to the students. So we professors have to be very careful, and we are often nervous. PATSY WANG-IVERSON Takahashi: Professor Shimizu was just describing how, in the university community, young professors have an opportunity to grow by participating in research lessons and by listening to final commentaries in post-lesson discussions. That way they can learn how to summarize the discussion and how to help teachers. Like the support system for teachers that Professor Shimizu mentioned, this system in which university professors participate is also not a formal system. Wang-Iverson: In these last two days and earlier today, I have listened to my Japanese colleagues, and I wrote down some rich sentences that I need to think about. Catherine
260
Lewis’ presentation ended with, “We don’t know what all the guiding principles are.” So, I don’t know what is the key to conducting lesson study effectively. I think all of us collectively are stumbling along together. If we hold hands, I think we can keep each other from falling. However, I should share a story: I was walking with my 91-year-old mother. She stumbled and fell—and I fell on top of her. So, perhaps, if we fall, we can cushion each other. This situation reminds me of something Tad Watanabe said. A colleague of mine wanted to create a logic model for lesson study. Tad was very uncomfortable with this idea. I didn’t understand what Tad meant until I read David Hawkins’s book, The Informed Vision, which is a collection of essays from almost 40 years ago. In the book, Hawkins writes about being told, “We want you to tell us what the learning objectives are.” I’m sure that’s a very familiar experience for many of you. What are the learning objectives? If we were designing a building, we should have a plan and we should make sure the plan gives us a finished product—but this approach may not be appropriate for thinking about lesson study. Another approach is described by a word I learned by reading one of Hawkins’s essays. The word is “eolithic.” Hawkins said that eolithic really is derived from ideas about the Stone Age. Someone finds a rock and sees its potential, then modifies the rock. The rock becomes an arrowhead. That’s how we make progress. I feel this helps to describe what lesson study is—that we learn from each other. For example, from reading those quotes that Catherine Lewis shared, one that struck me in particular was, “We feel there is a great value in a public lesson. It is an opportunity to put our work out for public scrutiny.” That’s quite an evolution from the attitude that we are going to offer you a demonstration lesson. Another conference participant said that we need to change our teaching practices, which may require changing our beliefs about teaching and learning. Even though we’re traveling together, changing our beliefs is something very personal. TAKASHI NAKAMURA Takahashi: The next speaker, Professor Nakamura, is a former colleague of mine. We worked together at the same school and in the same math department for ten years. Then he went to Yamanashi University, and I ended up in Chicago. So before I came to the United States we saw each other every day. He’s one of the busiest professors I know. He commented on 64 research lessons last year. Nakamura: I was an elementary school teacher for 21 years, until 1998. I participated in research lessons about 40 times during my time as an elementary school teacher. Since I don’t speak English well, I will speak in Japanese, and Akihiko Takahashi will translate. A research lesson is only one lesson. However, in doing research lessons we are not thinking about only one lesson. We need to think about the entire unit and how it’s related to other grade levels. That is very important.
261

I will illustrate the kind of investigation that needs to be done during lesson planning by using the new English translation of a Japanese textbook: Japanese Elementary School Mathematics Textbook: Sample of Units on Geometry and Area. The task on page 86 is about estimating the area of one quarter of a circle. It occurs in 5B, the second half of grade 5. The textbook page shows a grid on a circle and students are asked to estimate the area of a quarter-circle. One question to investigate during lesson planning is: Will students figure out how to use the grid to estimate the area, or will the teacher need to tell students how to use the grid to estimate the area?
Mathematics for Elementary School 5B, p.86 Sugiyama, Y. and Hironaka, H. (Eds.) (2005)
The answer is that students can use the grid to estimate the area without being taught the method by the teacher. The reason is that students already have used grid paper to find an area. A task in the first part of grade 5 asks students to estimate the area of a leaf-shape using two methods, both involving a grid. For both methods, the textbook shows how symmetry can be used to estimate the area of the leaf. In the first method, the leaf-shape is approximated as an isosceles triangle, then the area of half of the triangle is calculated and multiplied by 2. (Students have learned to find the area of a triangle using base and height
262

earlier in 5A.) For the second method, students count the number of grid squares that lie entirely within the leaf, and the number of grid squares that are not completely within the leaf. Because of the symmetry of the leaf shape and because its axis of symmetry lies on a grid line, symmetry can be also be used in this method. Students need only count the number of grid squares that lie above the axis of symmetry, then multiply that number by 2.
Mathematics for Elementary School 5A, p.83 Sugiyama, Y. and Hironaka, H. (Eds.) (2005)
A similar idea occurs in the second half of grade 4. Students are asked not just to find the number of squares in a shape composed of entire squares, but to find areas of shapes that are made of two half-squares. In part 1, the half-squares are made by splitting squares in half horizontally. In part 2, the half-squares are made by splitting two squares along diagonals.
263

Mathematics for Elementary School 4B, p.25 Sugiyama, Y. and Hironaka, H. (Eds.) (2005)
The ideas involved in estimating the area of a circle using the grid are introduced and carefully laid out in grade 4; then the idea is extended a bit in grade 5. That’s why students in 5B can estimate the area of a quarter-circle by using this idea. After that, students estimate the area of a circle by using grid paper. Then the textbook describes how to estimate the area of a circle by cutting the circle and rearranging it as a shape that is a close to a rectangle.
Mathematics for Elementary School 5B, p.88 Sugiyama, Y. and Hironaka, H. (Eds.) (2005)
264

In grade 5, students have already experienced the idea of decomposing and rearranging a shape in the context of changing a parallelogram into a rectangle in order to find its area. They are reminded of this idea on the previous page:
Mathematics for Elementary School 5B, p.87 Sugiyama, Y. and Hironaka, H. (Eds.) (2005)
Later in grade 5, a related idea occurs in the description of how to change a circular area into a triangular area.
Mathematics for Elementary School 5B, p.91 Sugiyama, Y. and Hironaka, H. (Eds.) (2005).
265

That is why Japanese teachers start kyozaikenkyu—investigating teaching materials—by looking at how the topic of the research lesson is related to students’ previous experiences, and how it will be extended later by investigating textbooks and sometimes comparing textbooks. Of course in lesson study, teachers are concerned only with one lesson, but the topic of that lesson is always related to other topics that occur at other times and other grade levels, and teachers need to investigate how those topics are related. QUESTION-AND-ANSWER PERIOD
Question: My school sent me with a mission: to ask for suggestions of how to make lesson planning work for teachers that have never planned collaboratively.
Takahashi: I’ll start with my experience. In visiting various places, I noticed that what is most challenging for U.S. teachers with lesson study is beginning lesson study by planning the lesson. In Japan it’s different, because there are a lot of opportunities to visit other research lessons. So teachers can participate by observing a lesson and participating in the post-lesson discussion. After experiencing research lessons conducted by others several times, a Japanese teacher says, “Well, I may want to develop a lesson with my colleagues.” Then they start. When they start planning the lesson, they have an idea of what kind of discussion follows the research lesson and what kind of lesson they might plan. They already have a picture. Now they can start. But it’s still very hard. But in the United States teachers don’t have these opportunities, so we probably need to jump into planning lessons. However, we do not know what kind of lesson we might plan, and we do not know what kind of discussion follows the observation. That is very challenging. Lewis: I think that it’s really important to begin by asking the question, “What’s a concept that students are really struggling with?” in order to identify something that’s really important to the teachers planning the lesson—an area in which they don’t feel satisfied with their own teaching. Often Japanese elementary-based lesson study also begins with the question: What are the qualities we want students to have five or ten years down the road? What are all the qualities that they should have for us to feel we succeeded as educators? Then look at the best available curriculum materials and try and think about your long-term goals and the concepts that you’re persistently struggling with. What are the best available materials and compare those. Think about why does this material approach the concept in this way? I really agree that starting from scratch is not a good thing to do. I also recommend thinking about how you want to work together. It sounds trivial but I think it’s not. I suggest beginning by talking about “How do we want to work together?” Begin by remembering the group experiences you’ve had that have been wonderful—really motivating and effective, and the group experiences that haven’t been so great. Use those to generate a set of norms for group interaction. I think it’s not a trivial thing to have a group working together in a way that’s challenging and supportive.
266

In the “How Many Seats?” video there’s a segment where the Mills Lesson Study Group teachers talk about the norms they want to have in their group work. One of these norms they call “sticking to the process.” At the end of every meeting, they choose a norm to reflect on. Based on their reflections, they change things about the way the group operates. Shimizu: I just wanted to add a view from the Japanese side. In Japan, the teachers have a teachers’ room, so the teachers get to see each other every day. In this way the physical environment helps us. Also, student teachers start lesson study before they become professional teachers. I did myself. So a student teacher is instructed to think about “How can I collaborate with other student-teachers?” Takahashi: I agree with Catherine Lewis that it’s helpful to start with sharing what is the most difficult topic for your students or what is the most difficult topic for teachers to teach. About four years ago, the Chicago Lesson Study Group started with a conversation about what is a challenging area for our students. We decided to investigate measurement because teachers felt it was a very difficult subject to teach and also because students struggled with it. Yoshida: What I would like to recommend is don’t isolate yourself. Do not try to do lesson study on your own without anyone who knows about it. Maybe send some members of your group somewhere to learn about it. Invite other practitioners and then learn by working together. I think that’s a very important part of starting lesson study.
Question: This morning Zalman Usiskin mentioned that Japanese high school teachers were not doing lesson study the way it was typically done because the Japanese teaching culture at that level did not lend itself to it. So what is it about the culture at the middle school and high school levels that does not lend itself to lesson study, whereas at the elementary school level it does
Takahashi: The question was why there is not much lesson study going on in middle and high school in Japan and how the culture of middle and high school is different from that of elementary school. Shimizu: One thing I noticed is that teachers at the secondary level specialize, but the teachers at the elementary level teach everything. The higher the grade level, the more isolated teachers tend to be. But this is not the full explanation. I think our Japanese colleague has a different opinion. Yasuhiro Sekiguchi: Generally speaking, elementary school teachers do lesson study most frequently and junior high school (grades 6–9) teachers do it less frequently. High school (grades 10–12) teachers do lesson study least frequently. Most public junior high school teachers do lesson study every year, but high school teachers—the people in education say high school teachers are not willing to do research lessons—are more interested in the mathematics itself. Elementary school teachers and junior high school teachers are very interested in teaching methods and how to teach.
267

Usiskin: My understanding of the culture is that one of the reasons for lesson study is to increase your knowledge of the subject that you are teaching. It is a vehicle for getting teachers to look at what they are teaching in more depth. As you go up the grades the teachers feel less need to know more about what they’re teaching because they’re specialists and they feel they know it all. I think the interesting thing is what’s been the situation in the United States where we have tried lesson study in the higher grades. Do we have the same phenomenon here? Audience member: I’m from Stevenson High School. The first week that I was teaching, we started a lesson study. Stevenson High School now does about three or four a year. We’ve found that they’re very successful for the reasons that you said. We’re still learning the math—and we tell our students this occasionally. We are still learning alternative ways to solve the mathematics problems so we do it and find that it’s very successful. —As you saw with the lessons that we did yesterday, it really gets us to think about alternative methods for doing the math and that there are other ways to solve a problem. Teachers by themselves don’t necessarily think about those. But when you have six or seven teachers together you start to think about alternative methods. Once you actually do lesson study you find there’re even more ways, as in the quote Catherine mentioned earlier: “There are many ways to solve problems correctly—and even more ways to solve them incorrectly.” Takahashi: Here is my opinion about why you do not see lesson study in the high school setting in Japan. Until recently, Japanese high school teachers had one day off during the week to do their in-service. For their in-service day, they don’t have to come to school. They need to do the improvement by themselves. Their professional development is an individual responsibility—not a cooperative one. One effect of this might be that high school teachers do not do lesson study. Gorman: I’ve been working mostly with high school teachers, and I’d say that the fact that they know a lot of mathematics and enjoy doing it has been a real plus. They love thinking about it and thinking about how it works and how that plays into the lessons. One teacher made a comment that I thought was significant in this regard. He said that as the teachers have become more advanced in their own knowledge of mathematics, they have often forgotten completely how it is to first learn it. Lesson study was a vehicle through which they could, in a sense, let go of some of their expertise and recapture the learner’s state. REFERENCES
Hawkins, D. (2002). The informed vision: Essays on learning and human nature. New York:
Agathon Press. Lewis, C., and Tsuchida, I. (1998). A lesson is like a swiftly flowing river: Research lessons
and the improvement of Japanese education. American Educator, 21(3), 12, 14–17, 50–52. Mills College Lesson Study Group. (2005). How many seats? [Video: 30 min.] Oakland, CA:
Mills College Lesson Study Group. Available at: http://www.lessonresearch.net/howmanyseats.html
268

Shulman, L. (1986). Those who understand: Knowledge growth in teaching. Educational Researcher, 15, 4–14.
Stigler, J. W., and Hiebert, J. (1999). The teaching gap: Best ideas from the world’s teachers for improving education in the classroom. New York: Summit Books.
Sugiyama, Y. and Hironaka, H. (Eds.) (2005). Japanese elementary school mathematics textbook: Sample of units on geometry and area (M. Yoshida, A. Takahashi, and T. Watanabe, Trans.). Madison, NJ: Global Education Resources. (Original work published 2000).
269