Embed Size (px)
Citation preview

Learning a Manifold as an Atlas∗
Nikolaos Pitelis Chris RussellSchool of EECS, Queen Mary, University of London
[nikolaos.pitelis,chrisr,lourdes]@eecs.qmul.ac.uk
Lourdes Agapito
Abstract
In this work, we return to the underlying mathematicaldefinition of a manifold and directly characterise learning amanifold as finding an atlas, or a set of overlapping charts,that accurately describe local structure. We formulate theproblem of learning the manifold as an optimisation thatsimultaneously refines the continuous parameters definingthe charts, and the discrete assignment of points to charts.
In contrast to existing methods, this direct formulationof a manifold does not require “unwrapping” the mani-fold into a lower dimensional space and allows us to learnclosed manifolds of interest to vision, such as those corre-sponding to gait cycles or camera pose. We report state-of-the-art results for manifold based nearest neighbour clas-sification on vision datasets, and show how the same tech-niques can be applied to the 3D reconstruction of humanmotion from a single image.
1. IntroductionOne of the greatest challenges in computer vision lies in
learning from high-dimensional data. In high-dimensional
spaces, our day-to-day intuitions about distances are vio-
lated, and nearest neighbour (NN) and RBF based classi-
fiers are less predictive and more easily swamped by noise.
Manifold learning techniques attempt to avoid these diffi-
culties by learning low dimensional representations of the
data which preserve relevant information.
The majority of manifold learning techniques can be
characterised as variants of kernel-PCA [9] that learn a
smooth mapping from a high dimensional embedding space
Rn into a low-dimensional space R
d while preserving prop-
erties of a local neighbourhood graph. ISOMAP [20] pre-
serves global path distances; Locally Linear Embedding
(LLE) [18] preserves the linear approximation of points by
their nearest neighbours; Laplacian Eigenmaps [1] and Hes-
sian LLE [5] preserve local Laplacian and Hessian deriva-
tives of this graph respectively; while Local Tangent Space
∗This research was funded by the European Research Council under
the ERC Starting Grant agreement 204871-HUMANIS
Alignment (LTSA) [26] and Weighted LTSA (wLTSA) [25]
preserve directions of greatest variance in each neighbour-
hood.
These methods rely on unwrapping the manifold into a
single chart isomorphic to Rd to characterise it. As such,
they have difficulty learning closed manifolds such as the
surface of a ball or a Klein bottle. This is a fundamental
limitation in computer vision where many of the manifolds
of interest are closed or contain closed components. Views
of an object under 360◦ rotation of camera or lighting form
a closed manifold; while the space of 3 × 3 image patches
form a closed manifold similar to that of a Klein bottle [12],
and in action recognition or 3D reconstruction, any repeti-
tive action such as walking or running forms closed cycles.
In practice, existing manifold learning techniques can be
adapted to handle closed cycles. For example, a one di-
mensional manifold of a gait cycle can be embedded in
a two-dimensional space, and a larger neighbourhood that
captures local second-order rather than the usual first-orderinformation can be used to prevent the manifold from col-
lapsing. We evaluate these standard approaches for NN
based 3D reconstruction of walking and running, and find
that they perform worse than using the original space.
The presence of noise causes further difficulties, as
points now lie near, but not on the manifold we wish to
recover. The local neighbourhood graph produced by knearest neighbours (k-NN) is extremely vulnerable to the
presence of noise, and the properties of the neighbourhood
graph which are preserved by the embedding do not cor-
respond to the underlying manifold. Here, many existing
manifold learning methods fail severely and collapse into
degenerate structures in the presence of noise (see Fig. 2).
In response to these difficulties, we present a novel for-
mulation for manifold learning, which we refer to as learn-
ing an atlas. As is common in differential geometry, we
characterise the manifold as an atlas, or set of overlapping
charts, each of which is isomorphic to Rd. Unlike exist-
ing machine learning approaches to manifold learning, this
allows us to directly learn closed and partially closed man-
ifolds. This differs from the standard formulations of dif-
ferential geometry, which presuppose direct access to the
2013 IEEE Conference on Computer Vision and Pattern Recognition
1063-6919/13 $26.00 © 2013 Crown Copyright
DOI 10.1109/CVPR.2013.215
1640
2013 IEEE Conference on Computer Vision and Pattern Recognition
1063-6919/13 $26.00 © 2013 Crown Copyright
DOI 10.1109/CVPR.2013.215
1640
2013 IEEE Conference on Computer Vision and Pattern Recognition
1063-6919/13 $26.00 © 2013 Crown Copyright
DOI 10.1109/CVPR.2013.215
1642
(a)
(b)
(c)
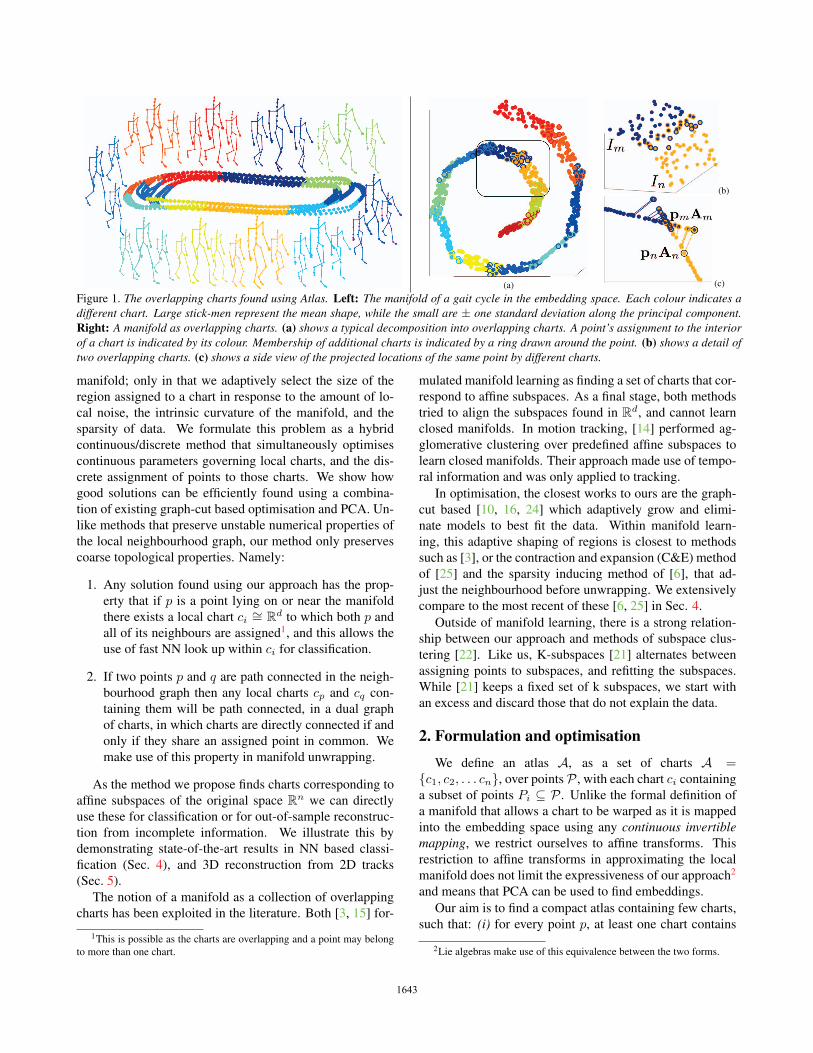
Figure 1. The overlapping charts found using Atlas. Left: The manifold of a gait cycle in the embedding space. Each colour indicates adifferent chart. Large stick-men represent the mean shape, while the small are ± one standard deviation along the principal component.Right: A manifold as overlapping charts. (a) shows a typical decomposition into overlapping charts. A point’s assignment to the interiorof a chart is indicated by its colour. Membership of additional charts is indicated by a ring drawn around the point. (b) shows a detail oftwo overlapping charts. (c) shows a side view of the projected locations of the same point by different charts.
manifold; only in that we adaptively select the size of the
region assigned to a chart in response to the amount of lo-
cal noise, the intrinsic curvature of the manifold, and the
sparsity of data. We formulate this problem as a hybrid
continuous/discrete method that simultaneously optimises
continuous parameters governing local charts, and the dis-
crete assignment of points to those charts. We show how
good solutions can be efficiently found using a combina-
tion of existing graph-cut based optimisation and PCA. Un-
like methods that preserve unstable numerical properties of
the local neighbourhood graph, our method only preserves
coarse topological properties. Namely:
1. Any solution found using our approach has the prop-
erty that if p is a point lying on or near the manifold
there exists a local chart ci ∼= Rd to which both p and
all of its neighbours are assigned1, and this allows the
use of fast NN look up within ci for classification.
2. If two points p and q are path connected in the neigh-
bourhood graph then any local charts cp and cq con-
taining them will be path connected, in a dual graph
of charts, in which charts are directly connected if and
only if they share an assigned point in common. We
make use of this property in manifold unwrapping.
As the method we propose finds charts corresponding to
affine subspaces of the original space Rn we can directly
use these for classification or for out-of-sample reconstruc-
tion from incomplete information. We illustrate this by
demonstrating state-of-the-art results in NN based classi-
fication (Sec. 4), and 3D reconstruction from 2D tracks
(Sec. 5).
The notion of a manifold as a collection of overlapping
charts has been exploited in the literature. Both [3, 15] for-
1This is possible as the charts are overlapping and a point may belong
to more than one chart.
mulated manifold learning as finding a set of charts that cor-
respond to affine subspaces. As a final stage, both methods
tried to align the subspaces found in Rd, and cannot learn
closed manifolds. In motion tracking, [14] performed ag-
glomerative clustering over predefined affine subspaces to
learn closed manifolds. Their approach made use of tempo-
ral information and was only applied to tracking.
In optimisation, the closest works to ours are the graph-
cut based [10, 16, 24] which adaptively grow and elimi-
nate models to best fit the data. Within manifold learn-
ing, this adaptive shaping of regions is closest to methods
such as [3], or the contraction and expansion (C&E) method
of [25] and the sparsity inducing method of [6], that ad-
just the neighbourhood before unwrapping. We extensively
compare to the most recent of these [6, 25] in Sec. 4.
Outside of manifold learning, there is a strong relation-
ship between our approach and methods of subspace clus-
tering [22]. Like us, K-subspaces [21] alternates between
assigning points to subspaces, and refitting the subspaces.
While [21] keeps a fixed set of k subspaces, we start with
an excess and discard those that do not explain the data.
2. Formulation and optimisationWe define an atlas A, as a set of charts A =
{c1, c2, . . . cn}, over points P , with each chart ci containing
a subset of points Pi ⊆ P . Unlike the formal definition of
a manifold that allows a chart to be warped as it is mapped
into the embedding space using any continuous invertiblemapping, we restrict ourselves to affine transforms. This
restriction to affine transforms in approximating the local
manifold does not limit the expressiveness of our approach2
and means that PCA can be used to find embeddings.
Our aim is to find a compact atlas containing few charts,
such that: (i) for every point p, at least one chart contains
2Lie algebras make use of this equivalence between the two forms.
164116411643

both p and a predefined neighbourhood3 Np of points in
its vicinity, and (ii) the reconstruction error associated with
mapping a point from its location in the chart back into the
embedding space is as low as possible.
We decompose the problem of finding the best choice
of atlas into two subproblems: Assigning points to charts
subject to constraint (i), and choosing the affine mappings
to minimise reconstruction error. Given an initial excess of
chart proposals (generated using PCA on random subsets
of the data) we assign points to charts in such a way that
they share points (Sec. 2.1), and alternate between refitting
the subspaces associated with a chart (Sec. 2.2) and point
reassignment.
2.1. Point assignment to overlapping charts
Similar assignment problems have been addressed in the
context of model fitting by the Non-rigid Structure from
Motion community [7, 16, 17] , and we follow [16] in for-
mulating this as an assignment of a set of models (or in our
case charts) to each point, that minimises the accumulated
reprojection error (summed over all points and all assigned
models), and that satisfies constraint (i). We define Ic, the
interior of chart c, as the set of all points whose neighbours
also belong to chart c; and we note that constraint (i) is sat-
isfied if and only if every point lies in the interior of some
chart. We use x = {x1, . . . ,xP }, where xp refers to the set
of charts assigned to point p, and seek an assignment that
minimises:
argminx∈(2A)P
C(x) =∑p∈P
⎛⎝ ∑
c∈xp
Up(c)
⎞⎠ + λMDL(x), (1)
such that each point belongs to a chart’s interior:
∀p ∈ P, ∃c ∈ A : p ∈ Ic, (2)
p ∈ Ic =⇒ ∀q ∈ Np c ∈ xq, (3)
where Up(c) is the reconstruction error of assigning point pto chart c, and
MDL(x) =∑c∈A
Δ(∃p ∈ Ic), (4)
where Δ(·) denotes the Dirac indicator function that takes
value 1 if (·) is true, and 0 otherwise. MDL(x) is a minimumdescription length prior [11] that penalises the total number
of charts used in an assignment.
Despite the large state-space considered ((2A)P rather
than the standard AP ), this can be solved with a variant of
α-expansion that assigns points to the interior of only one
chart [16].
3In practice we take Np to be the k-nearest neighbours of p.
Pairwise regularisation In classification problems and
when faced with relatively dense data, it can be useful to add
additional regularisation terms to encourage larger charts
that cover more of the manifold. Where necessary, we
use the additional pairwise regularisation proposed in [17].
Writing yp for the assignment of point p to the interior of
one chart the regularisation takes the form of the standard
Potts potential:
ψp,q(yp, yq) = θΔ(yp = yq), (5)
defined with constant weight θ > 0 over all edges in the
k-NN graph. We use Atlas to refer to the method using the
cost function of (1), and Atlas+ to refer to the same method
with the additional pairwise regularisation of (5).
2.2. Subspace costs and fitting
We use p to refer to the vector location of point p. We de-
fine the d dimensional subspace associated with chart ci in
terms of its mean μi, and an orthonormal matrix Ci which
describes its principal directions of variance. We set the re-
construction error for point p belonging to chart ci to
Up(ci) = ||p− μi −CTi Ci(p− μi)||22, (6)
i.e. the squared distance between a point and the back-
projection of the closest vector on the chart ci. Given a
set of points Pi assigned to chart ci, the optimal parameters
for minimising the reconstruction error∑
p∈PiUp(ci) can
be computed by setting μi to the mean of Pi, and Ci as the
top d eigenvectors of the covariance matrix of Pi.
In practice, both the subspaces corresponding to charts
and the assignment of points to charts are initially unknown,
so we bootstrap our solution by estimating an excess of
possible subspaces, initialised by performing PCA on ran-
dom samples as described above. Then, we perform a hill
climbing approach that alternates between assigning points
to charts, and refitting the subspaces to minimise the recon-
struction error.
3. Manifold unwrapping for visualisationUnlike existing approaches to manifold learning, our
method has no requirement to unwrap the manifold and af-
ter characterising it as an atlas, as in the previous section,
we can immediately perform classification (Sec. 4), or 3D
reconstruction (Sec. 5). However, one of the principal uses
of manifold learning [18, 20, 26] is in creating a mapping
from a high dimensional space into R2 or R
3 suitable for vi-
sualising data. As a way of illustrating our method’s robust-
ness to sparse data, the presence of noise, and to systematic
holes, we illustrate unwrapping on standard datasets.
Given a partitioning of the data into overlapping charts
isomorphic to Rd, for each affine chart ci we wish to find an
affine mapping Ai from Rd → R
n into the original space in
164216421644

(a) Original data (b) Atlas (c) 27 embedded charts (d) 27 charts unwrapped
(k = 5, λ = 1)
(e) MDS[2] (k = 8) (f) PCA (g) Isomap[20] (k = 5) (h) LLE[18] (k = 8)
(i) Hessian LLE[5] (j) Laplacian Eigenmaps[1] (k) Diffusion Maps[4] (l) LTSA[26]
(k = 8) (k = 5) (σ = 2, α = 1) (k = 8)
(a) Original data (b) Atlas (c) 13 embedded charts (d) 13 charts unwrapped
(k = 5, λ = 0.1)
(e) MDS (k = 8) (f) PCA (g) Isomap (k = 5) (h) LLE (k = 8)
(i) Hessian LLE (j) Laplacian Eigenmaps (k) Diffusion Maps (l) LTSA
(k = 8) (k = 10) (σ = 1, α = 10) (k = 8)
Figure 2. Unwrapping a Manifold Top row: (a) The original data; (b) the unwrapping generated by Atlas; (c) the charts found by Atlas;(d) the charts unwrapped. Other rows: (e-l) Other methods. All methods shown with optimal parameters. Left: Swiss Roll with Gaussiannoise. Right: Sharply peaked Gaussian manifold with no noise. Additional examples in supplementary materials. Discussion in Sec. 3.1.
such a way that a point is projected into the same location
by each subspace that it belongs to; the centres of each sub-
space are far from one another; the affine projection is not
degenerate and distinct points in the subspace do not col-
lapse on top of one another; and the reconstruction is as flat
as possible, with most of the coefficients that do not corre-
spond to a projection into the plane being small.
As neither visualisation nor unwrapping is a primary fo-
cus of the paper, we defer the precise form of the objective
used to the supplementary materials and focus on results.
3.1. Comparison with existing methods
Fig. 2 illustrates the failure of existing methods, with op-
timally tuned parameters, on standard synthetic datasets4.
Although the examples are straightforward for a human to
unwrap –consisting of distinct 2D manifolds, with no self
intersections, and lying in a 3D space– all methods except
ours fail. For the Swiss roll this can be attributed to the
Gaussian noise. As argued, if the points sampled lie not on
the manifold, but near it, many of the properties of the k-
NN graph (such as, in LLE, how points can be expressed as
a weighted average of their neighbours) are unrepresenta-
tive of the underlying manifold and preserving these prop-
erties does not help in finding a good embedding. Our mini-
mal assumption that neighbouring points in the k-NN graph
should belong to the same subspace is robust to the presence
of noise.
The failure of the Gaussian reconstruction is more repre-
sentative of the general problems faced by any unwrapping
method. Here, samples are more sparsely sampled in the
tail of the Gaussian than in the central peak, and choos-
ing a graph that is sufficiently connected in the tail leads to
an over-connected graph about the peak, where the local k-
NN graph characterises the local 3-dimensional structure in-
stead of the 2D manifold. While such local degeneracies are
4Generated using MANI [23].
to be expected occasionally, for all nearest neighbours graph
based methods, the local degeneracy spreads throughout the
manifold and leads to a mapping in which the manifold is
folded over itself. In the classification and reconstruction
problems we discuss next, our method is used without un-
wrapping and such failures can never propagate throughout
the manifold, and local mistakes remain local.
4. Nearest neighbour classificationManifold learning classification is typically done by un-
wrapping the manifold and performing 1-NN on the result.
In our approach, we simply perform nearest-neighbour in
each chart independently. During the manifold learning,
each point p is assigned by α-expansion to the interior of
a single chart, and we assign a label to p simply by per-
forming nearest neighbour in this chart. It is an empirical
question whether we should include all points assigned to
the chart when performing nearest neighbour or just those
that belong to the interior of the chart. On the Yale Faces
dataset, we observed that using only the interior points led
to a small (∼ 0.03%) consistent improvement, and we re-
port all scores for Atlas using only interior points.
We compare against standard approaches LLE [18],
LSTA [26], and PCA, and the recent state-of-the-art ap-
proaches of [6, 25]. We evaluate our approach on face
recognition on the Extended Yale Face Database B [8, 13],
and the classification of handwritten digits on Semeion. In
both cases, following [25], we randomly split the data for
100 folds and report average error.
SMCE [6] is a sparsity based method controlled by a pa-
rameter λ. The solution found provides local neighbour-
hood sizes, and dimensionality d. We report the score asso-
ciated with the best value of λ ∈ [0, 100] that gives a man-
ifold of dimensionality d. As SMCE [6] is intended to be
used as a clustering algorithm, we report both clustering ac-
curacy (SMCE clust), and 1-NN classification (SMCE NN).
164316431645

� �
� ��
�
Figure 3. Left: Atlas based nearest neighbour. Points lie on the manifold (black circle). The manifold is decomposed into a set of charts(coloured straight lines) each of which approximates a local region of the embedding space (coloured curve) as an affine subspace. Interiorpoints are mapped into the charts using the associated projection, and nearest neighbour look up is performed within each chart. Hereyou can see the point marked ‘?’ has a nearest labelled neighbour of ‘1’ in the chart space, rather than ‘2’ in the original space. Centre:Minimal NN classification error(%) on Semeion using the best value of k for each choice of dimensionality. Right: Minimum(Fine),mean(Bold), and mean+standard deviation of NN classification error(%) on Semeion, as k varies. For Atlas the error is also averagedover λ = 10−1, 100, . . . , 103.
Summary Across both datasets we substantially outper-
form wLTSA, LTSA, LLE, and SMCE. This is most no-
ticeable in the Yale Faces dataset where our method Atlas+
obtains 0.70% error versus 3.01%, the best reported error
of [25], which used weighted LTSA with an adaptive neigh-
bourhood, and 1.12% obtained by SMCE. The stability of
our approach is also a substantial advantage; we obtain a
classification accuracy of 0.71 ± 0.01% for dimensionality
5-10 despite fixing to constant values the parameters k, λ,
and θ. On the Semeion dataset, we present a 1% improve-
ment over wLTSA, LLE, and SMCE, again without varying
k or λ. In contrast, all other methods are tuned fully for
each choice of dimensionality.
Extended Yale Face Database B contains 2,432 frontal
face images of 38 individuals under a fixed pose and 64
illumination conditions. We pre-processed the original
192 × 168 images in the same way as [25]. Each image
is resized to 32 × 28 and every pixel is represented as an
8-bit binary vector. Moving around the 8-neighbourhood of
each pixel, vector bits are set to 1 if its neighbouring pix-
els are of lower intensity and 0 otherwise. The vectors are
concatenated to give a 7168-dimensional image vector. In
each of the 100 folds, 16 images of each individual lie in
the training set and 48 in the testing set.
Examination of the data provided by [25] showed a con-
sistent “off by one” error in the image annotation. Images
were provided ordered sequentially by individual, but rather
than the expected 62 images, the first person had only 61
images associated with them, and every 1st image was con-
sistently misclassified as belonging to the previous person.
Visual inspection confirmed the “off by one” error, which
has an approximate 1% impact on the results of [25]. Tables
for uncorrected annotations are in the supplementary mate-
rial, where we still consistently outperform other methods.
Table 1(a) shows 1-NN based face recognition in the
original space and in lower-dimensional spaces of dimen-
sionality 8 through 10 learnt with SMCE [6] while vary-
ing λ, and PCA, Atlas, and Atlas+ keeping their parame-
ters fixed. Also shown are the uncorrected results of LLE,
LTSA, and wLTSA given in [25], which provided state-of-
the-art results using Contraction and Expansion(C&E) [25].
Table 1(b) shows the error of a 1-NN classifier using
corrected image annotations, over [2-7]-dimensional spaces
learnt with PCA, LLE, LTSA, SMCE, Atlas, and Atlas+, all
using the same random splits. The neighbourhood size is
tuned in [2, 20] for LLE and LTSA, while the parameters for
Atlas and Atlas+ are fixed. Atlas outperforms PCA, LLE,
LTSA, and SMCE clust for this range of d, with Atlas+ low-
ering the error further and outperforming all methods on all
but one choices of d. Fig. 4 shows a representative sample
of misclassified and correctly classified images. The major-
ity of the images (∼ 94%) are always classified correctly,
while a small number of completely black images or heav-
ily shadowed ones from specific subjects are consistently
misclassified.
Semeion contains 1593 16 × 16 grey scale images of
handwritten digits (0 to 9) written by approximately 80 peo-
ple5. We follow[25] in extracting a 256-dimensional binary
vector from each image by applying a fixed threshold. In
each split of the data 796 images are assigned to the train-
ing set and 797 to the testing set.
Table 2(a) contains the classification results we produced
using PCA, SMCE, and Atlas, alongside results for LLE,
LTSA, and wLTSA as reported in [25]. As neither the orig-
inal folds, nor the code for wLTSA is available, we ran
versions of LLE and LTSA provided by [23] on our folds,
and confirmed that the performance was approximately the
same. See supplementary materials for numbers.
As the performance of LLE and LTSA depends strongly
on the choice of k (see Fig. 3 centre), we select the best
5available for download from http://archive.ics.uci.edu/ml/
164416441646

Figure 4. Random sample of Yale Faces left: misclassified and right: correctly classified, by Atlas+ for d = 8.
Figure 5. Random sample of Semeion images left: misclassified and right: correctly classified, by Atlas for d = 31.
Table 1. Yale Faces classification error (%) using 1-NN. The classification error of 1-NN in the original space is 4.39, and the lowestclassification error of PCA 1-NN is 4.02 for d = 292. #c is the number of charts found by Atlas(+). For LTSA and LLE, k ∈ [2, 20]. SMCEuses λ ∈ [1, 100] . For Atlas, λ = 700 and k = 4. For Atlas+, λ = 700, k = 2, and the pairwise terms use 5 neighbours with θ = 1000.
(a) LLE(C&E), LTSA(C&E), and wLTSA(C&E) as reported by [25] ver-
sus PCA, SMCE, Atlas, and Atlas+.
PCA LLE LTSA wLTSA SMCE SMCE Atlas Atlas+C&E C&E C&E clust NN
d ε(%) ε(%) ε(%) ε(%) ε(%) λ ε(%) λ ε(%) #c ε(%) #c
8 47.13 5.93 3.88 3.01 25.04 7 3.80 7 1.92 52 0.70 679 45.92 6.85 4.40 3.22 33.92 6 3.60 6 1.95 58 0.71 6910 42.23 6.59 4.18 3.13 47.50 4 3.42 4 1.90 58 0.71 69
(b) PCA, LLE, LTSA, SMCE, Atlas, and Atlas+ results from our experi-
ments for manifold dimensionality 2 to 7.
PCA LLE LTSA SMCE SMCE Atlas Atlas+clust NN
d ε(%) ε(%) k ε(%) k ε(%) λ ε(%) λ ε(%) #c ε(%) #c
2 97.53 3.37 4 8.22 5 11.81 44 1.12 63 1.99 112 0.80 653 97.40 3.17 4 10.51 6 10.90 23 1.28 34 1.97 118 1.92 674 88.18 3.08 4 16.78 9 11.56 21 3.03 21 1.93 129 0.79 695 73.60 2.33 4 10.83 10 11.31 13 4.35 14 1.92 142 0.71 696 62.22 2.51 4 5.92 10 12.38 11 4.73 11 2.16 152 0.71 707 53.63 2.47 4 7.02 13 17.23 9 4.36 9 2.25 160 0.72 72
Table 2. Semeion dataset classification error (%) of 1-NN classifier with PCA, LLE, LTSA, Atlas, and wLTSA. The classification error of1-NN classifier in the original space is 10.92 with 10.90 reported in [25]. #c denotes the number of charts found by Atlas.
(a) Columns 3, 4, and 5 contain the results reported in [25]. The best value of
k ∈ {10, 15, 20, 25} for LLE and k ∈ {35, 40, 45, 50} for LTSA and wLTSA;
For Atlas, λ = 100 and k = 6.
PCA LLE LTSA wLTSA SMCE SMCE Atlasclust NN
d ε(%) ε(%) k ε(%) k ε(%) k ε(%) λ ε(%) λ ε(%) #c
12 11.37 12.47 10 11.89 45 11.09 45 27.58 14 9.26 16 10.85 414 10.28 12.01 15 10.27 40 10.12 40 31.44 8 10.77 8 10.19 416 10.41 11.67 10 10.53 50 9.89 35 28.05 0.89 11.72 0.97 9.88 418 9.63 10.85 10 10.08 50 9.87 40 28.61 0.61 11.40 0.59 9.51 420 9.41 10.23 10 9.93 35 9.85 50 28.64 0.27 11.59 0.32 9.32 4
(b) Semeion dataset classification error (%) of NN classifier with PCA, LLE,
LTSA, and Atlas. The best value of k ∈ [2, 50] for LLE and LTSA. For Atlas,
λ = 100 and k = 6.
PCA LLE LTSA SMCE SMCE Atlasclust NN
d ε(%) ε(%) k ε(%) k ε(%) λ ε(%) λ ε(%) #c
21 9.34 9.80 8 9.56 34 29.17 0.22 11.67 0.2 8.99 423 9.23 9.61 8 9.89 33 35.55 0.05 12.02 0.05 8.90 425 8.97 9.73 9 9.75 39 - - - - 8.64 427 8.77 9.57 8 9.86 40 - - - - 8.61 429 8.74 9.41 16 9.75 42 - - - - 8.48 431 8.66 9.54 8 10.16 43 - - - - 8.27 433 8.67 9.69 16 10.29 44 - - - - 8.50 4
k ∈ [2, 50] and report the lowest error for each choice of
manifold dimensionality d. In contrast, for our method we
fix our parameters to k = 6 and λ = 100 as we vary the
local manifold dimensionality d. Nevertheless, Atlas out-
performs all other methods for almost all choices of d. Ta-
ble 2(b) shows additional results for dim 21-33, where all
methods except SMCE achieve their best performance.
The additional pairwise regularisation of Atlas+ does not
help on this problem, with the best results for Atlas+ oc-
curring as the pairwise regulariser θ → 0, at which point
Atlas+ and Atlas are equivalent. Fig. 3 right shows a graph
of results over a wide range of k. Atlas consistently out-
performs other methods and is robust to a wide choice of
dimensionality.
5. Reconstructing human motion
We apply our method to the task of non-rigid 3D re-
construction of human motion6 using 2D measurements ac-
quired by a camera from a known viewpoint. Having learnt
a manifold on 3D mocap data from one person using Atlas,
we estimate the 3D pose of a new person directly from a test
6CMU Motion Capture Database http://mocap.cs.cmu.edu/
image showing the 2D image locations of the mocap mark-
ers. This is an inverse problem of reconstructing the 3D
pose given 2D input data and knowledge of our piecewise
affine manifold.
Assuming an orthographic camera of known orientation,
both the affine subspaces of the manifold and the back-
projection of points into 3D form hyper-planes. The prob-
lem of 3D reconstruction from 2D image data can then be
posed as out-of-sample reconstruction, or finding the point
lying on any of the affine subspaces that is closest to the
back-projected hyper-plane. This can be done by an ex-
haustive search over the subspaces7, and finding the closest
points on the two hyper-planes, which can be done using
standard linear algebra e.g. [19]. The closest point on the
manifold subspaces is picked as the 3D reconstruction.
This technique cannot be directly applied to standard
manifold learning methods, such as LLE and LTSA, which
do not provide an explicit embedding of the manifold in
the original space. For these methods, we learn the motion
manifold using the 2D joint locations of all training and test
sequences, then reconstruct by finding the nearest neigh-
7This is fast, as typically, less than 10 subspaces are used to characterise
a gait cycle. See Fig. 1.
164516451647

ε2
2D InputNovel-view
Ground Truth21-NN
ReconstructionAtlas
ReconstructionFigure 6. Reconstruction of CMU running sequence with σ = 3cmGaussian noise added to both the image reconstructed and thetraining data. The reconstructions of 21-NN and Atlas have aver-age RMS reconstruction error (ε) of 5cm and 3.74cm respectively.Marker colours are based on squared reconstruction error.
bours in the low-dimensional space and averaging their 3D
coordinates in the original space. In a similar way, we per-
form k-NN reconstruction in the 3D projection of the orig-
inal space. Reconstruction using PCA is done by treating it
as a degenerate case of our method with only one subspace.
For evaluation we selected two subsets of the CMU mo-
cap database; dataset I containing walking sequences and
dataset II containing both walking and running sequences.
Dataset I uses as training set 4 walking sequences of one
subject and as testing set 8 sequences of two different sub-
jects. Dataset II has a training set of 4 walking sequences
of one subject and 4 running sequences of another subject,
testing contains 16 sequences of two different subjects, 4
walking and 4 running from each. The test images are gen-
erated by projecting the 31 mocap markers onto each frame
using an orthographic camera model. The image measure-
ments are registered to the centroid of each image to elim-
inate the translation component. Each walking or running
sequence includes about 4 cycles of motion. The subjects
used for training and testing do not overlap. Gaussian noise
is added to the original 3D data used in training. We add 5
different levels of Gaussian noise with standard deviation σranging from 0.5cm to 5cm.
We show reconstruction results for PCA, k-NN, and At-
las. The error shown in all cases is the root mean squared 3D
reconstruction error (RMS) in cm, averaged over all mark-
ers and frames in the testing set. For our method, we keep
the parameters fixed for each dimensionality across all lev-
els of noise, with λ ∈ {100, 101, . . . , 106} and k ∈ [2, 21].For k-NN we show both the best k per noise level and the
value of k that gives the lowest error averaged for all levels
of noise.
Fig. 7 shows comparative results of the 3D reconstruc-
tion error for PCA, k-NN, and Atlas when the scene is
Figure 7. CMU average RMS reconstruction error for manifolddimensionality 1 to 20. Top row: dataset I walking sequencesand bottom row: dataset II walking and running sequences. Leftcolumn shows 0cm noise case and right column 2cm noise.
viewed from a generic view-point on datasets I (top) and
II (bottom). We show results for varying values of the di-
mensionality d in the noise-less case (left) and the case of
noisy data with σ = 2cm (right). Atlas clearly outperforms
all other methods and, unlike PCA, its performance does
not degrade as the dimensionality increases.
Fig. 6 shows the reconstruction results of a running se-
quence with 3cm Gaussian noise. Table 3 shows more ex-
tensive comparisons: with 6 levels of noise and local dimen-
sionality d ∈ [1, 20]; and two different camera view-points:
a side view and a generic view-point. The same pattern can
be observed of our method outperforming all others.
We observed experimentally that k-NN on the manifold
spaces learnt by LLE and LTSA had consistently poorer per-
formance than k-NN in the original space and their results
are omitted.
6. Conclusion
Starting from the formal definition of a manifold, as an
atlas of overlapping charts, we have presented a novel ap-
proach to manifold learning that directly characterises the
manifold in the original embedding space. In comparison
with existing methods, our method has substantial theoreti-
cal advantages. In particular, unlike existing methods, it can
potentially learn any form of manifold rather than being re-
stricted to manifolds that can be expressed by a single chart.
We show a substantial boost in performance classification
and robustness to the choice of both manifold dimensional-
ity and neighbourhood graph.
Unlike existing approaches, our characterisation of the
manifold directly in the embedding space allows us to re-
cover previously unseen and partially missing data easily,
and we have shown applications in the reconstruction of hu-
164616461648

Table 3. CMU average RMS reconstruction error in cm. Noisestandard deviation in cm.
dataset I walking sequencesside view
noise 0 0.5 1 2 3.5 5
d PCA Atlas PCA Atlas PCA Atlas PCA Atlas PCA Atlas PCA Atlas
1 3.46 2.39 3.46 2.40 3.46 2.43 3.47 2.52 3.48 2.77 3.51 2.995 2.51 1.99 2.51 2.00 2.52 2.09 2.55 2.13 2.64 2.41 2.79 2.6410 1.98 1.87 1.99 1.87 2.00 1.88 2.06 2.03 2.29 2.33 2.69 2.69
15 1.85 1.85 1.86 1.86 1.88 1.86 1.96 1.96 2.31 2.31 2.75 2.75
20 1.68 1.68 1.69 1.69 1.76 1.76 1.90 1.90 2.34 2.37 2.88 2.7921-NN ε 2.47 ε 2.47 ε 2.47 ε 2.47 ε 2.56 ε 2.80
k-NN ε 2.43 k 7 ε 2.43 k 7 ε 2.44 k 8 ε 2.46 k 13 ε 2.56 k 21 ε 2.80 k 21
generic view-pointnoise 0 0.5 1 2 3.5 5
d PCA Atlas PCA Atlas PCA Atlas PCA Atlas PCA Atlas PCA Atlas
1 3.75 2.49 3.75 2.49 3.75 2.50 3.76 2.57 3.76 2.82 3.79 3.055 3.06 2.21 3.06 2.20 3.07 2.25 3.11 2.33 3.13 2.48 3.21 2.7810 3.19 2.12 3.20 2.11 3.18 2.19 3.21 2.26 3.35 2.50 3.40 2.8815 3.42 2.11 3.43 2.08 3.43 2.13 3.34 2.21 3.55 2.49 3.48 2.9520 3.60 2.15 3.60 2.04 3.64 2.10 3.58 2.18 3.61 2.50 3.74 3.0621-NN ε 2.51 ε 2.50 ε 2.50 ε 2.51 ε 2.62 ε 2.89
k-NN ε 2.49 k 9 ε 2.48 k 8 ε 2.48 k 9 ε 2.50 k 14 ε 2.62 k 21 ε 2.89 k 21
dataset II walking and running sequences
side viewnoise 0 0.5 1 2 3.5 5
d PCA Atlas PCA Atlas PCA Atlas PCA Atlas PCA Atlas PCA Atlas
1 5.85 3.14 5.85 3.16 5.85 3.14 5.86 3.33 5.87 3.63 5.87 3.755 3.28 2.43 3.28 2.43 3.29 2.43 3.31 2.52 3.38 2.75 3.49 3.0210 2.60 2.30 2.61 2.34 2.62 2.34 2.66 2.42 2.86 2.67 3.10 2.9615 2.61 2.25 2.61 2.26 2.63 2.29 2.69 2.39 2.91 2.64 3.26 2.9920 2.55 2.44 2.56 2.24 2.58 2.23 2.66 2.39 2.95 2.68 3.39 3.0313-NN ε 3.17 ε 3.17 ε 3.17 ε 3.17 ε 3.29 ε 3.49
k-NN ε 3.12 k 5 ε 3.12 k 5 ε 3.12 k 5 ε 3.15 k 7 ε 3.28 k 18 ε 3.40 k 21
generic view-pointnoise 0 0.5 1 2 3.5 5
d PCA Atlas PCA Atlas PCA Atlas PCA Atlas PCA Atlas PCA Atlas
1 6.08 3.27 6.08 3.31 6.08 3.34 6.09 3.41 6.09 3.70 6.09 3.825 3.86 2.70 3.86 2.69 3.86 2.70 3.88 2.75 3.94 3.01 4.01 3.2010 3.49 2.42 3.49 2.52 3.50 2.62 3.54 2.72 3.68 3.20 3.82 3.4315 3.91 2.29 3.92 2.41 3.97 2.58 3.97 2.77 4.04 3.18 4.28 3.5420 4.23 2.23 4.23 2.37 4.24 2.48 4.27 2.72 4.30 3.18 4.43 3.6715-NN ε 3.27 ε 3.28 ε 3.27 ε 3.27 ε 3.38 ε 3.55
k-NN ε 3.24 k 4 ε 3.24 k 5 ε 3.24 k 6 ε 3.25 k 8 ε 3.38 k 20 ε 3.49 k 21
man motion.
References[1] M. Belkin and P. Niyogi. Laplacian eigenmaps and spectral
techniques for embedding and clustering. Advances in neuralinformation processing systems, 14:585–591, 2001. 1, 4
[2] I. Borg and P. Groenen. Modern multidimensional scaling:Theory and applications. Springer, 2005. 4
[3] M. Brand. Charting a manifold. In Advances in Neural In-formation Processing Systems, pages 961–968, 2003. 2
[4] R. R. Coifman and S. Lafon. Diffusion maps. Applied andComputational Harmonic Analysis, 21(1):5 – 30, 2006. 4
[5] D. Donoho and C. Grimes. Hessian eigenmaps: Lo-
cally linear embedding techniques for high-dimensional
data. Proceedings of the National Academy of Sciences,
100(10):5591–5596, 2003. 1, 4
[6] E. Elhamifar and R. Vidal. Sparse manifold clustering and
embedding. In Advances in Neural Information ProcessingSystems, pages 55–63, 2011. 2, 4, 5
[7] J. Fayad, C. Russell, and L. Agapito. Automated articulated
structure and 3d shape recovery from point correspondences.
In International Conference in Computer Vision, 2011. 3
[8] A. Georghiades, P. Belhumeur, and D. Kriegman. From few
to many: Illumination cone models for face recognition un-
der variable lighting and pose. IEEE Transactions on PatternAnalysis and Machine Intelligence, 23(6):643–660, 2001. 4
[9] J. Ham, D. Lee, S. Mika, and B. Scholkopf. A kernel view
of the dimensionality reduction of manifolds. In Proceed-ings of the twenty-first international conference on Machinelearning, page 47. ACM, 2004. 1
[10] H. Isack and Y. Boykov. Energy-based geometric multi-
model fitting. International Journal of Computer Vision(IJCV), 97(2), 2012. 2
[11] L. Ladicky, C. Russell, P. Kohli, and P. Torr. Graph cut based
inference with co-occurrence statistics. In European Confer-ence on Computer Vision, 2010. 3
[12] A. B. Lee, K. S. Pedersen, and D. Mumford. The nonlinear
statistics of high-contrast patches in natural images. Interna-tional Journal of Computer Vision, 54(1-3), 2003. 1
[13] K. Lee, J. Ho, and D. Kriegman. Acquiring linear sub-
spaces for face recognition under variable lighting. IEEETransactions on Pattern Analysis and Machine Intelligence,
27(5):684–698, 2005. 4
[14] J. C. Nascimento and J. G. Silva. Manifold learning for ob-
ject tracking with multiple motion dynamics. In EuropeanConference on Computer Vision, pages 172–185, 2010. 2
[15] S. Roweis, L. K. Saul, G. E. Hinton, et al. Global coordina-
tion of local linear models. Advances in neural informationprocessing systems, 2:889–896, 2002. 2
[16] C. Russell, J. Fayad, and L. Agapito. Energy based multiple
model fitting for non-rigid structure from motion. In Com-puter Vision and Pattern Recognition, 2011. 2, 3
[17] C. Russell, J. Fayad, and L. Agapito. Dense non-rigid struc-
ture from motion. 3dimPVT, 2012. 3
[18] L. Saul and S. Roweis. Think globally, fit locally: unsuper-
vised learning of low dimensional manifolds. The Journal ofMachine Learning Research, 4:119–155, 2003. 1, 3, 4
[19] G. Strang. Introduction to Linear Algebra. Wellesley-
Cambridge Press, 1993. 6
[20] J. B. Tenenbaum, V. de Silva, and J. C. Langford. A global
geometric framework for nonlinear dimensionality reduc-
tion. Science, 2000. 1, 3, 4
[21] P. Tseng. Nearest q-flat to m points. Journal of OptimizationTheory and Applications, 105(1):249–252, April 2000. 2
[22] R. Vidal. Subspace clustering. IEEE Signal Processing Mag-azine, 28(2):52–68, 2011. 2
[23] T. Wittman. Manifold learning matlab demo, 2005. URL:http://www.math.umn.edu/˜wittman/mani/index.html. 4, 5
[24] R. Zabih and V. Kolmogorov. Spatially coherent clustering
using graph cuts. In Computer Vision and Pattern Recogni-tion, pages 437–444, 2004. 2
[25] Z. Zhang, J. Wang, and H. Zha. Adaptive manifold learning.
Pattern Analysis and Machine Intelligence, IEEE Transac-tions on, 34(2):253 –265, feb. 2012. 1, 2, 4, 5, 6
[26] Z. Zhang and H. Zha. Principal manifolds and nonlinear di-
mension reduction via local tangent space alignment. SIAMJournal of Scientific Computing, 26:313–338, 2002. 1, 3, 4
164716471649