Embed Size (px)
Citation preview

Learn data visualization best practices
Modeling, monitoring, and analyzing information are analytical skills. But when it’s time to
share visualizations, think like a designer to get your point across with memorable and
compelling graphics. Mastering design elements:
• Assists you in building a more articulate and persuasive case.
• Helps viewers understand and connect with data, through support for clear insights.
• Encourages people to share and use your visualizations.
Embrace clarity
Just as a strong narrative helps structure a story, having
a purpose behind every aspect of a chart or graph
helps support your point. It’s best to:
• Avoid adding more formatting than is needed to
achieve data clarity.
• Avoid clutter or elements that draw too much (or
too little) focus.
• Label data points and put clear titles on charts
and graphs.
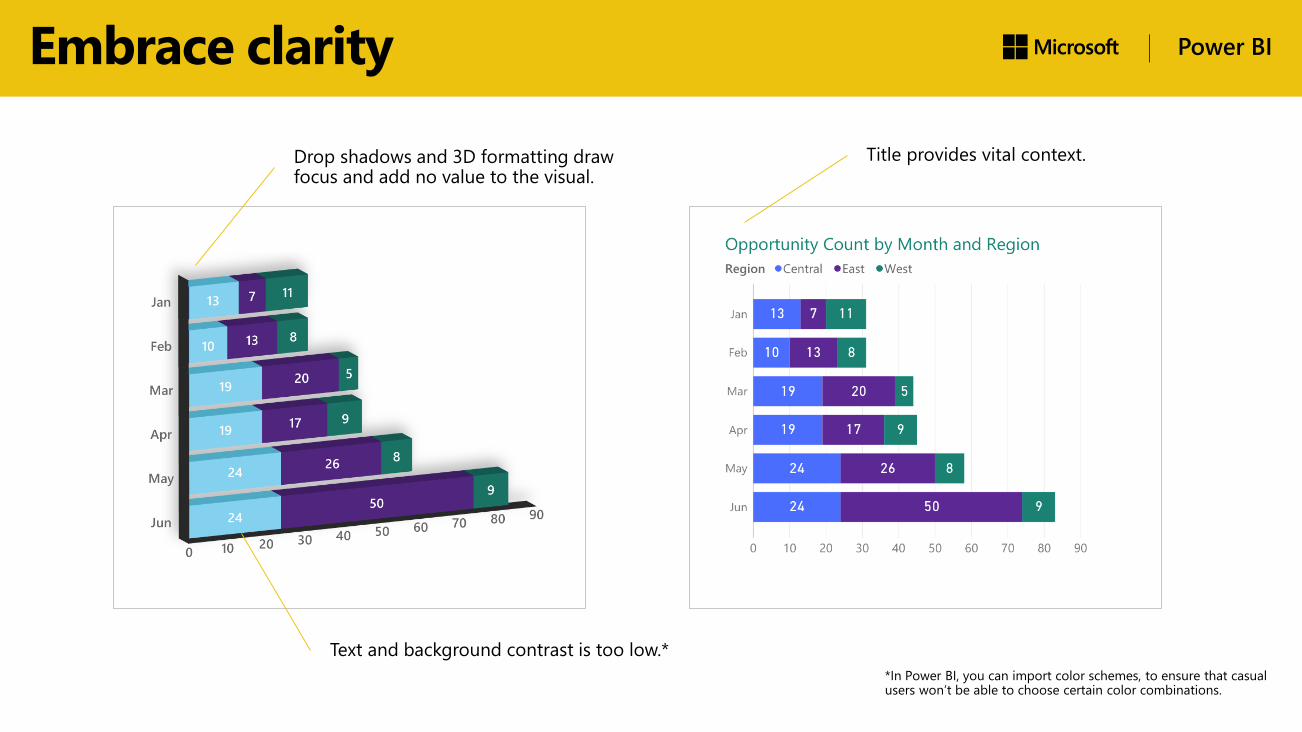
Embrace clarity
Drop shadows and 3D formatting draw focus and add no value to the visual.
Text and background contrast is too low.*
Title provides vital context.
*In Power BI, you can import color schemes, to ensure that casual users won’t be able to choose certain color combinations.
Be consistent
Inconsistency can make a visualization confusing or
hard to interpret. Be sure to:
• Keep design elements such as color and line
weight uniform.
• Make certain the name and color representing a
particular data point across a dashboard or related
charts stays the same.
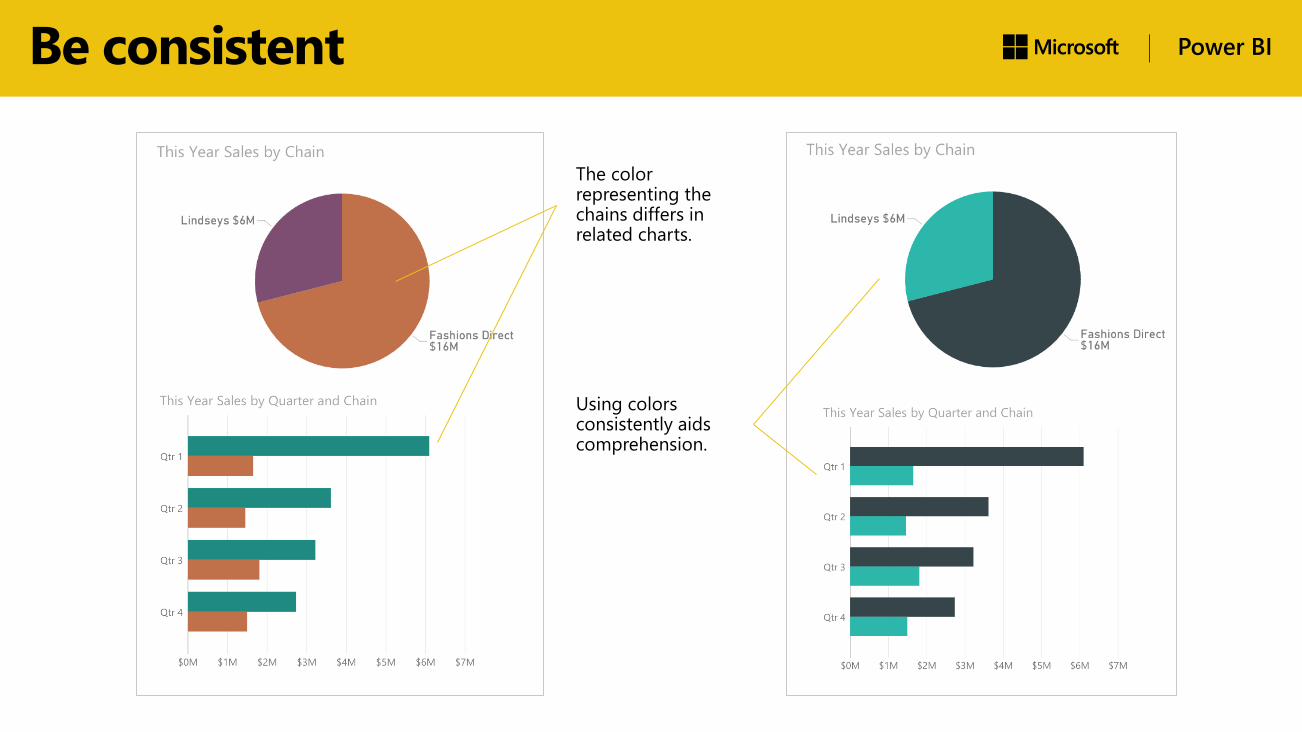
Be consistent
The color representing the chains differs in related charts.
Using colors consistently aids comprehension.
Support readability
Make words as legible as possible:
• Use light and dark values to create contrast instead of
relying on different colors. Low-contrast text-and-
color combinations don't provide enough visual cues
for people with low vision or color blindness. For
specific guidance, use the WebAIM contrast checker
or Altervista Accessibility Color Wheel.
• Use font types, font sizes, and text orientation that
are easy to read. Avoid serif fonts, which tend to
lessen readability on displays.
• Choose shape fills and backgrounds that support, not
obscure, numbers and text.
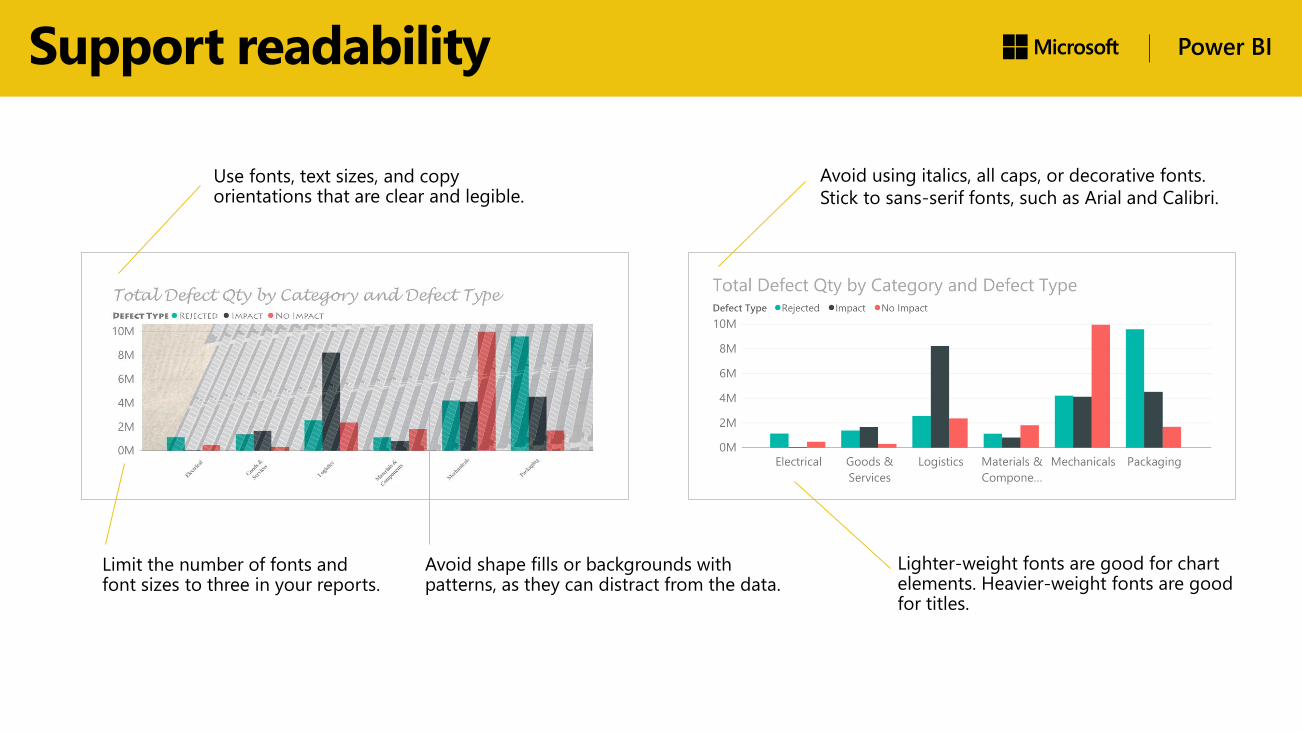
Support readability
Avoid using italics, all caps, or decorative fonts.
Stick to sans-serif fonts, such as Arial and Calibri.
Lighter-weight fonts are good for chart elements. Heavier-weight fonts are good for titles.
Use fonts, text sizes, and copy orientations that are clear and legible.
Limit the number of fonts and font sizes to three in your reports.
Avoid shape fills or backgrounds with patterns, as they can distract from the data.
Achieve balance
Simplify and make sure that what’s important is easy
to see. Be sure to:
• Leave the right amount of “white space” between
chart elements.
• Show the right number of data relationships per
chart. In general, cap data-set relationships at six
per chart or graph.
• Note that in cultures where people read from left
to right, most viewers focus on the center and
top left of a chart, giving the upper right, lower
left, and lower right areas less visual importance.
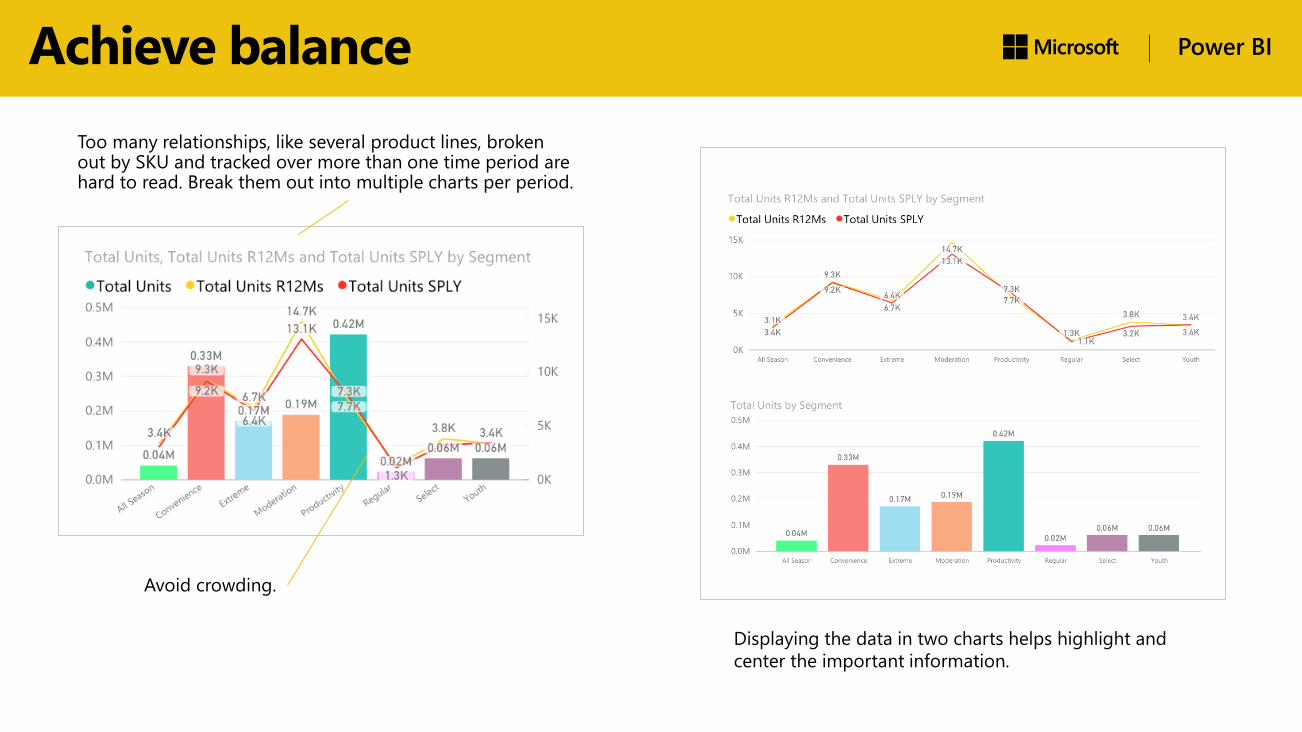
Achieve balance
Displaying the data in two charts helps highlight and
center the important information.
Too many relationships, like several product lines, broken out by SKU and tracked over more than one time period are hard to read. Break them out into multiple charts per period.
Avoid crowding.
Get input
When you work alone, it’s easy to miss something
important. What seems clear to you could be confusing
to your audience. Top tips:
• Get feedback on your visualization, to see if your
message is getting across—ask a colleague what she
thinks your chart shows, to see how her impression
fits with the underlying data.
• If your message didn’t come through, adjust your
visualization or try a different approach.
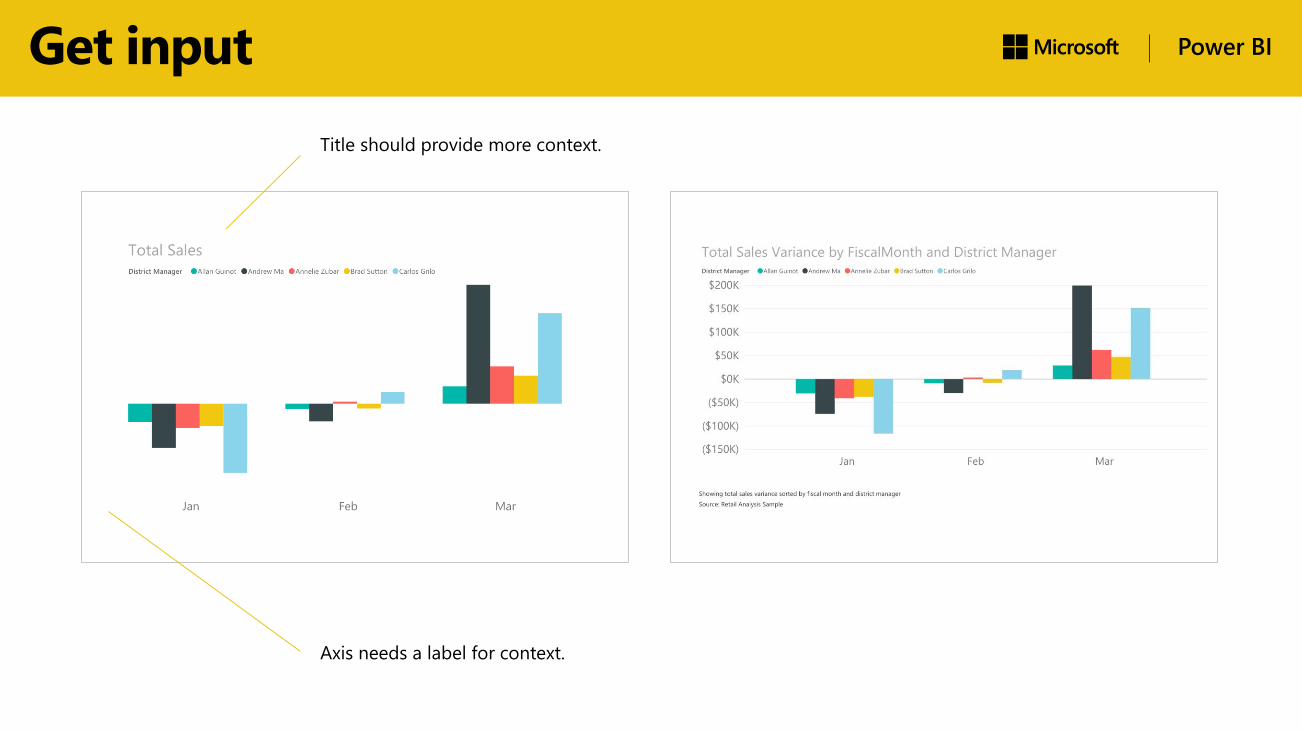
Get input
Title should provide more context.
Axis needs a label for context.
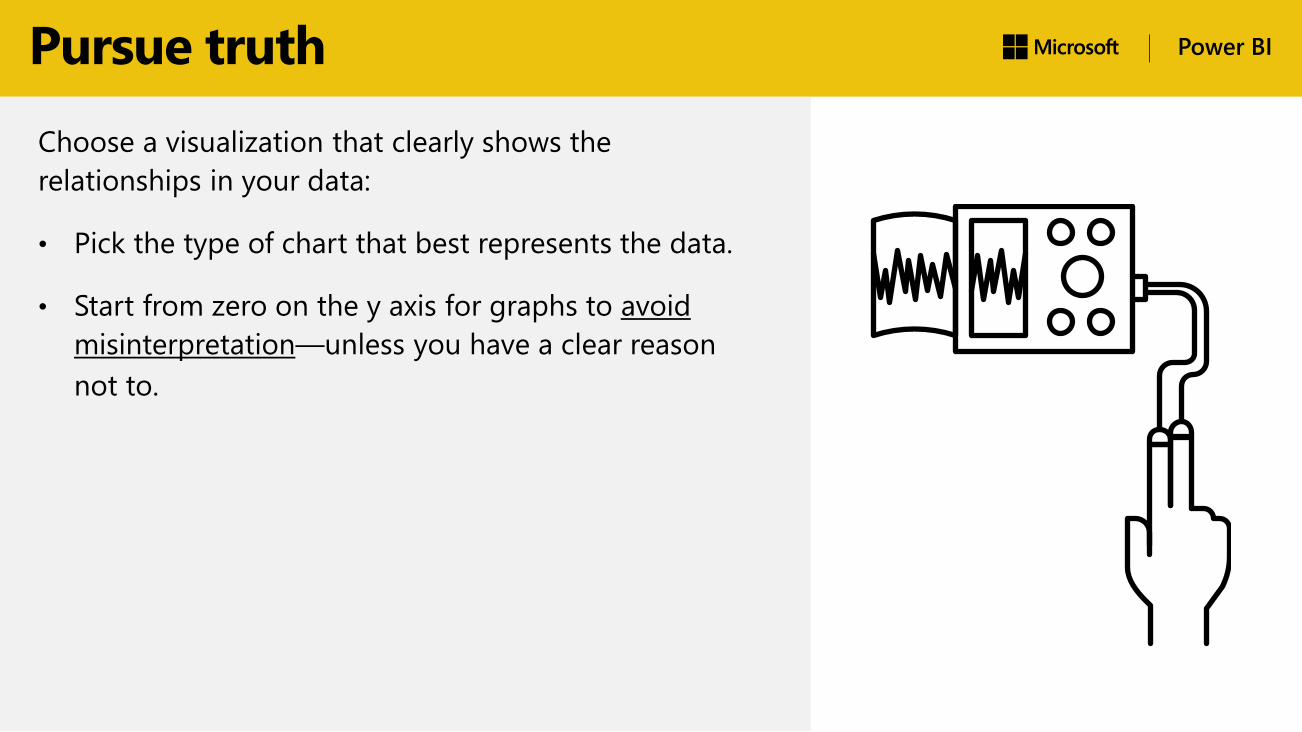
Pursue truth
Choose a visualization that clearly shows the
relationships in your data:
• Pick the type of chart that best represents the data.
• Start from zero on the y axis for graphs to avoid
misinterpretation—unless you have a clear reason
not to.
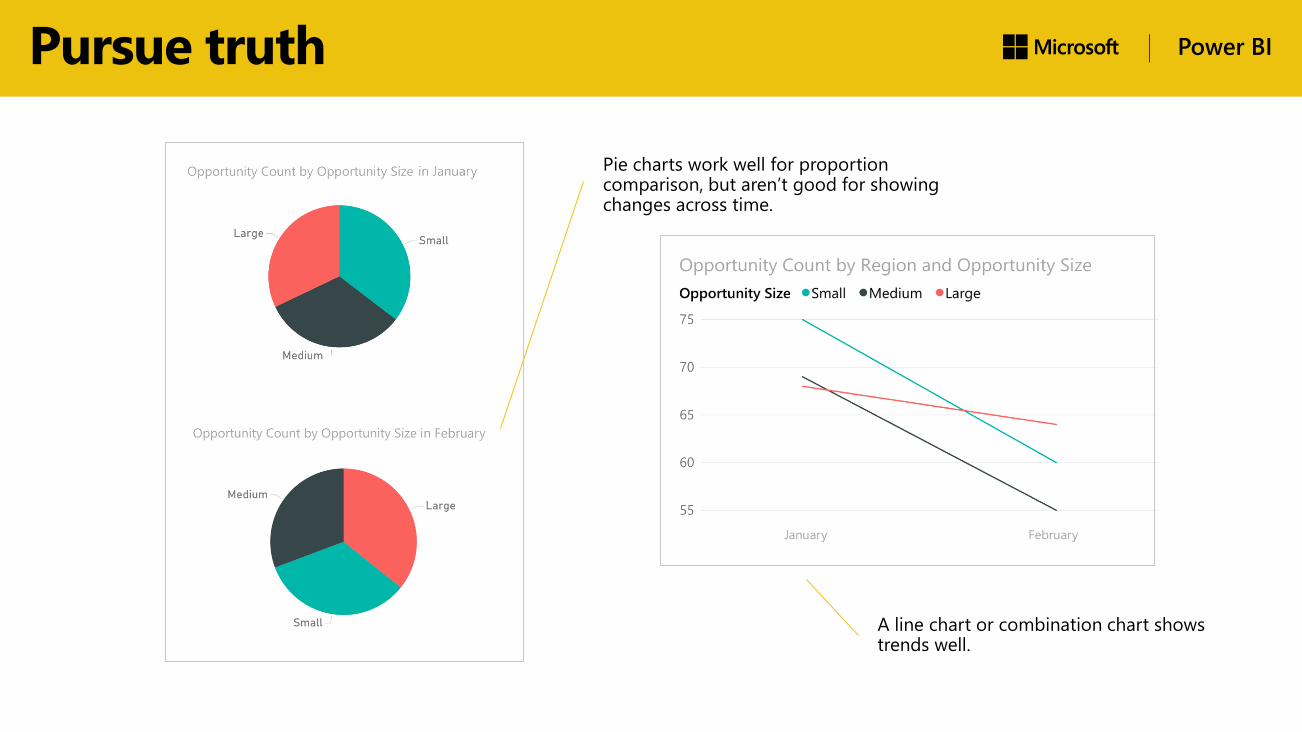
Pursue truth
Pie charts work well for proportion comparison, but aren’t good for showing changes across time.
A line chart or combination chart shows trends well.
Take the next step
For more information on the basics of good visualization principles:
• Grab The DIY Guide to Dazzling Data
• Check out this video by data expert Alberto Cairo.
• Sign up for Power BI and make some beautiful visualizations yourself.