Embed Size (px)
Citation preview

The Machine That Changed the
World
George A. Noyes III
OUTLINE
Background
Parallels to the Auto
Industry
Craft Manufacturing
Mass Production
Ford’s Contributions
Sloan’s Innovations
United Auto Workers
Line of Technical
Efficiency
Taiichi Ohno
LEAN vs. Mass Design
IPT Maturity Model
Producibility
LEAN vs. Mass Production
LEAN vs. Mass Supply
LEAN vs. Mass Distribution
Lean Aerospace Initiative
Next Steps

LOW
VOLUME
HIGH
VOLUME
PRODUCT
STRUCTURE
CONTINUOUS
FLOW
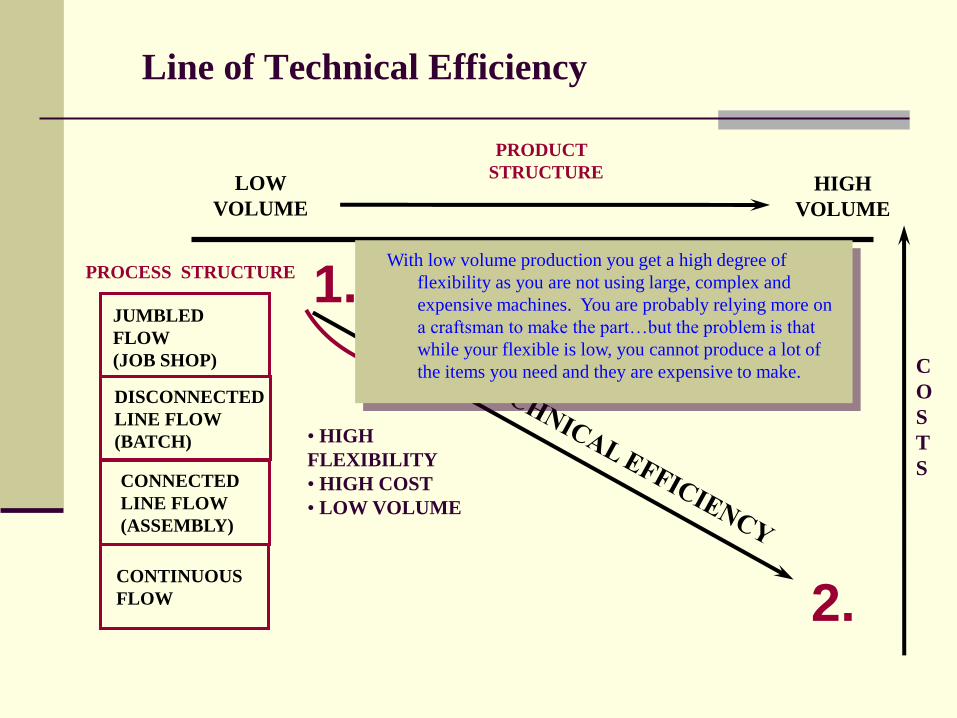
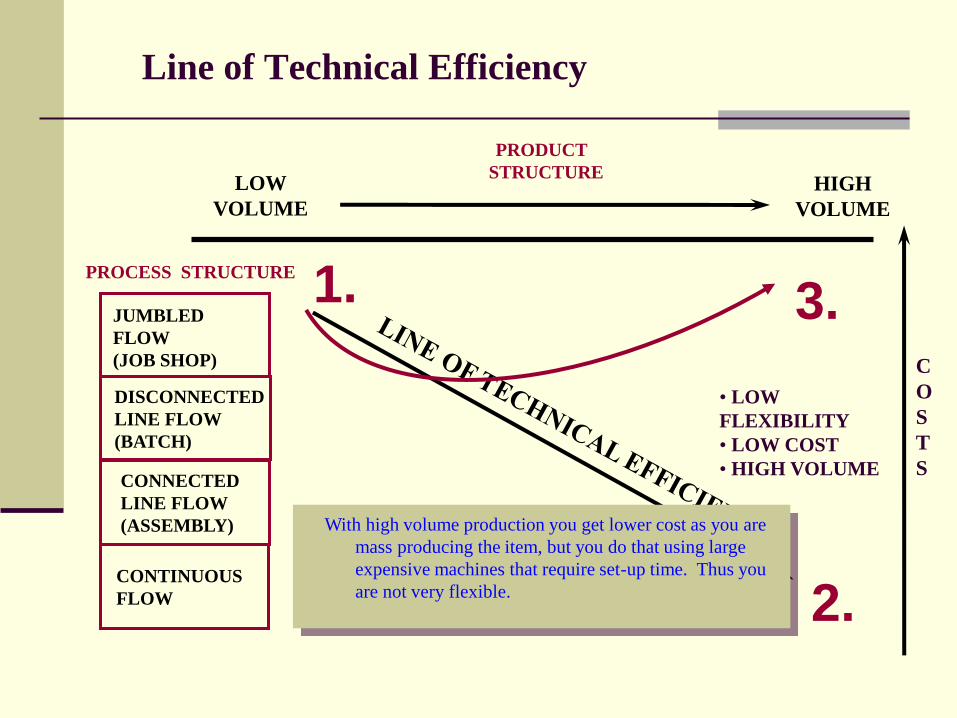
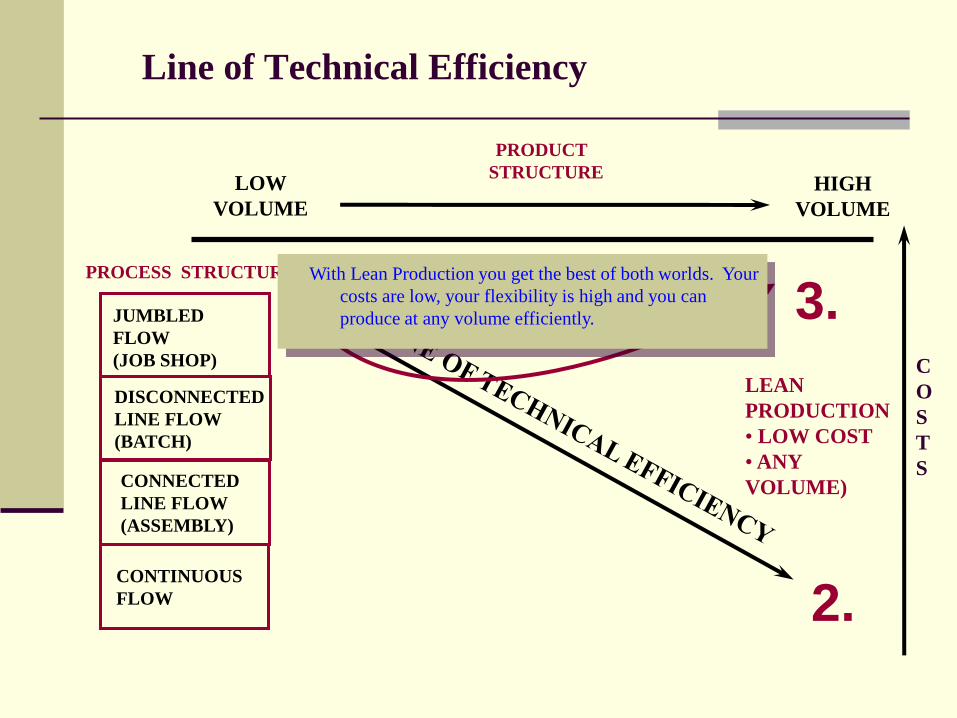
Line of Technical Efficiency
C
O
S
T
S
DISCONNECTED
LINE FLOW
(BATCH)
CONNECTED
LINE FLOW
(ASSEMBLY)
JUMBLED
FLOW
(JOB SHOP)
PROCESS STRUCTURE 1.
2.
3.
LOW
VOLUME
HIGH
VOLUME
PRODUCT
STRUCTURE
CONTINUOUS
FLOW
Line of Technical Efficiency
C
O
S
T
S
DISCONNECTED
LINE FLOW
(BATCH)
CONNECTED
LINE FLOW
(ASSEMBLY)
JUMBLED
FLOW
(JOB SHOP)
PROCESS STRUCTURE 1.
2.
3.
• HIGH
FLEXIBILITY
• HIGH COST
• LOW VOLUME
With low volume production you get a high degree of
flexibility as you are not using large, complex and
expensive machines. You are probably relying more on
a craftsman to make the part…but the problem is that
while your flexible is low, you cannot produce a lot of
the items you need and they are expensive to make.
LOW
VOLUME
HIGH
VOLUME
PRODUCT
STRUCTURE
CONTINUOUS
FLOW
Line of Technical Efficiency
C
O
S
T
S
DISCONNECTED
LINE FLOW
(BATCH)
CONNECTED
LINE FLOW
(ASSEMBLY)
JUMBLED
FLOW
(JOB SHOP)
PROCESS STRUCTURE 1.
2.
3.
• LOW
FLEXIBILITY
• LOW COST
• HIGH VOLUME
With high volume production you get lower cost as you are
mass producing the item, but you do that using large
expensive machines that require set-up time. Thus you
are not very flexible.
LOW
VOLUME
HIGH
VOLUME
PRODUCT
STRUCTURE
CONTINUOUS
FLOW
Line of Technical Efficiency
C
O
S
T
S
DISCONNECTED
LINE FLOW
(BATCH)
CONNECTED
LINE FLOW
(ASSEMBLY)
JUMBLED
FLOW
(JOB SHOP)
PROCESS STRUCTURE 1.
2.
3.
LEAN
PRODUCTION
• LOW COST
• ANY
VOLUME)
With Lean Production you get the best of both worlds. Your
costs are low, your flexibility is high and you can
produce at any volume efficiently.
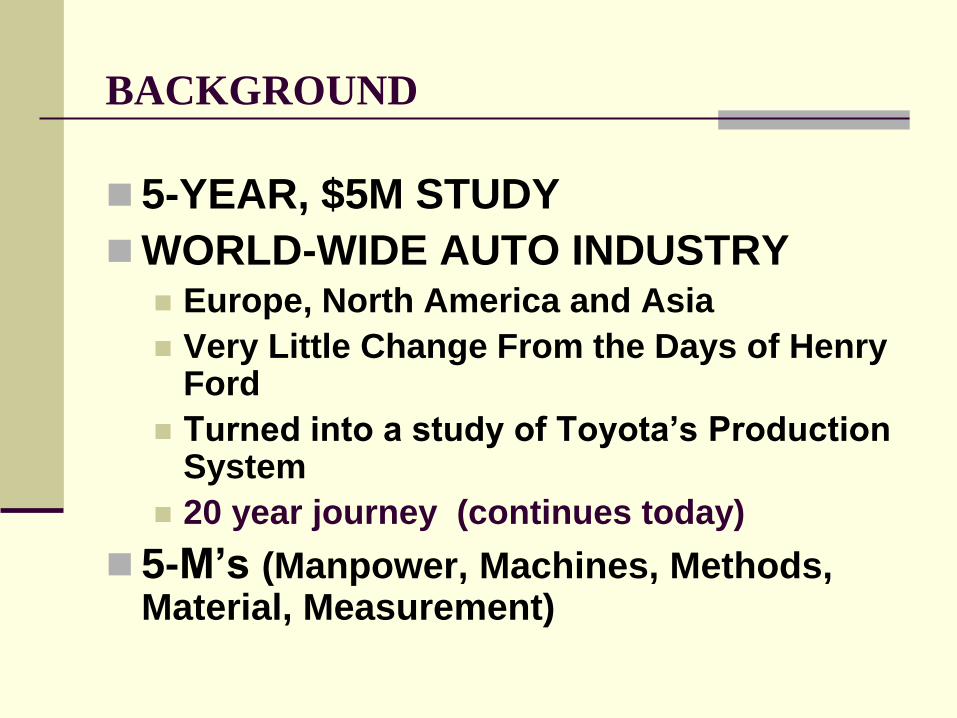
BACKGROUND
5-YEAR, $5M STUDY
WORLD-WIDE AUTO INDUSTRY Europe, North America and Asia
Very Little Change From the Days of Henry Ford
Turned into a study of Toyota’s Production System
20 year journey (continues today)
5-M’s (Manpower, Machines, Methods, Material, Measurement)
The U.S. automotive industry had their significant
emotional experience over 10 years ago, including:
Rapidly declining market share
Overcapacity in capital and labor
Lengthening design times
They have improved, and their improvement is
directly and proportionally traceable to the adoption
of “Lean Production Techniques.”
Today the defense industry is facing very similar
“significant emotional events.”

CRAFT
Highly Skilled Workers
Flexible Machines & Tools
Quality = Craftsmanship
Decentralized Organizations (Guild System)
Low Volume/High Cost
Great Amount of Variety
1-1 Customer Relationships
Today: Luxury/Image Cars (Aston Martin)

MASS
Professionals with Narrow Skills
Mfg., Tooling, Inspection, Design, etc.
Semi or Unskilled Workers
Variable Cost, Work was Cyclical and Boring
Expensive, Single Purpose Machines & Tools
Intolerant of Disruption
Low Flexibility
Economies of Scale
Keep Standard Designs a Long Time
Low Variety

MASS (Continued)
Centralized Organizations
Reward Individuals
High Volume, Low Cost
Quality = AQL

Interchangeable Parts
Single Gaging System
Simplicity of Design & Ease of Assembly
Easy to Maintain
1908 Model T (514/minutes cycle time)
1913 Model T (2.3/min.)
Moving Assembly Line
Single Task per Assembler (1.19/min.)
Vertical Integration
Tolerances & Scheduling
Lots of Support Workers
Tooling, Quality, Foreman, Expediters, etc.
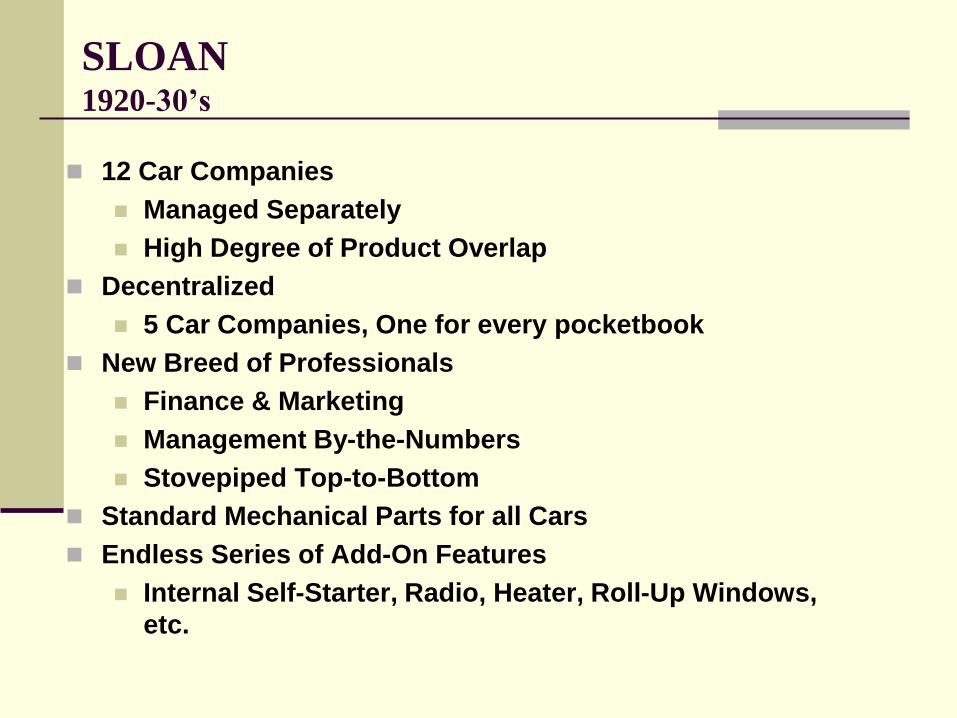
SLOAN 1920-30’s
12 Car Companies
Managed Separately
High Degree of Product Overlap
Decentralized
5 Car Companies, One for every pocketbook
New Breed of Professionals
Finance & Marketing
Management By-the-Numbers
Stovepiped Top-to-Bottom
Standard Mechanical Parts for all Cars
Endless Series of Add-On Features
Internal Self-Starter, Radio, Heater, Roll-Up Windows,
etc.

UNITED AUTO WORKERS 1930’s
Big “3” Agreement
Based on Seniority & Job Rights
Attempt to Dampen Impact of Cyclical
Layoffs
Final Wedge Between Management &
Worker
Final Stovepiping in Factory Operations
Mass Production in it’s Final Mature Form
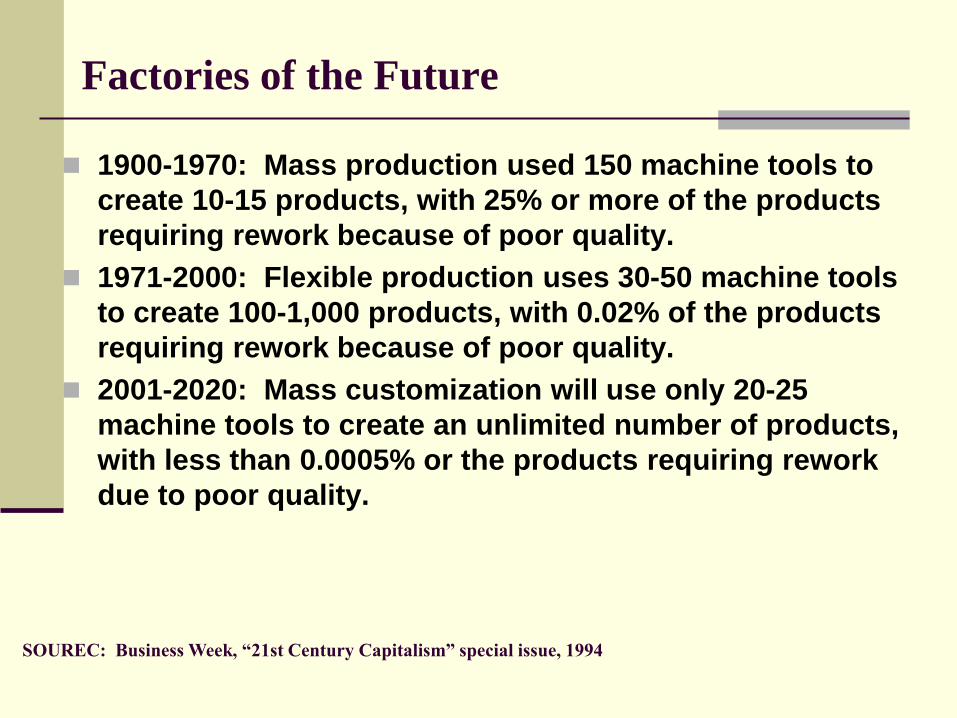
Factories of the Future
1900-1970: Mass production used 150 machine tools to
create 10-15 products, with 25% or more of the products
requiring rework because of poor quality.
1971-2000: Flexible production uses 30-50 machine tools
to create 100-1,000 products, with 0.02% of the products
requiring rework because of poor quality.
2001-2020: Mass customization will use only 20-25
machine tools to create an unlimited number of products,
with less than 0.0005% or the products requiring rework
due to poor quality.
SOUREC: Business Week, “21st Century Capitalism” special issue, 1994

Taiichi Ohno
Ford’s System Rife with Muda (Waste)
20% of Floor Space Dedicated to Rework
25% of Total Hours Involved in Fixing Mistakes
Only the Assembly Worker “Adds Value” - Value Stream
Workers Given Additional Jobs
QC, Housekeeping, Minor Tool Repair, etc.
Time Set Aside for Continuous Improvement (Kaizen)
No Rework
Cord to Stop the Line - Five Why’s
Poka-Yoke (Foolproofing)
Group Works in Teams with a Leader
Accomplishes Groups of Tasks
Leader is also a Worker
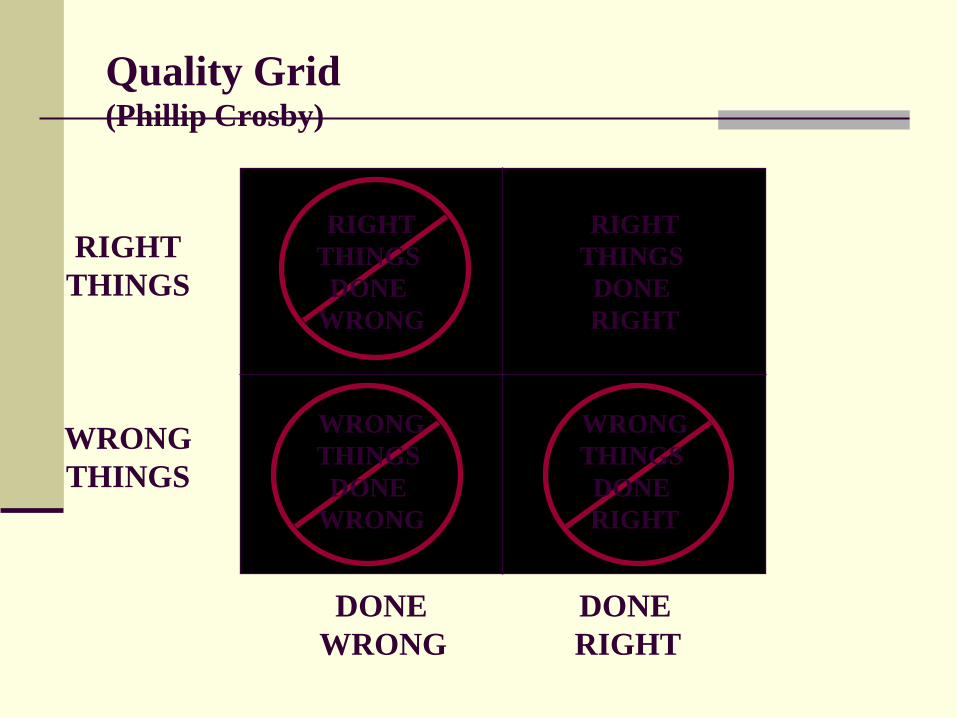
Quality Grid (Phillip Crosby)
RIGHT
THINGS
DONE
RIGHT
RIGHT
THINGS
WRONG
THINGS
DONE DONE
WRONG RIGHT
WRONG
THINGS
DONE
WRONG
WRONG
THINGS
DONE
RIGHT
RIGHT
THINGS
DONE
WRONG
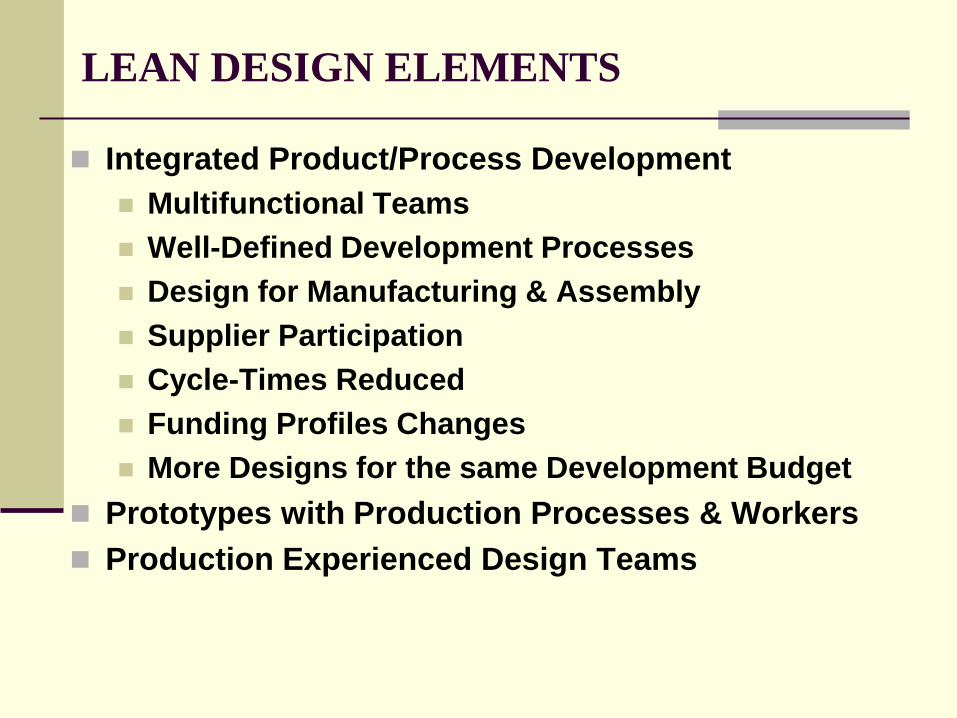
LEAN DESIGN ELEMENTS
Integrated Product/Process Development
Multifunctional Teams
Well-Defined Development Processes
Design for Manufacturing & Assembly
Supplier Participation
Cycle-Times Reduced
Funding Profiles Changes
More Designs for the same Development Budget
Prototypes with Production Processes & Workers
Production Experienced Design Teams

LEAN DESIGN ELEMENTS (Continued)
Project Team Leader Carries Great Power and
Prestige (Shusa)
Assigned for the duration of the Project
Teams are Small Tightly Knit Groups
Get Report Card from the Team Leader
Advancement is Through Performance on the
Team
Groups Forced to Confront all Difficult Trade-
Offs Early
Team Starts-Off Large and Gradually Shrinks
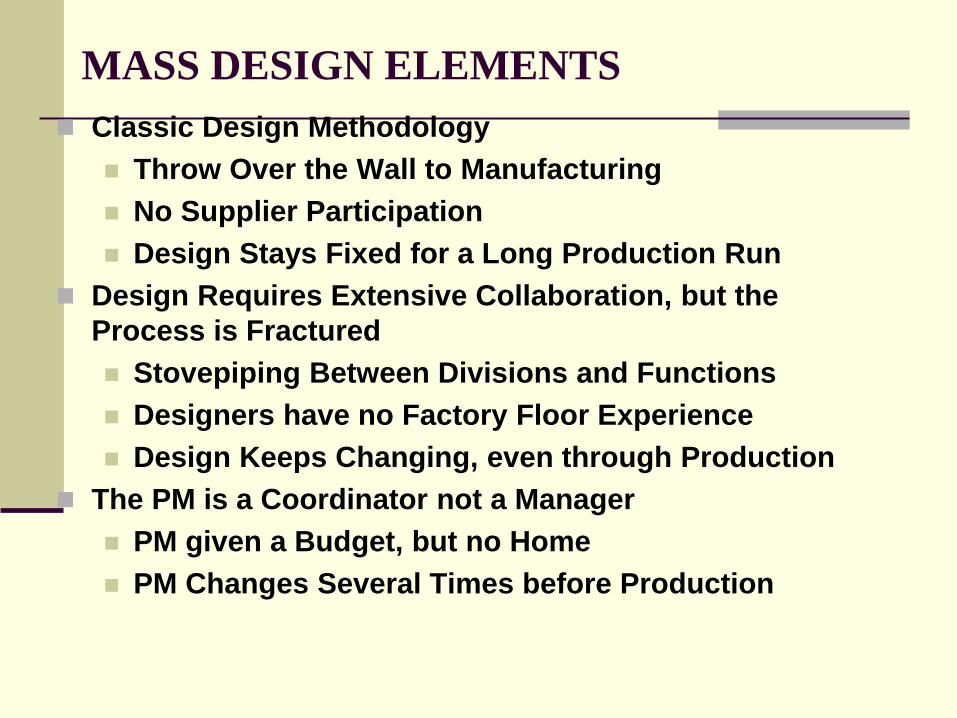
MASS DESIGN ELEMENTS
Classic Design Methodology
Throw Over the Wall to Manufacturing
No Supplier Participation
Design Stays Fixed for a Long Production Run
Design Requires Extensive Collaboration, but the
Process is Fractured
Stovepiping Between Divisions and Functions
Designers have no Factory Floor Experience
Design Keeps Changing, even through Production
The PM is a Coordinator not a Manager
PM given a Budget, but no Home
PM Changes Several Times before Production

MASS DESIGN ELEMENTS
(Continued)
Teams are Large and Loosely Connected
Assigned for Limited Period of Time
May get Report Card from PM, but Future Success is
Through Functional Boss
Groups Avoid Early Decisions, no Process to Force
Decisions
Teams Start-Off Small and Grow as Problems Mount
Products Developed 1st, then the Processes to Make Them
Product Development Cycle Time is High
Developing a New Product is Very Expensive
Funding Profile Does Not Support Teaming

IPT Maturity Model
TEAMWORK
TECHNOLOGIES
COMMUNICATIONS
PROJECT FOCUS
ANALYTICAL
APPROACH
DEPLOYMENT
CREATIVITY
REINFORCEMENT
TIME
DENNIS
RODMAN
SOME
TRAINING
STRONG
TEAM
FOCUS
BALANCED
BY DESIGN
INDUSTRY
BENCHMARK
INDUSTRY
BENCHMARK
INDUSTRY
BENCHMARK
INDUSTRY
BENCHMARK
INDUSTRY
BENCHMARK
INDUSTRY
BENCHMARK
INDUSTRY
BENCHMARK
INDUSTRY
BENCHMARK
PENCIL &
ABACUS DRAFTING
TABLES
CATIA
FAC. SIM.
INTEGRATED
EDI/TDI
THREE
MONKEYS
WHY ARE
WE HERE?
MOOD
RINGS
NEGATIVE
TRENDS
CLONE
FACTORY
BEAT
AGAIN
REGULAR
MEETINGS
STRONG
TWO-WAY VULCAN
MIND MELD
FIXING
BLAME
FIXING
PROBLEMS POSITIVE
TEENDS
EARLY
TOOL USE
7 Q TOOLS
7 M TOOLS
QFD, DOE,
SPC, ETC
SOME
IMPROVE MANY
IMPROVE
GREAT
TRENDS
SOME
NEW IDEAS
REWARD
THINKING
LEARNING
LAB
SLOGANS DECISIONS
BASED ON
VALUES
CONSTANCY
OF
PURPOSE
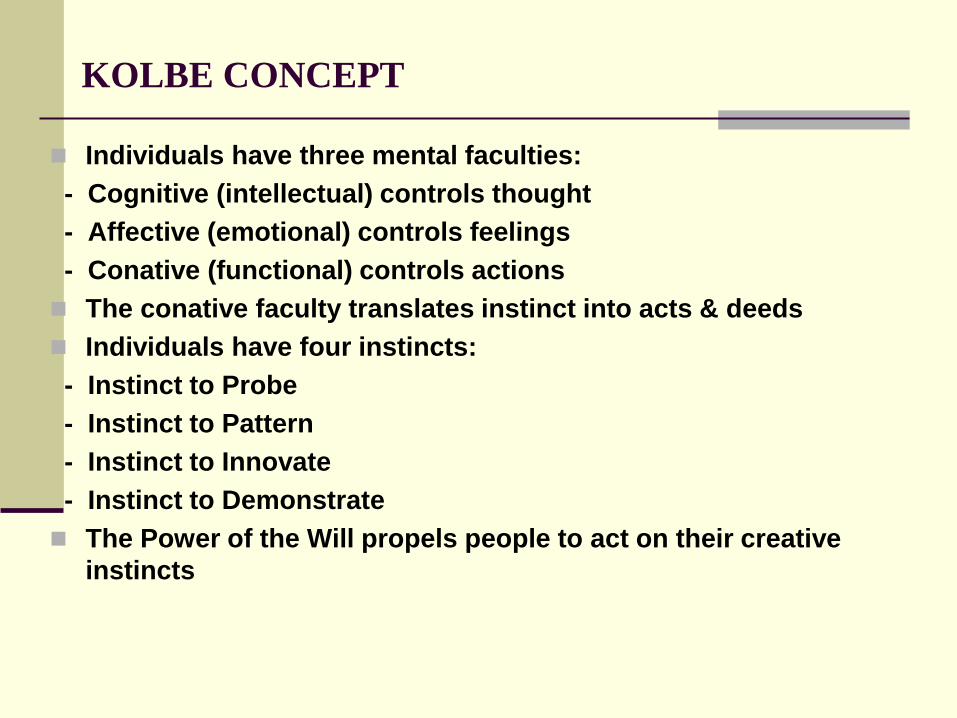
KOLBE CONCEPT
Individuals have three mental faculties:
- Cognitive (intellectual) controls thought
- Affective (emotional) controls feelings
- Conative (functional) controls actions
The conative faculty translates instinct into acts & deeds
Individuals have four instincts:
- Instinct to Probe
- Instinct to Pattern
- Instinct to Innovate
- Instinct to Demonstrate
The Power of the Will propels people to act on their creative
instincts
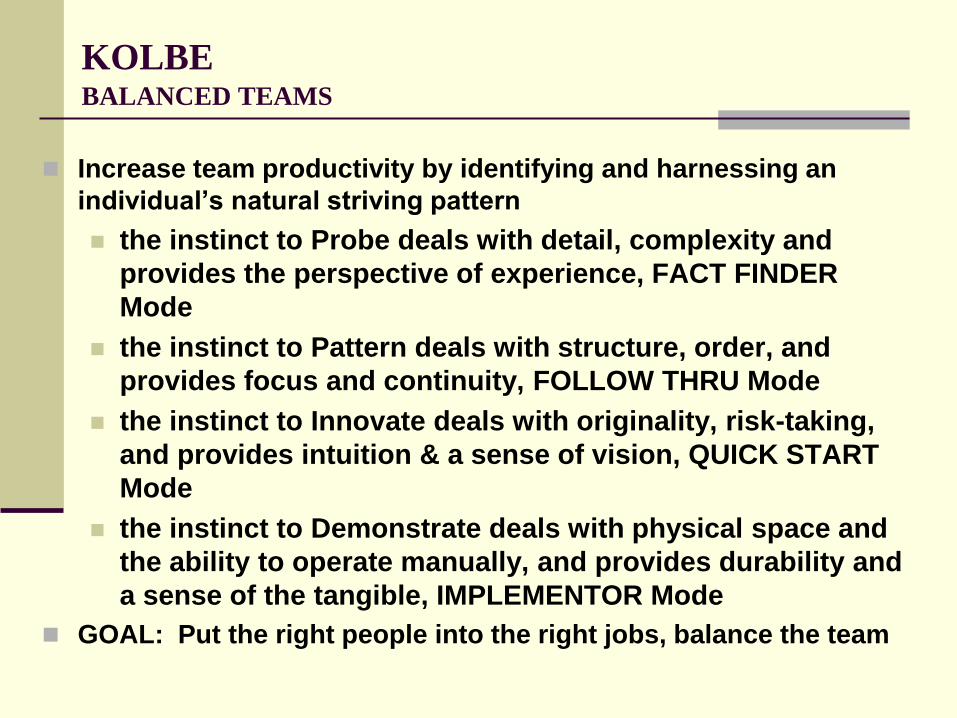
KOLBE BALANCED TEAMS
Increase team productivity by identifying and harnessing an
individual’s natural striving pattern
the instinct to Probe deals with detail, complexity and
provides the perspective of experience, FACT FINDER
Mode
the instinct to Pattern deals with structure, order, and
provides focus and continuity, FOLLOW THRU Mode
the instinct to Innovate deals with originality, risk-taking,
and provides intuition & a sense of vision, QUICK START
Mode
the instinct to Demonstrate deals with physical space and
the ability to operate manually, and provides durability and
a sense of the tangible, IMPLEMENTOR Mode
GOAL: Put the right people into the right jobs, balance the team
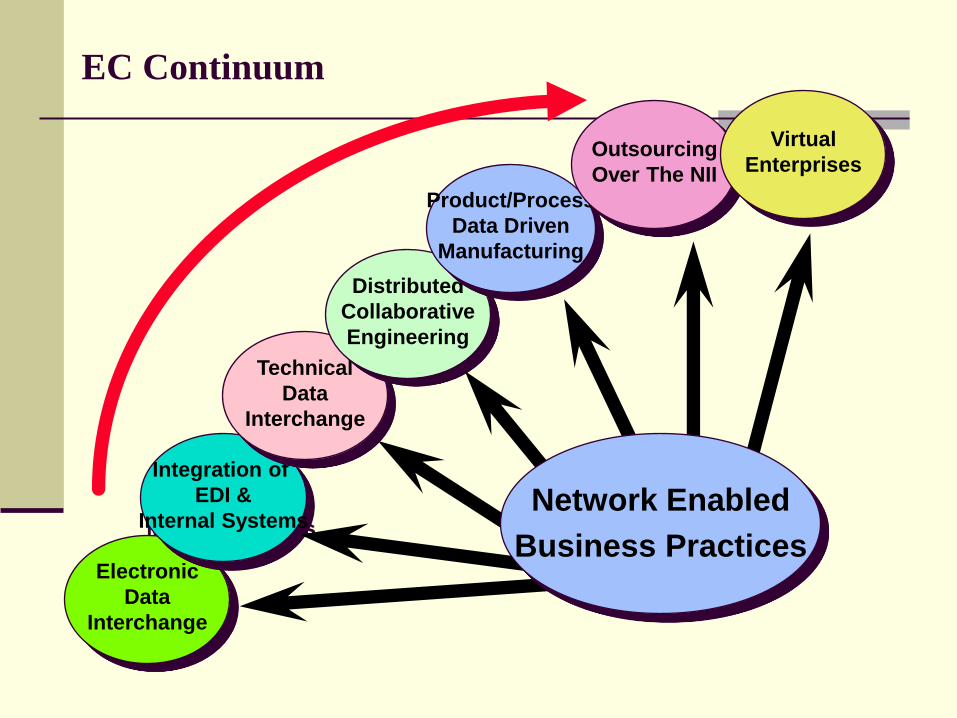
Electronic
Data
Interchange
Integration of
EDI &
Internal Systems
Technical
Data
Interchange
Distributed
Collaborative
Engineering
Product/Process
Data Driven
Manufacturing
Outsourcing
Over The NII
Virtual
Enterprises
Network Enabled
Business Practices
EC Continuum

Analytical Approach
LEAN (Uses tools to
help solve problems)
Fix the Problem
7 Quality Tools
Cause & Effect
Diagrams
Structured
Brainstorming
5 Whys
7 Management Tools
QFD, DOE, SPC
Key Characteristics
Real Integration
MASS (Limited tool
use)
Fix the Blame
SPC used by QA only

Key Characteristics
Features or characteristics whose variability has the
greatest impact on fit, performance, or service life
Key characteristics provide a focus for product
improvement
Quality if conformance to nominal on all key
characteristics
Quality improvement comes from reducing variation by:
-- Eliminating special causes
-- Improving consistency of measurement systems
-- Controlling the product by controlling the processes
-- Reducing losses and eliminating waste
But - How do you identify the features that are the most
vital?

Transformation Methodology From Customer Requirements to Material & Manufacturing Processes
Customer Requirement
• Support the SIOP
(Be on time is a Key Reqmt)
Manufacturing Requirements
• Hardware Requirements
-- MIL-SPEC Diode
-- Good Solder Joints
• Process Requirements
-- MIL-STD 2000
-- Wave Solder Machine
• Verification Requirements
-- DOE to Identify Key Characteristics
-- SPC to control key process factors
Subsystem Requirement
Clock Keys = Readability
& Accuracy
Power
Supply
Display
Assembly
Voltage is Key Photo LCD Panel
Diode Lamp

Quality Function Deployment “The Start of Lean Thinking”
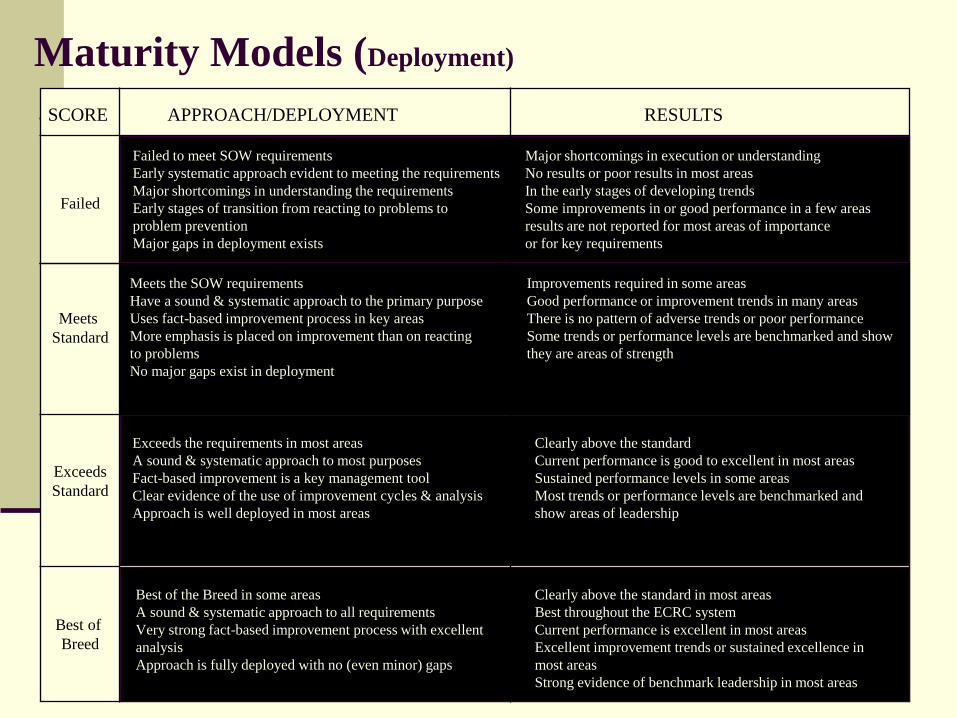
Maturity Models (Deployment)
SCORE APPROACH/DEPLOYMENT RESULTS
Failed
Meets
Standard
Exceeds
Standard
Best of
Breed
Major shortcomings in execution or understanding
No results or poor results in most areas
In the early stages of developing trends
Some improvements in or good performance in a few areas
results are not reported for most areas of importance
or for key requirements
Failed to meet SOW requirements
Early systematic approach evident to meeting the requirements
Major shortcomings in understanding the requirements
Early stages of transition from reacting to problems to
problem prevention
Major gaps in deployment exists
Meets the SOW requirements
Have a sound & systematic approach to the primary purpose
Uses fact-based improvement process in key areas
More emphasis is placed on improvement than on reacting
to problems
No major gaps exist in deployment
Exceeds the requirements in most areas
A sound & systematic approach to most purposes
Fact-based improvement is a key management tool
Clear evidence of the use of improvement cycles & analysis
Approach is well deployed in most areas
Best of the Breed in some areas
A sound & systematic approach to all requirements
Very strong fact-based improvement process with excellent
analysis
Approach is fully deployed with no (even minor) gaps
Improvements required in some areas
Good performance or improvement trends in many areas
There is no pattern of adverse trends or poor performance
Some trends or performance levels are benchmarked and show
they are areas of strength
Clearly above the standard
Current performance is good to excellent in most areas
Sustained performance levels in some areas
Most trends or performance levels are benchmarked and
show areas of leadership
Clearly above the standard in most areas
Best throughout the ECRC system
Current performance is excellent in most areas
Excellent improvement trends or sustained excellence in
most areas
Strong evidence of benchmark leadership in most areas

PRODUCIBILITY
A design accomplishment resulting from a
coordinated effort by all engineering
functions to create a functional hardware
design that optimizes ease and economy
of fabrication, assembly, inspection, test,
and acceptance without sacrificing
desired function, performance, or quality.
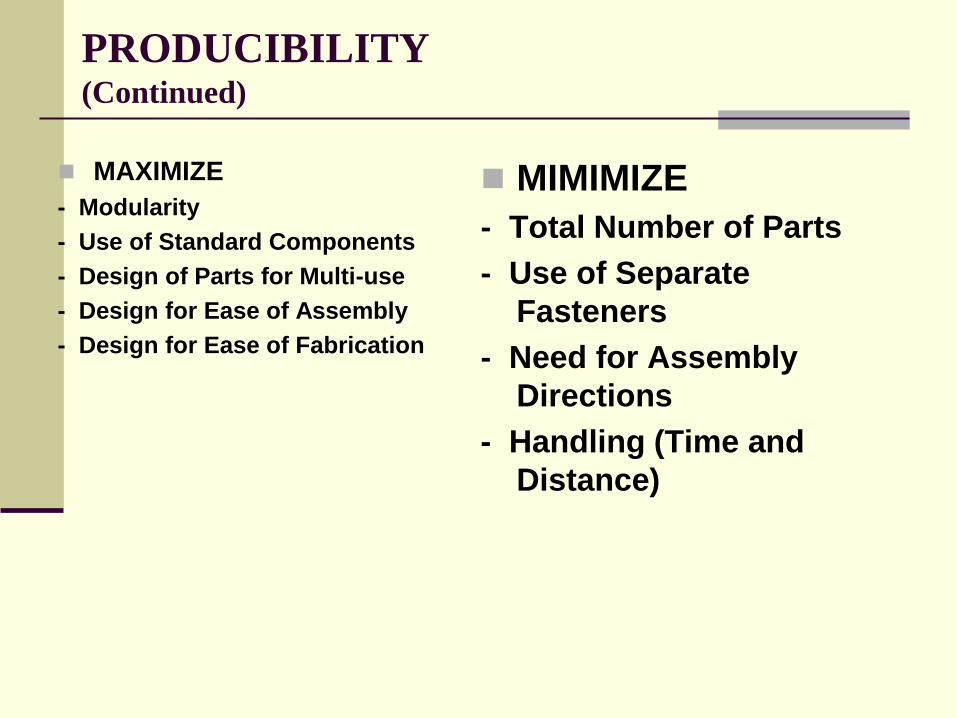
PRODUCIBILITY (Continued)
MAXIMIZE
- Modularity
- Use of Standard Components
- Design of Parts for Multi-use
- Design for Ease of Assembly
- Design for Ease of Fabrication
MIMIMIZE
- Total Number of Parts
- Use of Separate
Fasteners
- Need for Assembly
Directions
- Handling (Time and
Distance)

MANAGEMENT FUNDING .9 FUNDING MATCHES PROJECTED BUDGET
.7 FUNDING ADEQUATE, DOES NOT EXCEES 5% OVER
.5 FUNDING MINIMAL, OVERRUNS OF 15% LIKELY
.3 FUNDING SKETCHY, HIGH OVERRUNS LIKELY
.1 FUNDING IS TOTALLY INADEQUATE
PRODUCIBILITY
.9 PRODUCIBILITY ASSESSMENT DONE BEFORE AWARD
.7 PRODUCIBILITY IMPLEMENTED AFTER PDR
.5 PRODUCIBILITY IMPLEMENTED AFTER CDR
.3 PRODUCIBILITY IMPLEMENTED AFTER EMD
.1 PRODUCIBILITY NOT CONSIDERED
RISK ASSESSMENT .9 RISK IS MANAGEABLE/PREDICTABLE - PLAN IS IN PLACE
.7 RISK IS LOW
.5 RISK IS MEDIUM
.3 RISK IS HIGH
.1 NO RISK PLAN OR POLICY CONSIDERED
DATA REQUIREMENTS
.9 ALL SPECs/CDRLs ARE ON CONTRACT
.7 TAILORING OF ALL SPECs/CDRLs IS ACCOMPLISHED
.5 ALL SPEC/CDRL COST DRIVERS IDENTIFIED
.3 A FEW SPEC/CDRL COST DRIVERS IDENTIFIED
.1 NONE IDENTIFIED
EMD DESIGN .9 EXISTING/SIMPLE DESIGN
.7 MINOR REDESIGN OR INCREASE IN COMPLEXITY
.5 MAJOR REDESIGN OR MODERATE INCREASE
.3 COMPLEX REDESIGN OR MAJOR INCREASE
.1 STATE OF THE ART RESEARCH REQUIRED
PROCESS/METHOD .9 PROVEN PROCESSES & TECHNOLOGIES
.7 PREVIOUS EXPERIENCE WITH PROCESSES
.5 PROCESS EXPERIENCE IS AVAILABLE
.3 PORCESS AVAILABLE BUT NOT PROVEN
.1 NO EXPERIENCE, PROCESS NEEDS R&D
MATERIALS .9 READILYAVAILABLY
.7 1-3 MONTH LEAD TIMES
.5 3-9 MONTH LEAD TIMES
.3 9-18 MONTH LEAD TIMES
.1 18= MONTH LEAD TIMES OR NEEDS R&D
DESIGN TO COST .9 BUDGET NOT EXCEEDED
.7 EXCEEDS BUDGET BY LESS THAN 5%
.5 EXCEEDS BUDGET BY 5-20%
.3 EXCEEDS BUDGET BY 20-50%
.1 EXCEEDS BUDGET BY MORE THAN 50%
Producibility Assessments

DFMA Design for Manufacturing/Assembly
A part is a candidate for redesign if you can answer
no to the following three questions:
During operation, does this part move relative to the part to
which it is attached?
Does this part need to be made of a different material that
the part to which it is attached?
Does this part need to be removable?
* Source: Boothroyd & Doohurst

Producers Rank Other Producers “Manufacturability of Products in Assembly Plant”
SOURCE: 1990 IMVP MANUFACTURABILITY SURVEY
Toyota
Honda
Mazda
Fiat
Nissan
Ford
Volkswagen
Mitsubishi
Suzuki
General Motors
Chrysler
Jaguar
RANK
2.2
3.9
4.8
5.3
5.4
5.6
6.4
6.6
8.7
10.2
13.5
18.6

“”Contributions to Quality Improvement
at Toyota”
QFD Taguchi - 50%
FTA/RFTA - 35%
FMEA - 15%
SPC
QFD helps to identify what is important
Taguchi, FTA/RFTA and FMEA are used to make the
continuous improvements (breakthroughs)
SPC is used to hold the gains and monitor the process
FTA = Fault Tree Analysis
RFTA = Reverse Fault Tree Analysis
FMEA = Failure Mode and Effect Analysis

TAGUCHI

Statistical Process Control

LEAN PRODUCTION
Transfers Maximum Number of Tasks and
Responsibilities to the Worker
Only Workers Add Value
Indirect Specialists Go Away or Reduce in
Numbers
Develops and Advanced Quality System
Root Cause Corrective Action (5-Whys)
Workers have Multiple Stills
Invest Heavily in Training (TI, Motorola)
Use Highly Flexible Machines
Produce a Great Variety of Products

MASS PRODUCTION
Work Arranged for the Worker
Only a Few Well Defined Tasks, Requiring Little Training
Work Brought to the Worker
Relentlessly Disciplined by the Pace of the Line
Many Indirect Specialists
Industrial & Mfg. Eng.., QA, Housekeeping, Tooling, etc.
Equipment
Very Accurate, Specialized & Expensive
Designed for High Volume (Set-Up Times Minimized)
Limited Number of Products (High Volume)
Buffers Between Production Steps
Excess Capacity, Excess People, and Large WIPs

Theory of Constraints “Eli Goldratt”
Inventory is the Root of All Evil
(Ohno and Goldratt)
The action you are proposing:
Will it increase throughput?
Will it decrease inventory?
Will it decrease operating expenses?
(Where is Muda in all this?)
Conventional cost accounting systems make
machine & employee utilization a key performance
measure and treat inventory as an asset!

Theory of Constraints (Continued)
Making Product does not equal Making
Money
People Working does not equal Making
Money
Manufacturing Goals (Simultaneously): Throughput (Sales)
Inventory & WIP
Operating Expense
Net Profit
ROI
Cash Flow
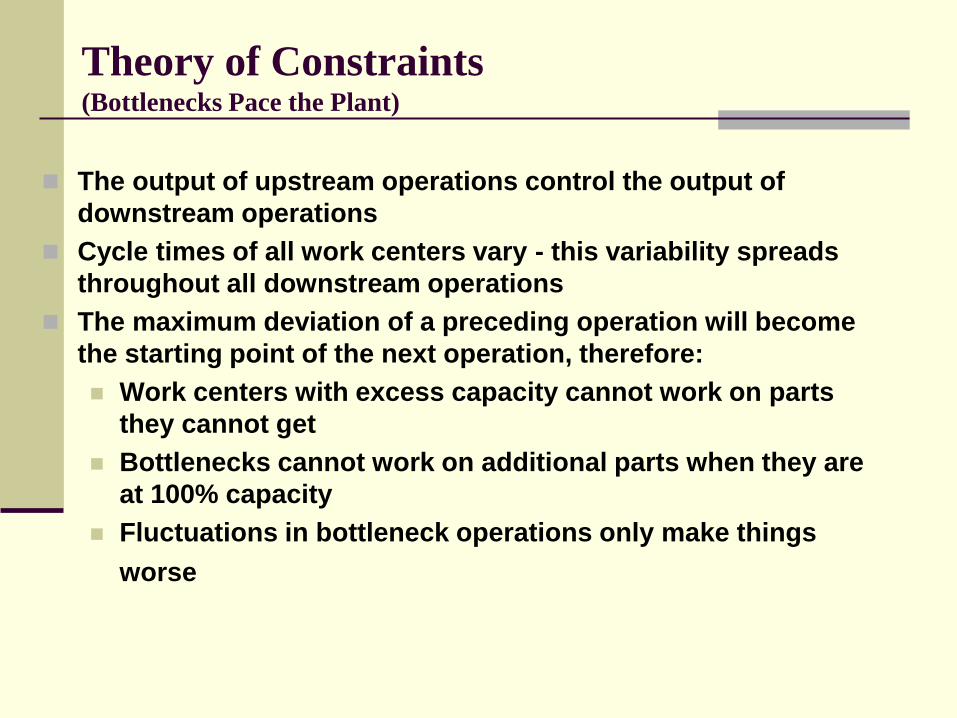
Theory of Constraints (Bottlenecks Pace the Plant)
The output of upstream operations control the output of
downstream operations
Cycle times of all work centers vary - this variability spreads
throughout all downstream operations
The maximum deviation of a preceding operation will become
the starting point of the next operation, therefore:
Work centers with excess capacity cannot work on parts
they cannot get
Bottlenecks cannot work on additional parts when they are
at 100% capacity
Fluctuations in bottleneck operations only make things
worse

Theory of Constraints (Continued)
Sum of the Local Optimums Global Optimum
Balance Flow not Capacity
Bottlenecks Govern Both Throughput & Inventory
An Hour Lost at a Bottleneck is an Hour Lost for the
Entire System
An Hour Saved at a non-Bottleneck is is Mirage
(The potential of a non-bottleneck is not determined by itself but
by the bottleneck)
If You Don’t Need a Part Don’t Make It
It is OK to let a non-bottleneck sit idle
It’s Never OK to let Bottlenecks sit idle
= /
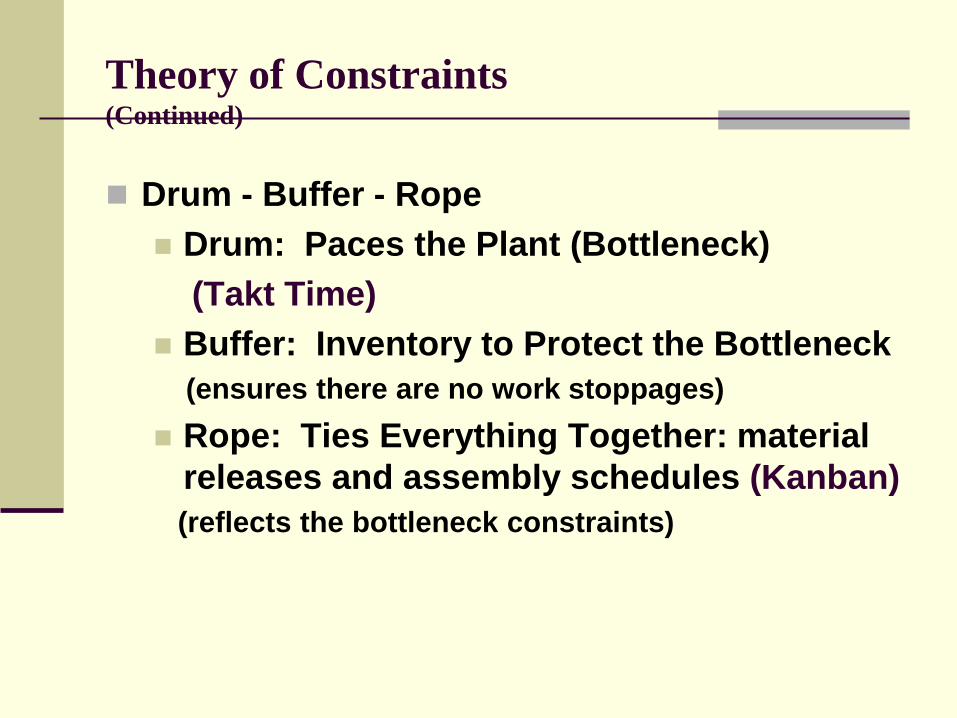
Theory of Constraints (Continued)
Drum - Buffer - Rope
Drum: Paces the Plant (Bottleneck)
(Takt Time)
Buffer: Inventory to Protect the Bottleneck
(ensures there are no work stoppages)
Rope: Ties Everything Together: material
releases and assembly schedules (Kanban)
(reflects the bottleneck constraints)

Theory of Constraints (The Process)
Identify the bottlenecks (capacity constraints)
Protect the bottlenecks
Use non-bottlenecks only to keep pace with
bottleneck flows
Only improve capacity & variability at existing
bottlenecks & capacity constrained resources
Reduce:
Set-up Times
Cycle Times & its Variability
Vendor Variability (Quality, Quantity & Times)

LEAN SUPPLY CHAIN
Designing the Parts:
Fewer Suppliers
Suppliers Selected on Basis of Past Relationships
vice Cost
Suppliers Design and Build Entire Components
Suppliers Work with Assemblers Early in the PD
Cycle
Assemblers Work with Suppliers and Provide Help
There is a Framework and Process for Exchanging
Information

LEAN SUPPLY CHAIN (Continued)
Supplying the Parts:
System for Establishing Price & Cost (Market Price
Minus vs. Supplier Cost Plus)
Continually Reduce Cost while Improving Quality
Quality: Work with the Suppliers
Share Proprietary Information
Heijunka - Production Smoothing (Assembler &
Supplier
Daily (52%) and Hourly (31%) Deliveries
Use of VE and Kaizen

MASS SUPPLY CHAIN
Designing the Parts:
Design Process is Sequential, One-Step at at Time
Suppliers Given Drawings and Asked for Bids
Given Quality Targets and Delivery Schedule
Contract Key Elements (Price, Quality, Reliability,
and Contract Length)
Supplier Buys-In and Makes Up on the Next
Contract
Suppliers Have No Contract with One Another

MASS SUPPLY CHAIN (Continued)
Supplying the Parts:
Purchasing Worries About Cost not Production
Many Suppliers
Debugging Process After Production (Running
Changes)
Often Don’t Meet Quality Targets (Ignore or
Cancel)
Fluctuating Markets (Keep Buffers)
Cost Estimating Difficult
Effort to Keep Supplier Profits Low
Cost Continue to Rise

LEAN DISTRIBUTION
Distribution Channels for Specific Models
Established Link Between Customer and Assembler
Use of Fully Trained Teams
Sell Door-to-Door
Daily Meetings to Solve Problems and Improve
Custom Orders with Delivery within 10 Days
Very Accurate Build Schedule
Closer Handle on Trends with Flexibility to Change
Production Smoothing
Done by Aggressive Selling
Success: Market Share
Don’t Ever Loose a Customer
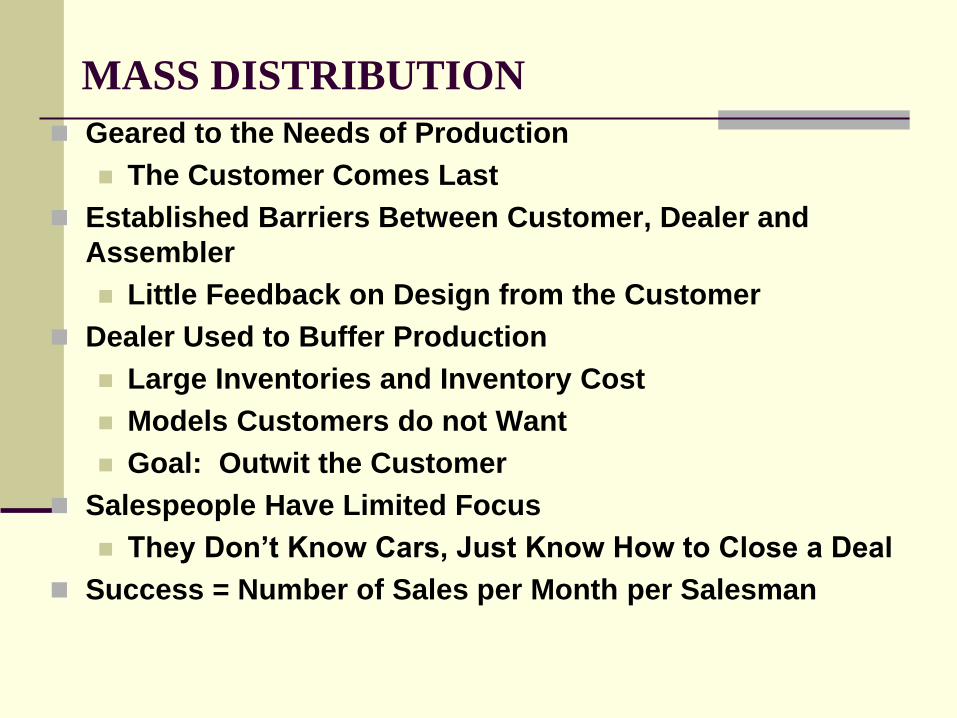
MASS DISTRIBUTION
Geared to the Needs of Production
The Customer Comes Last
Established Barriers Between Customer, Dealer and
Assembler
Little Feedback on Design from the Customer
Dealer Used to Buffer Production
Large Inventories and Inventory Cost
Models Customers do not Want
Goal: Outwit the Customer
Salespeople Have Limited Focus
They Don’t Know Cars, Just Know How to Close a Deal
Success = Number of Sales per Month per Salesman

LEAN AIRCRAFT INITIATIVE
3-Year Research at MIT Based on “The
Machine That Changed The World”
Uses Lean Production Principles as a
Starting Point
Aimed at Substantial Improvements in
Industrial Performance
Sponsored by 21 Companies and ASC
All Aircraft Industry Sectors (Airframe,
Engine, Avionics and Equipment)

STRUCTURE and PROCESS EXECUTIVE
BOARD
WORKING
GROUP
Development Process
Factory Operations
Supplier relations
Human Resources
Policy and External Environment
A
B
C
D
E
Focus
Group Workshops
Research Projects
Research Teams
Research Reports
Service Acquisition Execs,
ASC/CC, WL/MT, DARPA
18 Industry Executives
2 Union Officials
TIME

LEAN THINKING “Value Stream”
Value is defined by the Customer
- Start with the Customer’s Key Characteristics
Value is created by the Producer
- Often hears “the Voice of the Engineer”not the customer
Value Stream : the set of all actions required to
bring a product through three critical
management tasks:
- Problem Solving:
- Information Management:
- Physical Transformation:

LEAN THINKING (Five Principles)
Organizations accurately specify value
The entire value stream is identified
Make value creating steps flow
continuously
Let customers pull value from the
enterprise
Perfection….becomes possible
(Hoshin Planning)

Hoshin Planning Tools STEPS 1 2 3 4 5 6
QC Tools Aim Plan Do Do Do Check/Act Check/Act Fishbone
Pareto
Line
Flow
Check Sheet
Histogram
Control
Mgmt Tools KJ
ID
Tree
Matrix
PDPC
Arrow
Alignment Tools
Flag
Target/Means
Cascading
T/M Tree
QFD

NEXT STEPS