Embed Size (px)
Citation preview
www.LeanSigmaCorporation.com1
© Lean Sigm
a Corporation
Lean Six Sigma Training -SXL
Lean Six Sigma Yellow Belt Training Featuring Examples from SigmaXL
www.LeanSigmaCorporation.com
Standard License AgreementUnless you have a confirmed superseding license agreement with Lean Sigma Corporation, this standard license shall govern your use of this content.
This Standard License Agreement (“License”) is made effective as of the date of purchase of your product from Lean Sigma Corporation. This license will be in effect for all Lean Sigma Corporation products unless superseded by another license agreement accompanying a Lean Sigma Corporation product. In this License Agreement, the party who is granting the right to use the licensed property will be referred to as “Lean Sigma Corporation” and the party who is receiving the right to use the licensed property will be referred to as “the Purchaser”.The parties agree as follows:1. GRANT OF LICENSE: Lean Sigma Corporation owns Six Sigma Training Materials (“Courseware”). In accordance with this License, Lean Sigma Corporation grants the Purchaser a non-exclusive license to use the purchased Courseware for his or her own personal learning & development. At no time may the Purchaser distribute, assign or transfer the Courseware.Lean Sigma Corporation retains title and ownership of the Courseware.2. DISTRIBUTION & RESALE RESTRICTIONS: The Courseware may be printed and distributed in printed format but not resold as a printed product without the express written consent of the Lean Sigma Corporation. The Courseware may not be distributed or sold in any electronic format to any person or entity unless written permission from Lean Sigma Corporation is obtained. The Courseware may not be stored on any webservers for display on any website, blog or other electronic medium used for broad publication.3. MODIFICATIONS: Unless the prior written approval of Lean Sigma Corporation is obtained, the Purchaser may not modify or change the Courseware in any manner.4. WARRANTIES: Neither party makes any warranties with respect to the use, sale or other transfer of the Courseware by the otherparty or by any third party, and the Purchaser accepts the product “AS IS.” In no event will Lean Sigma Corporation be liable for direct, indirect, special, incidental, or consequential damages, that are in any way related to the Courseware.5 TRANSFER OF RIGHTS: This License shall be binding on any successors of the parties. Neither party shall have the right to assign its interests in this Agreement to any other party, unless the prior written consent of the other party is obtained. 2
© Lean Sigm
a Corporation
Lean Six Sigma Training -SXL
www.LeanSigmaCorporation.com
1.0 Define Phase
3
© Lean Sigm
a Corporation
Lean Six Sigma Training -SXL

www.LeanSigmaCorporation.com
1.1 Overview of Six Sigma
4
© Lean Sigm
a Corporation
Lean Six Sigma Training -SXL

www.LeanSigmaCorporation.com
Yellow Belt Training: Define Phase1.1 Six Sigma Overview
1.1.1 What is Six Sigma1.1.2 Six Sigma History1.1.3 Six Sigma Approach Y = f(x)1.1.4 Six Sigma Methodology1.1.5 Roles and Responsibilities
1.2 Six Sigma Fundamentals1.2.1 Defining a Process1.2.2 VOC and CTQs1.2.3 QFD1.2.4 Cost of Poor Quality (COPQ)1.2.5 Pareto Analysis (80 : 20 rule)
1.3 Lean Six Sigma Projects1.3.1 Six Sigma Metrics1.3.2 Business Case and Charter1.3.3 Project Team Selection1.3.4 Project Risk Management1.3.5 Project Planning
1.4 Lean Fundamentals1.4.1 Lean and Six Sigma1.4.2 History of Lean1.4.3 The Seven Deadly Muda1.4.4 Five-S (5S)
5
© Lean Sigm
a Corporation
Lean Six Sigma Training -SXL
www.LeanSigmaCorporation.com
1.1.1 What is Six Sigma
6
© Lean Sigm
a Corporation
Lean Six Sigma Training -SXL
www.LeanSigmaCorporation.com
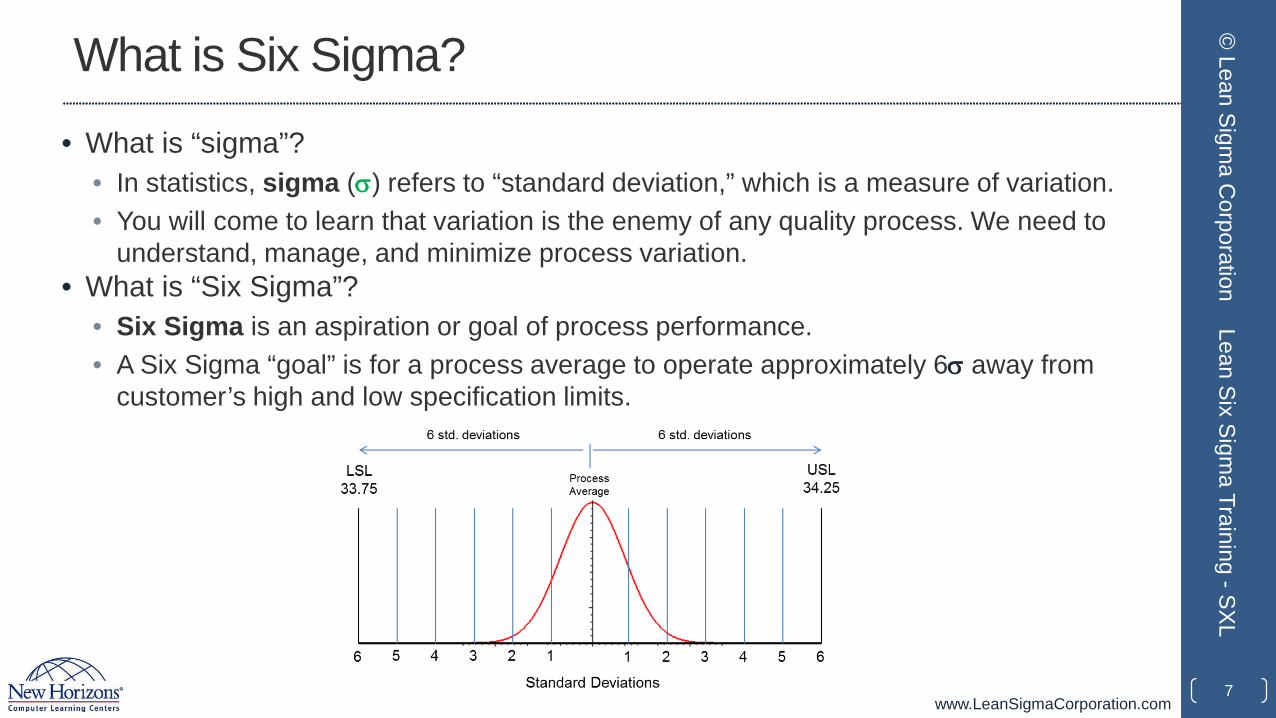
What is Six Sigma?• What is “sigma”?
• In statistics, sigma (σ) refers to “standard deviation,” which is a measure of variation.• You will come to learn that variation is the enemy of any quality process. We need to
understand, manage, and minimize process variation.• What is “Six Sigma”?
• Six Sigma is an aspiration or goal of process performance.• A Six Sigma “goal” is for a process average to operate approximately 6σ away from
customer’s high and low specification limits.
7
© Lean Sigm
a Corporation
Lean Six Sigma Training -SXL
www.LeanSigmaCorporation.com
What is Six Sigma?
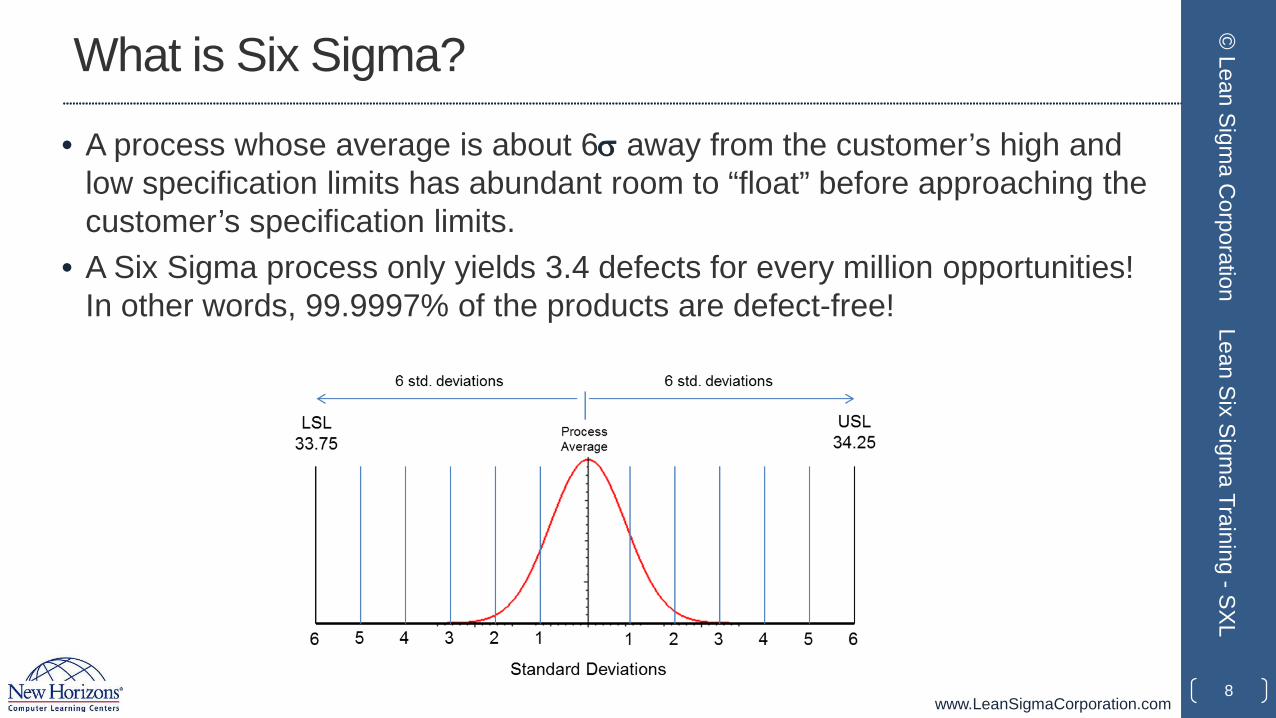
• A process whose average is about 6σ away from the customer’s high and low specification limits has abundant room to “float” before approaching the customer’s specification limits.
• A Six Sigma process only yields 3.4 defects for every million opportunities! In other words, 99.9997% of the products are defect-free!
8
© Lean Sigm
a Corporation
Lean Six Sigma Training -SXL
www.LeanSigmaCorporation.com
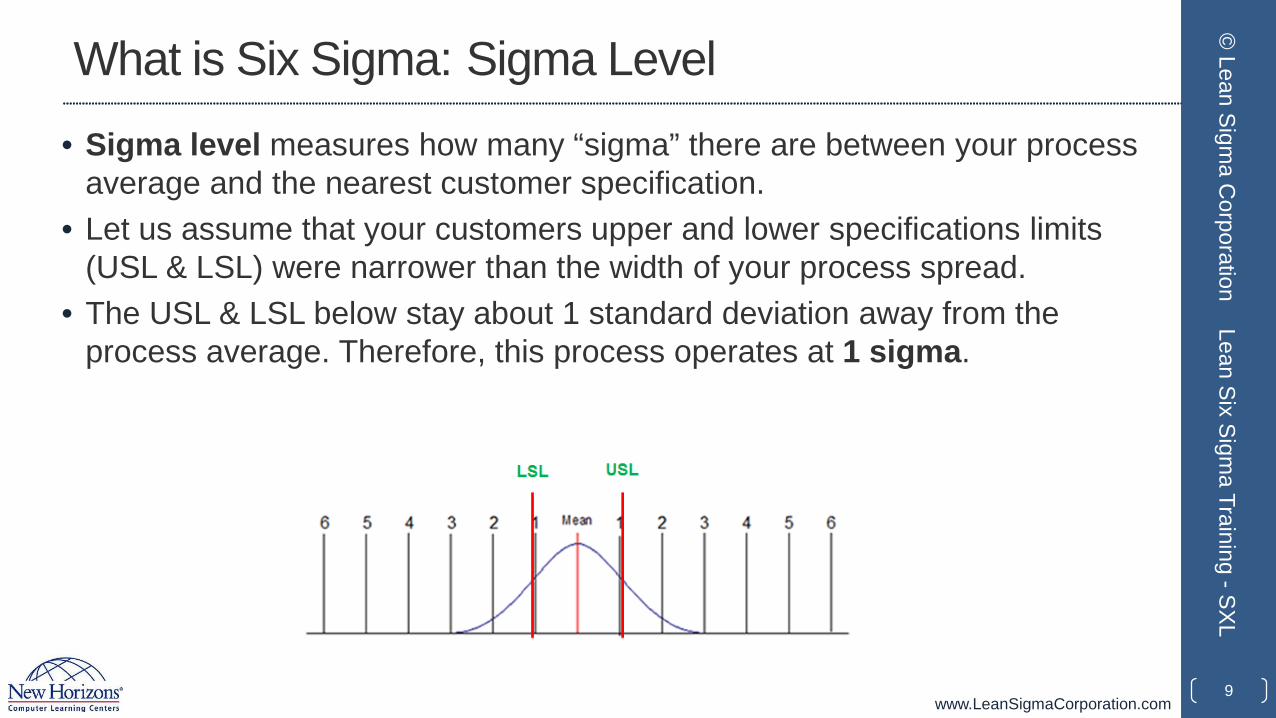
What is Six Sigma: Sigma Level• Sigma level measures how many “sigma” there are between your process
average and the nearest customer specification.• Let us assume that your customers upper and lower specifications limits
(USL & LSL) were narrower than the width of your process spread.• The USL & LSL below stay about 1 standard deviation away from the
process average. Therefore, this process operates at 1 sigma.
9
© Lean Sigm
a Corporation
Lean Six Sigma Training -SXL
www.LeanSigmaCorporation.com
What is Six Sigma: Sigma Level• A process operating at 1 sigma has a defect rate of approximately 70%.
• This means that the process will generate defect-free products only 30% of the time.
• What about processes with more than 1 sigma level?
• A higher sigma level means a lower defect rate.
• Let us take a look at the defect rates of processes at different sigma levels.
10
© Lean Sigm
a Corporation
Lean Six Sigma Training -SXL
www.LeanSigmaCorporation.com
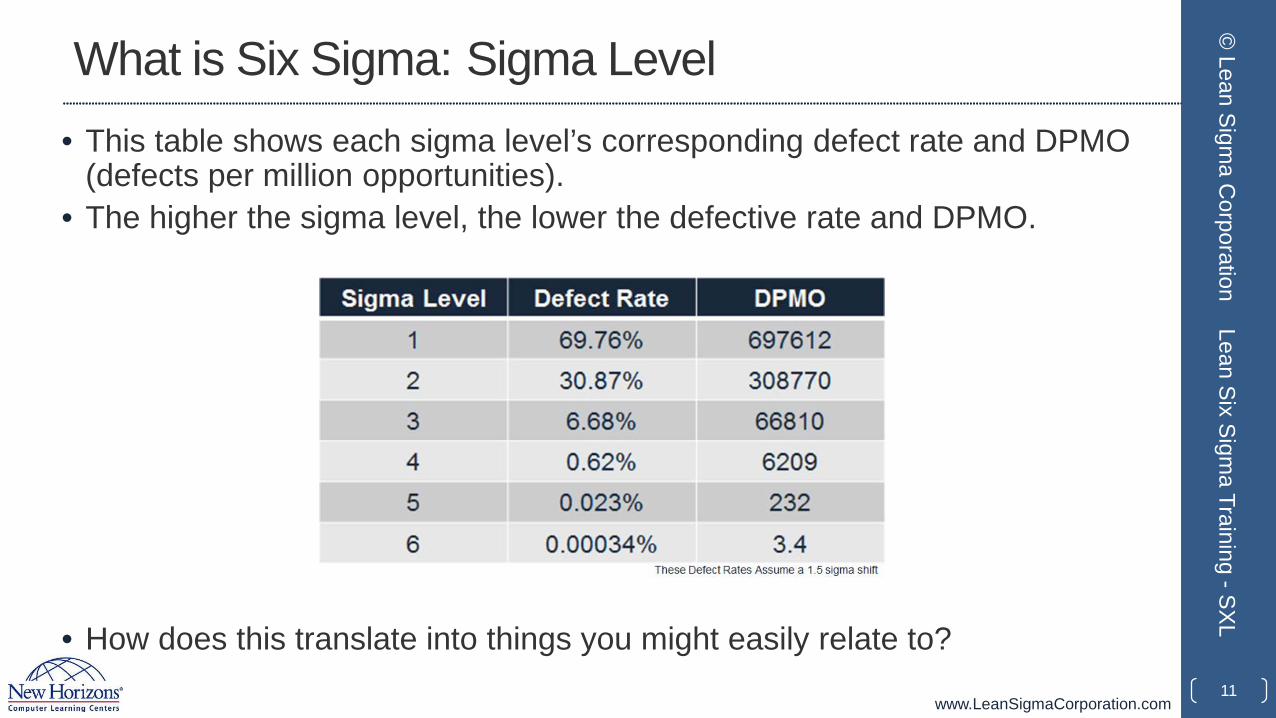
What is Six Sigma: Sigma Level• This table shows each sigma level’s corresponding defect rate and DPMO
(defects per million opportunities).• The higher the sigma level, the lower the defective rate and DPMO.
• How does this translate into things you might easily relate to?11
© Lean Sigm
a Corporation
Lean Six Sigma Training -SXL
www.LeanSigmaCorporation.com
What is Six Sigma: Sigma Level• Let us take a look at processes operating at 3 sigma.• 3 sigma processes have a defect rate of approximately 7%. What would
happen if processes operated at 3 sigma?• Virtually no modern computer would function*.• 10,800,000 health care claims would be mishandled each year.• 18,900 US savings bonds would be lost every month.• 54,000 checks would be lost each night by a single large bank.• 4,050 invoices would be sent out incorrectly each month by a modest-sized
telecommunications company.• 540,000 erroneous call details would be recorded each day from a regional
telecommunications company.• 270 million erroneous credit card transactions would be recorded each year in
the United States.
12
© Lean Sigm
a Corporation
Lean Six Sigma Training -SXL
(*http://www.qualityamerica.com)
www.LeanSigmaCorporation.com
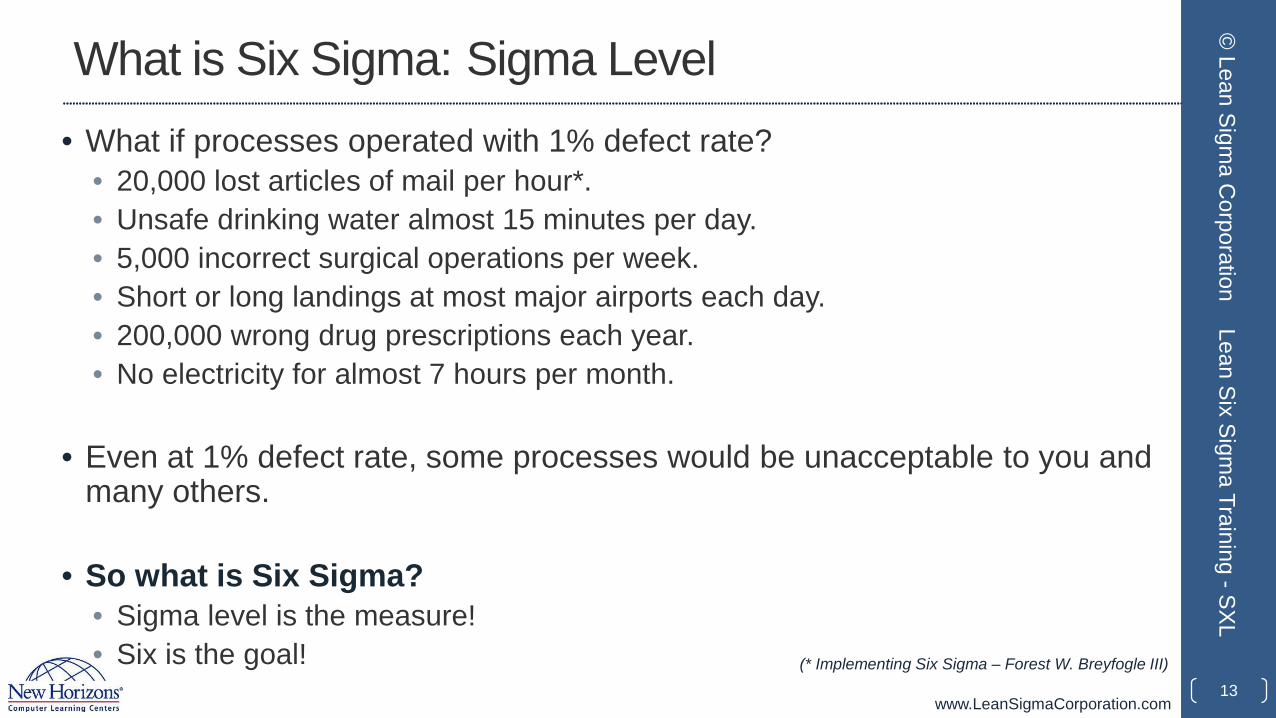
What is Six Sigma: Sigma Level• What if processes operated with 1% defect rate?
• 20,000 lost articles of mail per hour*.• Unsafe drinking water almost 15 minutes per day.• 5,000 incorrect surgical operations per week.• Short or long landings at most major airports each day.• 200,000 wrong drug prescriptions each year.• No electricity for almost 7 hours per month.
• Even at 1% defect rate, some processes would be unacceptable to you and many others.
• So what is Six Sigma?• Sigma level is the measure!• Six is the goal!
13
© Lean Sigm
a Corporation
Lean Six Sigma Training -SXL
(* Implementing Six Sigma – Forest W. Breyfogle III)
www.LeanSigmaCorporation.com
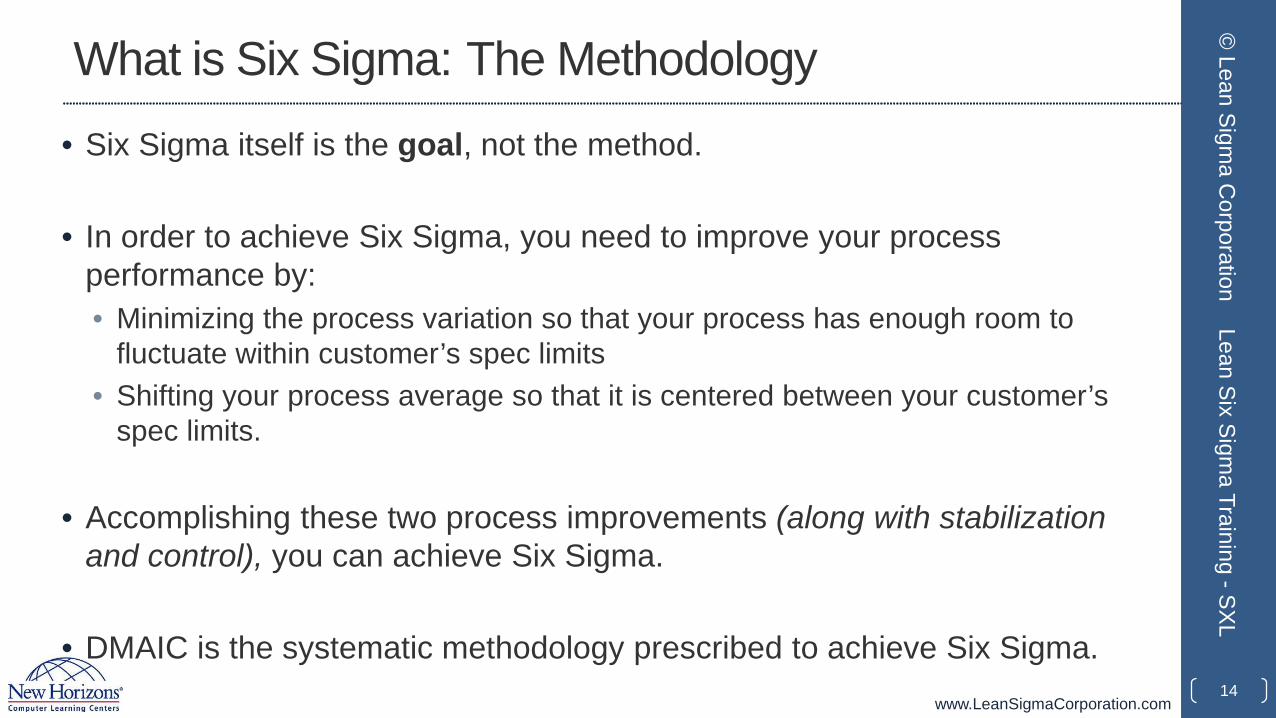
What is Six Sigma: The Methodology• Six Sigma itself is the goal, not the method.
• In order to achieve Six Sigma, you need to improve your process performance by:• Minimizing the process variation so that your process has enough room to
fluctuate within customer’s spec limits • Shifting your process average so that it is centered between your customer’s
spec limits.
• Accomplishing these two process improvements (along with stabilization and control), you can achieve Six Sigma.
• DMAIC is the systematic methodology prescribed to achieve Six Sigma.14
© Lean Sigm
a Corporation
Lean Six Sigma Training -SXL
www.LeanSigmaCorporation.com
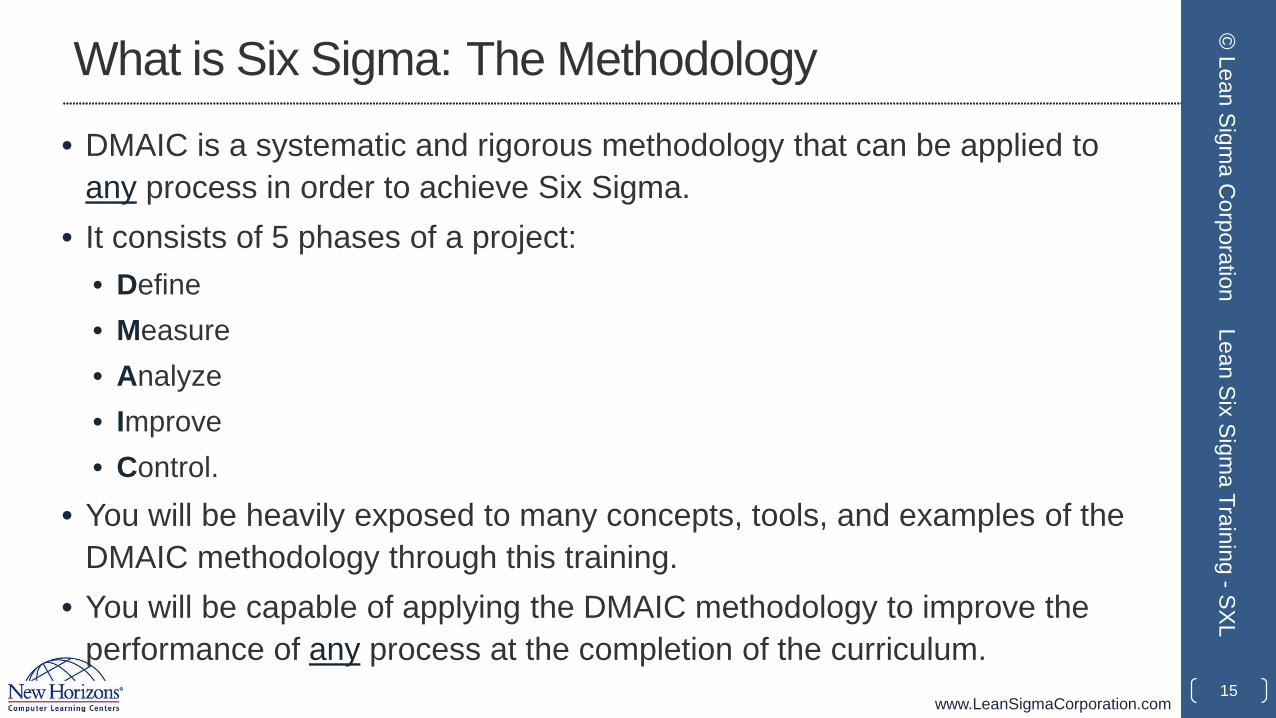
What is Six Sigma: The Methodology• DMAIC is a systematic and rigorous methodology that can be applied to
any process in order to achieve Six Sigma.• It consists of 5 phases of a project:
• Define• Measure• Analyze• Improve• Control.
• You will be heavily exposed to many concepts, tools, and examples of the DMAIC methodology through this training.
• You will be capable of applying the DMAIC methodology to improve the performance of any process at the completion of the curriculum.
15
© Lean Sigm
a Corporation
Lean Six Sigma Training -SXL
www.LeanSigmaCorporation.com
1.1.2 Six Sigma History
16
© Lean Sigm
a Corporation
Lean Six Sigma Training -SXL
www.LeanSigmaCorporation.com
Six Sigma History
17
© Lean Sigm
a Corporation
Lean Six Sigma Training -SXL
Polaroid
www.LeanSigmaCorporation.com
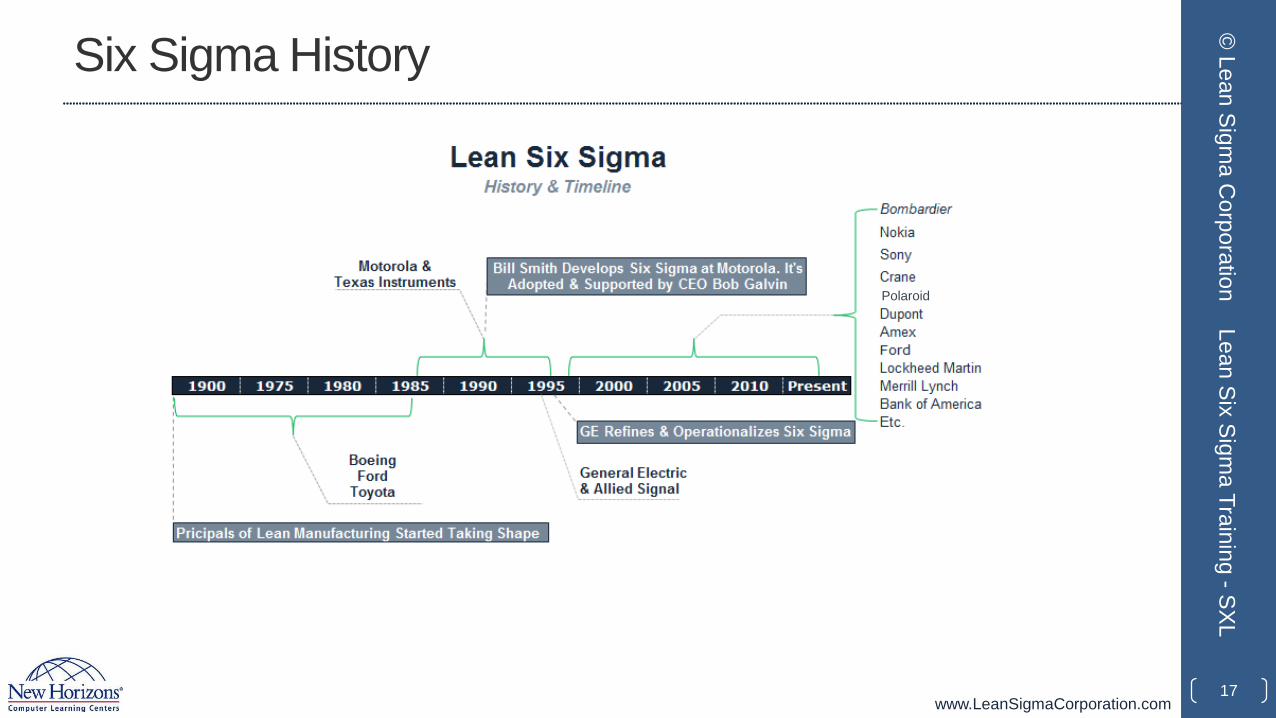
Six Sigma History
• The “Six Sigma” terminology was originally adopted by Bill Smith at Motorola in the late 1980s as a quality management methodology.
• As the “Father of Six Sigma,” Bill forged the path for Six Sigma through Motorola’s CEO Bob Galvin who strongly supported Bill’s passion and efforts.
• Starting from the late 1980s, Motorola extensively applied Six Sigma as a process management discipline throughout the company, leveraging Motorola University.
• In 1988, Motorola was recognized with the prestigious Malcolm Baldrige National Quality Award for its achievements in quality improvement.
18
© Lean Sigm
a Corporation
Lean Six Sigma Training -SXL
www.LeanSigmaCorporation.com
Six Sigma History
• Six Sigma has been widely adopted by companies as an efficient way of improving the business performance since General Electric implemented the methodology under the leadership of Jack Welch in the 1990s.
• As GE connected Six Sigma results to its executive compensation and published the financial benefits of Six Sigma implementation in their annual report, Six Sigma became a highly sought-after discipline of quality.
19
© Lean Sigm
a Corporation
Lean Six Sigma Training -SXL
www.LeanSigmaCorporation.com
Six Sigma History
• Most Six Sigma programs cover the aspects, tools, and topics of Lean or Lean Manufacturing.
• The two work hand in hand, benefitting each other.• Six Sigma focuses on minimizing process variability, shifting the process
average, and delivering within customer’s specification limits.• Lean focuses on eliminating waste and increasing efficiency.
• Lean and its popularity began to form and gain significant traction in the mid 1960s with the Toyota initiative “TPS” or Toyota Production System.
• The concepts and methodology of Lean, however, were fundamentally applied much earlier by both Ford and Boeing in the early 1900s.
20
© Lean Sigm
a Corporation
Lean Six Sigma Training -SXL
www.LeanSigmaCorporation.com
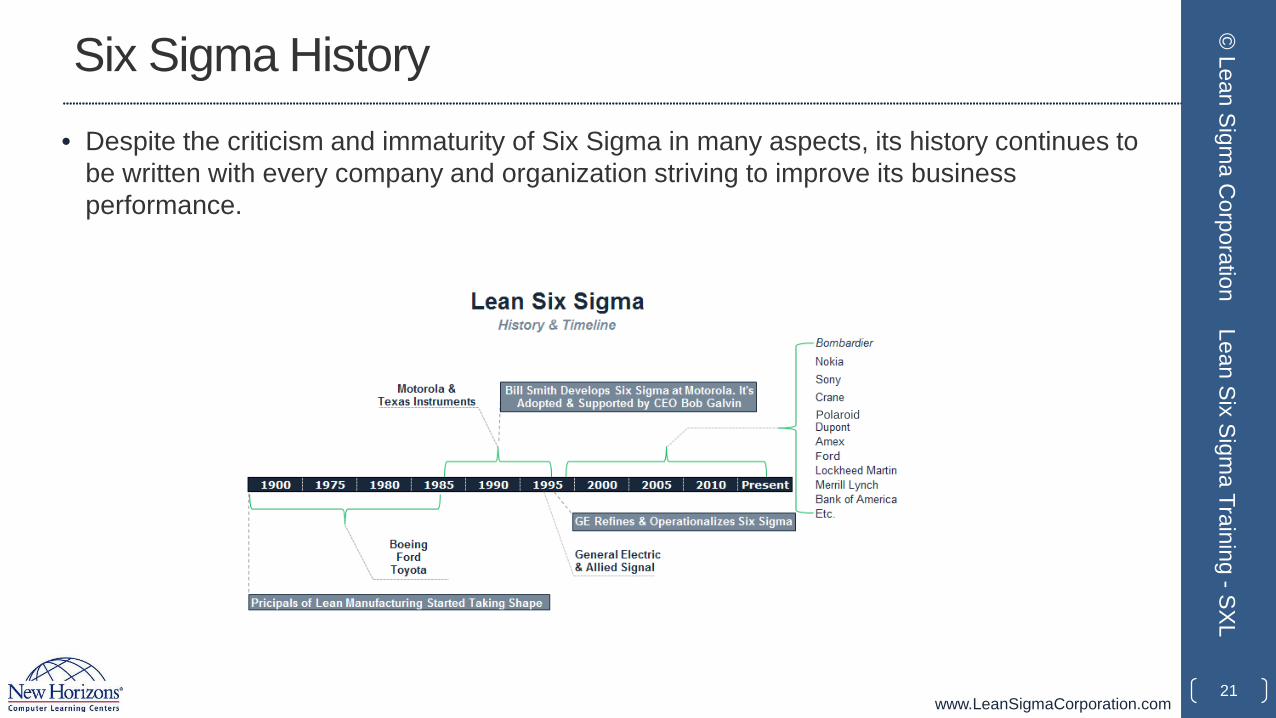
Six Sigma History• Despite the criticism and immaturity of Six Sigma in many aspects, its history continues to
be written with every company and organization striving to improve its business performance.
21
© Lean Sigm
a Corporation
Lean Six Sigma Training -SXL
Polaroid

www.LeanSigmaCorporation.com
1.1.3 Six Sigma Approach
22
© Lean Sigm
a Corporation
Lean Six Sigma Training -SXL
www.LeanSigmaCorporation.com
Six Sigma Approach: Y = f(x)
• The Six Sigma approach to problem solving uses a transfer function.
• A transfer function is a mathematical expression of the relationship between the inputs and outputs of a system.
• Y = f(x) is the relational transfer function that is used by all Six Sigma practitioners.
• It is absolutely critical that you understand and embrace this concept.
23
© Lean Sigm
a Corporation
Lean Six Sigma Training -SXL
www.LeanSigmaCorporation.com
Six Sigma Approach: Y = f(x)
• “Y” refers to the measure or output of a process.• Y is usually your primary metric• Y is the measure of process performance that you are trying to improve.
• f(x) means “function of x.”• x’s are factors or inputs that affect the Y
• Combined, the Y = f(x) statement reads “Y is a function of x.”• In simple terms: “My process performance is dependent on certain x’s.”• The objective in a Six Sigma project is to identify the critical x’s that have
the most influence on the output (Y) and adjust them so that the Y improves.
24
© Lean Sigm
a Corporation
Lean Six Sigma Training -SXL
www.LeanSigmaCorporation.com
Six Sigma Approach: Y = f(x)
• Let us look at a simple example of a pizza delivery company that desires to meet customer expectations of on-time delivery.• Measure = on-time pizza deliveries
• Y = percent of on-time deliveries• f(x) would be the x’s or factors that heavily influence timely deliveries
• x1: might be traffic• x2: might be the number of deliveries per driver dispatch• x3: might be the accuracy of directions provided to the driver• x4: might be the reliability of the delivery vehicle• etc.
• The statement Y = f(x) in this example will refer to the proven x’s determined through the steps of a Six Sigma project.
25
© Lean Sigm
a Corporation
Lean Six Sigma Training -SXL
www.LeanSigmaCorporation.com
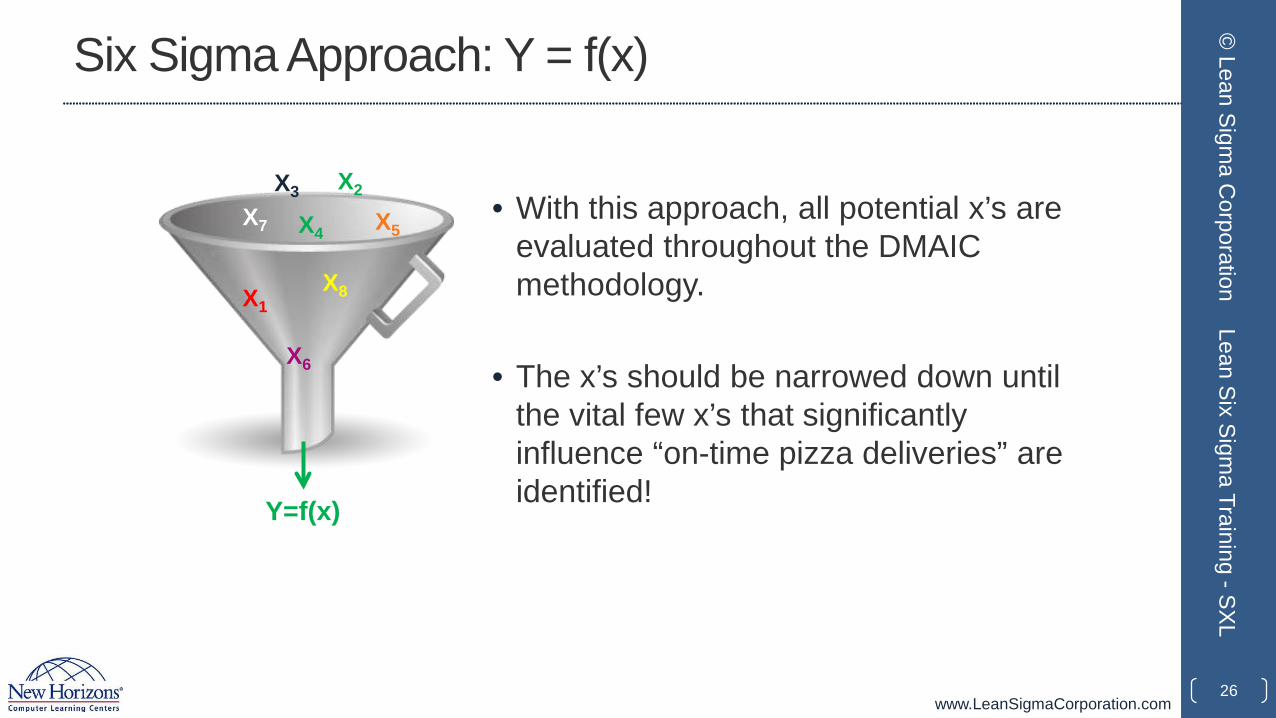
Six Sigma Approach: Y = f(x)
• With this approach, all potential x’s are evaluated throughout the DMAIC methodology.
• The x’s should be narrowed down until the vital few x’s that significantly influence “on-time pizza deliveries” are identified!
26
© Lean Sigm
a Corporation
Lean Six Sigma Training -SXL
Y=f(x)
X8
X6
X1
X5X7 X4
X3 X2
www.LeanSigmaCorporation.com
Six Sigma Approach: Y = f(x)
• This approach to problem solving will take you through the process of determining all potential x’s that might influence on-time deliveries and then determining through measurements and analysis which x’s do influence on-time deliveries.
• Those significant x’s become the ones used in the Y = f(x) equation.
• The Y = f(x) equation is a very powerful concept and requires the ability to measure your output and quantify your inputs.
• Measuring process inputs and outputs is crucial to effectively determining the significant influences to any process.
27
© Lean Sigm
a Corporation
Lean Six Sigma Training -SXL
www.LeanSigmaCorporation.com
1.1.4 Six Sigma Methodology
28
© Lean Sigm
a Corporation
Lean Six Sigma Training -SXL
www.LeanSigmaCorporation.com
Six Sigma Methodology
• Six Sigma follows a methodology that is conceptually rooted in the principles of a five-phase project.
• Each phase has a specific purpose and specific tools and techniques that aid in achieving the phase objectives.
• The 5 phases of DMAIC:1. Define2. Measure3. Analyze4. Improve5. Control
29
© Lean Sigm
a Corporation
Lean Six Sigma Training -SXL
www.LeanSigmaCorporation.com
Six Sigma Methodology
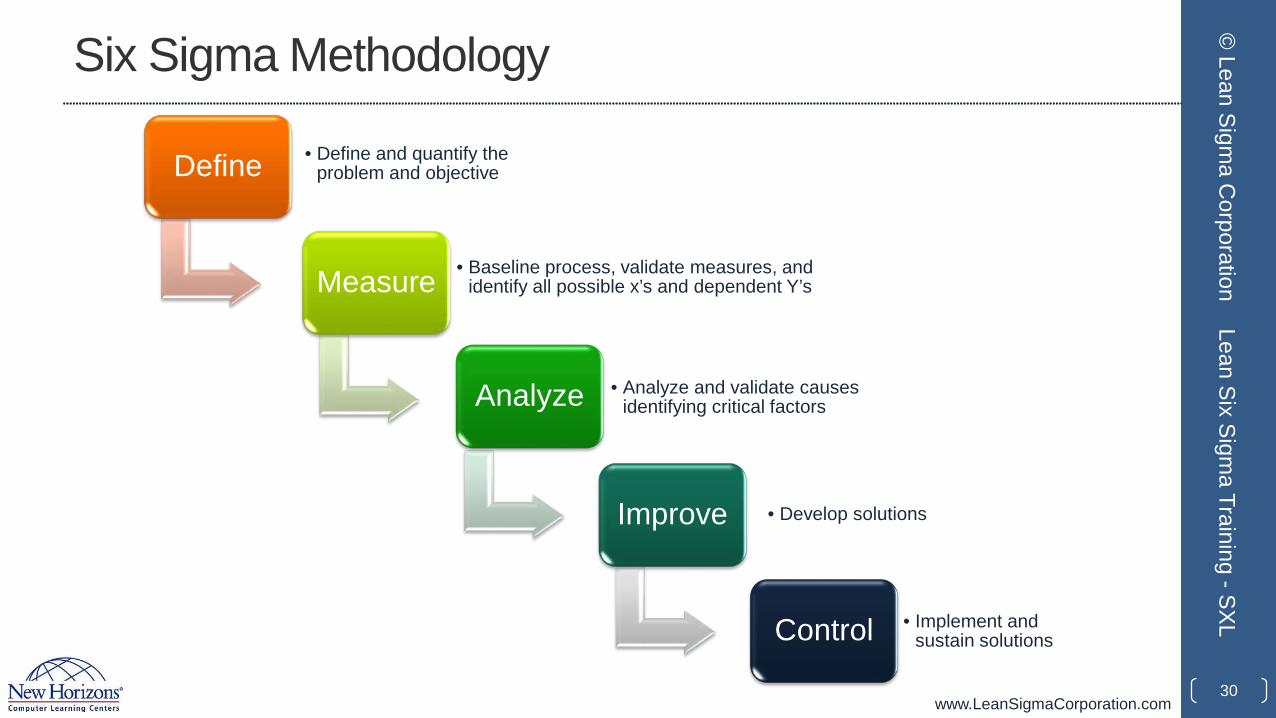
Define • Define and quantify the problem and objective
Measure • Baseline process, validate measures, and identify all possible x’s and dependent Y’s
Analyze • Analyze and validate causes identifying critical factors
Improve • Develop solutions
Control • Implement and sustain solutions
30
© Lean Sigm
a Corporation
Lean Six Sigma Training -SXL
www.LeanSigmaCorporation.com
Six Sigma Methodology: Define Phase• The goal of the Define phase is to establish a solid foundation and business case
for a Six Sigma project.
• Define is arguably the most important aspect of any Six Sigma project.
• All successful projects start with a current state challenge or problem that can be articulated in a quantifiable manner. • It is not enough to just know the problem, you must quantify it and also determine the
goal.
• Once problems and goals are identified and quantified, the rest of the define phase will be about valuation, team, scope, project planning, timeline, stakeholders, Voice Of the Customer (VOC), and Voice Of the Business (VOB).
31
© Lean Sigm
a Corporation
Lean Six Sigma Training -SXL
www.LeanSigmaCorporation.com
Six Sigma Methodology: Define Phase• Define Phase Tools and Deliverables
• Project Charter – Establish the: • Business Case• Problem Statement• Project Objective• Project Scope• Project Timeline• Project Team.
• Stakeholder Assessment• High-Level Pareto Chart Analysis• High-Level Process Map• VOC/VOB and CTQs Identified and Defined• Financial Assessment
32
© Lean Sigm
a Corporation
Lean Six Sigma Training -SXL
www.LeanSigmaCorporation.com
Six Sigma Methodology: Measure Phase• The goal of the Measure phase is to gather baseline information about the
process (process performance, inputs, measurements, customer expectations etc.).
• Throughout the Measure phase you will seek to achieve a few important objectives:• Gather All Possible x's• Assess Measurement System and Data Collection Requirements• Validate Assumptions• Validate Improvement Goals• Determine COPQ (Cost of Poor Quality)• Refine Process Understanding• Determine Process Stability• Determine Process Capability.
33
© Lean Sigm
a Corporation
Lean Six Sigma Training -SXL

www.LeanSigmaCorporation.com
Six Sigma Methodology: Measure Phase• Measure Phase Tools and Deliverables
• Process Maps, SIPOC, Value Stream Maps• Failure Modes and Effects Analysis (FMEA)• Cause-and-Effect Diagram• XY Matrix• Six Sigma Statistics
• Basic Statistics• Descriptive Statistics
• Measurement Systems Analysis • Variable and/or Attribute Gage R&R • Gage Linearity and Accuracy or Stability
• Basic Control Charts• Process Capability (Cpk, Ppk) and Sigma Levels• Data Collection Plan 34
© Lean Sigm
a Corporation
Lean Six Sigma Training -SXL
www.LeanSigmaCorporation.com
Six Sigma Methodology: Analyze Phase• The Analyze phase is all about establishing verified drivers.
• In the DMAIC methodology, the Analyze phase uses statistics and higher-order analytics to discover relationships between process performance and process inputs (in other words, what are the root causes or drivers of the improvement effort).
• Ultimately, the Analyze phase establishes a reliable hypothesis for improvement solutions. • Establish the Transfer Function Y = f(x)• Validate the List of Critical x's and Impacts• Create a Beta Improvement Plan (e.g., pilot plan).
35
© Lean Sigm
a Corporation
Lean Six Sigma Training -SXL
www.LeanSigmaCorporation.com
Six Sigma Methodology: Analyze Phase• Analyze Phase Tools and Deliverables
• The Analyze phase is about proving and validating critical x’s using the appropriate and necessary analysis techniques. Examples include:• Hypothesis Testing
• Parametric and Non-Parametric• Regression
• Simple Linear Regression• Multiple Linear Regression
• The Analyze phase is also about establishing a set of solution hypotheses to be tested and further validated in the Improve phase.
36
© Lean Sigm
a Corporation
Lean Six Sigma Training -SXL
www.LeanSigmaCorporation.com
Six Sigma Methodology: Improve Phase• The goal of the Improve phase is. . .you guessed it! "make the
improvement." Improve is about designing, testing, and implementing your solution.
• To this point you have defined the problem and objective of the project, brainstormed possible x's, analyzed and verified critical x's. Now it's time to make it real!• Statistically Proven Results from Active Study/Pilot• Improvement/Implementation Plan• Updated Stakeholder Assessment• Revised Business Case with Return on Investment (ROI)• Risk Assessment/Updated FMEA• New Process Capability and Sigma.
37
© Lean Sigm
a Corporation
Lean Six Sigma Training -SXL
www.LeanSigmaCorporation.com
Six Sigma Methodology: Improve Phase• Improve Phase Tools and Deliverables
• Any Appropriate Tool from Previous Phases
• Design of Experiment (DOE)• Full Factorial• Fractional Factorial
• Pilot or Planned Study Using:• Hypothesis Testing• Valid Measurement Systems
• Implementation Plan
38
© Lean Sigm
a Corporation
Lean Six Sigma Training -SXL
www.LeanSigmaCorporation.com
Six Sigma Methodology: Control Phase
• The last of the 5 core phases of the DMAIC methodology is the Controlphase.
• The goal of the Control phase is to establish automated and managed mechanisms to maintain and sustain your improvement.
• A successful control plan also establishes a reaction and mitigation plan as well as an accountability structure.
39
© Lean Sigm
a Corporation
Lean Six Sigma Training -SXL
www.LeanSigmaCorporation.com
Six Sigma Methodology: Control Phase
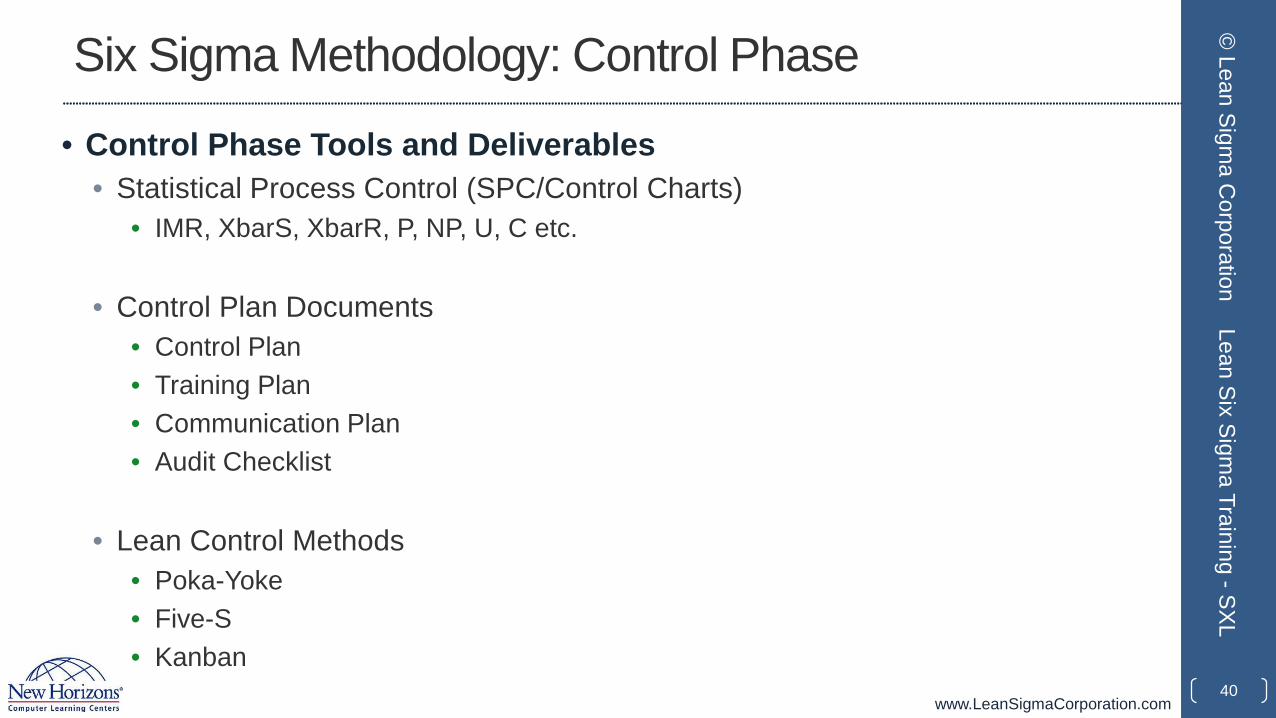
• Control Phase Tools and Deliverables• Statistical Process Control (SPC/Control Charts)
• IMR, XbarS, XbarR, P, NP, U, C etc.
• Control Plan Documents• Control Plan• Training Plan• Communication Plan• Audit Checklist
• Lean Control Methods• Poka-Yoke• Five-S• Kanban
40
© Lean Sigm
a Corporation
Lean Six Sigma Training -SXL
www.LeanSigmaCorporation.com
Six Sigma Methodology
41
© Lean Sigm
a Corporation
Lean Six Sigma Training -SXL
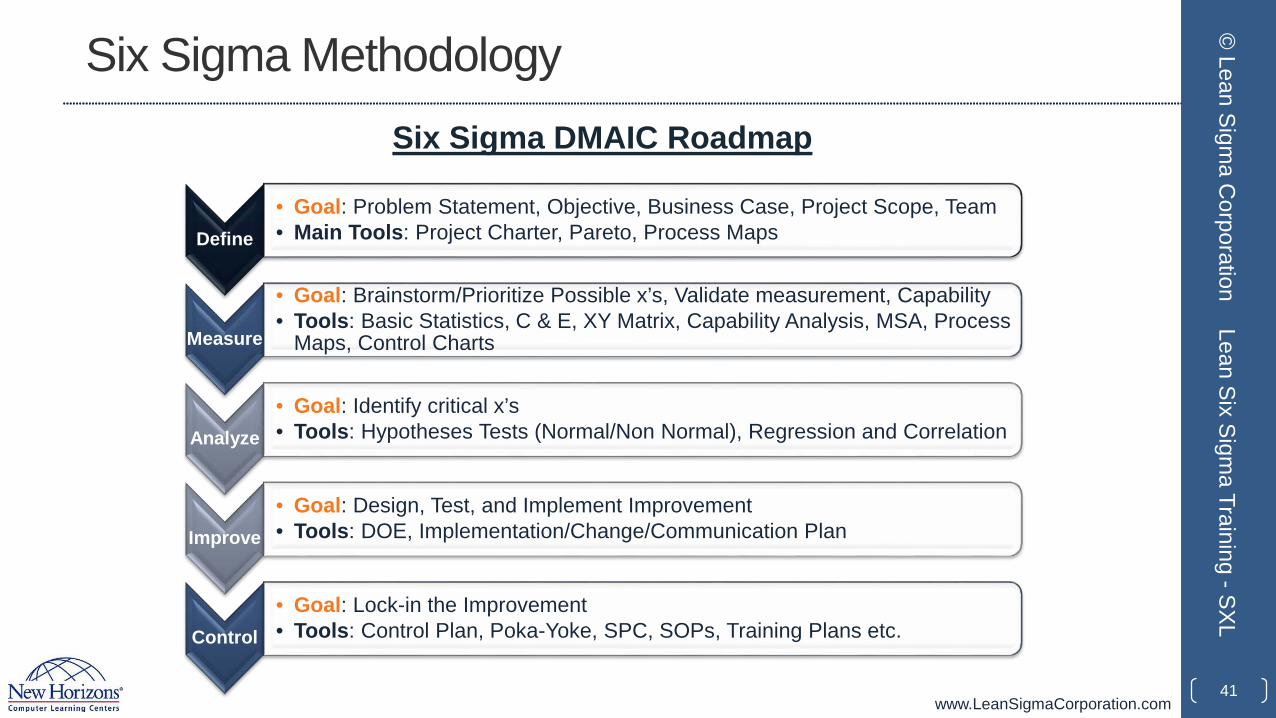
Define• Goal: Problem Statement, Objective, Business Case, Project Scope, Team• Main Tools: Project Charter, Pareto, Process Maps
Measure
• Goal: Brainstorm/Prioritize Possible x’s, Validate measurement, Capability• Tools: Basic Statistics, C & E, XY Matrix, Capability Analysis, MSA, Process
Maps, Control Charts
Analyze• Goal: Identify critical x’s• Tools: Hypotheses Tests (Normal/Non Normal), Regression and Correlation
Improve• Goal: Design, Test, and Implement Improvement• Tools: DOE, Implementation/Change/Communication Plan
Control• Goal: Lock-in the Improvement• Tools: Control Plan, Poka-Yoke, SPC, SOPs, Training Plans etc.
Six Sigma DMAIC Roadmap
www.LeanSigmaCorporation.com
1.1.5 Roles and Responsibilities
42
© Lean Sigm
a Corporation
Lean Six Sigma Training -SXL
www.LeanSigmaCorporation.com
Roles and Responsibilities
• The various roles in a Six Sigma program are commonly referred to as “Belts.”
• In addition to Belts, there are also other key roles with specific responsibilities.
• Let us explore the different roles and their corresponding responsibilities in a Six Sigma program.
43
© Lean Sigm
a Corporation
Lean Six Sigma Training -SXL
www.LeanSigmaCorporation.com
Expert
Novice
Roles and Responsibilities
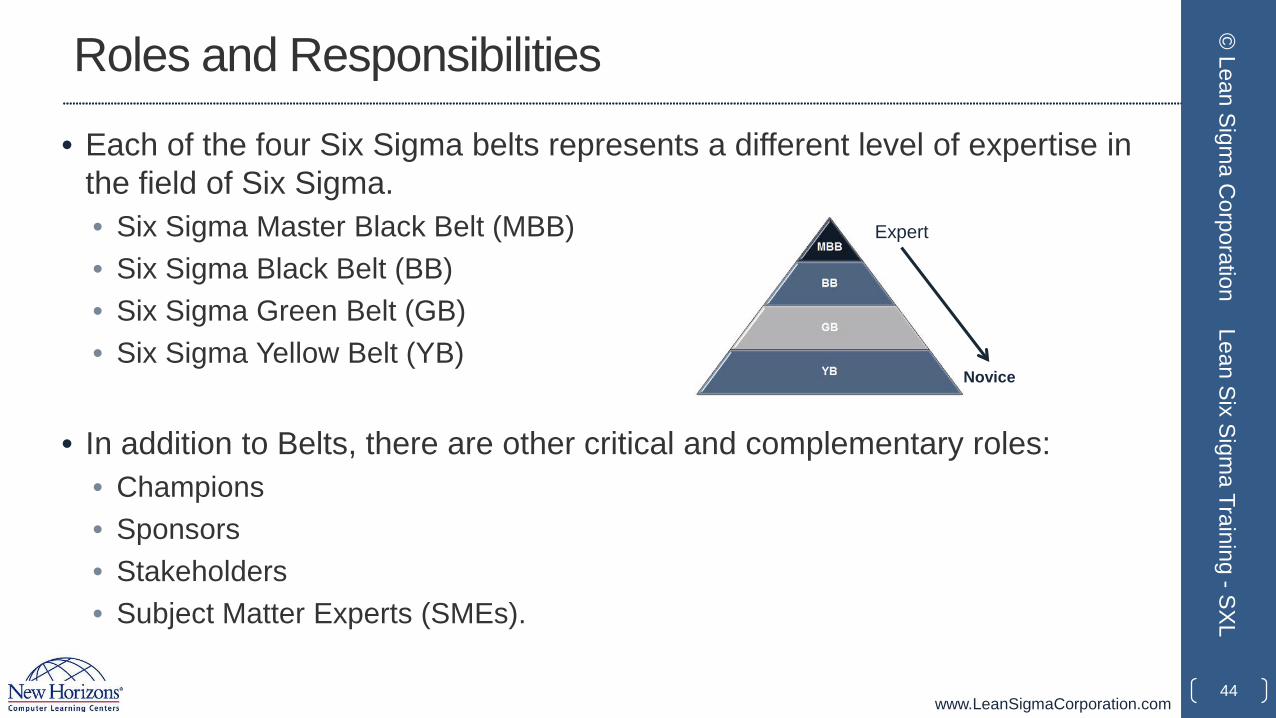
• Each of the four Six Sigma belts represents a different level of expertise in the field of Six Sigma. • Six Sigma Master Black Belt (MBB)• Six Sigma Black Belt (BB)• Six Sigma Green Belt (GB)• Six Sigma Yellow Belt (YB)
• In addition to Belts, there are other critical and complementary roles:• Champions• Sponsors• Stakeholders• Subject Matter Experts (SMEs).
44
© Lean Sigm
a Corporation
Lean Six Sigma Training -SXL
www.LeanSigmaCorporation.com
Roles and Responsibilities: MBB
• The Master Black Belt (MBB) is the most experienced, educated, and capable Six Sigma expert.
• A typical MBB has managed dozens of Black Belt level projects.
• The MBB can simultaneously lead multiple Six Sigma Belt projects while mentoring and certifying Black Belt and Green Belt candidates.
• The MBB typically works with high-level operations directors, senior executives, and business managers to help with assessing and planning business strategies and tactics.
45
© Lean Sigm
a Corporation
Lean Six Sigma Training -SXL
www.LeanSigmaCorporation.com
Roles and Responsibilities: MBB
• MBB commonly advises management team on the cost of poor quality of an operation and consults on methods to improve business performance.
• Typical Responsibilities of a MBB• Identifies and defines the portfolio of projects required to support a business
strategy• Establishes scope, goals, timelines, and milestones• Assigns and marshals resources• Trains and mentors Green Belts and Black Belts• Facilitates tollgates or checkpoints for Belt candidates• Reports-out/updates stakeholders and executives• Establishes organization’s Six Sigma strategy/roadmap• Leads the implementation of Six Sigma.
46
© Lean Sigm
a Corporation
Lean Six Sigma Training -SXL
www.LeanSigmaCorporation.com
Roles and Responsibilities: BB
• The Black Belt (BB) is the most active and valuable experienced Six Sigma professional among all the Six Sigma Belts.
• A typical BB has • led multiple projects • trained and mentored various Green Belts candidates• understood how to define a problem and drive effective solution.
• The BB is well rounded in terms of project management, statistical analysis, financial analysis, meeting facilitation, prioritization, and a range of other value-added capabilities, which makes a BB highly valuable asset in the business world.
47
© Lean Sigm
a Corporation
Lean Six Sigma Training -SXL
www.LeanSigmaCorporation.com
Roles and Responsibilities: BB
• BBs commonly serves as the dedicated resource continuing their line management role while simultaneously achieving a BB certification.
• Typical Responsibilities of a BB• Project Management
• Defines projects, scope, teams etc.• Marshals resources• Establishes goals, timelines, and milestones• Provides reports and/or updates to stakeholders and executives.
48
© Lean Sigm
a Corporation
Lean Six Sigma Training -SXL
www.LeanSigmaCorporation.com
Roles and Responsibilities: BB
• Typical Responsibilities of a BB (continued)
• Task Management• Establishes the team’s Lean Sigma roadmap• Plans and implements the use of Lean Sigma tools• Facilitates project meetings• Does project management of the team’s work• Manages progress toward objectives.
• Team Management• Chooses or recommend team members• Defines ground rules for the project team• Coaches, mentors, and directs project team• Coaches other Six Sigma Belts• Manages the team’s organizational interfaces.
49
© Lean Sigm
a Corporation
Lean Six Sigma Training -SXL
www.LeanSigmaCorporation.com
Roles and Responsibilities: GB
• The Green Belt (GB) is considered as a less intense version of Six Sigma professional than the Black Belt (BB).
• A GB is exposed to all the comprehensive aspects of Six Sigma with less focus on the statistical theories and some other advanced analytical methodologies such as Design of Experiment (DOE).
• When it comes to project management, a GB has almost the same responsibilities as a BB.
• In general, the GB works on less complicated and challenging business problems than a BB.
50
© Lean Sigm
a Corporation
Lean Six Sigma Training -SXL
www.LeanSigmaCorporation.com
Roles and Responsibilities: GB• Typical Responsibilities of a Green Belt
• Project Management• Defines the project, scope, team etc.• Marshals resources• Sets goals, timelines, and milestones• Reports-out/updates stakeholders and executives.
• Task Management• Establishes the team’s Lean Sigma Roadmap• Plans and implements the use of Lean Sigma tools• Facilitates project meetings• Does Project Management of the team’s work• Manages progress toward objectives.
• Team Management• Chooses or recommends team members• Defines ground rules for the project team• Coaches, mentors, and directs project team• Coaches other Six Sigma Belts• Manages the team’s organizational interfaces.
51
© Lean Sigm
a Corporation
Lean Six Sigma Training -SXL
www.LeanSigmaCorporation.com
Roles and Responsibilities: YB
• The Yellow Belt (YB) understands the basic objectives and methods of a Six Sigma project.
• YB has an elementary understanding about what other Six Sigma Belts (GB, BB, MBB) are doing to help them succeed.
• In a Six Sigma project, YB usually serves as a subject matter expert regarding some aspects of the process or project.
• Supervisors, managers, directors, and sometimes executives are usually trained at the YB level.
52
© Lean Sigm
a Corporation
Lean Six Sigma Training -SXL
www.LeanSigmaCorporation.com
Roles and Responsibilities: YB• Typical Responsibilities of a Yellow Belt
• Helps define process scope and parameters
• Contributes to team selection process
• Assists in information and data collection
• Participates in experiential analysis sessions (FMEA, Process Mapping, Cause and Effect etc.)
• Assists in assessing and developing solutions
• Delivers solution implementations.53
© Lean Sigm
a Corporation
Lean Six Sigma Training -SXL
www.LeanSigmaCorporation.com
Roles and Responsibilities: Champions & Sponsors
• Champions and sponsors are those individuals (directors, executives, managers etc.) chartering, funding, or driving the Six Sigma projects that BBs and GBs are conducting.
• Champions and sponsors need to have a basic understanding of the concepts, tools, and techniques involved in the DMAIC methodology so that they can provide proper support and direction.
54
© Lean Sigm
a Corporation
Lean Six Sigma Training -SXL
www.LeanSigmaCorporation.com
Roles and Responsibilities: Champions & Sponsors
• Champions and sponsors play critical roles in the successful deployment of Six Sigma.
• Strong endorsement of Six Sigma from the leadership team is critical for success.
• Typical Responsibilities of a Champion/Sponsor• Maintains a strategic oversight• Establishes strategy and direction for a portfolio of projects• Clearly defines success • Provides resolution for issues such as resources or politics• Establishes routine tollgates or project reviews• Clears the path for solution implementation• Assists in project team formation.
55
© Lean Sigm
a Corporation
Lean Six Sigma Training -SXL
www.LeanSigmaCorporation.com
Roles and Responsibilities: Stakeholders
• Stakeholders are usually the recipients or beneficiaries of the success of a Six Sigma project.
• Stakeholders are individuals owning the process, function, or production/service line that a Six Sigma Belt focuses on improving the performance of.
• BBs and GBs need to keep strong working relationships with stakeholders because without their support, it would be extremely difficult to make the Six Sigma project a success.
56
© Lean Sigm
a Corporation
Lean Six Sigma Training -SXL

www.LeanSigmaCorporation.com
Roles and Responsibilities: SMEs
• Subject Matter Experts (SMEs) are commonly known as the experts of the process or subject matter.
• Six Sigma Belts should proactively look to key SMEs to round out their working project team.
• SMEs play critical roles to the success of a project.• Based on SMEs’ extensive knowledge about the process, they have the
experience to identify which solutions can work and which cannot work.• SMEs who simply do not speak up can hurt the chances of the process’
success. • SMEs are also the same people who prefer to keep the status quo. Six Sigma
Belts may find many of them unwilling to help implement the changes.57
© Lean Sigm
a Corporation
Lean Six Sigma Training -SXL
www.LeanSigmaCorporation.com
Roles and Responsibilities
• Throughout this module we have reviewed the various common roles and corresponding responsibilities in any Six Sigma program:• Six Sigma Master Black Belt• Six Sigma Black Belt• Six Sigma Green Belt• Six Sigma Yellow Belt• Champion and Sponsors• Stakeholders• Subject Matter Experts (SMEs)
• These Six Sigma belts and other roles are designed to deliver value to the business effectively and successfully.
58
© Lean Sigm
a Corporation
Lean Six Sigma Training -SXL

www.LeanSigmaCorporation.com
1.2. Six Sigma Fundamentals
59
© Lean Sigm
a Corporation
Lean Six Sigma Training -SXL
www.LeanSigmaCorporation.com
Yellow Belt Training: Define Phase1.1 Six Sigma Overview
1.1.1 What is Six Sigma1.1.2 Six Sigma History1.1.3 Six Sigma Approach Y = f(x)1.1.4 Six Sigma Methodology1.1.5 Roles and Responsibilities
1.2 Six Sigma Fundamentals1.2.1 Defining a Process1.2.2 VOC and CTQs1.2.3 QFD1.2.4 Cost of Poor Quality (COPQ)1.2.5 Pareto Analysis (80 : 20 rule)
1.3 Lean Six Sigma Projects1.3.1 Six Sigma Metrics1.3.2 Business Case and Charter1.3.3 Project Team Selection1.3.4 Project Risk Management1.3.5 Project Planning
1.4 Lean Fundamentals1.4.1 Lean and Six Sigma1.4.2 History of Lean1.4.3 The Seven Deadly Muda1.4.4 Five-S (5S)
60
© Lean Sigm
a Corporation
Lean Six Sigma Training -SXL
www.LeanSigmaCorporation.com
1.2.1 Defining a Process
61
© Lean Sigm
a Corporation
Lean Six Sigma Training -SXL
www.LeanSigmaCorporation.com
Defining a Process
• The basic method of defining and understanding a process is the process map.
• Process maps help determine where and how a process begins as well as all the steps and decisions in between.
• By learning the various types and methods of process maps, you can become adept at setting project scopes, identifying value-added and non-value-added steps, identifying problems in a process, etc.
• This module covers:• High-level process maps• Detailed process maps• Functional maps.
• In the Measure section we will touch on several other types and methods of process mapping.
62
© Lean Sigm
a Corporation
Lean Six Sigma Training -SXL
www.LeanSigmaCorporation.com
What is a Process Map?
• A process map is a graphical representation of a process flow.• It illustrates how the business process is accomplished step by step.• It describes how the materials or information sequentially flow from one
business entity to the next.• It illustrates who is responsible for what between the process boundaries.• It depicts the inputs and outputs of each individual process step.• Always encourage your project team to map the current state of the process
instead of the ideal state. Be honest with each other!
63
© Lean Sigm
a Corporation
Lean Six Sigma Training -SXL
www.LeanSigmaCorporation.com
Process Map Basic Symbols
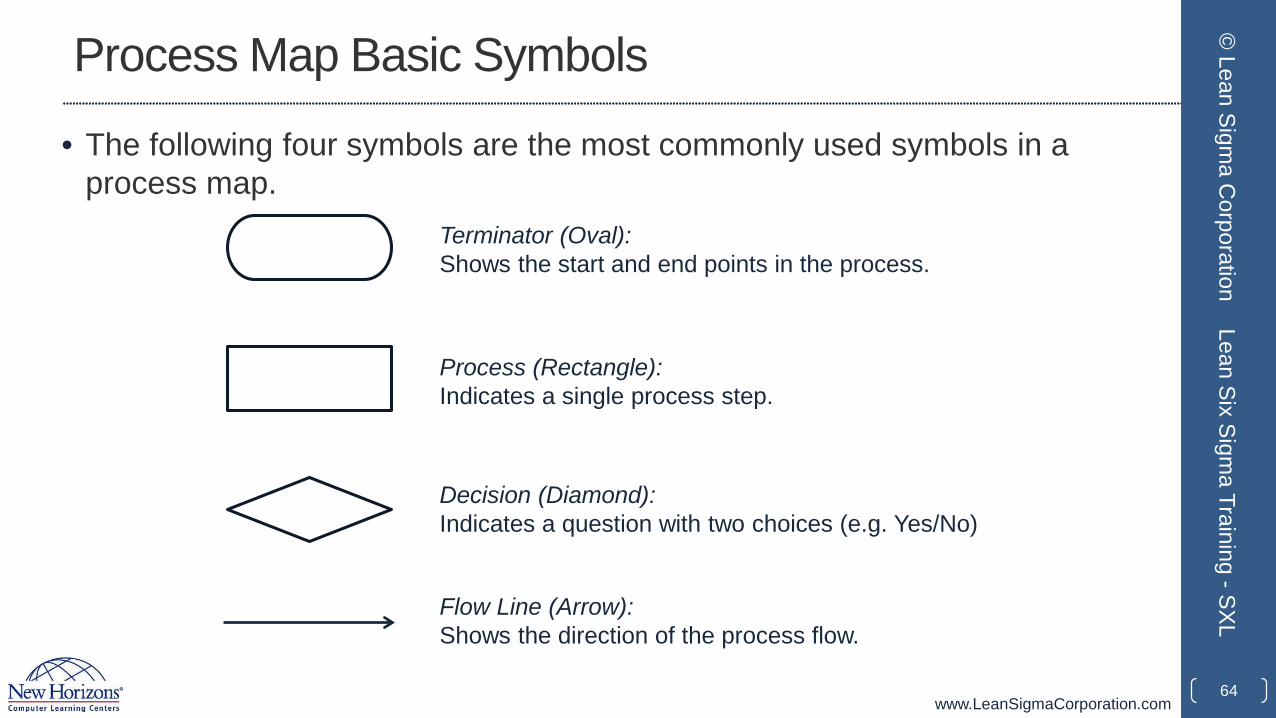
• The following four symbols are the most commonly used symbols in a process map.
64
© Lean Sigm
a Corporation
Lean Six Sigma Training -SXL
Terminator (Oval):Shows the start and end points in the process.
Process (Rectangle):Indicates a single process step.
Decision (Diamond):Indicates a question with two choices (e.g. Yes/No)
Flow Line (Arrow):Shows the direction of the process flow.
www.LeanSigmaCorporation.com
Additional Process Symbols
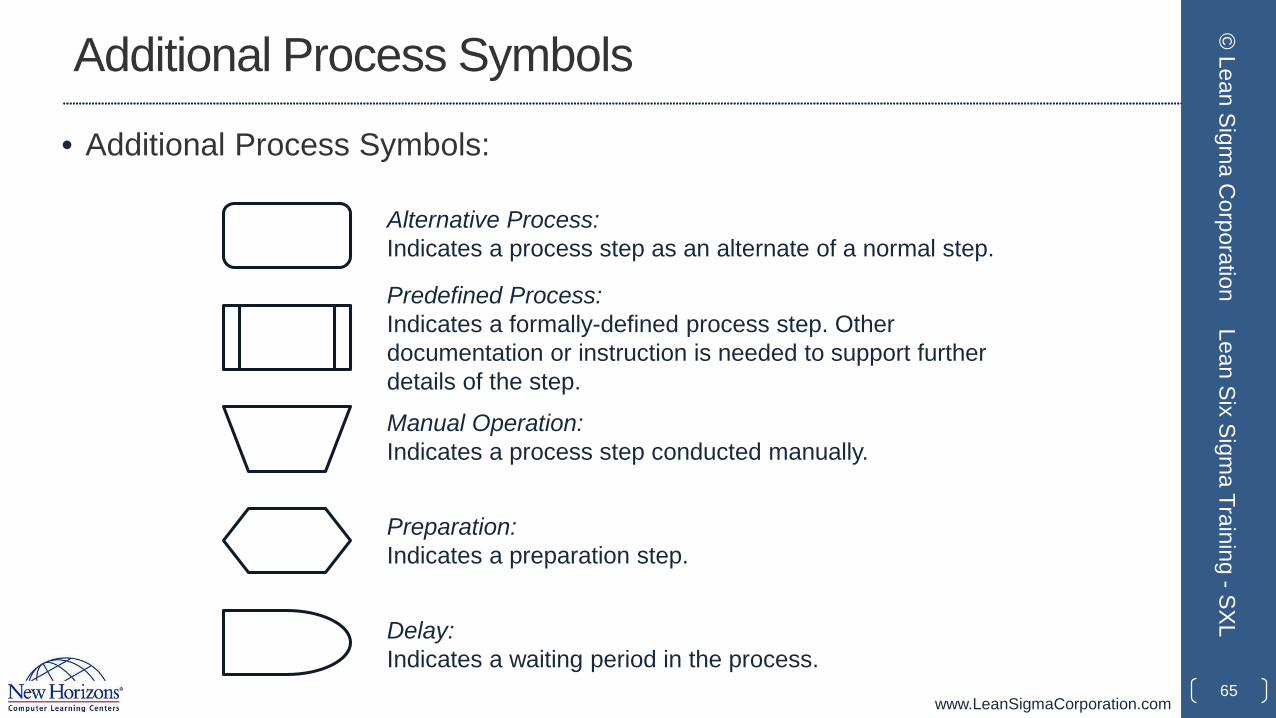
• Additional Process Symbols:
65
© Lean Sigm
a Corporation
Lean Six Sigma Training -SXL
Alternative Process:Indicates a process step as an alternate of a normal step.
Predefined Process:Indicates a formally-defined process step. Other documentation or instruction is needed to support further details of the step.
Manual Operation:Indicates a process step conducted manually.
Preparation:Indicates a preparation step.
Delay:Indicates a waiting period in the process.
www.LeanSigmaCorporation.com
Additional Process Symbols
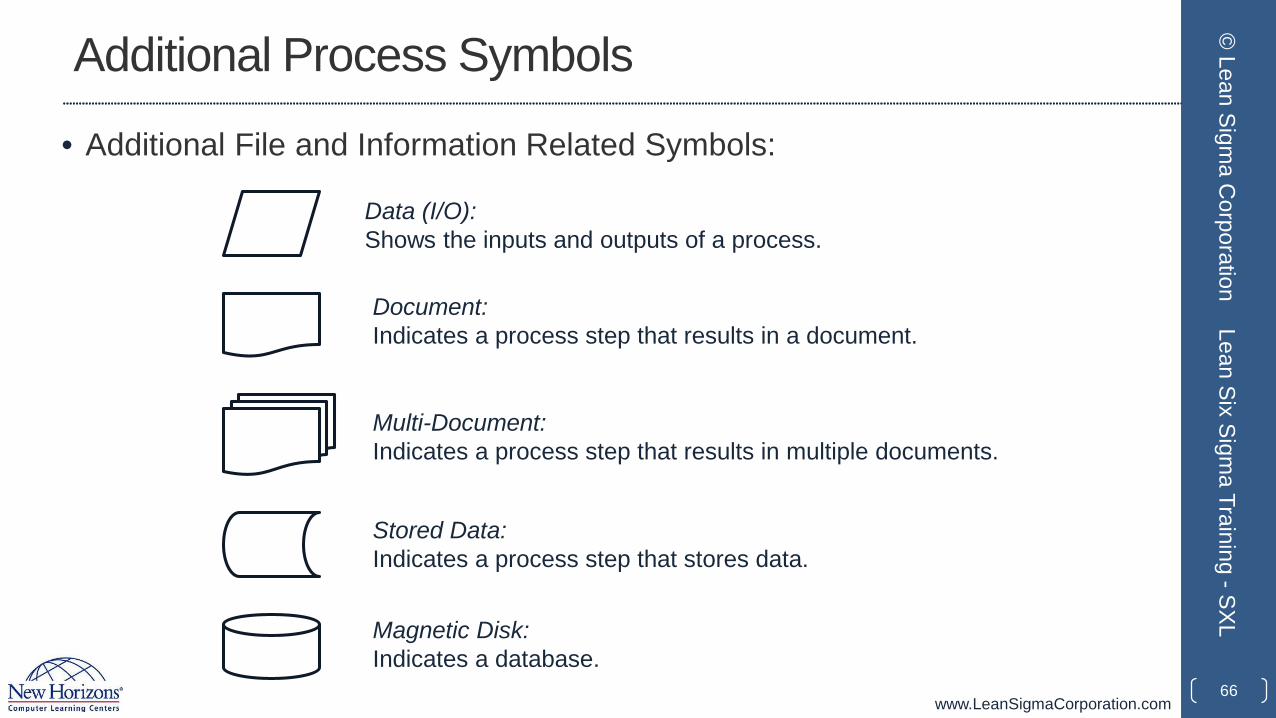
• Additional File and Information Related Symbols:
66
© Lean Sigm
a Corporation
Lean Six Sigma Training -SXL
Data (I/O):Shows the inputs and outputs of a process.
Document:Indicates a process step that results in a document.
Multi-Document:Indicates a process step that results in multiple documents.
Stored Data:Indicates a process step that stores data.
Magnetic Disk:Indicates a database.
www.LeanSigmaCorporation.com
Additional Process Symbols
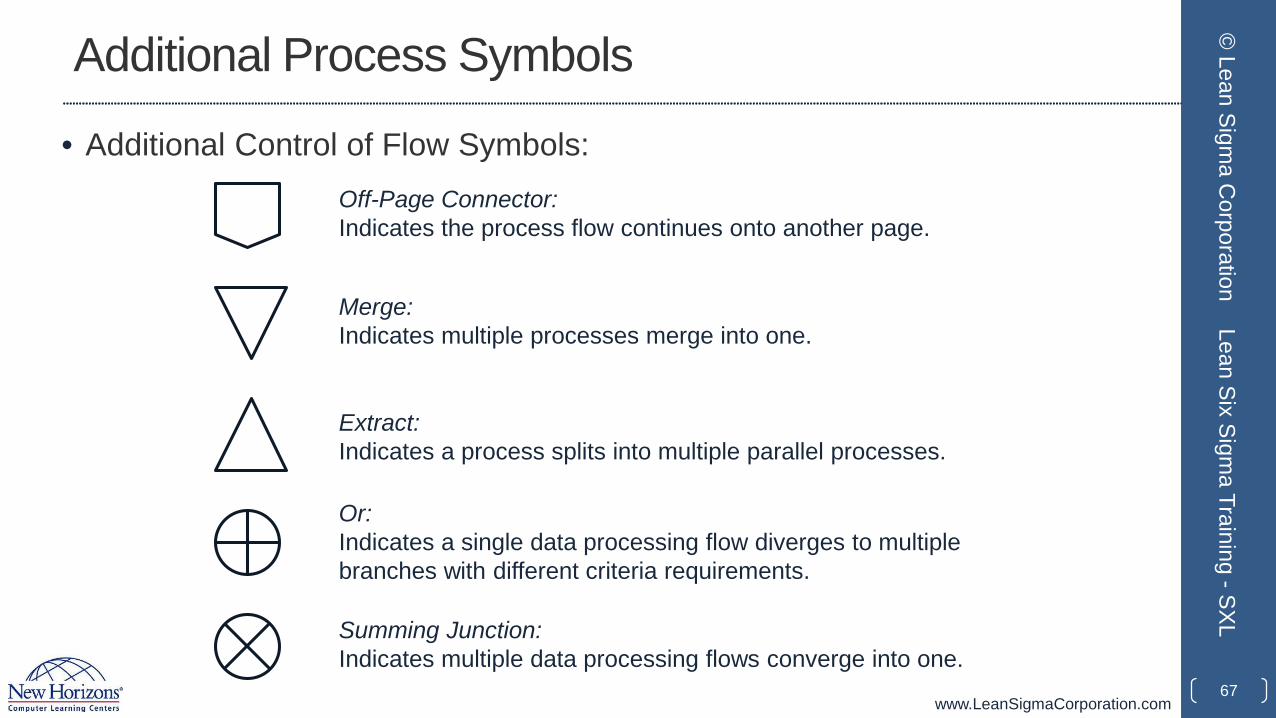
• Additional Control of Flow Symbols:
67
© Lean Sigm
a Corporation
Lean Six Sigma Training -SXL
Off-Page Connector:Indicates the process flow continues onto another page.
Merge:Indicates multiple processes merge into one.
Extract:Indicates a process splits into multiple parallel processes.
Or:Indicates a single data processing flow diverges to multiple branches with different criteria requirements.
Summing Junction:Indicates multiple data processing flows converge into one.
www.LeanSigmaCorporation.com
How to Plot a Process Map
• Step 1: Define the boundaries of the process you want to map.
• A process map can depict the flow of an entire process or a segment of it.
• You need to identify and define the beginning and ending points of the process before starting to plot.
• Use operational definitions where possible.
68
© Lean Sigm
a Corporation
Lean Six Sigma Training -SXL
www.LeanSigmaCorporation.com
How to Plot a Process Map
• Step 2: Define and sort the process steps with the flow.
• Consult with process owners and SMEs or observe the process in action to understand how the process is actually performed.
• Record the process steps and sort them according to the order of their occurrence.
69
© Lean Sigm
a Corporation
Lean Six Sigma Training -SXL
www.LeanSigmaCorporation.com
How to Plot a Process Map
• Step 3: Fill the step information into the appropriate process symbols and plot the diagram.
• In the team meeting of process mapping, place the sticky notes with different colors on a white board so you can move them around while the map is under-construction.
• The flow lines can be plotted directly on the white board.
• Decision steps. Rotate the sticky note 45 degrees.
• When the map is completed on the white board, record the map using Excel, PowerPoint, Visio, Quality Companion, or other preferred software.
70
© Lean Sigm
a Corporation
Lean Six Sigma Training -SXL
www.LeanSigmaCorporation.com
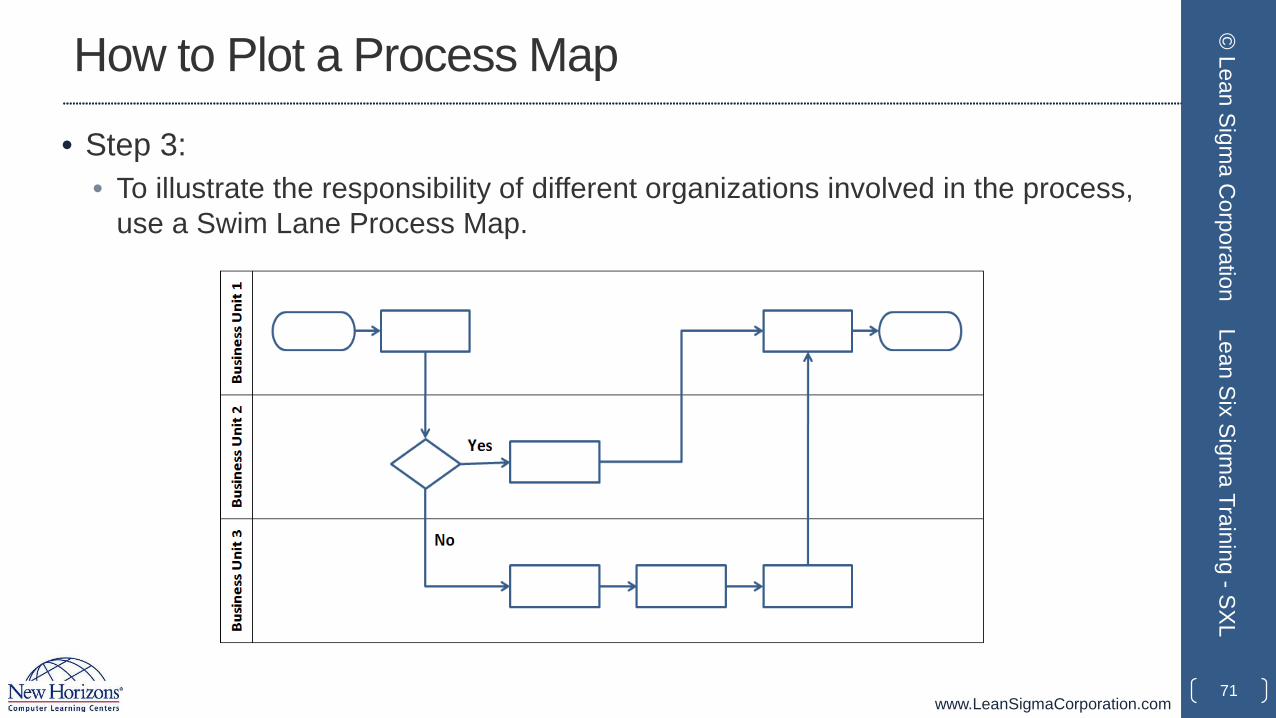
How to Plot a Process Map
• Step 3:• To illustrate the responsibility of different organizations involved in the process,
use a Swim Lane Process Map.
71
© Lean Sigm
a Corporation
Lean Six Sigma Training -SXL
www.LeanSigmaCorporation.com
How to Plot a Process Map
• Step 4: Identify and record inputs/outputs and their corresponding specifications for each process step.
• The process map helps in understanding and documenting Y = f(x) of a process, where Y represents the outputs and x represents the inputs.
• The inputs of each process step can be controllable or non-controllable, standardized operational procedures, or noise.
• Inputs are the source of variation in the process and need to be analyzed qualitatively and quantitatively.
• The outputs of each process step can be products, information, services, etc. They are the little Y’s within the process.
72
© Lean Sigm
a Corporation
Lean Six Sigma Training -SXL
www.LeanSigmaCorporation.com
How to Plot a Process Map
• Step 5: Evaluate the process map and adjust if needed.
• If the process is too complicated to be covered in one single process map, you may create additional detailed sub-process maps for further information.
• Number the process steps in the order of their occurrence for clarity.
73
© Lean Sigm
a Corporation
Lean Six Sigma Training -SXL
www.LeanSigmaCorporation.com
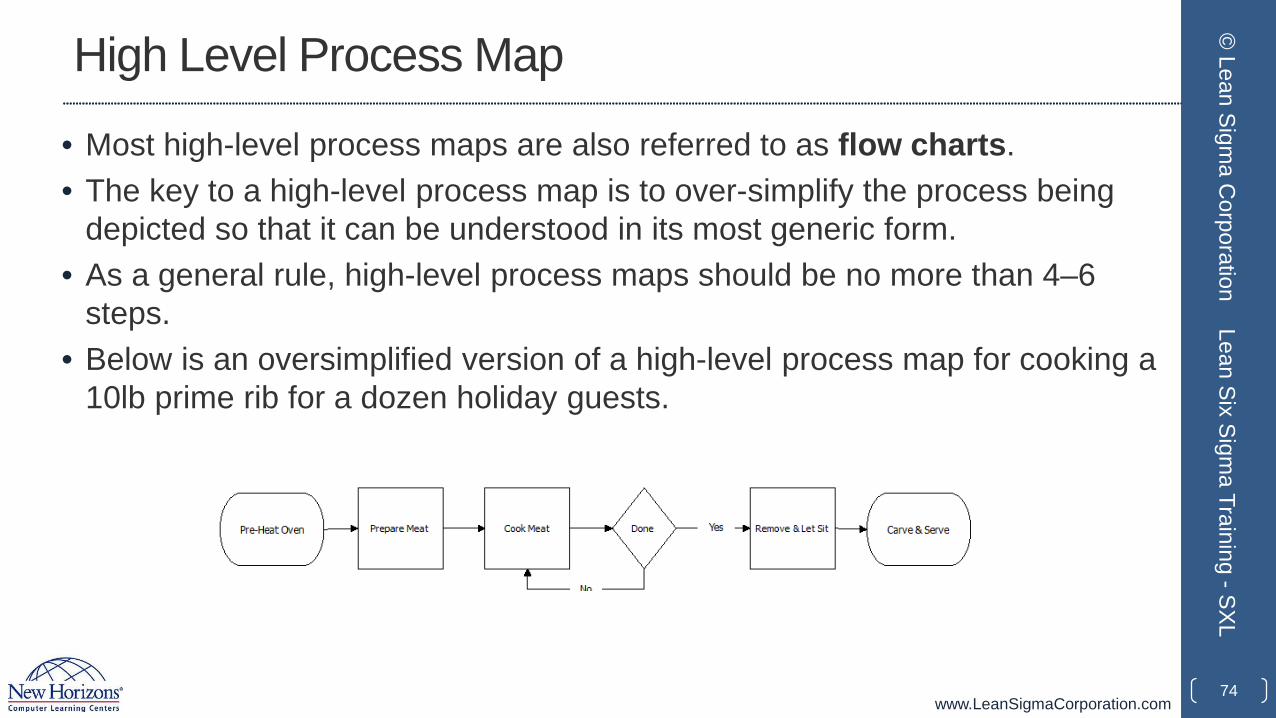
High Level Process Map
• Most high-level process maps are also referred to as flow charts. • The key to a high-level process map is to over-simplify the process being
depicted so that it can be understood in its most generic form.• As a general rule, high-level process maps should be no more than 4–6
steps. • Below is an oversimplified version of a high-level process map for cooking a
10lb prime rib for a dozen holiday guests.
74
© Lean Sigm
a Corporation
Lean Six Sigma Training -SXL

www.LeanSigmaCorporation.com
Detailed Process Map
• Detailed process maps or multi-level maps take the high-level map much further.
• Detailed maps can be 2–4 levels deeper than your high-level process map. • A good guideline used to help create the second level is to take each step
in the high level map and break it down into 2–4 steps (no more).• Repeat this process (level 3, level 4 etc.) until reaching the desired level of
detail.• Some detailed maps are 2 or 3 levels deep, others can be 5–6 levels deep.
Obviously, the deeper the levels, the more complex and the more burdensome.
75
© Lean Sigm
a Corporation
Lean Six Sigma Training -SXL
www.LeanSigmaCorporation.com
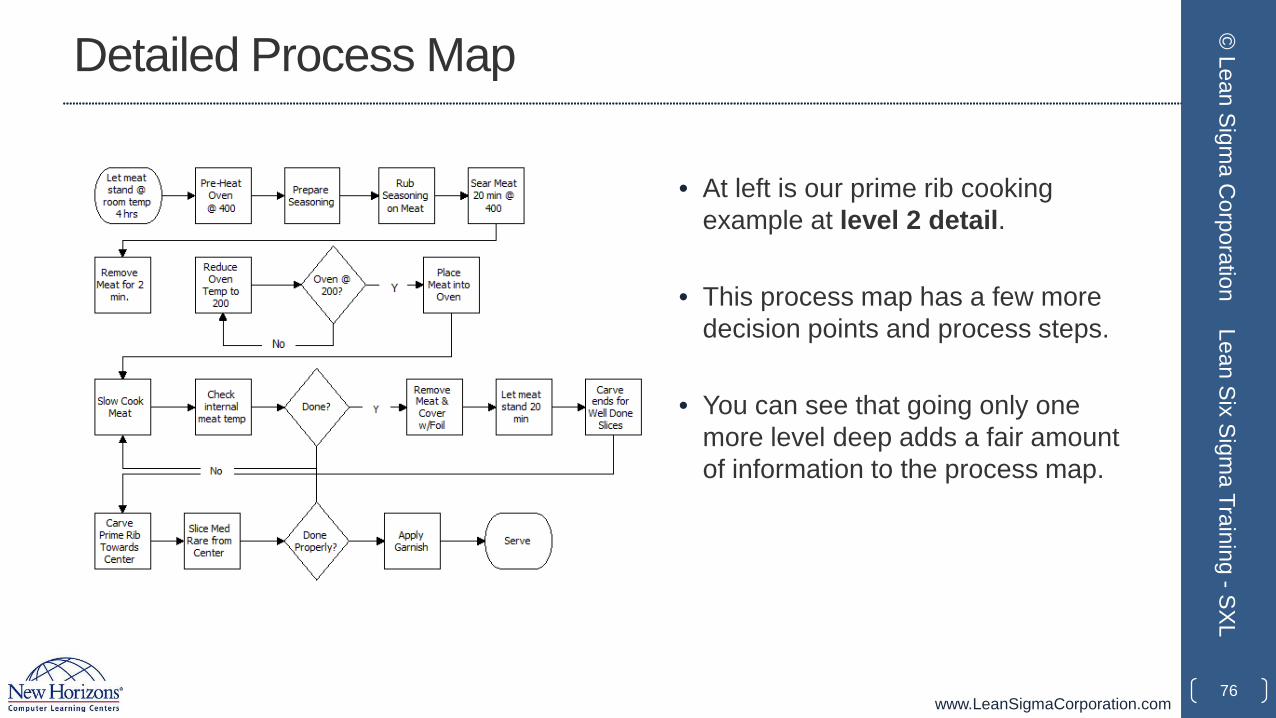
Detailed Process Map
• At left is our prime rib cooking example at level 2 detail.
• This process map has a few more decision points and process steps.
• You can see that going only one more level deep adds a fair amount of information to the process map.
76
© Lean Sigm
a Corporation
Lean Six Sigma Training -SXL

www.LeanSigmaCorporation.com
Functional Process Map• The functional map adds dimension to the high-level or detailed map. • The dimension added is identifying which function or job performs the step or makes the
decision.• Below is a generic example of a functional map. Note that functions are identified in
horizontal lanes and each process step is placed in the appropriate lane based on which function performs the step.
77
© Lean Sigm
a Corporation
Lean Six Sigma Training -SXL
www.LeanSigmaCorporation.com
1.2.2 VOC and CTQs
78
© Lean Sigm
a Corporation
Lean Six Sigma Training -SXL
www.LeanSigmaCorporation.com
Voice of the Customer
• VOC stands for “Voice of the Customer.”• Voice of the customer is a term used for a data-driven plan to discover
customer wants and needs. • VOC is an important component to a successful Six Sigma project.• There are also other “Voices” that need to be heard when conducting
projects. The 3 primary forms are:
• VOC: Voice of the Customer• VOB: Voice of the Business• VOA: Voice of the Associate.
79
© Lean Sigm
a Corporation
Lean Six Sigma Training -SXL
www.LeanSigmaCorporation.com
Gathering VOC
• Gathering VOC should be performed methodically.• The two most popular methods of collecting VOC are
1. Indirect2. Direct.
• 1. Indirect data collection for VOC involves passive information exchange: • Warranty claims • Customer complaints/compliments • Service calls • Sales reports.
• 2. Indirect methods are less effective, sometimes dated, require heavy interpretation, and are also more difficult to confirm.
80
© Lean Sigm
a Corporation
Lean Six Sigma Training -SXL
www.LeanSigmaCorporation.com
Gathering VOC
• Direct data collection methods for VOC are active and planned customer engagements:• Conducting interviews• Conducting customer surveys• Conducting market research• Hosting focus groups.
• Direct methods are typically more effective for several reasons:• Less need to interpret meaning• Researchers can go a little deeper when interacting with customers• Customers are aware of their participation and will respond better upon follow-
up• Researchers can properly plan engagements (questions, sample size,
information collection techniques etc.).81
© Lean Sigm
a Corporation
Lean Six Sigma Training -SXL
www.LeanSigmaCorporation.com
Gathering VOC
• Gathering VOC requires consideration of many factors such as product or services types, customer segments, manufacturing methods or facilities etc.
• All this information will influence the sampling strategy.• Consider which factors are important and build a sample size plan around
them.• Also, consider response rates and adjust the initial sample strategy to
ensure adequate input is received.• Once a sampling plan is in place, collect data via the direct and indirect
methods discussed earlier.• After gathering VOC it will be necessary to translate it into something
meaningful: CTQs.
82
© Lean Sigm
a Corporation
Lean Six Sigma Training -SXL
www.LeanSigmaCorporation.com
Critical to Quality: CTQ
• CTQ stands for Critical to Quality.• CTQs are translated from VOC or
“voice of the customer” feedback.• VOC is often vague, emotional, or simply
a generalization about products or services.• CTQs are the quantifiable, measureable, and meaningful translations of
VOC.• Organizing VOC helps to identify CTQs. • One effective way to organize VOC is to group or bucket it using an affinity
diagram.• Affinity diagrams are ideal for large amounts of soft data resulting from
brainstorming sessions or surveys.
83
© Lean Sigm
a Corporation
Lean Six Sigma Training -SXL

www.LeanSigmaCorporation.com
Affinity Diagram: Building a CTQ Tree
• Steps for conducting an Affinity Diagram exercise:
• Step 1: Clearly define the question or focus of the exercise (“Why are associates late for work?”).
• Step 2: Record all participant responses on note cards or sticky notes (this is the sloppy part, record everything!).
• Step 3: Lay out all note cards or post the sticky notes onto a wall.
• Step 4: Look for and identify common themes.
• Step 5: Begin moving the note cards or sticky notes into the themes until all responses are allocated.
• Step 6: Re-evaluate and make adjustments.84
© Lean Sigm
a Corporation
Lean Six Sigma Training -SXL
www.LeanSigmaCorporation.com
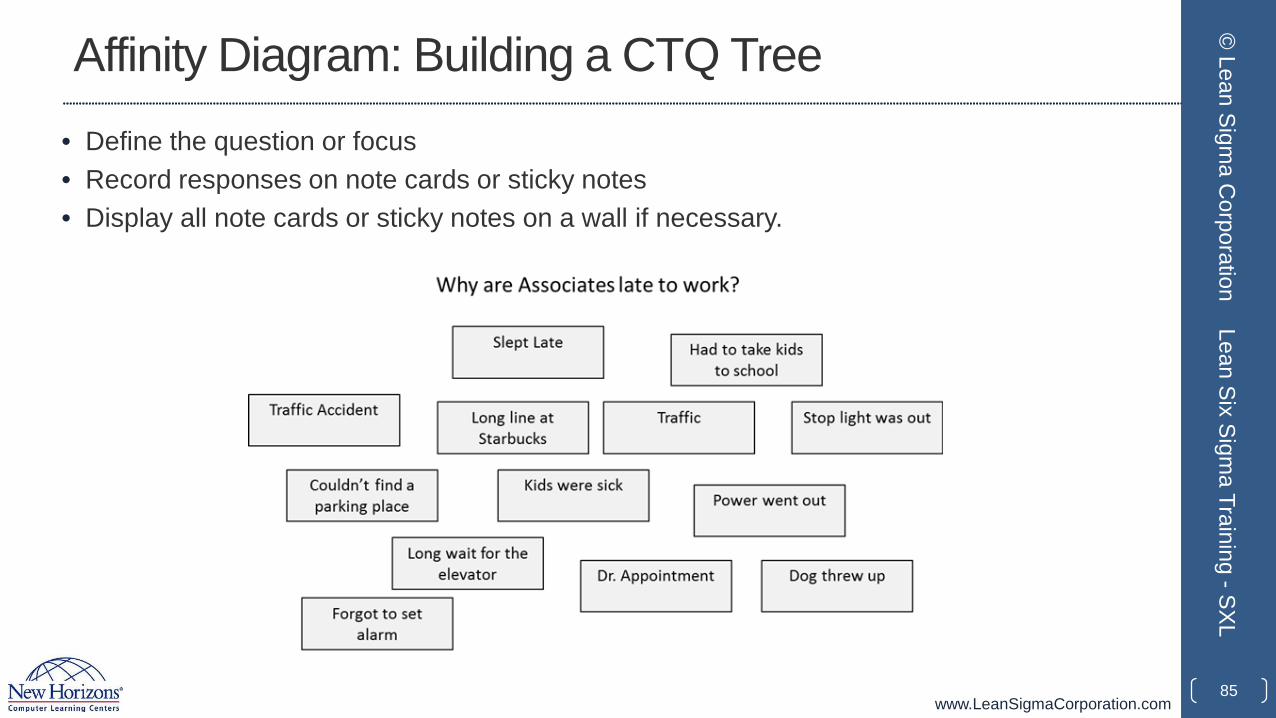
Affinity Diagram: Building a CTQ Tree• Define the question or focus • Record responses on note cards or sticky notes• Display all note cards or sticky notes on a wall if necessary.
85
© Lean Sigm
a Corporation
Lean Six Sigma Training -SXL
www.LeanSigmaCorporation.com
Affinity Diagram: Building a CTQ Tree
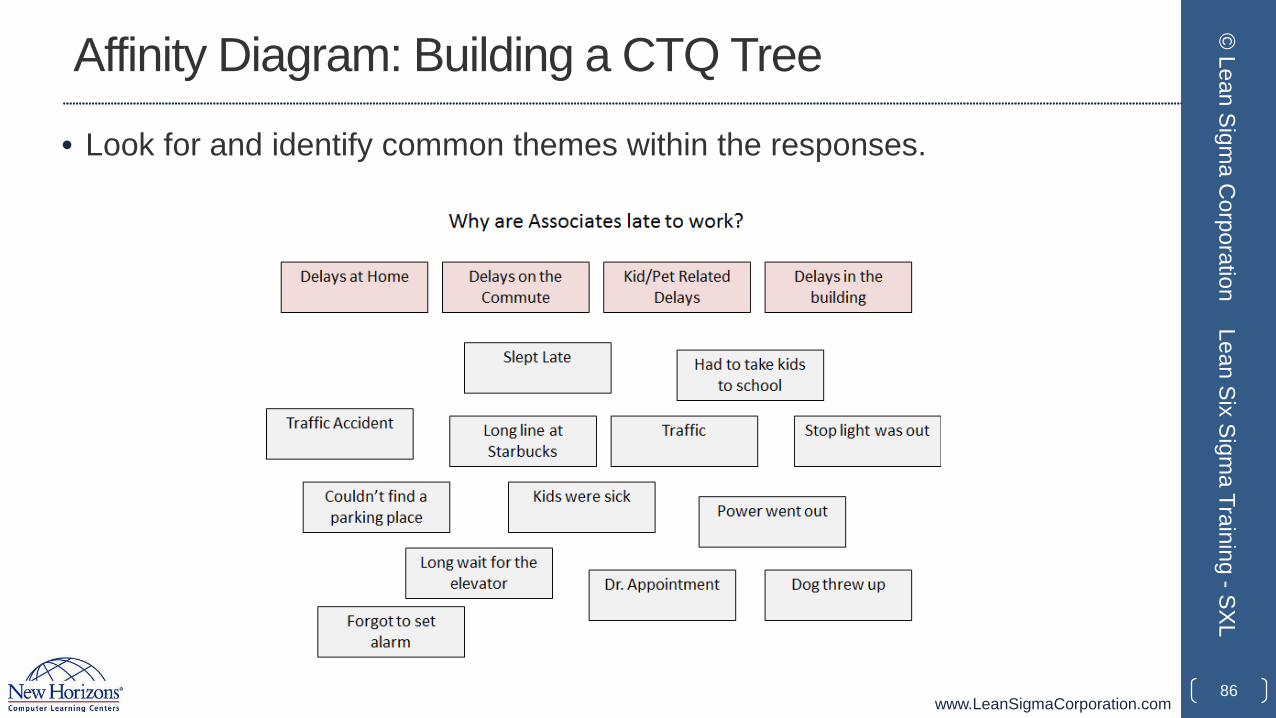
• Look for and identify common themes within the responses.
86
© Lean Sigm
a Corporation
Lean Six Sigma Training -SXL
www.LeanSigmaCorporation.com
Affinity Diagram: Building a CTQ Tree
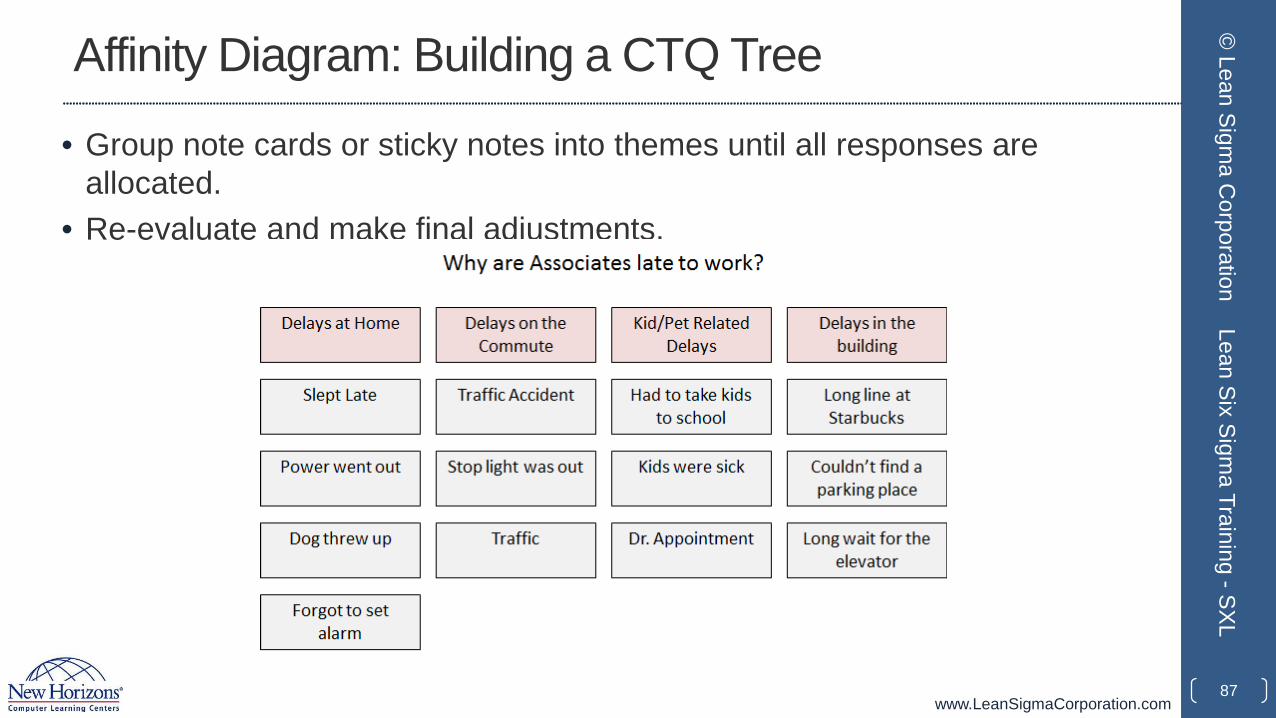
• Group note cards or sticky notes into themes until all responses are allocated.
• Re-evaluate and make final adjustments.
87
© Lean Sigm
a Corporation
Lean Six Sigma Training -SXL
www.LeanSigmaCorporation.com
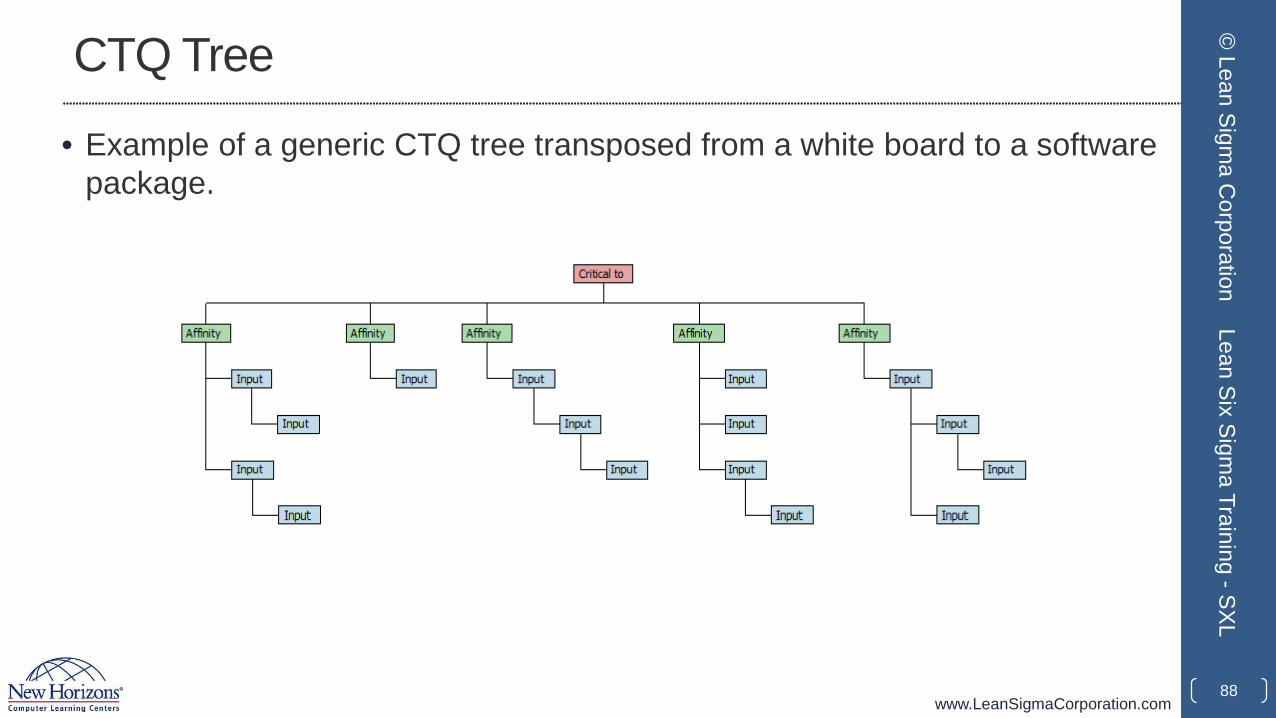
CTQ Tree
• Example of a generic CTQ tree transposed from a white board to a software package.
88
© Lean Sigm
a Corporation
Lean Six Sigma Training -SXL
www.LeanSigmaCorporation.com
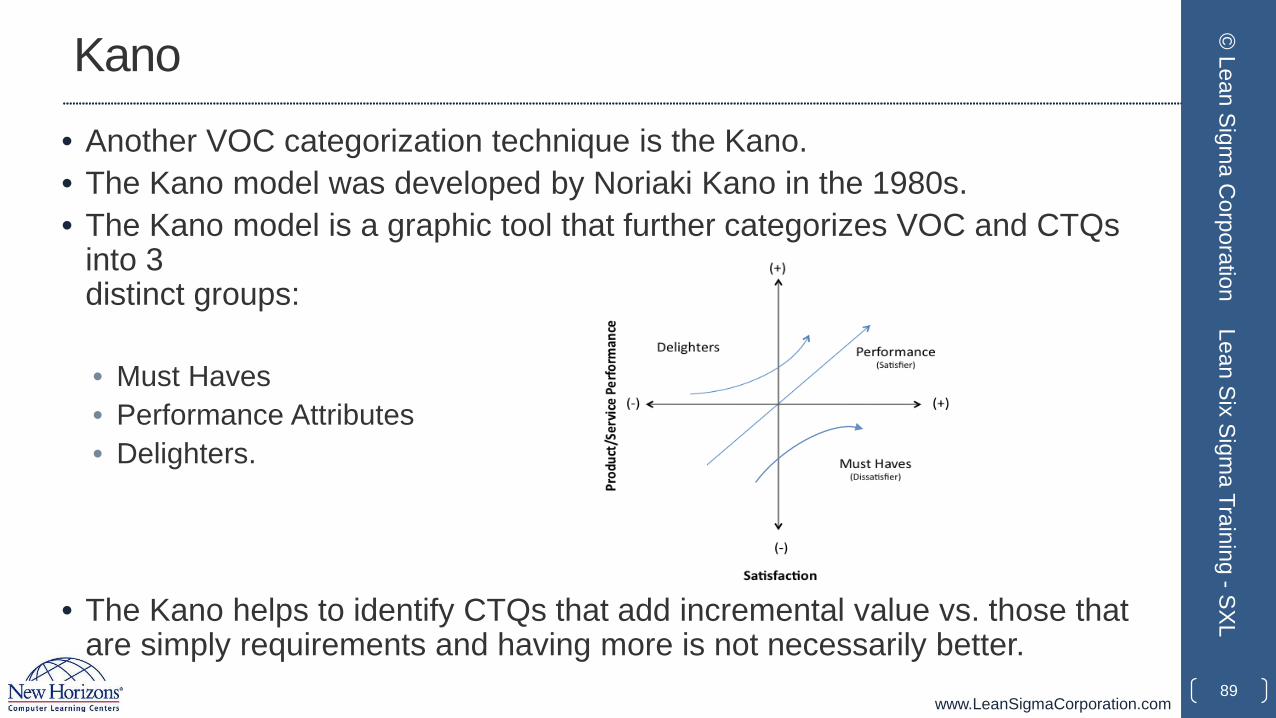
Kano• Another VOC categorization technique is the Kano.• The Kano model was developed by Noriaki Kano in the 1980s.• The Kano model is a graphic tool that further categorizes VOC and CTQs
into 3 distinct groups:
• Must Haves• Performance Attributes• Delighters.
• The Kano helps to identify CTQs that add incremental value vs. those that are simply requirements and having more is not necessarily better.
89
© Lean Sigm
a Corporation
Lean Six Sigma Training -SXL
www.LeanSigmaCorporation.com
Validating VOC and CTQs
• After determining all CTQs, confirm them with the customer.
• Confirming can be accomplished by conducting surveys through one or more of the following methods:• Group sessions• One-on-one meetings• Phone interviews• Electronic means (chat, email, social media etc.)• Physical mail.
• Consider your confirming audience and try to avoid factors that may influence or bias responses such as inconvenience or overly burdensome time commitments.
90
© Lean Sigm
a Corporation
Lean Six Sigma Training -SXL
www.LeanSigmaCorporation.com
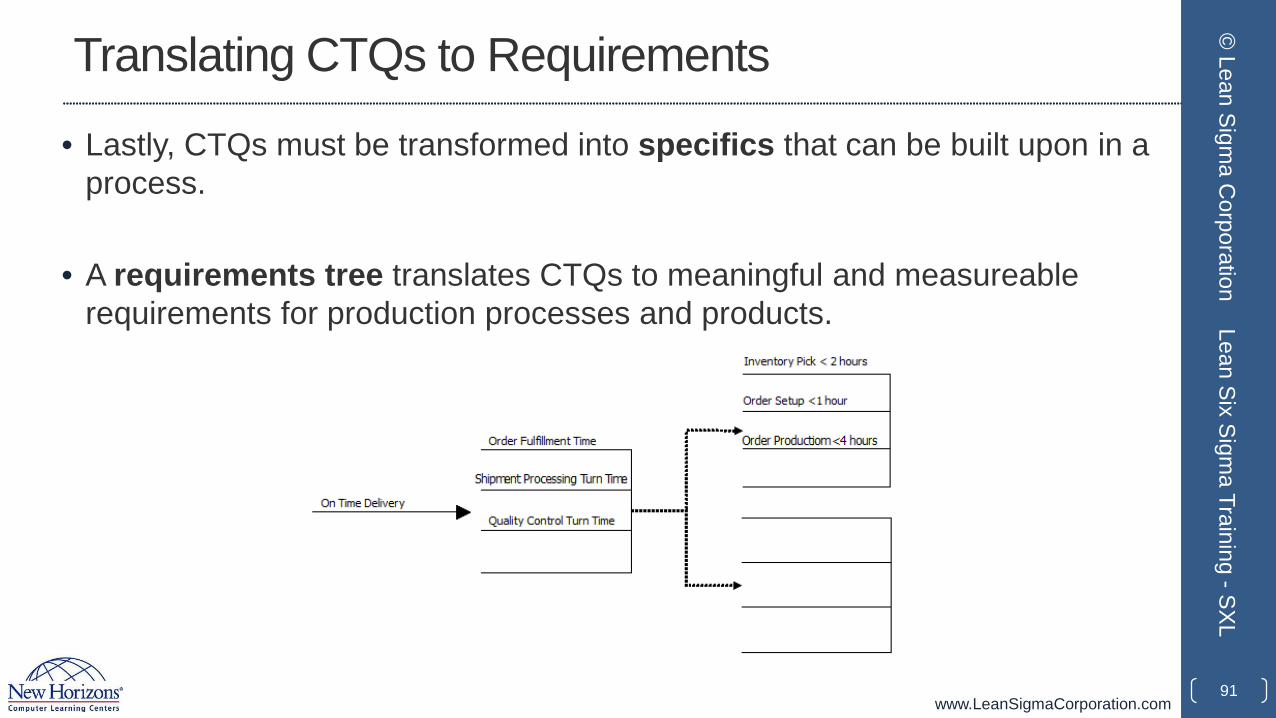
Translating CTQs to Requirements
• Lastly, CTQs must be transformed into specifics that can be built upon in a process.
• A requirements tree translates CTQs to meaningful and measureable requirements for production processes and products.
91
© Lean Sigm
a Corporation
Lean Six Sigma Training -SXL
www.LeanSigmaCorporation.com
1.2.3 Quality Function Deployment
92
© Lean Sigm
a Corporation
Lean Six Sigma Training -SXL

www.LeanSigmaCorporation.com
History of QFD
• Developed by Shigeru Mizuno (1910–1989) and Yoji Akao (b. 1928) in Japan. Quality Function Deployment (QFD) aims to design products that assure customer satisfaction and value – the first time and every time.
• The QFD framework can be used for translating actual customer statements and needs (“The voice of the customer”) into actions and designs to build and deliver a quality product.
93
© Lean Sigm
a Corporation
Lean Six Sigma Training -SXL
www.LeanSigmaCorporation.com
What is QFD?
• Quality Function Deployment (QFD) is a construction methodology and quantification tool used to identify and measure customer’s requirements and transform them into meaningful and measureable parameters.
• QFD helps to prioritize actions to advance process or product to meet customer’s anticipations.
• QFD is an excellent tool for contact between cross-functional groups.
94
© Lean Sigm
a Corporation
Lean Six Sigma Training -SXL
www.LeanSigmaCorporation.com
Purpose of QFD
The quality function deployment has many purposes. Among the most important are:
• Market analysis to establish needs and expectations
• Examination of competitors’ abilities
• Identification of key factors for success
• Translation of key factors into product and process characteristics.
95
© Lean Sigm
a Corporation
Lean Six Sigma Training -SXL
www.LeanSigmaCorporation.com
Phases of QFD
Four Key Phases of QFD
• Phase I: Product Planning Including the “House of Quality” (Requirements
Engineering Life Cycle)
• Phase II: Product Design (Design Life Cycles)
• Phase III: Process Planning (Implementation Life Cycle)
• Phase IV: Process Control (Testing Life Cycle)
96
© Lean Sigm
a Corporation
Lean Six Sigma Training -SXL
www.LeanSigmaCorporation.com
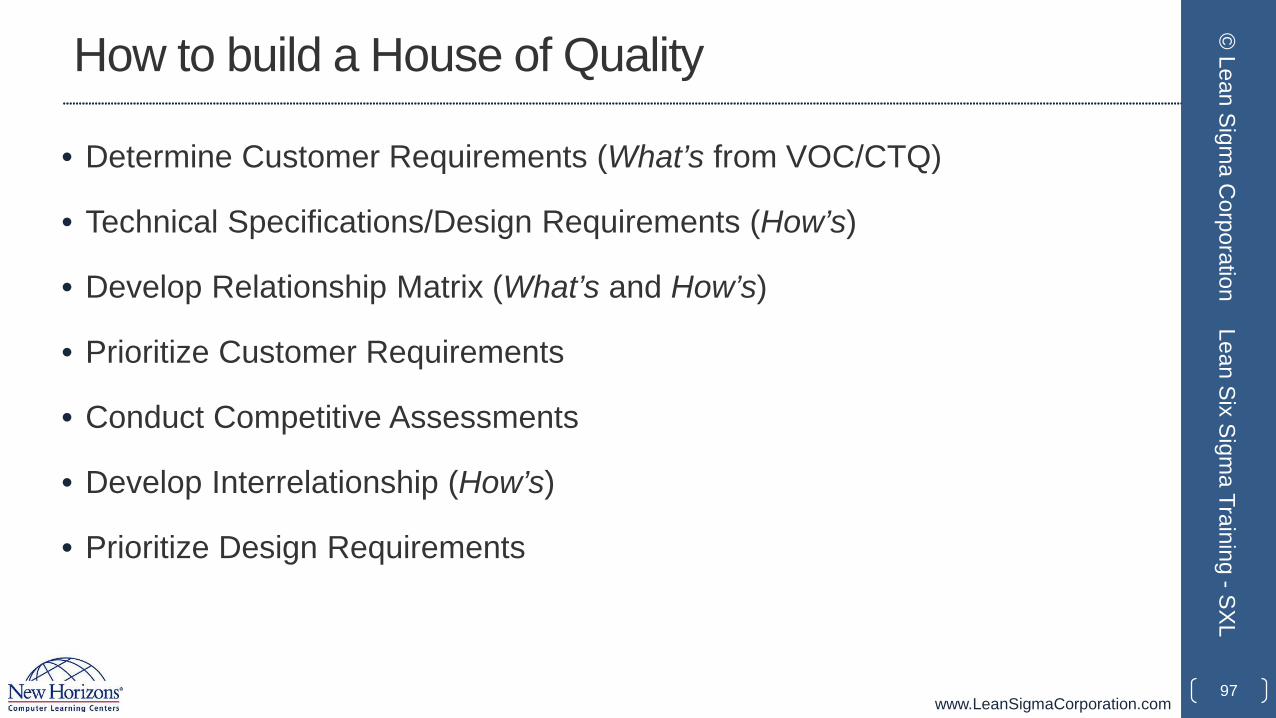
How to build a House of Quality
• Determine Customer Requirements (What’s from VOC/CTQ)
• Technical Specifications/Design Requirements (How’s)
• Develop Relationship Matrix (What’s and How’s)
• Prioritize Customer Requirements
• Conduct Competitive Assessments
• Develop Interrelationship (How’s)
• Prioritize Design Requirements
97
© Lean Sigm
a Corporation
Lean Six Sigma Training -SXL
www.LeanSigmaCorporation.com
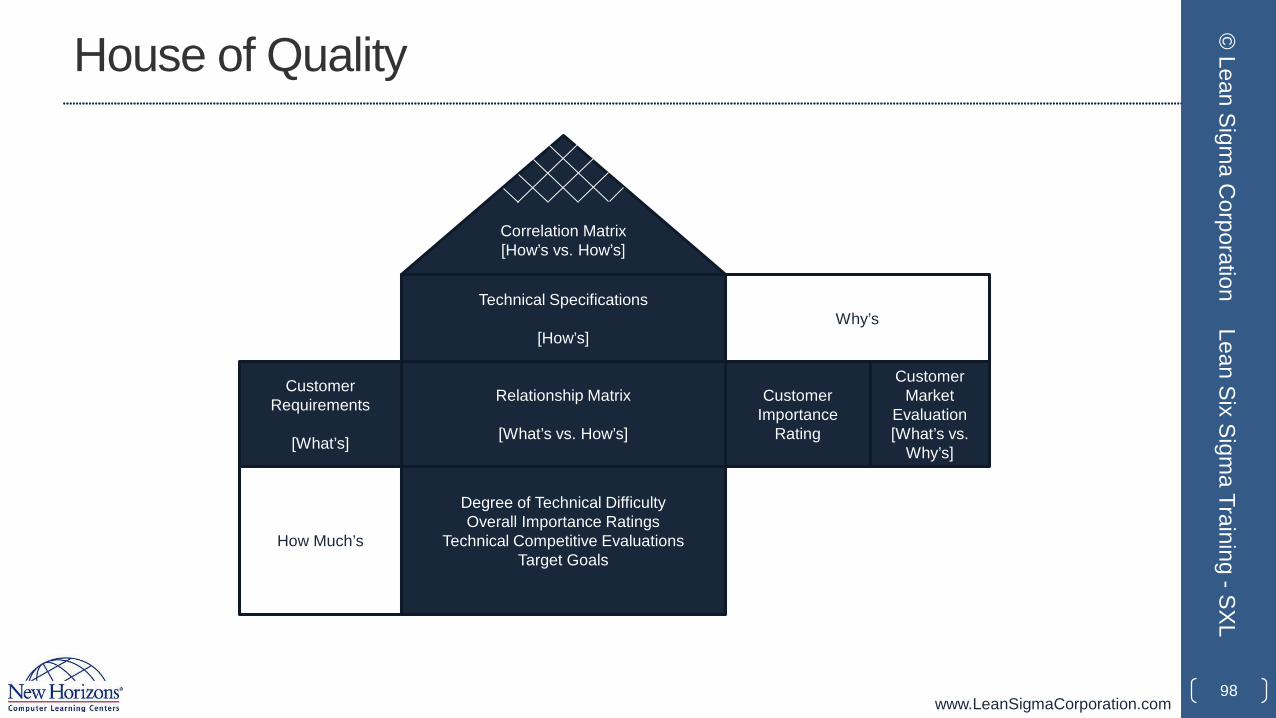
House of Quality
98
© Lean Sigm
a Corporation
Lean Six Sigma Training -SXL
Correlation Matrix [How’s vs. How’s]
Technical Specifications
[How’s]
Relationship Matrix
[What’s vs. How’s]
Degree of Technical DifficultyOverall Importance Ratings
Technical Competitive EvaluationsTarget Goals
Customer Requirements
[What’s]
How Much’s
Why’s
Customer Importance
Rating
Customer Market
Evaluation[What’s vs.
Why’s]
www.LeanSigmaCorporation.com
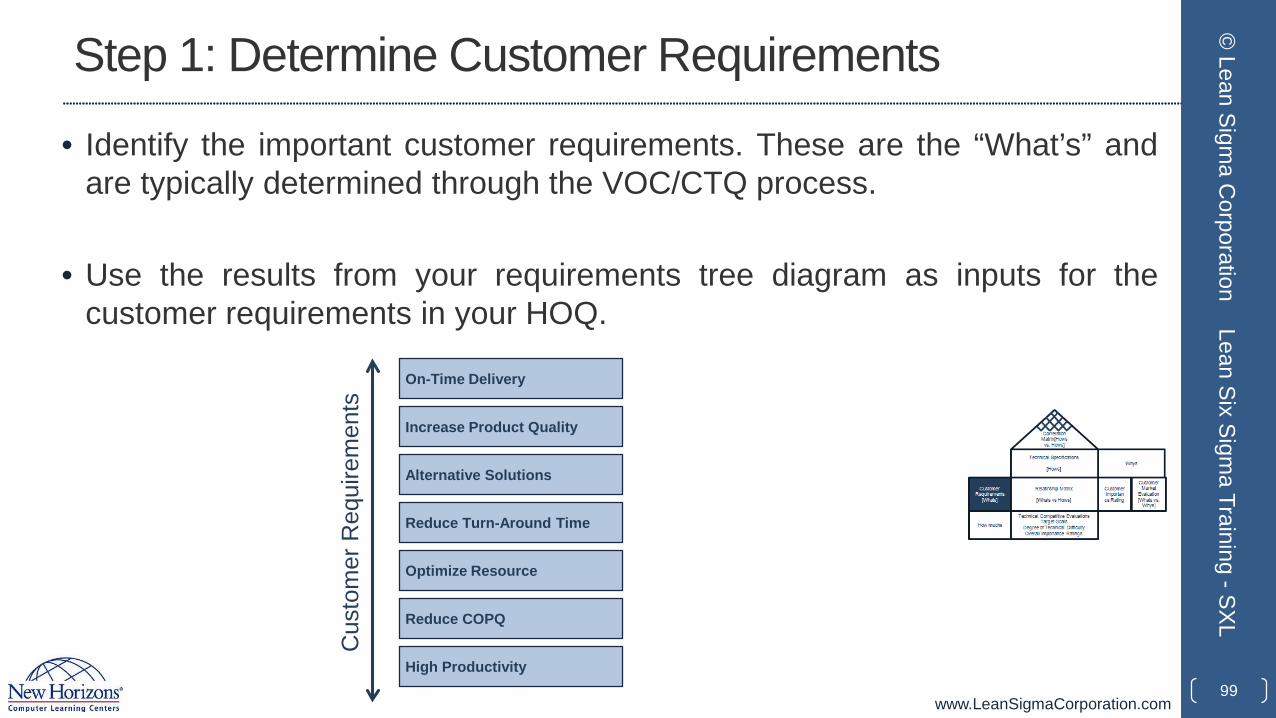
Step 1: Determine Customer Requirements
• Identify the important customer requirements. These are the “What’s” andare typically determined through the VOC/CTQ process.
• Use the results from your requirements tree diagram as inputs for thecustomer requirements in your HOQ.
99
© Lean Sigm
a Corporation
Lean Six Sigma Training -SXL
On-Time Delivery
Increase Product Quality
Alternative Solutions
Reduce Turn-Around Time
Optimize Resource
Reduce COPQ
High Productivity
Cus
tom
er R
equi
rem
ents
www.LeanSigmaCorporation.com
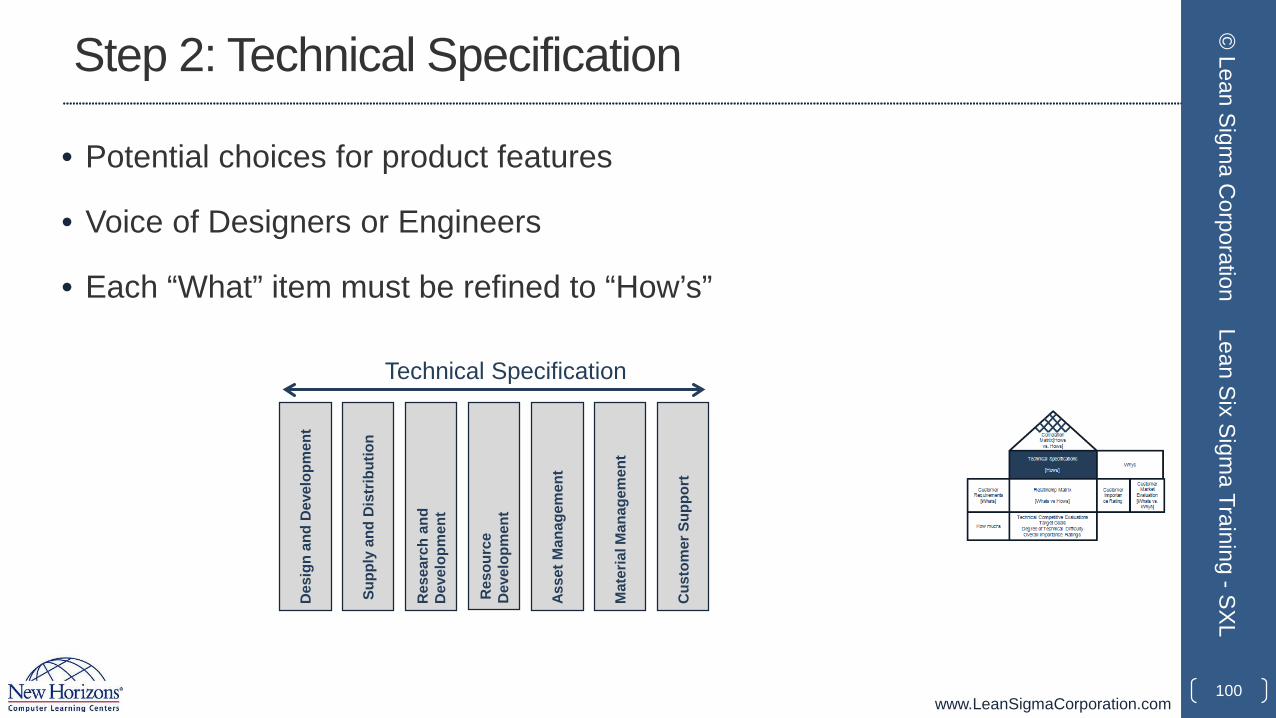
Step 2: Technical Specification
• Potential choices for product features
• Voice of Designers or Engineers
• Each “What” item must be refined to “How’s”
100
© Lean Sigm
a Corporation
Lean Six Sigma Training -SXL
Des
ign
and
Dev
elop
men
t
Supp
ly a
nd D
istr
ibut
ion
Res
earc
h an
d D
evel
opm
ent
Res
ourc
e D
evel
opm
ent
Asse
t Man
agem
ent
Mat
eria
l Man
agem
ent
Cus
tom
er S
uppo
rt
Technical Specification
www.LeanSigmaCorporation.com
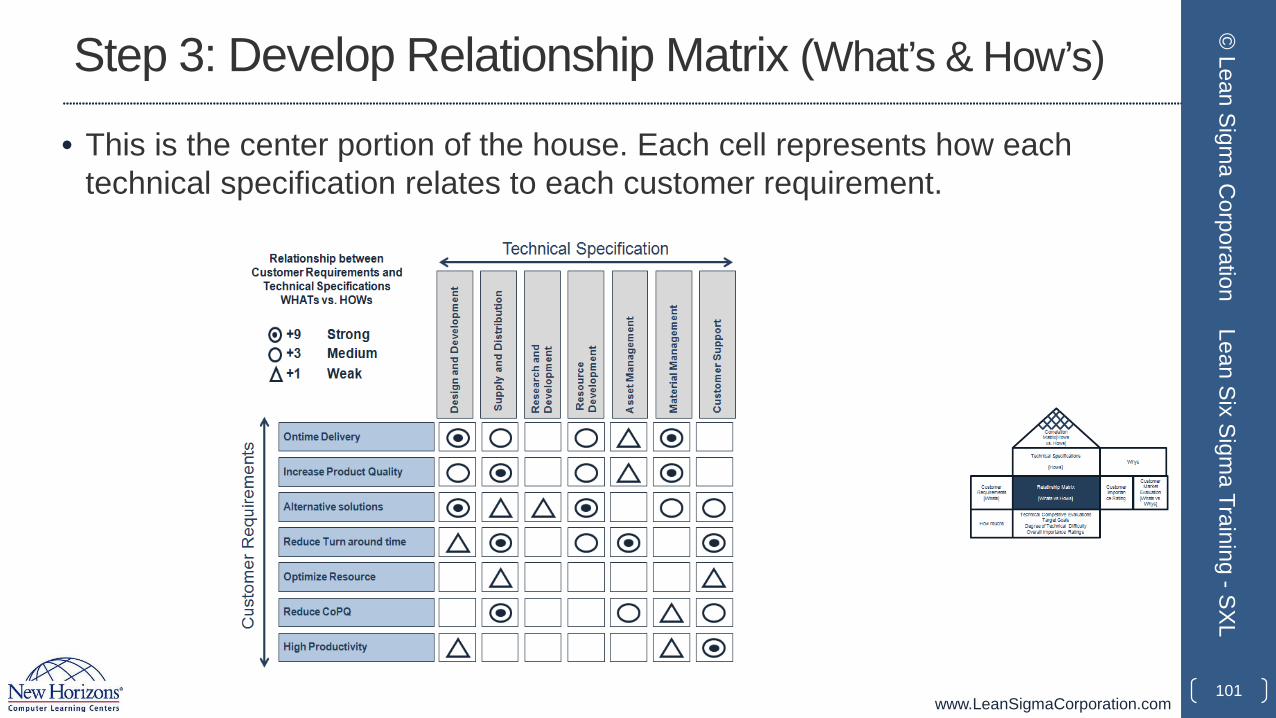
Step 3: Develop Relationship Matrix (What’s & How’s)
• This is the center portion of the house. Each cell represents how each technical specification relates to each customer requirement.
101
© Lean Sigm
a Corporation
Lean Six Sigma Training -SXL
www.LeanSigmaCorporation.com
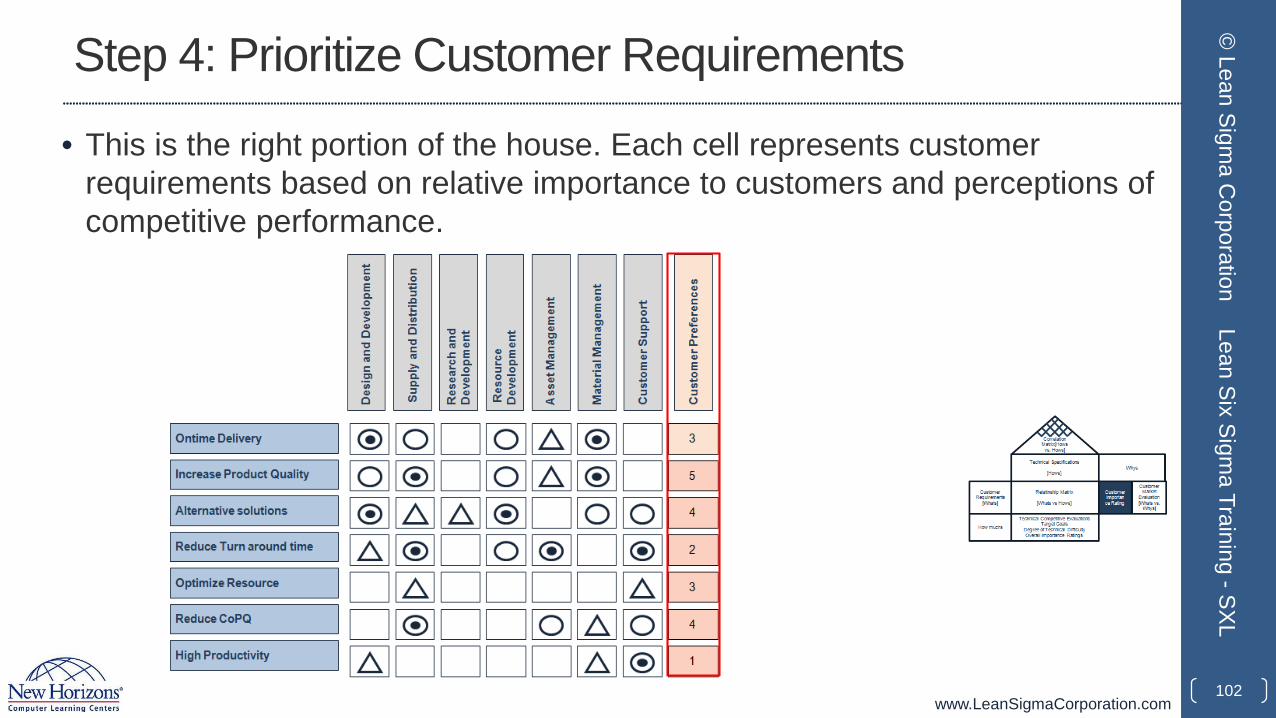
Step 4: Prioritize Customer Requirements
• This is the right portion of the house. Each cell represents customer requirements based on relative importance to customers and perceptions of competitive performance.
102
© Lean Sigm
a Corporation
Lean Six Sigma Training -SXL
www.LeanSigmaCorporation.com
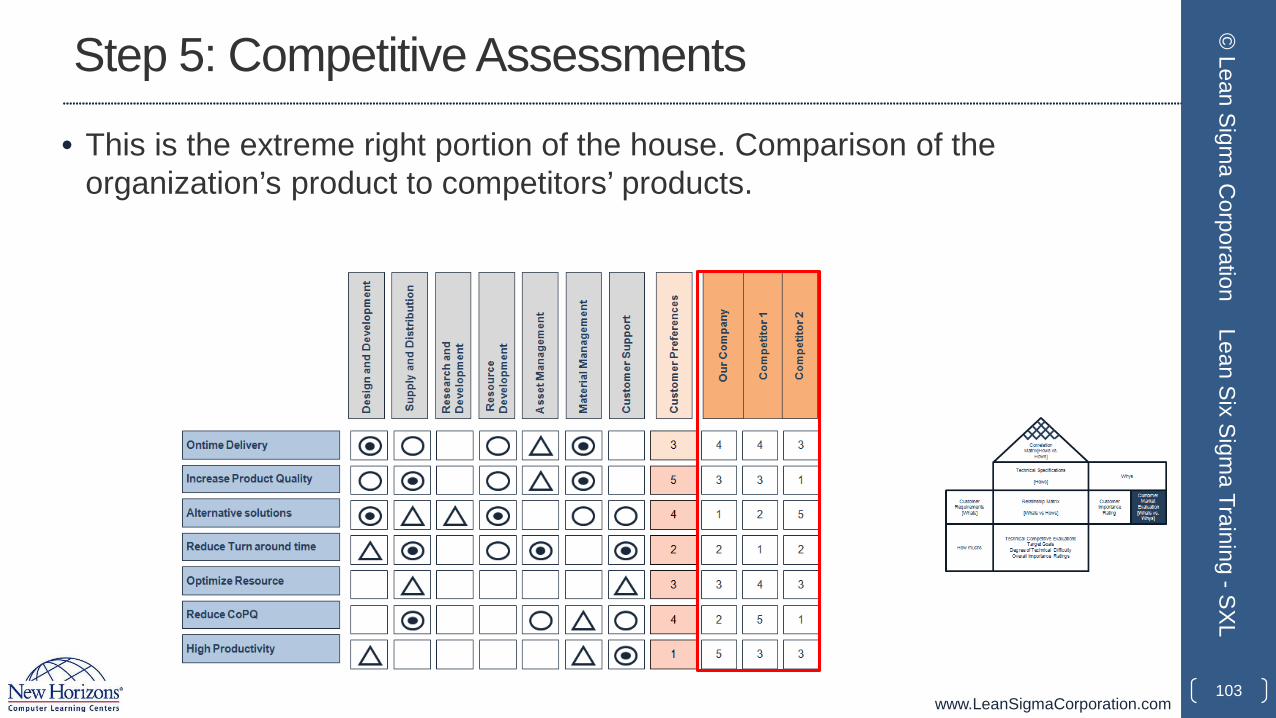
Step 5: Competitive Assessments
• This is the extreme right portion of the house. Comparison of the organization’s product to competitors’ products.
103
© Lean Sigm
a Corporation
Lean Six Sigma Training -SXL
www.LeanSigmaCorporation.com
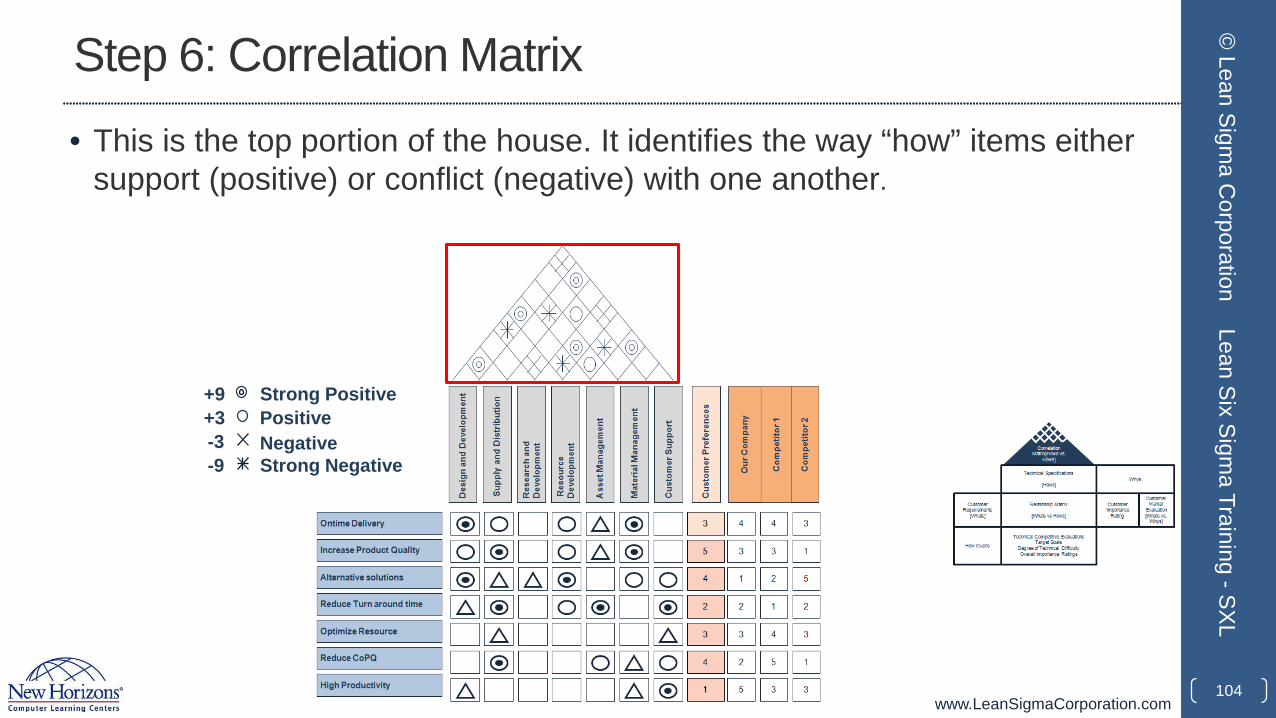
Step 6: Correlation Matrix• This is the top portion of the house. It identifies the way “how” items either
support (positive) or conflict (negative) with one another.
104
© Lean Sigm
a Corporation
Lean Six Sigma Training -SXL
Strong PositivePositiveNegativeStrong Negative
+9+3-3-9
www.LeanSigmaCorporation.com
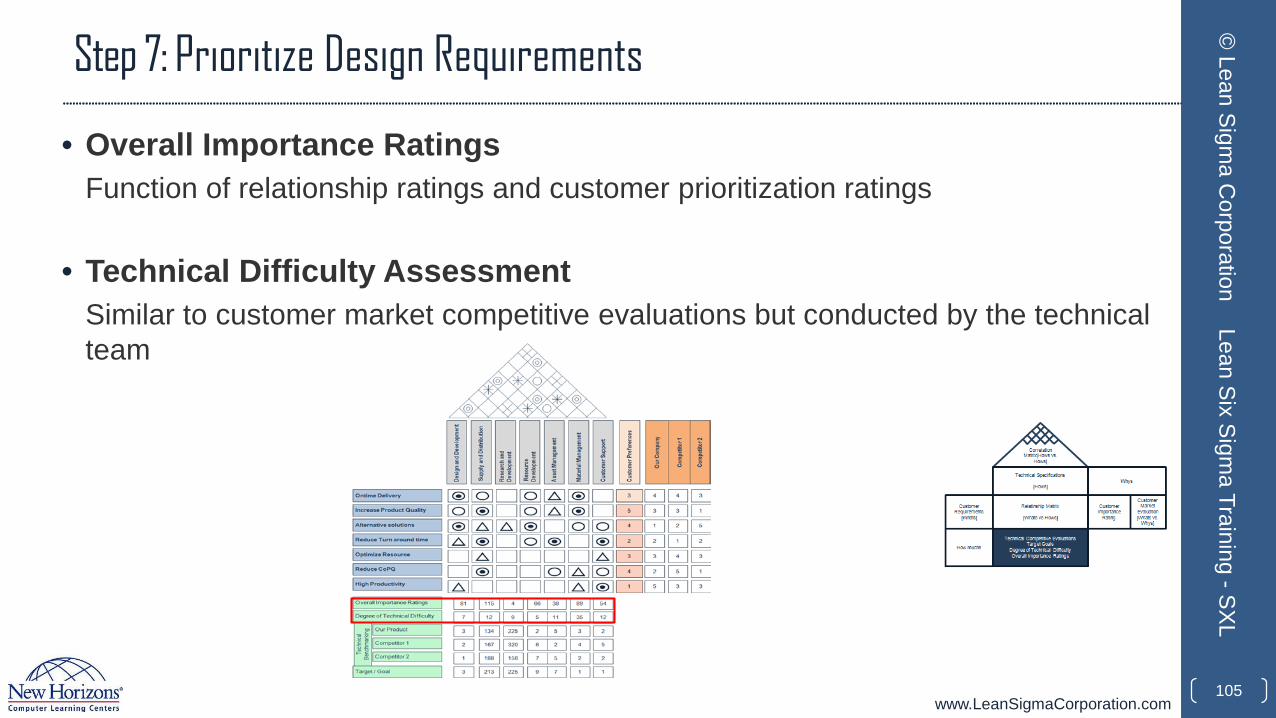
Step 7: Prioritize Design Requirements
• Overall Importance RatingsFunction of relationship ratings and customer prioritization ratings
• Technical Difficulty AssessmentSimilar to customer market competitive evaluations but conducted by the technical team
105
© Lean Sigm
a Corporation
Lean Six Sigma Training -SXL
www.LeanSigmaCorporation.com
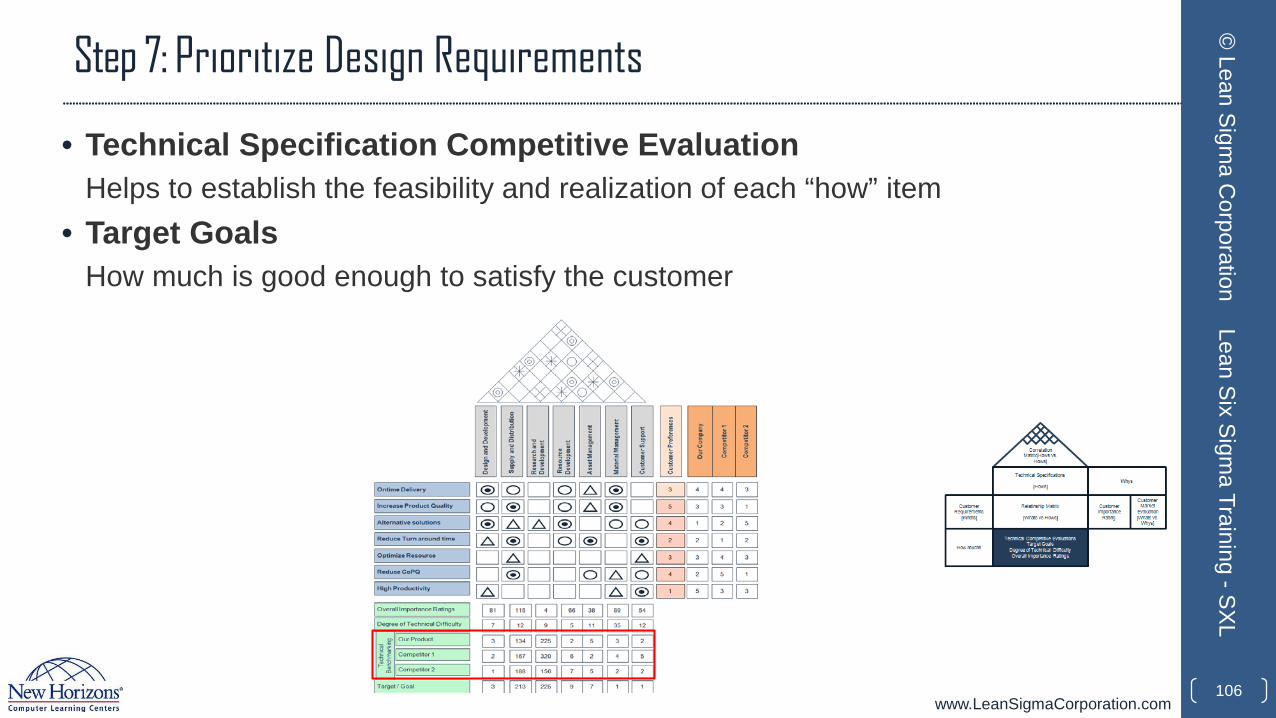
Step 7: Prioritize Design Requirements
• Technical Specification Competitive EvaluationHelps to establish the feasibility and realization of each “how” item
• Target GoalsHow much is good enough to satisfy the customer
106
© Lean Sigm
a Corporation
Lean Six Sigma Training -SXL
www.LeanSigmaCorporation.com
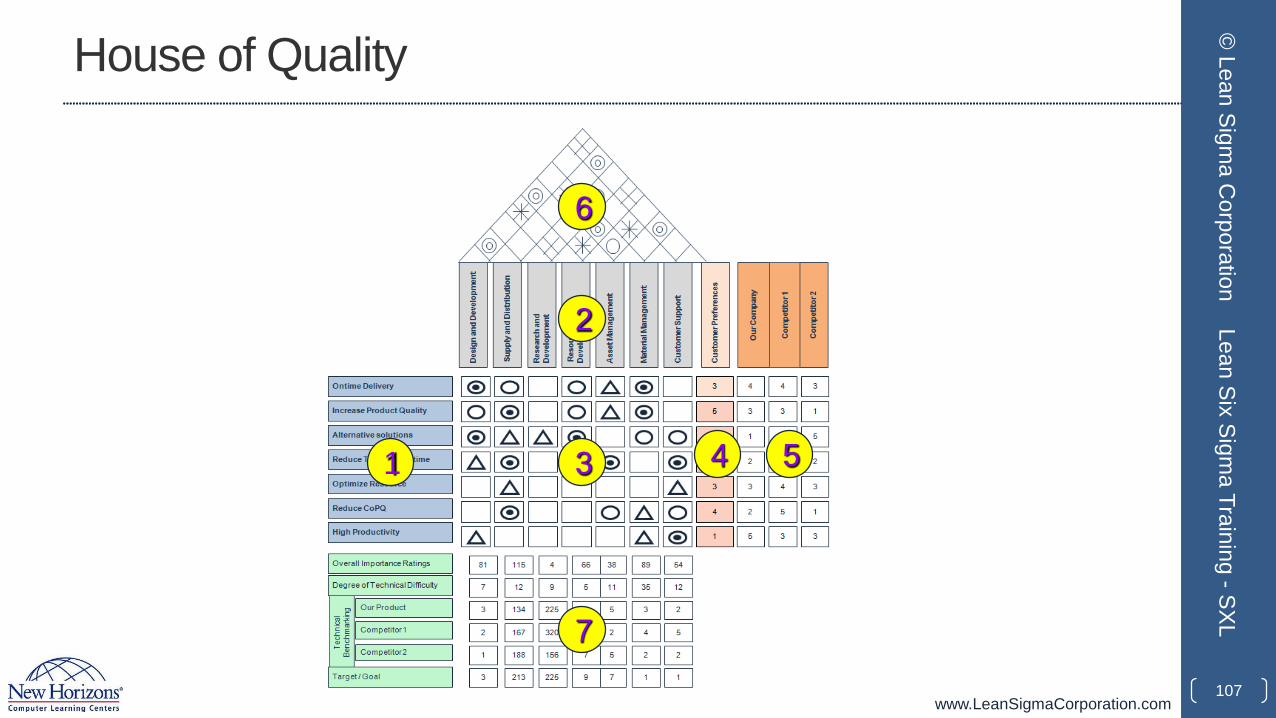
House of Quality
107
© Lean Sigm
a Corporation
Lean Six Sigma Training -SXL
1
2
43 5
6
7

www.LeanSigmaCorporation.com
Pros of QFD
• Focuses the design of the product or process on satisfying customer’s needs and wants.
• Improves the contact channels between customers, advertising, research and improvement, quality and production departments, which sustains better decision making.
• Reduces the new product development project period and cost.
108
© Lean Sigm
a Corporation
Lean Six Sigma Training -SXL
www.LeanSigmaCorporation.com
Cons of QFD
• The relationship matrix can be too obscure with many process inputs and/or many customer constraints.
• It can be very complicated and difficult to implement without experience.
• If throughout the process new ideas, specifications, or requirements are not discovered, you run the risk of losing team members’ trust in the process.
109
© Lean Sigm
a Corporation
Lean Six Sigma Training -SXL
www.LeanSigmaCorporation.com
QFD Summary
When used properly, the quality function deployment is an extremely valuable approach to product/process design. There are many benefits of QFD that can only be realized when each step of the process is completed thoroughly:• Logical way of obtaining information and presenting it• Smallest product development cycle• Considerably condensed start-up costs• Fewer engineering alterations• Reduced chance of supervision during design process• Collaborating environment• Preserving everything in characters.
110
© Lean Sigm
a Corporation
Lean Six Sigma Training -SXL

www.LeanSigmaCorporation.com
1.2.4 Cost of Poor Quality
111
© Lean Sigm
a Corporation
Lean Six Sigma Training -SXL
www.LeanSigmaCorporation.com
Cost of Poor Quality
• Cost of Poor Quality (COPQ) is the expense incurred due to waste, inefficiencies, and defects.
• The COPQ has been proven to range from 5% to 30% of gross sales for most companies.
• The COPQ can be staggering when considering process inefficiencies, hidden factories, defective products, rework, scrap, etc.
• Understanding COPQ and where to look for it will help uncover process inefficiencies, defects, and hidden factories within your business.
112
© Lean Sigm
a Corporation
Lean Six Sigma Training -SXL
www.LeanSigmaCorporation.com
Cost of Poor Quality
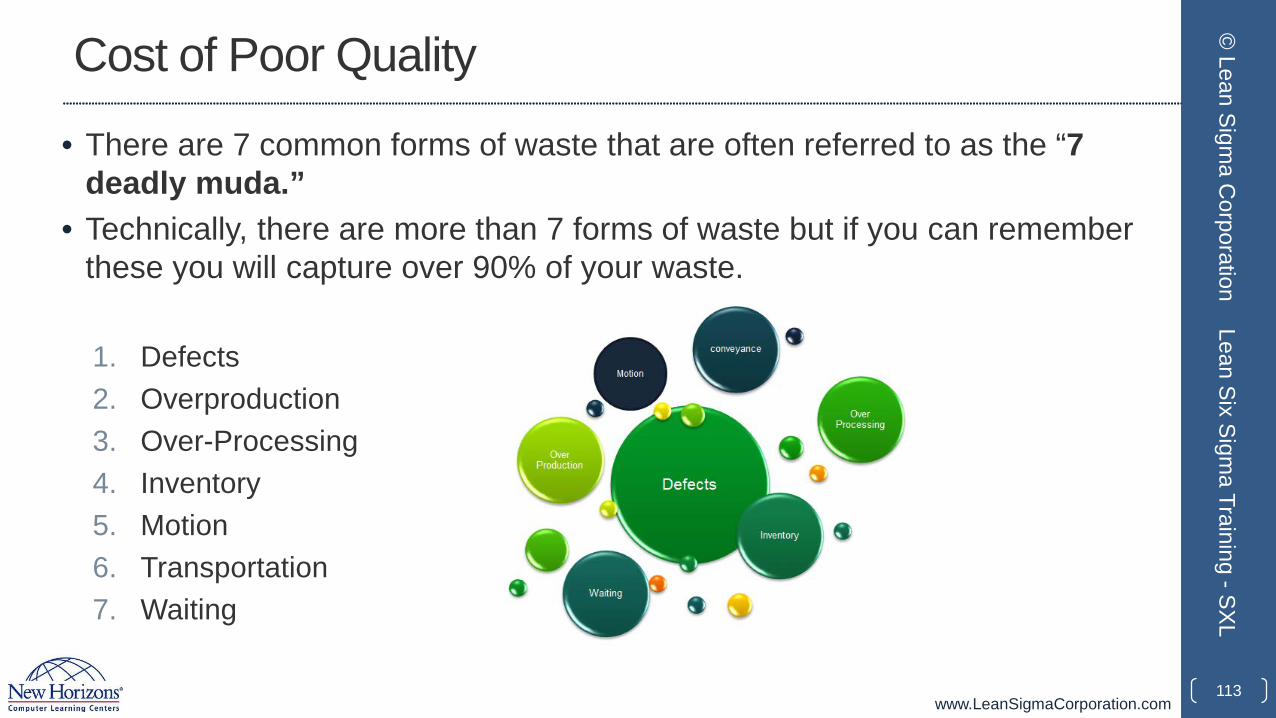
• There are 7 common forms of waste that are often referred to as the “7 deadly muda.”
• Technically, there are more than 7 forms of waste but if you can remember these you will capture over 90% of your waste.
1. Defects2. Overproduction3. Over-Processing4. Inventory5. Motion6. Transportation7. Waiting
113
© Lean Sigm
a Corporation
Lean Six Sigma Training -SXL
www.LeanSigmaCorporation.com
Cost of Poor Quality
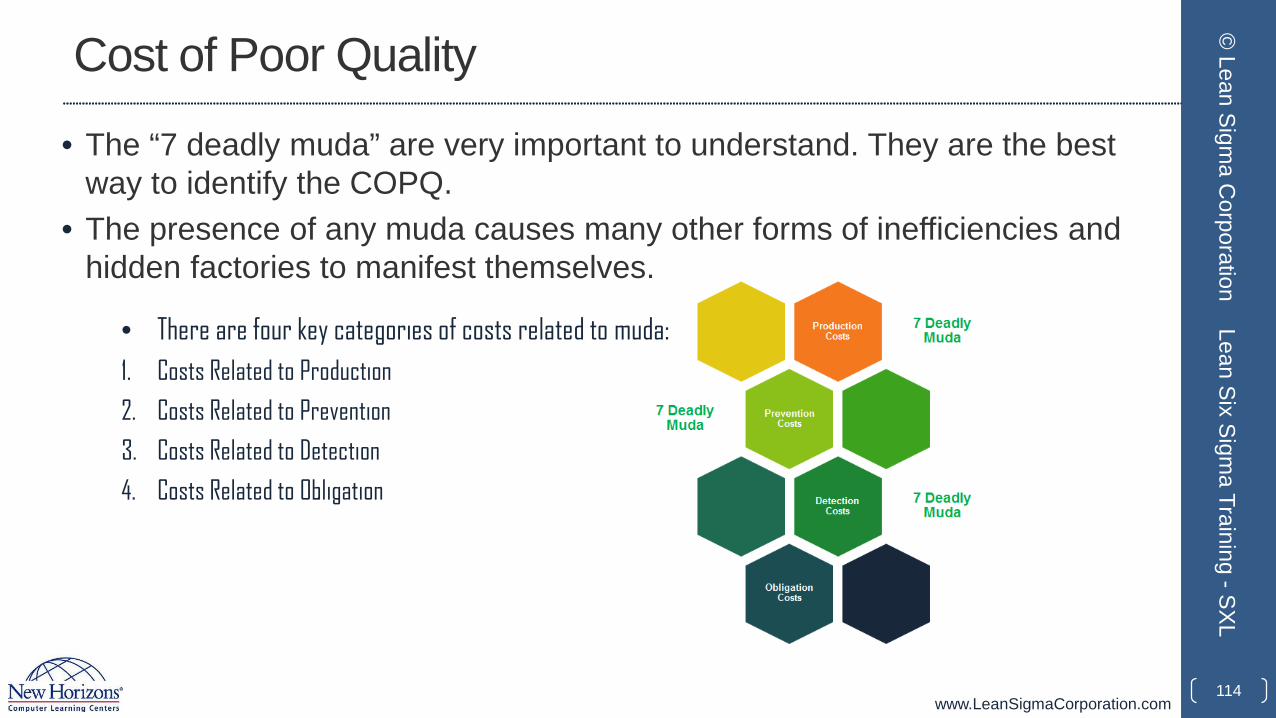
• The “7 deadly muda” are very important to understand. They are the best way to identify the COPQ.
• The presence of any muda causes many other forms of inefficiencies and hidden factories to manifest themselves.
114
© Lean Sigm
a Corporation
Lean Six Sigma Training -SXL
• There are four key categories of costs related to muda:1. Costs Related to Production
2. Costs Related to Prevention
3. Costs Related to Detection
4. Costs Related to Obligation
www.LeanSigmaCorporation.com
COPQ: Costs Related to Production
• Costs related to production are the direct costs of the presence of muda. These forms of COPQ are usually understood and easily observable. They are in fact the “7 deadly muda” themselves.1. Defects
2. Overproduction
3. Over-Processing
4. Inventory
5. Motion
6. Transportation
7. Waiting
115
© Lean Sigm
a Corporation
Lean Six Sigma Training -SXL
www.LeanSigmaCorporation.com
COPQ: Costs Related to Prevention
• Costs related to the prevention of muda are those associated with trying to reduce or eliminate any of the “7 deadly muda.”• Costs for error proofing methods or devices
• Costs for process improvement and quality programs
• Costs for training and certifications
• etc.
• Any costs directly associated with the prevention of waste and defects should be included in the COPQ calculation.
116
© Lean Sigm
a Corporation
Lean Six Sigma Training -SXL
www.LeanSigmaCorporation.com
COPQ: Costs Related to Detection
• Costs related to the detection of muda are those associated with trying to find or observe any of the “7 deadly muda.”• Costs for sampling• Costs for quality control check points• Costs for inspection costs• Costs for cycle counts or inventory accuracy inspections• etc.
• Any costs directly associated with the detection of waste and defects should be included in the COPQ calculation.
117
© Lean Sigm
a Corporation
Lean Six Sigma Training -SXL
www.LeanSigmaCorporation.com
COPQ: Costs Related to Obligation
• Costs related to obligation are those associated with addressing the muda that reaches a customer.• Repair costs
• Warranty costs
• Replacement costs
• Customer returns and customer service overhead
• etc.
• Any costs directly associated with customer obligations should be included in the COPQ calculation.
118
© Lean Sigm
a Corporation
Lean Six Sigma Training -SXL
www.LeanSigmaCorporation.com
COPQ: Types of Cost
• There are two types of costs to be considered when determining COPQ1. Hard Costs
• Tangible costs that can be traced to the income statement2. Soft Costs
• Intangible costs: avoidance, opportunity costs, lost revenue etc.
• Calculating the COPQ1. Determine the types of waste that are present in your process2. Estimate the frequency of waste that occurs3. Estimate the cost per event, item, or time frame4. Do the math.
119
© Lean Sigm
a Corporation
Lean Six Sigma Training -SXL
www.LeanSigmaCorporation.com
1.2.5 Pareto Charts and Analysis
120
© Lean Sigm
a Corporation
Lean Six Sigma Training -SXL
www.LeanSigmaCorporation.com
Pareto Principle
• The Pareto principle is commonly known as the “law of the vital few” or “80:20 rule.”
• It means that the majority (approximately 80%) of effects come from a few (approximately 20%) of the causes.
• This principle was first introduced in early 1900s and has been applied as a rule of thumb in various areas.
• Example of applying the Pareto principle:• 80% of the defects of a process come from 20% of the causes.• 80% of sales come from 20% of customers.
121
© Lean Sigm
a Corporation
Lean Six Sigma Training -SXL
www.LeanSigmaCorporation.com
Pareto Principle
• The Pareto principle helps us to focus on the vital few items that have the most significant impact.
• In concept, it also helps us to prioritize potential improvement efforts.• Since this 80:20 rule was originally based upon the works of Wilfried Fritz
Pareto (or Vilfredo Pareto), the Pareto principle and references to it should be capitalized because Pareto refers to a person (proper noun).• Mr. Pareto is also credited for many works associated with the 80:20, some
more loosely than others:• Pareto’s Law• Pareto efficiency• Pareto distribution etc.
122
© Lean Sigm
a Corporation
Lean Six Sigma Training -SXL
www.LeanSigmaCorporation.com
Pareto Charts
• A Pareto chart is a chart of descending bars with an ascending cumulative line on the top.• Sum or Count:The descending bars on a Pareto chart may be set on a scale that represents the total of all bars or relative to the biggest bucket, depending on the software you are using.
• Percent to Total: A Pareto chart shows the percentage to the total for individual bars.
• Cumulative Percentage: A Pareto chart also shows the cumulative percentage of each additional bar. The data points of all cumulative percentages are connected into an ascending line on the top of all bars.
123
© Lean Sigm
a Corporation
Lean Six Sigma Training -SXL
www.LeanSigmaCorporation.com
Pareto Charts
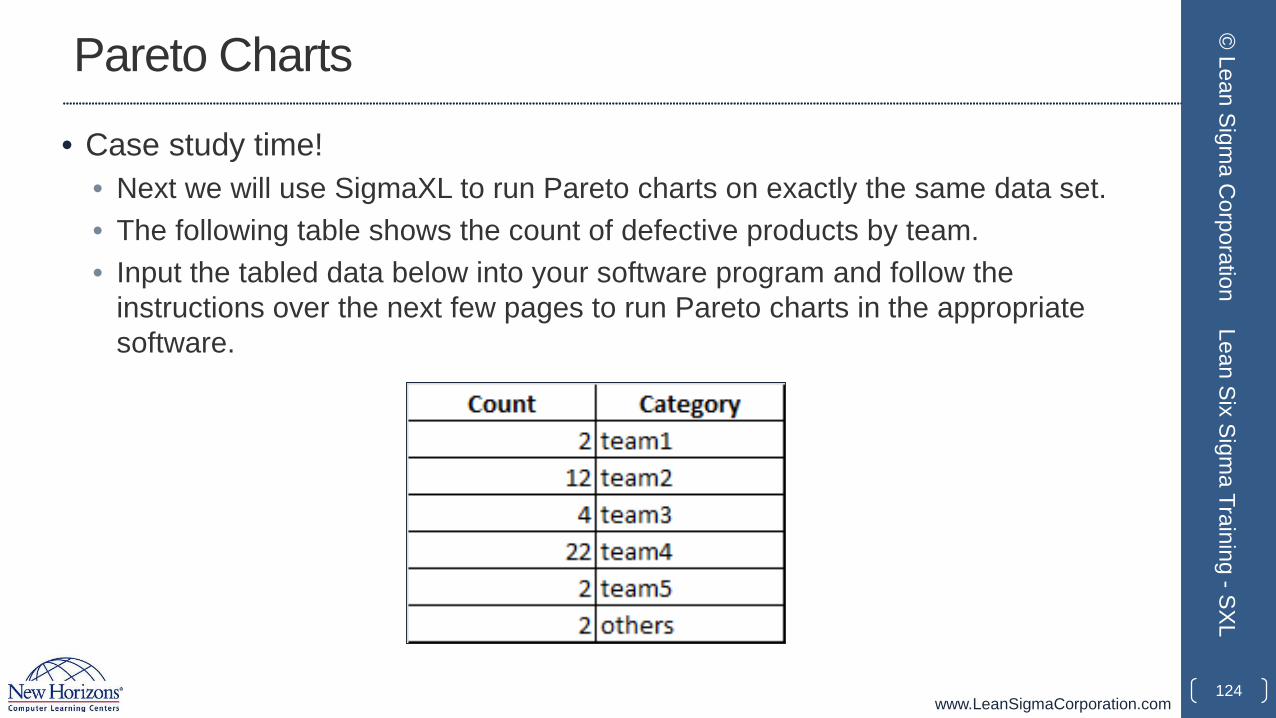
• Case study time!• Next we will use SigmaXL to run Pareto charts on exactly the same data set.• The following table shows the count of defective products by team.• Input the tabled data below into your software program and follow the
instructions over the next few pages to run Pareto charts in the appropriate software.
124
© Lean Sigm
a Corporation
Lean Six Sigma Training -SXL
www.LeanSigmaCorporation.com
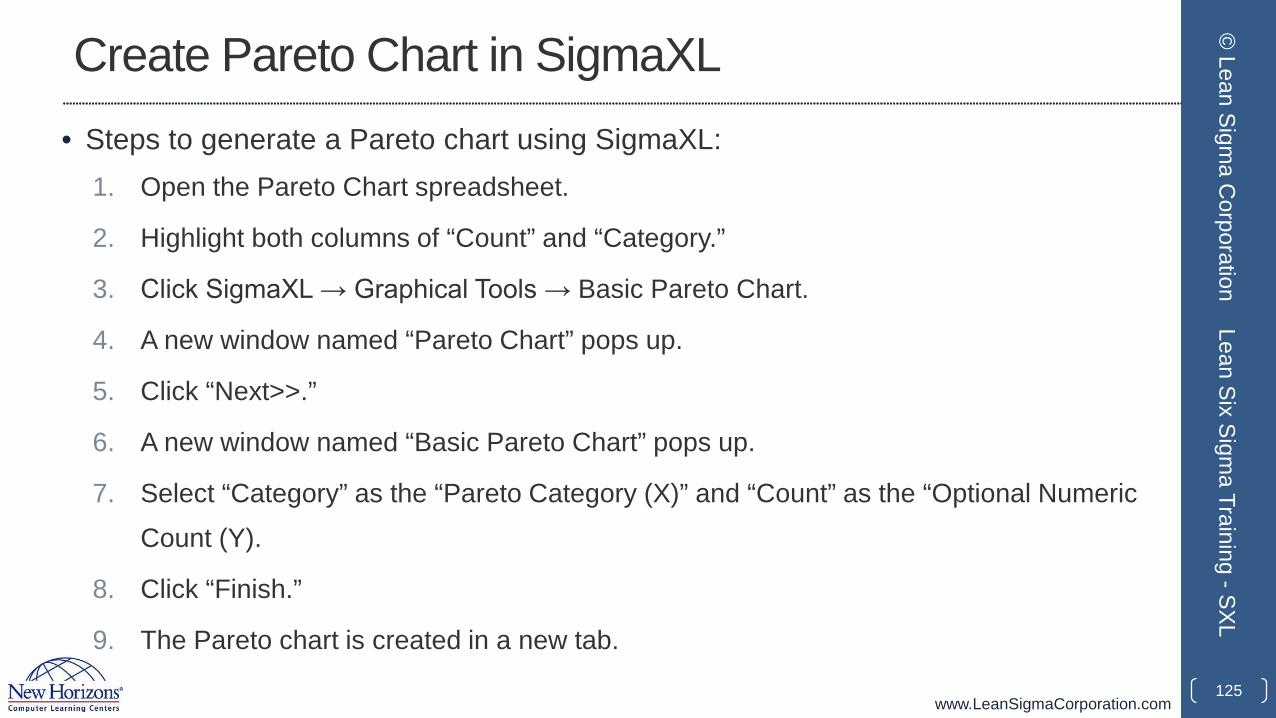
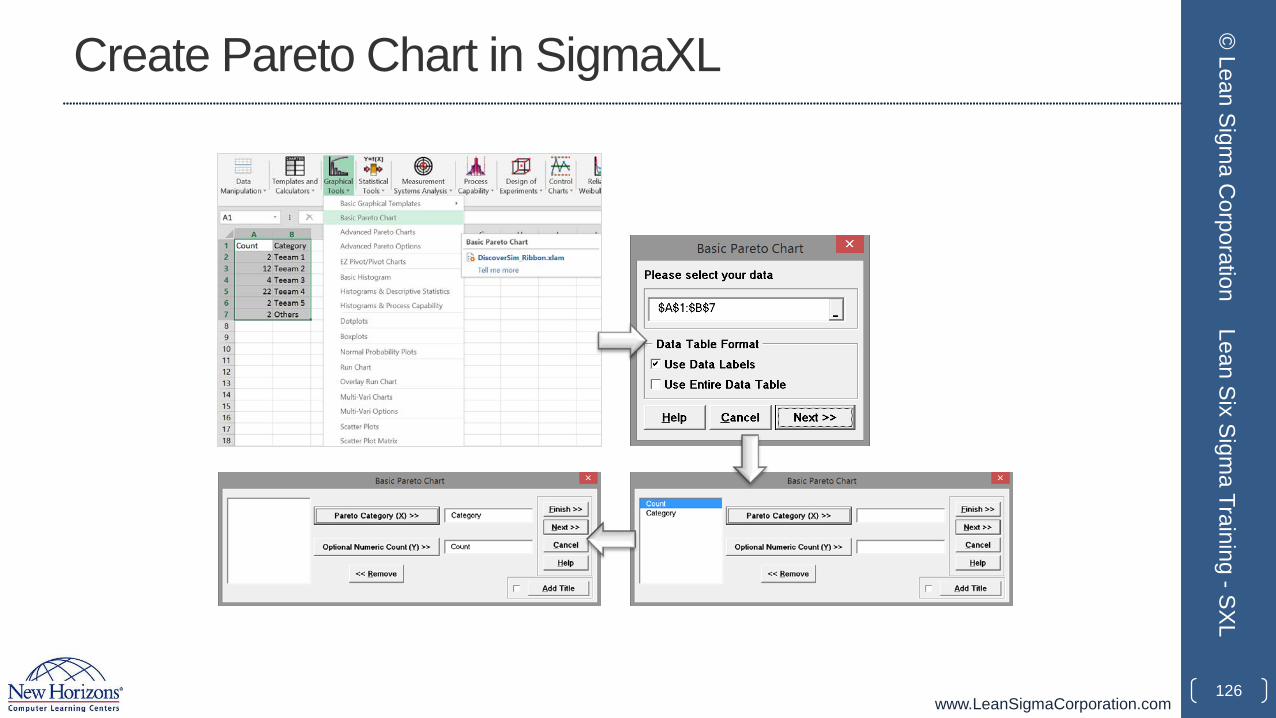
Create Pareto Chart in SigmaXL• Steps to generate a Pareto chart using SigmaXL:
1. Open the Pareto Chart spreadsheet.
2. Highlight both columns of “Count” and “Category.”
3. Click SigmaXL → Graphical Tools → Basic Pareto Chart.
4. A new window named “Pareto Chart” pops up.
5. Click “Next>>.”
6. A new window named “Basic Pareto Chart” pops up.
7. Select “Category” as the “Pareto Category (X)” and “Count” as the “Optional Numeric Count (Y).
8. Click “Finish.”
9. The Pareto chart is created in a new tab.
125
© Lean Sigm
a Corporation
Lean Six Sigma Training -SXL
www.LeanSigmaCorporation.com
Create Pareto Chart in SigmaXL
126
© Lean Sigm
a Corporation
Lean Six Sigma Training -SXL
www.LeanSigmaCorporation.com
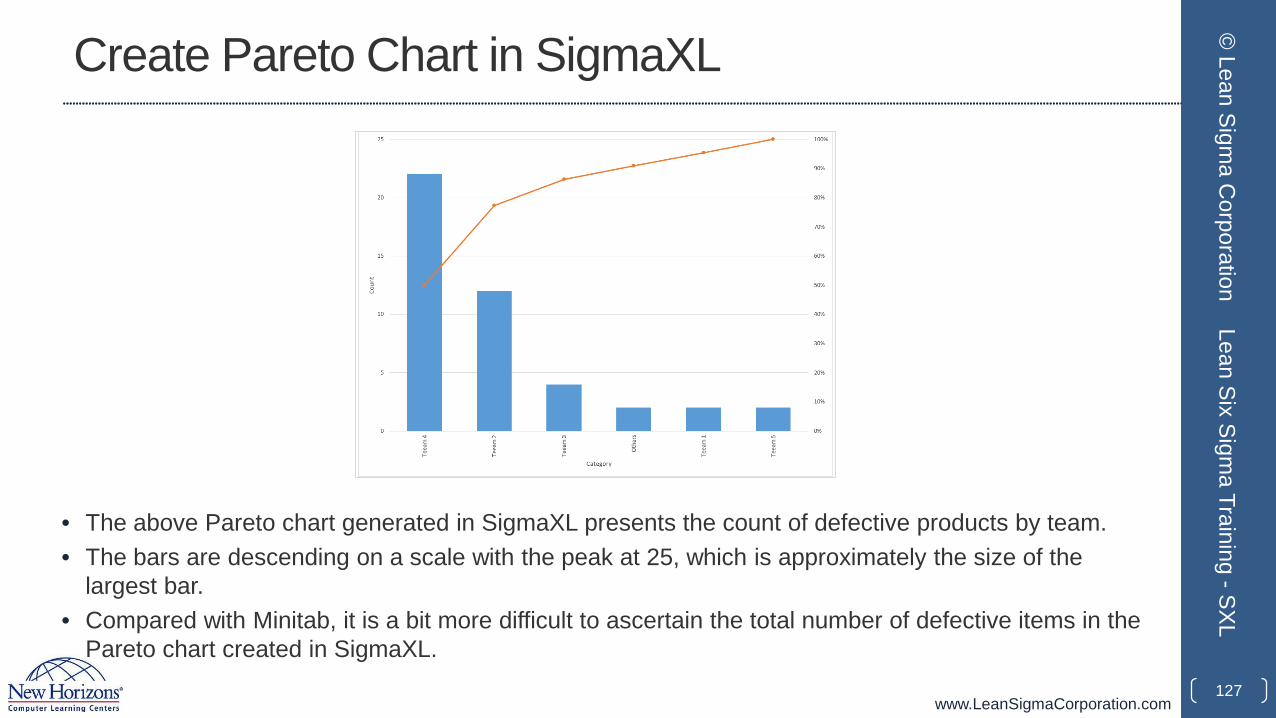
Create Pareto Chart in SigmaXL
• The above Pareto chart generated in SigmaXL presents the count of defective products by team. • The bars are descending on a scale with the peak at 25, which is approximately the size of the
largest bar.• Compared with Minitab, it is a bit more difficult to ascertain the total number of defective items in the
Pareto chart created in SigmaXL.127
© Lean Sigm
a Corporation
Lean Six Sigma Training -SXL
www.LeanSigmaCorporation.com
Pareto Analysis
• The Pareto analysis is used to identify the root causes by using multiple Pareto charts.
• In Pareto analysis, we drill down into the bigger buckets of defects and identify the root causes of defects that contribute heavily to total defects.
• This "drill down" approach effectively solves a significant portion of the problem.
• Next you will see an example of three-level Pareto analysis.• The second-level Pareto is a Pareto chart that is a subset of the tallest bar on
the first Pareto.• The third-level Pareto is a subset of the tallest bar of the second-level Pareto.
128
© Lean Sigm
a Corporation
Lean Six Sigma Training -SXL
www.LeanSigmaCorporation.com
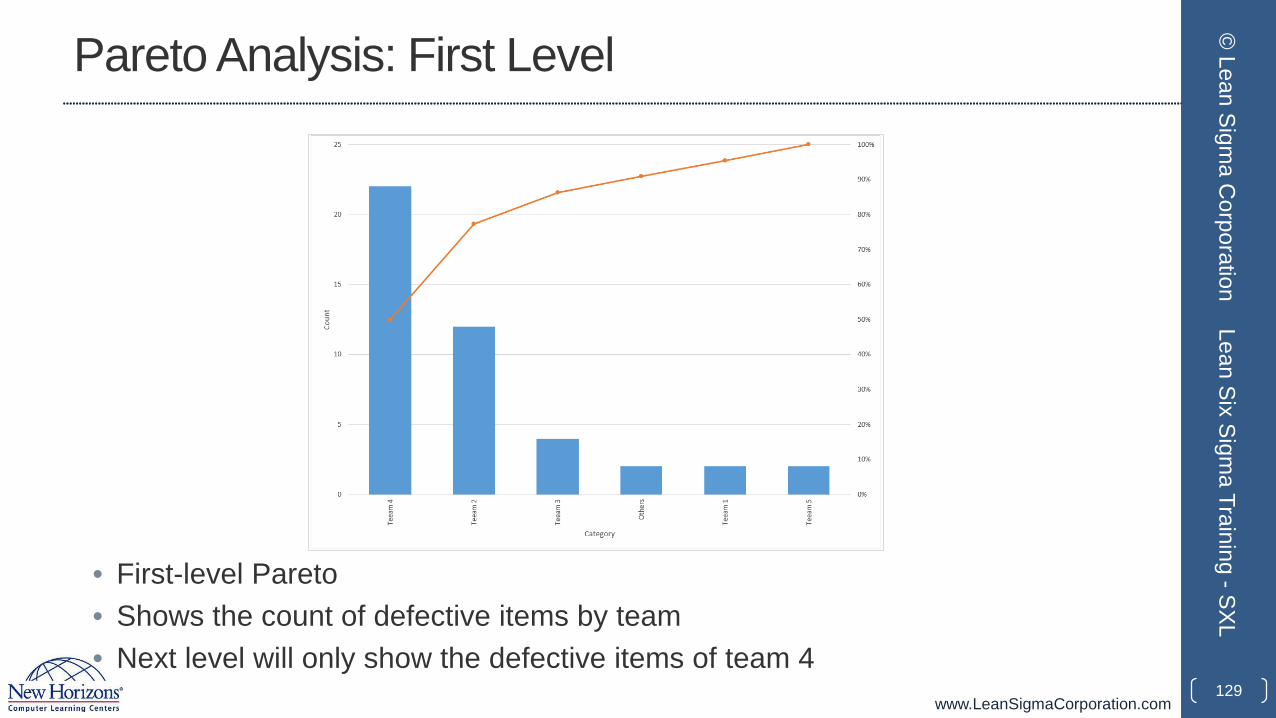
Pareto Analysis: First Level
• First-level Pareto• Shows the count of defective items by team• Next level will only show the defective items of team 4
129
© Lean Sigm
a Corporation
Lean Six Sigma Training -SXL
www.LeanSigmaCorporation.com
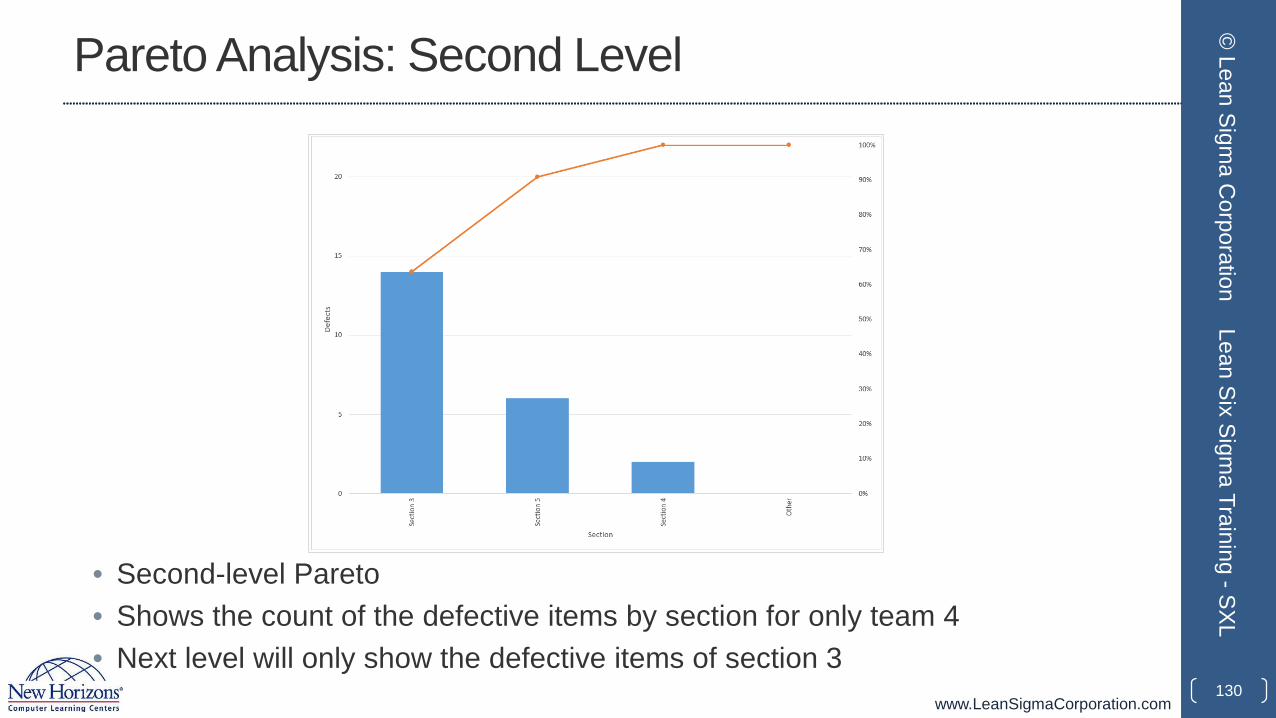
Pareto Analysis: Second Level
• Second-level Pareto• Shows the count of the defective items by section for only team 4• Next level will only show the defective items of section 3
130
© Lean Sigm
a Corporation
Lean Six Sigma Training -SXL
www.LeanSigmaCorporation.com
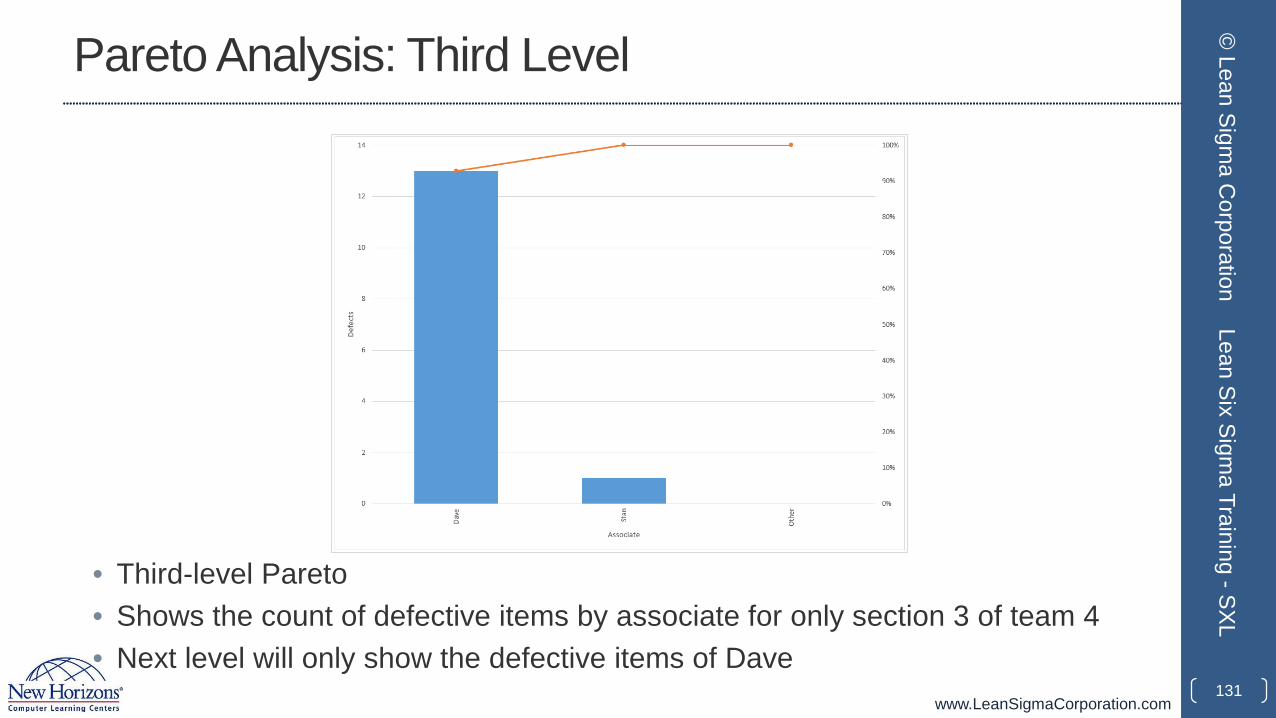
Pareto Analysis: Third Level
• Third-level Pareto• Shows the count of defective items by associate for only section 3 of team 4• Next level will only show the defective items of Dave
131
© Lean Sigm
a Corporation
Lean Six Sigma Training -SXL
www.LeanSigmaCorporation.com
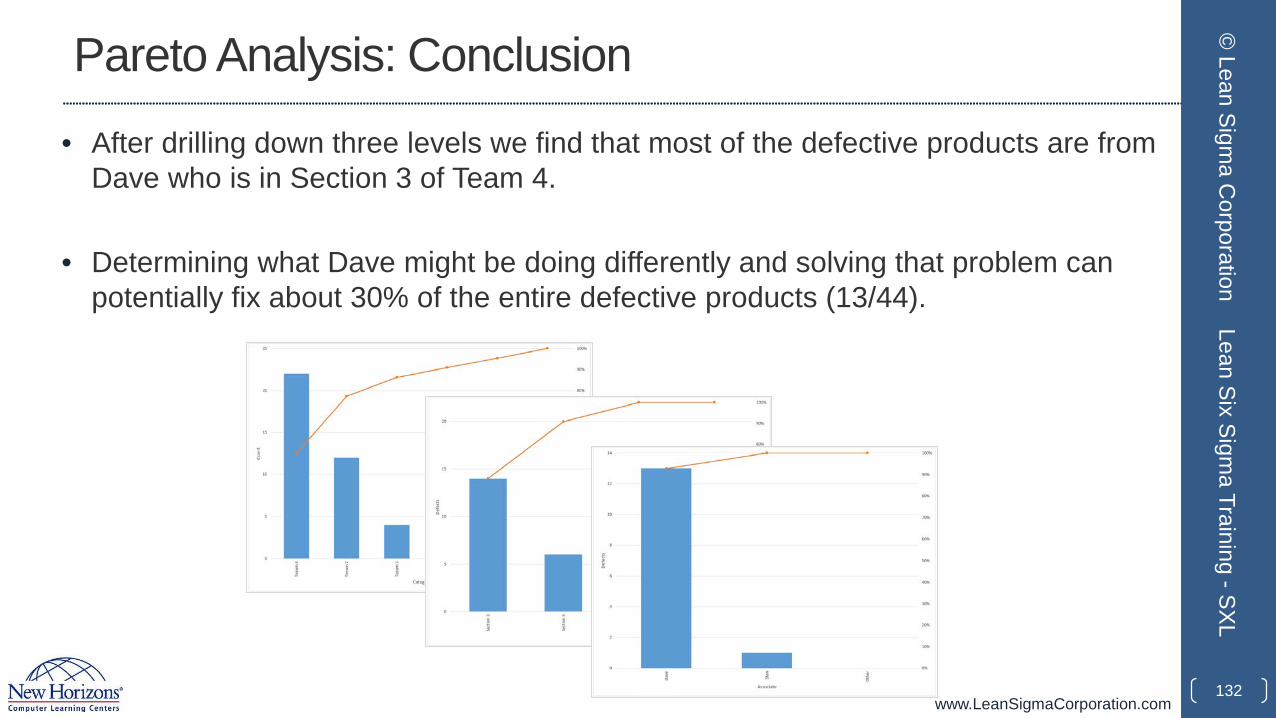
Pareto Analysis: Conclusion• After drilling down three levels we find that most of the defective products are from
Dave who is in Section 3 of Team 4.
• Determining what Dave might be doing differently and solving that problem can potentially fix about 30% of the entire defective products (13/44).
132
© Lean Sigm
a Corporation
Lean Six Sigma Training -SXL
www.LeanSigmaCorporation.com
1.3 Six Sigma Projects
133
© Lean Sigm
a Corporation
Lean Six Sigma Training -SXL
www.LeanSigmaCorporation.com
Yellow Belt Training: Define Phase1.1 Six Sigma Overview
1.1.1 What is Six Sigma1.1.2 Six Sigma History1.1.3 Six Sigma Approach Y = f(x)1.1.4 Six Sigma Methodology1.1.5 Roles and Responsibilities
1.2 Six Sigma Fundamentals1.2.1 Defining a Process1.2.2 VOC and CTQs1.2.3 QFD1.2.4 Cost of Poor Quality (COPQ)1.2.5 Pareto Analysis (80 : 20 rule)
1.3 Lean Six Sigma Projects1.3.1 Six Sigma Metrics1.3.2 Business Case and Charter1.3.3 Project Team Selection1.3.4 Project Risk Management1.3.5 Project Planning
1.4 Lean Fundamentals1.4.1 Lean and Six Sigma1.4.2 History of Lean1.4.3 The Seven Deadly Muda1.4.4 Five-S (5S)
134
© Lean Sigm
a Corporation
Lean Six Sigma Training -SXL

www.LeanSigmaCorporation.com
1.3.1 Six Sigma Metrics
135
© Lean Sigm
a Corporation
Lean Six Sigma Training -SXL
www.LeanSigmaCorporation.com
Six Sigma Metrics
• There are many Six Sigma metrics and/or measures of performance used by Six Sigma practitioners.
• In addition to the ones we will cover here, several others (Sigma level, Cp, Cpk, Pp, Ppk, takt time, cycle time, utilization etc.) will be covered in other modules throughout this training.
• The Six Sigma metrics of interest here in the define phase are:• Defects per Unit (DPU)• Defects per Million Opportunities (DPMO)• Yield (Y)• Rolled Throughput Yield (RTY).
136
© Lean Sigm
a Corporation
Lean Six Sigma Training -SXL
www.LeanSigmaCorporation.com
Defects per Unit: DPU
• DPU stands for “Defects per Unit“• DPU is the basis for calculating DPMO and RTY, which we will cover in the
next few pages.• DPU is found by dividing total defects by total units.
• DPU = D/U
• For example, if you have a process step that produces an average of 65 defects for every 598 units, then your DPU = 65/598 = 0.109.
137
© Lean Sigm
a Corporation
Lean Six Sigma Training -SXL
www.LeanSigmaCorporation.com
DPMO: Defects per Million Opportunities
• DPMO is one of the few important Six Sigma metrics that you should get comfortable with if you are associated with Six Sigma.
• In order to understand DPMO it is best if you first understand both the nomenclature and the nuances such as the difference between defect and defective.
• Nomenclature• Defects = D• Unit = U• Opportunity to have a defect = O
138
© Lean Sigm
a Corporation
Lean Six Sigma Training -SXL
www.LeanSigmaCorporation.com
DPMO: Defects per Million Opportunities
• In order to properly discuss DPMO, we must first explore the differences between "defects" and "defective." • Defective
• Defective suggests that the value or function of the entire unit or product has been compromised.
• Defective items will always have at least one defect. Typically, however, it takes multiple defects and/or critical defects to cause an item to be defective.
• Defect• A defect is an error, mistake, flaw, fault, or some type of imperfection that reduces the
value of a product or unit. • A single defect may or may not render the product or unit "defective" depending on
the specifications of the customer. • Summary
• Defect means that part of a unit is bad. • Defective means that the whole unit is bad.
139
© Lean Sigm
a Corporation
Lean Six Sigma Training -SXL
www.LeanSigmaCorporation.com
DPMO: Defects per Million Opportunities
• Now let us turn our attention to defining "opportunities" so that we can fully understand Defects per Million Opportunities (DPMO).
• Opportunities• Opportunities are the total number of possible defects. • Therefore, if a unit has 6 possible defects, then each unit produced is equal to 6
defect opportunities. • If we produce 100 units, then there are 600 defect opportunities.
140
© Lean Sigm
a Corporation
Lean Six Sigma Training -SXL
www.LeanSigmaCorporation.com
DPMO: Defects per Million Opportunities
• Calculating Defects per Million Opportunities
• The equation is DPMO = (D/(U × O)) × 1,000,000• Example: Let us assume:
• There are 6 defect opportunities per unit• There are an average of 4 defects every 100 units.
• Opportunities = 6 × 100 = 600
• Defect rate = 4/600
• DPMO = 4/600 × 1,000,000 = 6,667
141
© Lean Sigm
a Corporation
Lean Six Sigma Training -SXL
www.LeanSigmaCorporation.com
DPMO: Defects per Million Opportunities
• What is the reason or significance of 1,000,000? • Converting defect rates to a per million value becomes necessary when the
performance of your process approaches Six Sigma.
• When this happens, the number of defects shrinks to virtually nothing. In fact, if you recall from the “What is Six Sigma” module, sigma is 3.4 defects per million opportunities.
• By using 1,000,000 opportunities as the barometer we have the resolution in the measurement to count defects all the way up to Six Sigma.
142
© Lean Sigm
a Corporation
Lean Six Sigma Training -SXL
www.LeanSigmaCorporation.com
RTY: Rolled Throughput Yield
• Rolled Throughput Yield (RTY) is a process performance measure that provides insight into the cumulative effects of an entire process.
• RTY measures the yield for each of several process steps and provides the probability that a unit will come through that process defect-free.
• RTY allows us to expose the "hidden factory" by providing visibility into the yield of each process step.
• This helps us identify the poorest performing process steps and gives us clues into where to look to find the most impactful process improvement opportunities.
143
© Lean Sigm
a Corporation
Lean Six Sigma Training -SXL
www.LeanSigmaCorporation.com
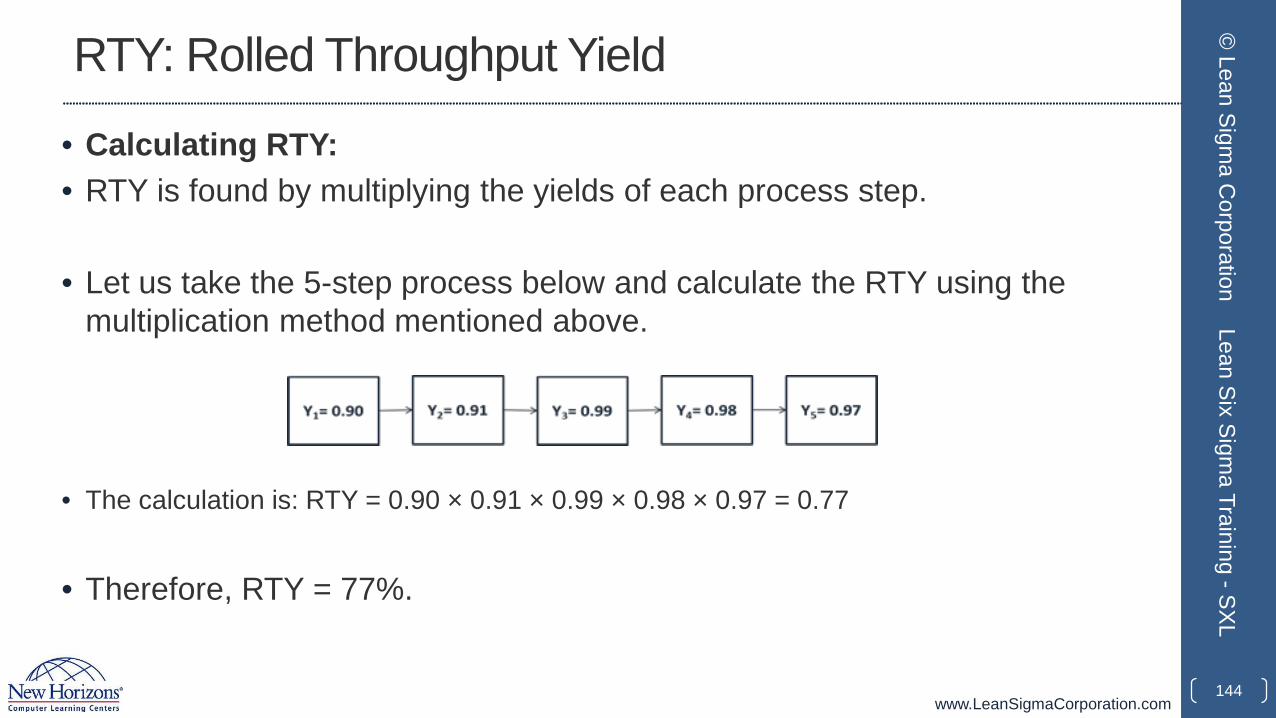
RTY: Rolled Throughput Yield
• Calculating RTY: • RTY is found by multiplying the yields of each process step.
• Let us take the 5-step process below and calculate the RTY using the multiplication method mentioned above.
• The calculation is: RTY = 0.90 × 0.91 × 0.99 × 0.98 × 0.97 = 0.77
• Therefore, RTY = 77%.
144
© Lean Sigm
a Corporation
Lean Six Sigma Training -SXL
www.LeanSigmaCorporation.com
RTY: Rolled Throughput Yield
• You may have noticed that in order to calculate RTY we must determine the yield for each process step.
• Before we get into calculating yield, there are a few abbreviations that need to be declared.
• Abbreviations• Defects = D• Unit = U• Defects per Unit = DPU• Yield = Y• e = 2.71828 (mathematical constant)
145
© Lean Sigm
a Corporation
Lean Six Sigma Training -SXL
www.LeanSigmaCorporation.com
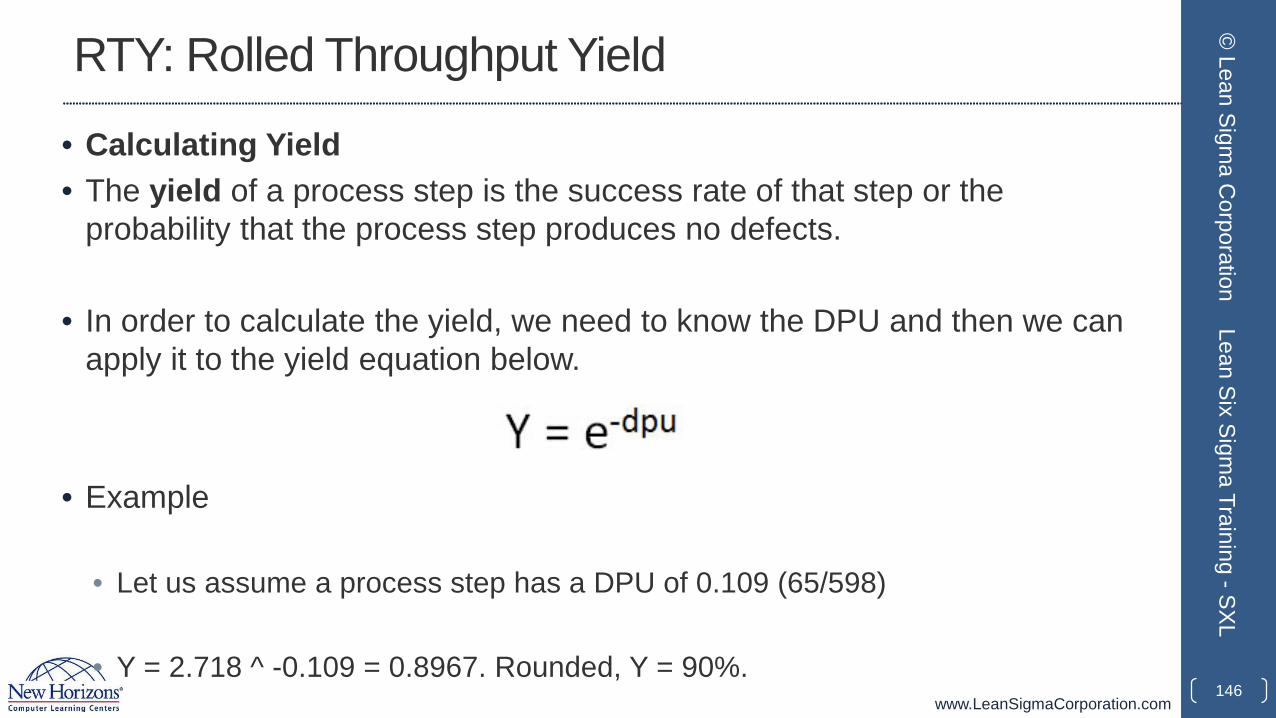
RTY: Rolled Throughput Yield
• Calculating Yield• The yield of a process step is the success rate of that step or the
probability that the process step produces no defects.
• In order to calculate the yield, we need to know the DPU and then we can apply it to the yield equation below.
• Example
• Let us assume a process step has a DPU of 0.109 (65/598)
• Y = 2.718 ^ -0.109 = 0.8967. Rounded, Y = 90%. 146
© Lean Sigm
a Corporation
Lean Six Sigma Training -SXL
www.LeanSigmaCorporation.com
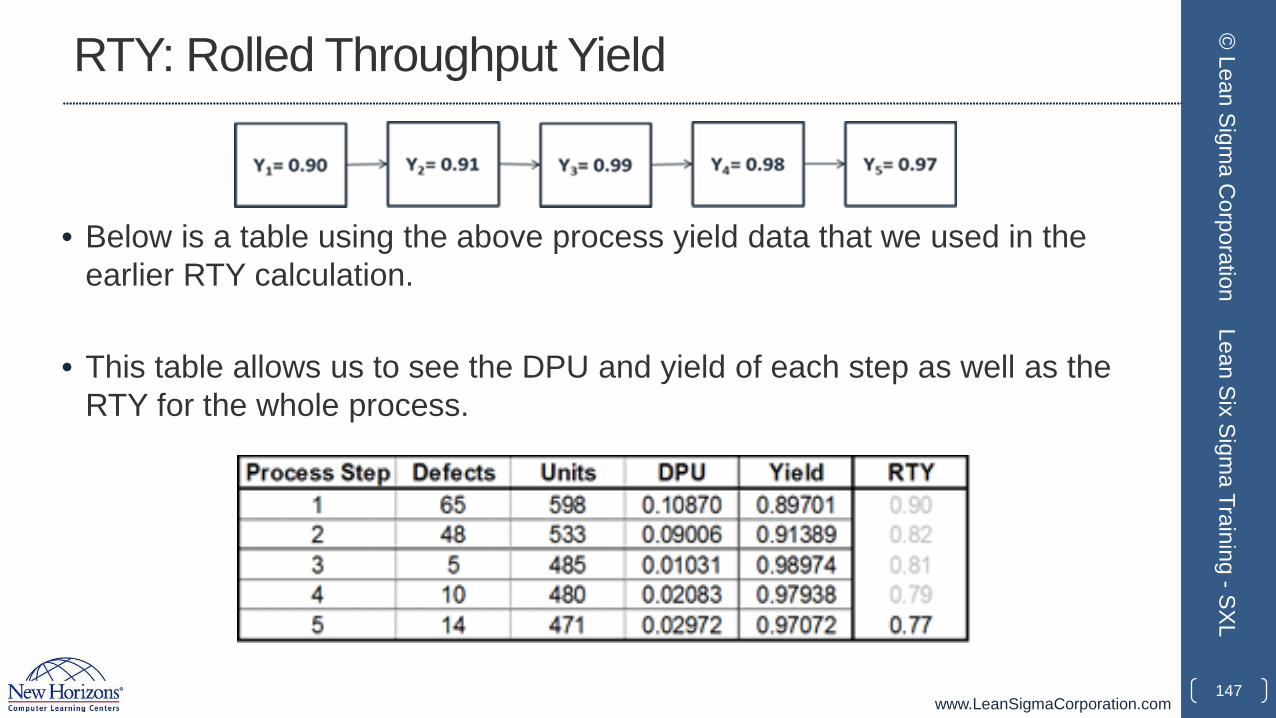
RTY: Rolled Throughput Yield
• Below is a table using the above process yield data that we used in the earlier RTY calculation.
• This table allows us to see the DPU and yield of each step as well as the RTY for the whole process.
147
© Lean Sigm
a Corporation
Lean Six Sigma Training -SXL
www.LeanSigmaCorporation.com
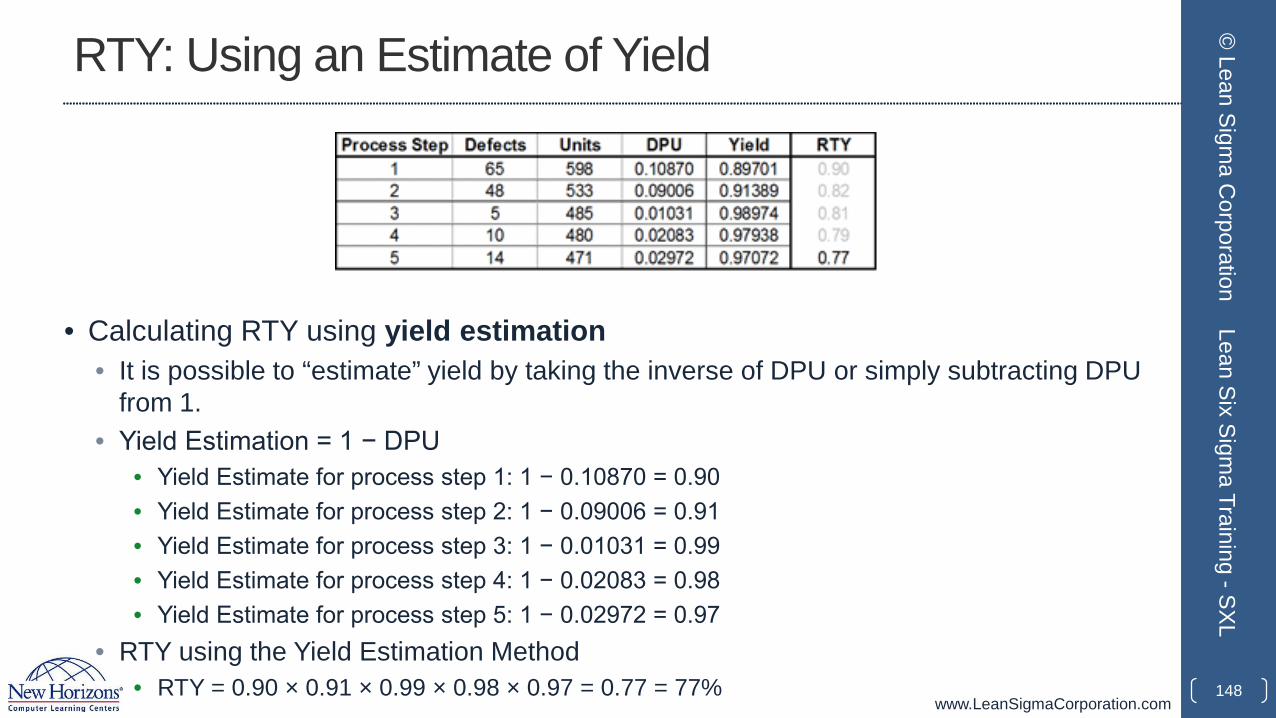
• Calculating RTY using yield estimation• It is possible to “estimate” yield by taking the inverse of DPU or simply subtracting DPU
from 1.• Yield Estimation = 1 − DPU
• Yield Estimate for process step 1: 1 − 0.10870 = 0.90• Yield Estimate for process step 2: 1 − 0.09006 = 0.91• Yield Estimate for process step 3: 1 − 0.01031 = 0.99• Yield Estimate for process step 4: 1 − 0.02083 = 0.98• Yield Estimate for process step 5: 1 − 0.02972 = 0.97
• RTY using the Yield Estimation Method• RTY = 0.90 × 0.91 × 0.99 × 0.98 × 0.97 = 0.77 = 77%
RTY: Using an Estimate of Yield
148
© Lean Sigm
a Corporation
Lean Six Sigma Training -SXL
www.LeanSigmaCorporation.com
1.3.2 Business Case and Charter
149
© Lean Sigm
a Corporation
Lean Six Sigma Training -SXL
www.LeanSigmaCorporation.com
Business Case and Project Charter
• Earlier we stated that DMAIC is a structured and rigorous methodology designed to be repeatedly applied to any process in order to achieve Six Sigma.
• We also stated that DMAIC was a methodology that refers to 5 phases of a project.• Define, Measure, Analyze, Improve, and Control
• Given that the premise of the DMAIC methodology is project-based, we must take the necessary steps to define and initiate a project, hence the need for. . .• Project Charters
150
© Lean Sigm
a Corporation
Lean Six Sigma Training -SXL
www.LeanSigmaCorporation.com
Project Charter
• The purpose of a project charter is to provide vital information about a project in a quick and easy-to-comprehend manner.
• Project charters are used to get approval and buy-in for projects and initiatives as well as declaring:
• The scope of work
• Project teams
• Decision authorities
• Project lead
• Success measures
151
© Lean Sigm
a Corporation
Lean Six Sigma Training -SXL
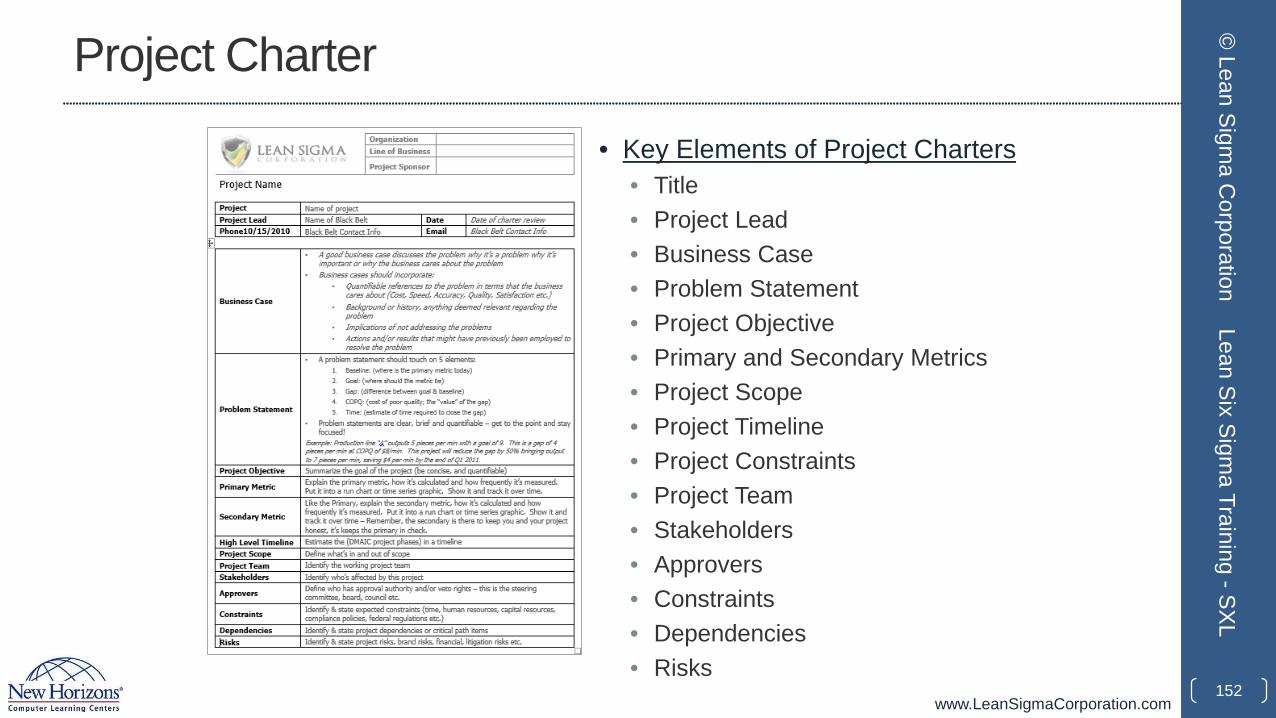
www.LeanSigmaCorporation.com
Project Charter
• Key Elements of Project Charters• Title• Project Lead• Business Case• Problem Statement• Project Objective• Primary and Secondary Metrics• Project Scope• Project Timeline• Project Constraints• Project Team• Stakeholders• Approvers• Constraints• Dependencies• Risks
152
© Lean Sigm
a Corporation
Lean Six Sigma Training -SXL
www.LeanSigmaCorporation.com
Project Charter: Key Elements
• Title• Projects should have a name, title, or some reference that identifies them. • Branding can be an important ingredient in the success of a project so be sure
your project has a reference name or title.
• Leader• Any projects needs a declared leader or someone who is responsible for
project’s execution and success. • You may hear references to RACI throughout in your Six Sigma journey. • RACI stands for Responsible, Accountable, Consulted, Informed and identifies
the people that play those roles. • Every project must have declared leaders indicating who is responsible and who
is accountable.
153
© Lean Sigm
a Corporation
Lean Six Sigma Training -SXL
www.LeanSigmaCorporation.com
Project Charter: Key Elements
• Business Case• A business case is the quantifiable reason why the project is important.
• Business cases help shed light on problems. They explain why a business should care.
• Business cases must be quantified and stated succinctly.
• COPQ is a key method of quantification for any business case.
154
© Lean Sigm
a Corporation
Lean Six Sigma Training -SXL
www.LeanSigmaCorporation.com
Project Charter: Key Elements
• Problem Statement and Objective• A properly written problem statement has an objective statement woven into it. • There should be no question as to the current state or the goal.
• A gap should be declared, the gap being the difference between the present state and the goal state.
• The project objective should be to close the gap or reduce the gap by some reasonable amount.
• Valuation or COPQ is the monetary value assigned to the gap. • Lastly, a well-written problem statement refers to a timeline expected to be met.
155
© Lean Sigm
a Corporation
Lean Six Sigma Training -SXL
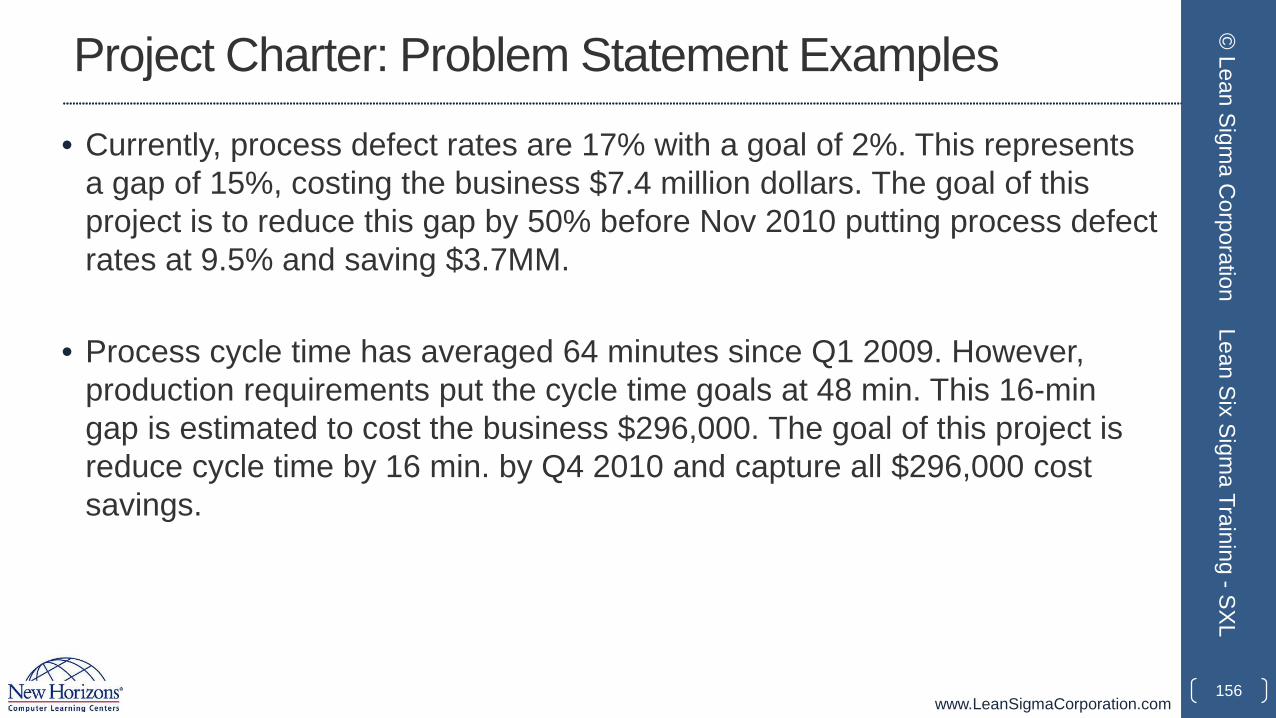
www.LeanSigmaCorporation.com
Project Charter: Problem Statement Examples
• Currently, process defect rates are 17% with a goal of 2%. This represents a gap of 15%, costing the business $7.4 million dollars. The goal of this project is to reduce this gap by 50% before Nov 2010 putting process defect rates at 9.5% and saving $3.7MM.
• Process cycle time has averaged 64 minutes since Q1 2009. However, production requirements put the cycle time goals at 48 min. This 16-min gap is estimated to cost the business $296,000. The goal of this project is reduce cycle time by 16 min. by Q4 2010 and capture all $296,000 cost savings.
156
© Lean Sigm
a Corporation
Lean Six Sigma Training -SXL
www.LeanSigmaCorporation.com
Project Charter: Key Elements
• Metrics
• A measure of success is an absolute for any project.
• Metrics give clarity to the purpose of the work.
• Metrics establish how the initiative will be judged.
• Metrics establish a baseline or “starting point.”
• For Six Sigma projects…metrics are mandatory!
157
© Lean Sigm
a Corporation
Lean Six Sigma Training -SXL
www.LeanSigmaCorporation.com
Project Charter: Key Elements
• Primary Metric• The primary metric is a generic term for a Six Sigma project's most important
measure of success. The primary metric is defined by the Black Belt, GB, MBB, or Champion.
• A primary metric is an absolute MUST for any project and it should not be taken lightly. Here are a few characteristics of good primary metrics.
• Primary metrics should be:• tied to the problem statement• measureable• expressed with an equation• aligned to business objectives• tracked at the proper frequency (hourly, daily, weekly, monthly etc.)• expressed pictorially over time with a run chart, time series, or control chart• validated with an MSA.
158
© Lean Sigm
a Corporation
Lean Six Sigma Training -SXL
www.LeanSigmaCorporation.com
Project Charter: Key Elements
• The primary metric is the reason for your work.
• It is the success indicator.
• It is your beacon.
• The primary metric is of utmost importance and should be improved, butnot at the expense of your secondary metric.
159
© Lean Sigm
a Corporation
Lean Six Sigma Training -SXL
www.LeanSigmaCorporation.com
Project Charter: Key Elements
• Secondary Metric• The secondary metric is the thing you do not want sacrificed on behalf of a
primary improvement. • A secondary metric is one that makes sure problems are not just "changing
forms" or "moving around." • The secondary metric keeps us honest and ensures we are not sacrificing too
much for our primary metric. • If your primary metric is a cost or speed metric, then your secondary metric
should probably be some quality measure.• Example: If you were accountable for saving energy in an office building and your
primary metric was energy consumption then you could shut off all the lights and the HVAC system and save tons of energy. . .except that your secondary metrics are probably comfort and functionality of the work environment.
160
© Lean Sigm
a Corporation
Lean Six Sigma Training -SXL
www.LeanSigmaCorporation.com
Project Charter: Key Elements
• Elements of a Good Project Charters (continued)
• Scope Statement – defined by high-level process map
• Stakeholders Identified – who is affected by the project
• Approval Authorities Identified – who makes the final call
• Review Committees Defined – who is on the review team
• Risks and Dependencies Highlighted – identify risks and critical path items
• Project Team Declared – declare team members
• Project Timeline Estimated – set high-level timeline expectations.
161
© Lean Sigm
a Corporation
Lean Six Sigma Training -SXL

www.LeanSigmaCorporation.com
1.3.3 Project Team Selection
162
© Lean Sigm
a Corporation
Lean Six Sigma Training -SXL
www.LeanSigmaCorporation.com
Project Team Selection
• Six Sigma project team selection is the cornerstone of a successful Six Sigma project.
• Teams and Team Success
• A team is a group of people who share complementary skills and experience.
• A team will be dedicated to consistent objectives.
• Winning teams share similar and coordinated goals.
• Teams often execute common methods or approaches.
• Team members hold each other accountable for achieving shared goals.
163
© Lean Sigm
a Corporation
Lean Six Sigma Training -SXL
www.LeanSigmaCorporation.com
Project Team Selection
• What makes a team successful?
• Shared goals
• Commitment
• Leadership
• Respect
• Effective communication
• Autonomy
• Diversity (capabilities, knowledge, skills, experience etc.)
• Adequate resources.164
© Lean Sigm
a Corporation
Lean Six Sigma Training -SXL
www.LeanSigmaCorporation.com
Project Team Selection• Keys to Team Success
• Agreed focus on the goal or the problem at hand• Focus on problems that have meaning to the business• Focus on solvable problems within the scope of influence; a successful team does not seek
unattainable solutions.• Team Selection
• Selected teammates have proper skills and knowledge• Adequately engaged management• Appropriate support and guidance from their direct leader
• Successful teams use reliable methods• Follow the prescribed DMAIC methodology• Manage data, information, and statistical evidence
• Successful teams always have exceeds players• Winning teams typically
• Have unusually high standards.• Have greater expectations of themselves and each other.• Do not settle for average or even above average results. 165
© Lean Sigm
a Corporation
Lean Six Sigma Training -SXL
www.LeanSigmaCorporation.com
Project Team Selection
• Principles of Team Selection: • Select team members based on
• Skills required to achieve the objective• Experience (Subject Matter Expertise)• Availability and willingness to participate• Team size (usually 4–8 members)
• Don’t go at it alone!• Don’t get too many cooks in the kitchen!
• Members’ ability to navigate• The process• The company• The political landscape
• Be sure to consider the inputs of others • Heed advice• Seek guidance
166
© Lean Sigm
a Corporation
Lean Six Sigma Training -SXL
www.LeanSigmaCorporation.com
Project Team Development• All teams experience the following four stages of development. It is helpful to
understand these phases so that you can anticipate what your team is going to experience.
• The four stages of team development process:• Forming• Storming• Norming• Performing
• Teammates seek something different at each stage:• In the forming stage they seek inclusion• In the storming stage they seek direction and guidance• In the norming stage they seek agreement• In the performing stage they seek results.
167
© Lean Sigm
a Corporation
Lean Six Sigma Training -SXL
www.LeanSigmaCorporation.com
Project Team Development
• Patterns of a team in the Forming stage:• Roles and responsibilities are unclear• Process and procedures are ignored• Scope and parameter setting is loosely attempted• Discussions are vague and frustrating• There is a high dependence on leadership for guidance
• Patterns of a team in the Storming stage:• Attempts to skip the research and jump to solutions• Impatience for some team members regarding lack of progress• Arguments about decisions and actions of the team• Team members establish their position• Subgroups or small teams form• Power struggles exist and resistance is present
168
© Lean Sigm
a Corporation
Lean Six Sigma Training -SXL
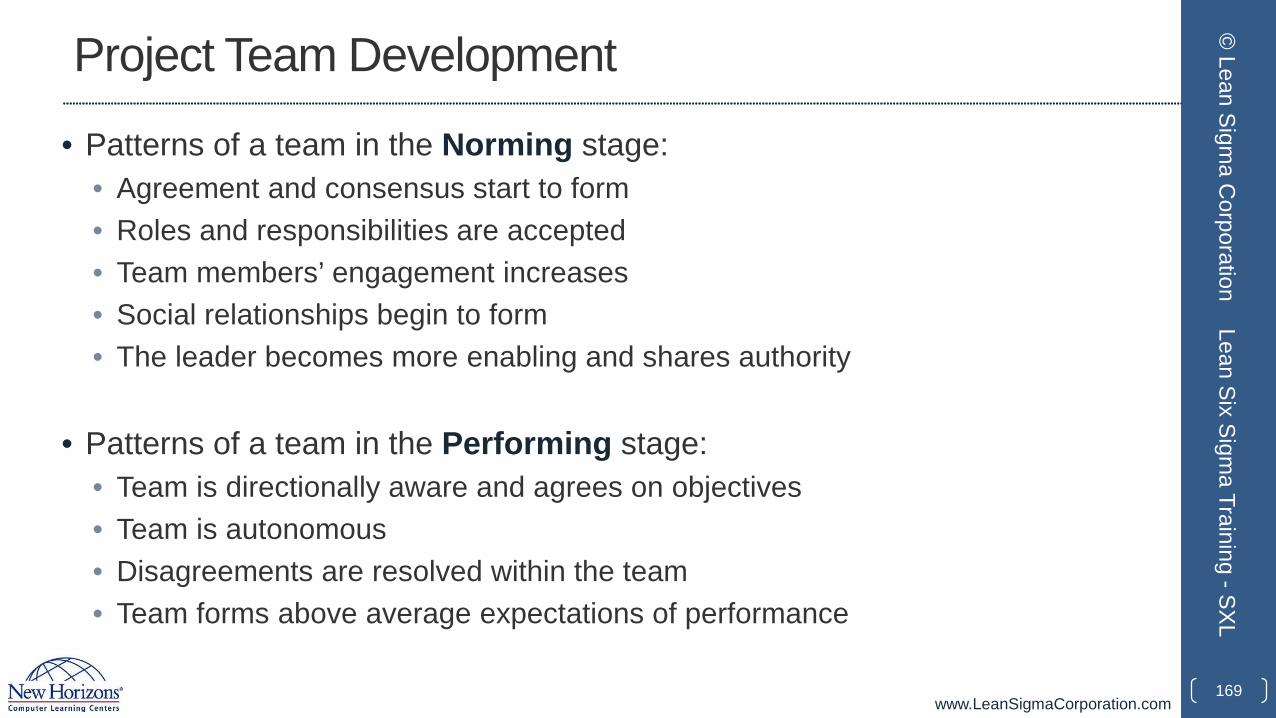
www.LeanSigmaCorporation.com
Project Team Development
• Patterns of a team in the Norming stage:• Agreement and consensus start to form• Roles and responsibilities are accepted• Team members’ engagement increases• Social relationships begin to form• The leader becomes more enabling and shares authority
• Patterns of a team in the Performing stage: • Team is directionally aware and agrees on objectives• Team is autonomous• Disagreements are resolved within the team• Team forms above average expectations of performance
169
© Lean Sigm
a Corporation
Lean Six Sigma Training -SXL
www.LeanSigmaCorporation.com
Project Team Development
• Well-structured and energized project teams are the essential components of any successful Six Sigma project.
• To have better chances of executing the project successfully, you will need to understand and effectively manage the team development process.
170
© Lean Sigm
a Corporation
Lean Six Sigma Training -SXL
www.LeanSigmaCorporation.com
1.3.4 Project Risk Management
171
© Lean Sigm
a Corporation
Lean Six Sigma Training -SXL
www.LeanSigmaCorporation.com
Risk
Risk is defined as a future event that can impact the task/project if it occurs.
172
© Lean Sigm
a Corporation
Lean Six Sigma Training -SXL

www.LeanSigmaCorporation.com
What is Project Risk Management?
• The main purpose of risk management is to foresee potential risks that may inhibit the project deliverables from being delivered on time, within budget, and at the appropriate level of quality, and then to mitigate these risks by creating, implementing, and monitoring contingency plans.
• Risk management is concerned with identifying, assessing, and monitoring project risks before they develop into issues and impact the project.
• Risk analysis helps to identify and manage potential problems that could impact key business initiatives or project goals.
173
© Lean Sigm
a Corporation
Lean Six Sigma Training -SXL
www.LeanSigmaCorporation.com
Three Basic Parameters of Risk Analysis• Risk Assessment:
The process of identifying and evaluating risks, whether in absolute or relative terms.
• Risk Management:Project risk management is the effort of responding to risks throughout the life of a project and in the interest of meeting project goals and objectives.
• Risk Communication:Communication plays a vital role in the risk analysis process because it leads to a good understanding of risk assessment and management decisions.
174
© Lean Sigm
a Corporation
Lean Six Sigma Training -SXL
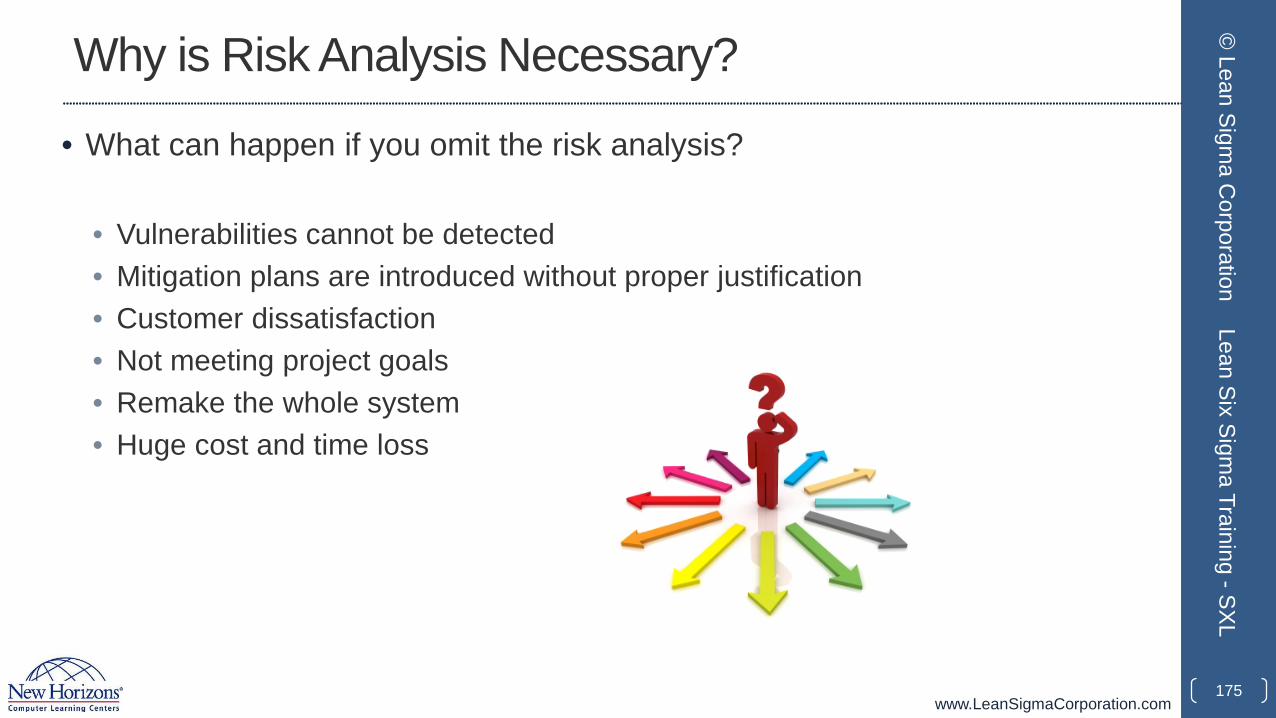
www.LeanSigmaCorporation.com
Why is Risk Analysis Necessary?
• What can happen if you omit the risk analysis?
• Vulnerabilities cannot be detected• Mitigation plans are introduced without proper justification• Customer dissatisfaction• Not meeting project goals• Remake the whole system• Huge cost and time loss
175
© Lean Sigm
a Corporation
Lean Six Sigma Training -SXL
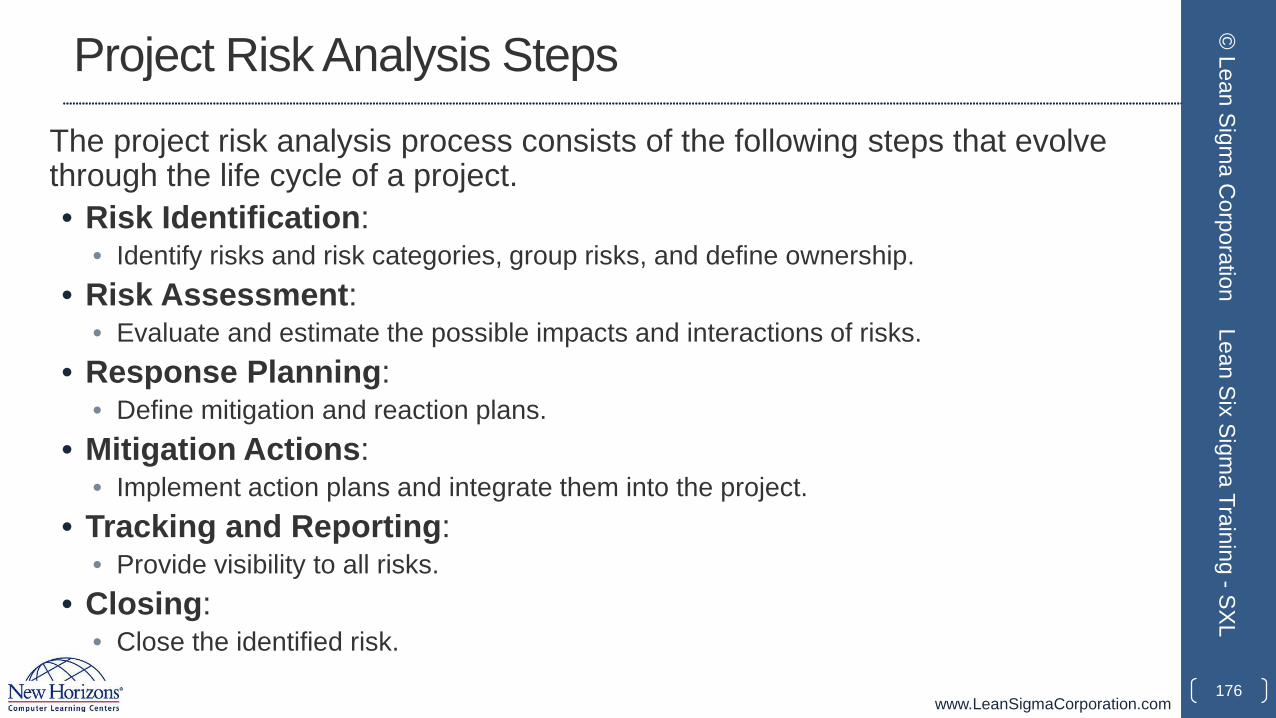
www.LeanSigmaCorporation.com
Project Risk Analysis StepsThe project risk analysis process consists of the following steps that evolve through the life cycle of a project. • Risk Identification:
• Identify risks and risk categories, group risks, and define ownership.• Risk Assessment:
• Evaluate and estimate the possible impacts and interactions of risks.• Response Planning:
• Define mitigation and reaction plans.• Mitigation Actions:
• Implement action plans and integrate them into the project.• Tracking and Reporting:
• Provide visibility to all risks.• Closing:
• Close the identified risk.176
© Lean Sigm
a Corporation
Lean Six Sigma Training -SXL
www.LeanSigmaCorporation.com
Risk Identification
The first action of risk management is the identificationof individual events that the project may encounterduring its lifecycle.
The identification step comprises:
• Identify the risks• Categorize the risks • Match the identified risks to categories• Define ownership for managing the risks.
177
© Lean Sigm
a Corporation
Lean Six Sigma Training -SXL
www.LeanSigmaCorporation.com
Risk Identification
• Source of Risk: • Identification of risk sources provides a basis for systematically examining
changing situations over time to uncover circumstances that impact the ability of the project to meet its objectives.
178
© Lean Sigm
a Corporation
Lean Six Sigma Training -SXL

www.LeanSigmaCorporation.com
Risk Identification
179
© Lean Sigm
a Corporation
Lean Six Sigma Training -SXL
Source of Risk Description
Human Resources The risks originated from human resources (e.g. availability, skill etc.)
Physical Resources
The risks originated from physical resources (e.g. hardware or software, availability of the required number at the right time etc.)
Technology The risks originated from technology (e.g. development environment, new or complex technologies, performance requirements, tools etc.)
Suppliers The risks are associated with a supplier (e.g. delays in supplies, capability of suppliers etc.)
Customer The risks derived from the customer (e.g. unclear requirements, requirement volatility, change in project scope, delays in response etc.)
Security The risks are associated with information security, security of personnel, security of assets, and security of intellectual property
Legal The risks are associated with legal issues that may impact the project
Project management
The risks are associated with project management processes, organizational maturity, and ability
www.LeanSigmaCorporation.com
Risk Identification
Risk Parameters:Parameters for evaluating, categorizing, and prioritizing risks include the following:
• Risk likelihood (i.e. probability of risk occurrence)• Risk consequence (i.e. impact and severity of risk occurrence)• Thresholds to trigger management activities.
180
© Lean Sigm
a Corporation
Lean Six Sigma Training -SXL
www.LeanSigmaCorporation.com
Risk Assessment
The risk assessment consists of evaluating the range of possible impacts should the risk occur.
Follow these steps when assessing risks: 1) Define the various impacts of each risk2) Rate each impact based on a logical severity level 3) Sort and evaluate risks by severity level4) Determine if any controls already exist5) Define potential mitigation actions.
181
© Lean Sigm
a Corporation
Lean Six Sigma Training -SXL
www.LeanSigmaCorporation.com
Risk Mitigation Planning
The risk owners are responsible for planning and implementing mitigation actions with support from the project team. • All team members, inclusive of partners and suppliers, may be requested
to identify and develop mitigation measures for identified risks.• The project core team members are responsible for identifying an
appropriate action owner for each identified risk. • After mitigation actions are defined, the project core team will review the
actions.• The risk owner must track all mitigation actions and expected completion
dates.• The risk owner and the project core team members must hold all action
owners accountable for the risk mitigation planning.
182
© Lean Sigm
a Corporation
Lean Six Sigma Training -SXL
www.LeanSigmaCorporation.com
Risk Mitigation Action Implementation
• The action implementation is the responsibility of the risk owner.
• The action owners are responsible for the execution of the tasks or activities necessary to complete the mitigation action and eliminate or minimize the risk.
• The risk owner or the project manager will monitor completion dates of the mitigation action implementation.
183
© Lean Sigm
a Corporation
Lean Six Sigma Training -SXL
www.LeanSigmaCorporation.com
Risk Occurrence and Contingency Plans
• Whenever any risk occurs, the project team should implement contingency plans to ensure that project deliverables can be met.
• The details of each occurrence should be recorded in the risk register or other tracking tool.
• The risk register or risk management plan (see next slide) will be maintained by the project manager and reviewed on a regular basis.
184
© Lean Sigm
a Corporation
Lean Six Sigma Training -SXL
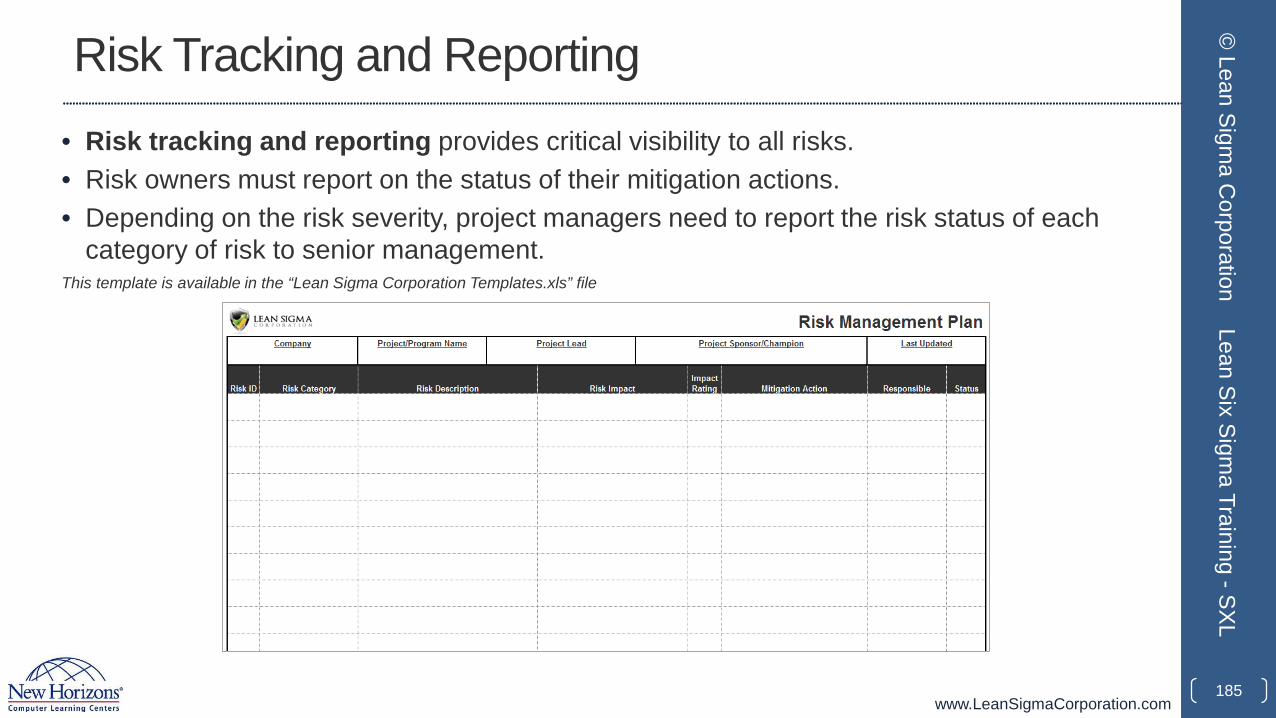
www.LeanSigmaCorporation.com
Risk Tracking and Reporting• Risk tracking and reporting provides critical visibility to all risks. • Risk owners must report on the status of their mitigation actions. • Depending on the risk severity, project managers need to report the risk status of each
category of risk to senior management.This template is available in the “Lean Sigma Corporation Templates.xls” file
185
© Lean Sigm
a Corporation
Lean Six Sigma Training -SXL
www.LeanSigmaCorporation.com
Risk Closure
• The risk owners are responsible for recommending the risk closure to the project manager.
• A risk is closed only when the item is not considered a risk to the project anymore.
• When a risk is closed, the project manager needs to update the risk status in the lessons learned document.
186
© Lean Sigm
a Corporation
Lean Six Sigma Training -SXL
www.LeanSigmaCorporation.com
Risk Analysis FeaturesThe risk analysis should be:• Systematic• Comprehensive• Data driven• Adherent to evidence• Logically sound• Practically acceptable• Open to critique• Easy to understand.
187
© Lean Sigm
a Corporation
Lean Six Sigma Training -SXL
www.LeanSigmaCorporation.com
Project Risk Analysis Advantages
• Helps strategic and business planning• Meets customer requirements• Reduces schedule slips and cost overruns• Promotes an effective usage of resources• Promotes continuous improvement• Helps to achieve project goals• Minimizes surprises from customers and stakeholders• Allows a quick grasp of new opportunities• Enhances communication• Reassures stakeholders that the project stays on track.
188
© Lean Sigm
a Corporation
Lean Six Sigma Training -SXL

www.LeanSigmaCorporation.com
1.3.5 Project Planning
189
© Lean Sigm
a Corporation
Lean Six Sigma Training -SXL
www.LeanSigmaCorporation.com
What is Project Management?
• Project management is the process of defining, planning, organizing, managing, leading, securing, and optimizing the resources to achieve a set of planned goals and objectives.
• It is the application of knowledge, skills, tools, and techniques to project activities in order to meet project requirements.
190
© Lean Sigm
a Corporation
Lean Six Sigma Training -SXL
www.LeanSigmaCorporation.com
What is a Project Plan?
• A project plan is a crucial step in project management for achieving a project’s goals.
• A project plan is a formal approved document used to guide and execute project tasks.
• It provides an overall framework for managing project tasks, schedules, and costs.
• A project plan is a coordinating tool and communication device that helps teams, contractors, customers, and organizations define the crucial aspects of a project or program.
191
© Lean Sigm
a Corporation
Lean Six Sigma Training -SXL
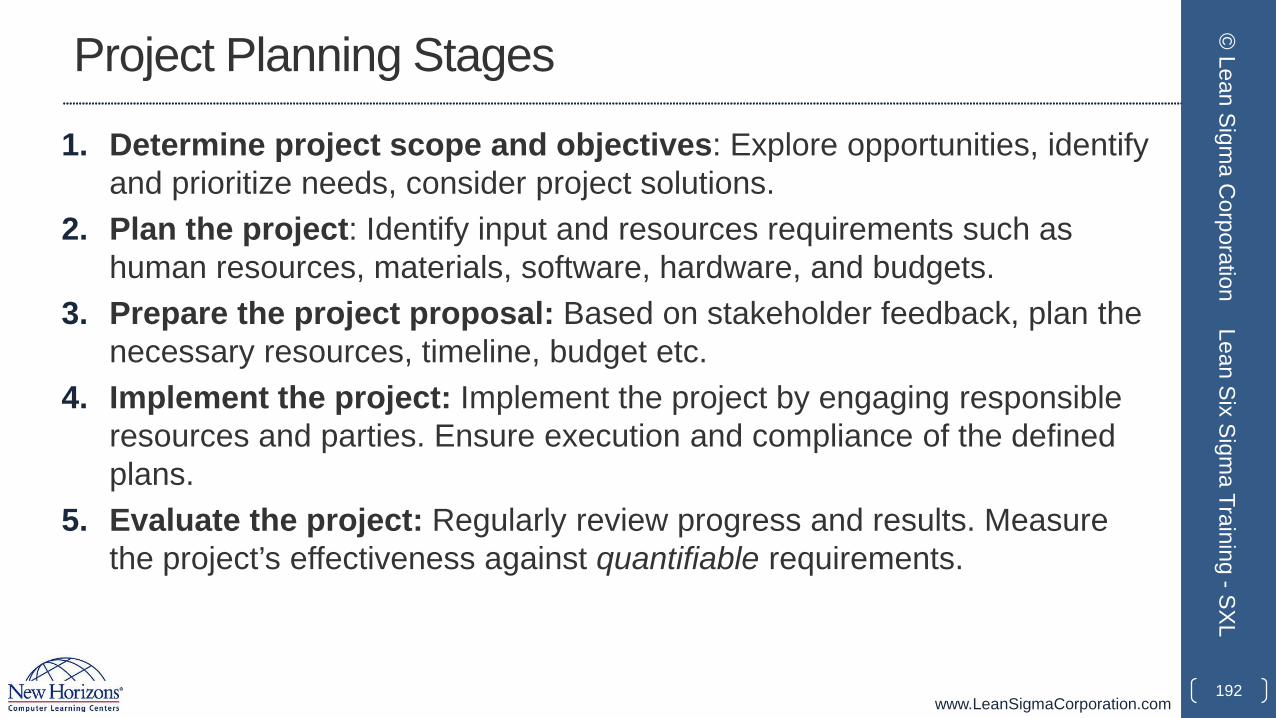
www.LeanSigmaCorporation.com
Project Planning Stages
1. Determine project scope and objectives: Explore opportunities, identify and prioritize needs, consider project solutions.
2. Plan the project: Identify input and resources requirements such as human resources, materials, software, hardware, and budgets.
3. Prepare the project proposal: Based on stakeholder feedback, plan the necessary resources, timeline, budget etc.
4. Implement the project: Implement the project by engaging responsible resources and parties. Ensure execution and compliance of the defined plans.
5. Evaluate the project: Regularly review progress and results. Measure the project’s effectiveness against quantifiable requirements.
192
© Lean Sigm
a Corporation
Lean Six Sigma Training -SXL
www.LeanSigmaCorporation.com
Planning and Scheduling Objectives
• To optimize the use of resources (both human and other resources).
• To increase productivity
• To achieve desired schedules and deliverables
• To establish an approach to minimize long-term maintenance costs
• To minimize the chaos and productivity losses resulting from planned production schedules, priority changes, and non-availability of resources.
• To assess current needs and future challenges. 193
© Lean Sigm
a Corporation
Lean Six Sigma Training -SXL
www.LeanSigmaCorporation.com
Project Planning Activities
• Statement of work (SOW)• Work breakdown structure (WBS)• Resource estimation plan• Project schedule• Budget or financial plan• Communication plan• Risk management plan
194
© Lean Sigm
a Corporation
Lean Six Sigma Training -SXL
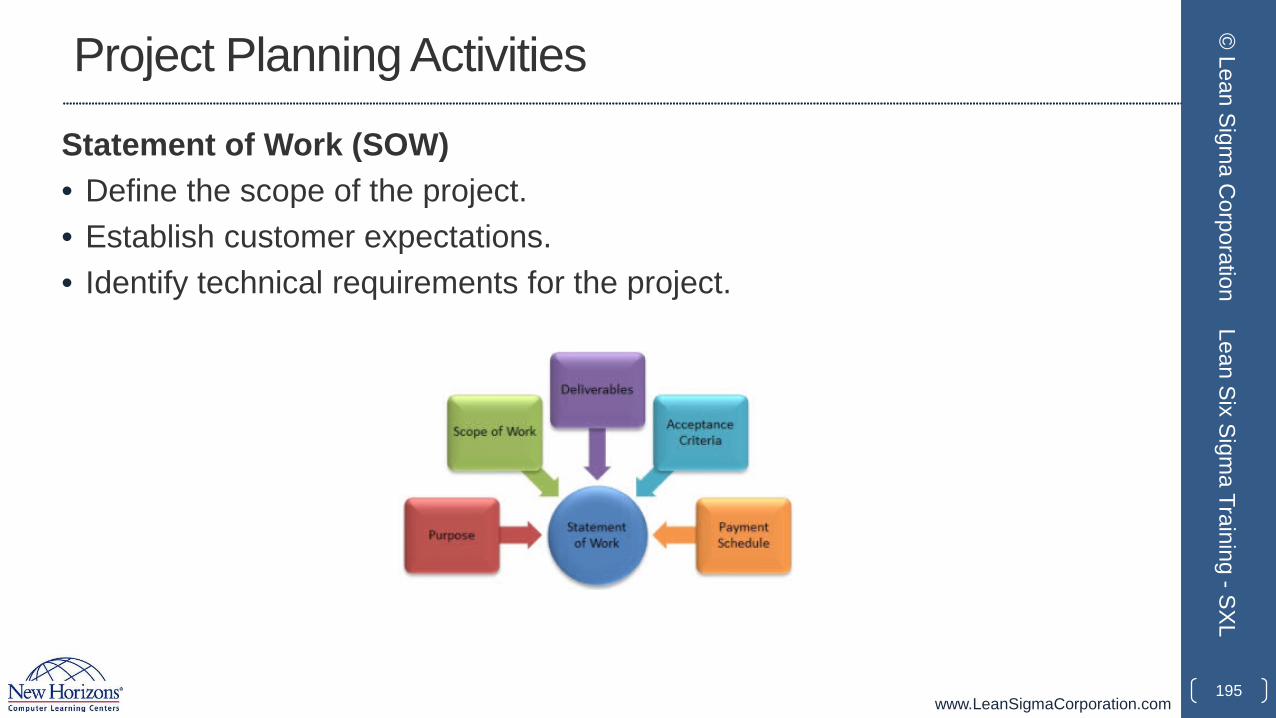
www.LeanSigmaCorporation.com
Project Planning Activities
Statement of Work (SOW)• Define the scope of the project.• Establish customer expectations.• Identify technical requirements for the project.
195
© Lean Sigm
a Corporation
Lean Six Sigma Training -SXL
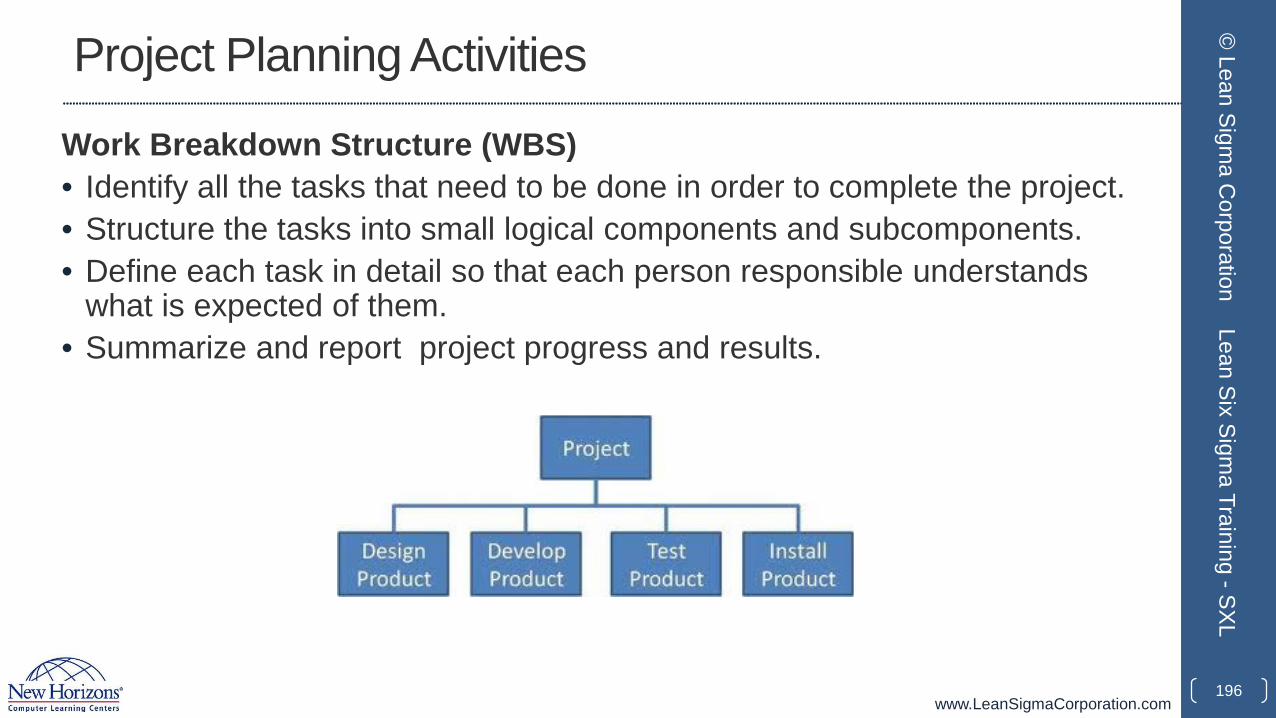
www.LeanSigmaCorporation.com
Project Planning Activities
Work Breakdown Structure (WBS)• Identify all the tasks that need to be done in order to complete the project.• Structure the tasks into small logical components and subcomponents.• Define each task in detail so that each person responsible understands
what is expected of them.• Summarize and report project progress and results.
196
© Lean Sigm
a Corporation
Lean Six Sigma Training -SXL
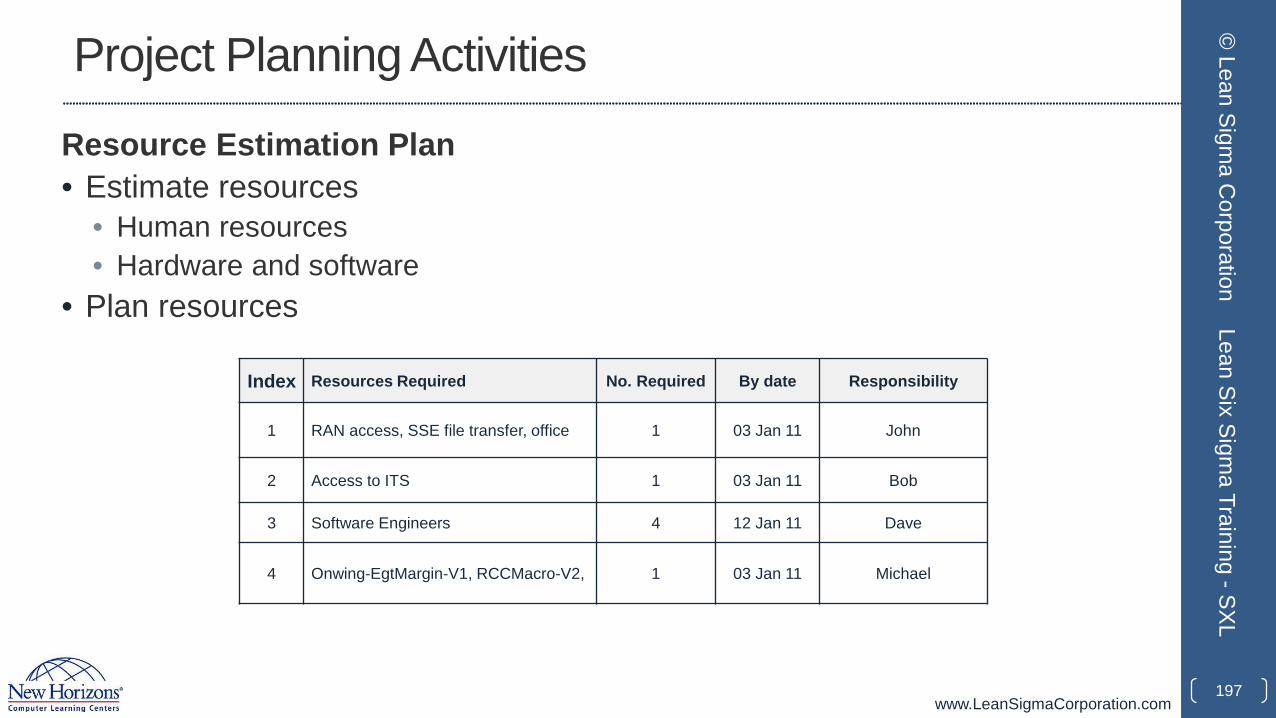
www.LeanSigmaCorporation.com
Project Planning Activities
Resource Estimation Plan• Estimate resources
• Human resources• Hardware and software
• Plan resources
197
© Lean Sigm
a Corporation
Lean Six Sigma Training -SXL
Index Resources Required No. Required By date Responsibility
1 RAN access, SSE file transfer, office 1 03 Jan 11 John
2 Access to ITS 1 03 Jan 11 Bob
3 Software Engineers 4 12 Jan 11 Dave
4 Onwing-EgtMargin-V1, RCCMacro-V2, 1 03 Jan 11 Michael
www.LeanSigmaCorporation.com
Project Planning Activities
Project Schedule• Assign time estimates to each activity in the WBS.• Create each task start and end dates.• Represent schedules as Gantt charts or network diagrams (PERT/CPM)
charts.• Identify critical dependencies between tasks.
198
© Lean Sigm
a Corporation
Lean Six Sigma Training -SXL
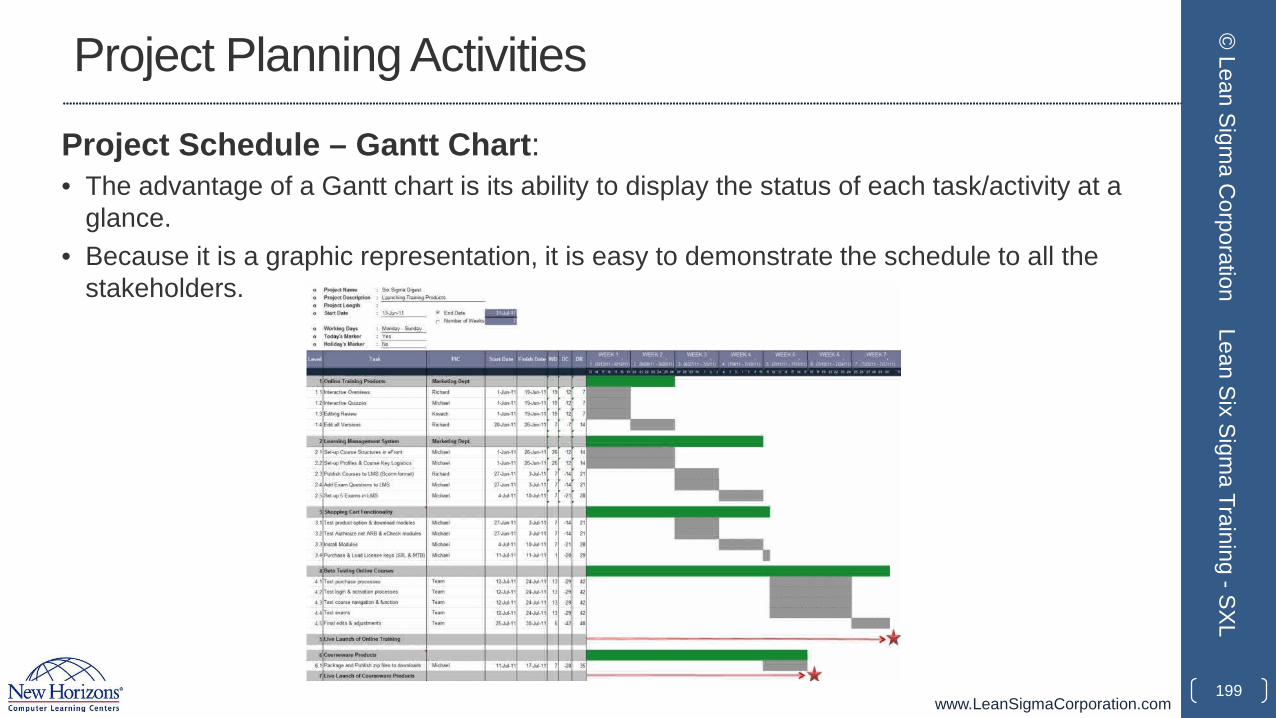
www.LeanSigmaCorporation.com
Project Planning Activities
Project Schedule – Gantt Chart:• The advantage of a Gantt chart is its ability to display the status of each task/activity at a
glance.• Because it is a graphic representation, it is easy to demonstrate the schedule to all the
stakeholders.
199
© Lean Sigm
a Corporation
Lean Six Sigma Training -SXL
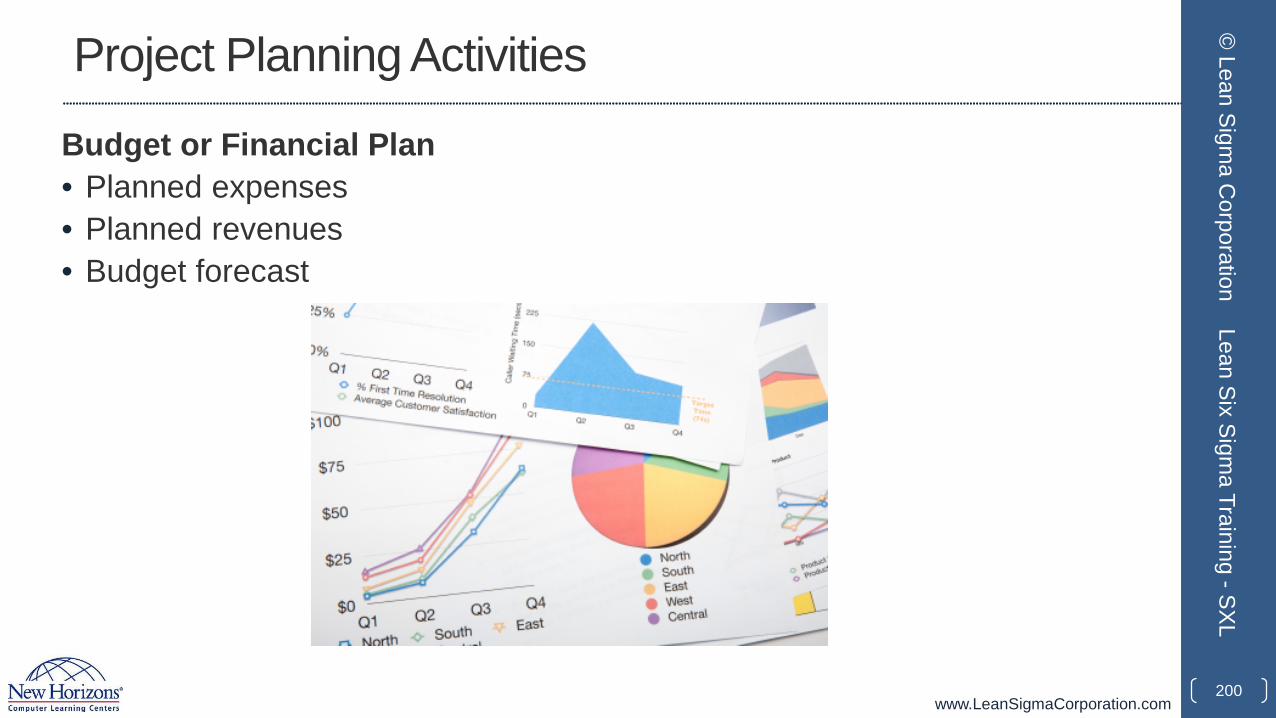
www.LeanSigmaCorporation.com
Project Planning Activities
Budget or Financial Plan• Planned expenses• Planned revenues• Budget forecast
200
© Lean Sigm
a Corporation
Lean Six Sigma Training -SXL
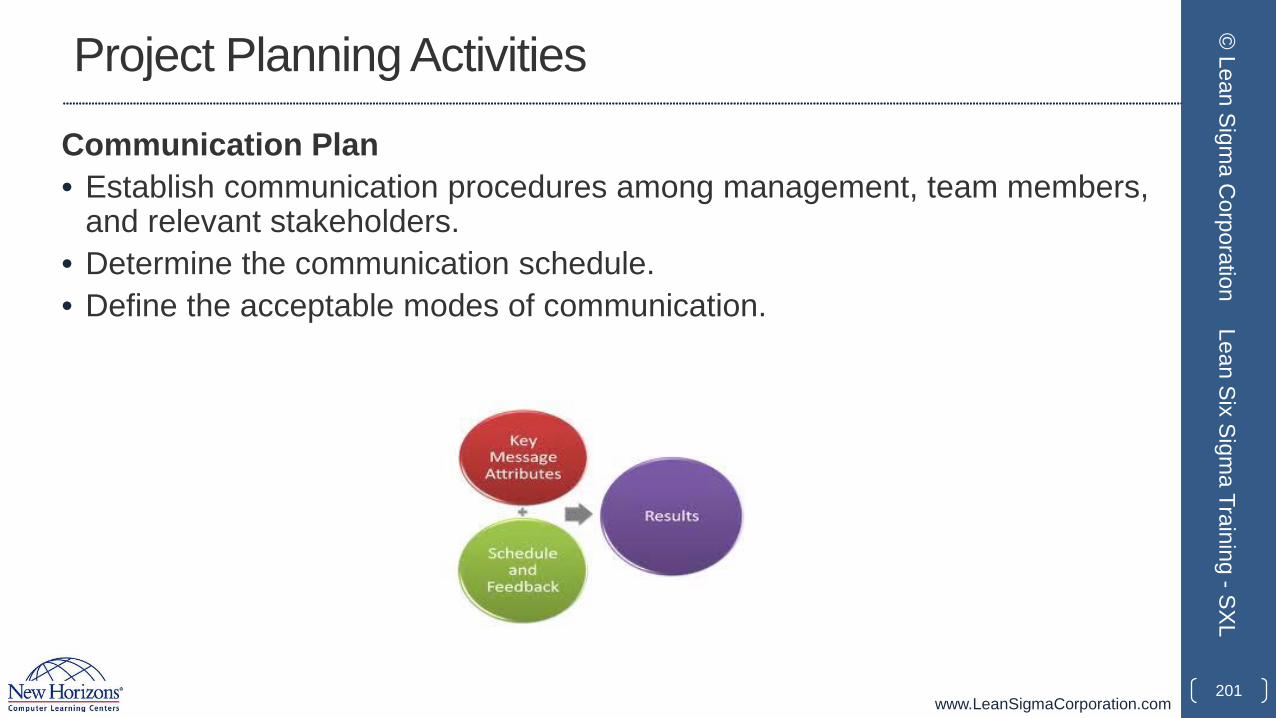
www.LeanSigmaCorporation.com
Project Planning Activities
Communication Plan• Establish communication procedures among management, team members,
and relevant stakeholders.• Determine the communication schedule.• Define the acceptable modes of communication.
201
© Lean Sigm
a Corporation
Lean Six Sigma Training -SXL
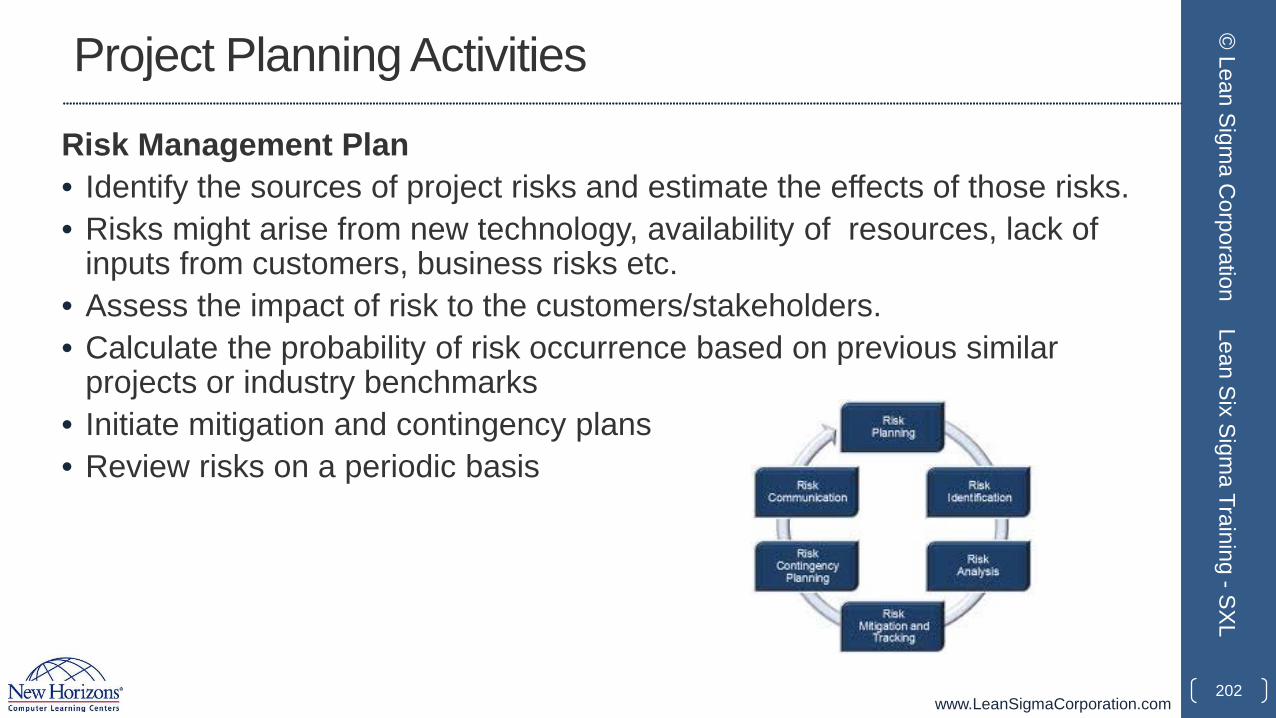
www.LeanSigmaCorporation.com
Project Planning Activities
Risk Management Plan• Identify the sources of project risks and estimate the effects of those risks. • Risks might arise from new technology, availability of resources, lack of
inputs from customers, business risks etc.• Assess the impact of risk to the customers/stakeholders.• Calculate the probability of risk occurrence based on previous similar
projects or industry benchmarks• Initiate mitigation and contingency plans• Review risks on a periodic basis
202
© Lean Sigm
a Corporation
Lean Six Sigma Training -SXL
www.LeanSigmaCorporation.com
Project Planning Tools Advantages• Project planning tools are very useful to organize and communicate project plans, status,
and projections.
• They help link tasks and sub-tasks or other work elements to get a whole view of what needs to be accomplished.
• They allow a more objective comparison of alternative solutions and provide consistent coverage of responsibilities.
• They allow for effective scope control and change management.
• They facilitate effective communication with all project participants and stakeholders.
• They help define management reviews.
• They act as an effective monitoring mechanism for the project.
• They establish project baselines for progress reviews and control points.203
© Lean Sigm
a Corporation
Lean Six Sigma Training -SXL
www.LeanSigmaCorporation.com
Project Planning Tools Disadvantages• Project planning tools can sometimes take too much time to maintain.
• Data updating and accuracy can be cumbersome.
• Too much documentation can cause version control to be challenging.
• Ineffective use of tools, especially risk management tools or project plans, can bring unwarranted project risks because bad decisions can be made on inaccurate information.
• Understanding of tools and usage of the tools may require training, hence additional costs and time.
204
© Lean Sigm
a Corporation
Lean Six Sigma Training -SXL
www.LeanSigmaCorporation.com
1.4 Lean Fundamentals
205
© Lean Sigm
a Corporation
Lean Six Sigma Training -SXL
www.LeanSigmaCorporation.com
Yellow Belt Training: Define Phase1.1 Six Sigma Overview
1.1.1 What is Six Sigma1.1.2 Six Sigma History1.1.3 Six Sigma Approach Y = f(x)1.1.4 Six Sigma Methodology1.1.5 Roles and Responsibilities
1.2 Six Sigma Fundamentals1.2.1 Defining a Process1.2.2 VOC and CTQs1.2.3 QFD1.2.4 Cost of Poor Quality (COPQ)1.2.5 Pareto Analysis (80 : 20 rule)
1.3 Lean Six Sigma Projects1.3.1 Six Sigma Metrics1.3.2 Business Case and Charter1.3.3 Project Team Selection1.3.4 Project Risk Management1.3.5 Project Planning
1.4 Lean Fundamentals1.4.1 Lean and Six Sigma1.4.2 History of Lean1.4.3 The Seven Deadly Muda1.4.4 Five-S (5S)
206
© Lean Sigm
a Corporation
Lean Six Sigma Training -SXL

www.LeanSigmaCorporation.com
1.4.1 Lean and Six Sigma
207
© Lean Sigm
a Corporation
Lean Six Sigma Training -SXL
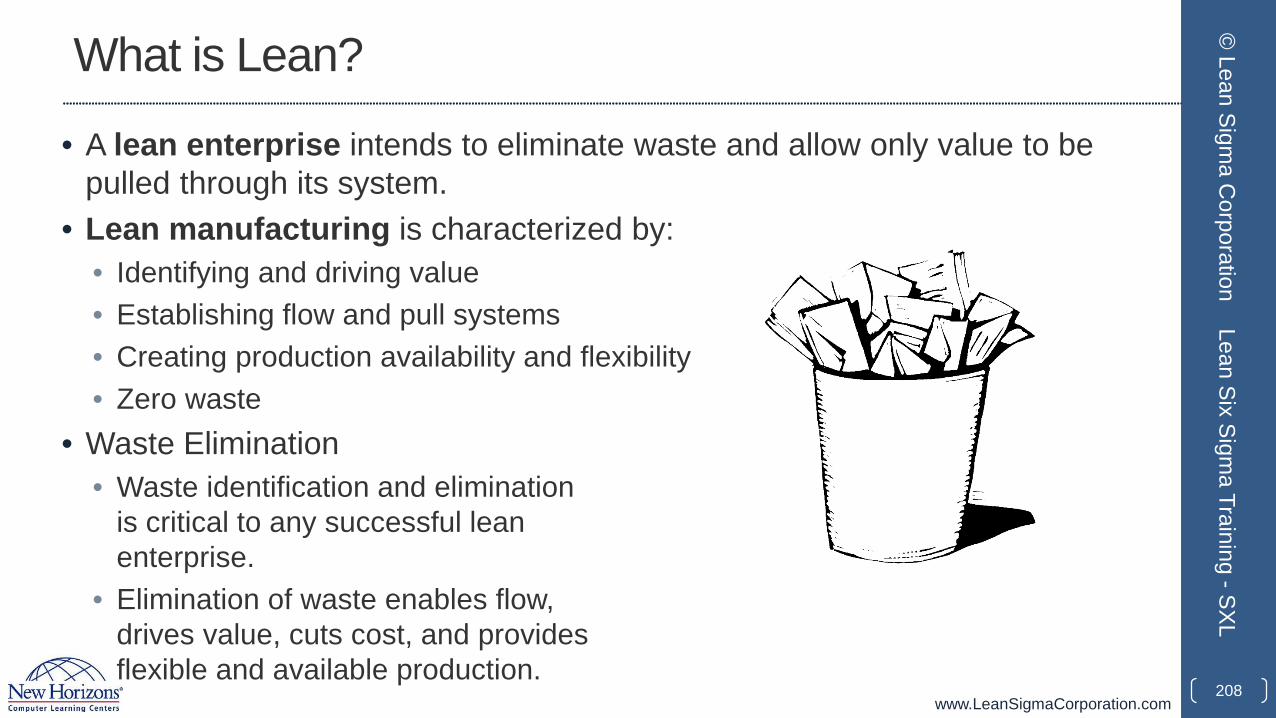
www.LeanSigmaCorporation.com
What is Lean?
• A lean enterprise intends to eliminate waste and allow only value to be pulled through its system.
• Lean manufacturing is characterized by:• Identifying and driving value• Establishing flow and pull systems• Creating production availability and flexibility• Zero waste
• Waste Elimination• Waste identification and elimination
is critical to any successful leanenterprise.
• Elimination of waste enables flow,drives value, cuts cost, and provides flexible and available production.
208
© Lean Sigm
a Corporation
Lean Six Sigma Training -SXL
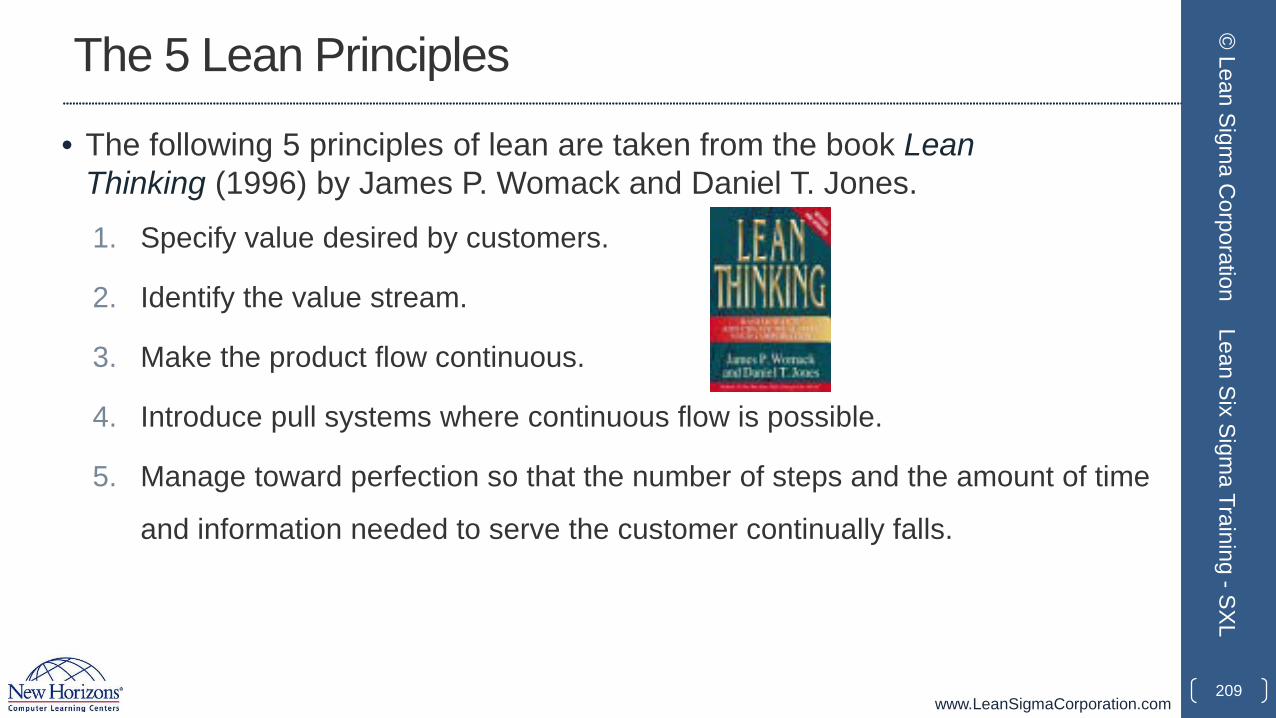
www.LeanSigmaCorporation.com
The 5 Lean Principles
• The following 5 principles of lean are taken from the book Lean Thinking (1996) by James P. Womack and Daniel T. Jones.1. Specify value desired by customers.
2. Identify the value stream.
3. Make the product flow continuous.
4. Introduce pull systems where continuous flow is possible.
5. Manage toward perfection so that the number of steps and the amount of time
and information needed to serve the customer continually falls.
209
© Lean Sigm
a Corporation
Lean Six Sigma Training -SXL
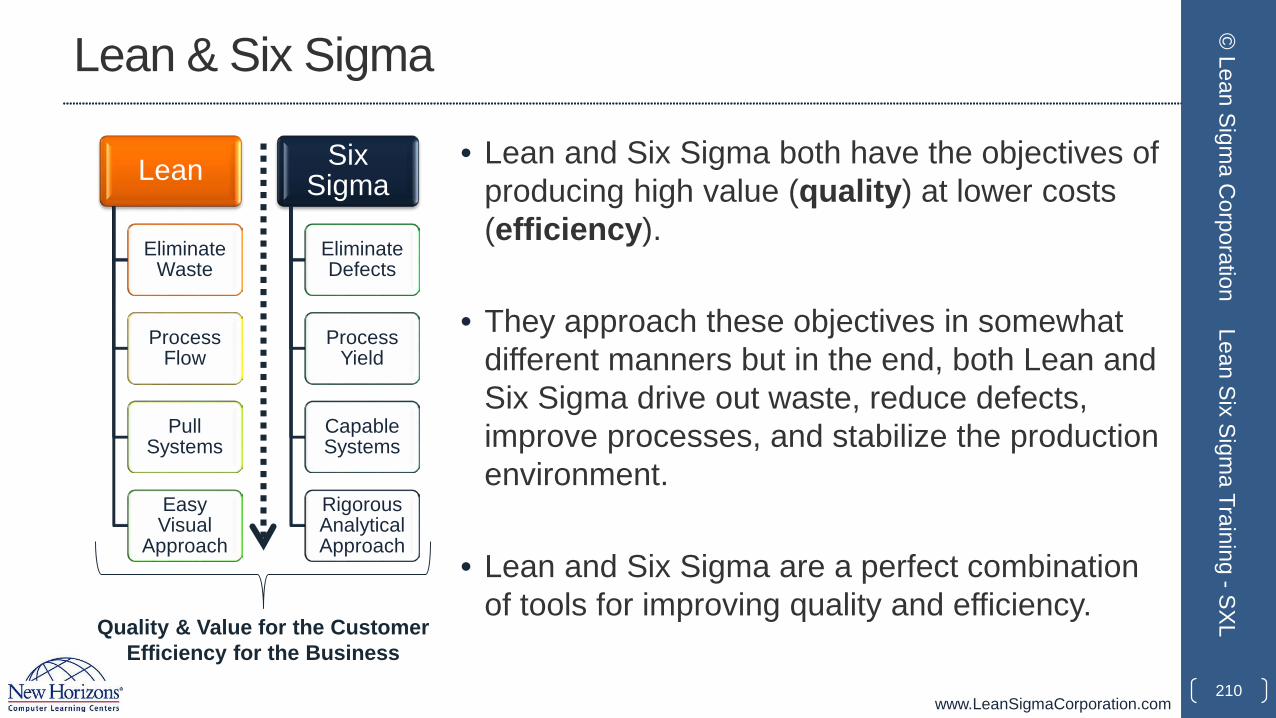
www.LeanSigmaCorporation.com
Lean & Six Sigma
• Lean and Six Sigma both have the objectives of producing high value (quality) at lower costs (efficiency).
• They approach these objectives in somewhat different manners but in the end, both Lean and Six Sigma drive out waste, reduce defects, improve processes, and stabilize the production environment.
• Lean and Six Sigma are a perfect combination of tools for improving quality and efficiency.
210
© Lean Sigm
a Corporation
Lean Six Sigma Training -SXL
Lean
Eliminate Waste
Process Flow
Pull Systems
Easy Visual
Approach
Six Sigma
Eliminate Defects
Process Yield
Capable Systems
Rigorous Analytical Approach
Quality & Value for the CustomerEfficiency for the Business
www.LeanSigmaCorporation.com
1.4.2 History of Lean
211
© Lean Sigm
a Corporation
Lean Six Sigma Training -SXL
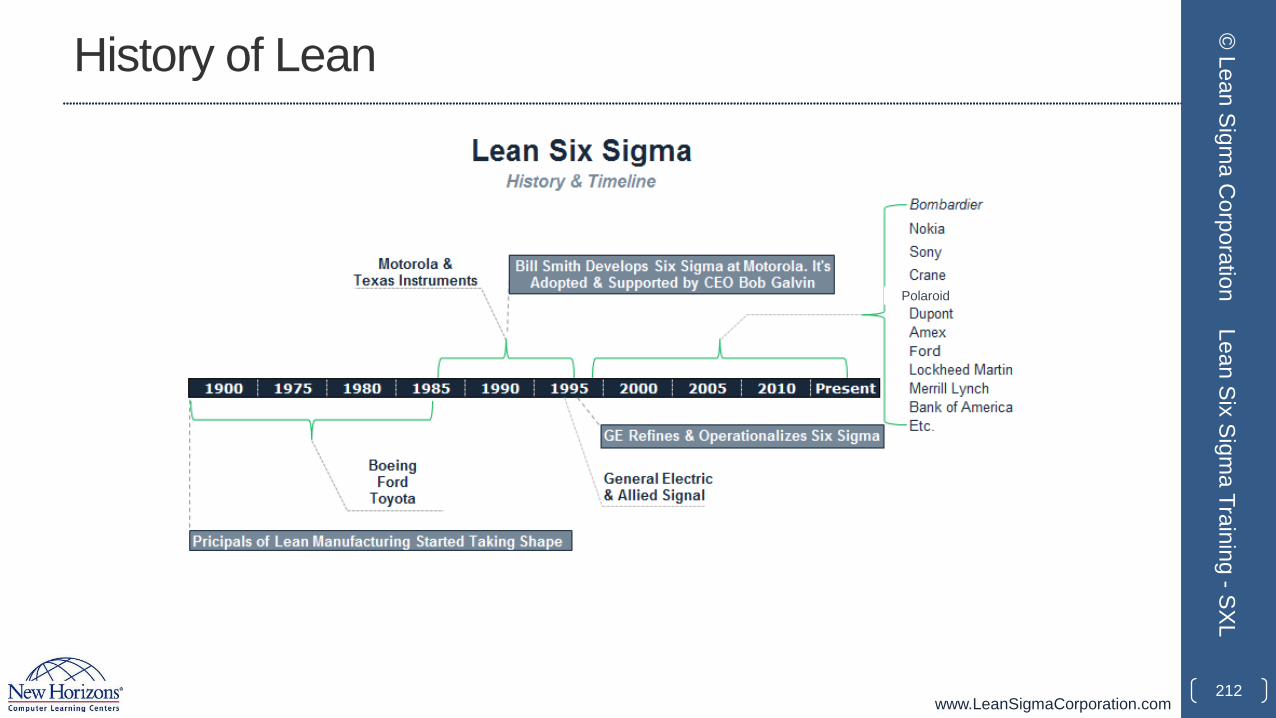
www.LeanSigmaCorporation.com
History of Lean
212
© Lean Sigm
a Corporation
Lean Six Sigma Training -SXL
Polaroid
www.LeanSigmaCorporation.com
History of Lean
• Lean thinking originated, as far as is known, the 1400s.
• Henry Ford established the first mass production system in 1913 by combining standard parts, conveyors, and work flow.
• Decades later, Kiichiro Toyoda and Taiichi Ohno at Toyota improved and implemented various new concepts and tools (e.g., value stream, takt time, kanban etc.) based on Ford’s effort.
• Toyota developed what is known today as the Toyota Production System (TPS) based on lean principles.
213
© Lean Sigm
a Corporation
Lean Six Sigma Training -SXL
www.LeanSigmaCorporation.com
History of Lean
• Starting in the mid 1990s, Lean became extensively recognized and implemented when more and more Fortune 100 companies began to adopt Lean and Six Sigma.
• The term “Lean manufacturing” was introduced by James Womack in the 1990s.
• Lean and Six Sigma share similar objectives, work hand in hand, and have benefited from one another in the past 30 years.
214
© Lean Sigm
a Corporation
Lean Six Sigma Training -SXL
www.LeanSigmaCorporation.com
1.4.3 Seven Deadly Muda
215
© Lean Sigm
a Corporation
Lean Six Sigma Training -SXL
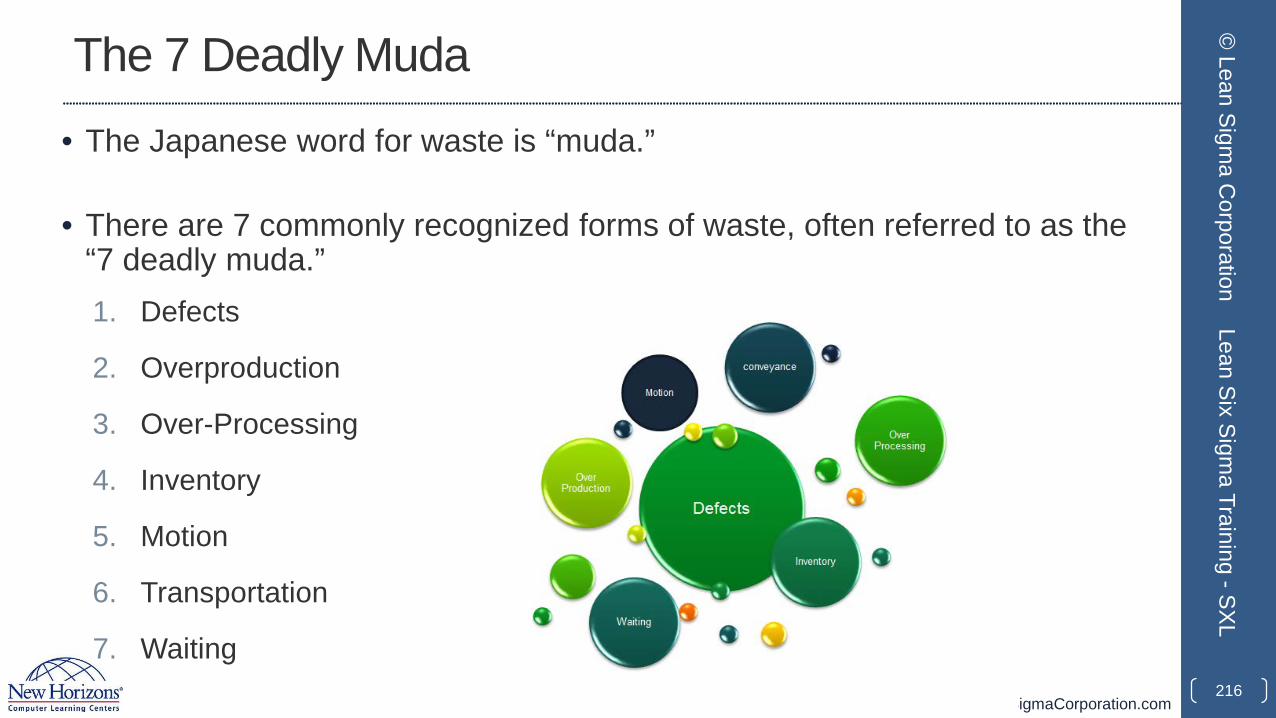
www.LeanSigmaCorporation.com
The 7 Deadly Muda• The Japanese word for waste is “muda.”
• There are 7 commonly recognized forms of waste, often referred to as the “7 deadly muda.” 1. Defects
2. Overproduction
3. Over-Processing
4. Inventory
5. Motion
6. Transportation
7. Waiting216
© Lean Sigm
a Corporation
Lean Six Sigma Training -SXL
www.LeanSigmaCorporation.com
The 7 Deadly Muda: Defects• Defects or defectives are an obvious waste for any working environment or
production system.
• Defects require rework during production and/or after the product is returned from an unhappy customer.
• Some defects are difficult to solve and they create “workarounds” and hidden factories.
• Eliminating defects is a sure way to improve product quality, customer satisfaction, and production costs.
217
© Lean Sigm
a Corporation
Lean Six Sigma Training -SXL
www.LeanSigmaCorporation.com
The 7 Deadly Muda: Overproduction• Overproduction is wasteful because your system expends energy and
resources to produce more materials than the customer or next function requires.
• Overproduction is one of the most detrimental of the seven deadly mudabecause it leads to many others:
• Inventory• Transportation• Waiting etc.
218
© Lean Sigm
a Corporation
Lean Six Sigma Training -SXL
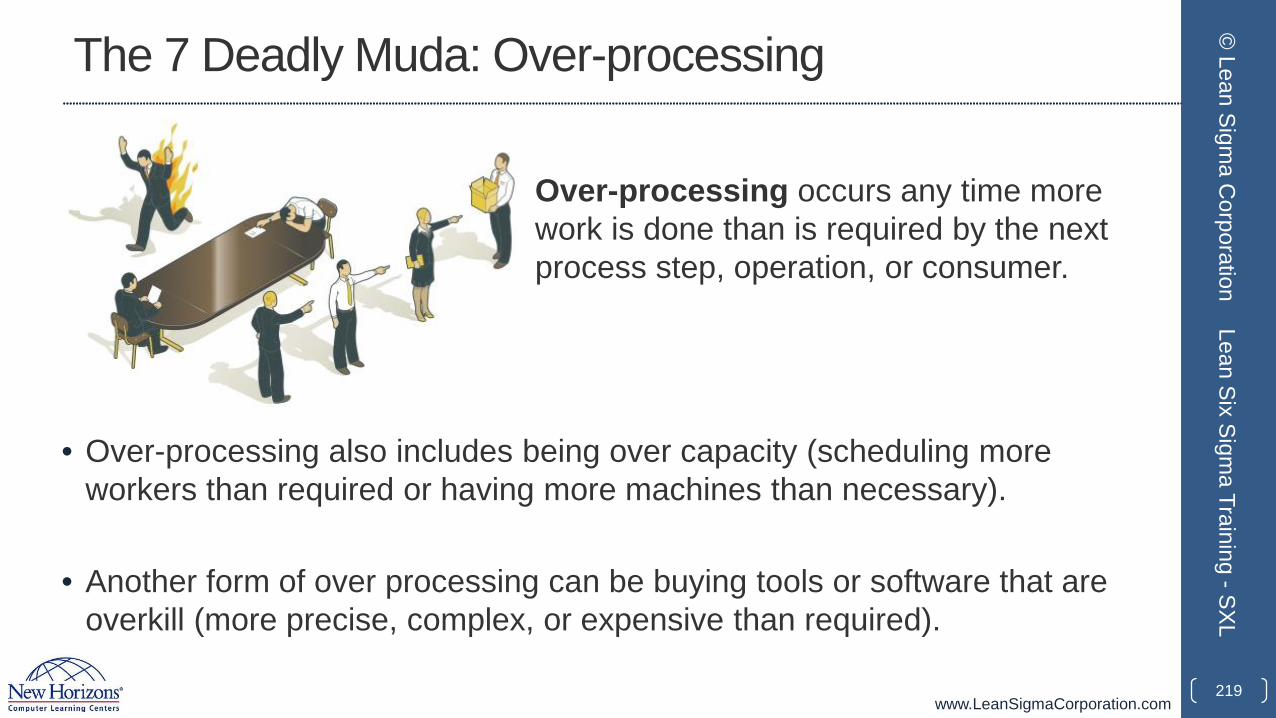
www.LeanSigmaCorporation.com
The 7 Deadly Muda: Over-processing
• Over-processing occurs any time more work is done than is required by the next process step, operation, or consumer.
• Over-processing also includes being over capacity (scheduling more workers than required or having more machines than necessary).
• Another form of over processing can be buying tools or software that are overkill (more precise, complex, or expensive than required).
219
© Lean Sigm
a Corporation
Lean Six Sigma Training -SXL
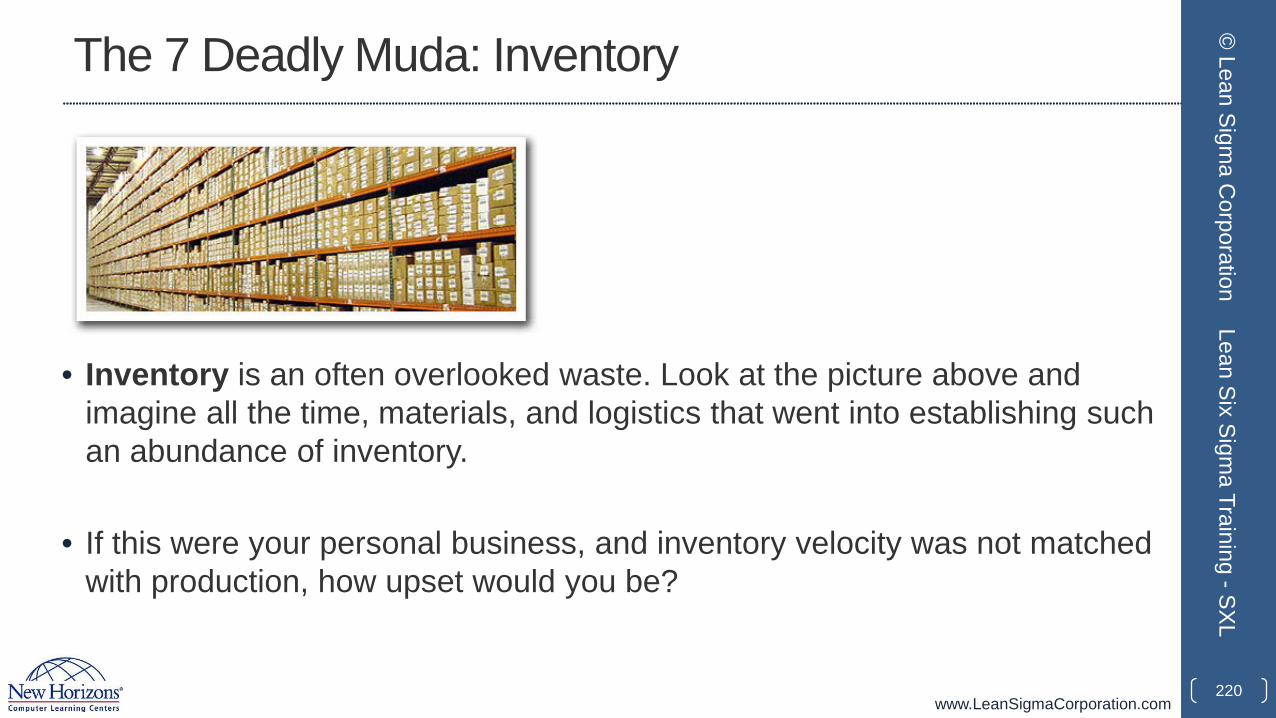
www.LeanSigmaCorporation.com
The 7 Deadly Muda: Inventory
• Inventory is an often overlooked waste. Look at the picture above and imagine all the time, materials, and logistics that went into establishing such an abundance of inventory.
• If this were your personal business, and inventory velocity was not matched with production, how upset would you be?
220
© Lean Sigm
a Corporation
Lean Six Sigma Training -SXL
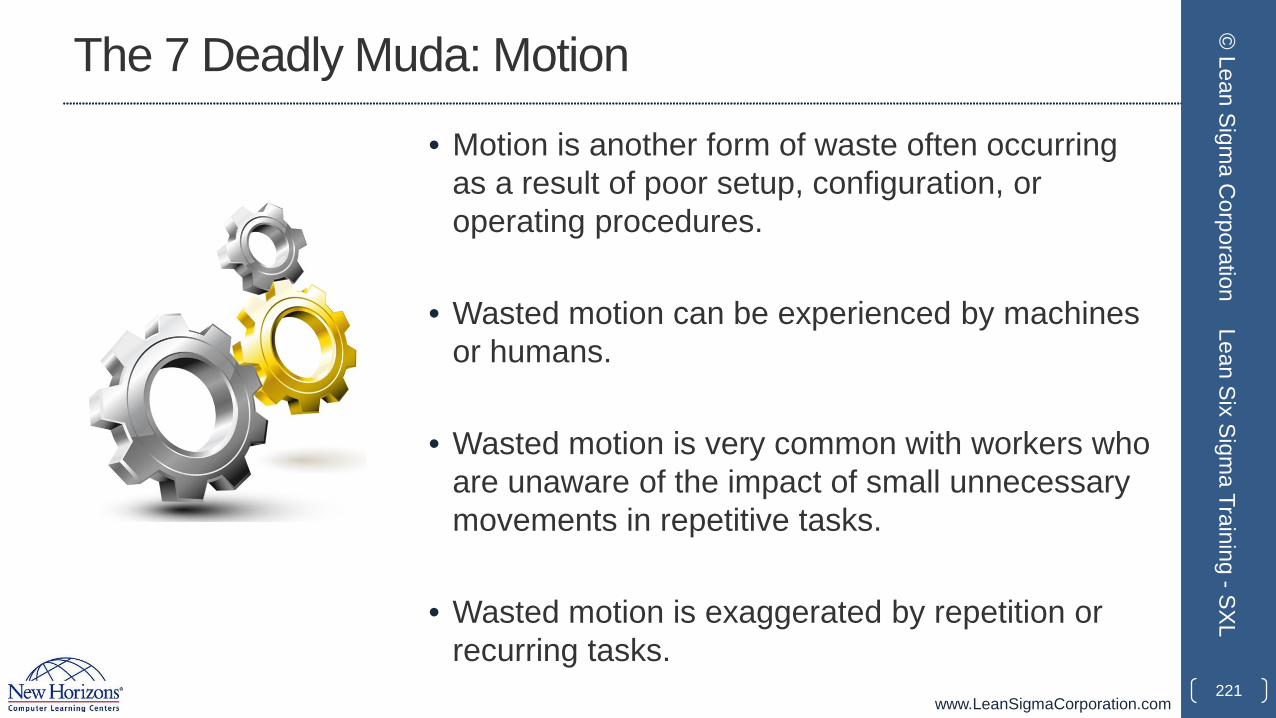
www.LeanSigmaCorporation.com
The 7 Deadly Muda: Motion
• Motion is another form of waste often occurring as a result of poor setup, configuration, or operating procedures.
• Wasted motion can be experienced by machines or humans.
• Wasted motion is very common with workers who are unaware of the impact of small unnecessary movements in repetitive tasks.
• Wasted motion is exaggerated by repetition or recurring tasks.
221
© Lean Sigm
a Corporation
Lean Six Sigma Training -SXL
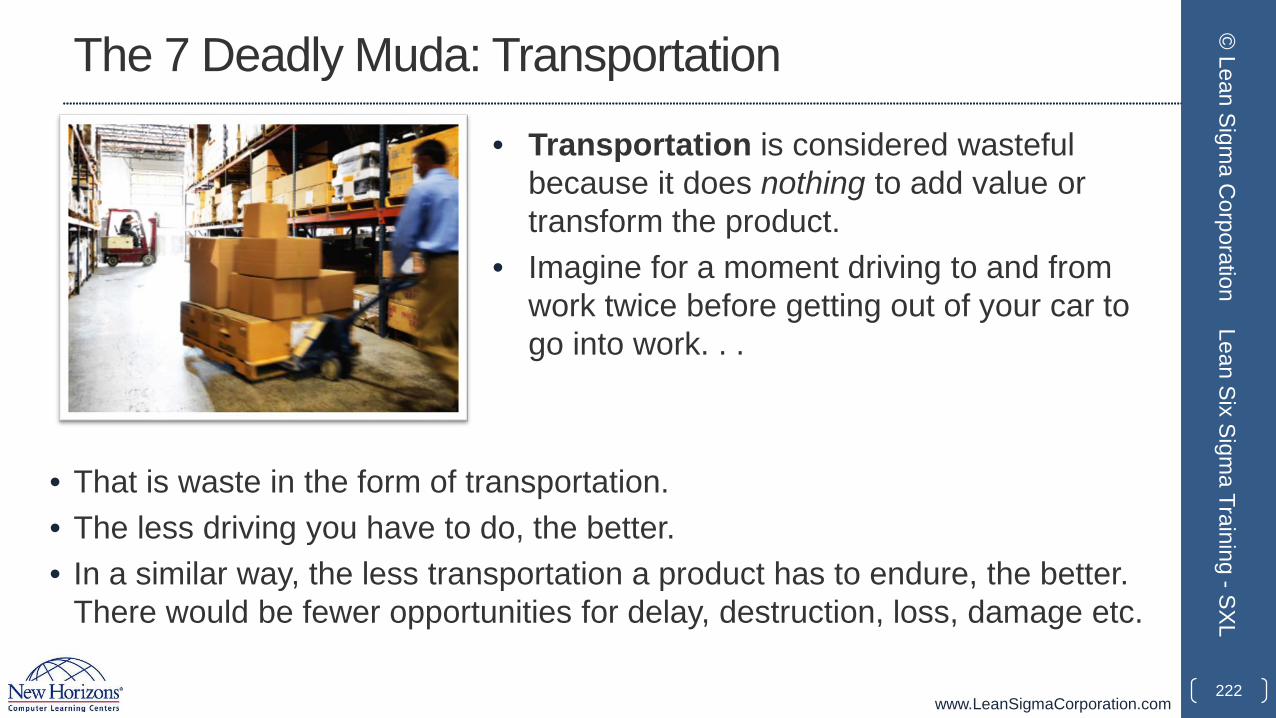
www.LeanSigmaCorporation.com
The 7 Deadly Muda: Transportation
• Transportation is considered wasteful because it does nothing to add value or transform the product.
• Imagine for a moment driving to and from work twice before getting out of your car to go into work. . .
• That is waste in the form of transportation.• The less driving you have to do, the better.• In a similar way, the less transportation a product has to endure, the better.
There would be fewer opportunities for delay, destruction, loss, damage etc.
222
© Lean Sigm
a Corporation
Lean Six Sigma Training -SXL

www.LeanSigmaCorporation.com
The 7 Deadly Muda: Waiting
• Waiting is an obvious form of waste and is typically a symptom of an upstream problem.
• Waiting is usually caused by inefficiency, bottlenecks, or poorly-designed work flows within the value stream.
• Waiting can also be caused by inefficient administration.• Reduction in waiting time will require thoughtful applications of lean and process
improvement.223
© Lean Sigm
a Corporation
Lean Six Sigma Training -SXL
www.LeanSigmaCorporation.com
1.4.4 Five-S (5S)
224
© Lean Sigm
a Corporation
Lean Six Sigma Training -SXL
www.LeanSigmaCorporation.com
What is 5S?
• 5S is systematic method to organize, order, clean, and standardize a workplace…and to keep it that way!• 5S is a methodology of organizing and improving the work environment.
• 5S is summarized in five Japanese words all starting with the letter S:• Seiri (sorting)• Seiton (straightening)• Seiso (shining)• Seiketsu (standardizing)• Shisuke (sustaining)
• 5S was originally developed in Japan and is widely used to optimize the workplace to increase productivity and efficiency.
225
© Lean Sigm
a Corporation
Lean Six Sigma Training -SXL
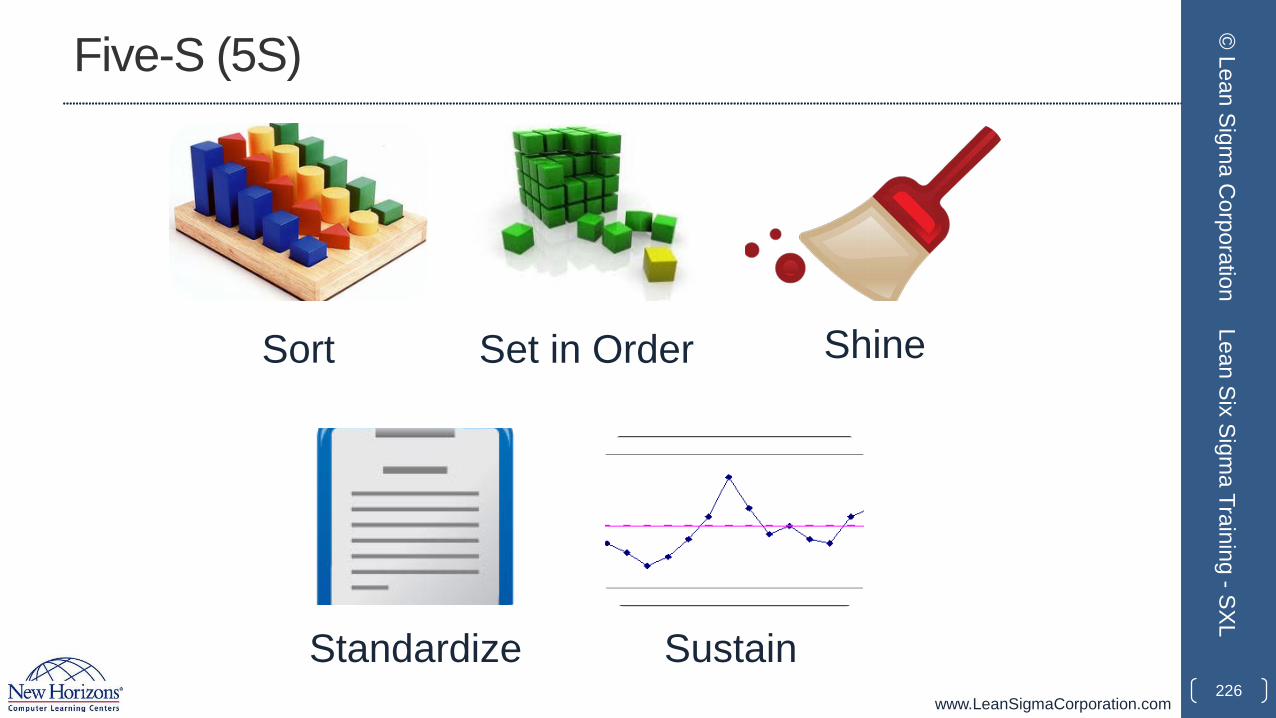
www.LeanSigmaCorporation.com
Five-S (5S)
Sort Set in Order Shine
Standardize Sustain226
© Lean Sigm
a Corporation
Lean Six Sigma Training -SXL
www.LeanSigmaCorporation.com
Goals of 5S• Reduced waste• Reduced cost• Establish a work environment that is:
• self-explaining• self-ordering• self-regulating• self-improving.• Where there is/are no more:
• Wandering and/or searching• Waiting or delaying• Secret hiding spots for tools• Obstacles or detours• Extra pieces, parts, materials etc.• Injuries• Waste.
227
© Lean Sigm
a Corporation
Lean Six Sigma Training -SXL
www.LeanSigmaCorporation.com
Benefits of 5S Systems
• Reduced changeovers • Reduced defects• Reduced waste• Reduced delays • Reduced injuries • Reduced breakdowns • Reduced complaints• Reduced red ink• Higher quality• Lower costs• Safer work environment• Greater associate and equipment capacity.
228
© Lean Sigm
a Corporation
Lean Six Sigma Training -SXL
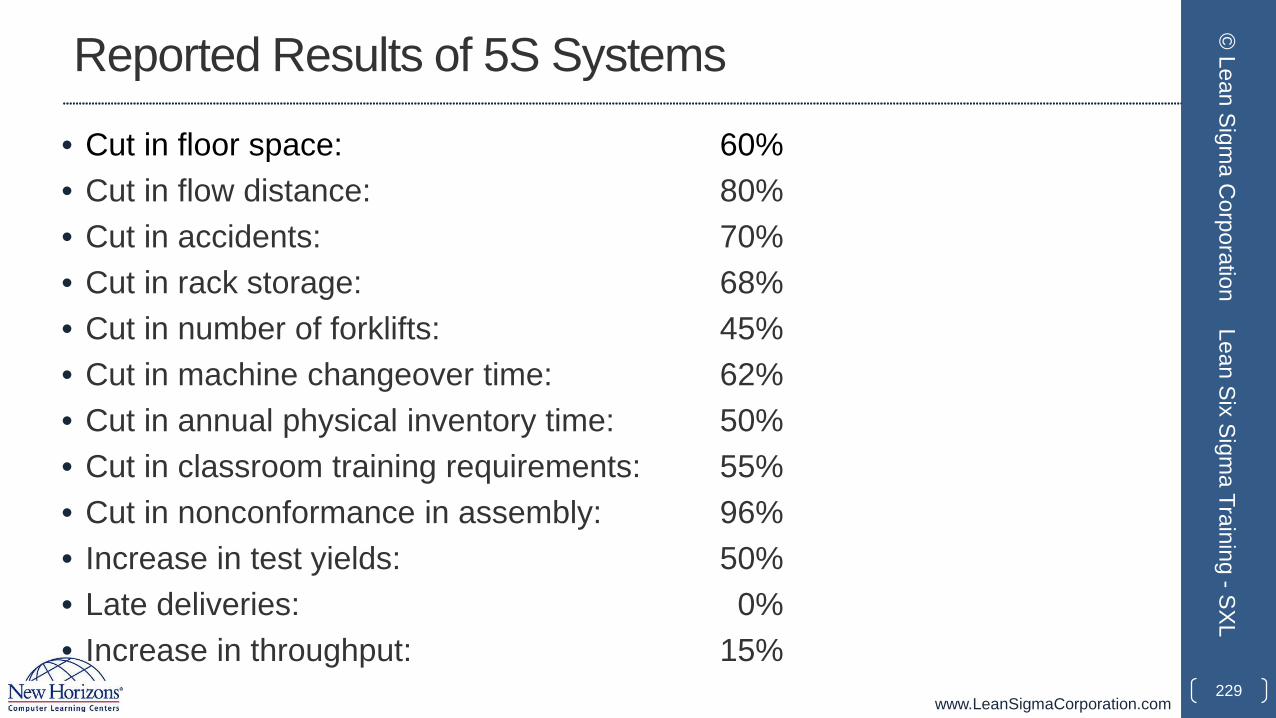
www.LeanSigmaCorporation.com
Reported Results of 5S Systems
• Cut in floor space: 60%• Cut in flow distance: 80%• Cut in accidents: 70%• Cut in rack storage: 68%• Cut in number of forklifts: 45%• Cut in machine changeover time: 62%• Cut in annual physical inventory time: 50%• Cut in classroom training requirements: 55%• Cut in nonconformance in assembly: 96%• Increase in test yields: 50%• Late deliveries: 0%• Increase in throughput: 15%
229
© Lean Sigm
a Corporation
Lean Six Sigma Training -SXL
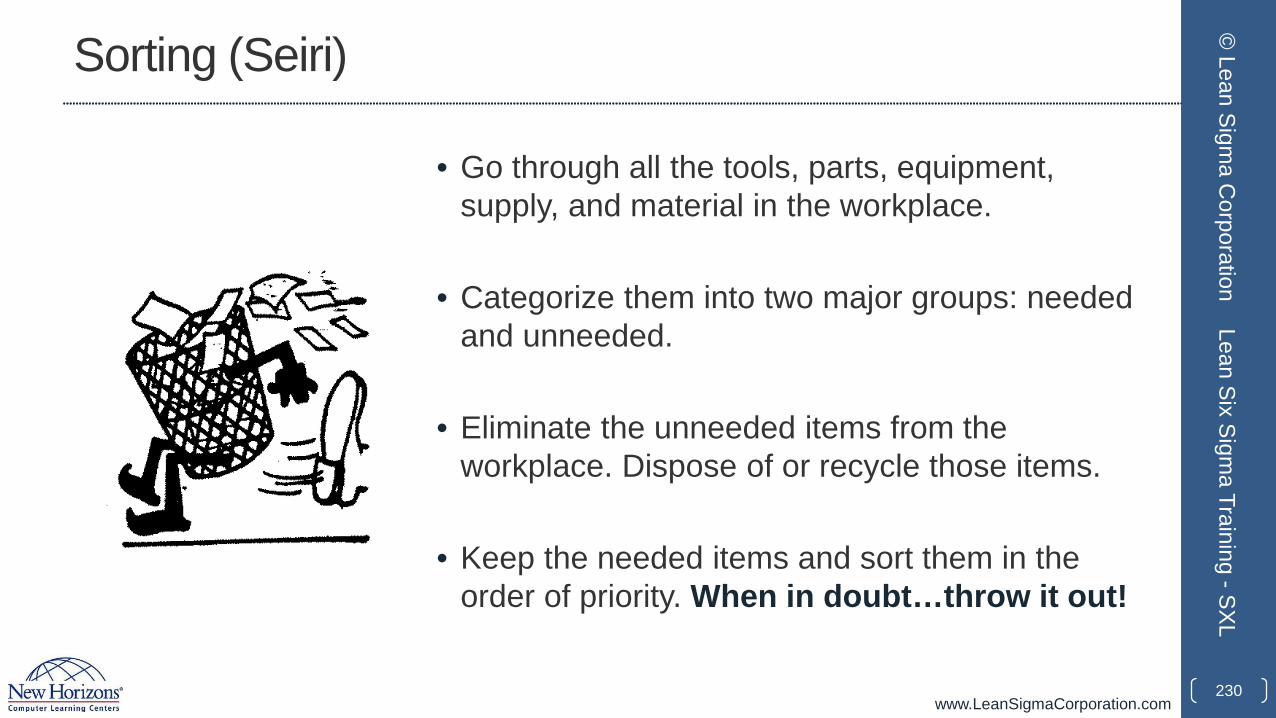
www.LeanSigmaCorporation.com
Sorting (Seiri)
• Go through all the tools, parts, equipment, supply, and material in the workplace.
• Categorize them into two major groups: needed and unneeded.
• Eliminate the unneeded items from the workplace. Dispose of or recycle those items.
• Keep the needed items and sort them in the order of priority. When in doubt…throw it out!
230
© Lean Sigm
a Corporation
Lean Six Sigma Training -SXL
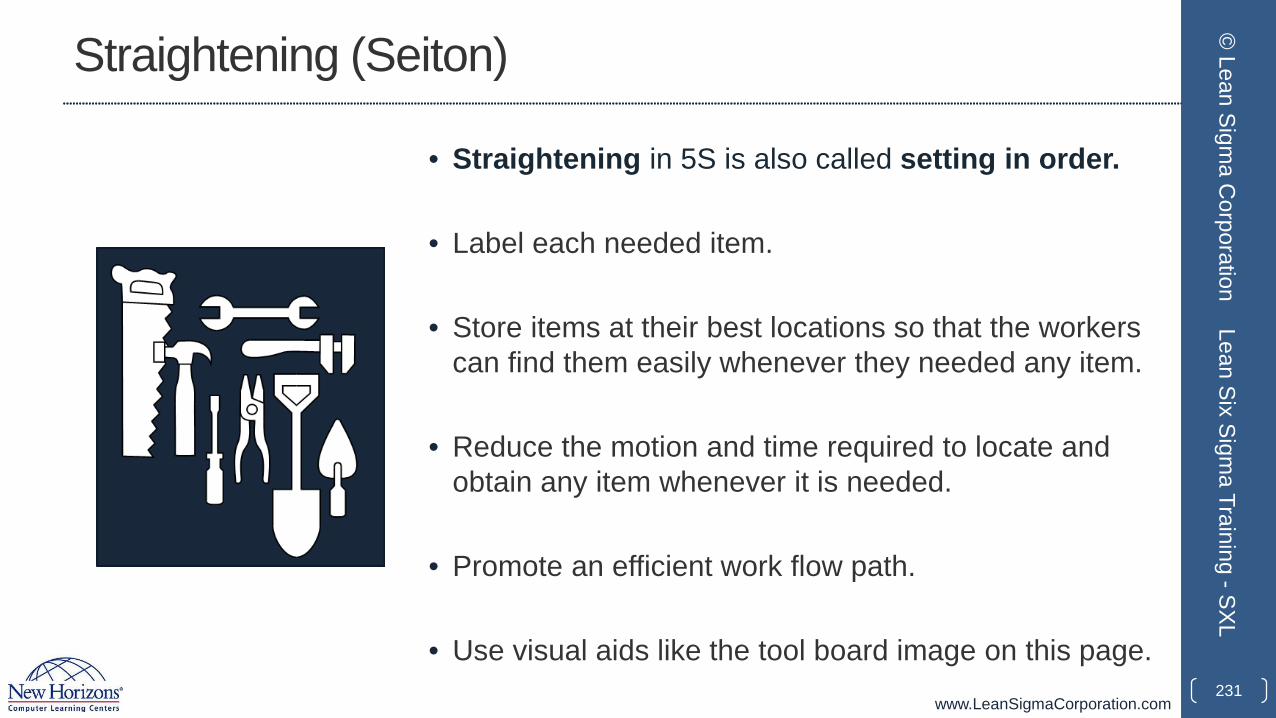
www.LeanSigmaCorporation.com
Straightening (Seiton)
• Straightening in 5S is also called setting in order.
• Label each needed item.
• Store items at their best locations so that the workers can find them easily whenever they needed any item.
• Reduce the motion and time required to locate and obtain any item whenever it is needed.
• Promote an efficient work flow path.
• Use visual aids like the tool board image on this page.231
© Lean Sigm
a Corporation
Lean Six Sigma Training -SXL
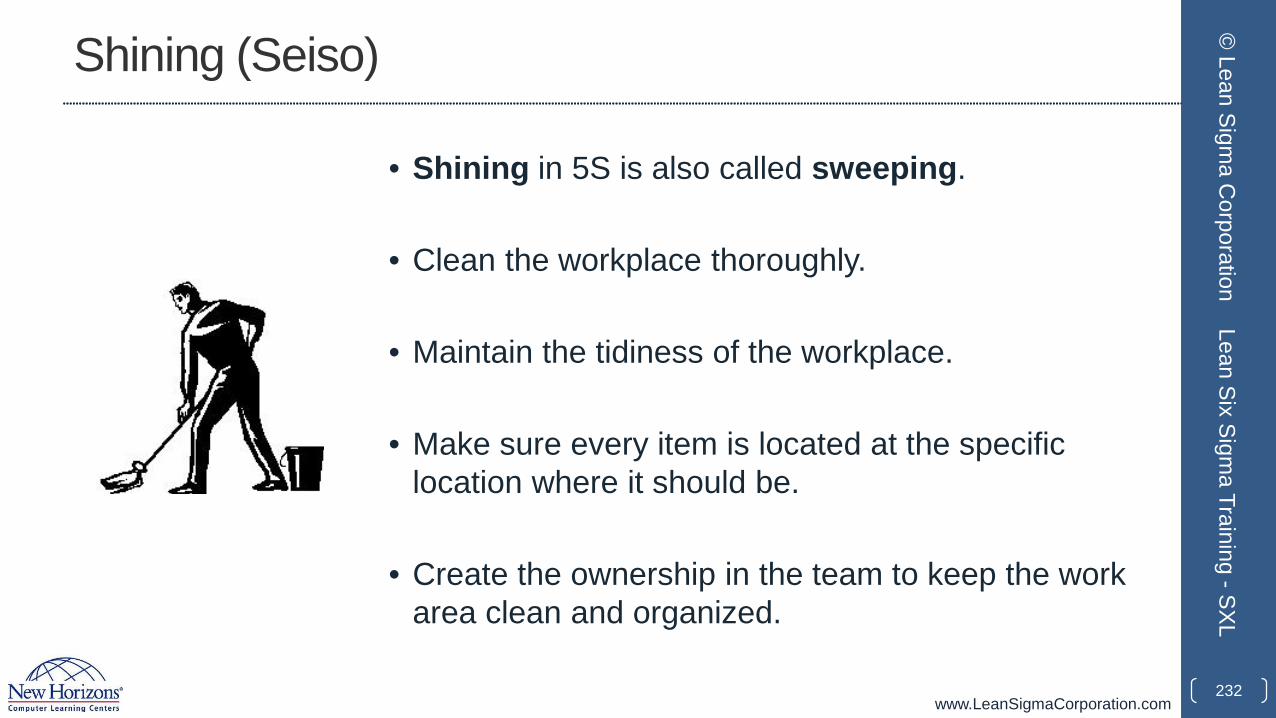
www.LeanSigmaCorporation.com
Shining (Seiso)
• Shining in 5S is also called sweeping.
• Clean the workplace thoroughly.
• Maintain the tidiness of the workplace.
• Make sure every item is located at the specific location where it should be.
• Create the ownership in the team to keep the work area clean and organized.
232
© Lean Sigm
a Corporation
Lean Six Sigma Training -SXL
www.LeanSigmaCorporation.com
Standardizing (Seiketsu)
• Standardize the workstation and the layout of tools, equipment and parts.
• Create identical workstations with a consistent way of storing the items at their specific locations so that workers can be moved around to any workstation any time and perform the same task.
233
© Lean Sigm
a Corporation
Lean Six Sigma Training -SXL

www.LeanSigmaCorporation.com
Sustaining (Shisuke)
• Sustaining in 5S is also called self-discipline.• Create the culture in the team to follow the first four S’s consistently.• Avoid falling back to the old ways of cluttered and unorganized work
environment.• Keep the momentum of optimizing the workplace.• Promote innovations of workplace improvement.• Sustain the first fours S’s using:
• 5S Maps• 5S Schedules• 5S Job cycle charts• Integration of regular work duties• 5S Blitz schedules• Daily workplace scans.
234
© Lean Sigm
a Corporation
Lean Six Sigma Training -SXL
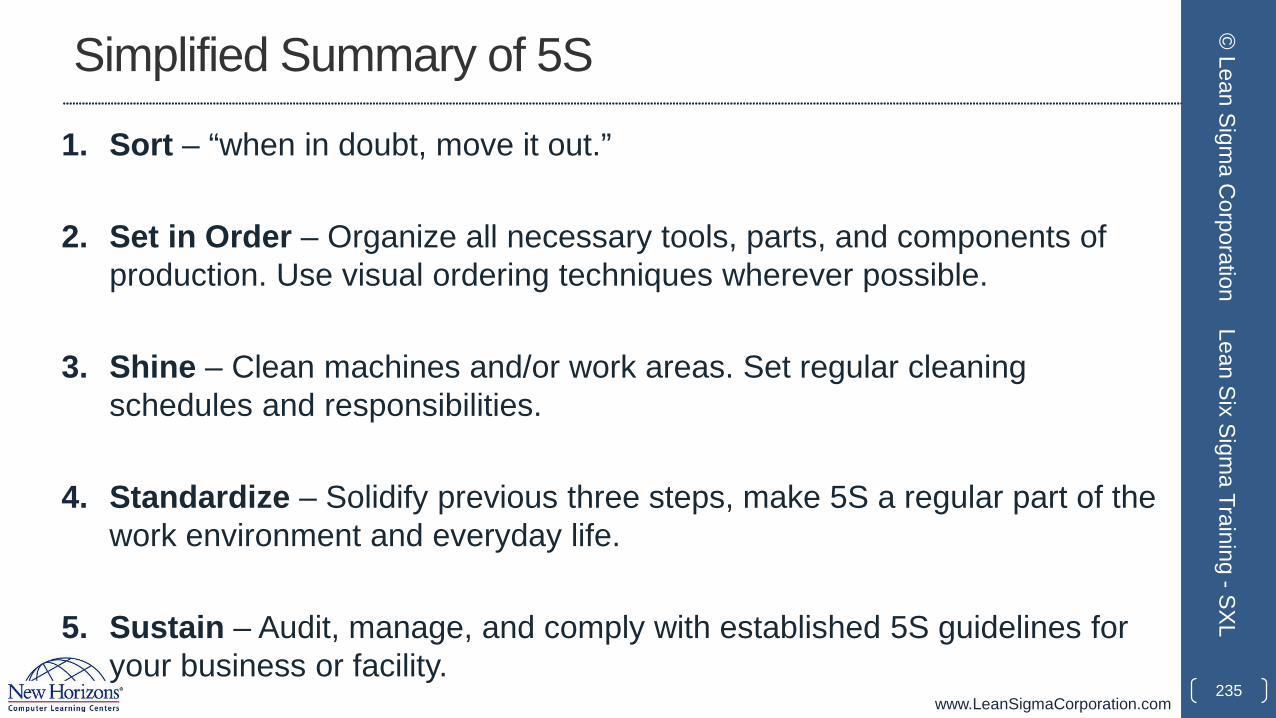
www.LeanSigmaCorporation.com
Simplified Summary of 5S
1. Sort – “when in doubt, move it out.”
2. Set in Order – Organize all necessary tools, parts, and components of production. Use visual ordering techniques wherever possible.
3. Shine – Clean machines and/or work areas. Set regular cleaning schedules and responsibilities.
4. Standardize – Solidify previous three steps, make 5S a regular part of the work environment and everyday life.
5. Sustain – Audit, manage, and comply with established 5S guidelines for your business or facility.
235
© Lean Sigm
a Corporation
Lean Six Sigma Training -SXL
www.LeanSigmaCorporation.com
Five-S (5S)
• A few words about 5S and the Lean Enterprise
• As a method, 5S generates immediate improvements.
• 5S is one of many effective lean methods that create observable results.
• It is tempting to implement 5S alone without considering the entire value stream.
• However, it is advisable to consider a well-planned lean manufacturing approach to the entire production system.
236
© Lean Sigm
a Corporation
Lean Six Sigma Training -SXL
www.LeanSigmaCorporation.com
2.0 Measure Phase
237
© Lean Sigm
a Corporation
Lean Six Sigma Training -SXL
www.LeanSigmaCorporation.com
Yellow Belt Training: Measure Phase2.1 Process Definition
2.1.1 Cause and Effect Diagrams2.1.2 Cause and Effects Matrix2.1.3 Process Mapping2.1.4 FMEA: Failure Modes and Effects Analysis2.1.5 Theory of Constraints
2.2 Six Sigma Statistics2.2.1 Basic Statistics2.2.2 Descriptive Statistics2.2.3 Distributions and Normality2.2.4 Graphical Analysis
2.3 Measurement System Analysis2.3.1 Precision and Accuracy2.3.2 Bias, Linearity, and Stability2.3.3 Gage R&R2.3.4 Variable and Attribute MSA
2.4 Process Capability2.4.1 Capability Analysis2.4.2 Concept of Stability2.4.3 Attribute and Discrete Capability2.4.4 Monitoring Techniques
238
© Lean Sigm
a Corporation
Lean Six Sigma Training -SXL
www.LeanSigmaCorporation.com
2.1 Process Definition
239
© Lean Sigm
a Corporation
Lean Six Sigma Training -SXL

www.LeanSigmaCorporation.com
Yellow Belt Training: Measure Phase2.1 Process Definition
2.1.1 Cause and Effect Diagrams2.1.2 Cause and Effects Matrix2.1.3 Process Mapping2.1.4 FMEA: Failure Modes and Effects Analysis2.1.5 Theory of Constraints
2.2 Six Sigma Statistics2.2.1 Basic Statistics2.2.2 Descriptive Statistics2.2.3 Distributions and Normality2.2.4 Graphical Analysis
2.3 Measurement System Analysis2.3.1 Precision and Accuracy2.3.2 Bias, Linearity, and Stability2.3.3 Gage R&R2.3.4 Variable and Attribute MSA
2.4 Process Capability2.4.1 Capability Analysis2.4.2 Concept of Stability2.4.3 Attribute and Discrete Capability2.4.4 Monitoring Techniques
240
© Lean Sigm
a Corporation
Lean Six Sigma Training -SXL
www.LeanSigmaCorporation.com
2.1.1 Cause and Effect Diagram
241
© Lean Sigm
a Corporation
Lean Six Sigma Training -SXL
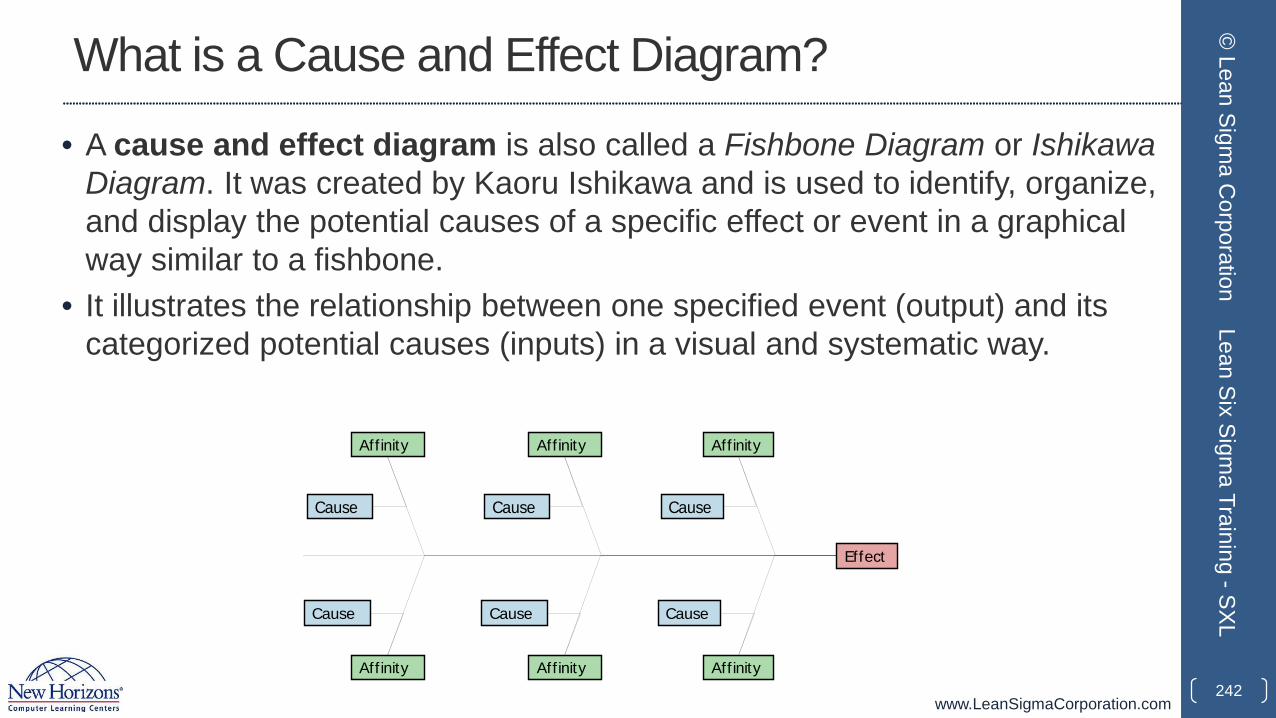
www.LeanSigmaCorporation.com
Effect
Affinity
Affinity
Cause
Cause
Affinity
Affinity
Affinity
Affinity
Cause
Cause
Cause
Cause
What is a Cause and Effect Diagram?
• A cause and effect diagram is also called a Fishbone Diagram or Ishikawa Diagram. It was created by Kaoru Ishikawa and is used to identify, organize, and display the potential causes of a specific effect or event in a graphical way similar to a fishbone.
• It illustrates the relationship between one specified event (output) and its categorized potential causes (inputs) in a visual and systematic way.
242
© Lean Sigm
a Corporation
Lean Six Sigma Training -SXL
www.LeanSigmaCorporation.com
Major Categories of Potential Causes
• P4ME• People: People who are involved in the process• Methods: How the process is completed (e.g., procedures, policies, regulations,
laws)• Machines: Equipment or tools needed to perform the process• Materials: Raw materials or information needed to do the job• Measurements: Data collected from the process for inspection or evaluation• Environment: Surroundings of the process (e.g., location, time, culture).
243
© Lean Sigm
a Corporation
Lean Six Sigma Training -SXL
www.LeanSigmaCorporation.com
How to Plot a Cause and Effect Diagram
• Step 1: Identify and define the effect/event being analyzed.
• Clearly state the operational definition of the effect/event of interest.
• The event can be the positive outcome desired or negative problem targeted to solve.
• Enter the effect/event in the end box of the Fishbone diagram and draw a spine pointed to it.
244
© Lean Sigm
a Corporation
Lean Six Sigma Training -SXL
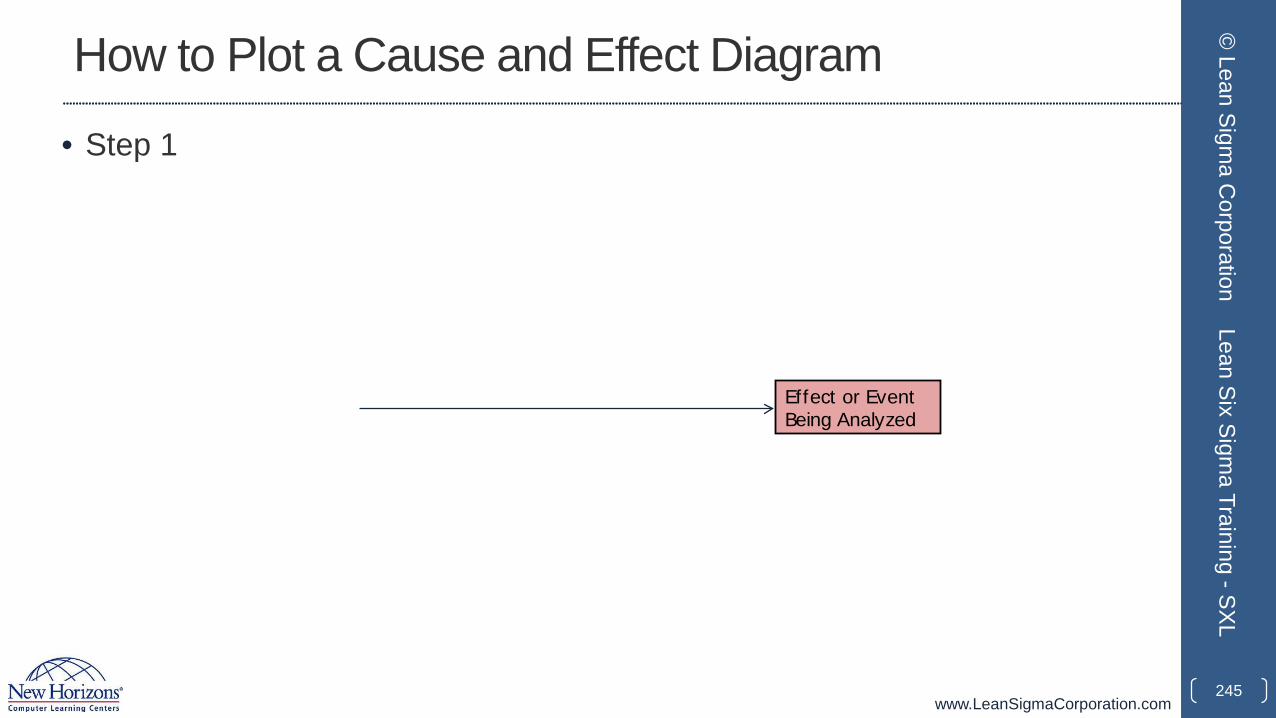
www.LeanSigmaCorporation.com
How to Plot a Cause and Effect Diagram
• Step 1
245
© Lean Sigm
a Corporation
Lean Six Sigma Training -SXL
Effect or Event Being Analyzed
www.LeanSigmaCorporation.com
How to Plot a Cause and Effect Diagram
• Step 2: Brainstorm the potential causes or factors of the effect/event occurring.
• Identify any factors with a potential impact on the effect/event and include them in this step.
• Put all the identified potential causes aside for use later.
246
© Lean Sigm
a Corporation
Lean Six Sigma Training -SXL
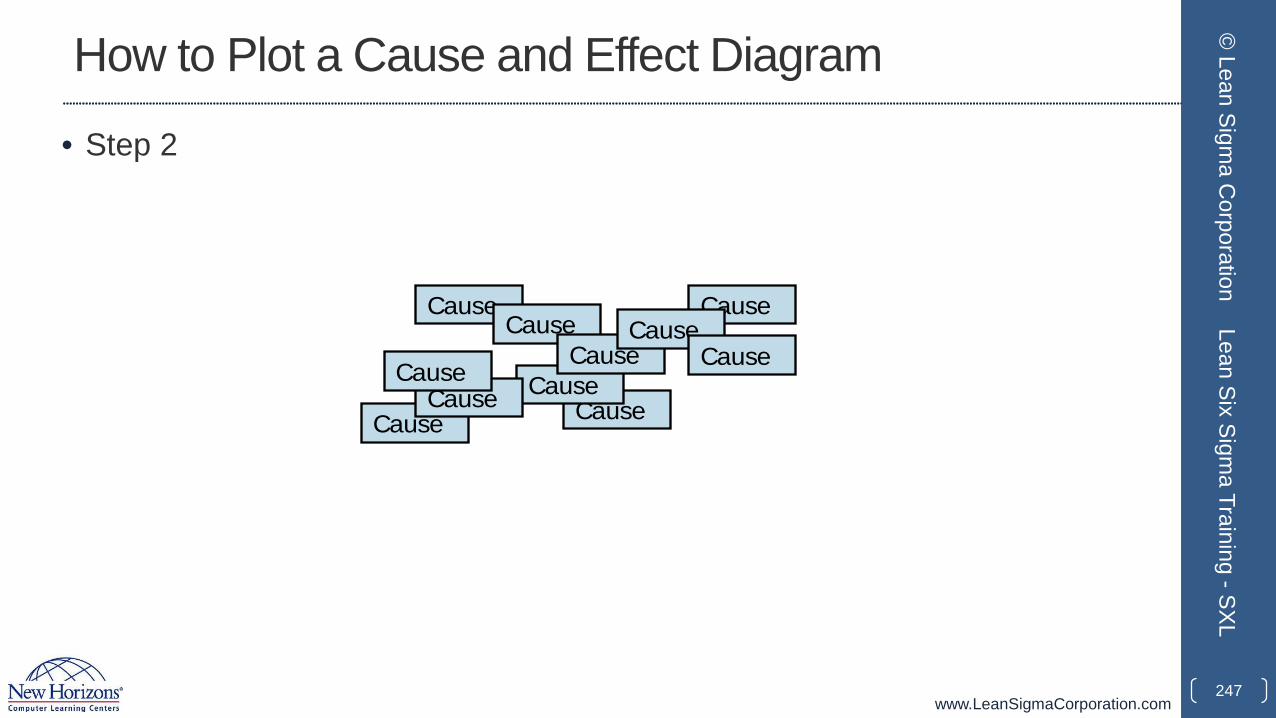
www.LeanSigmaCorporation.com
How to Plot a Cause and Effect Diagram
• Step 2
247
© Lean Sigm
a Corporation
Lean Six Sigma Training -SXL
Cause
CauseCause
CauseCause
CauseCause
Cause
CauseCause
Cause
www.LeanSigmaCorporation.com
How to Plot a Cause and Effect Diagram
• Step 3: Identify the main categories of causes and group the potential causes accordingly.
• Besides P4ME (i.e., people, methods, machines, materials, measurements, and environment), you can group potential causes into other customized categories.
• Below each major category, you can define sub-categories and then classify them to help you visualize the potential causes.
• Enter each cause category in a box and connect the box to the spine. Link each potential cause to its corresponding cause category.
248
© Lean Sigm
a Corporation
Lean Six Sigma Training -SXL
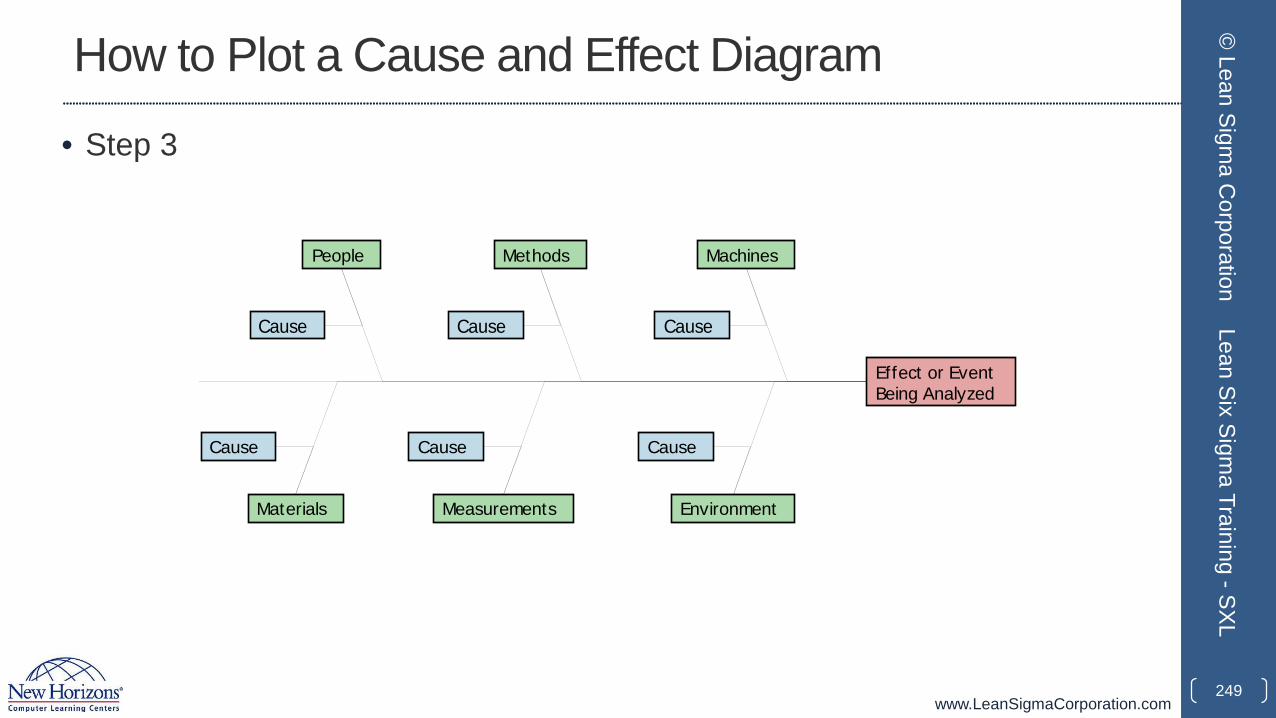
www.LeanSigmaCorporation.com
How to Plot a Cause and Effect Diagram
• Step 3
249
© Lean Sigm
a Corporation
Lean Six Sigma Training -SXL
Effect or Event Being Analyzed
Machines
Environment
Methods
Measurements
People
Materials
Cause
CauseCause
CauseCause
Cause
www.LeanSigmaCorporation.com
How to Plot a Cause and Effect Diagram
• Step 4: Analyze the cause and effect diagram.
• A cause and effect diagram includes all the possible factors of the effect/event being analyzed.
• Use a Pareto chart to filter causes the project team needs to focus on.
• Identify causes with high impact that the team can take action upon.
• Determine how to measure causes and effects quantitatively. Prepare for further statistical analysis.
250
© Lean Sigm
a Corporation
Lean Six Sigma Training -SXL
www.LeanSigmaCorporation.com
Benefits to Using Cause and Effect Diagram
• Helps to quickly identify and sort the potential causes of an effect.
• Provides a systematic way to brainstorm potential causes effectively and efficiently.
• Identifies areas requiring data collection for further quantitative analysis.
• Locates “low-hanging fruit.”
251
© Lean Sigm
a Corporation
Lean Six Sigma Training -SXL
www.LeanSigmaCorporation.com
Limitation of Cause and Effect Diagrams
• A cause and effect diagram only provides qualitative analysis of correlation between each cause and the effect.
• One cause and effect diagram can only focus on one effect or event at a time.
• Further statistical analysis is required to quantify the relationship between various factors and the effect and identify the root causes.
252
© Lean Sigm
a Corporation
Lean Six Sigma Training -SXL
www.LeanSigmaCorporation.com
Cause and Effect Diagram Example
• Case study:
• A real estate company is interested to find the root causes of high energy costs of its properties.
• The cause and effect diagram is used to identify, organize, and analyze the potential root causes.
253
© Lean Sigm
a Corporation
Lean Six Sigma Training -SXL
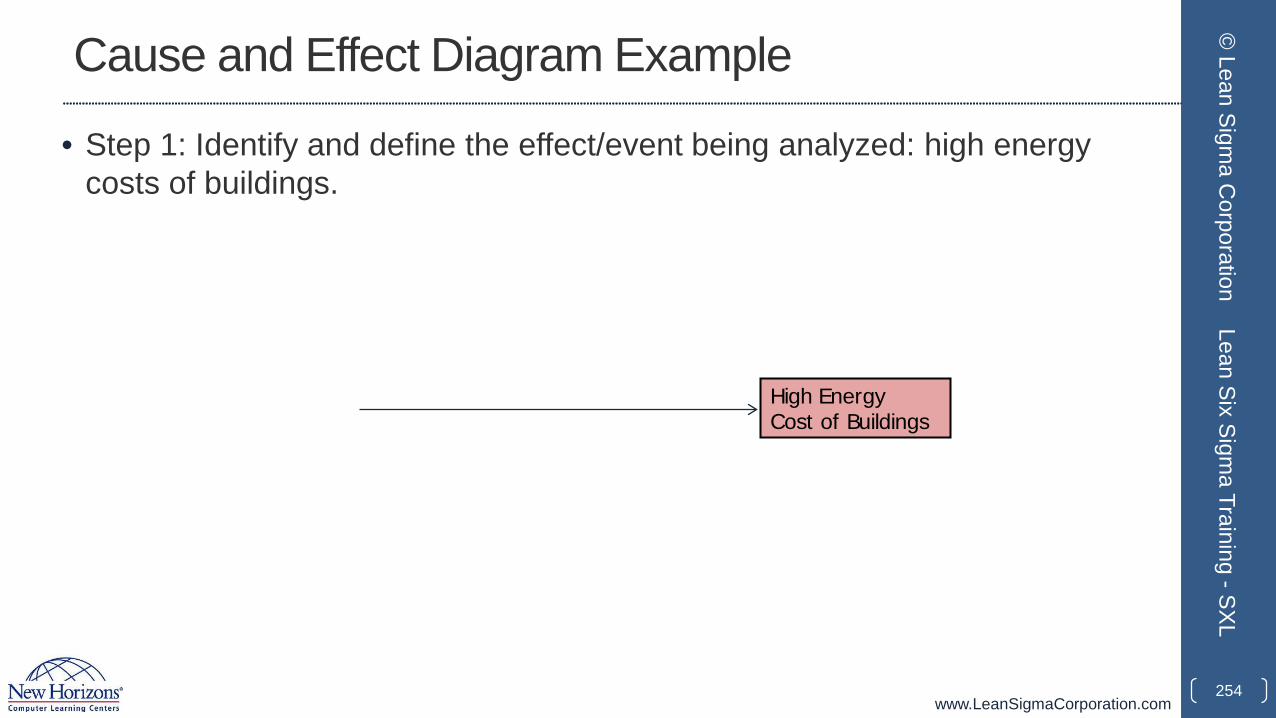
www.LeanSigmaCorporation.com
Cause and Effect Diagram Example
• Step 1: Identify and define the effect/event being analyzed: high energy costs of buildings.
254
© Lean Sigm
a Corporation
Lean Six Sigma Training -SXL
High EnergyCost of Buildings
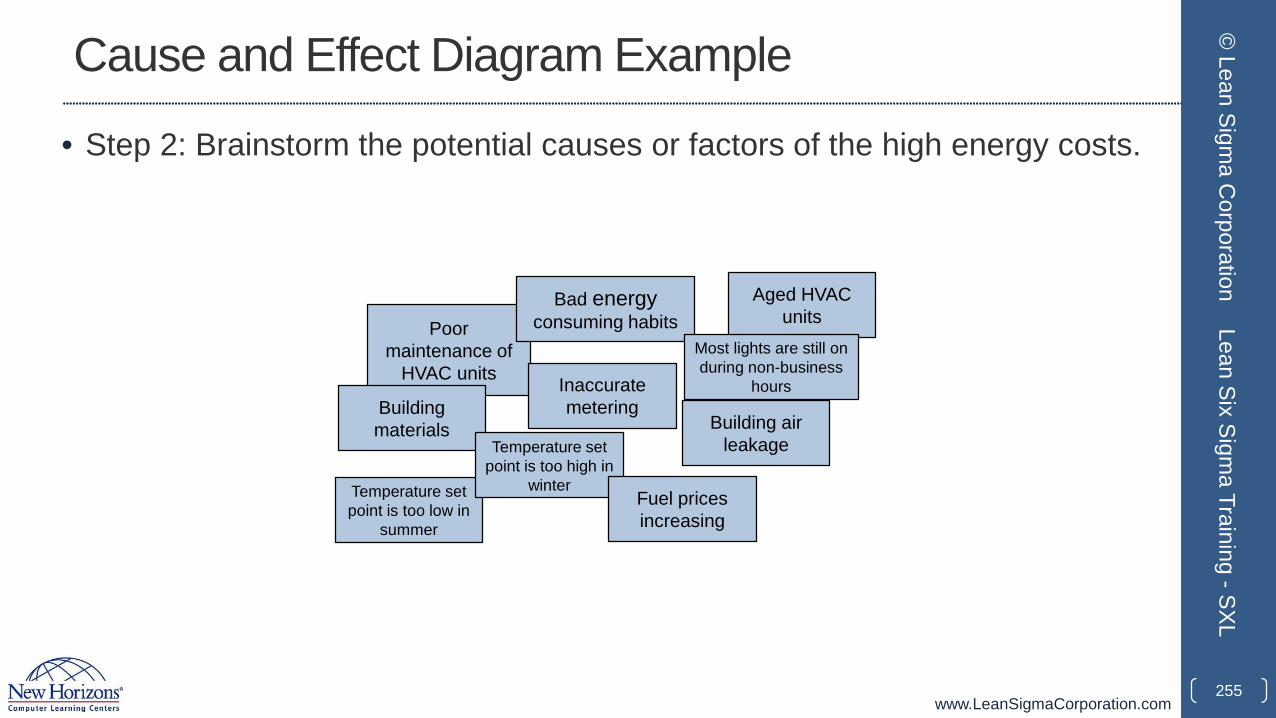
www.LeanSigmaCorporation.com
Cause and Effect Diagram Example
• Step 2: Brainstorm the potential causes or factors of the high energy costs.
255
© Lean Sigm
a Corporation
Lean Six Sigma Training -SXL
Aged HVAC unitsPoor
maintenance of HVAC units
Bad energyconsuming habits
Inaccurate meteringBuilding
materials
Temperature set point is too low in
summer
Temperature set point is too high in
winter
Most lights are still on during non-business
hours
Building air leakage
Fuel prices increasing
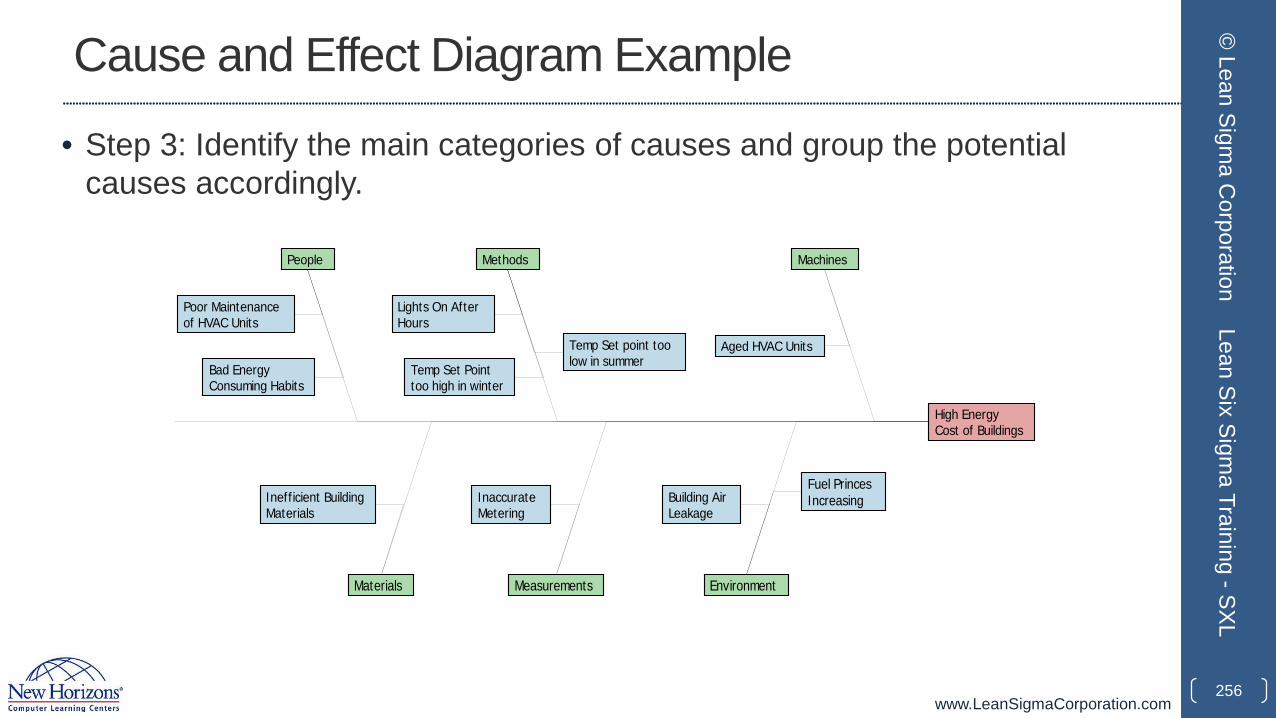
www.LeanSigmaCorporation.com
Cause and Effect Diagram Example
• Step 3: Identify the main categories of causes and group the potential causes accordingly.
256
© Lean Sigm
a Corporation
Lean Six Sigma Training -SXL
High EnergyCost of Buildings
Machines
Environment
Methods
Measurements
People
Materials
Aged HVAC Units
Building Air Leakage
Inaccurate Metering
Lights On After Hours
Poor Maintenance of HVAC Units
Inefficient Building Materials
Temp Set point too low in summerBad Energy
Consuming HabitsTemp Set Point too high in winter
Fuel Princes Increasing
www.LeanSigmaCorporation.com
Cause and Effect Diagram Example• Step 4: Analyze the cause and effect (C&E) diagram.
• After completing the C&E diagram, the real estate company conducts further research on each potential root cause.
• It is discovered that:• The utility metering is accurate• The building materials are fine and there is not significant amount of air leakage from the
building• The fuel prices increased recently but were negligible• Most lights are off during the non-business hours except that some lights have to be on for
security purposes• The temperature set points in the summer and winter are both adequate and reasonable• The high energy costs are probably caused by the poor HVAC maintenance on aged units and
the wasteful energy consuming habits.• Next, the real estate company needs to collect and analyze the data to check whether
root causes identified in the C&E diagram are statistically the causes of the high energy costs.
257
© Lean Sigm
a Corporation
Lean Six Sigma Training -SXL
www.LeanSigmaCorporation.com
2.1.2 Cause and Effects Matrix
258
© Lean Sigm
a Corporation
Lean Six Sigma Training -SXL
www.LeanSigmaCorporation.com
What is a Cause and Effect Matrix?
• The cause and effect matrix (XY Matrix) is a tool to help subjectively quantify the relationship of several X's to several Y's.
• Among the Y's under consideration, two important ones should be the primary and secondary metrics of your Six Sigma project.
• The X's should be derived from your cause and effect diagram. Let us take a peek as what it looks like on the next page.
259
© Lean Sigm
a Corporation
Lean Six Sigma Training -SXL
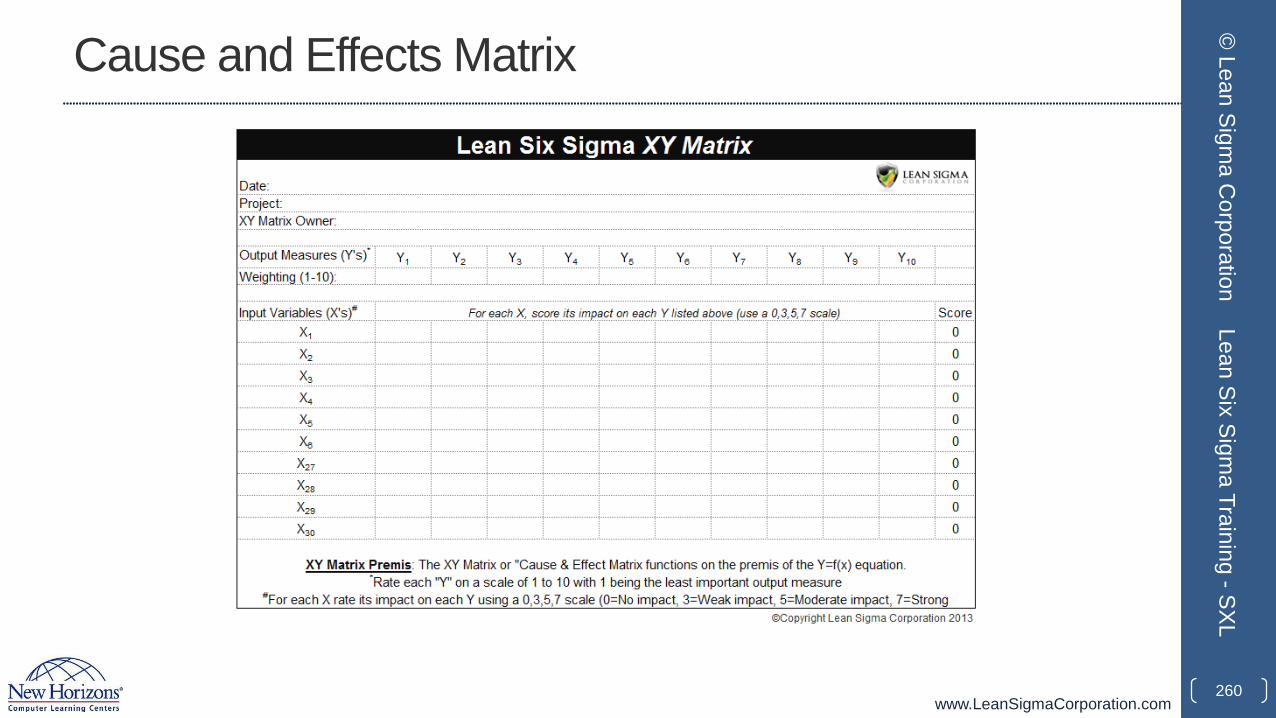
www.LeanSigmaCorporation.com
Cause and Effects Matrix
260
© Lean Sigm
a Corporation
Lean Six Sigma Training -SXL
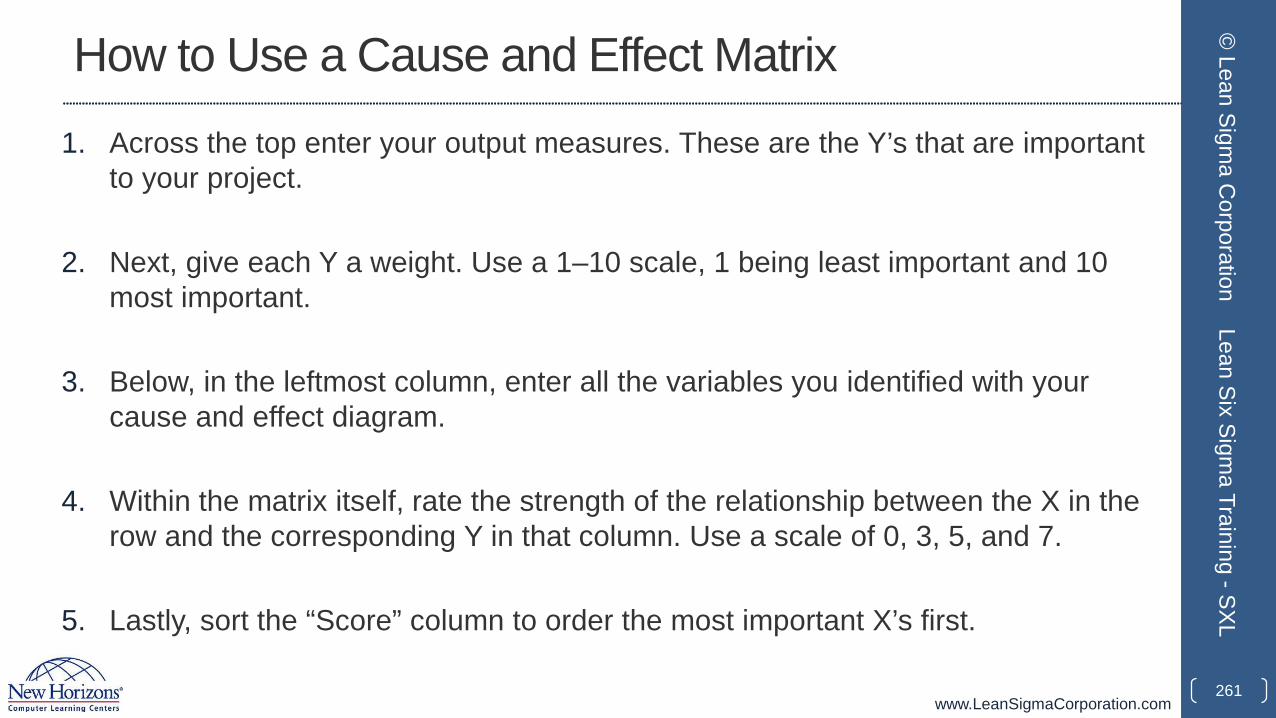
www.LeanSigmaCorporation.com
How to Use a Cause and Effect Matrix1. Across the top enter your output measures. These are the Y’s that are important
to your project.
2. Next, give each Y a weight. Use a 1–10 scale, 1 being least important and 10 most important.
3. Below, in the leftmost column, enter all the variables you identified with your cause and effect diagram.
4. Within the matrix itself, rate the strength of the relationship between the X in the row and the corresponding Y in that column. Use a scale of 0, 3, 5, and 7.
5. Lastly, sort the “Score” column to order the most important X’s first.
261
© Lean Sigm
a Corporation
Lean Six Sigma Training -SXL
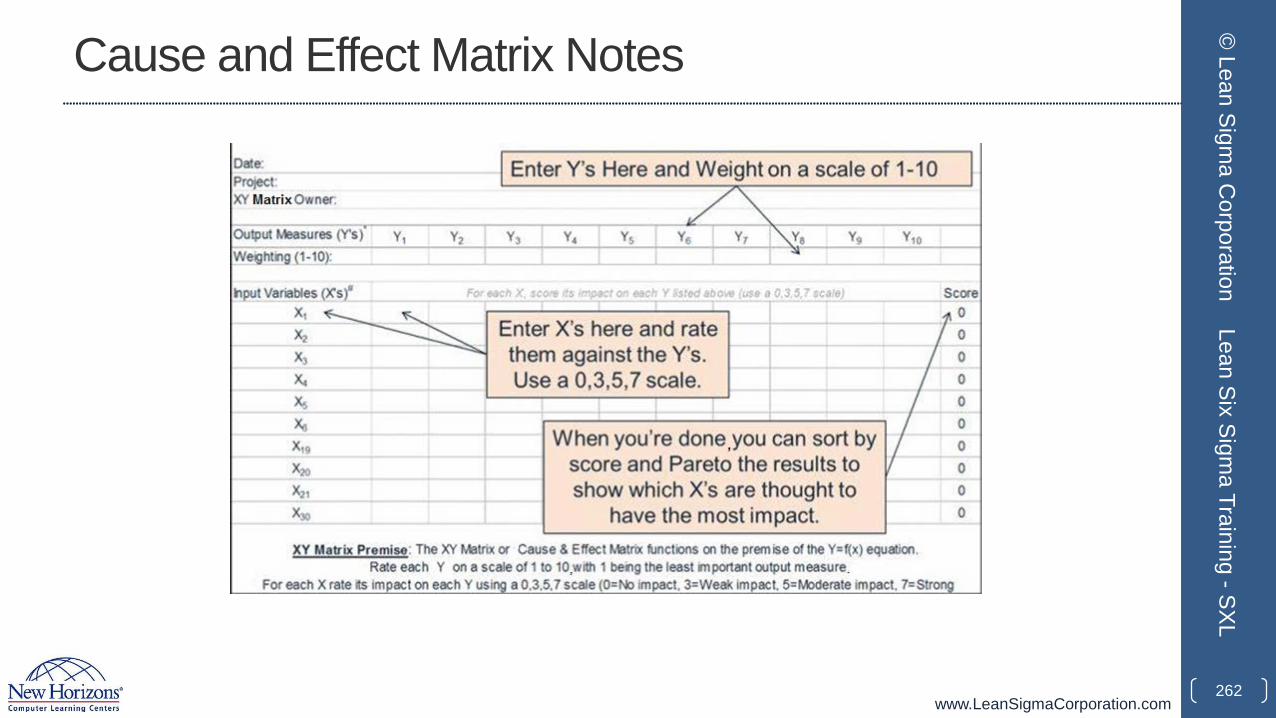
www.LeanSigmaCorporation.com
Cause and Effect Matrix Notes
262
© Lean Sigm
a Corporation
Lean Six Sigma Training -SXL
www.LeanSigmaCorporation.com
After You Have Completed the C&E Matrix
After you have completed your cause and effects matrix, build a strategy for validating and/or eliminating the x’s as significant variables to the Y=f(x) equation.
• Build a data collection plan
• Prepare and execute planned studies
• Perform analytics
• Review results with SMEs
• etc.263
© Lean Sigm
a Corporation
Lean Six Sigma Training -SXL
www.LeanSigmaCorporation.com
2.1.3 Process Mapping
264
© Lean Sigm
a Corporation
Lean Six Sigma Training -SXL
www.LeanSigmaCorporation.com
What is a Process Map?
• A process map is a graphical representation of a process flow.
• It visualizes how the business process is accomplished step by step.• It describes how the information or materials sequentially flow from one
business entity to the next.• It illustrates who is responsible for what between the process boundaries.• It depicts the input and output of each individual process step.
• In the Measure phase, the project team should map the current state of the process instead of the ideal state.
265
© Lean Sigm
a Corporation
Lean Six Sigma Training -SXL
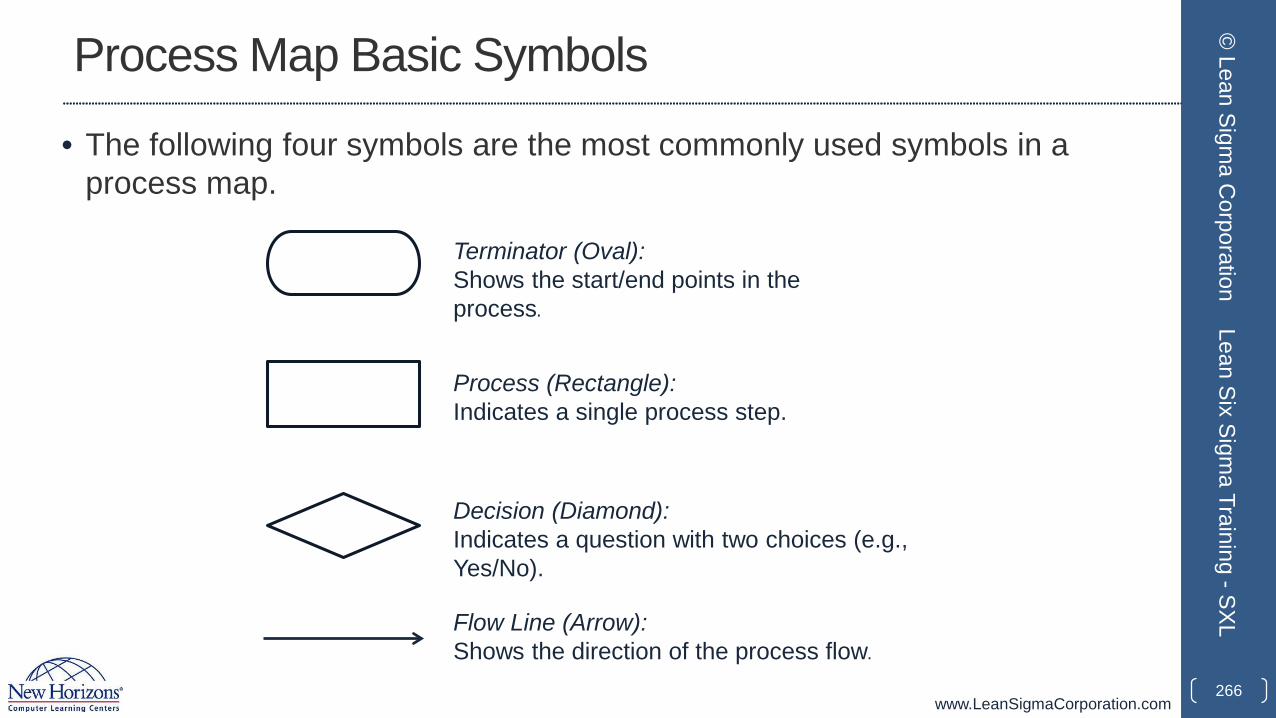
www.LeanSigmaCorporation.com
Process Map Basic Symbols
• The following four symbols are the most commonly used symbols in a process map.
266
© Lean Sigm
a Corporation
Lean Six Sigma Training -SXL
Terminator (Oval):Shows the start/end points in the process.
Process (Rectangle):Indicates a single process step.
Decision (Diamond):Indicates a question with two choices (e.g., Yes/No).
Flow Line (Arrow):Shows the direction of the process flow.
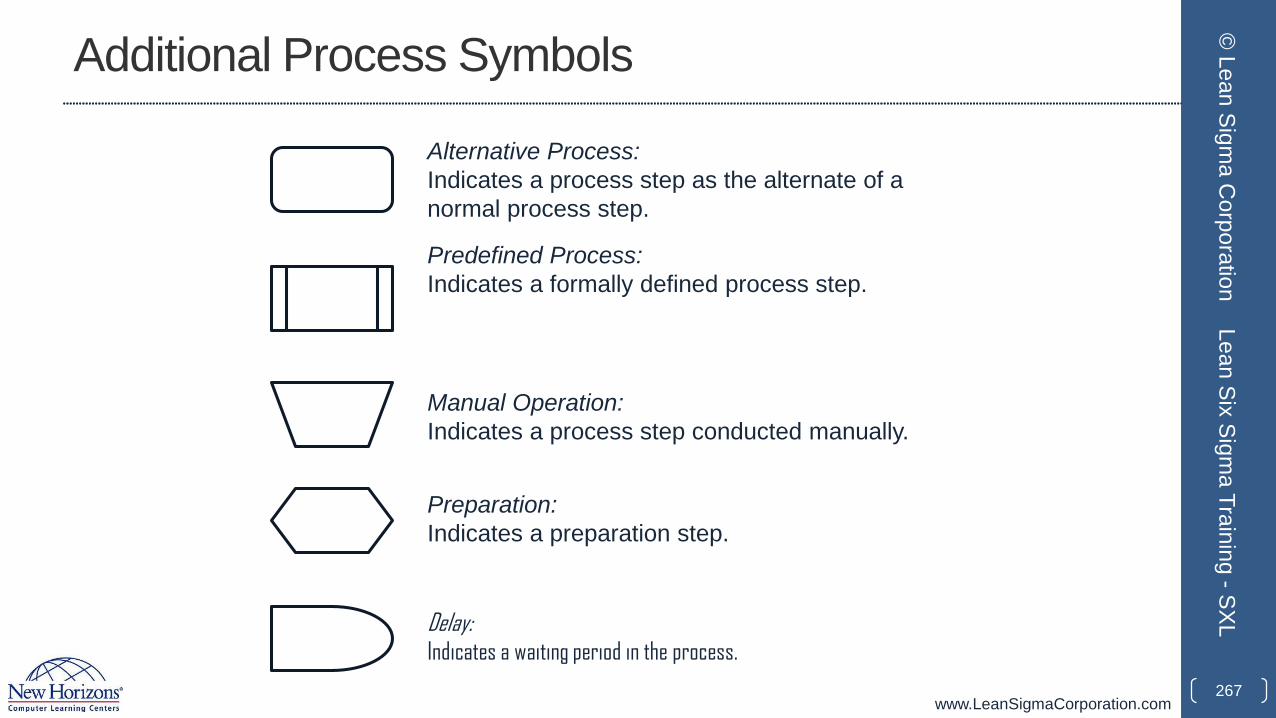
www.LeanSigmaCorporation.com
Additional Process Symbols
267
© Lean Sigm
a Corporation
Lean Six Sigma Training -SXL
Alternative Process:Indicates a process step as the alternate of a normal process step.
Predefined Process:Indicates a formally defined process step.
Manual Operation:Indicates a process step conducted manually.
Preparation:Indicates a preparation step.
Delay:Indicates a waiting period in the process.
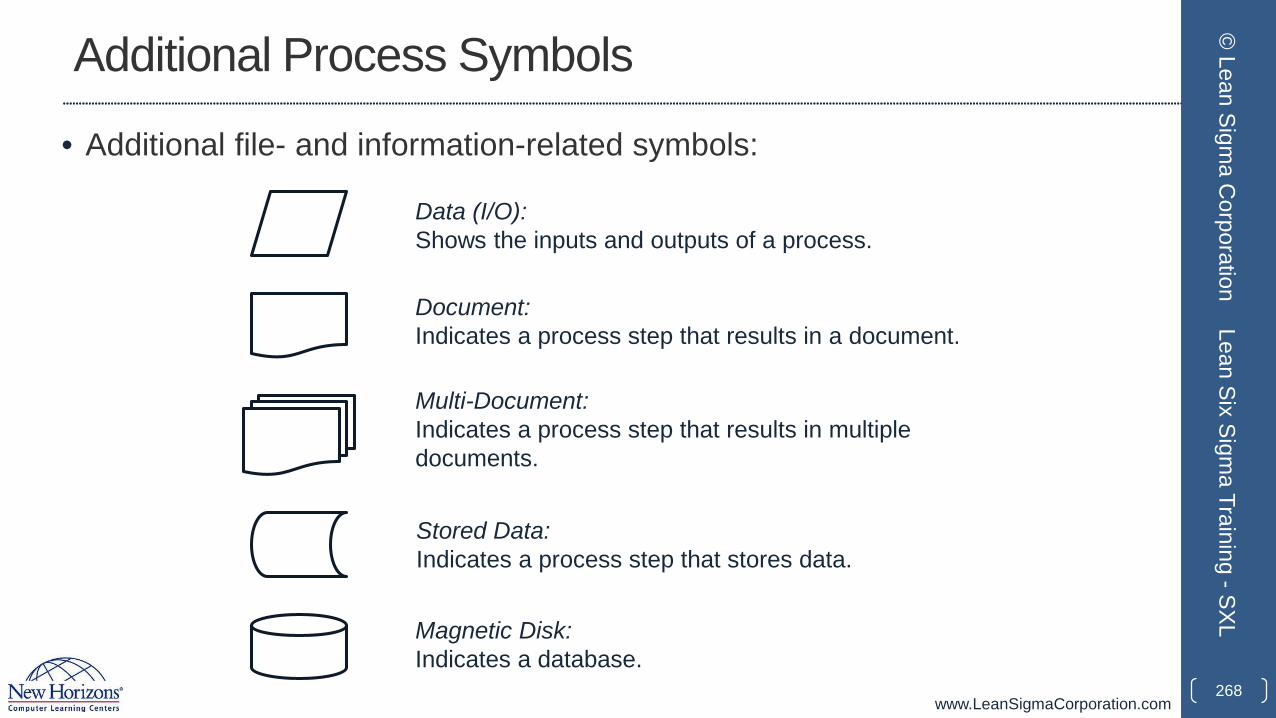
www.LeanSigmaCorporation.com
Additional Process Symbols
• Additional file- and information-related symbols:
268
© Lean Sigm
a Corporation
Lean Six Sigma Training -SXL
Data (I/O):Shows the inputs and outputs of a process.
Document:Indicates a process step that results in a document.
Multi-Document:Indicates a process step that results in multiple documents.
Stored Data:Indicates a process step that stores data.
Magnetic Disk:Indicates a database.
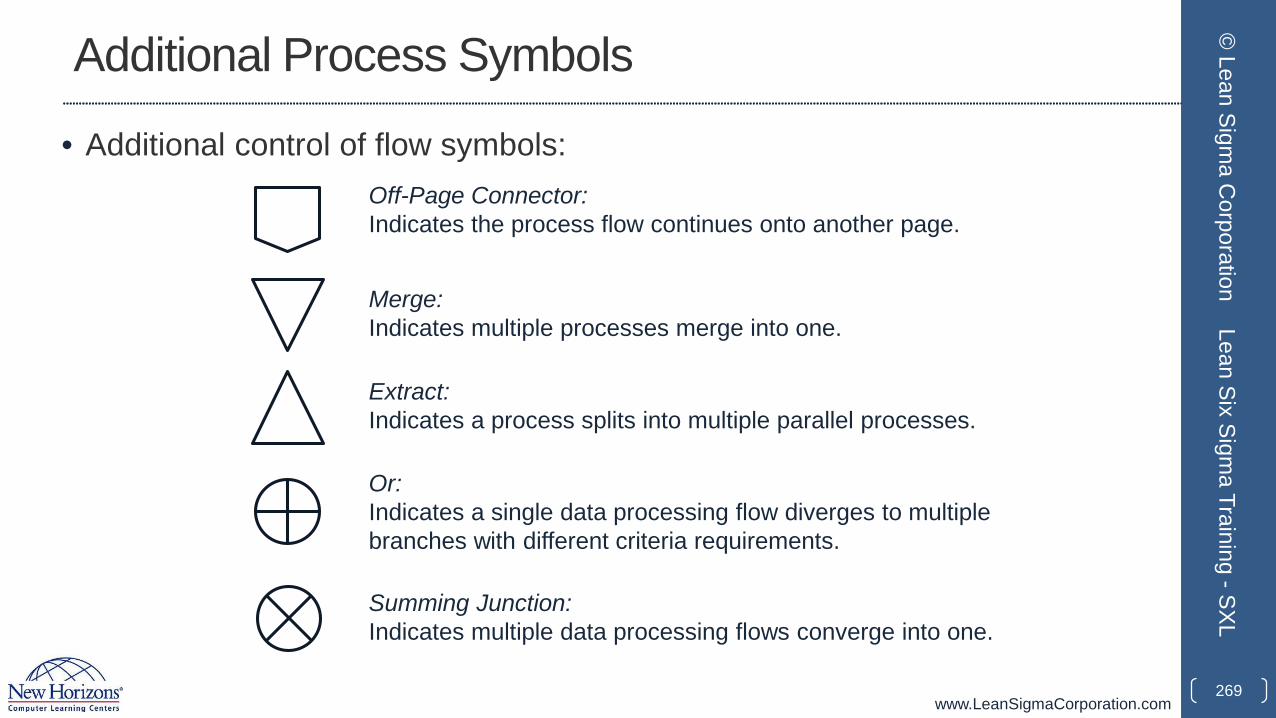
www.LeanSigmaCorporation.com
Additional Process Symbols
• Additional control of flow symbols:
269
© Lean Sigm
a Corporation
Lean Six Sigma Training -SXL
Off-Page Connector:Indicates the process flow continues onto another page.
Merge:Indicates multiple processes merge into one.
Extract:Indicates a process splits into multiple parallel processes.
Or:Indicates a single data processing flow diverges to multiple branches with different criteria requirements.
Summing Junction:Indicates multiple data processing flows converge into one.
www.LeanSigmaCorporation.com
How to Plot a Process Map
• Step 1: Define boundaries of the process you want to map.
• A process map can depict the flow of an entire process or a segment of it.
• You need to identify and define the beginning and ending points of the process before starting to plot.
• Use operational definition.
270
© Lean Sigm
a Corporation
Lean Six Sigma Training -SXL
www.LeanSigmaCorporation.com
How to Plot a Process Map
• Step 2: Define and sort the process steps with the flow.
• Consult with process owners and subject matter experts or observe the process in action to understand how the process is actually performed.
• Record the process steps and sort them according to the order of their occurrence.
271
© Lean Sigm
a Corporation
Lean Six Sigma Training -SXL
www.LeanSigmaCorporation.com
How to Plot a Process Map
• Step 3: Fill the step information into the appropriate process symbols and plot the diagram.
• In the team meeting of process mapping, place the sticky notes with different colors on a white board to flexibly adjust the under-construction process map.
• The flow lines are plotted directly on the white board. For the decision step, rotate the sticky note by 45°.
• When the map is completed on the white board, record the map using Excel, PowerPoint, or Visio.
272
© Lean Sigm
a Corporation
Lean Six Sigma Training -SXL
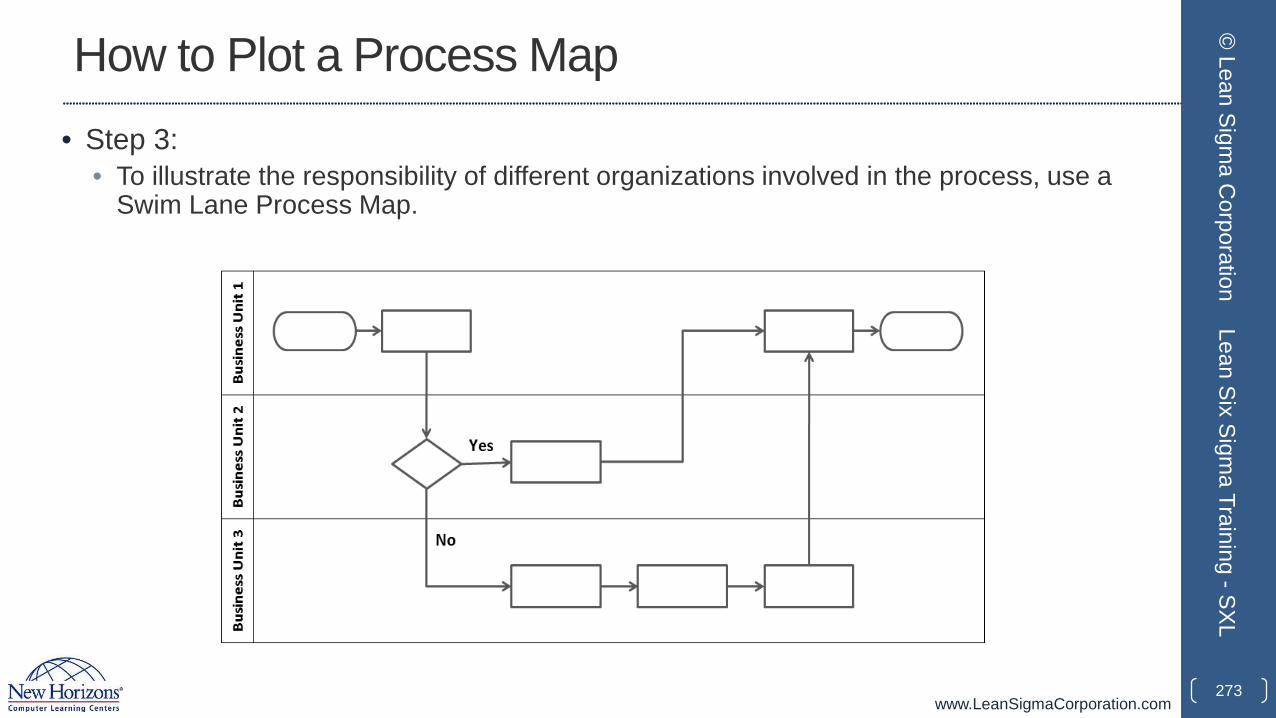
www.LeanSigmaCorporation.com
How to Plot a Process Map• Step 3:
• To illustrate the responsibility of different organizations involved in the process, use a Swim Lane Process Map.
273
© Lean Sigm
a Corporation
Lean Six Sigma Training -SXL
www.LeanSigmaCorporation.com
How to Plot a Process Map
• Step 4: Identify and record the inputs/outputs and their corresponding specifications for each process step.
• The process map helps in understanding and documenting Y=f(x) of a process where Y represents the outputs and x represents the inputs.
• The inputs of each process step can be controllable or non-controllable, standardized operational procedure, or noise. They are the source of variation in the process and need to be analyzed qualitatively and quantitatively in order to identify the vital few inputs that have significant effect on the outcome of the process.
• The outputs of each process step can be products, information, services, etc. They are the little Y’s within the process.
274
© Lean Sigm
a Corporation
Lean Six Sigma Training -SXL
www.LeanSigmaCorporation.com
How to Plot a Process Map
• Step 5: Evaluate the process map and adjust it if needed.
• If the process is too complicated to be covered in one single process map, you may create additional detailed sub-process maps for further information.
• Number the process steps in the order of their occurrence for clarity.
275
© Lean Sigm
a Corporation
Lean Six Sigma Training -SXL
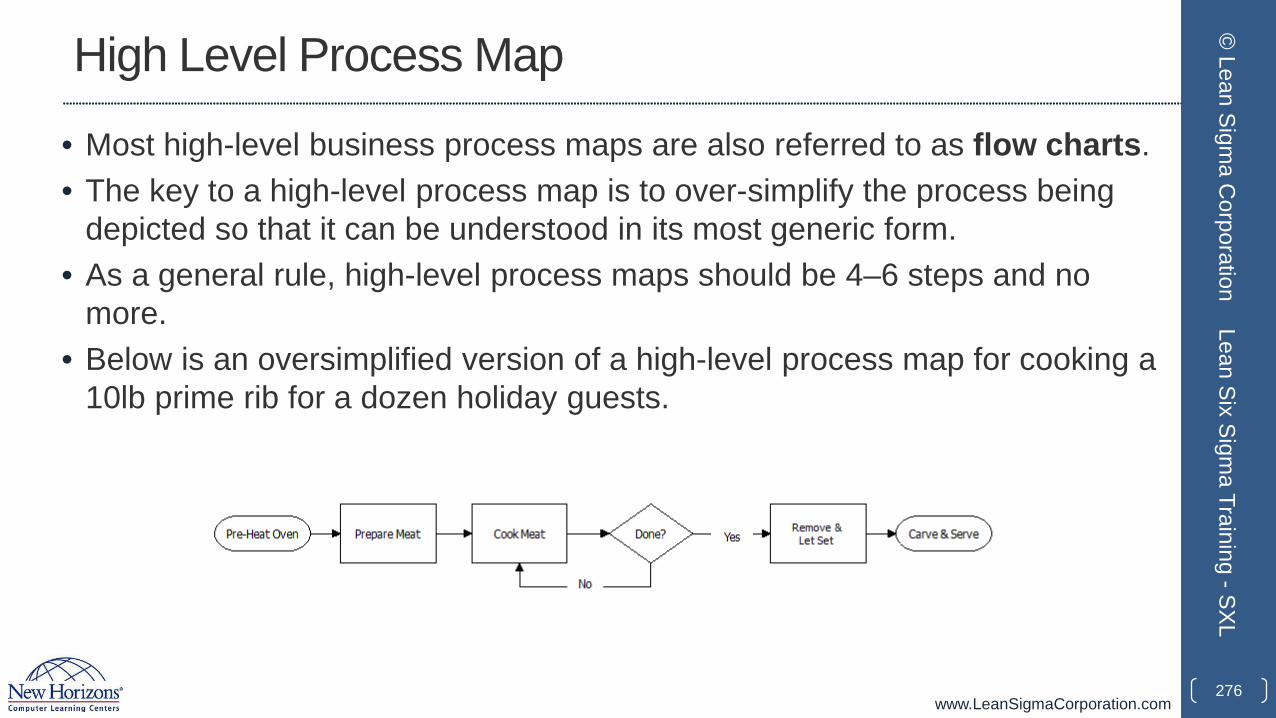
www.LeanSigmaCorporation.com
High Level Process Map
• Most high-level business process maps are also referred to as flow charts. • The key to a high-level process map is to over-simplify the process being
depicted so that it can be understood in its most generic form.• As a general rule, high-level process maps should be 4–6 steps and no
more. • Below is an oversimplified version of a high-level process map for cooking a
10lb prime rib for a dozen holiday guests.
276
© Lean Sigm
a Corporation
Lean Six Sigma Training -SXL
www.LeanSigmaCorporation.com
Detailed Process Map
• Detailed process maps or multi-level maps take the high-level map much further.
• Detailed maps can be two, three, or more levels deeper than your high-level process map.
• A good guideline used to help create the second level is to take each step in the high-level map and break it down into another two to four steps each (no more).
• Repeat this process (level 3, level 4 etc.) until reaching the desired level of detail.
• Some detailed maps are two or three levels deep, others can be five or six levels deep. Obviously, the deeper the levels, the more complex and the more burdensome.
277
© Lean Sigm
a Corporation
Lean Six Sigma Training -SXL
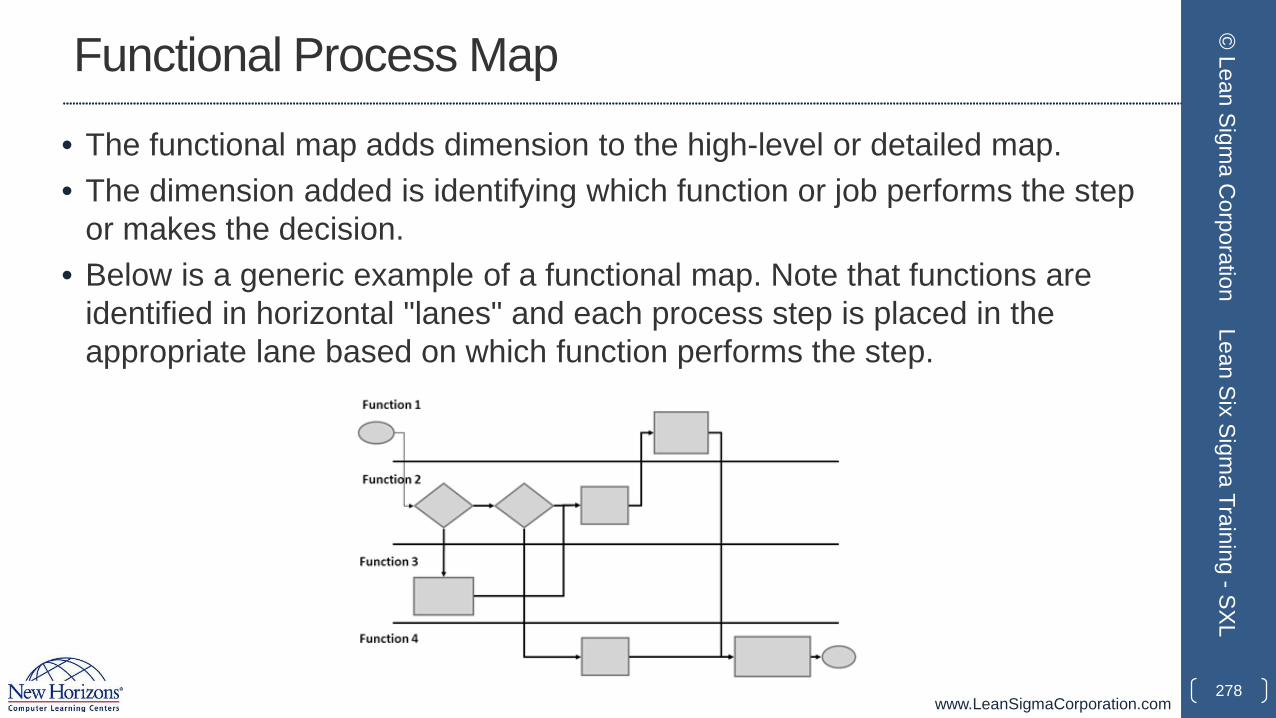
www.LeanSigmaCorporation.com
Functional Process Map
• The functional map adds dimension to the high-level or detailed map. • The dimension added is identifying which function or job performs the step
or makes the decision.• Below is a generic example of a functional map. Note that functions are
identified in horizontal "lanes" and each process step is placed in the appropriate lane based on which function performs the step.
278
© Lean Sigm
a Corporation
Lean Six Sigma Training -SXL
www.LeanSigmaCorporation.com
What is SIPOC?
• A SIPOC (Suppliers-Input-Process-Output-Customers) is a high-level visualization tool to help identify and link the different components in a process.
• It is usually applied in the Measure phase in order to better understand the current state of the process and define the scope of the project.
279
© Lean Sigm
a Corporation
Lean Six Sigma Training -SXL
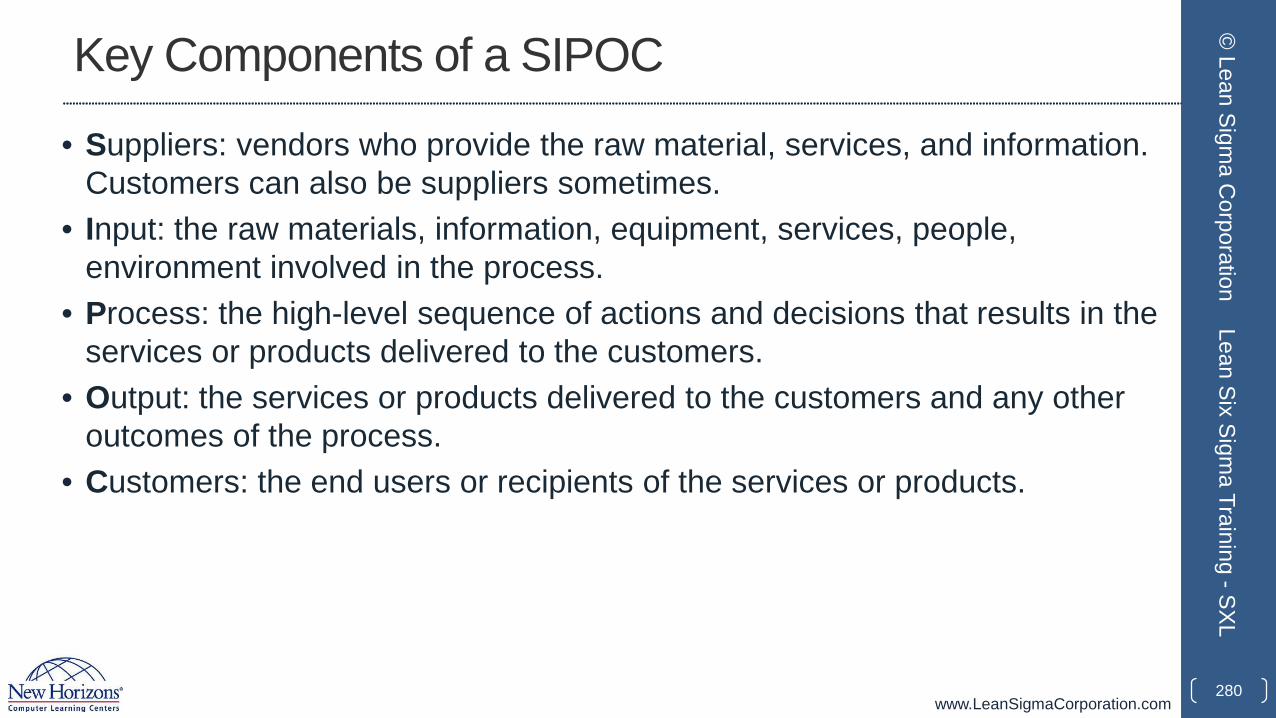
www.LeanSigmaCorporation.com
Key Components of a SIPOC
• Suppliers: vendors who provide the raw material, services, and information. Customers can also be suppliers sometimes.
• Input: the raw materials, information, equipment, services, people, environment involved in the process.
• Process: the high-level sequence of actions and decisions that results in the services or products delivered to the customers.
• Output: the services or products delivered to the customers and any other outcomes of the process.
• Customers: the end users or recipients of the services or products.
280
© Lean Sigm
a Corporation
Lean Six Sigma Training -SXL
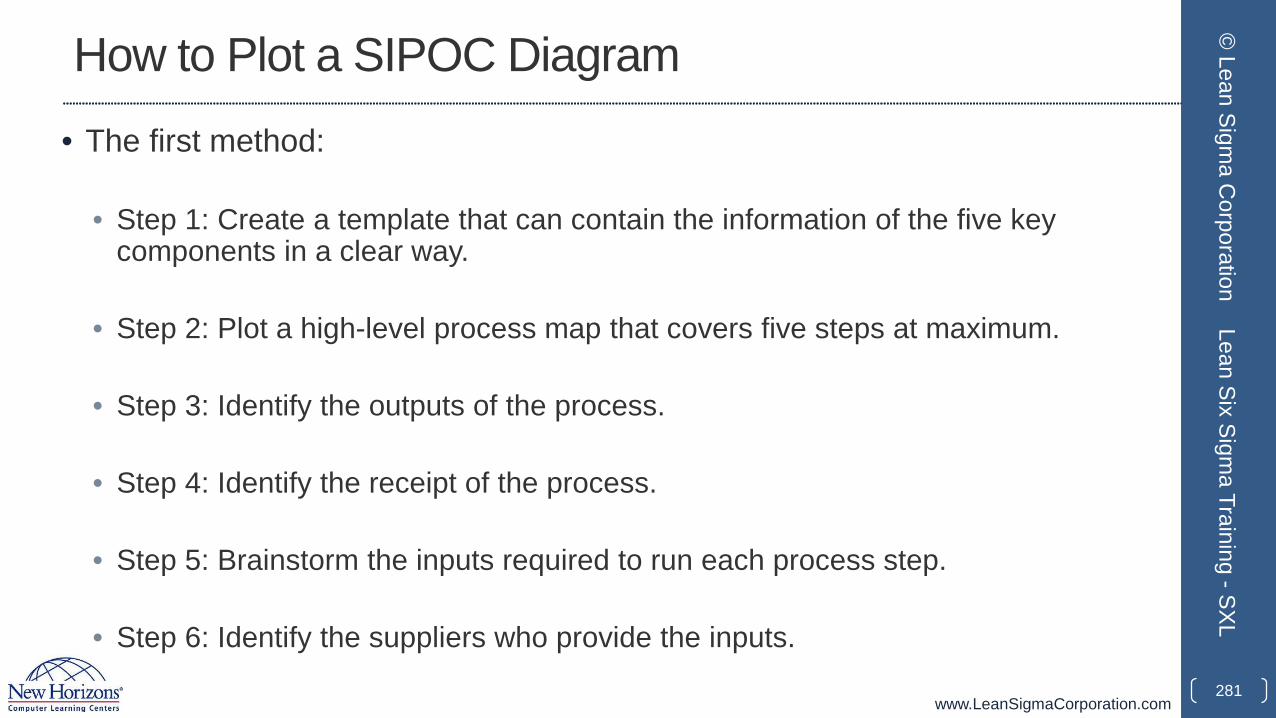
www.LeanSigmaCorporation.com
How to Plot a SIPOC Diagram• The first method:
• Step 1: Create a template that can contain the information of the five key components in a clear way.
• Step 2: Plot a high-level process map that covers five steps at maximum.
• Step 3: Identify the outputs of the process.
• Step 4: Identify the receipt of the process.
• Step 5: Brainstorm the inputs required to run each process step.
• Step 6: Identify the suppliers who provide the inputs.281
© Lean Sigm
a Corporation
Lean Six Sigma Training -SXL
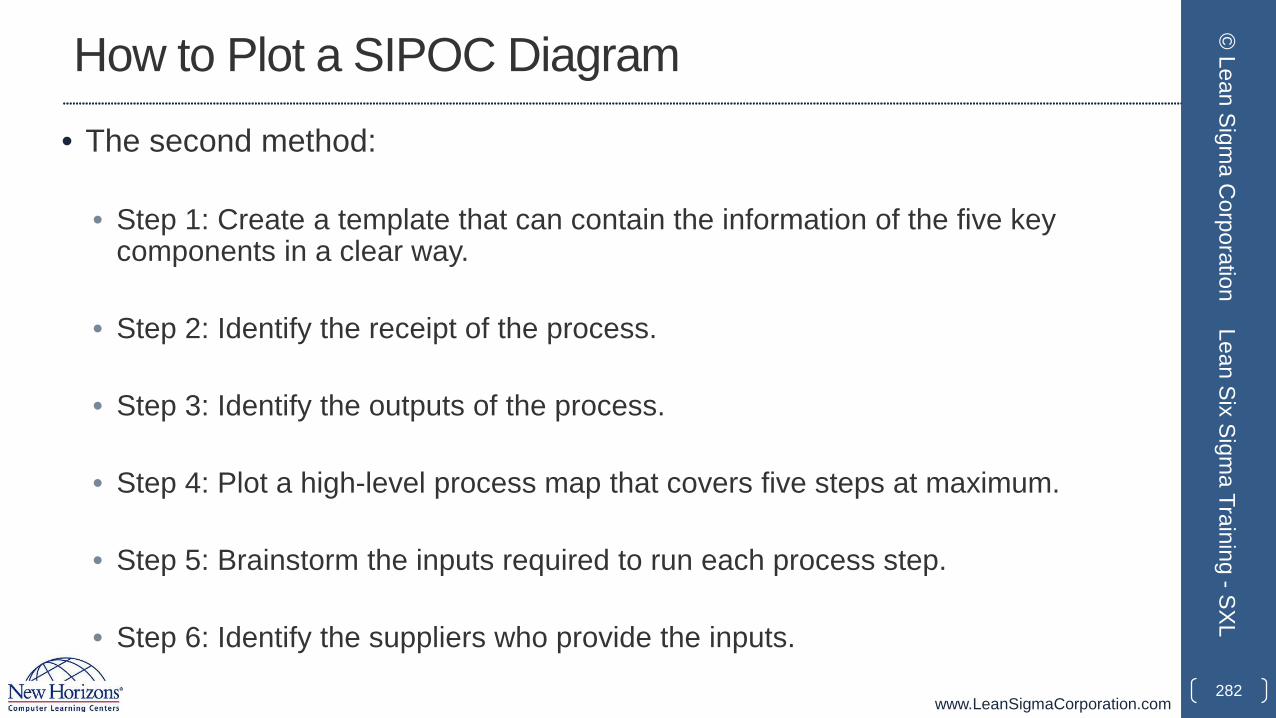
www.LeanSigmaCorporation.com
How to Plot a SIPOC Diagram• The second method:
• Step 1: Create a template that can contain the information of the five key components in a clear way.
• Step 2: Identify the receipt of the process.
• Step 3: Identify the outputs of the process.
• Step 4: Plot a high-level process map that covers five steps at maximum.
• Step 5: Brainstorm the inputs required to run each process step.
• Step 6: Identify the suppliers who provide the inputs.282
© Lean Sigm
a Corporation
Lean Six Sigma Training -SXL
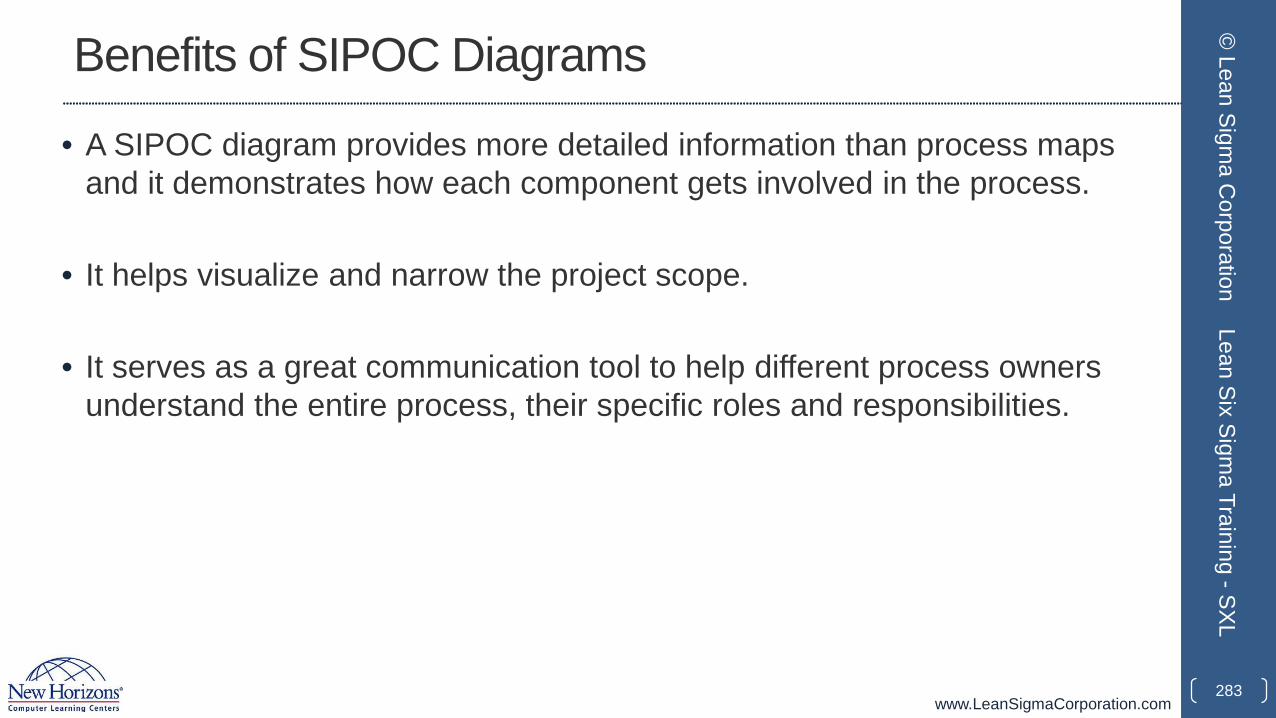
www.LeanSigmaCorporation.com
Benefits of SIPOC Diagrams
• A SIPOC diagram provides more detailed information than process maps and it demonstrates how each component gets involved in the process.
• It helps visualize and narrow the project scope.
• It serves as a great communication tool to help different process owners understand the entire process, their specific roles and responsibilities.
283
© Lean Sigm
a Corporation
Lean Six Sigma Training -SXL
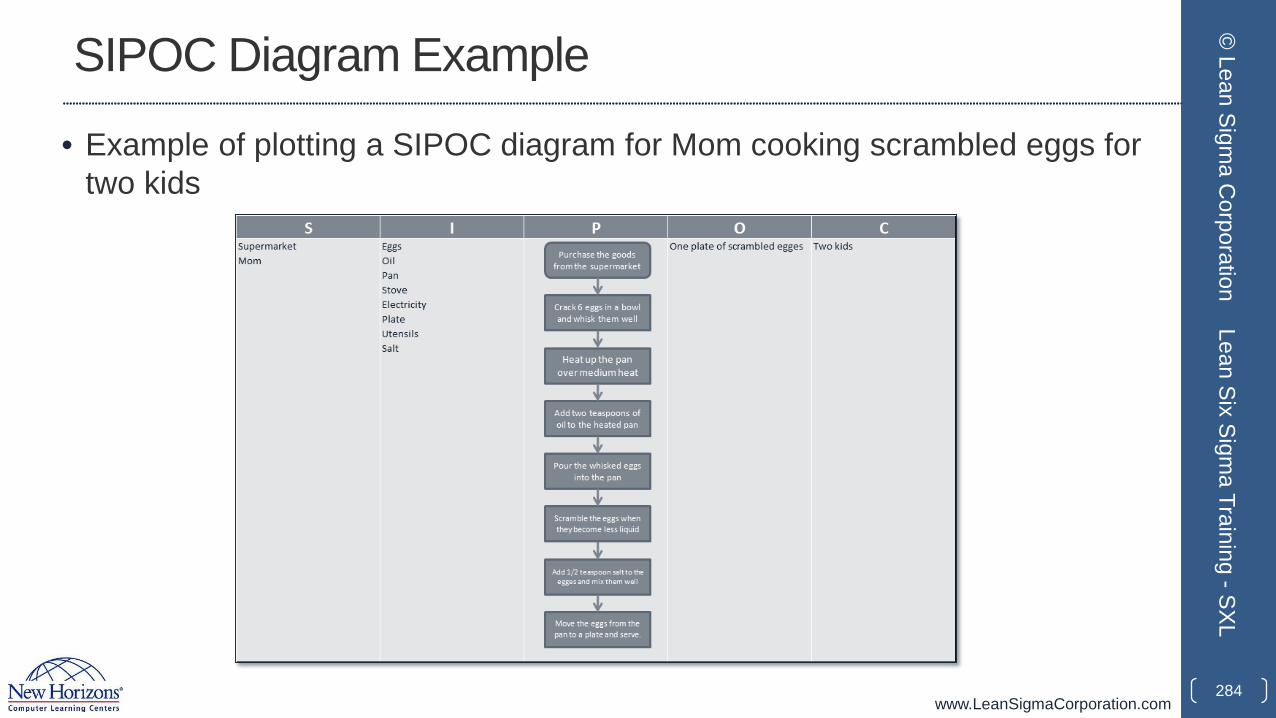
www.LeanSigmaCorporation.com
SIPOC Diagram Example
• Example of plotting a SIPOC diagram for Mom cooking scrambled eggs for two kids
284
© Lean Sigm
a Corporation
Lean Six Sigma Training -SXL
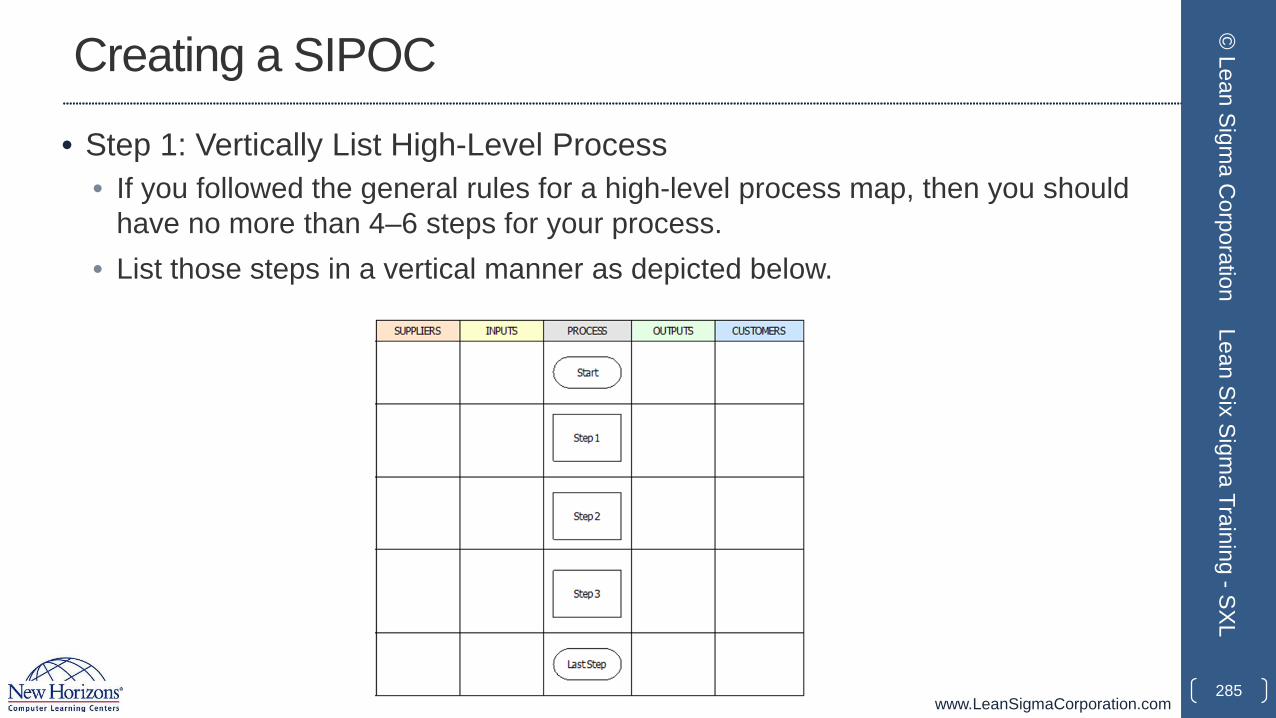
www.LeanSigmaCorporation.com
Creating a SIPOC
• Step 1: Vertically List High-Level Process• If you followed the general rules for a high-level process map, then you should
have no more than 4–6 steps for your process.• List those steps in a vertical manner as depicted below.
285
© Lean Sigm
a Corporation
Lean Six Sigma Training -SXL
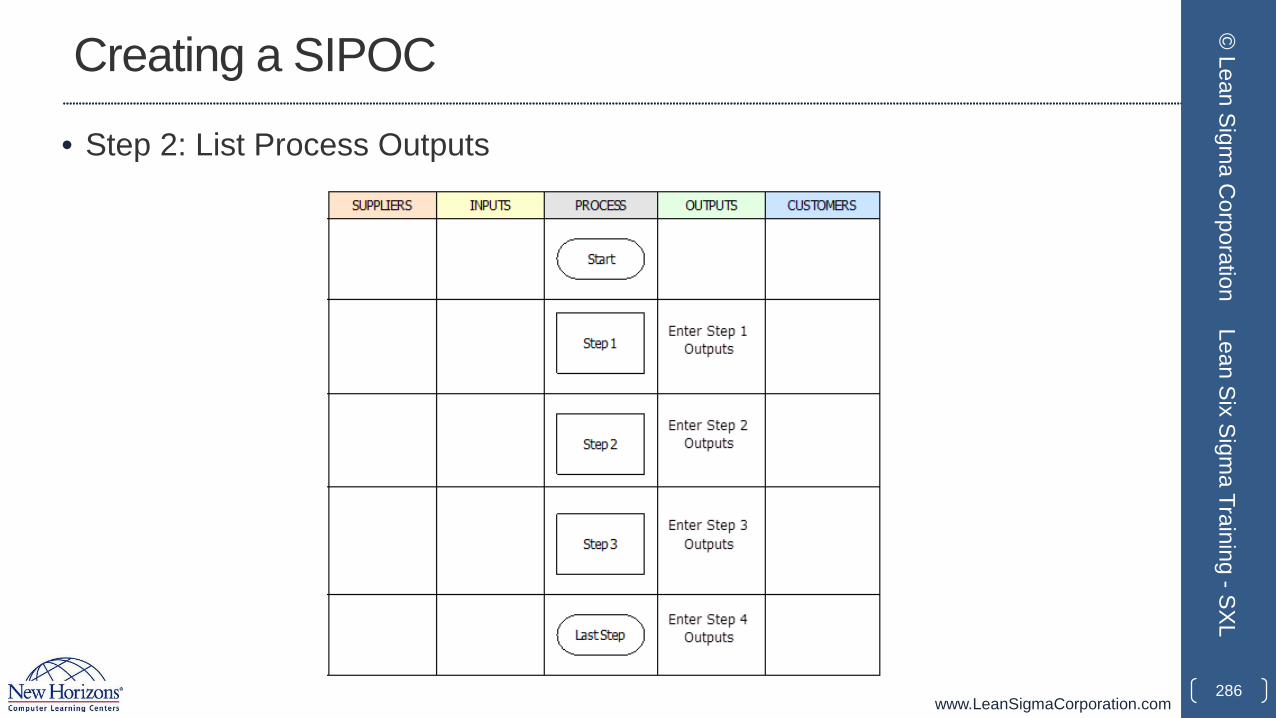
www.LeanSigmaCorporation.com
Creating a SIPOC
• Step 2: List Process Outputs
286
© Lean Sigm
a Corporation
Lean Six Sigma Training -SXL
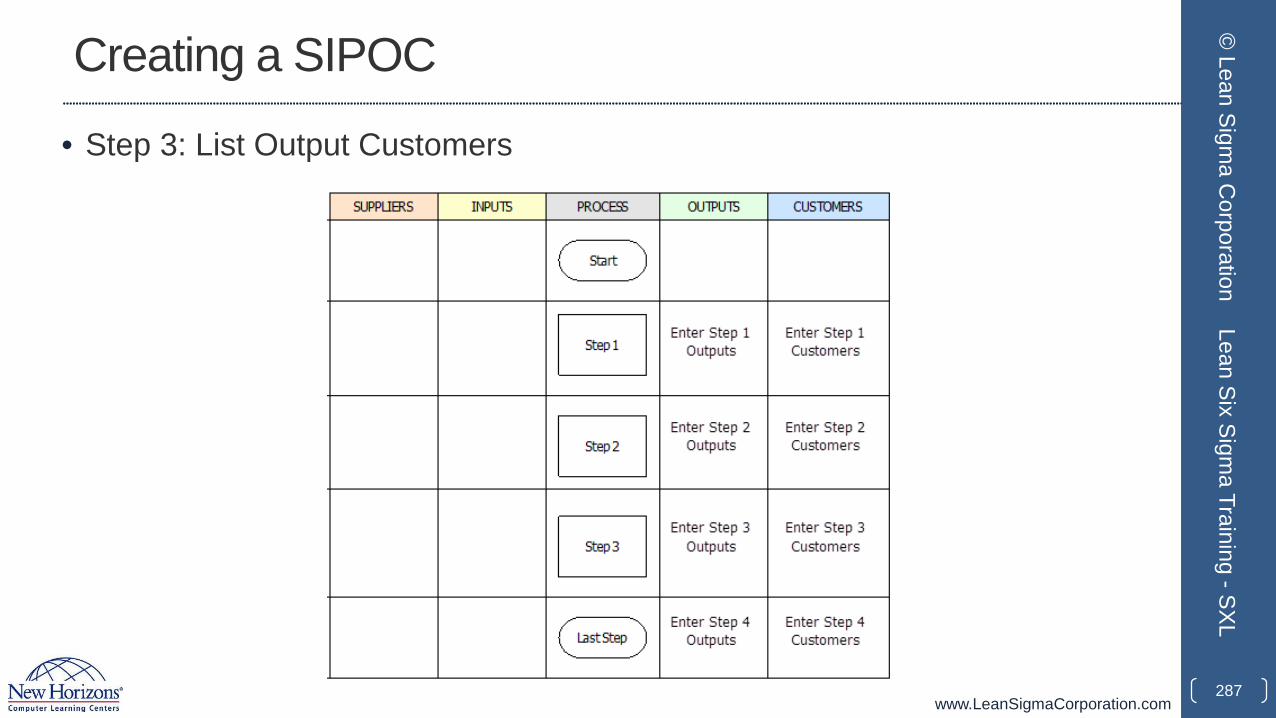
www.LeanSigmaCorporation.com
Creating a SIPOC
• Step 3: List Output Customers
287
© Lean Sigm
a Corporation
Lean Six Sigma Training -SXL

www.LeanSigmaCorporation.com
Creating a SIPOC
• Step 4: List Process Inputs
288
© Lean Sigm
a Corporation
Lean Six Sigma Training -SXL
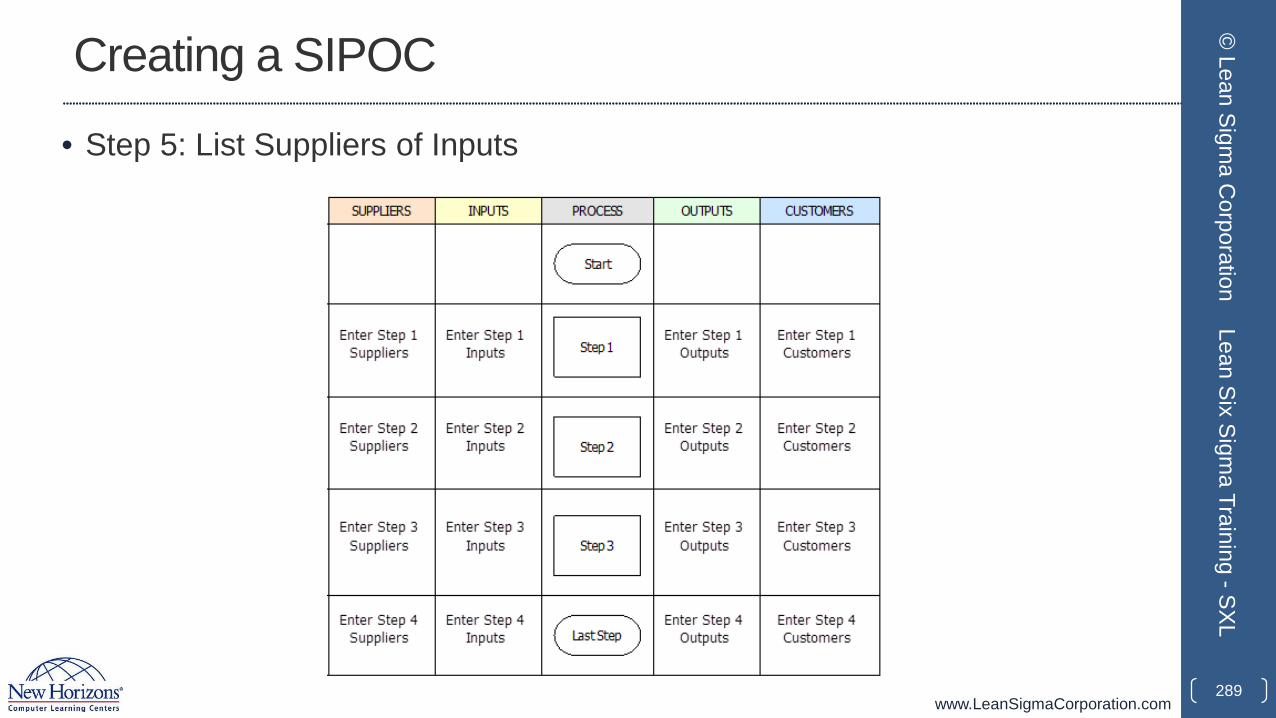
www.LeanSigmaCorporation.com
Creating a SIPOC
• Step 5: List Suppliers of Inputs
289
© Lean Sigm
a Corporation
Lean Six Sigma Training -SXL
www.LeanSigmaCorporation.com
SIPOC Benefits
• Visually communicate project scope• Identify key inputs and outputs of a process• Identify key suppliers and customers of a process• Verify:
• Inputs match outputs for upstream processes• Outputs match inputs for downstream processes.
• This type of mapping is effective for identifying opportunities for improvement of your process.
• If you have completed your high-level process map, follow the outlined steps to create a process map of Suppliers, Inputs, Process, Outputs, and Customer.
290
© Lean Sigm
a Corporation
Lean Six Sigma Training -SXL
www.LeanSigmaCorporation.com
What is Value Stream Mapping?
• Value stream mapping is a method to visualize and analyze the path of how information and raw materials are transformed into products or services customers receive.
• It is used to identify, measure, and decrease the non-value-adding steps in the current process.
291
© Lean Sigm
a Corporation
Lean Six Sigma Training -SXL
www.LeanSigmaCorporation.com
Non-Value-Added Activities
• Non-value-adding activities are activities in a process that do not add any other value to the products or services customers demand.
• Example of non-value-adding activities:• Rework• Overproduction• Excess transportation• Excess stock• Waiting• Unnecessary motion.
• Not all non-value-adding activities are unnecessary.
292
© Lean Sigm
a Corporation
Lean Six Sigma Training -SXL
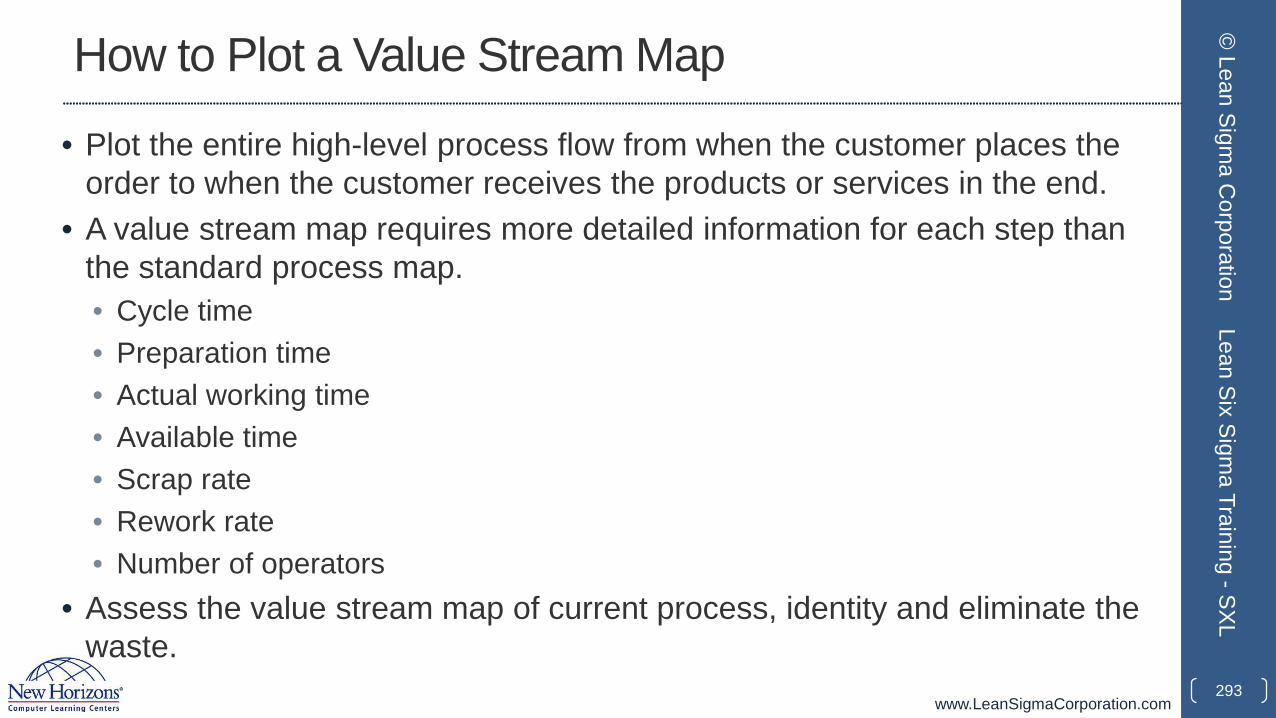
www.LeanSigmaCorporation.com
How to Plot a Value Stream Map
• Plot the entire high-level process flow from when the customer places the order to when the customer receives the products or services in the end.
• A value stream map requires more detailed information for each step than the standard process map.• Cycle time• Preparation time• Actual working time• Available time• Scrap rate• Rework rate• Number of operators
• Assess the value stream map of current process, identity and eliminate the waste.
293
© Lean Sigm
a Corporation
Lean Six Sigma Training -SXL
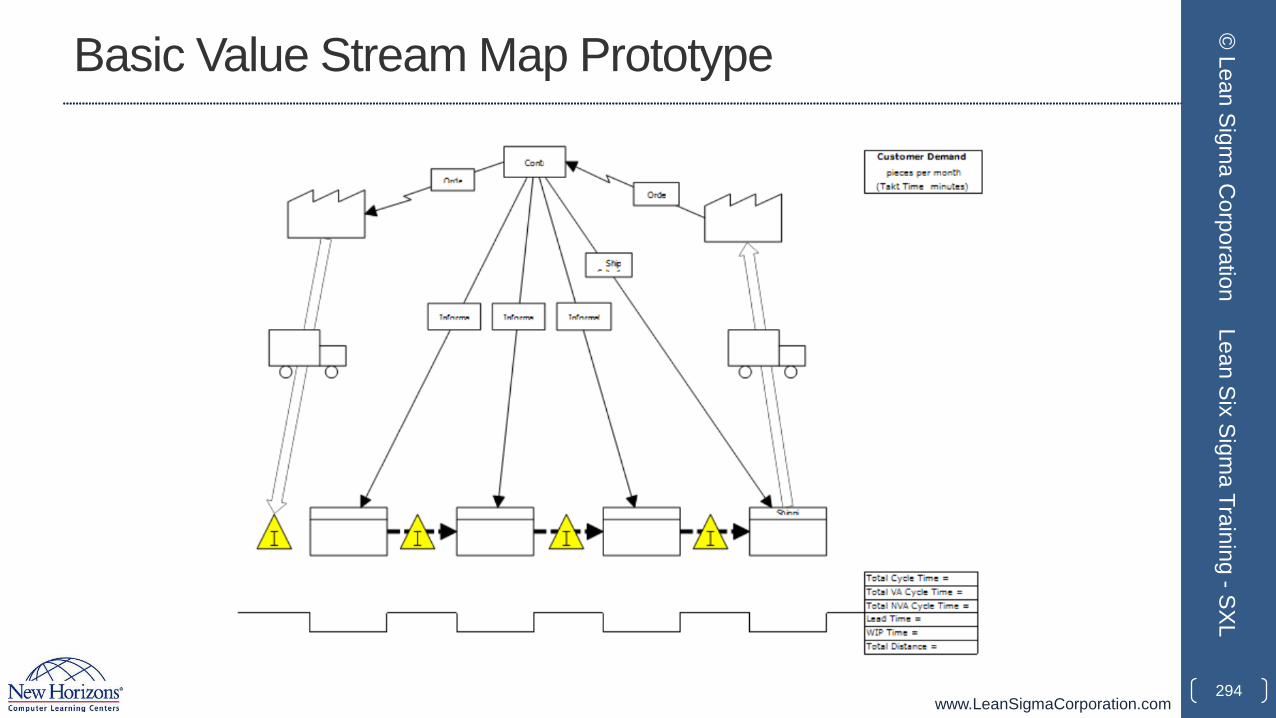
www.LeanSigmaCorporation.com
Basic Value Stream Map Prototype
294
© Lean Sigm
a Corporation
Lean Six Sigma Training -SXL
www.LeanSigmaCorporation.com
Additional Mapping Techniques
• Spaghetti Chart• Thought Process Mapping
295
© Lean Sigm
a Corporation
Lean Six Sigma Training -SXL
www.LeanSigmaCorporation.com
Spaghetti Chart
• A spaghetti chart is a graphical tool to map out the physical flow of materials, information, and people involved in a process. It can also reflect the distances between multiple workstations the physical flow has been through.
• A process that has not been streamlined has messy and wasteful movements of materials, information, and people, resembling a bowl of cooked spaghetti.
296
© Lean Sigm
a Corporation
Lean Six Sigma Training -SXL
www.LeanSigmaCorporation.com
How to Plot a Spaghetti Chart
• Step 1: Create a map of the work area layout.
• Step 2: Observe the current work flow and draw the actual work path from the very beginning of work to the end when products exit the work area.
• Step 3: Analyze the spaghetti chart and identify improvement opportunities.
297
© Lean Sigm
a Corporation
Lean Six Sigma Training -SXL
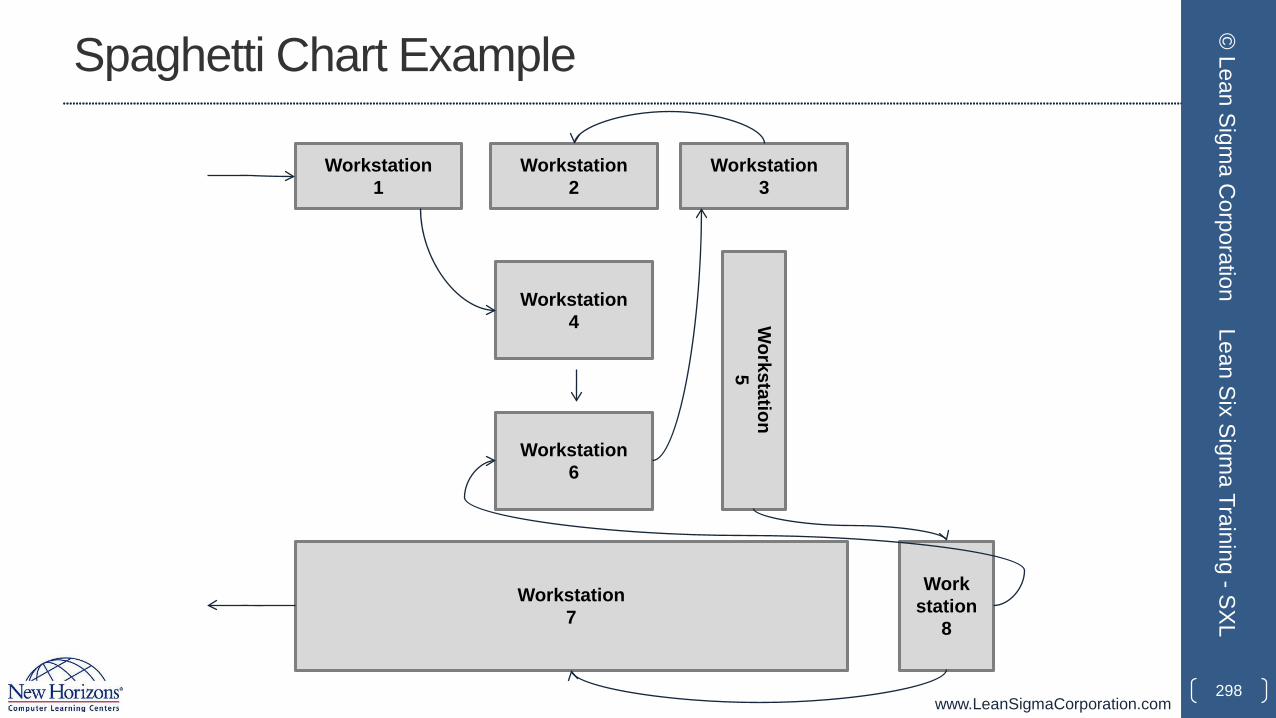
www.LeanSigmaCorporation.com
Spaghetti Chart Example
298
© Lean Sigm
a Corporation
Lean Six Sigma Training -SXL
Workstation1
Workstation2
Workstation4
Workstation7
Workstation3
Workstation
5
Workstation6
Workstation
8
www.LeanSigmaCorporation.com
Thought Process Mapping
• A thought process map is a graphical tool to help brainstorm, organize, and visualize the information, ideas, questions, or thoughts regarding reaching the project goal.
• It is a popular tool generally used at the beginning of a project in order to:• identify knowns and unknowns• communicate assumptions and risks• discover potential problems and solutions• identify resources, information, and actions required to meet the goal• present relationship of thoughts.
299
© Lean Sigm
a Corporation
Lean Six Sigma Training -SXL
www.LeanSigmaCorporation.com
How to Plot a Thought Process Map• Step 1: Define the project goal.
• Step 2: Brainstorm knowns and unknowns about the project.
• Step 3: Brainstorm questions and group the unknowns and questions into five phases (Define, Measure, Analyze, Improve, and Control).
• Step 4: Sequence the questions below the project goal and link the related questions.
• Step 5: Identify tools or methods that would be used to answer the questions.
• Step 6: Repeat steps 3 to 5 as the project continues.300
© Lean Sigm
a Corporation
Lean Six Sigma Training -SXL
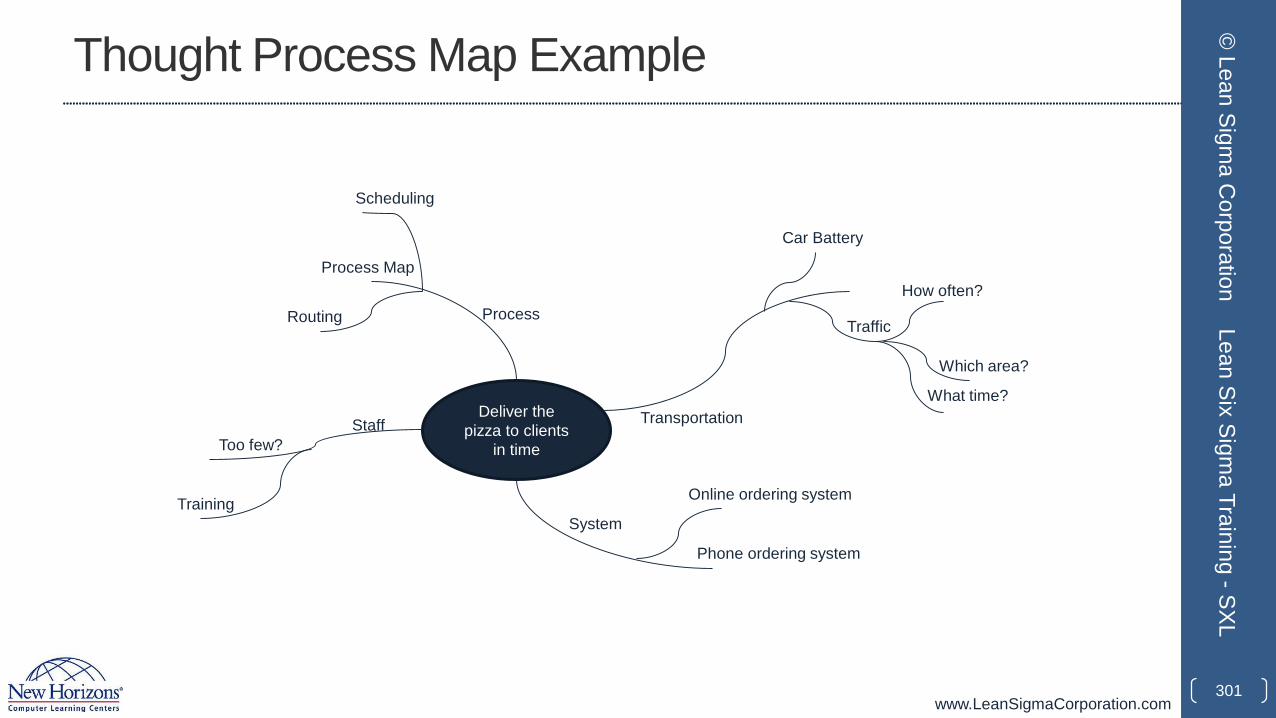
www.LeanSigmaCorporation.com
Thought Process Map Example
301
© Lean Sigm
a Corporation
Lean Six Sigma Training -SXL
Deliver the pizza to clients
in time
TransportationStaff
System
Process
Car Battery
Traffic
How often?
Which area?
What time?
Training
Too few?
Scheduling
Routing
Process Map
Online ordering system
Phone ordering system
www.LeanSigmaCorporation.com
2.1.4 FMEA
302
© Lean Sigm
a Corporation
Lean Six Sigma Training -SXL
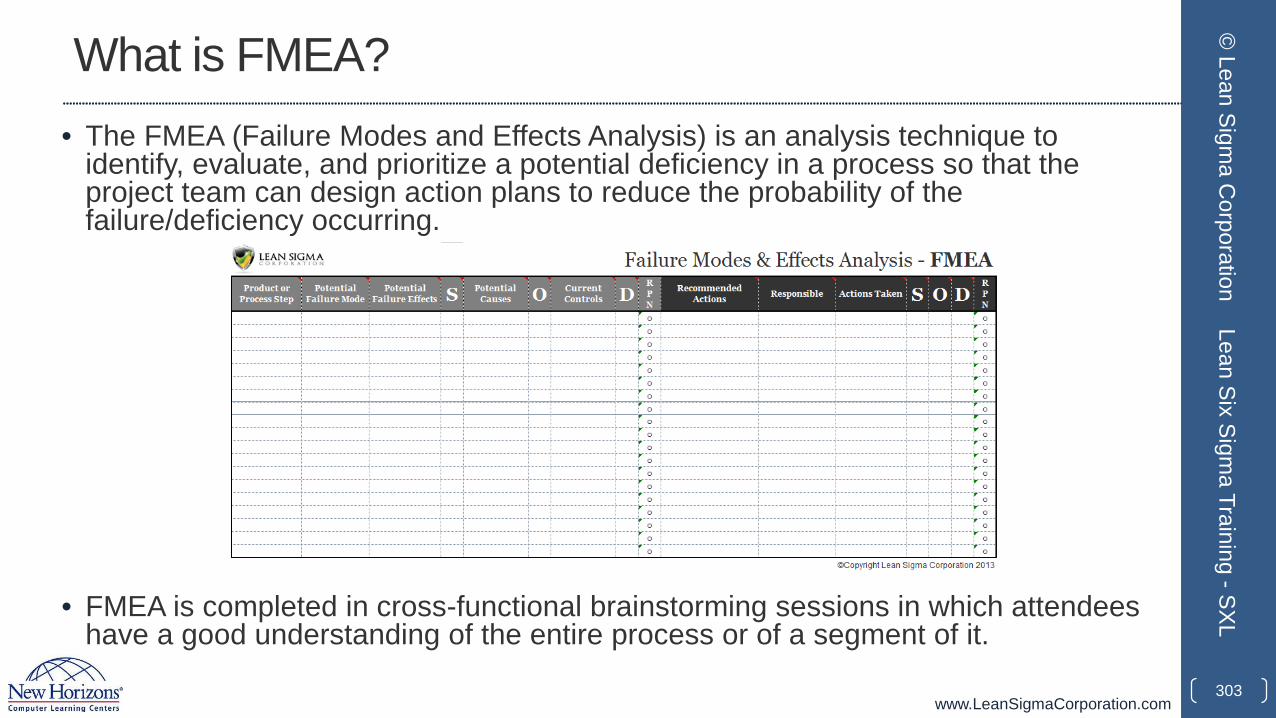
www.LeanSigmaCorporation.com
What is FMEA? • The FMEA (Failure Modes and Effects Analysis) is an analysis technique to
identify, evaluate, and prioritize a potential deficiency in a process so that the project team can design action plans to reduce the probability of the failure/deficiency occurring.
• FMEA is completed in cross-functional brainstorming sessions in which attendees have a good understanding of the entire process or of a segment of it.
303
© Lean Sigm
a Corporation
Lean Six Sigma Training -SXL
www.LeanSigmaCorporation.com
Basic FMEA Terms• Process Functions
• Process steps depicted in the process map. FMEA is based on a process map and one step/function is analyzed at a time.
• Failure Modes• Potential and actual failure in the process function/step. It usually describes the way in which
failure occurs. There might be more than one failure mode for one process function.• Failure Effects
• Impact of failure modes on the process or product. One failure mode might trigger multiple failure effects.
• Failure Causes• Potential defect of the design that might result in the failure modes occurring. One failure mode
might have multiple potential failure causes.• Current Controls
• Procedures currently conducted to prevent failure modes from happening or to detect the failure mode occurring.
304
© Lean Sigm
a Corporation
Lean Six Sigma Training -SXL
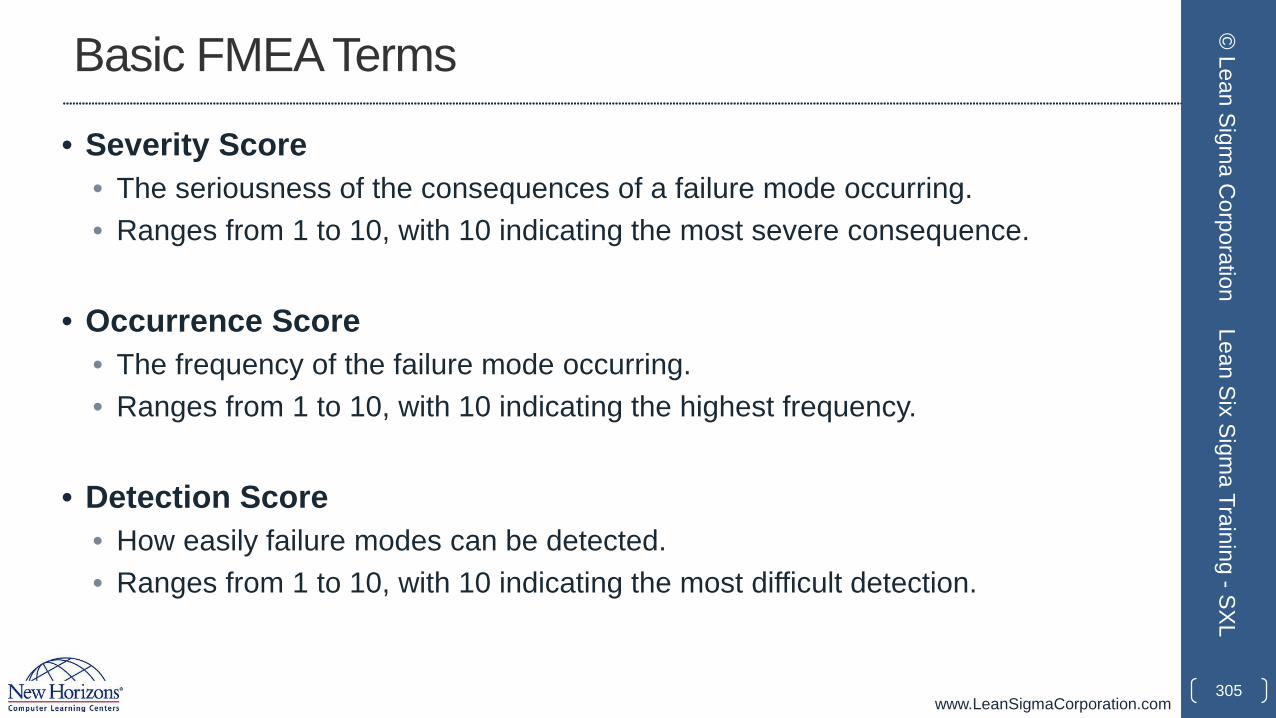
www.LeanSigmaCorporation.com
Basic FMEA Terms
• Severity Score• The seriousness of the consequences of a failure mode occurring.• Ranges from 1 to 10, with 10 indicating the most severe consequence.
• Occurrence Score• The frequency of the failure mode occurring. • Ranges from 1 to 10, with 10 indicating the highest frequency.
• Detection Score• How easily failure modes can be detected. • Ranges from 1 to 10, with 10 indicating the most difficult detection.
305
© Lean Sigm
a Corporation
Lean Six Sigma Training -SXL
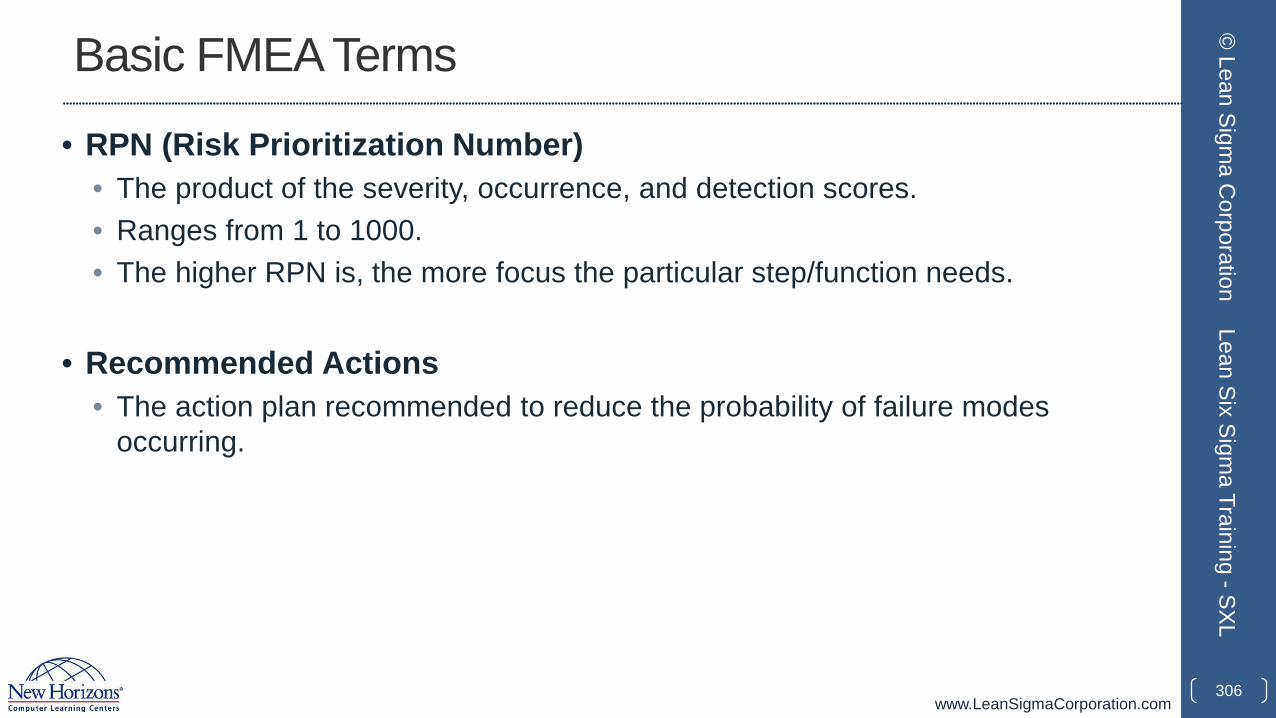
www.LeanSigmaCorporation.com
Basic FMEA Terms
• RPN (Risk Prioritization Number)• The product of the severity, occurrence, and detection scores.• Ranges from 1 to 1000. • The higher RPN is, the more focus the particular step/function needs.
• Recommended Actions• The action plan recommended to reduce the probability of failure modes
occurring.
306
© Lean Sigm
a Corporation
Lean Six Sigma Training -SXL
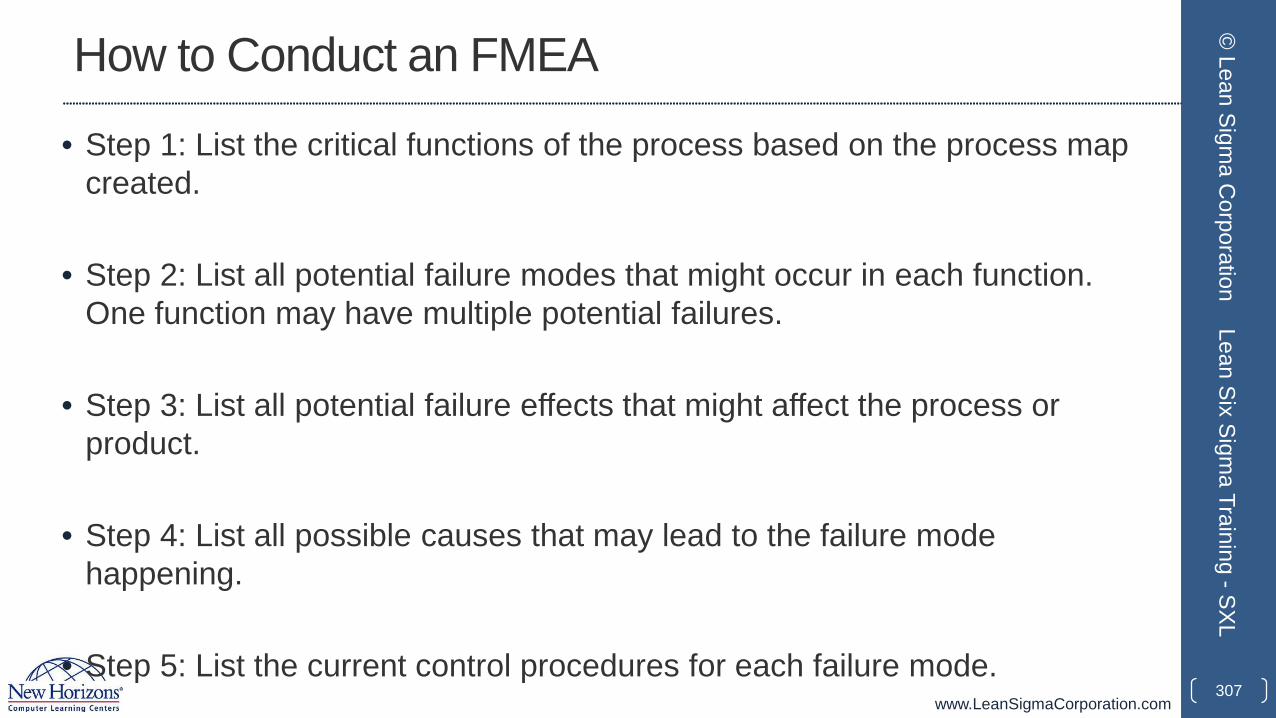
www.LeanSigmaCorporation.com
How to Conduct an FMEA
• Step 1: List the critical functions of the process based on the process map created.
• Step 2: List all potential failure modes that might occur in each function. One function may have multiple potential failures.
• Step 3: List all potential failure effects that might affect the process or product.
• Step 4: List all possible causes that may lead to the failure mode happening.
• Step 5: List the current control procedures for each failure mode. 307
© Lean Sigm
a Corporation
Lean Six Sigma Training -SXL

www.LeanSigmaCorporation.com
How to Conduct an FMEA
• Step 6: Determine the severity rating for each potential failure mode.
• Step 7: Determine the occurrence rating for each potential failure cause.
• Step 8: Determine the detection rating for each current control procedure.
• Step 9: Calculate RPN (Risk Prioritization Number).
• Step 10: Rank the failures using RPN and determine the precedence of problems or critical inputs of the process. A Pareto chart might help to focus on the failure modes with high RPNs. The higher the RPN, the higher the priority the correction action plan.
308
© Lean Sigm
a Corporation
Lean Six Sigma Training -SXL
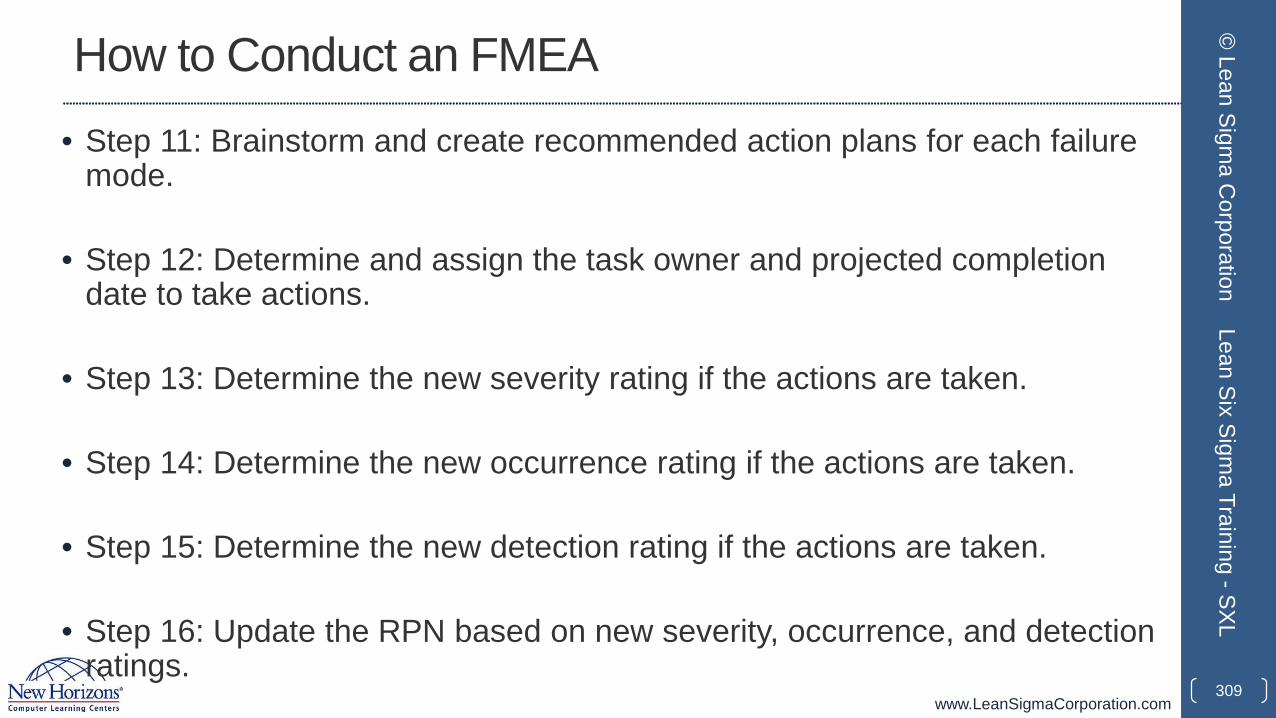
www.LeanSigmaCorporation.com
How to Conduct an FMEA• Step 11: Brainstorm and create recommended action plans for each failure
mode.
• Step 12: Determine and assign the task owner and projected completion date to take actions.
• Step 13: Determine the new severity rating if the actions are taken.
• Step 14: Determine the new occurrence rating if the actions are taken.
• Step 15: Determine the new detection rating if the actions are taken.
• Step 16: Update the RPN based on new severity, occurrence, and detection ratings.
309
© Lean Sigm
a Corporation
Lean Six Sigma Training -SXL
www.LeanSigmaCorporation.com
FMEA Example
Case study: • Joe is trying to identify, analyze, and eliminate the failure modes he
experienced in the past when preparing his work bag before heading to the office every morning. He decides to run an FMEA for his process of work bag preparation.
• There are only two steps involved in the process.• Putting the work files in the bag• Putting a water bottle in the bag.
310
© Lean Sigm
a Corporation
Lean Six Sigma Training -SXL
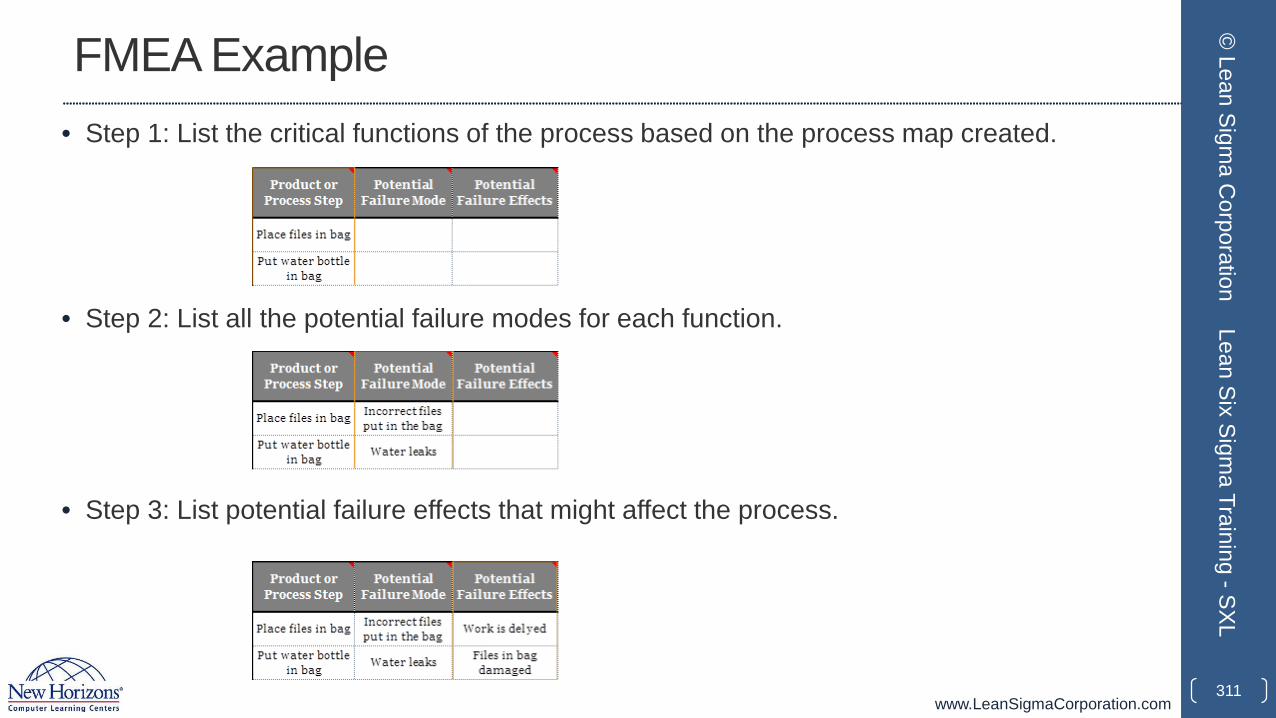
www.LeanSigmaCorporation.com
FMEA Example
311
© Lean Sigm
a Corporation
Lean Six Sigma Training -SXL
• Step 1: List the critical functions of the process based on the process map created.
• Step 2: List all the potential failure modes for each function.
• Step 3: List potential failure effects that might affect the process.
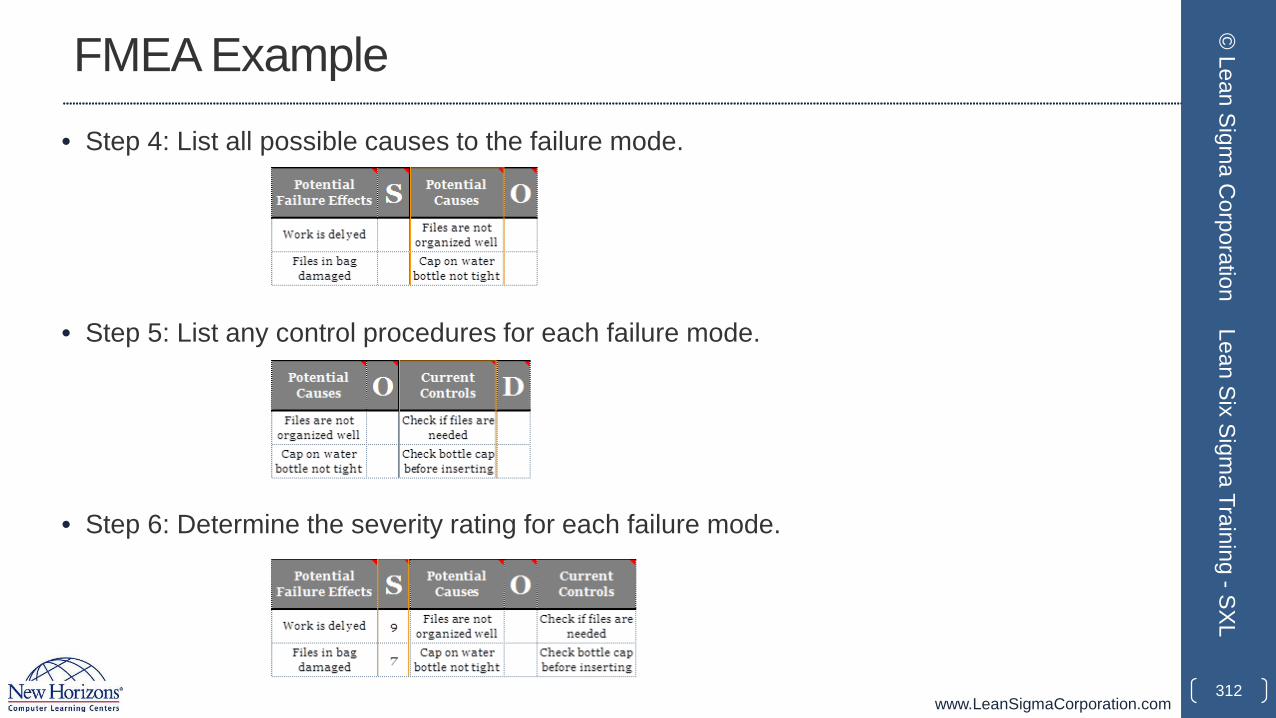
www.LeanSigmaCorporation.com
FMEA Example
312
© Lean Sigm
a Corporation
Lean Six Sigma Training -SXL
• Step 4: List all possible causes to the failure mode.
• Step 5: List any control procedures for each failure mode.
• Step 6: Determine the severity rating for each failure mode.
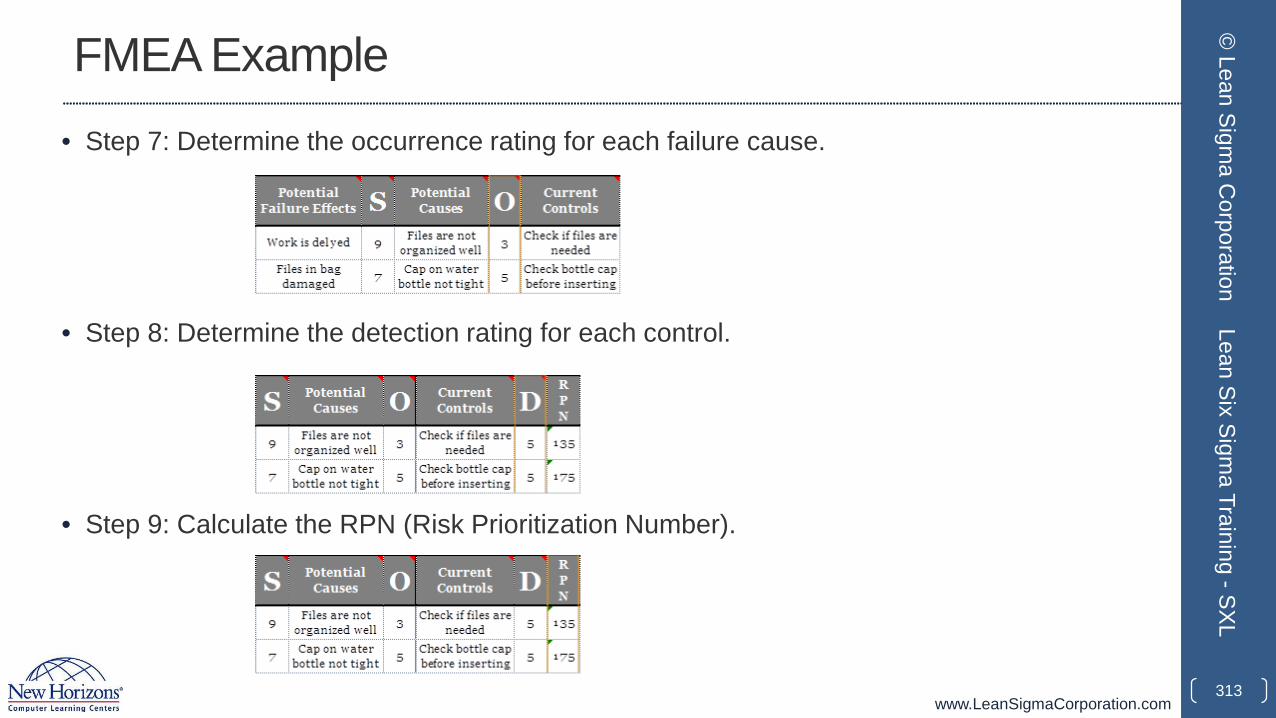
www.LeanSigmaCorporation.com
FMEA Example
313
© Lean Sigm
a Corporation
Lean Six Sigma Training -SXL
• Step 7: Determine the occurrence rating for each failure cause.
• Step 8: Determine the detection rating for each control.
• Step 9: Calculate the RPN (Risk Prioritization Number).
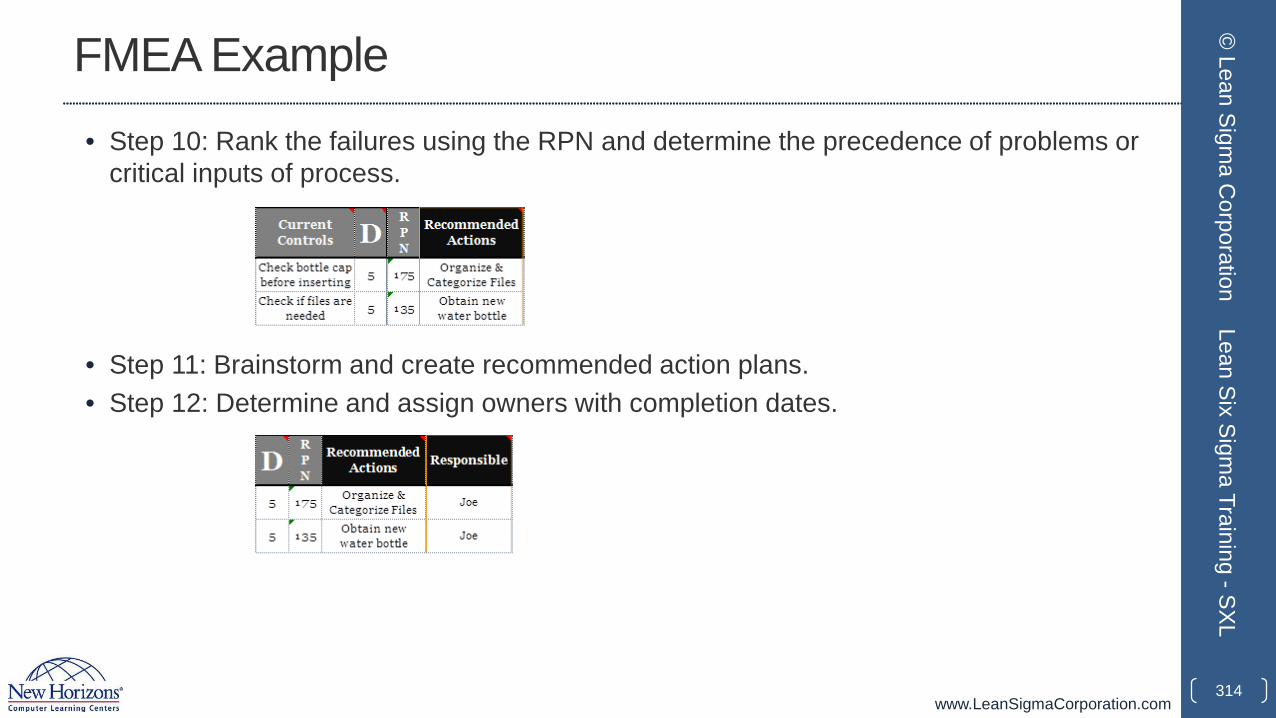
www.LeanSigmaCorporation.com
FMEA Example
314
© Lean Sigm
a Corporation
Lean Six Sigma Training -SXL
• Step 10: Rank the failures using the RPN and determine the precedence of problems or critical inputs of process.
• Step 11: Brainstorm and create recommended action plans.• Step 12: Determine and assign owners with completion dates.
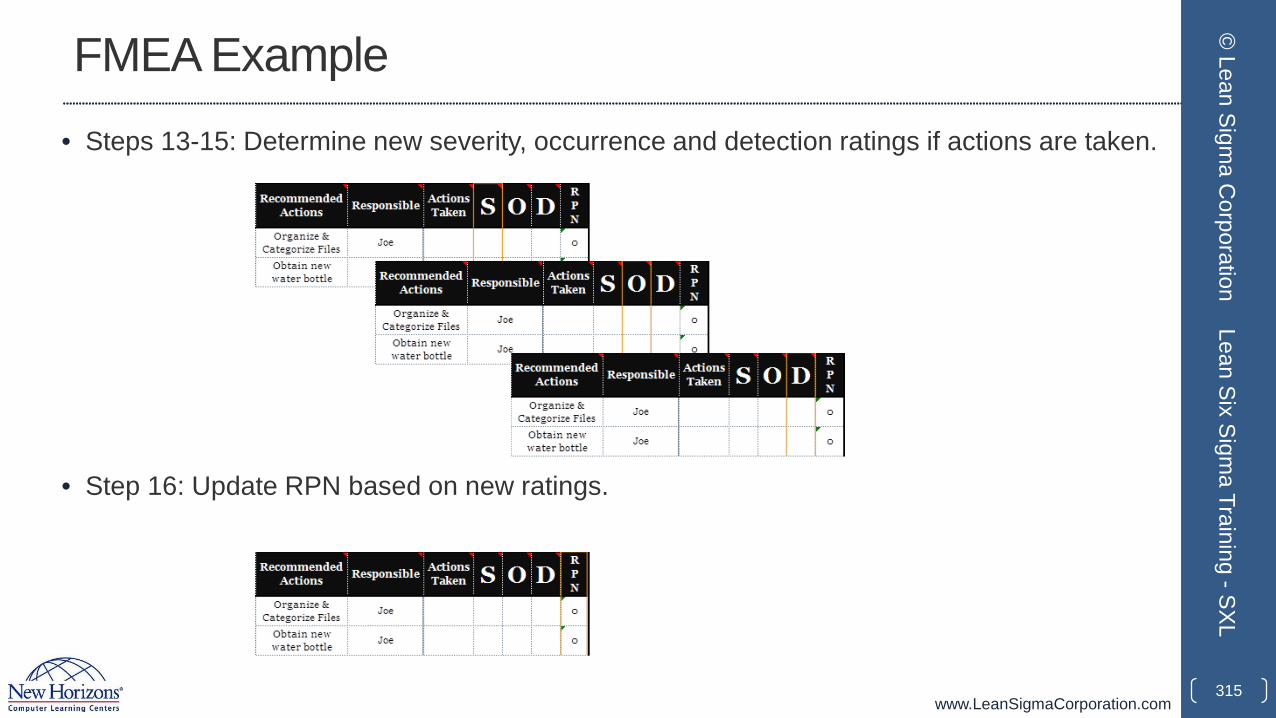
www.LeanSigmaCorporation.com
FMEA Example
315
© Lean Sigm
a Corporation
Lean Six Sigma Training -SXL
• Steps 13-15: Determine new severity, occurrence and detection ratings if actions are taken.
• Step 16: Update RPN based on new ratings.
www.LeanSigmaCorporation.com
2.1.5 Theory of Constraints
316
© Lean Sigm
a Corporation
Lean Six Sigma Training -SXL
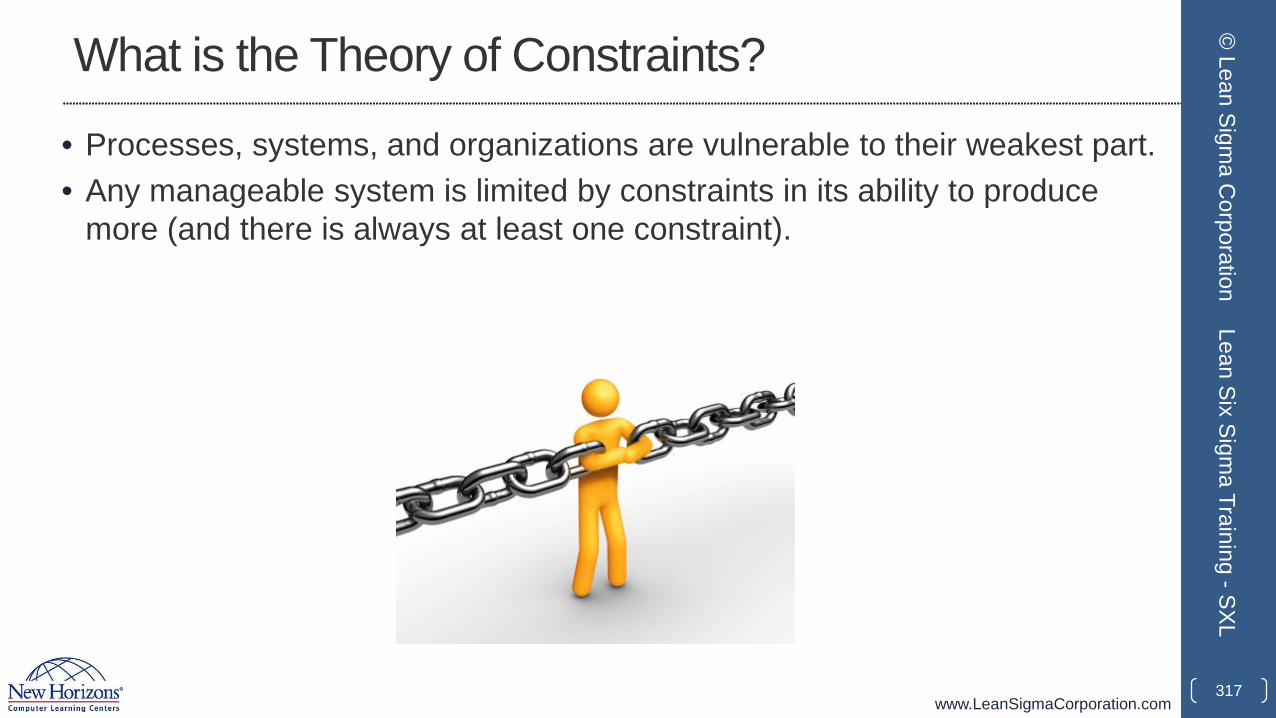
www.LeanSigmaCorporation.com
What is the Theory of Constraints?
• Processes, systems, and organizations are vulnerable to their weakest part.• Any manageable system is limited by constraints in its ability to produce
more (and there is always at least one constraint).
317
© Lean Sigm
a Corporation
Lean Six Sigma Training -SXL
www.LeanSigmaCorporation.com
Performance Measures
Making sound financial decisions based on these three measures is a critical requirement.• Throughput – rate at which a system generates money through sales.• Operational Expense – money spent by the system to turn inventory into
throughput.• Inventory – money the system has invested in purchasing things it intends
to sell.
318
© Lean Sigm
a Corporation
Lean Six Sigma Training -SXL
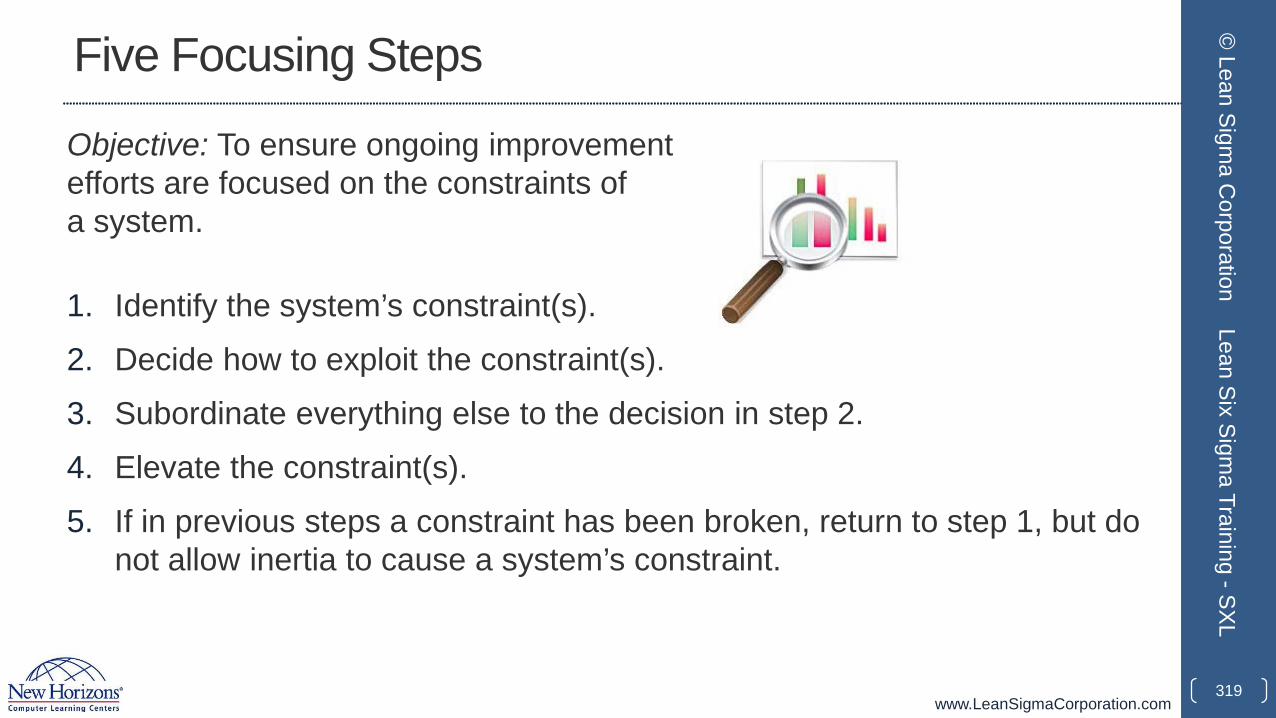
www.LeanSigmaCorporation.com
Five Focusing Steps
Objective: To ensure ongoing improvement efforts are focused on the constraints of a system.
1. Identify the system’s constraint(s).2. Decide how to exploit the constraint(s).3. Subordinate everything else to the decision in step 2.4. Elevate the constraint(s).5. If in previous steps a constraint has been broken, return to step 1, but do
not allow inertia to cause a system’s constraint.
319
© Lean Sigm
a Corporation
Lean Six Sigma Training -SXL
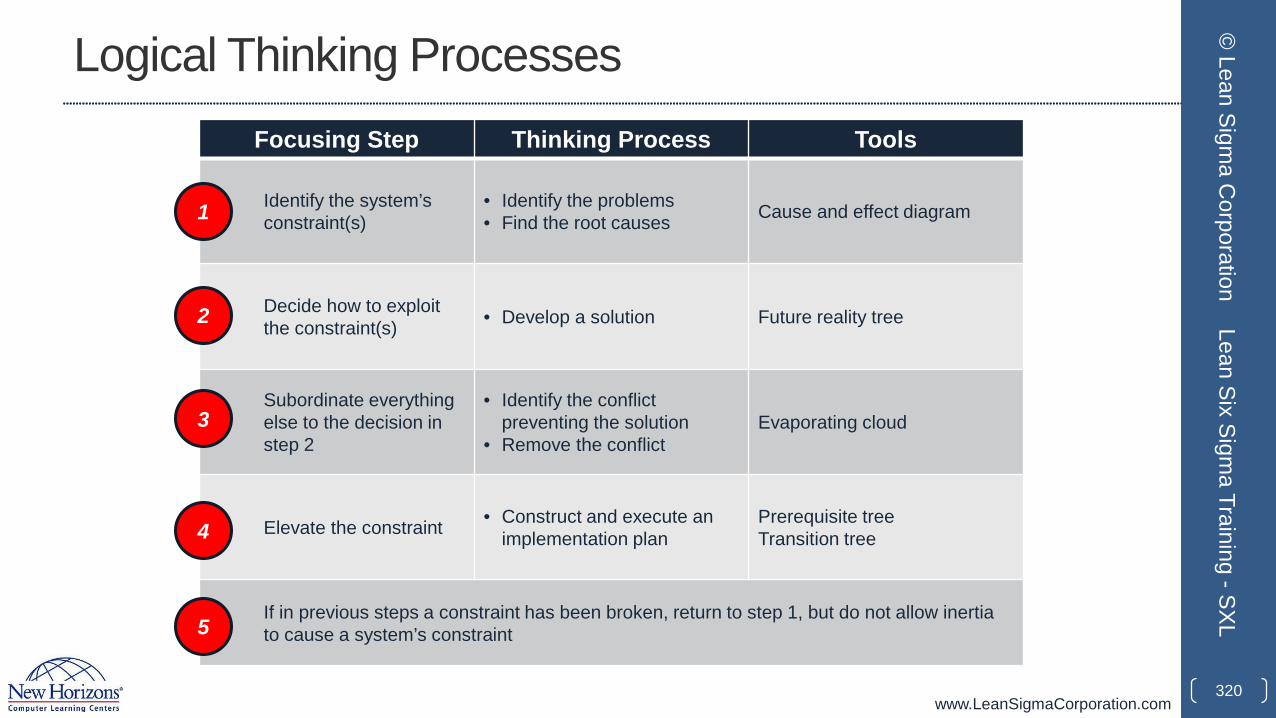
www.LeanSigmaCorporation.com
Logical Thinking Processes
320
© Lean Sigm
a Corporation
Lean Six Sigma Training -SXL
Focusing Step Thinking Process Tools
Identify the system’s constraint(s)
• Identify the problems• Find the root causes Cause and effect diagram
Decide how to exploit the constraint(s) • Develop a solution Future reality tree
Subordinate everything else to the decision in step 2
• Identify the conflict preventing the solution
• Remove the conflictEvaporating cloud
Elevate the constraint • Construct and execute an implementation plan
Prerequisite treeTransition tree
If in previous steps a constraint has been broken, return to step 1, but do not allow inertia to cause a system’s constraint
1
2
3
4
5
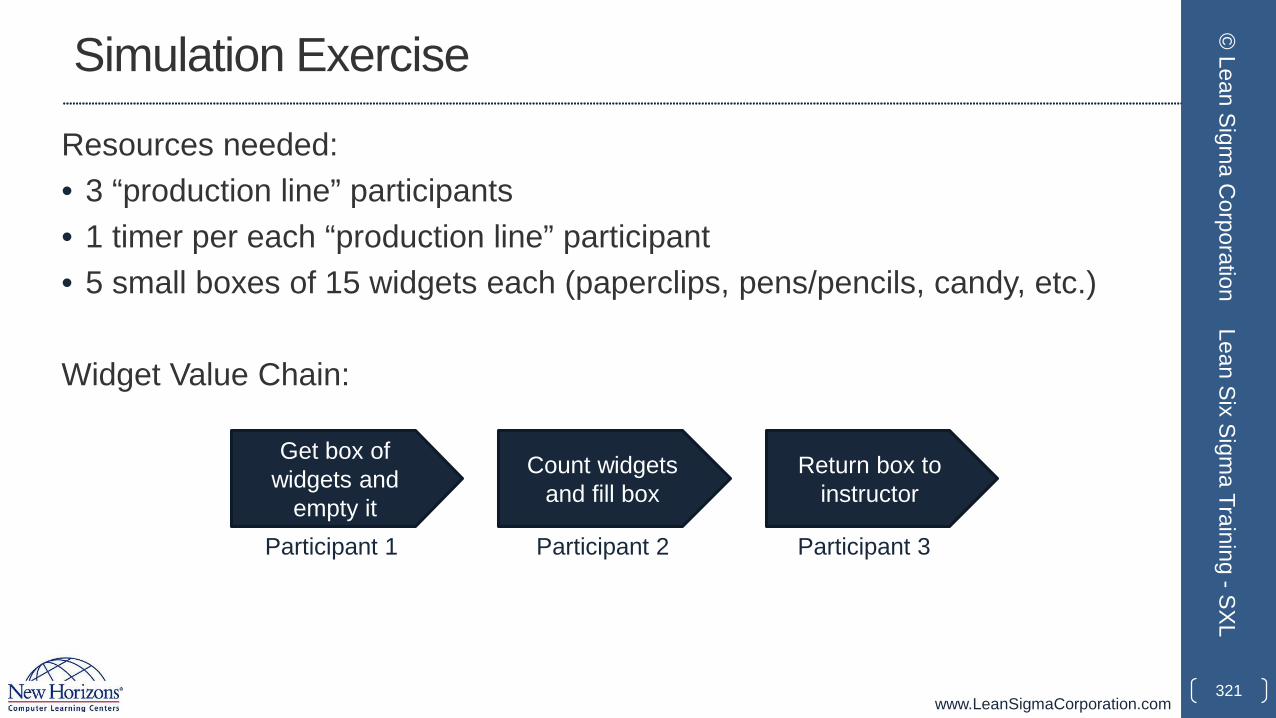
www.LeanSigmaCorporation.com
Simulation Exercise
Resources needed:• 3 “production line” participants• 1 timer per each “production line” participant• 5 small boxes of 15 widgets each (paperclips, pens/pencils, candy, etc.)
Widget Value Chain:
321
© Lean Sigm
a Corporation
Lean Six Sigma Training -SXL
Get box of widgets and
empty it
Count widgets and fill box
Return box to instructor
Participant 1 Participant 2 Participant 3
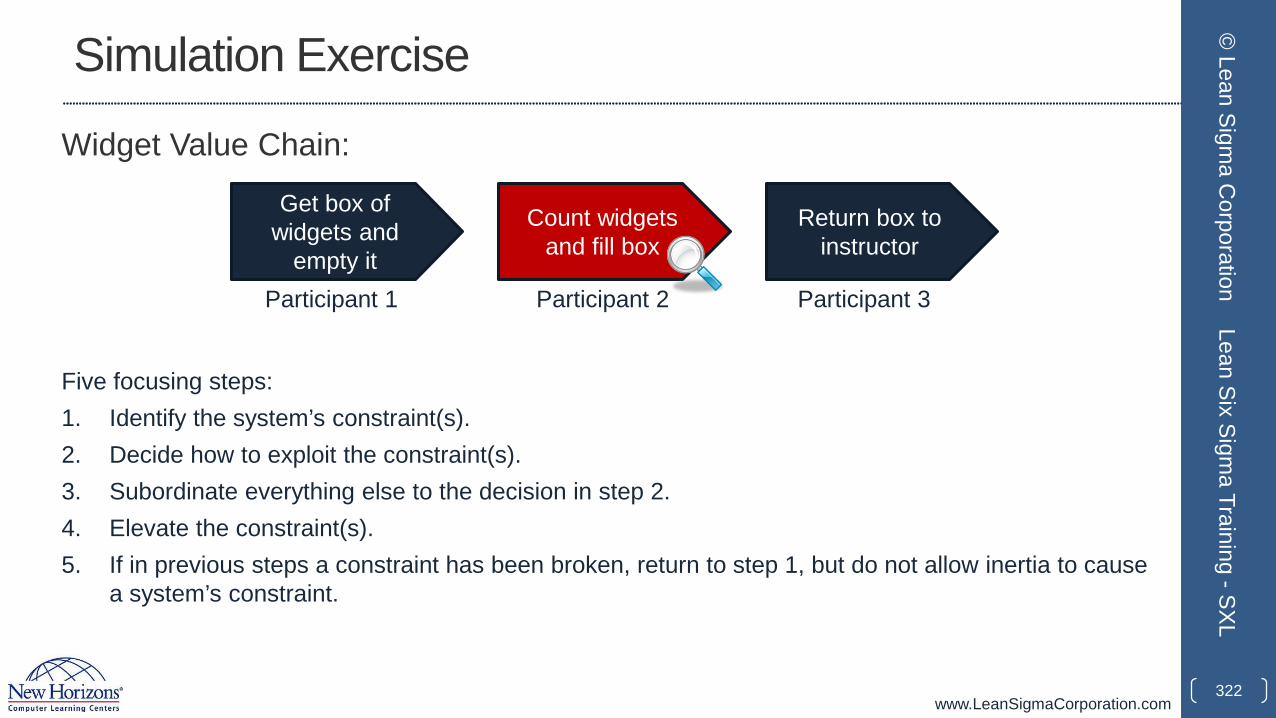
www.LeanSigmaCorporation.com
Simulation Exercise
Widget Value Chain:
322
© Lean Sigm
a Corporation
Lean Six Sigma Training -SXL
Get box of widgets and
empty it
Count widgets and fill box
Return box to instructor
Participant 1 Participant 2 Participant 3
Five focusing steps:1. Identify the system’s constraint(s).2. Decide how to exploit the constraint(s).3. Subordinate everything else to the decision in step 2.4. Elevate the constraint(s).5. If in previous steps a constraint has been broken, return to step 1, but do not allow inertia to cause
a system’s constraint.
www.LeanSigmaCorporation.com
2.2 Six Sigma Statistics
323
© Lean Sigm
a Corporation
Lean Six Sigma Training -SXL
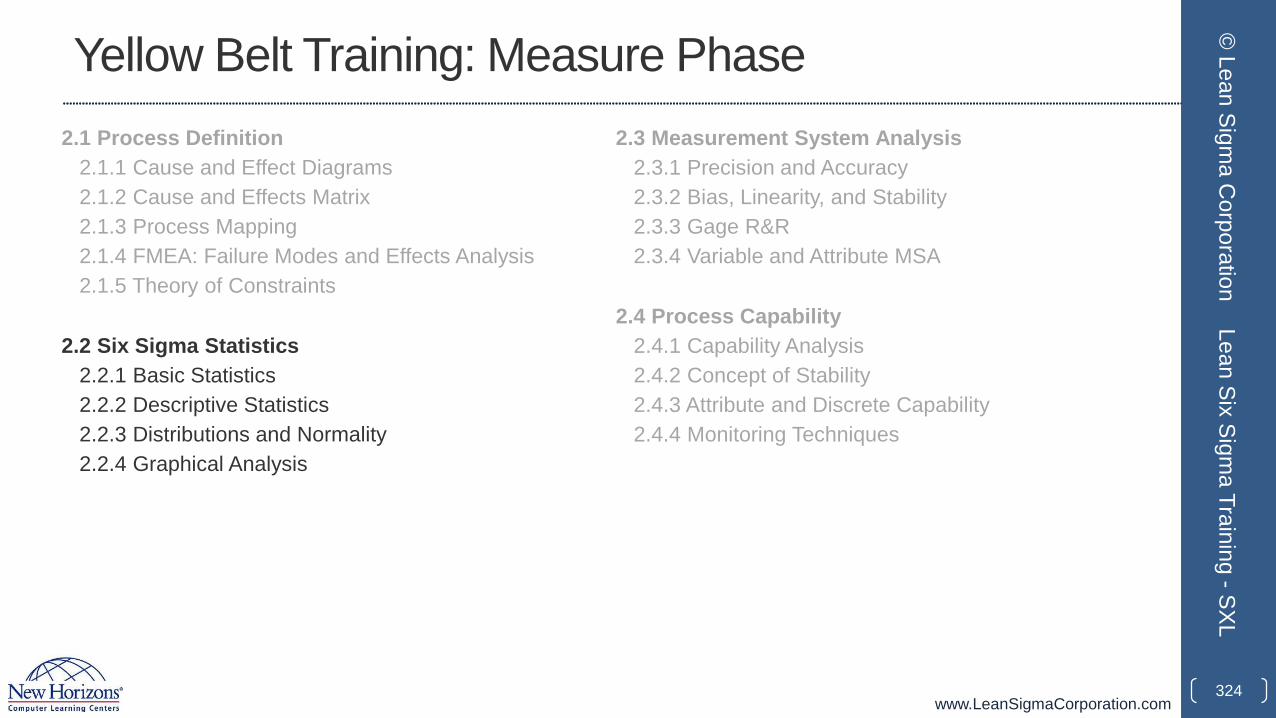
www.LeanSigmaCorporation.com
Yellow Belt Training: Measure Phase2.1 Process Definition
2.1.1 Cause and Effect Diagrams2.1.2 Cause and Effects Matrix2.1.3 Process Mapping2.1.4 FMEA: Failure Modes and Effects Analysis2.1.5 Theory of Constraints
2.2 Six Sigma Statistics2.2.1 Basic Statistics2.2.2 Descriptive Statistics2.2.3 Distributions and Normality2.2.4 Graphical Analysis
2.3 Measurement System Analysis2.3.1 Precision and Accuracy2.3.2 Bias, Linearity, and Stability2.3.3 Gage R&R2.3.4 Variable and Attribute MSA
2.4 Process Capability2.4.1 Capability Analysis2.4.2 Concept of Stability2.4.3 Attribute and Discrete Capability2.4.4 Monitoring Techniques
324
© Lean Sigm
a Corporation
Lean Six Sigma Training -SXL
www.LeanSigmaCorporation.com
2.2.1 Basic Statistics
325
© Lean Sigm
a Corporation
Lean Six Sigma Training -SXL
www.LeanSigmaCorporation.com
What is Statistics?
• Statistics is the science of collection, analysis, interpretation, and presentation of data.
• In Six Sigma, we apply statistical methods and principles to quantitatively measure and analyze the process performance to reach statistical conclusions and help solve business problems.
326
© Lean Sigm
a Corporation
Lean Six Sigma Training -SXL
www.LeanSigmaCorporation.com
Types of Statistics
• Descriptive Statistics• Describing what was going on
• Inferential Statistics• Making inferences from the data at hand to more general conditions
327
© Lean Sigm
a Corporation
Lean Six Sigma Training -SXL
www.LeanSigmaCorporation.com
Descriptive Statistics
• Descriptive statistics is applied to describe the main characteristics of a collection of data.
• Descriptive statistics summarizes the features of the data quantitatively.
• Descriptive statistics is descriptive only and it does not make any generalizations beyond the data at hand.
• The data used for descriptive statistics are for the purpose of representing or reporting.
328
© Lean Sigm
a Corporation
Lean Six Sigma Training -SXL
www.LeanSigmaCorporation.com
Inferential Statistics
• Inferential statistics is applied to infer the characteristics or relationships of the populations from which the data are collected.
• Inferential statistics draws statistical conclusions about the population by analyzing the sample data subject to random variation.
• A complete data analysis includes both descriptive statistics and inferential statistics.
329
© Lean Sigm
a Corporation
Lean Six Sigma Training -SXL
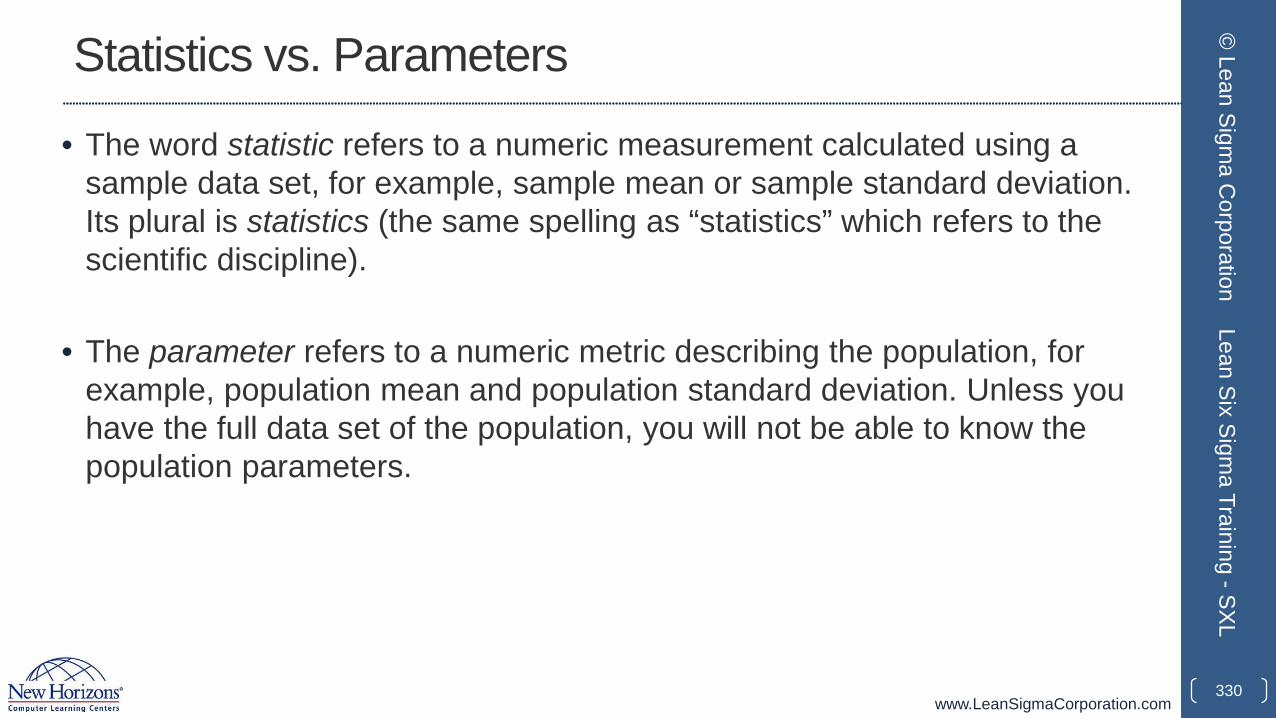
www.LeanSigmaCorporation.com
Statistics vs. Parameters
• The word statistic refers to a numeric measurement calculated using a sample data set, for example, sample mean or sample standard deviation. Its plural is statistics (the same spelling as “statistics” which refers to the scientific discipline).
• The parameter refers to a numeric metric describing the population, for example, population mean and population standard deviation. Unless you have the full data set of the population, you will not be able to know the population parameters.
330
© Lean Sigm
a Corporation
Lean Six Sigma Training -SXL
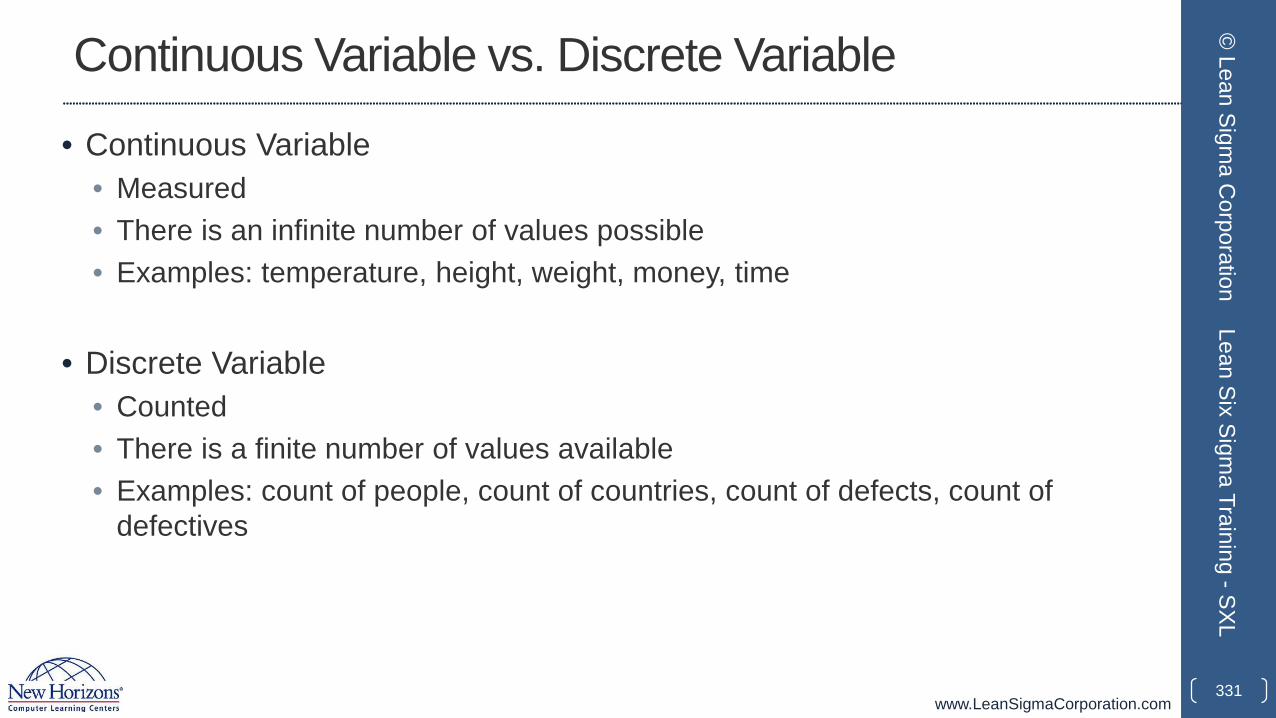
www.LeanSigmaCorporation.com
Continuous Variable vs. Discrete Variable
• Continuous Variable• Measured• There is an infinite number of values possible• Examples: temperature, height, weight, money, time
• Discrete Variable• Counted• There is a finite number of values available• Examples: count of people, count of countries, count of defects, count of
defectives
331
© Lean Sigm
a Corporation
Lean Six Sigma Training -SXL
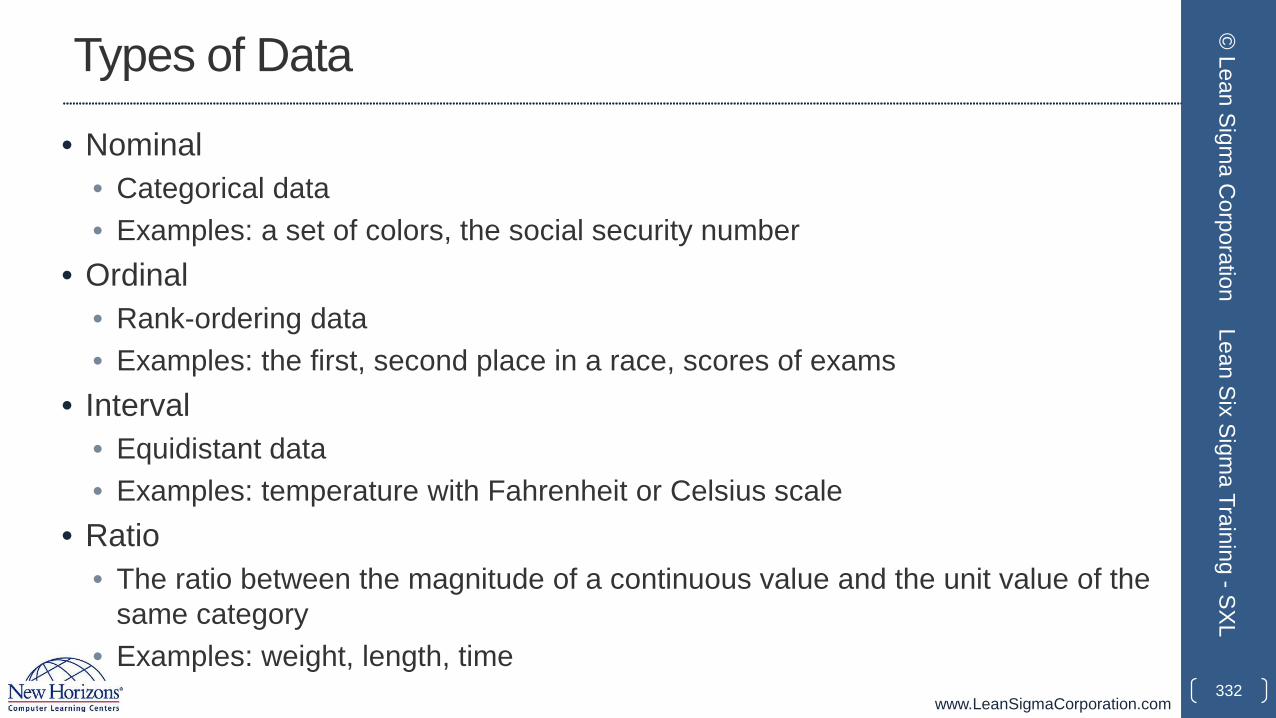
www.LeanSigmaCorporation.com
Types of Data
• Nominal• Categorical data• Examples: a set of colors, the social security number
• Ordinal• Rank-ordering data• Examples: the first, second place in a race, scores of exams
• Interval• Equidistant data• Examples: temperature with Fahrenheit or Celsius scale
• Ratio• The ratio between the magnitude of a continuous value and the unit value of the
same category• Examples: weight, length, time
332
© Lean Sigm
a Corporation
Lean Six Sigma Training -SXL

www.LeanSigmaCorporation.com
2.2.2 Descriptive Statistics
333
© Lean Sigm
a Corporation
Lean Six Sigma Training -SXL
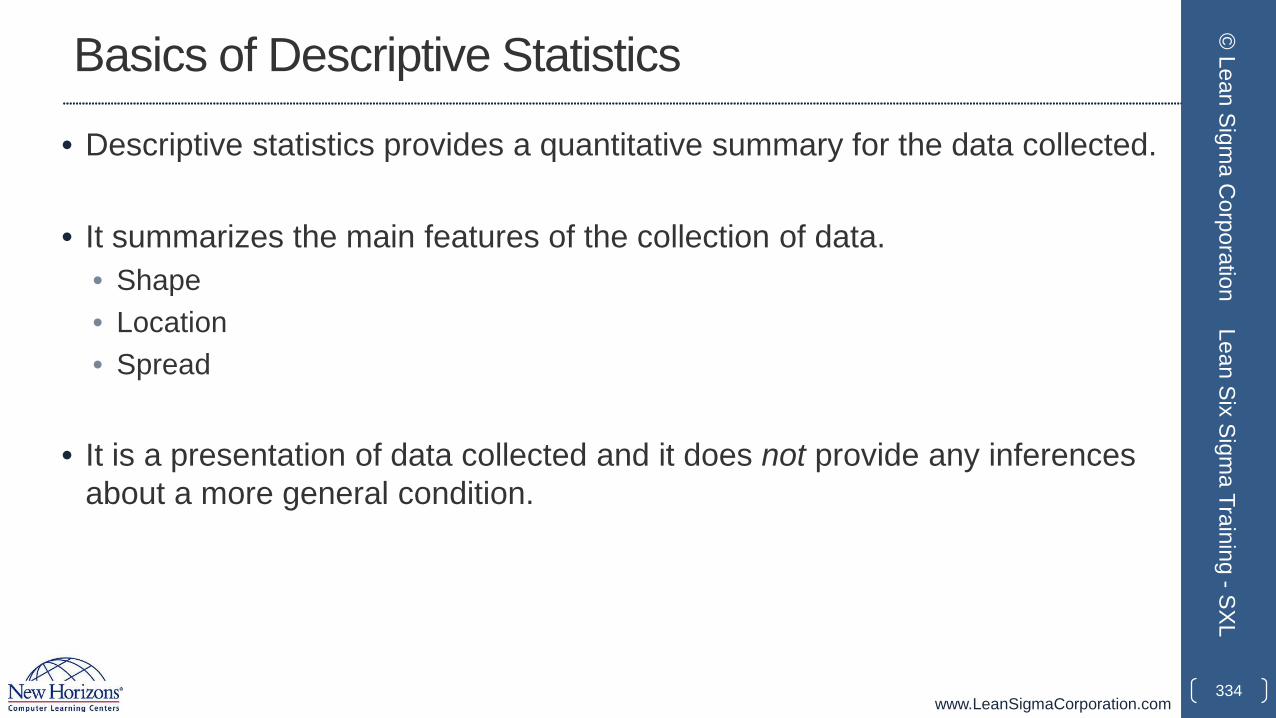
www.LeanSigmaCorporation.com
Basics of Descriptive Statistics
• Descriptive statistics provides a quantitative summary for the data collected.
• It summarizes the main features of the collection of data.• Shape• Location• Spread
• It is a presentation of data collected and it does not provide any inferences about a more general condition.
334
© Lean Sigm
a Corporation
Lean Six Sigma Training -SXL
www.LeanSigmaCorporation.com
Shape of the Data
• Distribution is used to describe the shape of the data.
• Distribution (also called frequency distribution) summarizes the frequency of an individual value or a range of values of a variable (either continuous or discrete).
• Distribution is depicted as a table or graph.
335
© Lean Sigm
a Corporation
Lean Six Sigma Training -SXL
www.LeanSigmaCorporation.com
Shape of the Data
• Simple example of distribution
• We are tossing a fair die. The possible value we obtain from each tossing is a value between 1 and 6.
• Each value between 1 and 6 has a 1/6 chance to be hit for each tossing.
• The distribution of this game describes the relationship between every possible value and the percentage of times the value is being hit (or count of times the value is being hit).
336
© Lean Sigm
a Corporation
Lean Six Sigma Training -SXL
www.LeanSigmaCorporation.com
Shape of the Data
• Examples of continuous distribution• Normal Distribution• T distribution• Chi-square distribution• F distribution
• Examples of discrete distribution• Binomial distribution• Poisson distribution
337
© Lean Sigm
a Corporation
Lean Six Sigma Training -SXL
www.LeanSigmaCorporation.com
Location of the Data
• The location (i.e. central tendency) of the data describes the value where the data tend to cluster around.
• There are multiple measurements to capture the location of the data:• Mean• Median• Mode.
338
© Lean Sigm
a Corporation
Lean Six Sigma Training -SXL
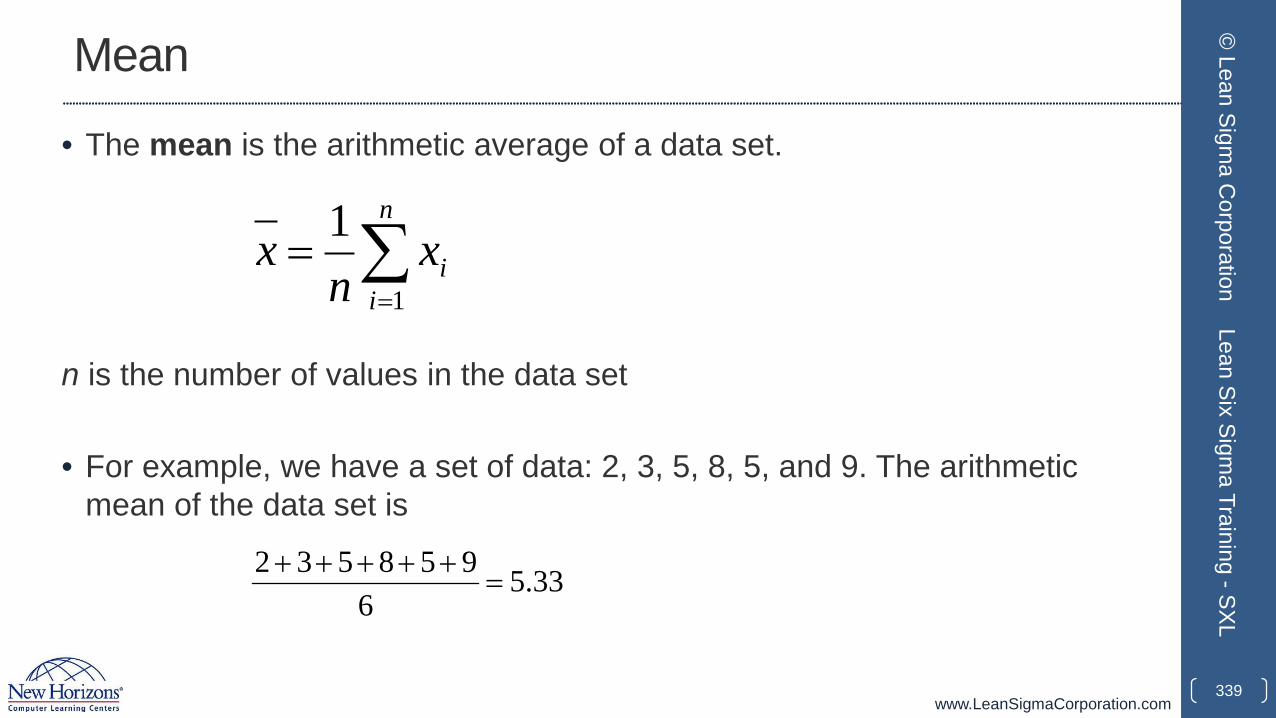
www.LeanSigmaCorporation.com
Mean
• The mean is the arithmetic average of a data set.
n is the number of values in the data set
• For example, we have a set of data: 2, 3, 5, 8, 5, and 9. The arithmetic mean of the data set is
339
© Lean Sigm
a Corporation
Lean Six Sigma Training -SXL
∑=
=n
iix
nx
1
1
33.56
958532=
+++++
www.LeanSigmaCorporation.com
Median
• The median is the middle value of the data set in numeric order.
• It separates the finite set of data into two parts: one with values higher that the median and the other with values lower than the median.
• For example, we have a set of data: 45, 32, 67, 12, 37, 54, and 28. The median is 37 since it is the middle value of the sorted list of values (i.e., 12, 28, 32, 37, 45, 54, and 67).
340
© Lean Sigm
a Corporation
Lean Six Sigma Training -SXL
www.LeanSigmaCorporation.com
Mode
• The mode is the value that occurs most often in the data set.
• If no number is repeated, there is no mode for the data set.
• For example, we have a data set: 55, 23, 45, 45, 68, 34, 45, 55. The mode is 45 since it occurs most frequently.
341
© Lean Sigm
a Corporation
Lean Six Sigma Training -SXL

www.LeanSigmaCorporation.com
Spread of the Data
• The spread (i.e. variation) of the data describes the degree of data dispersing around the center value.
• There are multiple measurements to capture the spread of the data:• Range• Variance• Standard Deviation.
342
© Lean Sigm
a Corporation
Lean Six Sigma Training -SXL
www.LeanSigmaCorporation.com
Range
• The range is the numeric difference between the greatest and smallest values in a data set.
• Only two data values (i.e. the greatest and the smallest values) are accounted for calculating the range.
• For example, we have a set of data: 34, 45, 23, 12, 32, 78, and 23. The range of the data is 78−12 = 66.
343
© Lean Sigm
a Corporation
Lean Six Sigma Training -SXL
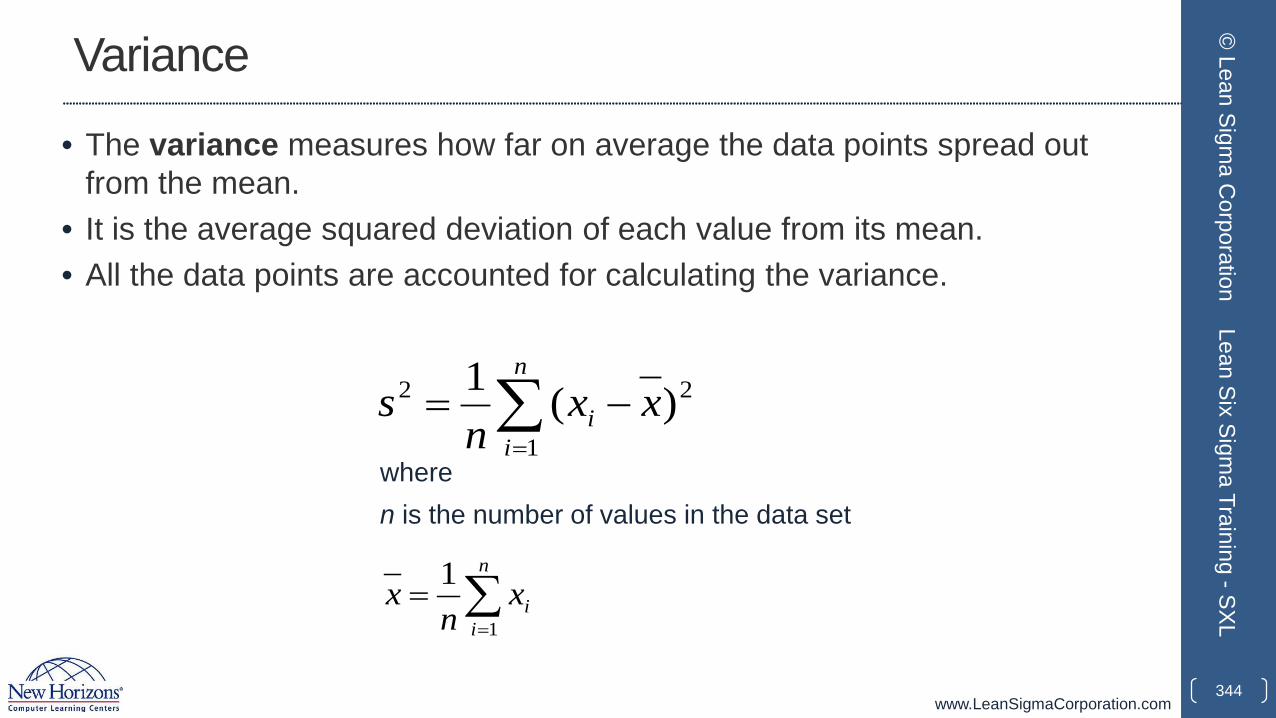
www.LeanSigmaCorporation.com
Variance
• The variance measures how far on average the data points spread out from the mean.
• It is the average squared deviation of each value from its mean.• All the data points are accounted for calculating the variance.
344
© Lean Sigm
a Corporation
Lean Six Sigma Training -SXL
2
1
2 )(1 xxn
sn
ii −= ∑
=wheren is the number of values in the data set
∑=
=n
iix
nx
1
1
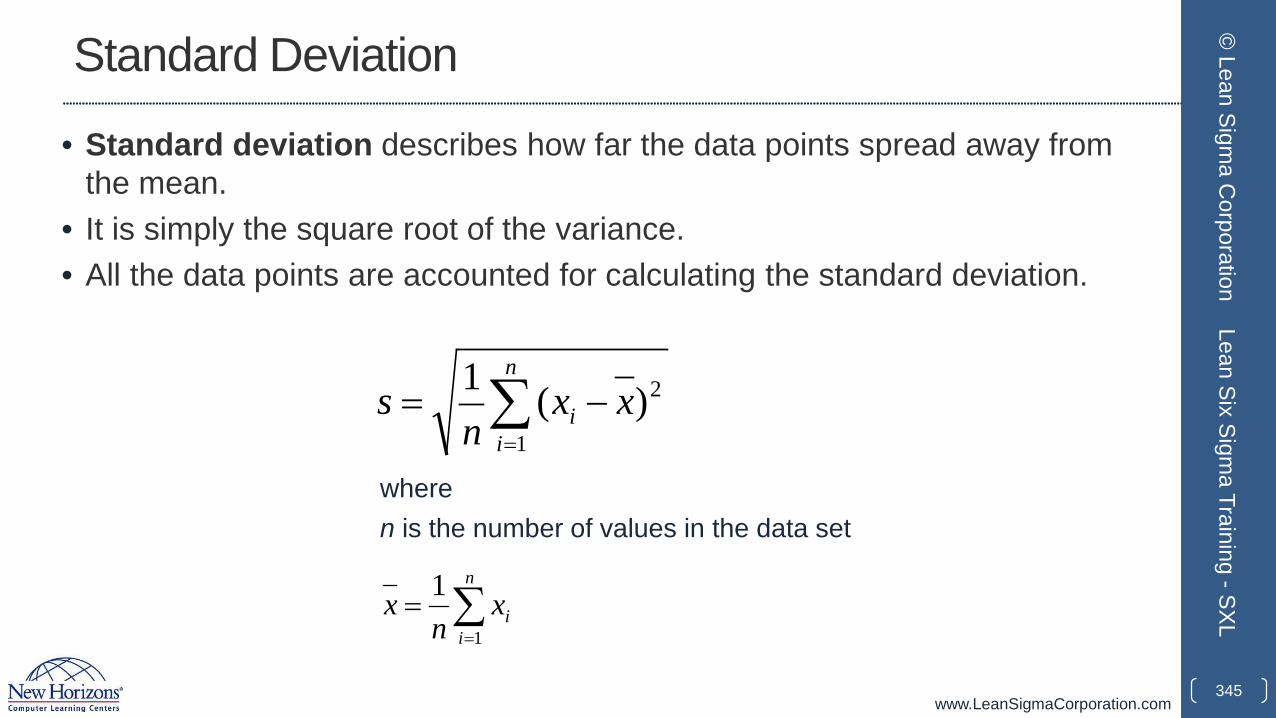
www.LeanSigmaCorporation.com
Standard Deviation
• Standard deviation describes how far the data points spread away from the mean.
• It is simply the square root of the variance.• All the data points are accounted for calculating the standard deviation.
345
© Lean Sigm
a Corporation
Lean Six Sigma Training -SXL
2
1)(1 xx
ns
n
ii −= ∑
=
wheren is the number of values in the data set
∑=
=n
iix
nx
1
1
www.LeanSigmaCorporation.com
2.2.3 Normal Distribution & Normality
346
© Lean Sigm
a Corporation
Lean Six Sigma Training -SXL
www.LeanSigmaCorporation.com
What is Normal Distribution?
• The normal distribution is a probability distribution of a continuous random variable whose values spread symmetrically around the mean.
• A normal distribution can be completely described by using its mean (μ) and variance (σ2).
• When a variable x is normally distributed, we denote x ~ N(μ, σ2).
347
© Lean Sigm
a Corporation
Lean Six Sigma Training -SXL
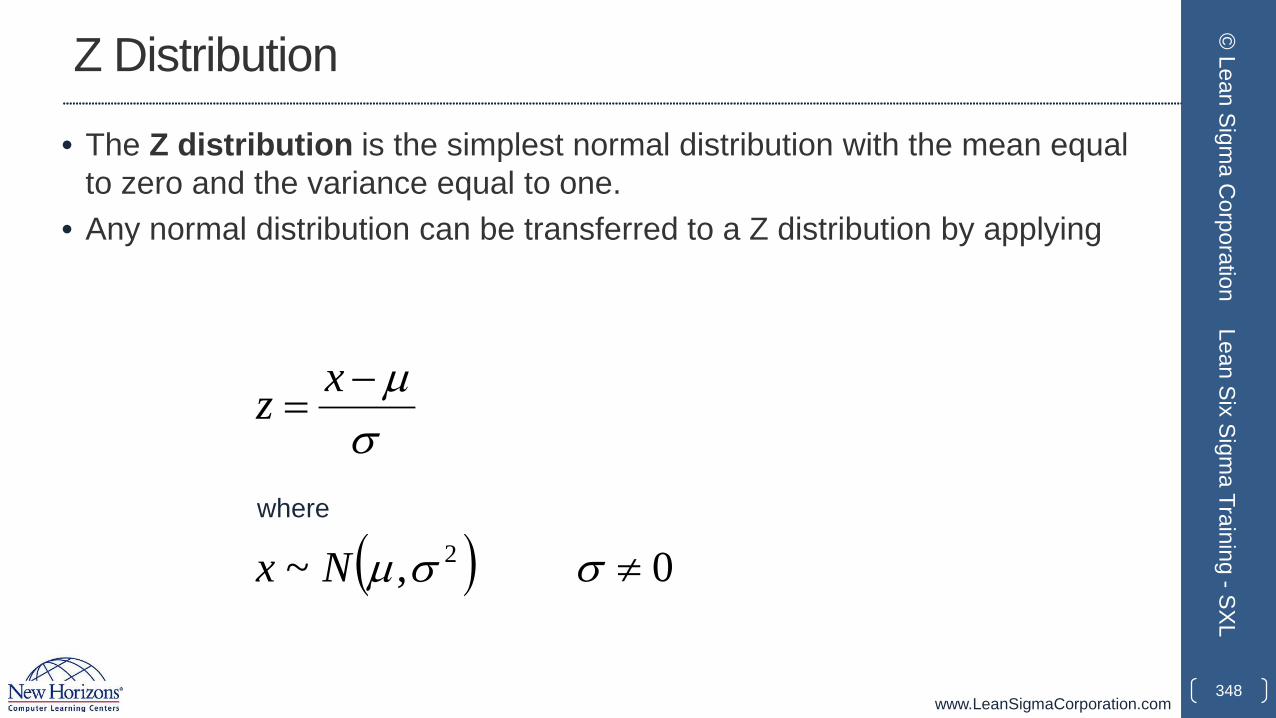
www.LeanSigmaCorporation.com
Z Distribution
• The Z distribution is the simplest normal distribution with the mean equal to zero and the variance equal to one.
• Any normal distribution can be transferred to a Z distribution by applying
348
© Lean Sigm
a Corporation
Lean Six Sigma Training -SXL
σµ−
=xz
where
( )2,~ σµNx 0≠σ
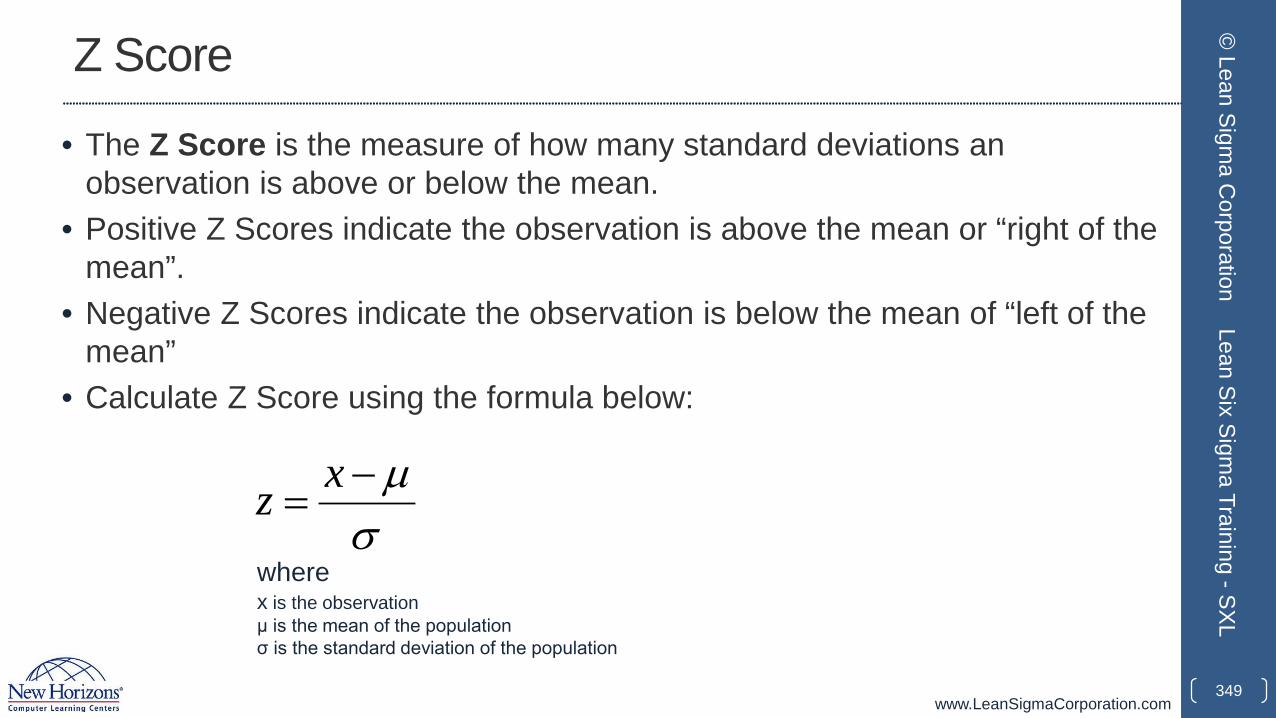
www.LeanSigmaCorporation.com
Z Score
• The Z Score is the measure of how many standard deviations an observation is above or below the mean.
• Positive Z Scores indicate the observation is above the mean or “right of the mean”.
• Negative Z Scores indicate the observation is below the mean of “left of the mean”
• Calculate Z Score using the formula below:
349
© Lean Sigm
a Corporation
Lean Six Sigma Training -SXL
σµ−
=xz
wherex is the observationμ is the mean of the populationσ is the standard deviation of the population
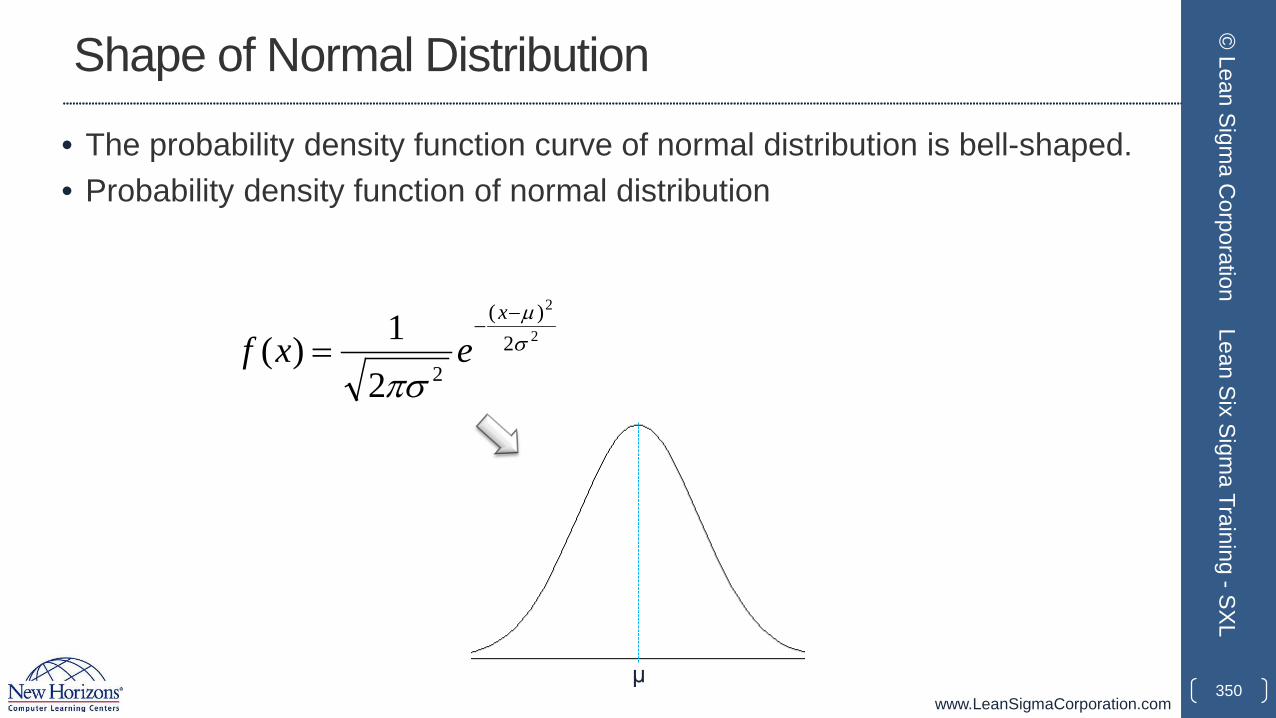
www.LeanSigmaCorporation.com
Shape of Normal Distribution
• The probability density function curve of normal distribution is bell-shaped.• Probability density function of normal distribution
350
© Lean Sigm
a Corporation
Lean Six Sigma Training -SXL
2
2
2)(
221)( σ
µ
πσ
−−
=x
exf
μ
www.LeanSigmaCorporation.com
Location of Normal Distribution
• If a variable is normally distributed, the mean, the median, and the mode have the same value.
• The probability density curve of normal distribution is symmetric around a center value which is the mean, the median, and the mode at the same time.
351
© Lean Sigm
a Corporation
Lean Six Sigma Training -SXL
www.LeanSigmaCorporation.com
Spread of Normal Distribution
• The spread or variation of the normally-distributed data can be described using the variance or the standard deviation.
• The smaller the variance or the standard deviation, the less variability in the data set.
352
© Lean Sigm
a Corporation
Lean Six Sigma Training -SXL
www.LeanSigmaCorporation.com
68-95-99.7 Rule
• The 68-95-99.7 rule or the empirical rule in statistics states that for a normal distribution:
• About 68% of the data fall within one standard deviation of the mean
• About 95% of the data fall within two standard deviations of the mean
• About 99.7% of the data fall within three standard deviations of the mean.
353
© Lean Sigm
a Corporation
Lean Six Sigma Training -SXL

www.LeanSigmaCorporation.com
68-95-99.7 Rule
354
© Lean Sigm
a Corporation
Lean Six Sigma Training -SXL
www.LeanSigmaCorporation.com
Normality
• Not all the distributions with a bell shape are normal distributions.
• To check whether a group of data points are normally distributed, we need to run a normality test.
• There are different normality tests available:• Anderson-Darling test• Sharpiro-Wilk test• Jarque-Bera test.
• More details of normality test will be introduced in the Analyze module.
355
© Lean Sigm
a Corporation
Lean Six Sigma Training -SXL
www.LeanSigmaCorporation.com
Normality Testing
• To check whether the population of our interest is normally distributed, we need to run normality test.
• Null Hypothesis (H0): The data points are normally distributed.• Alternative Hypothesis (Ha): The data points are not normally distributed.
• There are many normality tests available. For example, Anderson-Darling test, Sharpiro-Wilk test, Jarque-Bera test, and so on.
356
© Lean Sigm
a Corporation
Lean Six Sigma Training -SXL
www.LeanSigmaCorporation.com
Use SigmaXL to Run a Normality Test
• Case Study: we are interested to know whether the height of basketball players is normally distributed.
• Data File: “One Sample T-Test” tab in “Sample Data.xlsx”
• Null Hypothesis (H0): the height of basketball players is normally distributed.• Alternative Hypothesis (Ha): the height of basketball players is not normally
distributed.
357
© Lean Sigm
a Corporation
Lean Six Sigma Training -SXL
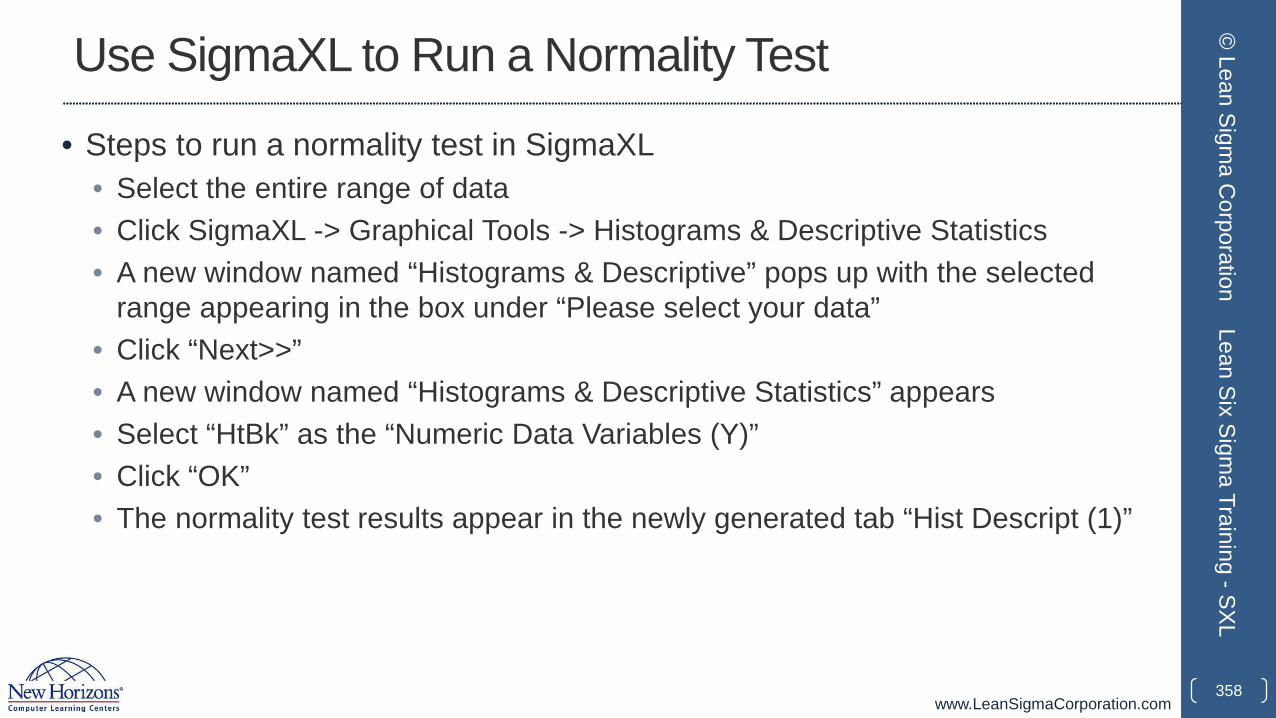
www.LeanSigmaCorporation.com
Use SigmaXL to Run a Normality Test
• Steps to run a normality test in SigmaXL• Select the entire range of data• Click SigmaXL -> Graphical Tools -> Histograms & Descriptive Statistics• A new window named “Histograms & Descriptive” pops up with the selected
range appearing in the box under “Please select your data”• Click “Next>>”• A new window named “Histograms & Descriptive Statistics” appears• Select “HtBk” as the “Numeric Data Variables (Y)”• Click “OK”• The normality test results appear in the newly generated tab “Hist Descript (1)”
358
© Lean Sigm
a Corporation
Lean Six Sigma Training -SXL
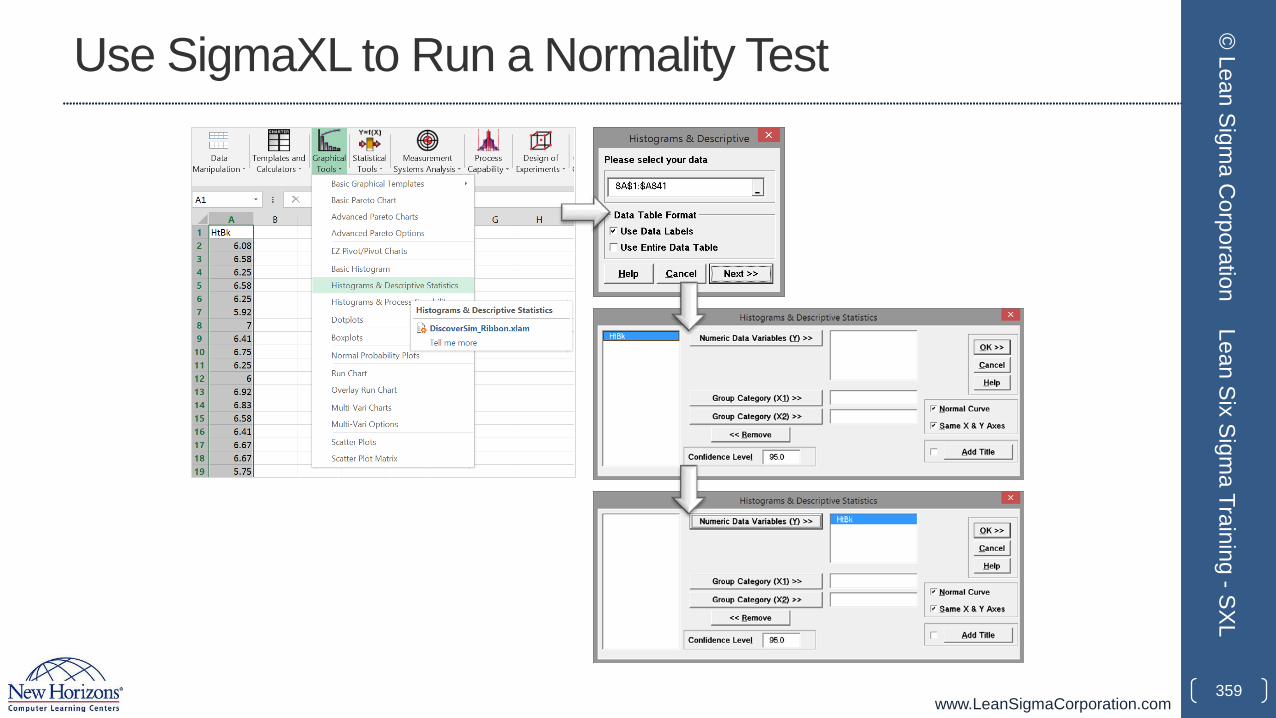
www.LeanSigmaCorporation.com
Use SigmaXL to Run a Normality Test
359
© Lean Sigm
a Corporation
Lean Six Sigma Training -SXL
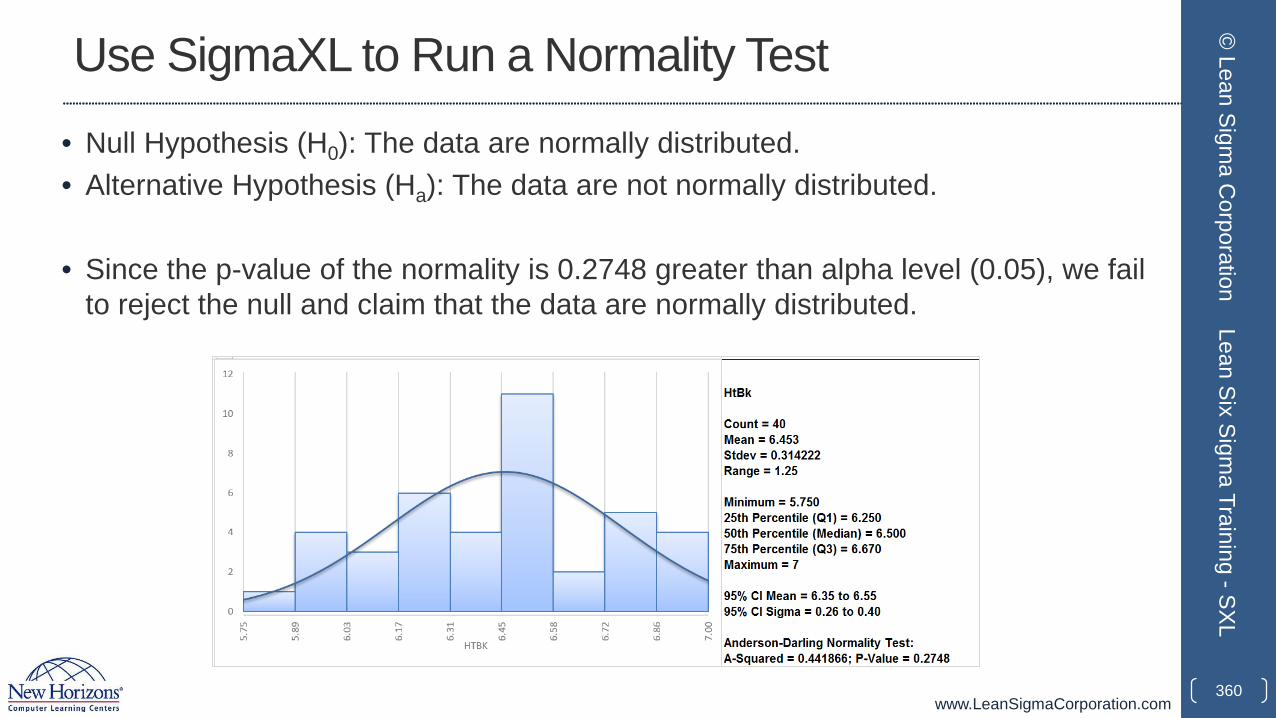
www.LeanSigmaCorporation.com
Use SigmaXL to Run a Normality Test• Null Hypothesis (H0): The data are normally distributed.• Alternative Hypothesis (Ha): The data are not normally distributed.
• Since the p-value of the normality is 0.2748 greater than alpha level (0.05), we fail to reject the null and claim that the data are normally distributed.
360
© Lean Sigm
a Corporation
Lean Six Sigma Training -SXL
www.LeanSigmaCorporation.com
2.2.4 Graphical Analysis
361
© Lean Sigm
a Corporation
Lean Six Sigma Training -SXL
www.LeanSigmaCorporation.com
What is Graphical Analysis?
• In statistics, graphical analysis is a method to visualize the quantitative data.
• Graphical analysis is used to discover the structure and patterns in the data, explaining and presenting the statistical conclusions.
• A complete statistical analysis includes both quantitative analysis and graphical analysis.
362
© Lean Sigm
a Corporation
Lean Six Sigma Training -SXL
www.LeanSigmaCorporation.com
Graphical Analysis Example
• There are various graphical analysis tools available. Here are four most commonly used examples:• Box Plot• Histogram• Scatter Plot• Run Chart.
363
© Lean Sigm
a Corporation
Lean Six Sigma Training -SXL
www.LeanSigmaCorporation.com
Box Plot
• A box plot is a graphical method to summarize a data set by visualizing the minimum value, 25th percentile, median, 75th percentile, the maximum value, and potential outliers.
• A percentile is the value below which a certain percentage of data fall. For example, if 75% of the observations have values lower than 685 in a data set, then 685 is the 75th percentile of the data.
364
© Lean Sigm
a Corporation
Lean Six Sigma Training -SXL
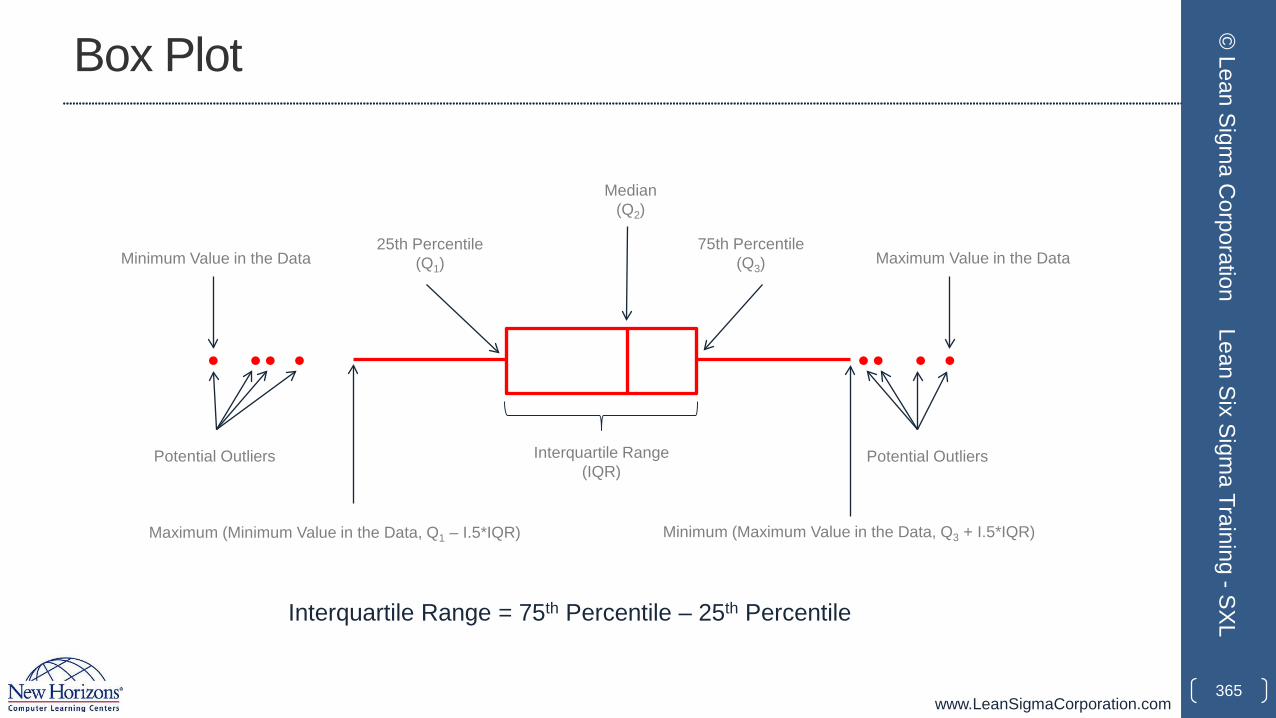
www.LeanSigmaCorporation.com
Box Plot
365
© Lean Sigm
a Corporation
Lean Six Sigma Training -SXLInterquartile Range = 75th Percentile – 25th Percentile
25th Percentile (Q1)
75th Percentile(Q3)
Median(Q2)
Interquartile Range(IQR)
Maximum (Minimum Value in the Data, Q1 – I.5*IQR) Minimum (Maximum Value in the Data, Q3 + I.5*IQR)
Minimum Value in the Data Maximum Value in the Data
Potential Outliers Potential Outliers
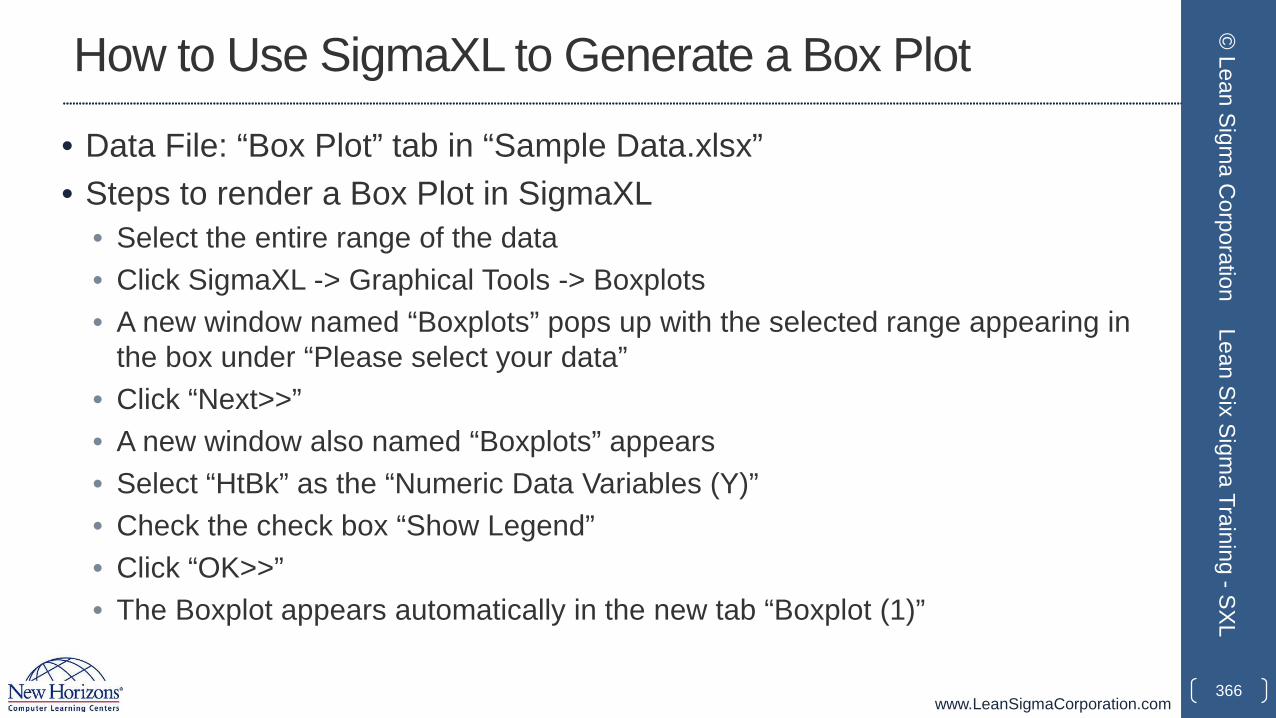
www.LeanSigmaCorporation.com
How to Use SigmaXL to Generate a Box Plot
• Data File: “Box Plot” tab in “Sample Data.xlsx”• Steps to render a Box Plot in SigmaXL
• Select the entire range of the data• Click SigmaXL -> Graphical Tools -> Boxplots• A new window named “Boxplots” pops up with the selected range appearing in
the box under “Please select your data”• Click “Next>>”• A new window also named “Boxplots” appears• Select “HtBk” as the “Numeric Data Variables (Y)”• Check the check box “Show Legend”• Click “OK>>”• The Boxplot appears automatically in the new tab “Boxplot (1)”
366
© Lean Sigm
a Corporation
Lean Six Sigma Training -SXL
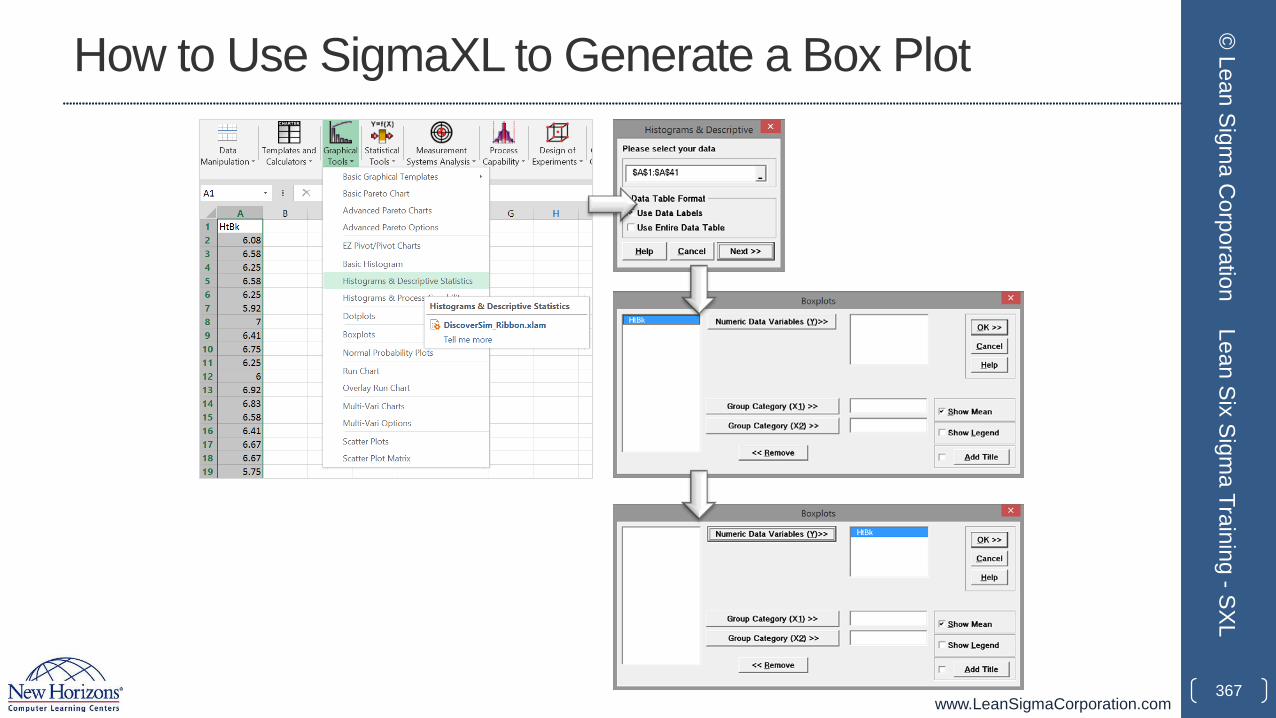
www.LeanSigmaCorporation.com
How to Use SigmaXL to Generate a Box Plot
367
© Lean Sigm
a Corporation
Lean Six Sigma Training -SXL
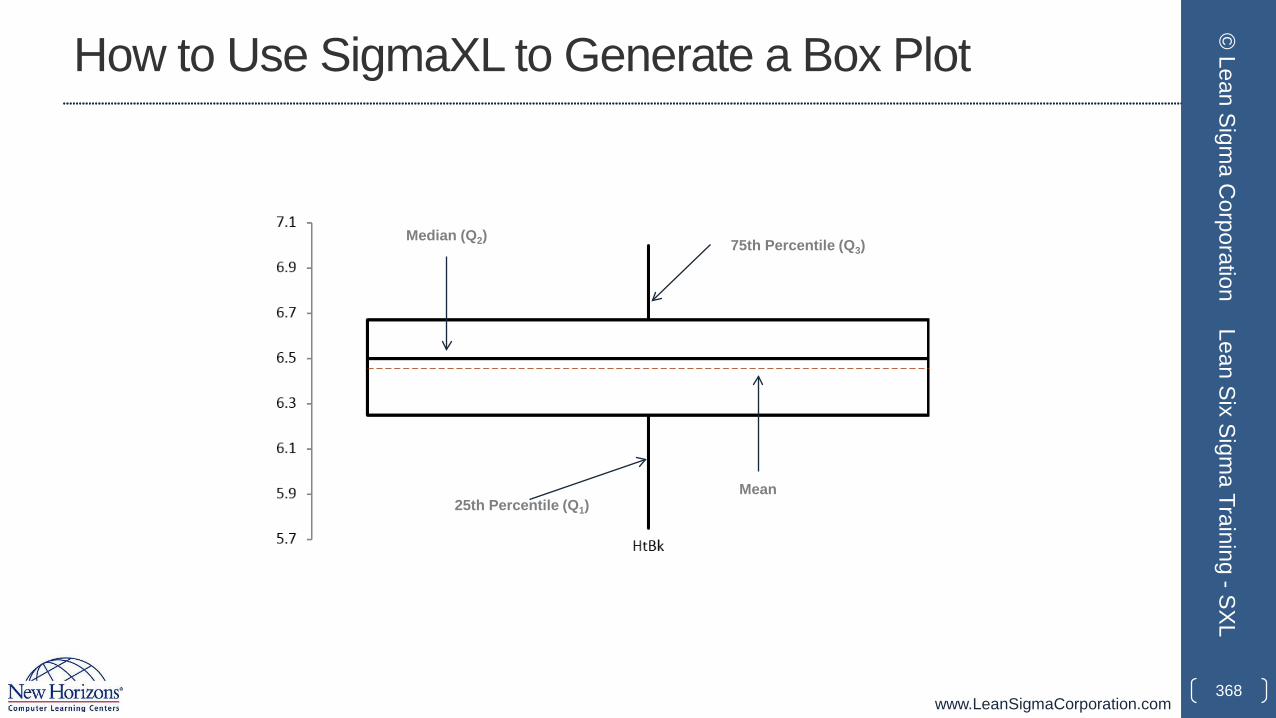
www.LeanSigmaCorporation.com
How to Use SigmaXL to Generate a Box Plot
368
© Lean Sigm
a Corporation
Lean Six Sigma Training -SXL
25th Percentile (Q1)
75th Percentile (Q3)Median (Q2)
Mean
www.LeanSigmaCorporation.com
Histogram
• A histogram is a graphical tool to present the distribution of the data.
• The X axis represents the possible values of the variable and the Y axis represents the frequency of the value occurring.
• A histogram consists of adjacent rectangles erected over intervals with heights equal to the frequency density of the interval.
• The total area of all the rectangles in a histogram is the number of data values.
369
© Lean Sigm
a Corporation
Lean Six Sigma Training -SXL
www.LeanSigmaCorporation.com
Histogram
• A histogram can also be normalized. In this case, the X axis still represents the possible values of the variable, but the Y axis represents the percentage of observations that fall into each interval on the X axis.
• The total area of all the rectangles in a normalized histogram is 1.
• With the histogram, we have a better understanding of the shape, location, and spread of the data.
370
© Lean Sigm
a Corporation
Lean Six Sigma Training -SXL
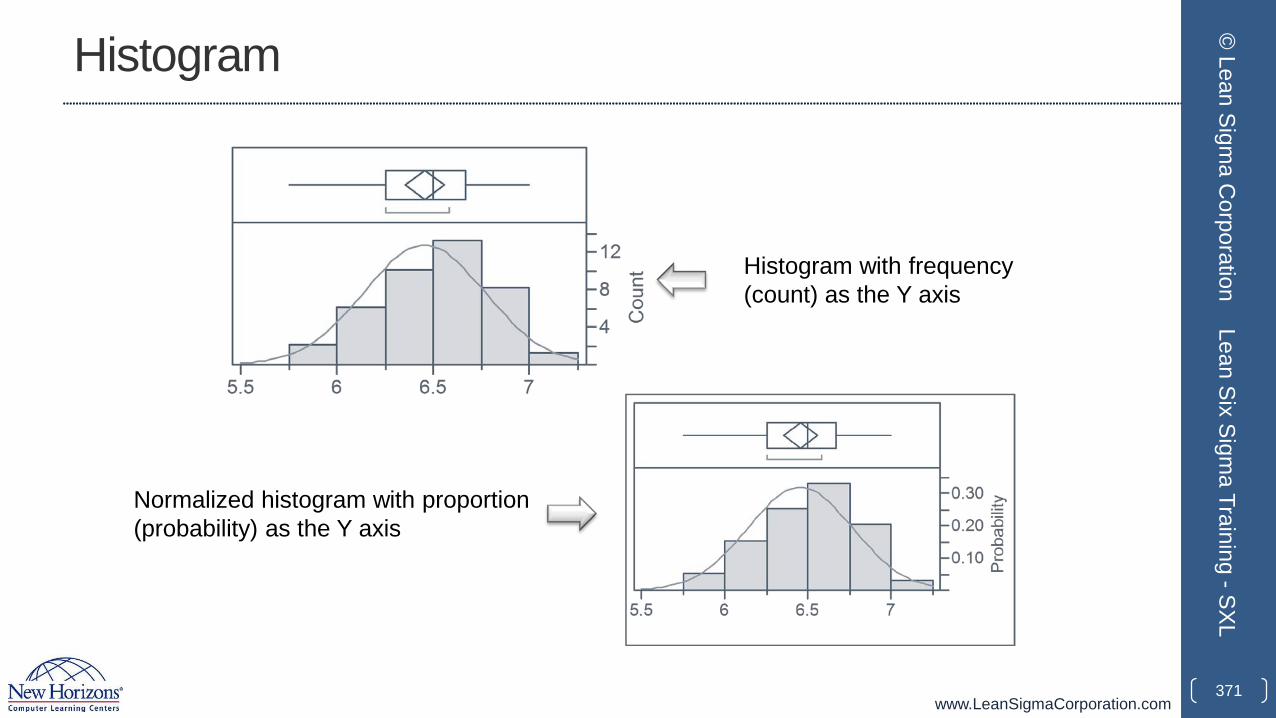
www.LeanSigmaCorporation.com
Histogram
371
© Lean Sigm
a Corporation
Lean Six Sigma Training -SXL
Histogram with frequency (count) as the Y axis
Normalized histogram with proportion (probability) as the Y axis
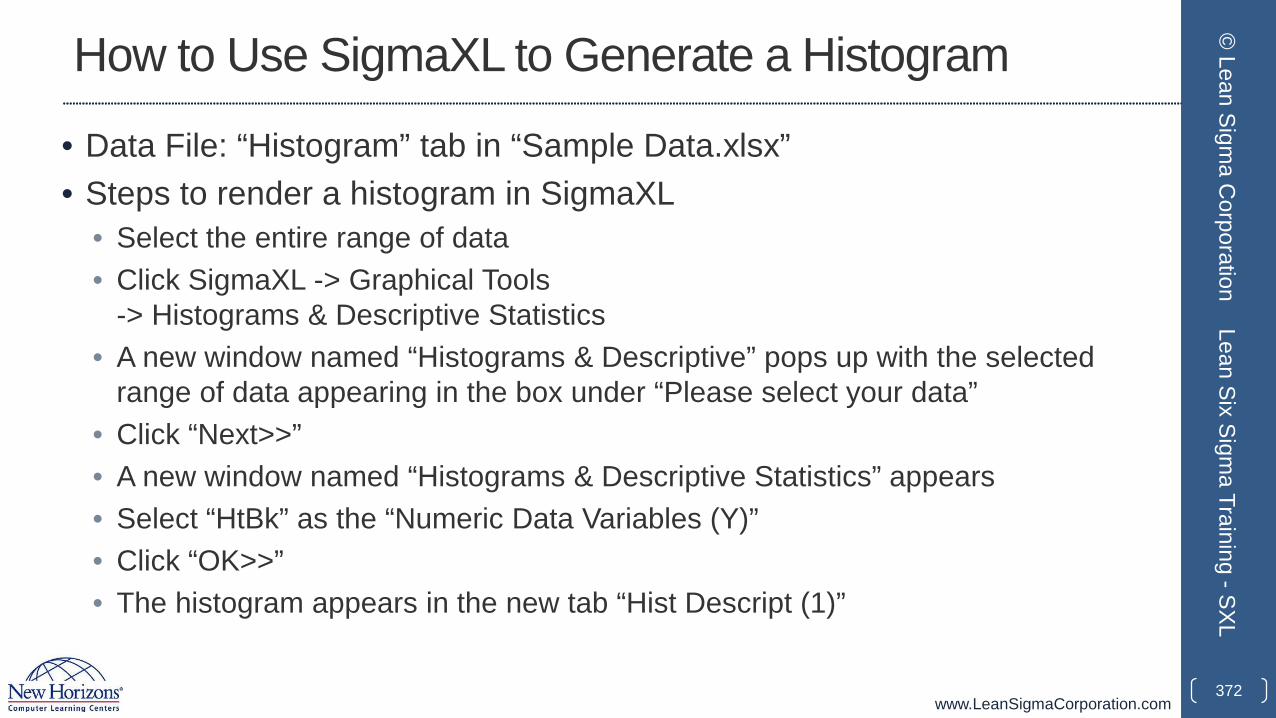
www.LeanSigmaCorporation.com
How to Use SigmaXL to Generate a Histogram
• Data File: “Histogram” tab in “Sample Data.xlsx”• Steps to render a histogram in SigmaXL
• Select the entire range of data• Click SigmaXL -> Graphical Tools
-> Histograms & Descriptive Statistics• A new window named “Histograms & Descriptive” pops up with the selected
range of data appearing in the box under “Please select your data”• Click “Next>>”• A new window named “Histograms & Descriptive Statistics” appears• Select “HtBk” as the “Numeric Data Variables (Y)”• Click “OK>>”• The histogram appears in the new tab “Hist Descript (1)”
372
© Lean Sigm
a Corporation
Lean Six Sigma Training -SXL
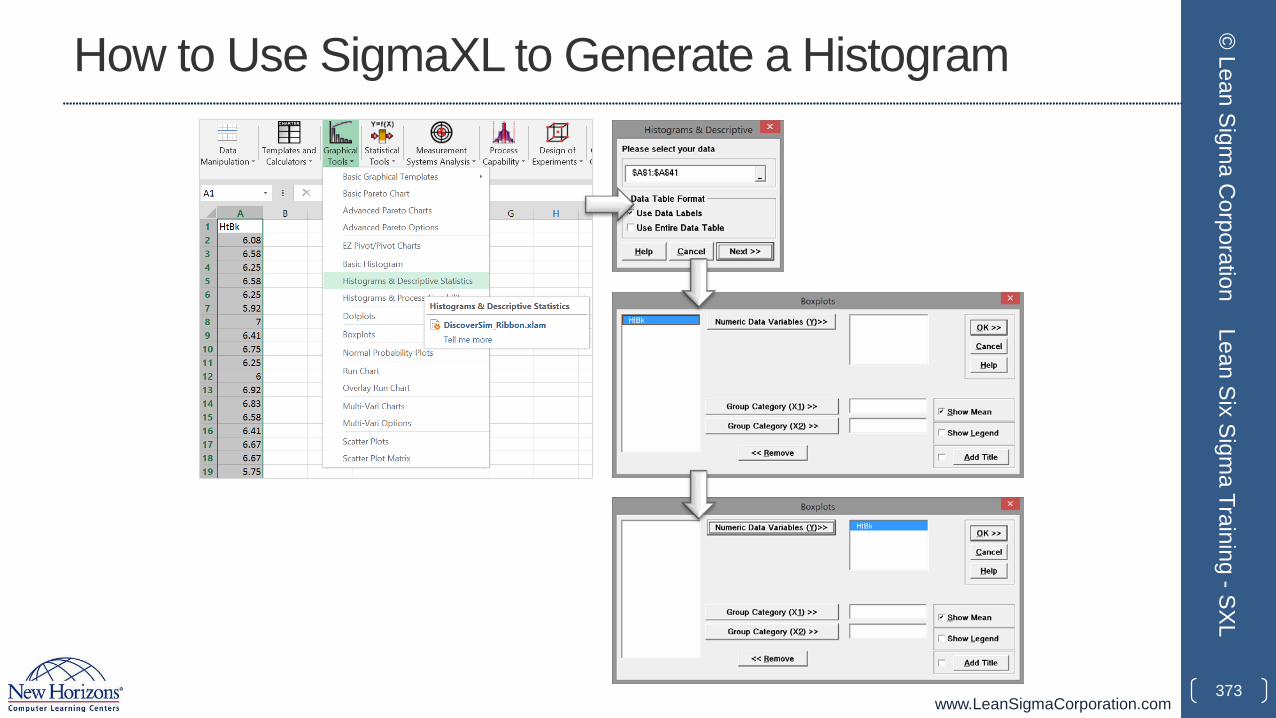
www.LeanSigmaCorporation.com
How to Use SigmaXL to Generate a Histogram
373
© Lean Sigm
a Corporation
Lean Six Sigma Training -SXL
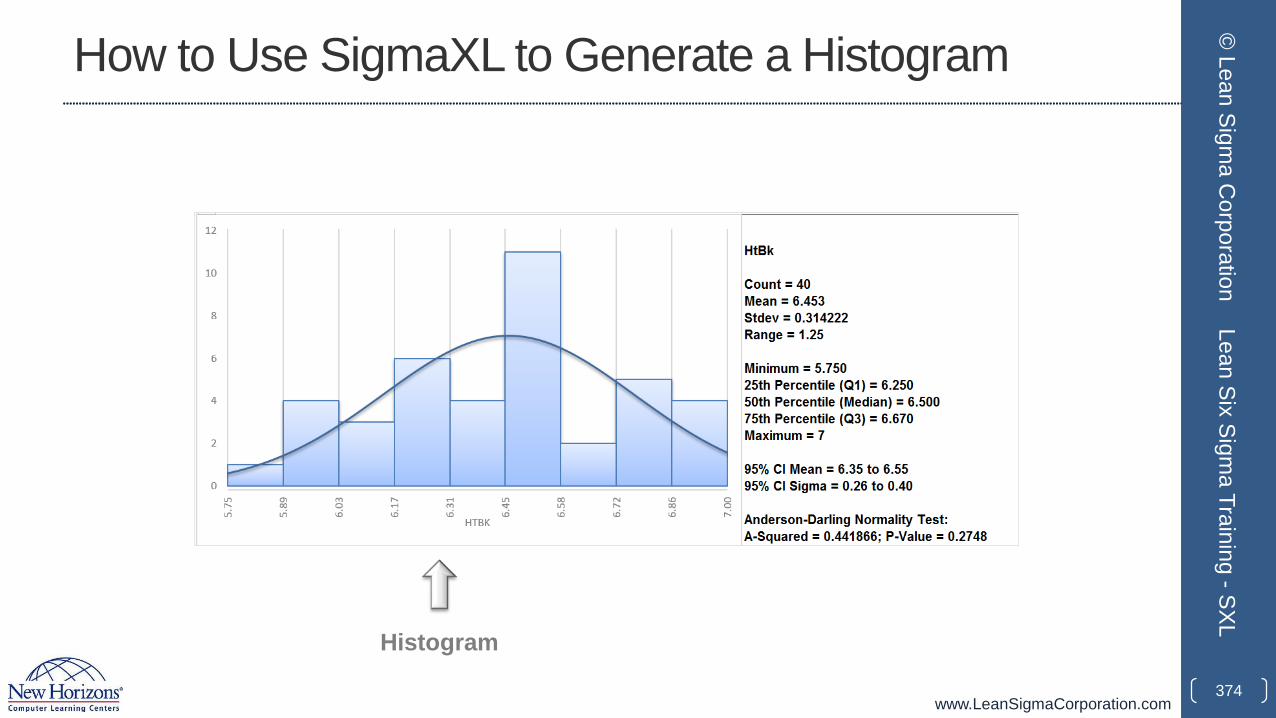
www.LeanSigmaCorporation.com
How to Use SigmaXL to Generate a Histogram
374
© Lean Sigm
a Corporation
Lean Six Sigma Training -SXL
Histogram
www.LeanSigmaCorporation.com
Scatter Plot
• A scatter plot is a diagram to present the relationship between two variables of a data set.
• A scatter plot consists of a set of data points.
• On the scatter plot, a single observation is presented by a data point with its horizontal position equal to the value of one variable and its vertical position equal to the value of the other variable.
375
© Lean Sigm
a Corporation
Lean Six Sigma Training -SXL
www.LeanSigmaCorporation.com
Scatter Plot
• A scatter plot helps to understand:
• Whether the two variables are related to each other or not
• How is the strength of their relationship
• What is the shape of their relationship
• What is the direction of their relationship
• Whether outliers are present.
376
© Lean Sigm
a Corporation
Lean Six Sigma Training -SXL
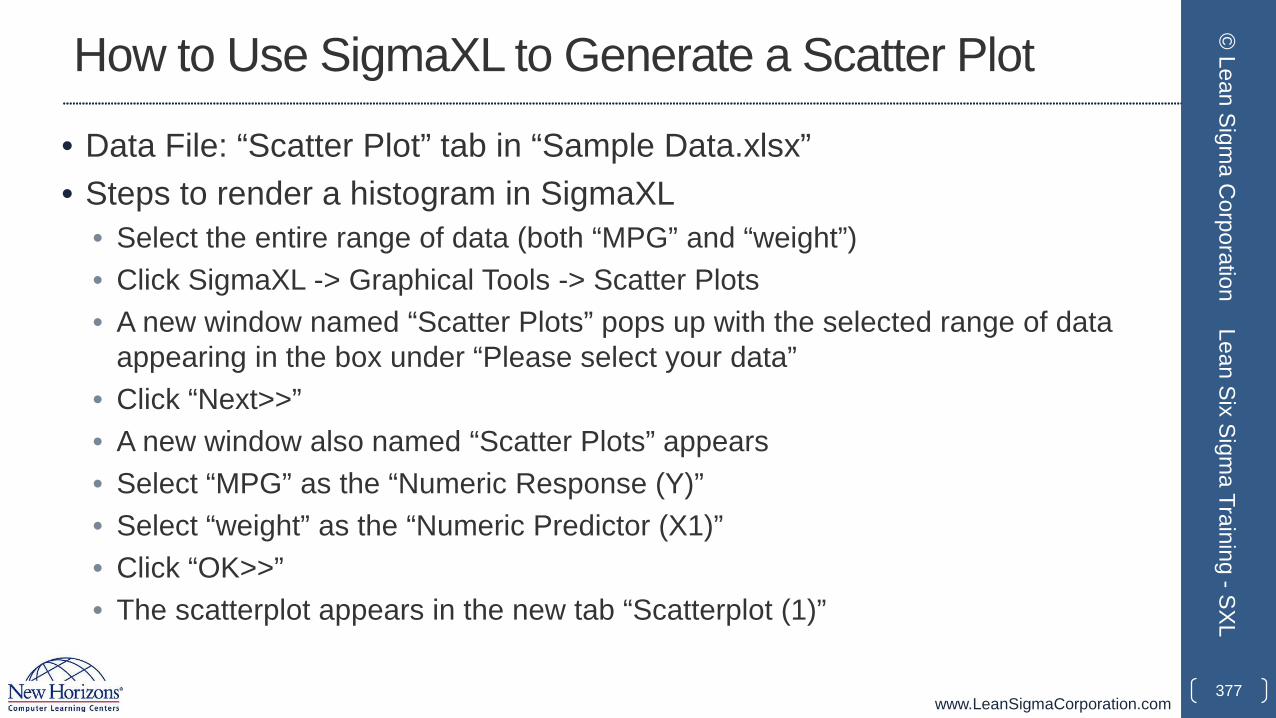
www.LeanSigmaCorporation.com
How to Use SigmaXL to Generate a Scatter Plot
• Data File: “Scatter Plot” tab in “Sample Data.xlsx”• Steps to render a histogram in SigmaXL
• Select the entire range of data (both “MPG” and “weight”)• Click SigmaXL -> Graphical Tools -> Scatter Plots• A new window named “Scatter Plots” pops up with the selected range of data
appearing in the box under “Please select your data”• Click “Next>>”• A new window also named “Scatter Plots” appears• Select “MPG” as the “Numeric Response (Y)”• Select “weight” as the “Numeric Predictor (X1)”• Click “OK>>”• The scatterplot appears in the new tab “Scatterplot (1)”
377
© Lean Sigm
a Corporation
Lean Six Sigma Training -SXL
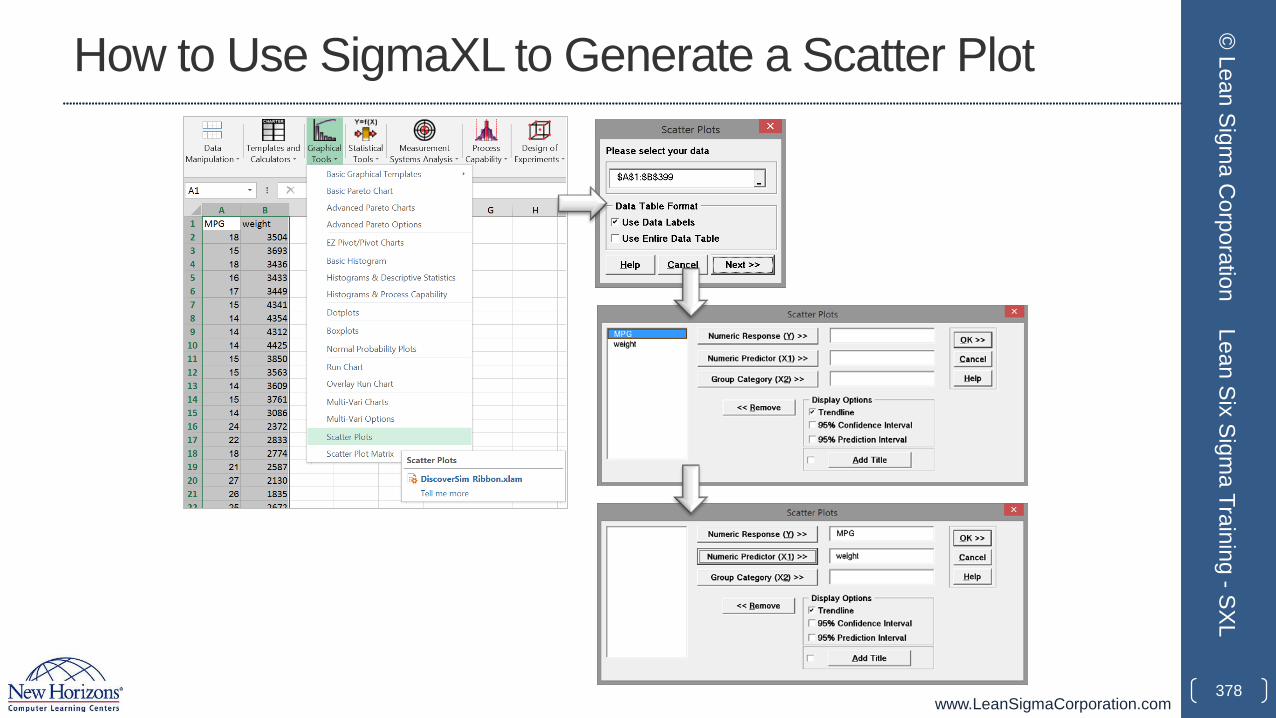
www.LeanSigmaCorporation.com
How to Use SigmaXL to Generate a Scatter Plot
378
© Lean Sigm
a Corporation
Lean Six Sigma Training -SXL
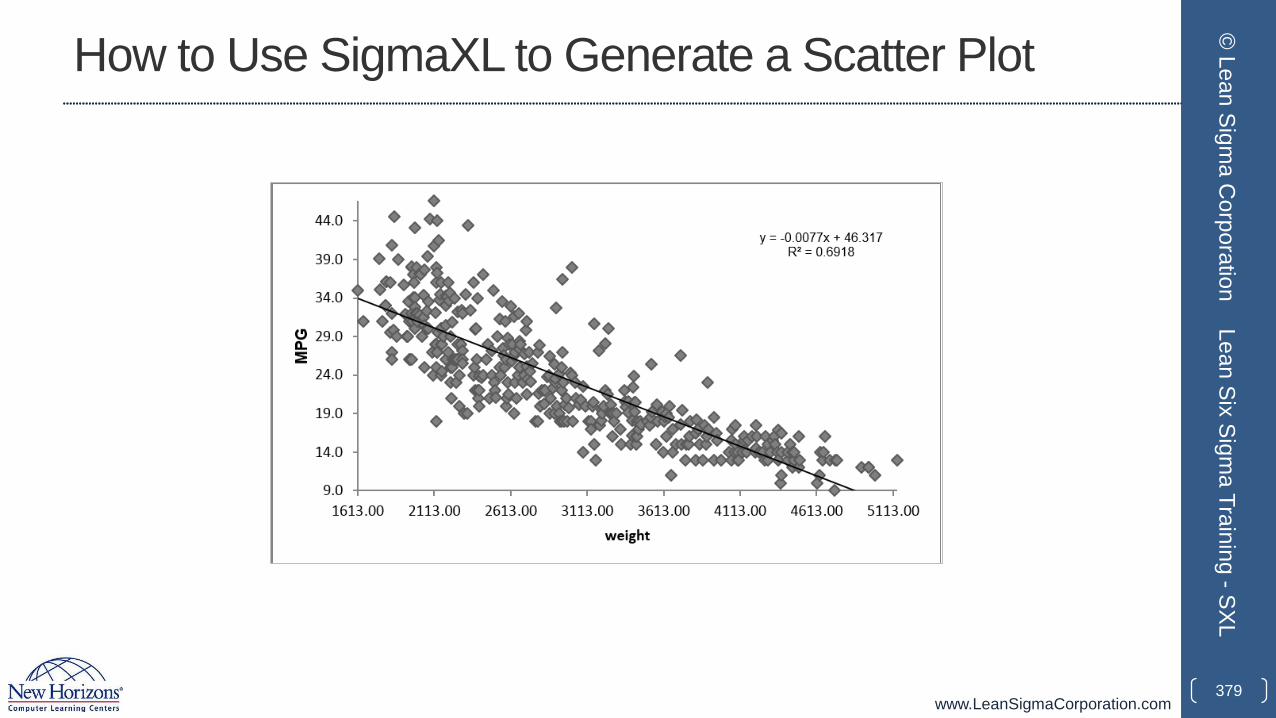
www.LeanSigmaCorporation.com
How to Use SigmaXL to Generate a Scatter Plot
379
© Lean Sigm
a Corporation
Lean Six Sigma Training -SXL
www.LeanSigmaCorporation.com
Run Chart
• A run chart is a chart used to present the data in time order. It captures the process performance over time.
• The X axis of the run chart indicates the time and the Y axis indicates the observed values.
• Run chart looks similar to control charts except that a run chart does not have control limits plotted. It is easier to produce a run chart than a control chart.
• It is often used to identify the anomalies in the data and discover the pattern of data changing over time.
380
© Lean Sigm
a Corporation
Lean Six Sigma Training -SXL
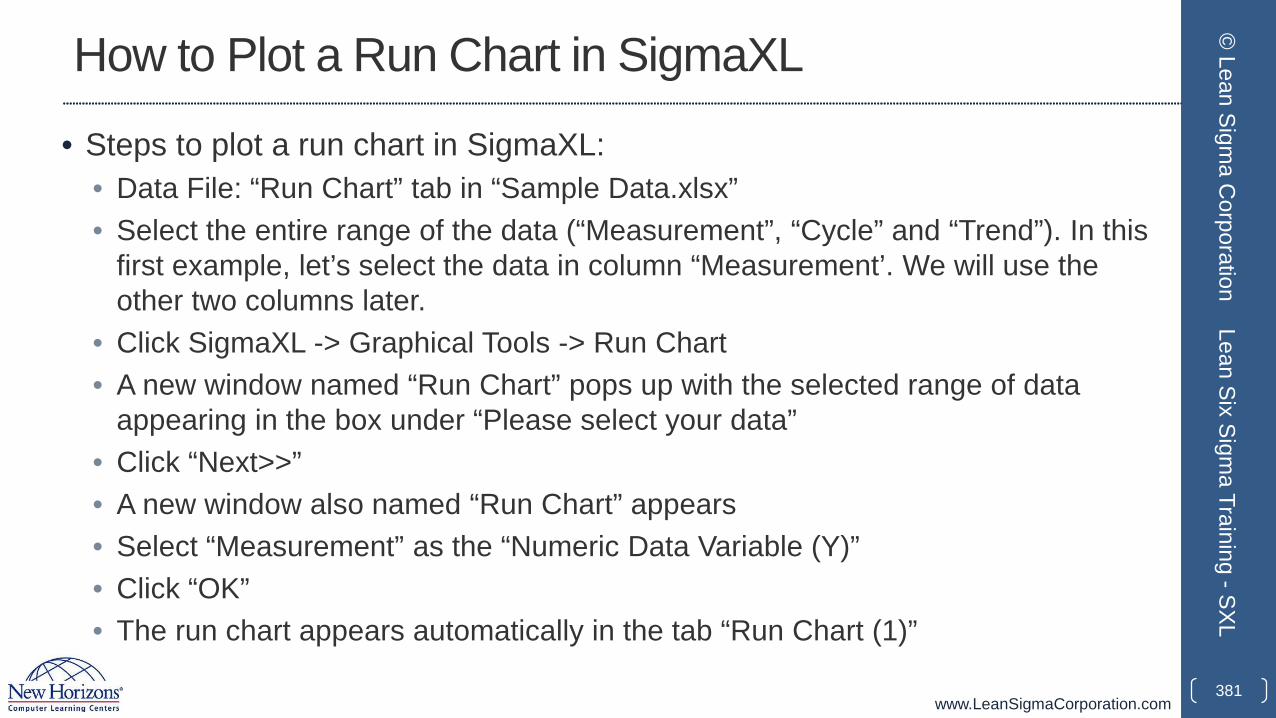
www.LeanSigmaCorporation.com
How to Plot a Run Chart in SigmaXL
• Steps to plot a run chart in SigmaXL:• Data File: “Run Chart” tab in “Sample Data.xlsx”• Select the entire range of the data (“Measurement”, “Cycle” and “Trend”). In this
first example, let’s select the data in column “Measurement’. We will use the other two columns later.
• Click SigmaXL -> Graphical Tools -> Run Chart• A new window named “Run Chart” pops up with the selected range of data
appearing in the box under “Please select your data”• Click “Next>>”• A new window also named “Run Chart” appears• Select “Measurement” as the “Numeric Data Variable (Y)”• Click “OK”• The run chart appears automatically in the tab “Run Chart (1)”
381
Lean Six Sigma Training -SXL
© Lean Sigm
a Corporation
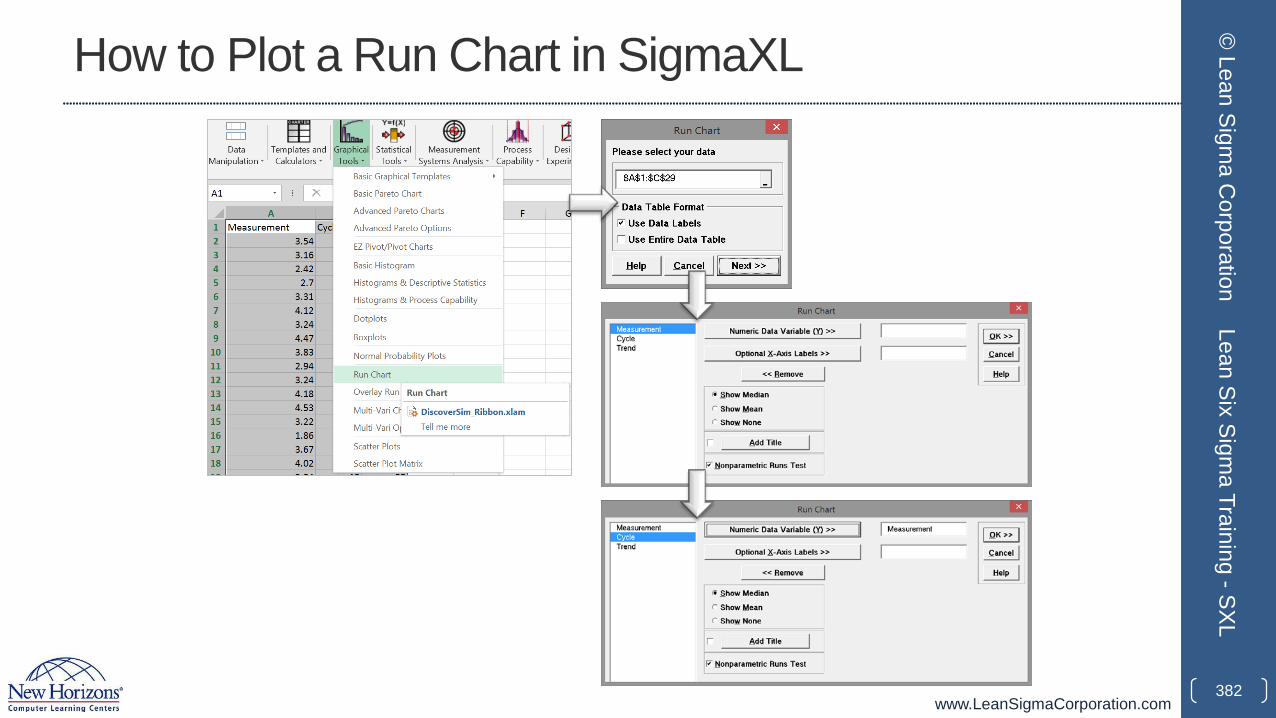
www.LeanSigmaCorporation.com
How to Plot a Run Chart in SigmaXL
382
© Lean Sigm
a Corporation
Lean Six Sigma Training -SXL
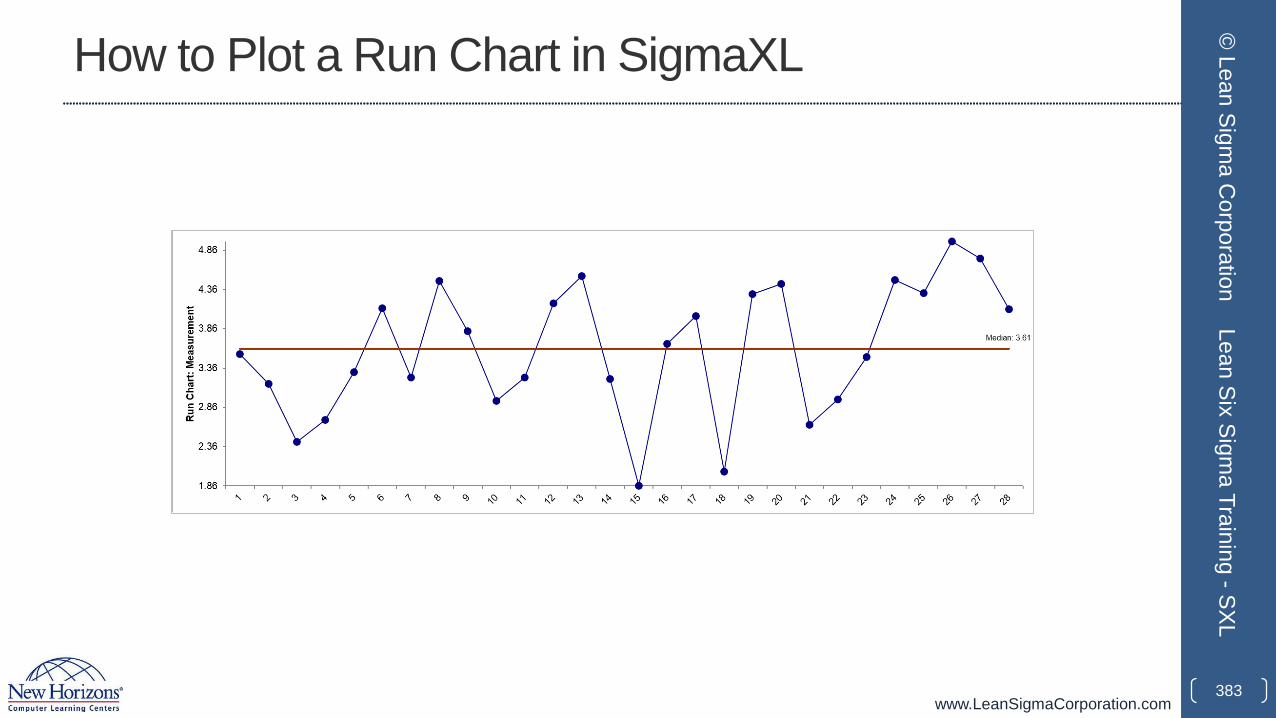
www.LeanSigmaCorporation.com
How to Plot a Run Chart in SigmaXL
383
© Lean Sigm
a Corporation
Lean Six Sigma Training -SXL

www.LeanSigmaCorporation.com
Run Chart Example
• Run chart is used to identify the trend, cycle, seasonal pattern, abnormality in the data.
384
© Lean Sigm
a Corporation
Lean Six Sigma Training -SXL
• The time series in this chart appear stable.
• There are no extreme outliers, trending or seasonal patterns.
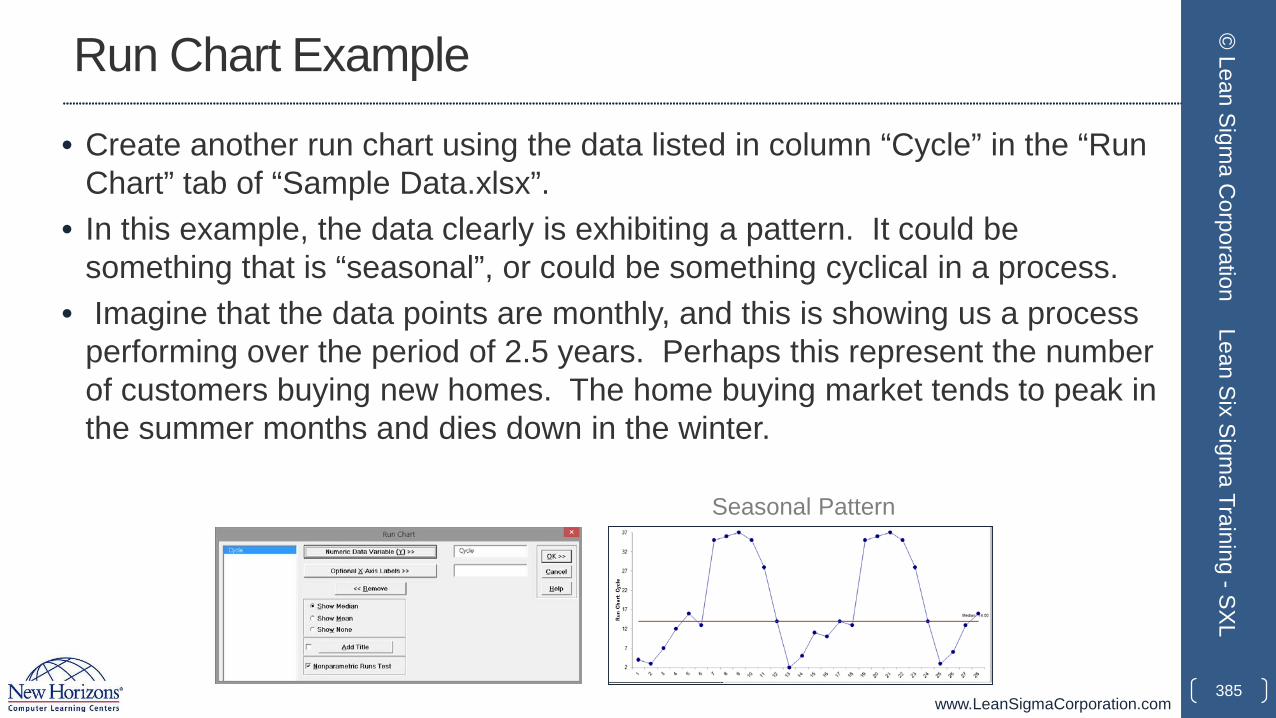
www.LeanSigmaCorporation.com
Run Chart Example
• Create another run chart using the data listed in column “Cycle” in the “Run Chart” tab of “Sample Data.xlsx”.
• In this example, the data clearly is exhibiting a pattern. It could be something that is “seasonal”, or could be something cyclical in a process.
• Imagine that the data points are monthly, and this is showing us a process performing over the period of 2.5 years. Perhaps this represent the number of customers buying new homes. The home buying market tends to peak in the summer months and dies down in the winter.
385
© Lean Sigm
a Corporation
Lean Six Sigma Training -SXL
Seasonal Pattern
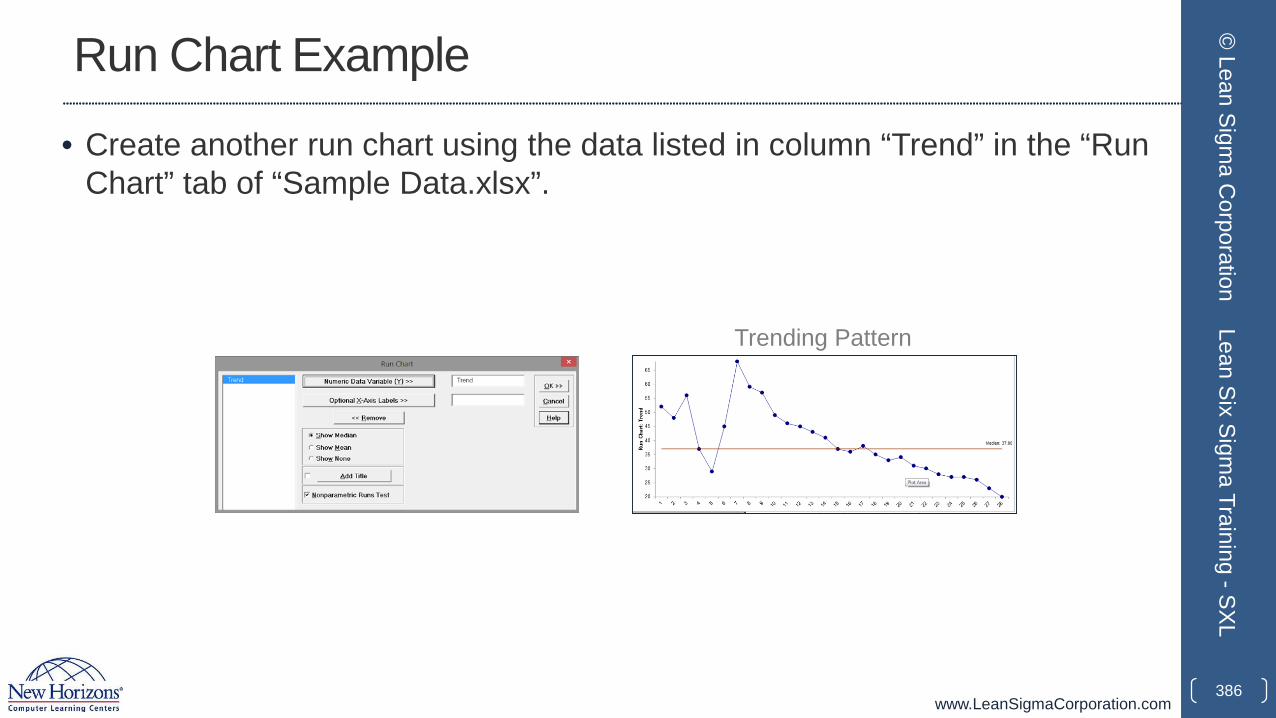
www.LeanSigmaCorporation.com
Run Chart Example
• Create another run chart using the data listed in column “Trend” in the “Run Chart” tab of “Sample Data.xlsx”.
386
© Lean Sigm
a Corporation
Lean Six Sigma Training -SXL
Trending Pattern
www.LeanSigmaCorporation.com
2.3 MSA (Measurement System Analysis)
387
© Lean Sigm
a Corporation
Lean Six Sigma Training -SXL
www.LeanSigmaCorporation.com
Yellow Belt Training: Measure Phase2.1 Process Definition
2.1.1 Cause and Effect Diagrams2.1.2 Cause and Effects Matrix2.1.3 Process Mapping2.1.4 FMEA: Failure Modes and Effects Analysis2.1.5 Theory of Constraints
2.2 Six Sigma Statistics2.2.1 Basic Statistics2.2.2 Descriptive Statistics2.2.3 Distributions and Normality2.2.4 Graphical Analysis
2.3 Measurement System Analysis2.3.1 Precision and Accuracy2.3.2 Bias, Linearity, and Stability2.3.3 Gage R&R2.3.4 Variable and Attribute MSA
2.4 Process Capability2.4.1 Capability Analysis2.4.2 Concept of Stability2.4.3 Attribute and Discrete Capability2.4.4 Monitoring Techniques
388
© Lean Sigm
a Corporation
Lean Six Sigma Training -SXL
www.LeanSigmaCorporation.com
2.3.1 Precision and Accuracy
389
© Lean Sigm
a Corporation
Lean Six Sigma Training -SXL
www.LeanSigmaCorporation.com
What is Measurement System Analysis
• Measurement System Analysis (MSA) is a systematic method to identify and analyze the variation components in the measurement.
• It is a mandatory step in any Six Sigma project to ensure the data are reliable before making any data-based decisions.
• The MSA is the check point of data quality before we start any further analysis and draw any conclusions from the data.
390
© Lean Sigm
a Corporation
Lean Six Sigma Training -SXL
www.LeanSigmaCorporation.com
Data-Based Analysis
• Here are some examples of data-based analysis where MSA is the prerequisite:• Correlation analysis
• Regression analysis
• Hypothesis testing
• Analysis of variance
• Design of experiments
• Multivariate analysis
• Statistical process control.
391
© Lean Sigm
a Corporation
Lean Six Sigma Training -SXL
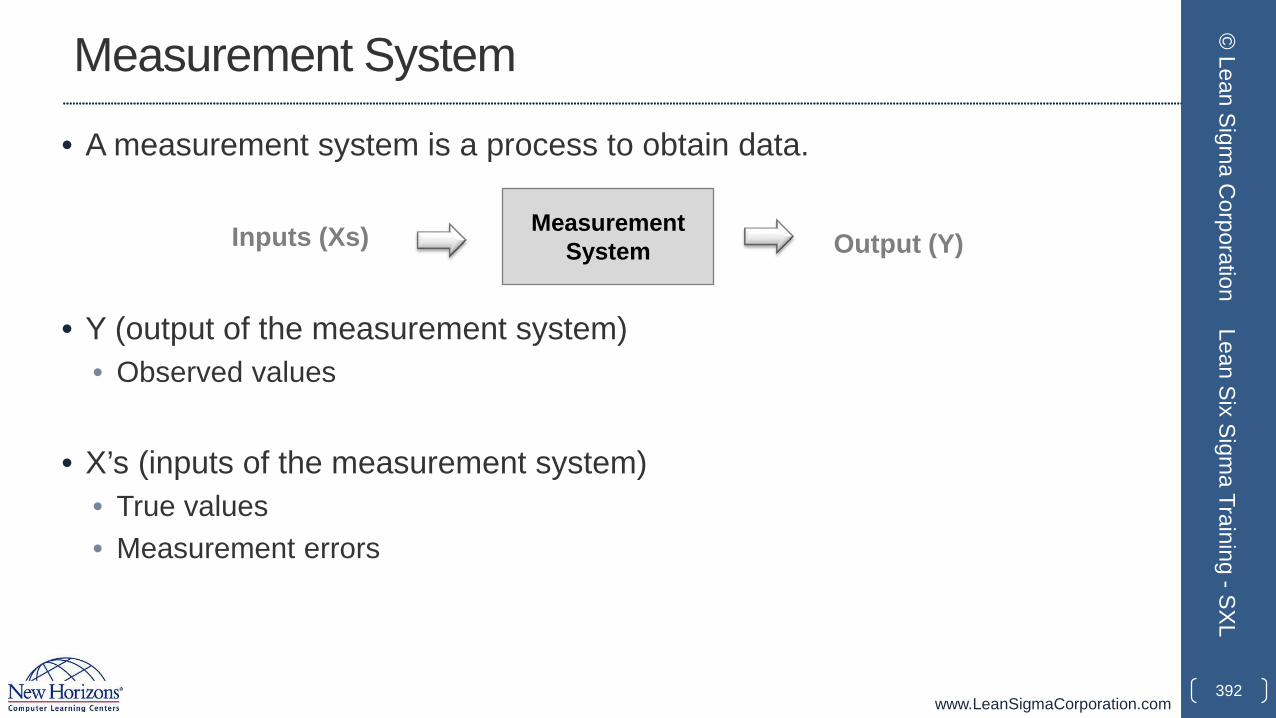
www.LeanSigmaCorporation.com
Measurement System
• A measurement system is a process to obtain data.
• Y (output of the measurement system)• Observed values
• X’s (inputs of the measurement system)• True values• Measurement errors
392
© Lean Sigm
a Corporation
Lean Six Sigma Training -SXL
MeasurementSystemInputs (Xs) Output (Y)
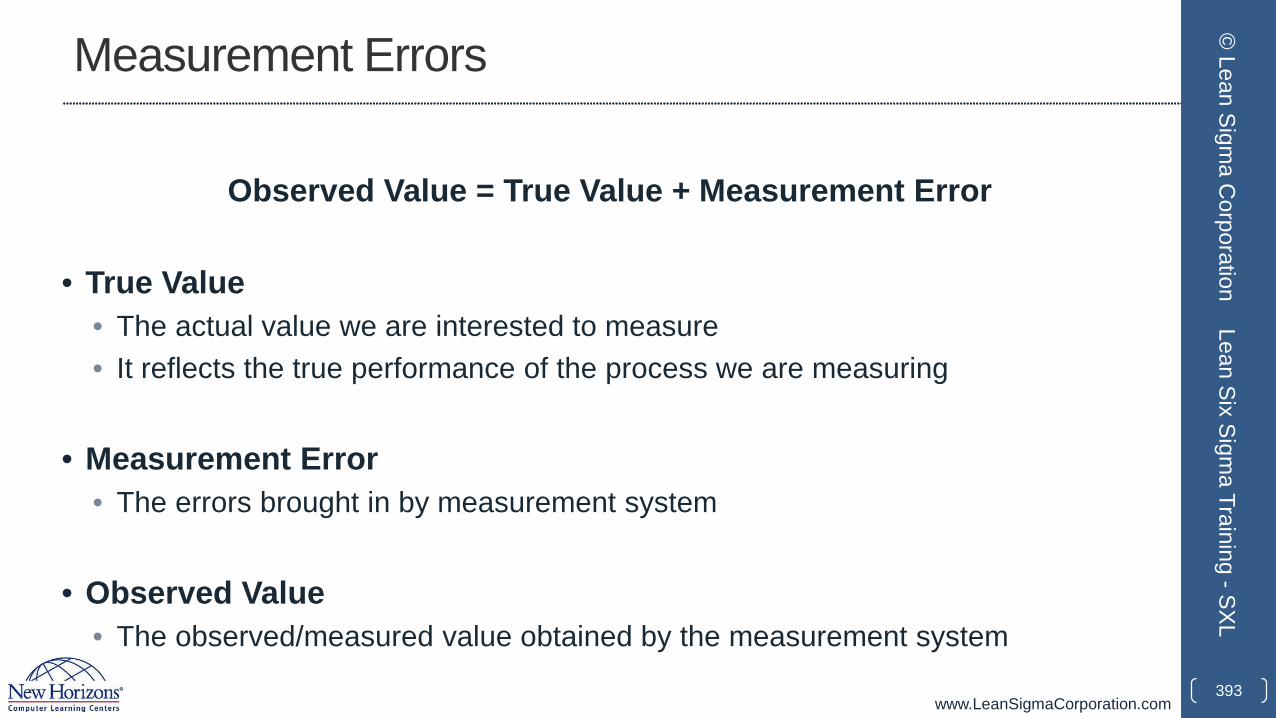
www.LeanSigmaCorporation.com
Measurement Errors
Observed Value = True Value + Measurement Error
• True Value• The actual value we are interested to measure• It reflects the true performance of the process we are measuring
• Measurement Error• The errors brought in by measurement system
• Observed Value• The observed/measured value obtained by the measurement system
393
© Lean Sigm
a Corporation
Lean Six Sigma Training -SXL
www.LeanSigmaCorporation.com
Measurement Errors
• Types of Observed Values:• Continuous measurements
• Weight• Height• Money
• Discrete measurements• Red/Yellow/Green• Yes/No• Ratings of 1–10
• A variable MSA is designed for continuous measurements and an attribute MSA is for discrete measurements.
394
© Lean Sigm
a Corporation
Lean Six Sigma Training -SXL
www.LeanSigmaCorporation.com
Measurement Errors
• Sources of measurement errors:• Human• Environment• Equipment• Sample• Process• Material• Method.
• Fishbone diagrams can help to brainstorm the potential factors affecting the measurement system.
395
© Lean Sigm
a Corporation
Lean Six Sigma Training -SXL
www.LeanSigmaCorporation.com
Measurement Errors
• The more errors the measurement system brings in, the less reliable the observed values are.
• A valid measurement system brings in minimum amount of measurement errors.
• The goal of MSA is to qualify the measurement system by quantitatively analyzing its characteristics.
396
© Lean Sigm
a Corporation
Lean Six Sigma Training -SXL
www.LeanSigmaCorporation.com
Characteristics of a Measurement System
• Any measurement systems can be characterized by two aspects:• Accuracy (location related)• Precision (variation related).
• A valid measurement system is both accurate and precise. • Being accurate does not guarantee the measurement system is precise.• Being precise does not guarantee the measurement system is accurate.
397
© Lean Sigm
a Corporation
Lean Six Sigma Training -SXL
www.LeanSigmaCorporation.com
Accuracy vs. Precision
• Accuracy:• The level of closeness between the average observed value and the true value• How well the observed value reflects the true value.
• Precision:• The spread of measurement values• How consistent the repeated measurements deliver the same values under the
same circumstances.
398
© Lean Sigm
a Corporation
Lean Six Sigma Training -SXL
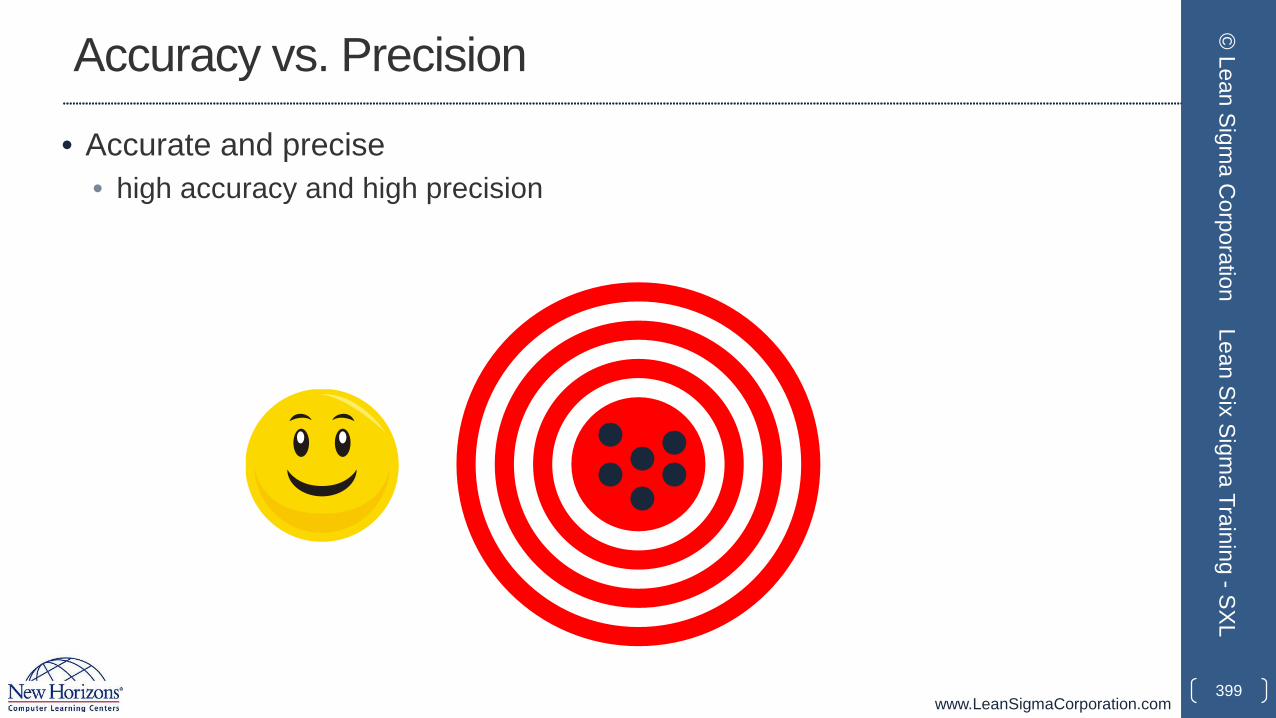
www.LeanSigmaCorporation.com
Accuracy vs. Precision
• Accurate and precise • high accuracy and high precision
399
© Lean Sigm
a Corporation
Lean Six Sigma Training -SXL

www.LeanSigmaCorporation.com
Accuracy vs. Precision
• Accurate and not precise• high accuracy and low precision
400
© Lean Sigm
a Corporation
Lean Six Sigma Training -SXL
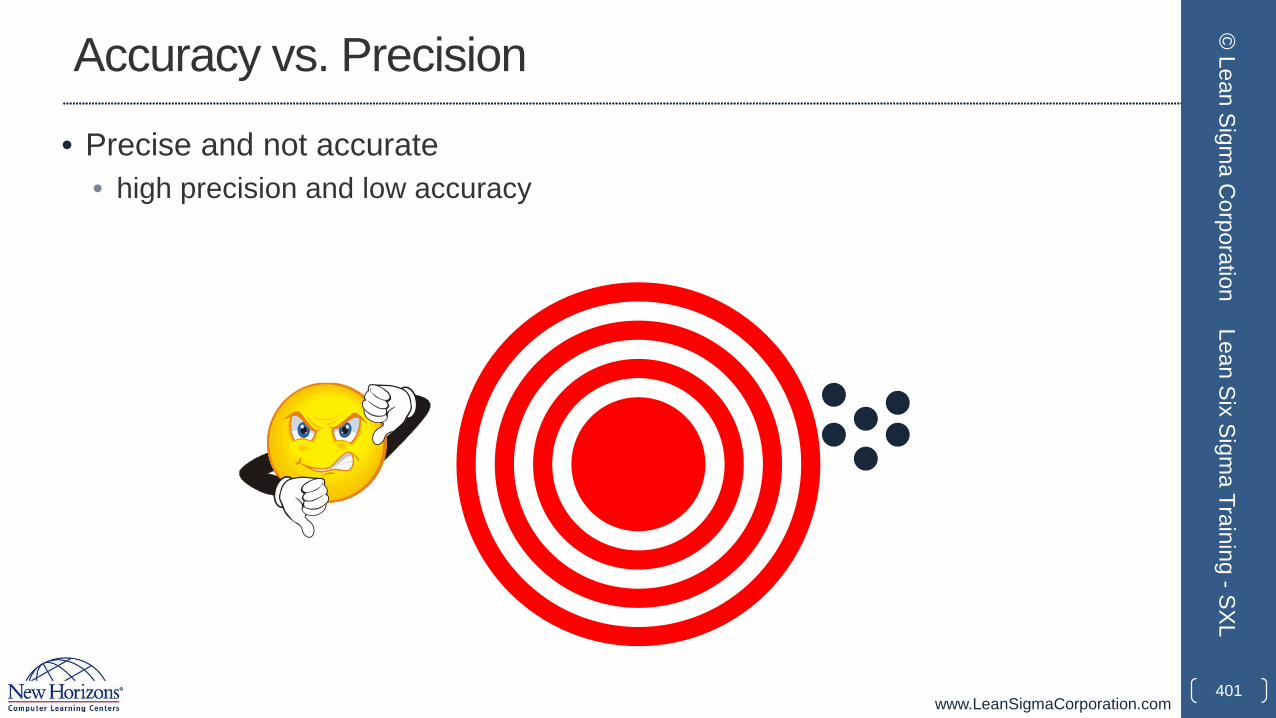
www.LeanSigmaCorporation.com
Accuracy vs. Precision
• Precise and not accurate • high precision and low accuracy
401
© Lean Sigm
a Corporation
Lean Six Sigma Training -SXL
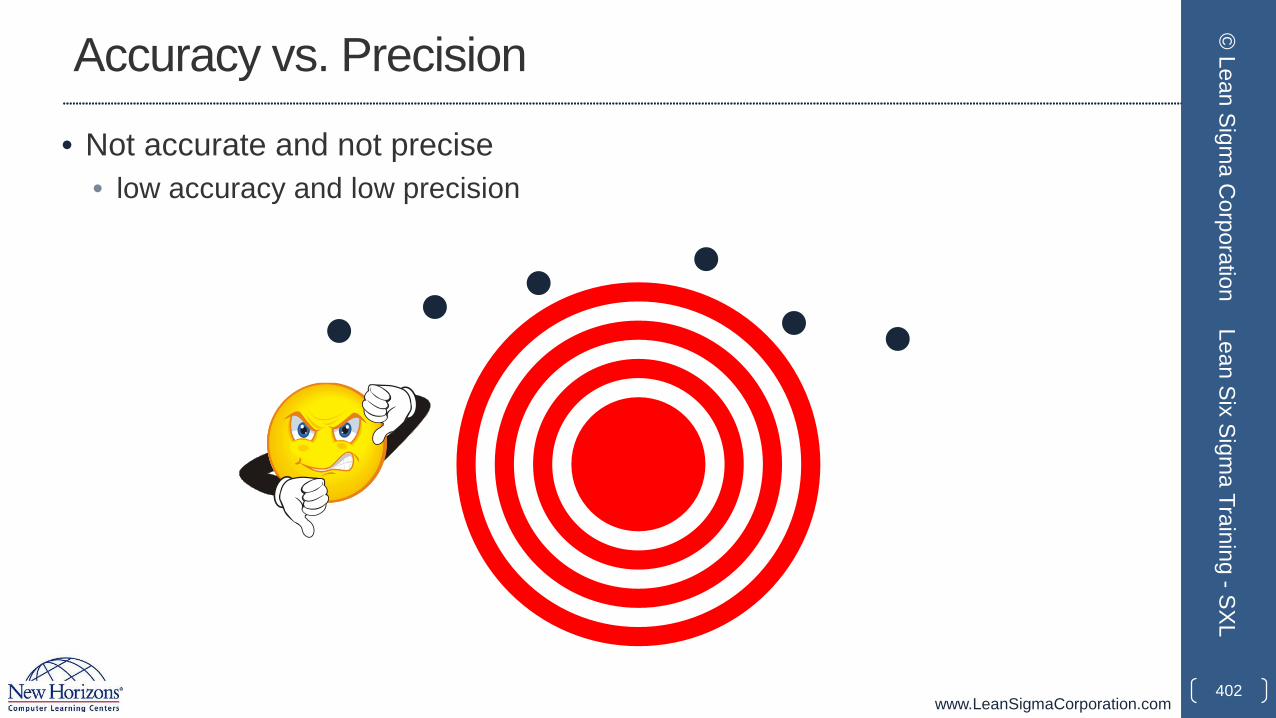
www.LeanSigmaCorporation.com
Accuracy vs. Precision
• Not accurate and not precise • low accuracy and low precision
402
© Lean Sigm
a Corporation
Lean Six Sigma Training -SXL
www.LeanSigmaCorporation.com
MSA Conclusions
• If the measurement system is considered both accurate and precise, we can start the data-based analysis or decision making.
• If the measurement system is either not accurate or not precise, we need to identify the factor(s) affecting it and calibrate the measurement system until it is both accurate and precise.
403
© Lean Sigm
a Corporation
Lean Six Sigma Training -SXL
www.LeanSigmaCorporation.com
Stratification of Accuracy and Precision
• Accuracy• Bias• Linearity• Stability
• Precision• Repeatability• Reproducibility
404
© Lean Sigm
a Corporation
Lean Six Sigma Training -SXL

www.LeanSigmaCorporation.com
2.3.2 Bias, Linearity and Stability
405
© Lean Sigm
a Corporation
Lean Six Sigma Training -SXL
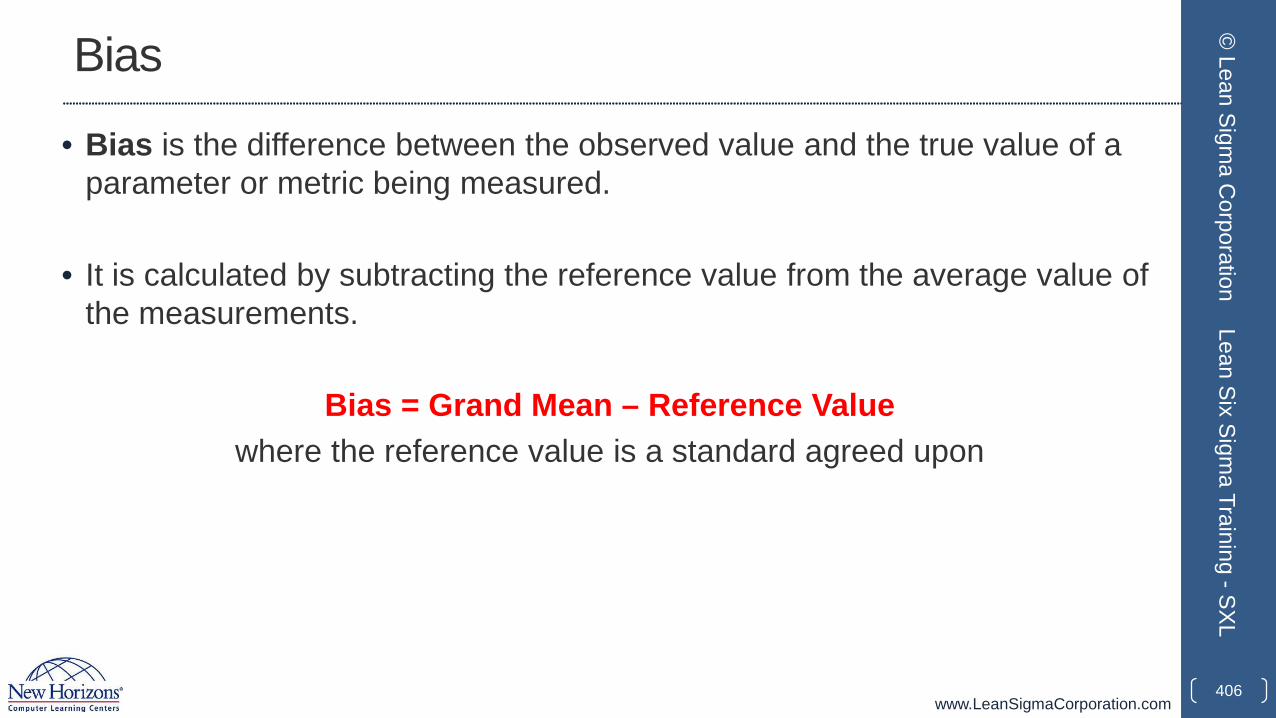
www.LeanSigmaCorporation.com
Bias
• Bias is the difference between the observed value and the true value of a parameter or metric being measured.
• It is calculated by subtracting the reference value from the average value of the measurements.
Bias = Grand Mean – Reference Valuewhere the reference value is a standard agreed upon
406
© Lean Sigm
a Corporation
Lean Six Sigma Training -SXL
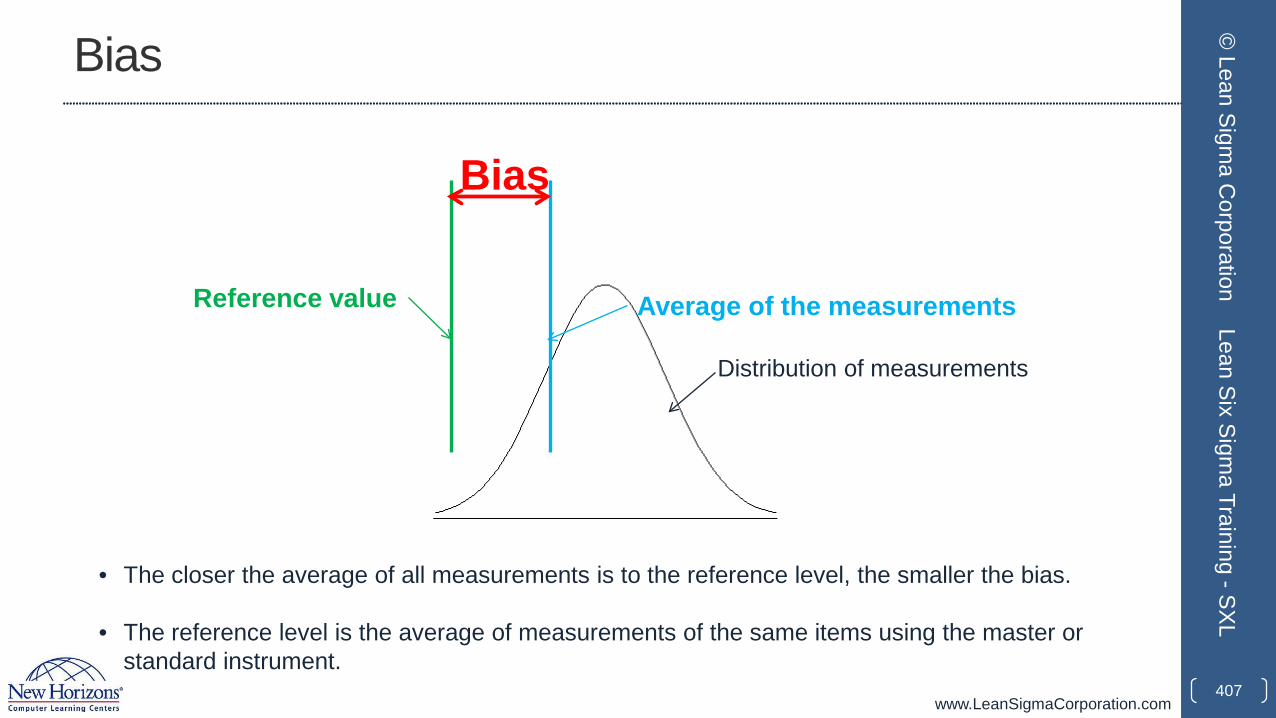
www.LeanSigmaCorporation.com
Bias
407
© Lean Sigm
a Corporation
Lean Six Sigma Training -SXL
Average of the measurementsReference value
Distribution of measurements
Bias
• The closer the average of all measurements is to the reference level, the smaller the bias.
• The reference level is the average of measurements of the same items using the master or standard instrument.
www.LeanSigmaCorporation.com
Bias
• To determine whether the difference between the average of observed measurement and the reference value is statistically significant (we will explain more details about statistical significance in the Analyze module), we can either conduct a hypothesis testing or compare the reference value against the confidence intervals of the average measurements.
• If the reference value falls into the confidence intervals, the bias is not statistically significant and can be ignored. Otherwise, the bias is statistically significant and must be fixed.
408
© Lean Sigm
a Corporation
Lean Six Sigma Training -SXL
www.LeanSigmaCorporation.com
Bias
• Potential causes of bias:• Errors in measuring the reference value• Lack of proper training for appraisers• Damaged equipment or instrument• Measurement instrument not calibrated precisely• Appraisers read the data incorrectly.
409
© Lean Sigm
a Corporation
Lean Six Sigma Training -SXL
www.LeanSigmaCorporation.com
Linearity
• Linearity is the degree of the consistency of bias over the entire expected measurement range.
• It quantifies how the bias changes over the range of measurement.
• For example, a scale is off by 0.01 pounds when measuring an object of 10 pounds. However, it is off by 10 pounds when measuring an object of 100 pounds. The scale’s bias is not linear.
410
© Lean Sigm
a Corporation
Lean Six Sigma Training -SXL
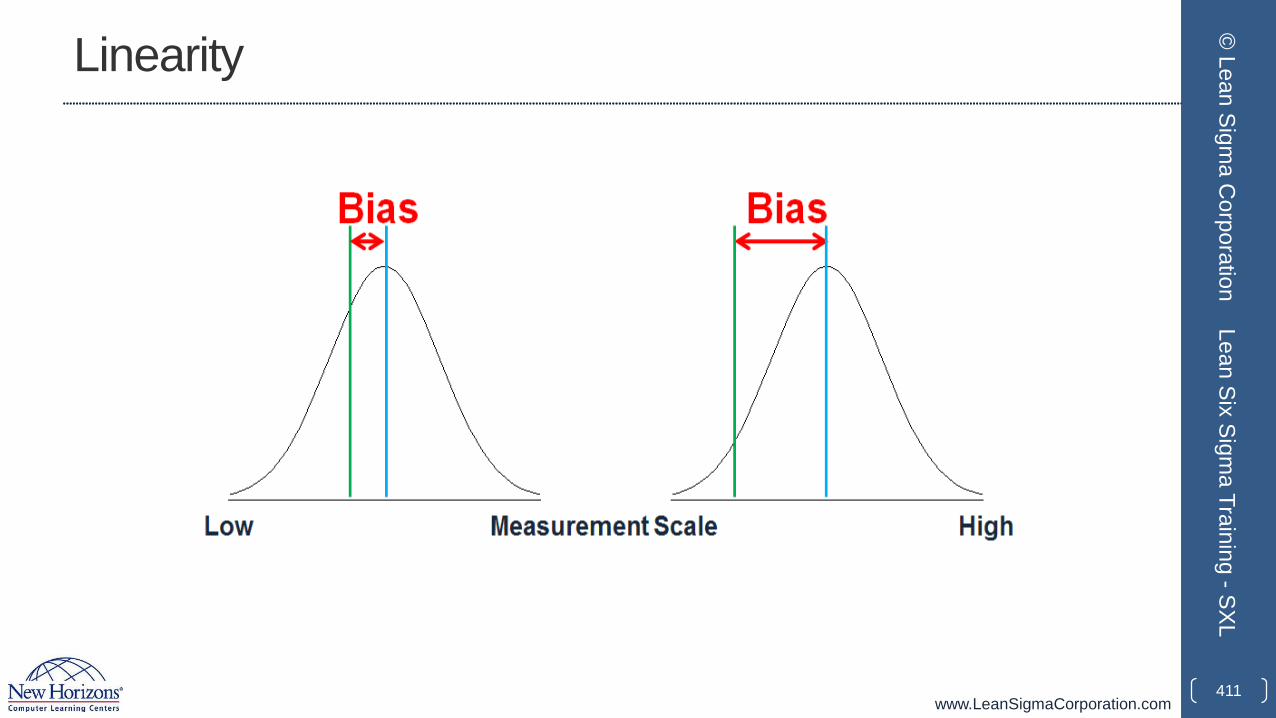
www.LeanSigmaCorporation.com
Linearity
411
© Lean Sigm
a Corporation
Lean Six Sigma Training -SXL
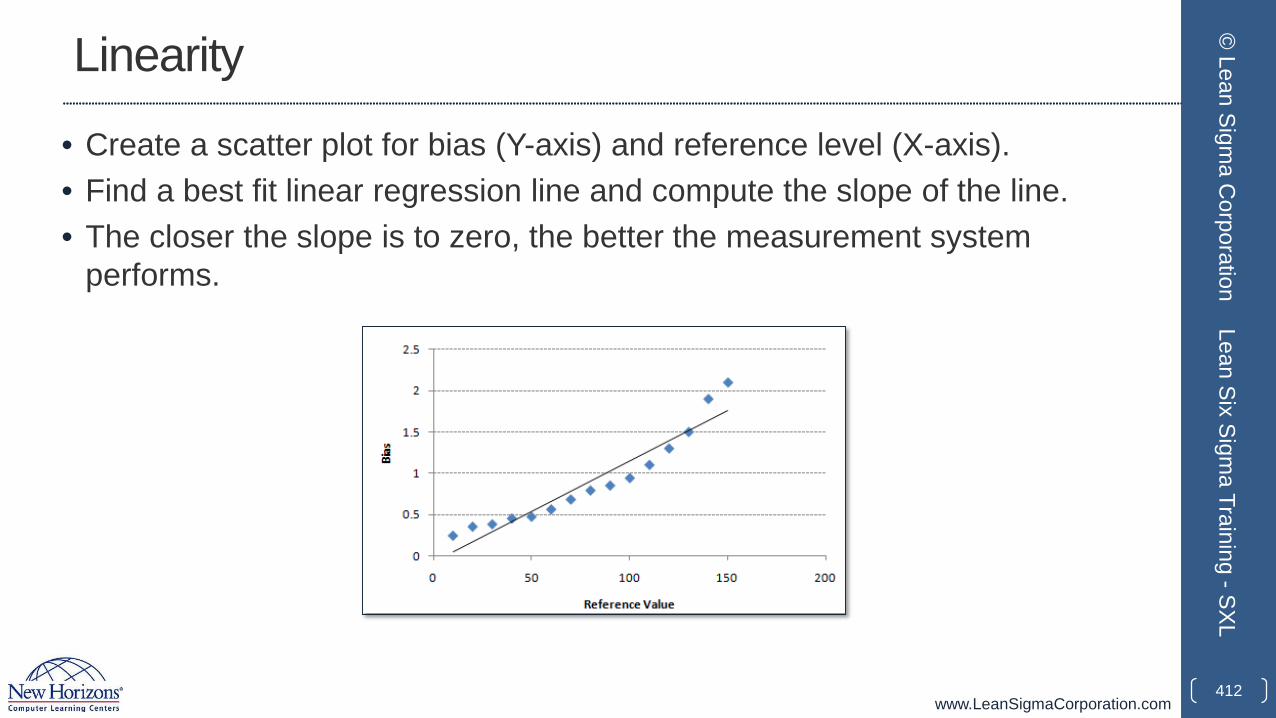
www.LeanSigmaCorporation.com
Linearity
• Create a scatter plot for bias (Y-axis) and reference level (X-axis).• Find a best fit linear regression line and compute the slope of the line.• The closer the slope is to zero, the better the measurement system
performs.
412
© Lean Sigm
a Corporation
Lean Six Sigma Training -SXL
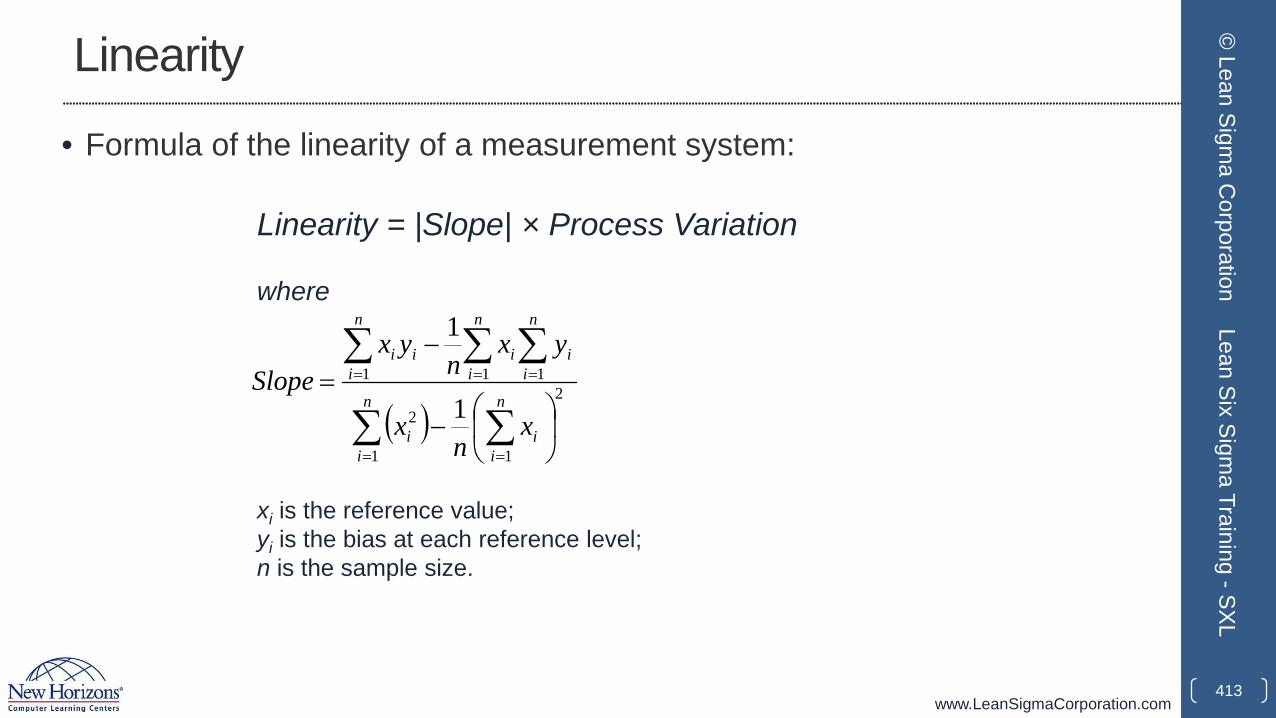
www.LeanSigmaCorporation.com
Linearity
• Formula of the linearity of a measurement system:
413
© Lean Sigm
a Corporation
Lean Six Sigma Training -SXL
Linearity = |Slope| × Process Variation
where
( )∑ ∑
∑∑∑
= =
===
−
−=
n
i
n
iii
n
ii
n
ii
n
iii
xn
x
yxn
yxSlope
1
2
1
2
111
1
1
xi is the reference value;yi is the bias at each reference level;n is the sample size.
www.LeanSigmaCorporation.com
Linearity
• Potential causes of linearity:• Errors in measuring the lower end or higher end of the reference value
• Lack of proper training for appraisers
• Damaged equipment or instrument
• Measurement instrument not calibrated correctly at the lower or higher end of
the measurement scale
• Innate nature of the instrument.
414
© Lean Sigm
a Corporation
Lean Six Sigma Training -SXL

www.LeanSigmaCorporation.com
Stability
• Stability is the consistency level needed to obtain the same values when measuring the same objects over an extended period of time.
• A measurement system that has low bias and linearity close to zero but cannot consistently perform well would not deliver reliable data.
• Stability is evaluated using control charts.
415
© Lean Sigm
a Corporation
Lean Six Sigma Training -SXL
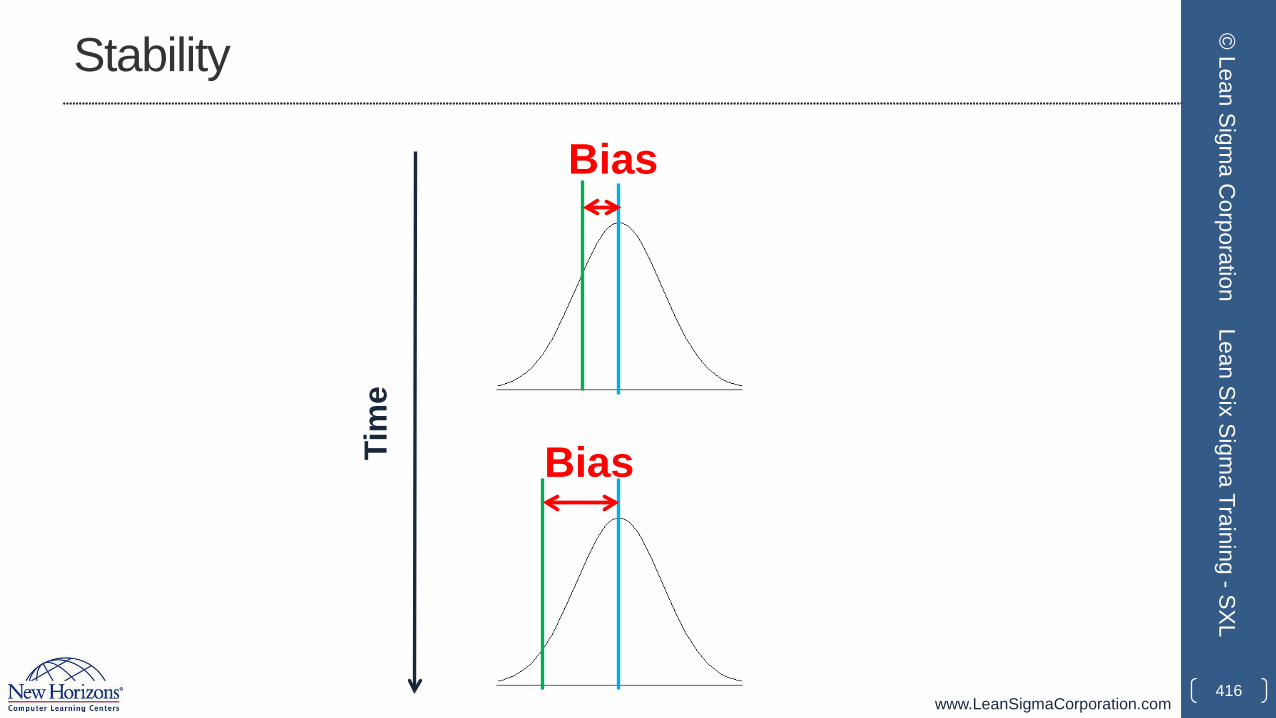
www.LeanSigmaCorporation.com
Stability
416
© Lean Sigm
a Corporation
Lean Six Sigma Training -SXL
Bias
BiasTim
e
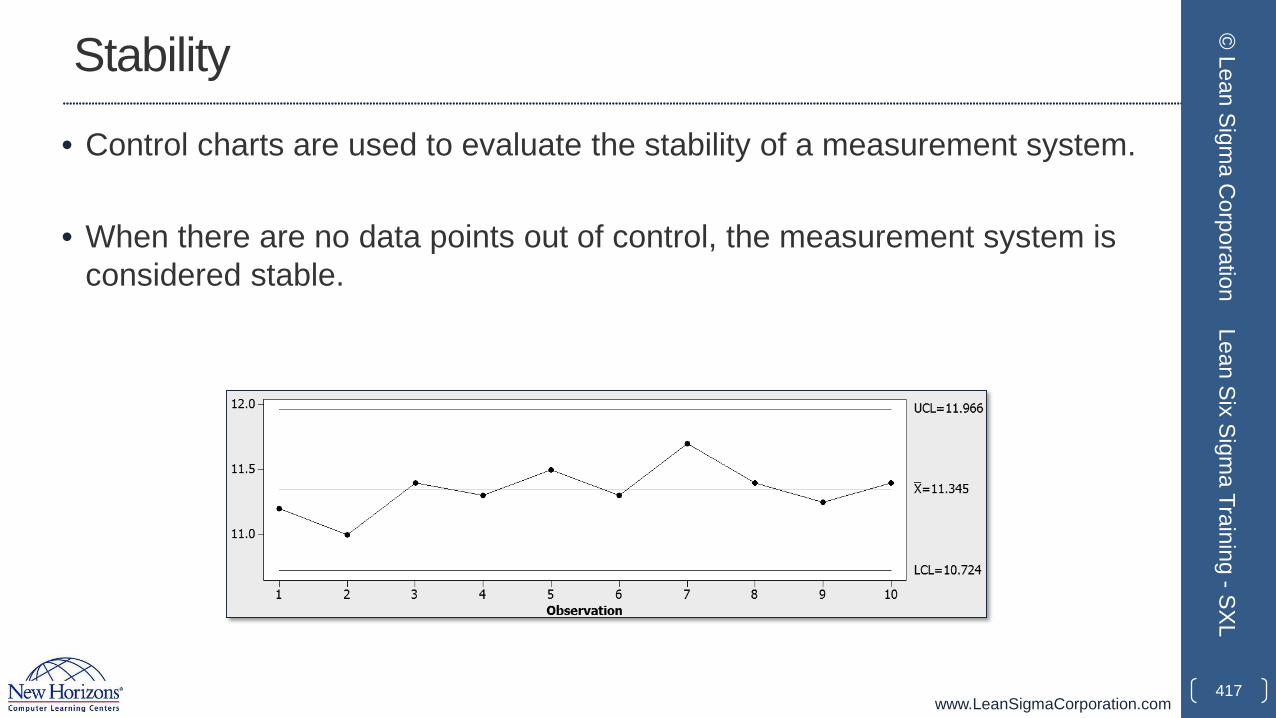
www.LeanSigmaCorporation.com
Stability
• Control charts are used to evaluate the stability of a measurement system.
• When there are no data points out of control, the measurement system is considered stable.
417
© Lean Sigm
a Corporation
Lean Six Sigma Training -SXL
www.LeanSigmaCorporation.com
Stability
• Potential causes of instability:• Inconsistent training for appraisers
• Damaged equipment or instrument
• Worn equipment or instrument
• Measurement instrument not calibrated
• Appraisers do not follow the procedure consistently.
418
© Lean Sigm
a Corporation
Lean Six Sigma Training -SXL
www.LeanSigmaCorporation.com
2.3.3 Gage R&R
419
© Lean Sigm
a Corporation
Lean Six Sigma Training -SXL
www.LeanSigmaCorporation.com
Repeatability
• Repeatability evaluates whether the same appraiser can obtain the same value multiple times when measuring the same object using the same equipment under the same environment.
• It refers to the level of agreement between the repeated measurements of the same appraiser under the same condition.
• Repeatability measures the inherent variation of the measurement instrument.
420
© Lean Sigm
a Corporation
Lean Six Sigma Training -SXL
www.LeanSigmaCorporation.com
Reproducibility
• Reproducibility evaluates whether different appraisers can obtain the same value when measuring the same object independently.
• It refers to the level of agreement between different appraisers.
• It is not caused by the inherent variation of the measurement instrument. It reflects the variability caused by different appraisers, locations, gauges, environments etc.
421
© Lean Sigm
a Corporation
Lean Six Sigma Training -SXL
www.LeanSigmaCorporation.com
Gauge R&R
• Gauge R&R (i.e. Gauge Repeatability & Reproducibility) is a method to analyze the variability of a measurement system by partitioning the variation of the measurements using ANOVA (Analysis of Variance).
• Gauge R&R only addresses the precision of a measurement system.
422
© Lean Sigm
a Corporation
Lean Six Sigma Training -SXL
www.LeanSigmaCorporation.com
Gauge R&R
• Data collection of a gauge R&R study:• let k appraisers measure n random samples independently and repeat the
process p times.
• Different appraisers perform the measurement independently.
• The order of measurement (e.g. sequence of samples and sequence of appraisers) is randomized.
423
© Lean Sigm
a Corporation
Lean Six Sigma Training -SXL
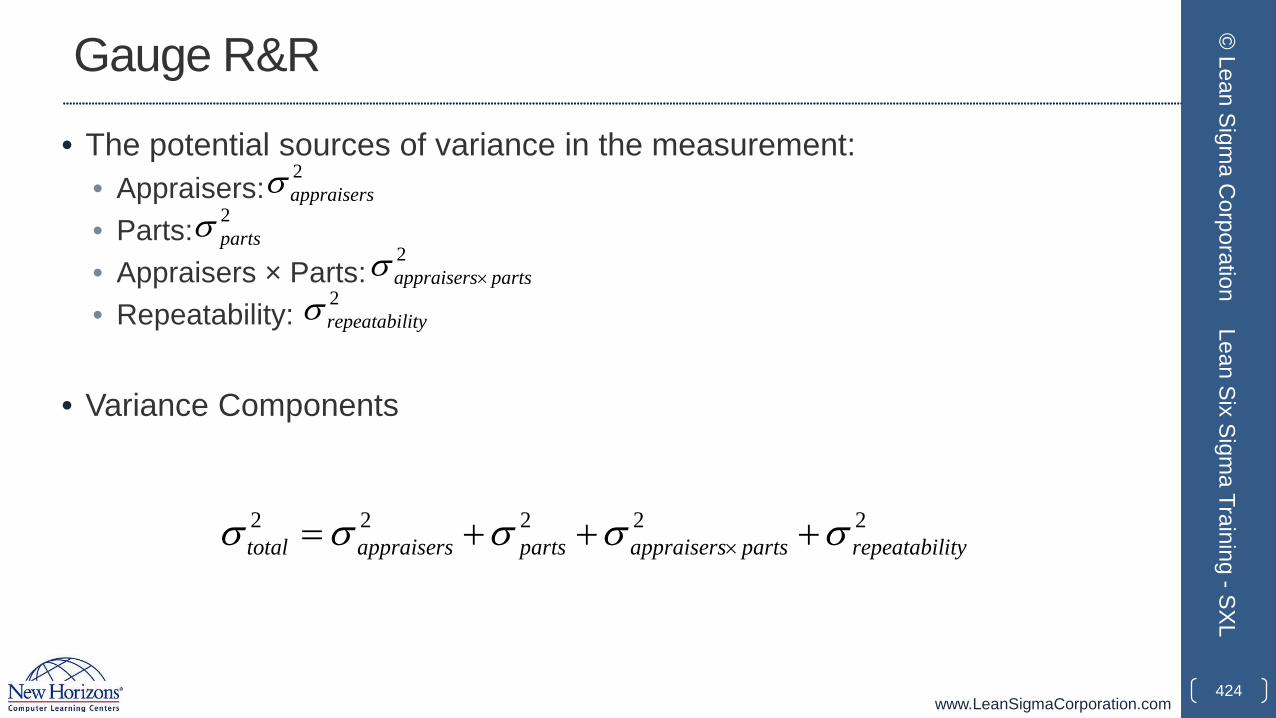
www.LeanSigmaCorporation.com
Gauge R&R
• The potential sources of variance in the measurement:• Appraisers:• Parts: • Appraisers × Parts:• Repeatability:
• Variance Components
424
© Lean Sigm
a Corporation
Lean Six Sigma Training -SXL
2appraisersσ
2partsσ
2partsappraisers×σ
2ityrepeatabilσ
22222ityrepeatabilpartsappraiserspartsappraiserstotal σσσσσ +++= ×
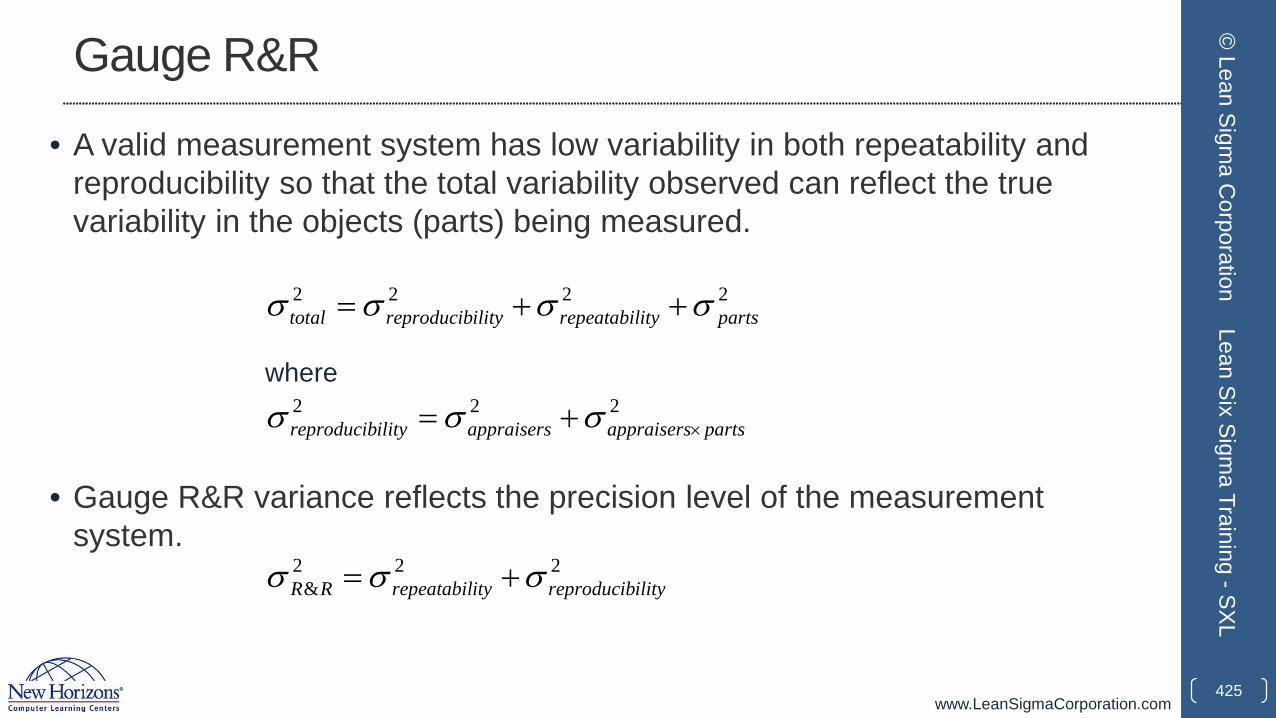
www.LeanSigmaCorporation.com
Gauge R&R
• A valid measurement system has low variability in both repeatability and reproducibility so that the total variability observed can reflect the true variability in the objects (parts) being measured.
• Gauge R&R variance reflects the precision level of the measurement system.
425
© Lean Sigm
a Corporation
Lean Six Sigma Training -SXL
222partsappraisersappraisersilityreproducib ×+= σσσ
2222partsityrepeatabililityreproducibtotal σσσσ ++=
where
222& ilityreproducibityrepeatabilRR σσσ +=
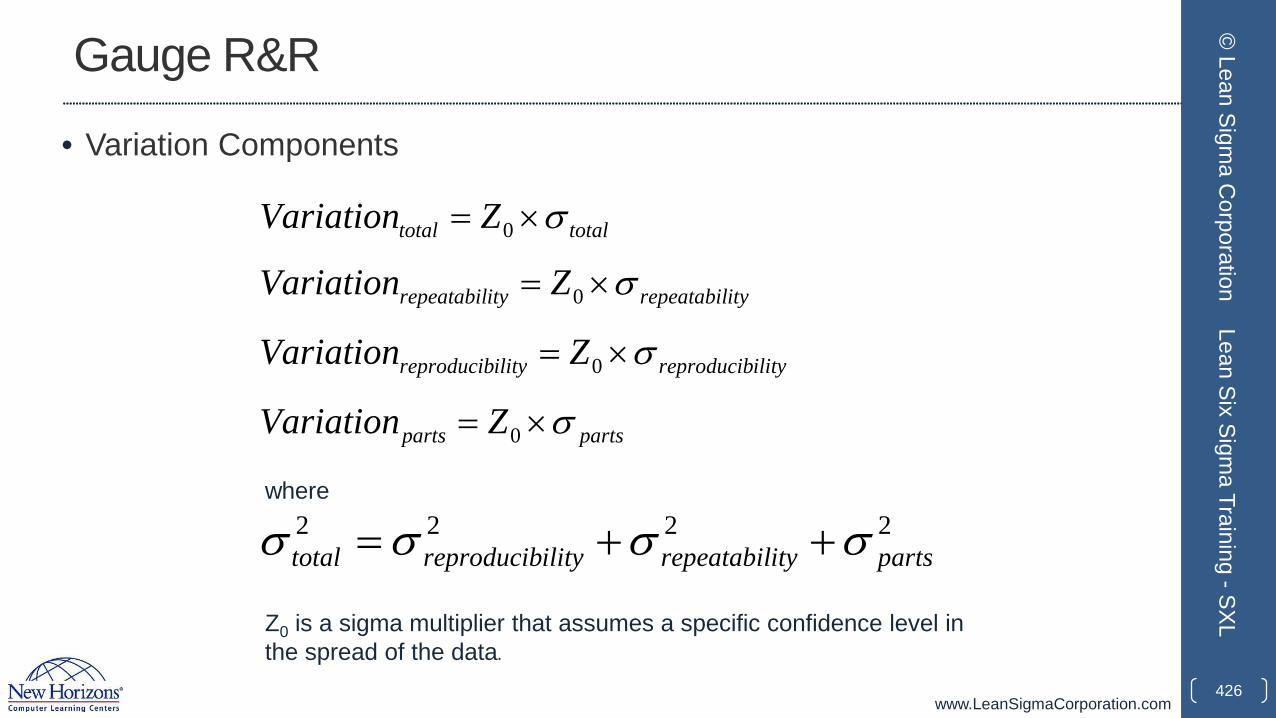
www.LeanSigmaCorporation.com
Gauge R&R
• Variation Components
426
© Lean Sigm
a Corporation
Lean Six Sigma Training -SXL
totaltotal ZVariation σ×= 0
ityrepeatabilityrepeatabil ZVariation σ×= 0
ilityreproducibilityreproducib ZVariation σ×= 0
partsparts ZVariation σ×= 0
where2222partsityrepeatabililityreproducibtotal σσσσ ++=
Z0 is a sigma multiplier that assumes a specific confidence level in the spread of the data.
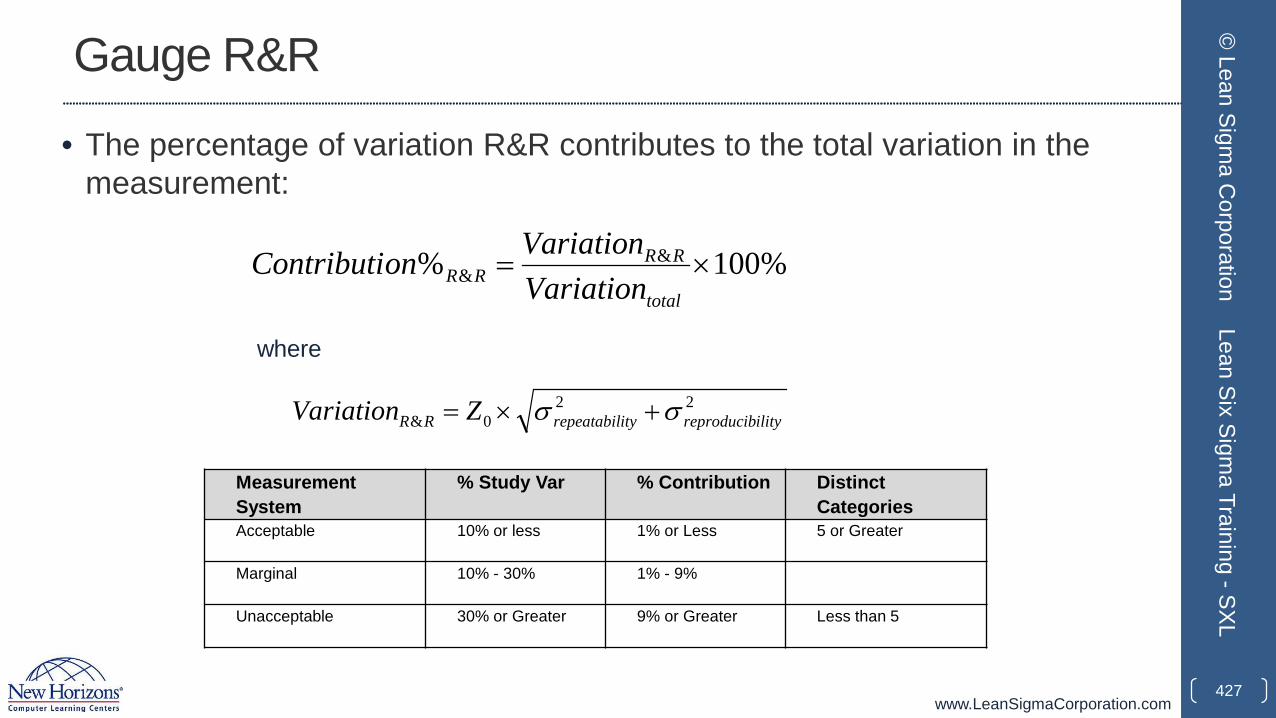
www.LeanSigmaCorporation.com
Gauge R&R
• The percentage of variation R&R contributes to the total variation in the measurement:
427
© Lean Sigm
a Corporation
Lean Six Sigma Training -SXL
%100% && ×=
total
RRRR Variation
VariationonContributi
220& ilityreproducibityrepeatabilRR ZVariation σσ +×=
where
Measurement System
% Study Var % Contribution Distinct Categories
Acceptable 10% or less 1% or Less 5 or Greater
Marginal 10% - 30% 1% - 9%
Unacceptable 30% or Greater 9% or Greater Less than 5
www.LeanSigmaCorporation.com
2.3.4 Variable and Attribute MSA
428
© Lean Sigm
a Corporation
Lean Six Sigma Training -SXL
www.LeanSigmaCorporation.com
Variable Gage R&R• Whenever something is measured repeatedly or by different people or
processes, the results of the measurements will vary. Variation comes from two primary sources: 1. Differences between the parts being measured
2. The measurement system.
• We can use a gage R&R to conduct a measurement system analysis to determine what portion of the variability comes from the parts and what portion comes from the measurement system.
• There are key study results that help us determine the components of variation within our measurement system.
429
© Lean Sigm
a Corporation
Lean Six Sigma Training -SXL
www.LeanSigmaCorporation.com
Key Measures of a Variable Gage R&R• %Contribution: The percent of contribution for a source is 100 times the variance
component for that source divided by the total variation.
• %Study Var (6*SD): The percent of study variation for a source is 100 times the study variation for that source divided by the total variation.
• %Tolerance (SV/Tolerance): The percent of spec range taken up by the total width of the distribution of the data based on variation from that source.
• Distinct Categories: The number of distinct categories of parts that the measurement system is able to distinguish. If a measurement system is not capable of distinguishing at least five types of parts, it is probably not adequate.
430
© Lean Sigm
a Corporation
Lean Six Sigma Training -SXL
www.LeanSigmaCorporation.com
Variable Gage R&R Guidelines (AIAG)
• Percent Tolerance and Percent Study Variation• 10% or less – Acceptable• 10% to 30% – Marginal• 30% or greater – Unacceptable
• Percent Contribution• 1% or less – Acceptable• 1% to 9% – Marginal• 9% or greater – Unacceptable
• Distinct Categories• Look for five or more distinct categories to indicate that your measurement
system is acceptable. 431
© Lean Sigm
a Corporation
Lean Six Sigma Training -SXL
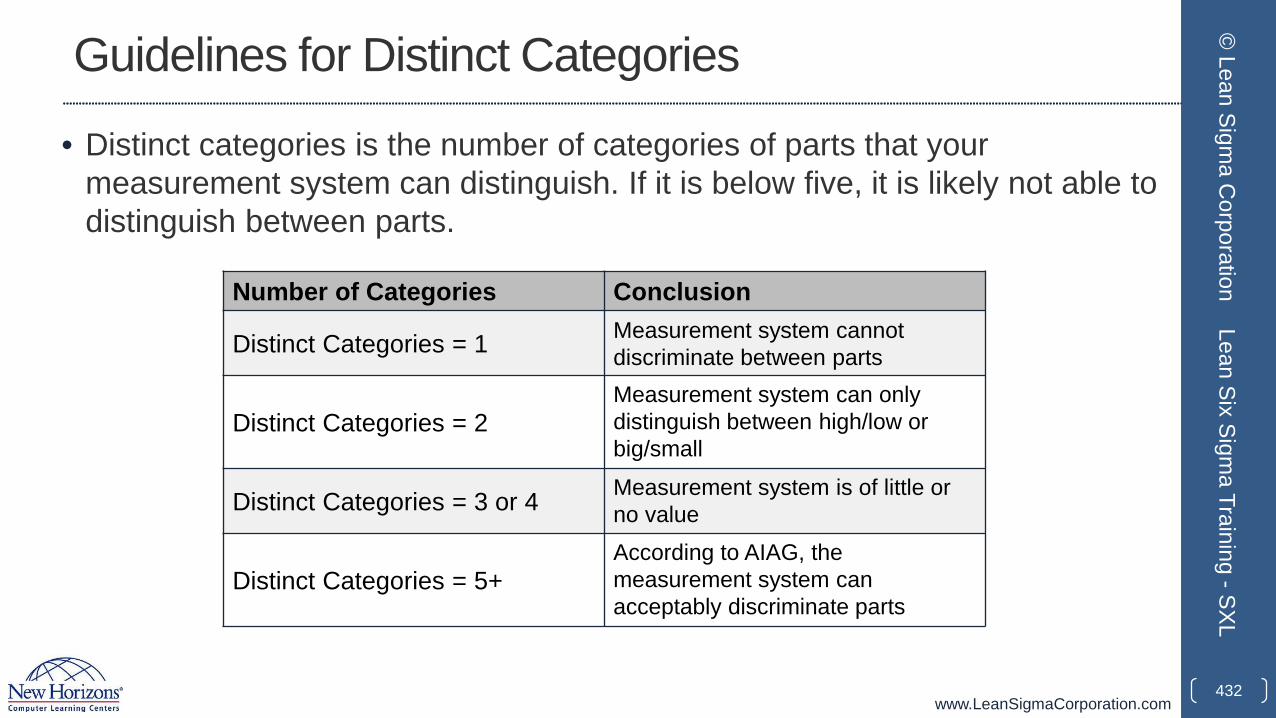
www.LeanSigmaCorporation.com
Number of Categories Conclusion
Distinct Categories = 1 Measurement system cannot discriminate between parts
Distinct Categories = 2Measurement system can only distinguish between high/low or big/small
Distinct Categories = 3 or 4 Measurement system is of little or no value
Distinct Categories = 5+According to AIAG, the measurement system can acceptably discriminate parts
Guidelines for Distinct Categories
• Distinct categories is the number of categories of parts that your measurement system can distinguish. If it is below five, it is likely not able to distinguish between parts.
432
© Lean Sigm
a Corporation
Lean Six Sigma Training -SXL
www.LeanSigmaCorporation.com
Use SigmaXL to Implement a Variable MSA
• Data File: “Variable MSA” tab in “Sample Data.xlsx” (an example in the AIAG MSA Reference Manual, 3rd Edition)
• Step 1: Initiate the MSA study• Click on SigmaXL -> Measurement Systems Analysis -> Create Gauge R&R
(Crossed) Worksheet• A new window named “Create Gauge R&R (Crossed) Worksheet” appears• Enter 10 as the “Number of Parts/Samples”• Enter 3 as the “Number of Operators/Appraisers”• Enter 3 as the “Number of Replicates/Trials”• Uncheck the checkboxes for both “Randomize Parts/Sample” and “Randomize
Operators/Appraisers”• Click “OK>>”• A new tab named “Gage R&R (Crossed) WKS” is generated.
433
© Lean Sigm
a Corporation
Lean Six Sigma Training -SXL
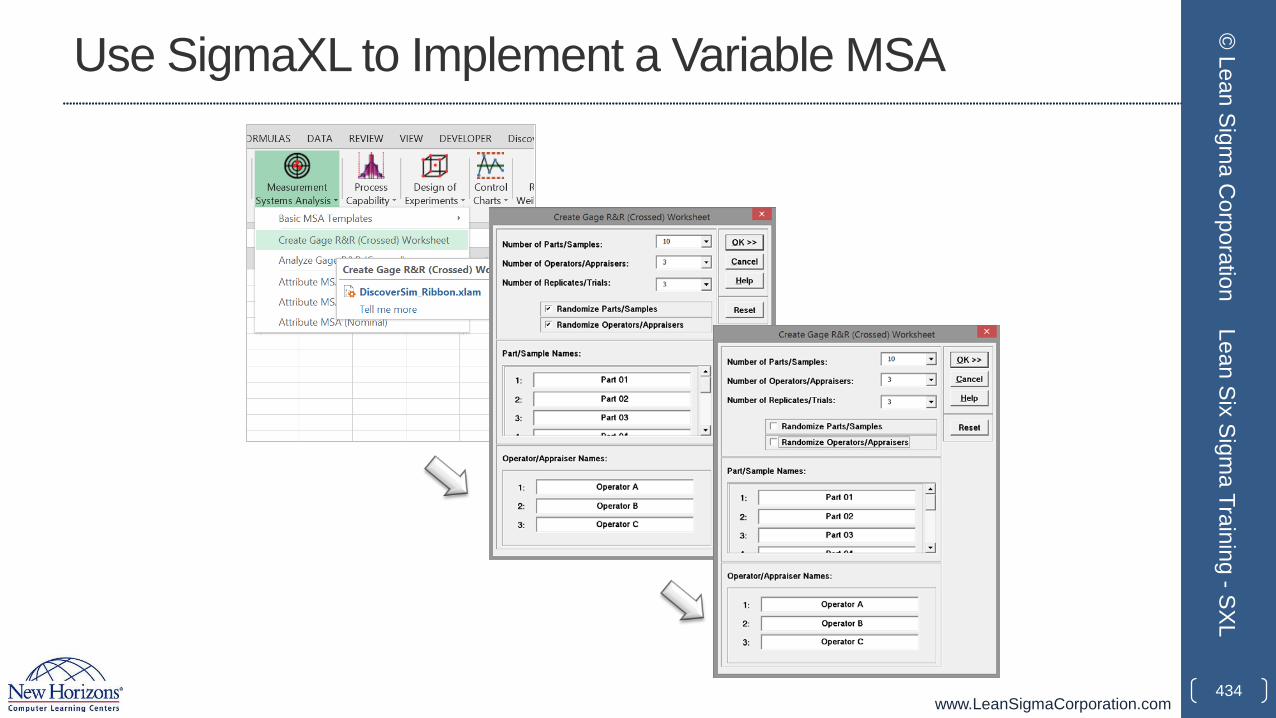
www.LeanSigmaCorporation.com
Use SigmaXL to Implement a Variable MSA
434
© Lean Sigm
a Corporation
Lean Six Sigma Training -SXL
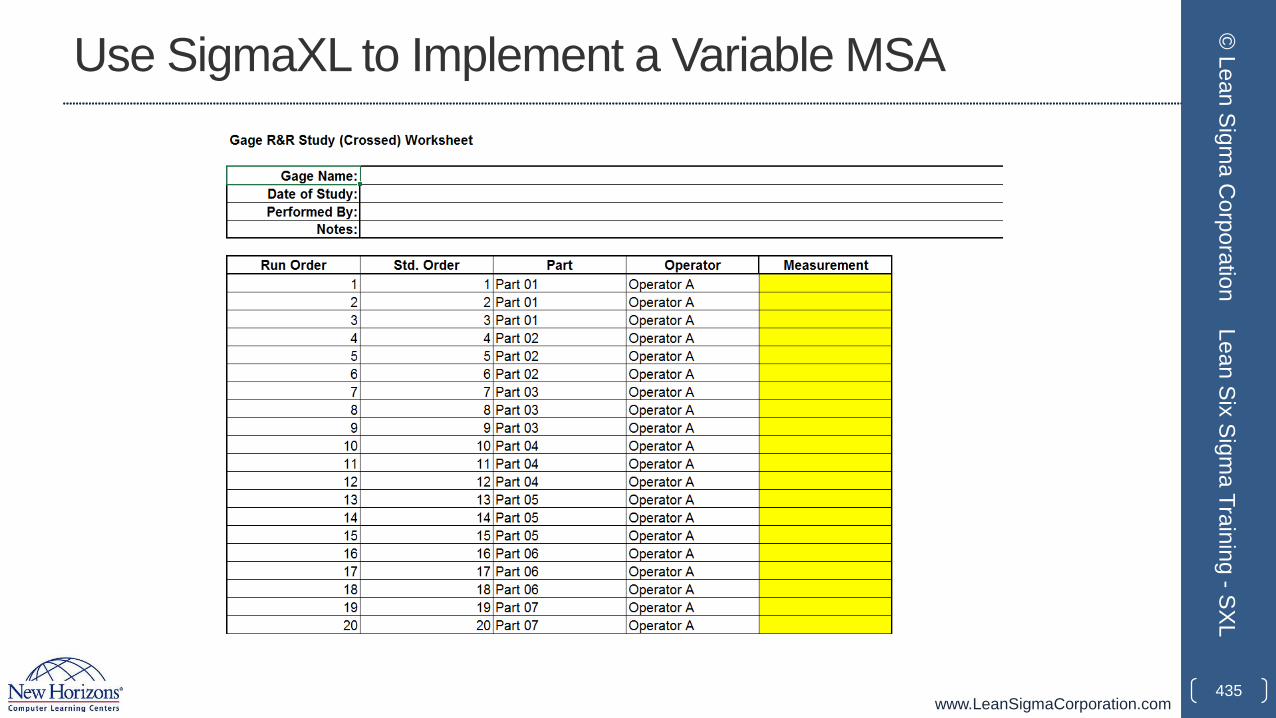
www.LeanSigmaCorporation.com
Use SigmaXL to Implement a Variable MSA
435
© Lean Sigm
a Corporation
Lean Six Sigma Training -SXL
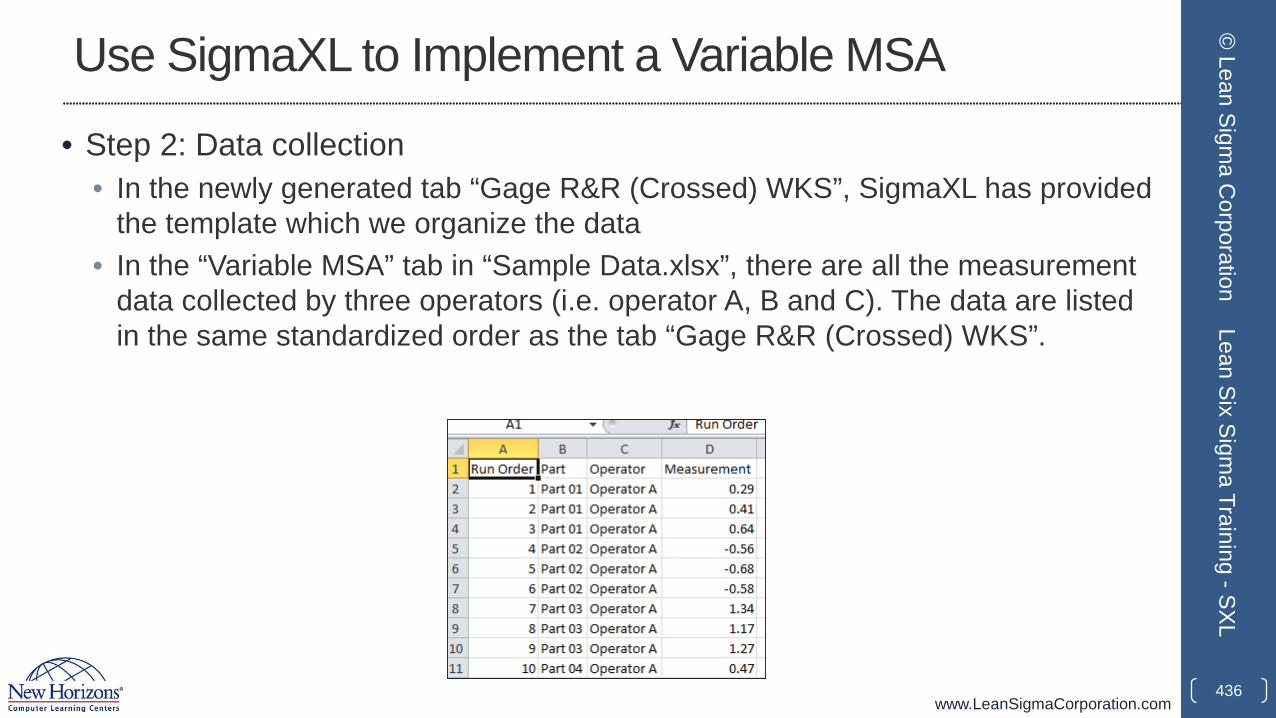
www.LeanSigmaCorporation.com
Use SigmaXL to Implement a Variable MSA
• Step 2: Data collection• In the newly generated tab “Gage R&R (Crossed) WKS”, SigmaXL has provided
the template which we organize the data• In the “Variable MSA” tab in “Sample Data.xlsx”, there are all the measurement
data collected by three operators (i.e. operator A, B and C). The data are listed in the same standardized order as the tab “Gage R&R (Crossed) WKS”.
436
© Lean Sigm
a Corporation
Lean Six Sigma Training -SXL
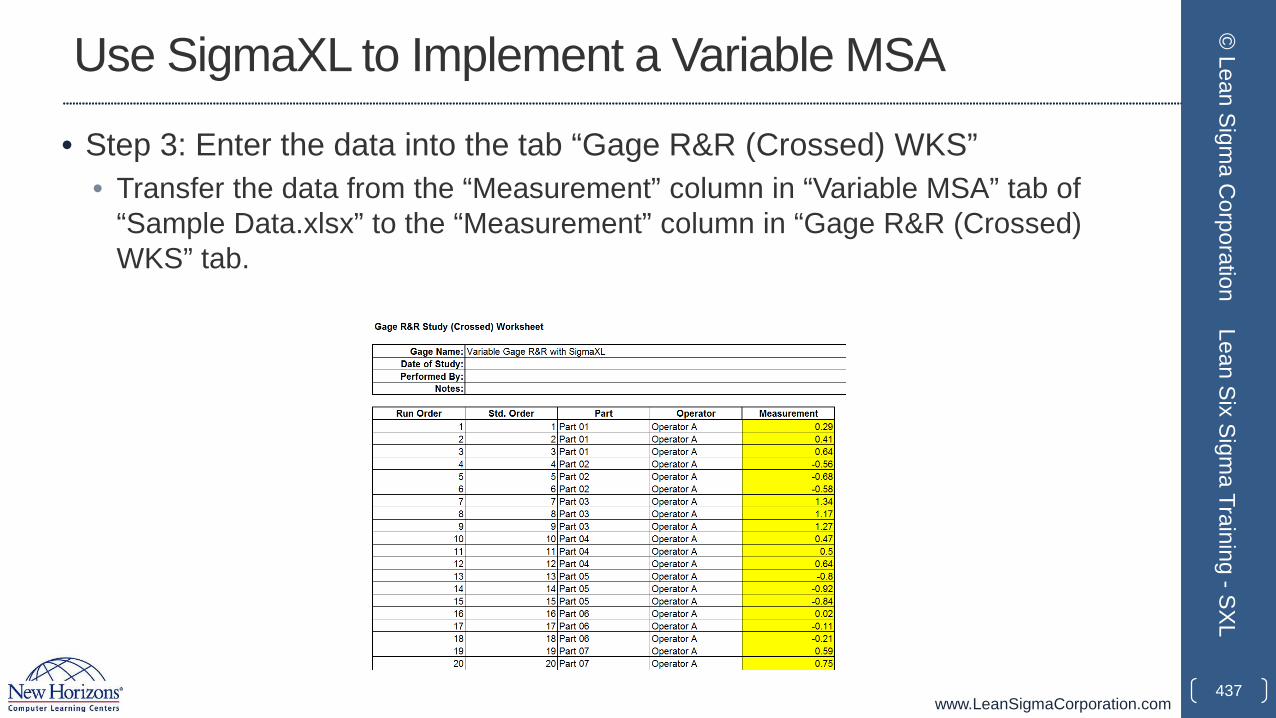
www.LeanSigmaCorporation.com
Use SigmaXL to Implement a Variable MSA
• Step 3: Enter the data into the tab “Gage R&R (Crossed) WKS”• Transfer the data from the “Measurement” column in “Variable MSA” tab of
“Sample Data.xlsx” to the “Measurement” column in “Gage R&R (Crossed) WKS” tab.
437
© Lean Sigm
a Corporation
Lean Six Sigma Training -SXL
www.LeanSigmaCorporation.com
Use SigmaXL to Implement a Variable MSA
• Step 4: Implement Gauge R&R• Click SigmaXL -> Measurement Systems Analysis -> Analyze Gage R&R
(Crossed)• A new window named “Analyze Gage R&R (Crossed)” appears with the data
range automatically selected in the box right below “Please select your data”• Click “Next>>”• A new window also named “Analyze Gauge R&R (Crossed)” pops up.• Select “Part” column as “Part”• Select “Operator” column as “Operator”• Select “Measurement” column as “Measurement”• Enter 5.15 as the “Standard Deviation Multiplier” and enter 95% as the
“Confidence Level”.• Click “OK”• A new tab named “Analyze Gage R&R (1)” appears automatically.
438
© Lean Sigm
a Corporation
Lean Six Sigma Training -SXL
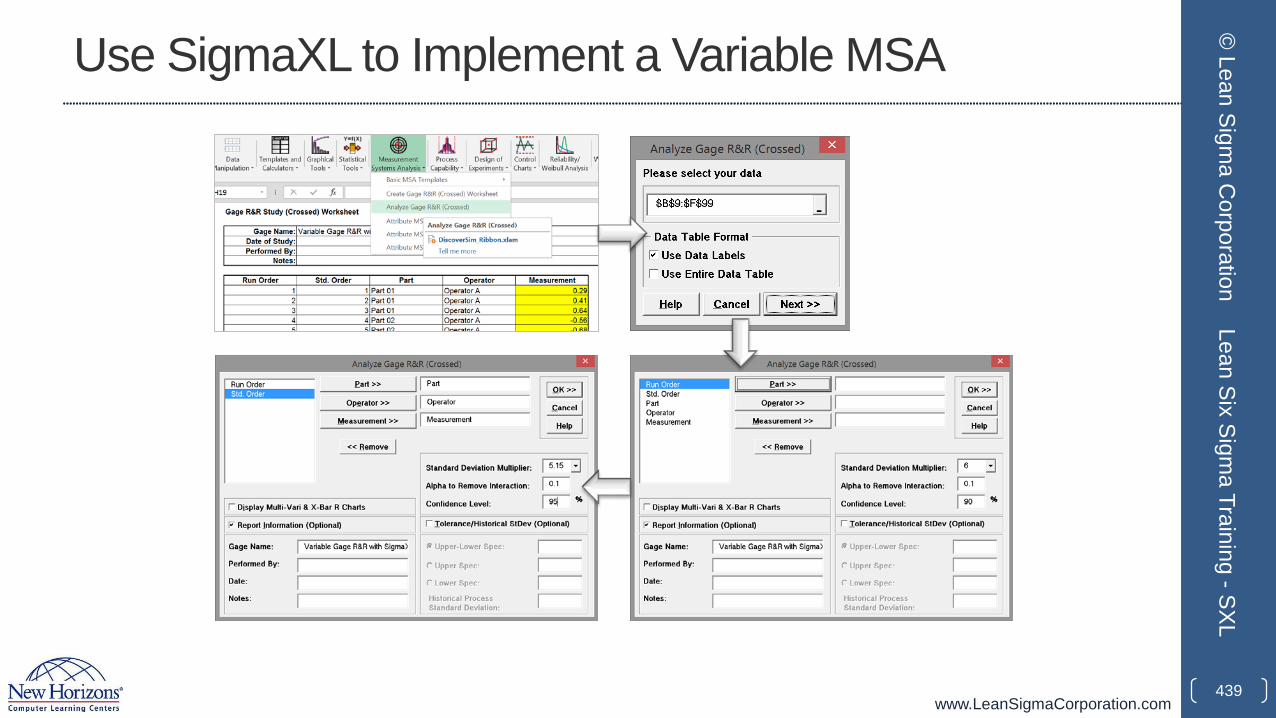
www.LeanSigmaCorporation.com
Use SigmaXL to Implement a Variable MSA
439
© Lean Sigm
a Corporation
Lean Six Sigma Training -SXL
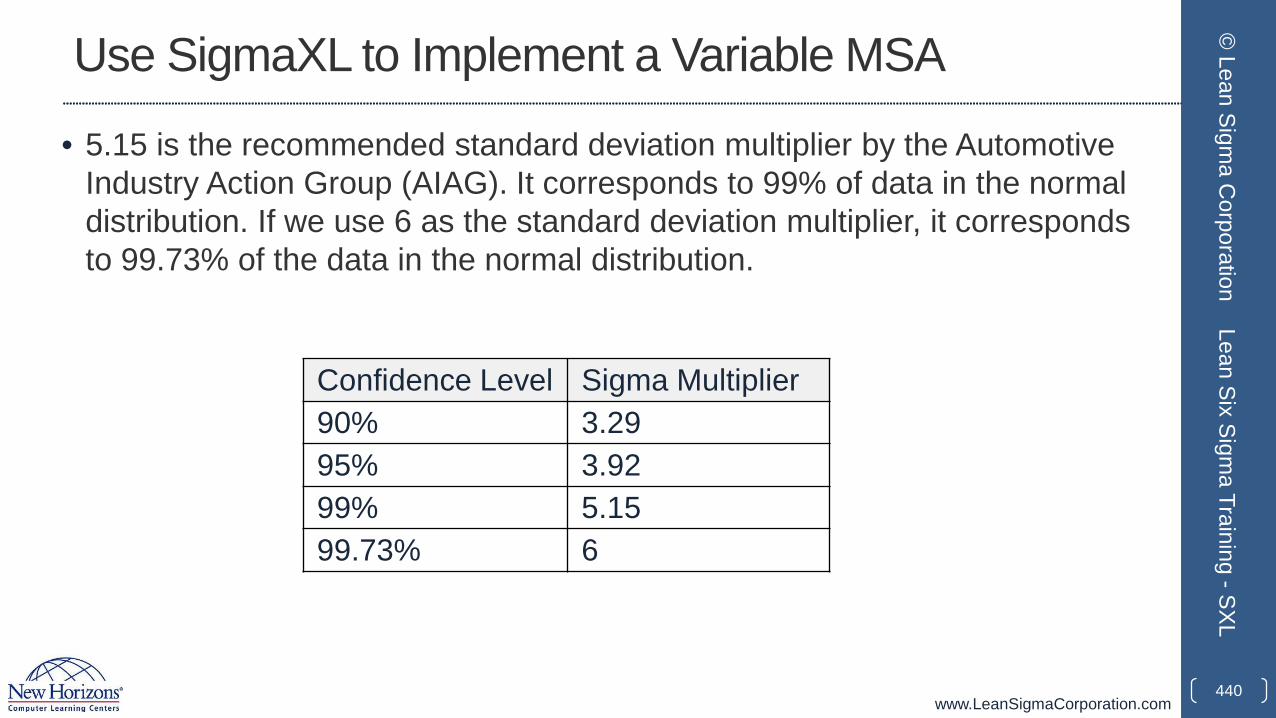
www.LeanSigmaCorporation.com
Use SigmaXL to Implement a Variable MSA
• 5.15 is the recommended standard deviation multiplier by the Automotive Industry Action Group (AIAG). It corresponds to 99% of data in the normal distribution. If we use 6 as the standard deviation multiplier, it corresponds to 99.73% of the data in the normal distribution.
440
© Lean Sigm
a Corporation
Lean Six Sigma Training -SXL
Confidence Level Sigma Multiplier90% 3.2995% 3.9299% 5.1599.73% 6
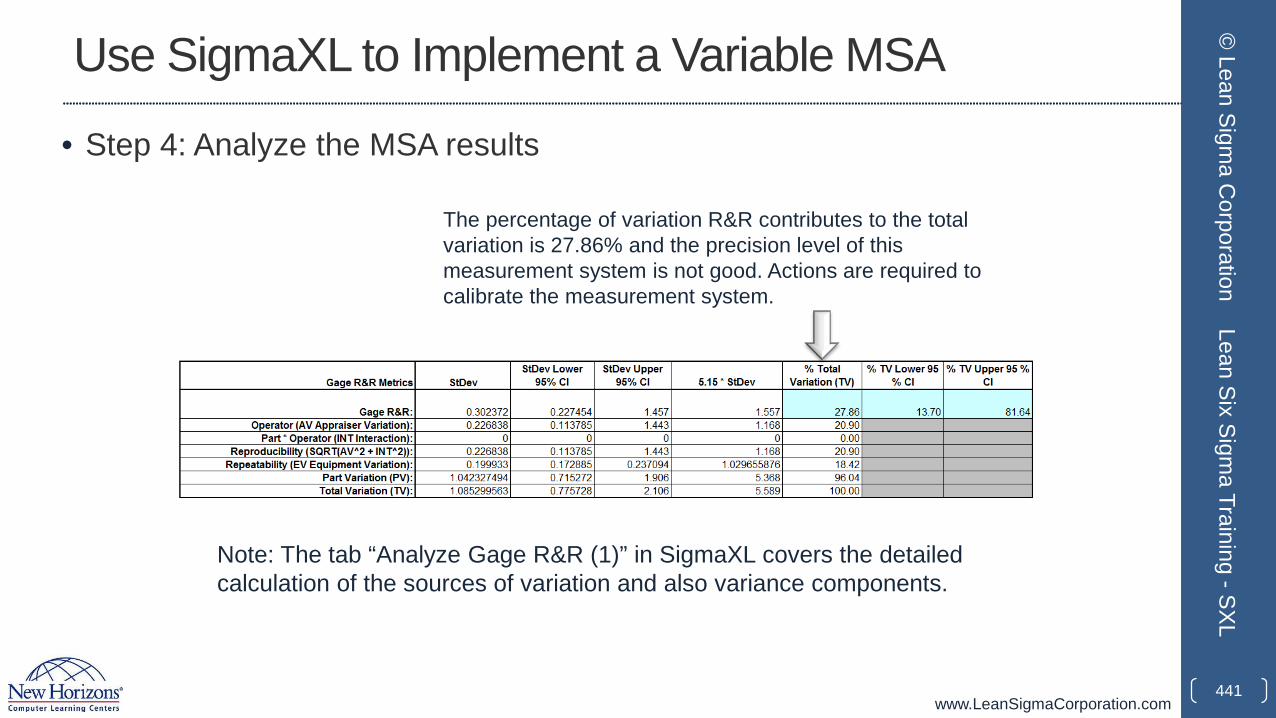
www.LeanSigmaCorporation.com
Use SigmaXL to Implement a Variable MSA
• Step 4: Analyze the MSA results
441
© Lean Sigm
a Corporation
Lean Six Sigma Training -SXL
The percentage of variation R&R contributes to the total variation is 27.86% and the precision level of this measurement system is not good. Actions are required to calibrate the measurement system.
Note: The tab “Analyze Gage R&R (1)” in SigmaXL covers the detailed calculation of the sources of variation and also variance components.
www.LeanSigmaCorporation.com
Use SigmaXL to Implement an Attribute MSA
• Data File: “Attribute MSA” tab in “Sample Data.xlsx” (an example in the AIAG MSA Reference Manual, 3rd Edition)
• Steps in SigmaXL to run an attribute MSA
442
© Lean Sigm
a Corporation
Lean Six Sigma Training -SXL
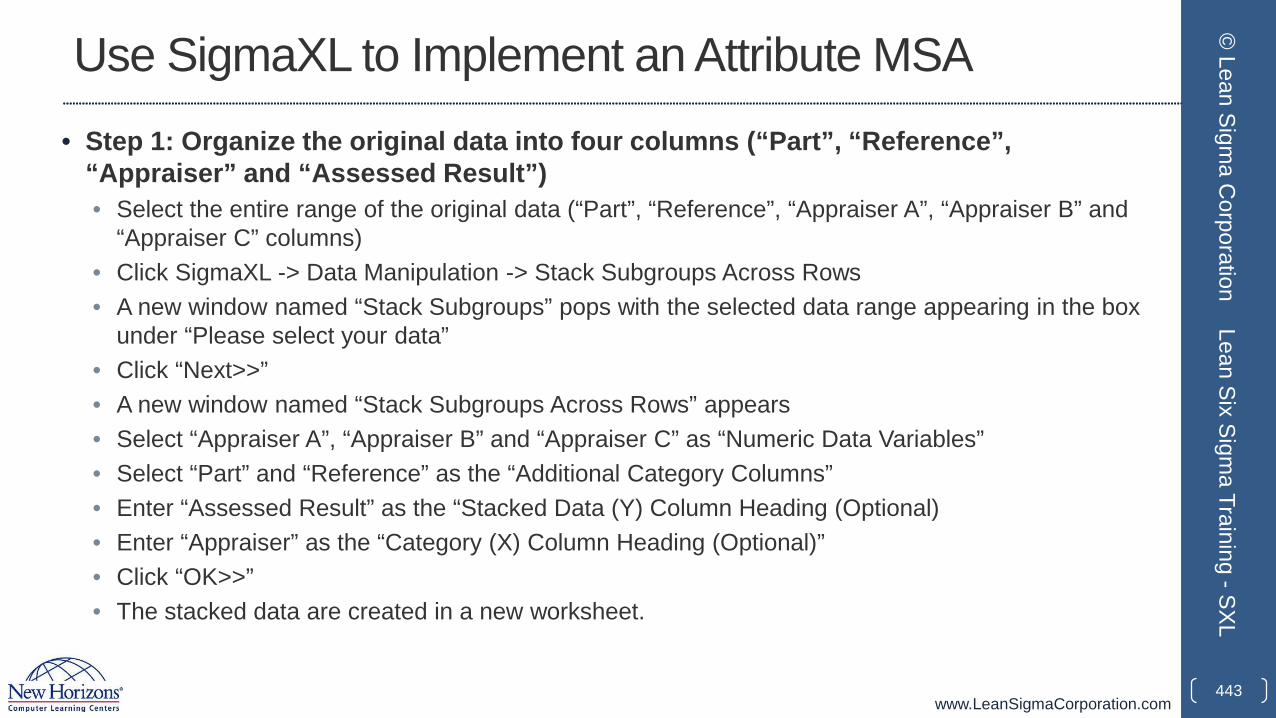
www.LeanSigmaCorporation.com
Use SigmaXL to Implement an Attribute MSA• Step 1: Organize the original data into four columns (“Part”, “Reference”,
“Appraiser” and “Assessed Result”)• Select the entire range of the original data (“Part”, “Reference”, “Appraiser A”, “Appraiser B” and
“Appraiser C” columns)• Click SigmaXL -> Data Manipulation -> Stack Subgroups Across Rows• A new window named “Stack Subgroups” pops with the selected data range appearing in the box
under “Please select your data”• Click “Next>>”• A new window named “Stack Subgroups Across Rows” appears• Select “Appraiser A”, “Appraiser B” and “Appraiser C” as “Numeric Data Variables”• Select “Part” and “Reference” as the “Additional Category Columns”• Enter “Assessed Result” as the “Stacked Data (Y) Column Heading (Optional)• Enter “Appraiser” as the “Category (X) Column Heading (Optional)”• Click “OK>>”• The stacked data are created in a new worksheet.
443
© Lean Sigm
a Corporation
Lean Six Sigma Training -SXL
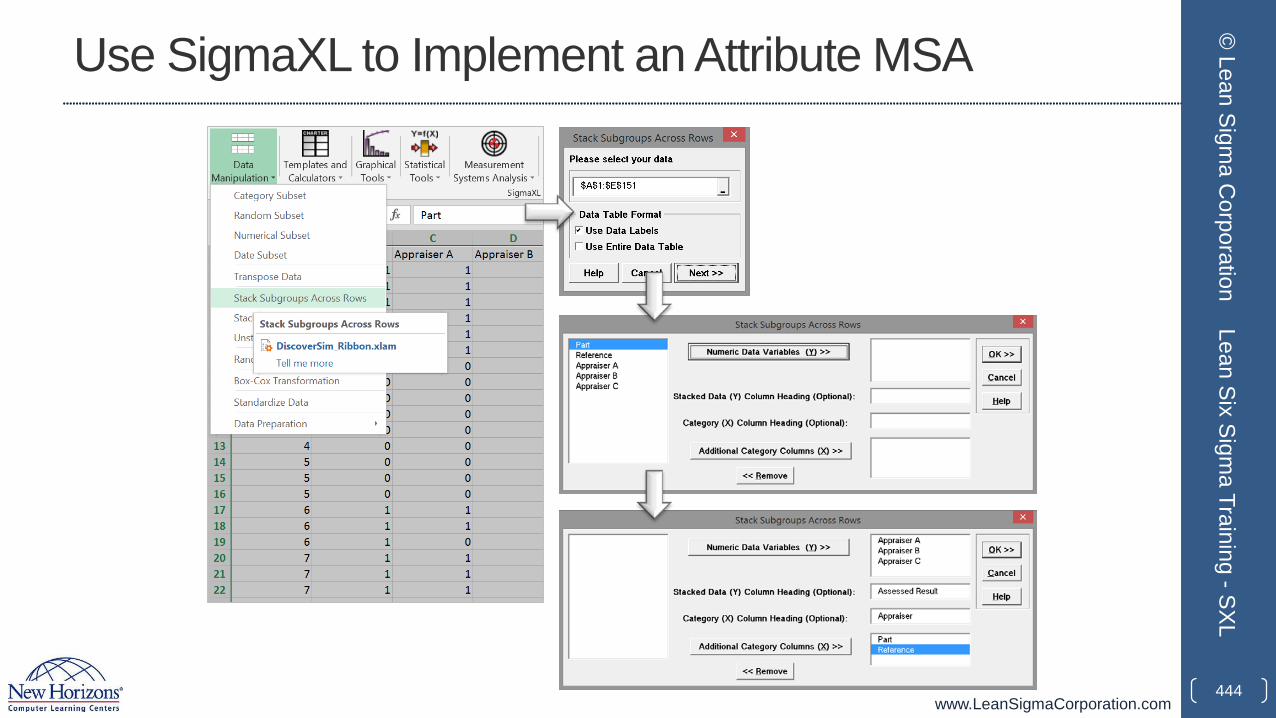
www.LeanSigmaCorporation.com
Use SigmaXL to Implement an Attribute MSA
444
© Lean Sigm
a Corporation
Lean Six Sigma Training -SXL
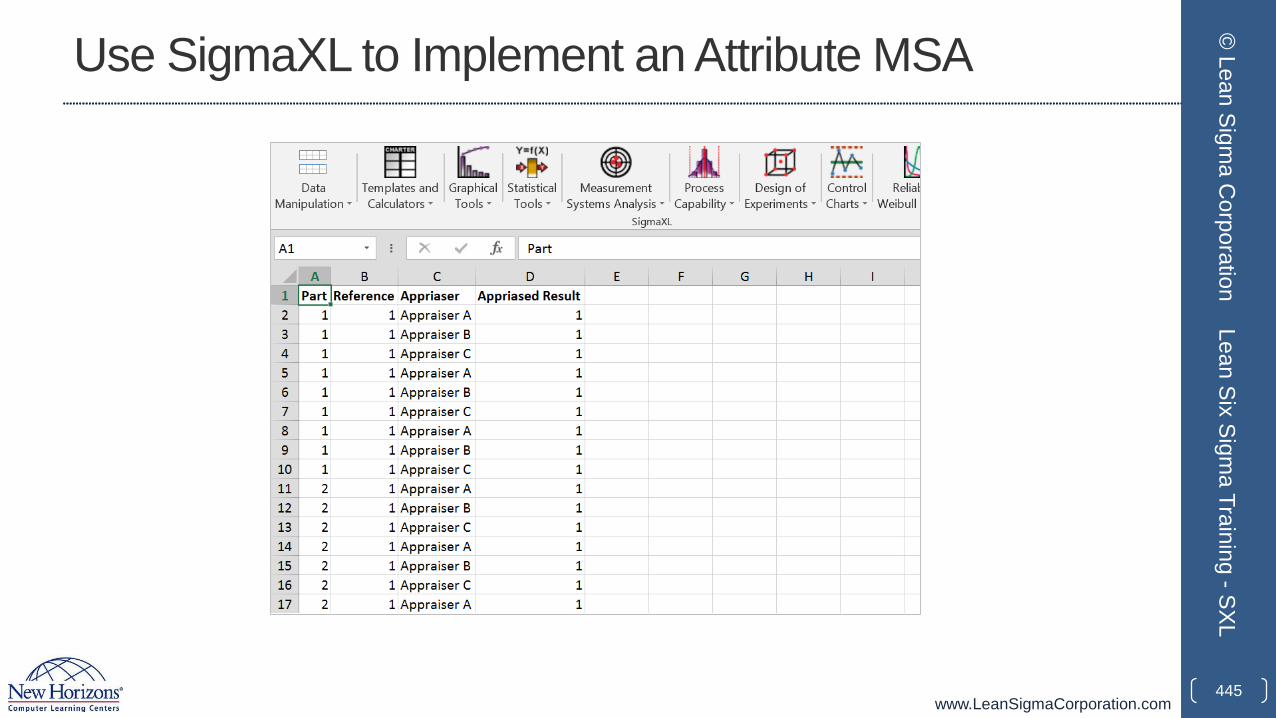
www.LeanSigmaCorporation.com
Use SigmaXL to Implement an Attribute MSA
445
© Lean Sigm
a Corporation
Lean Six Sigma Training -SXL
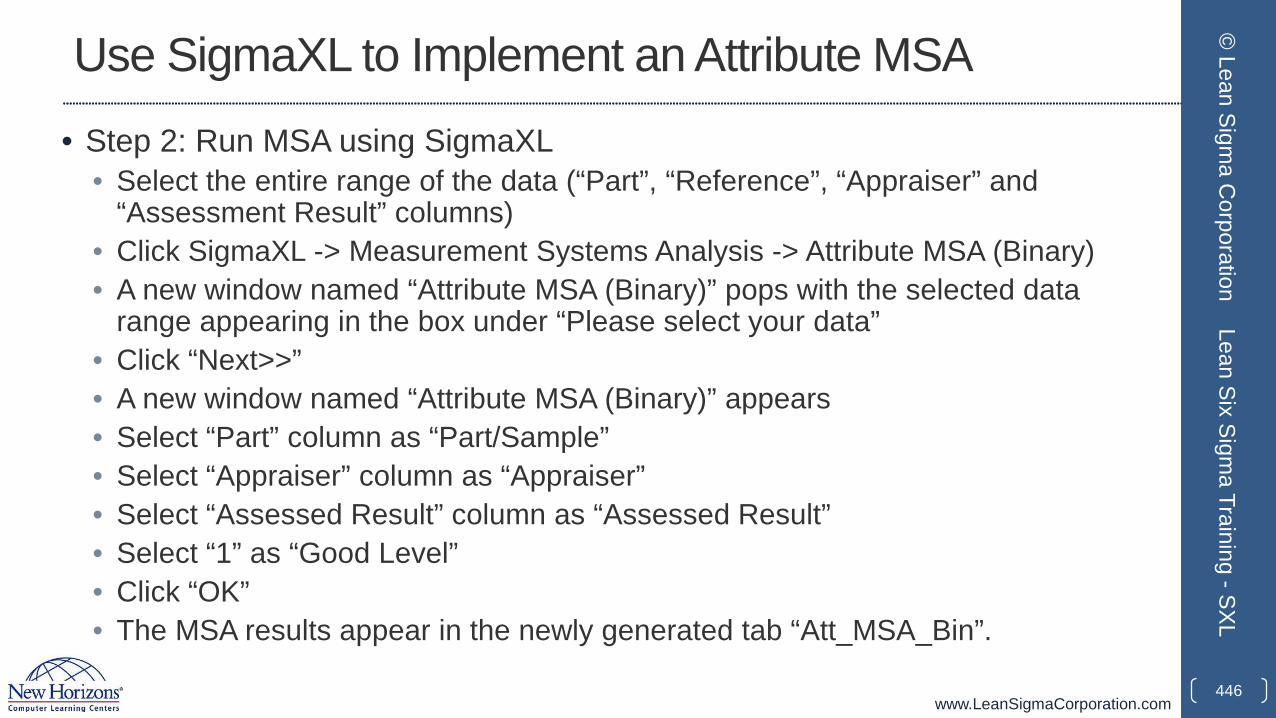
www.LeanSigmaCorporation.com
Use SigmaXL to Implement an Attribute MSA• Step 2: Run MSA using SigmaXL
• Select the entire range of the data (“Part”, “Reference”, “Appraiser” and “Assessment Result” columns)
• Click SigmaXL -> Measurement Systems Analysis -> Attribute MSA (Binary)• A new window named “Attribute MSA (Binary)” pops with the selected data
range appearing in the box under “Please select your data”• Click “Next>>”• A new window named “Attribute MSA (Binary)” appears• Select “Part” column as “Part/Sample”• Select “Appraiser” column as “Appraiser”• Select “Assessed Result” column as “Assessed Result”• Select “1” as “Good Level”• Click “OK”• The MSA results appear in the newly generated tab “Att_MSA_Bin”.
446
© Lean Sigm
a Corporation
Lean Six Sigma Training -SXL
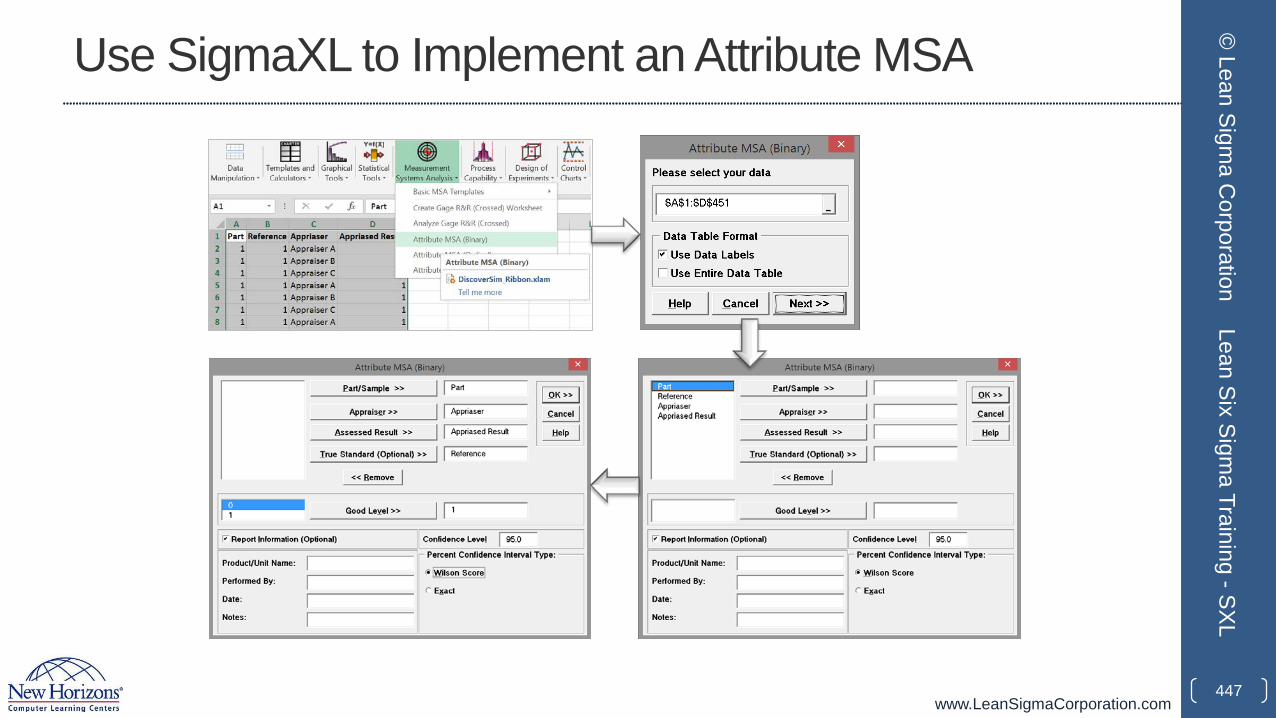
www.LeanSigmaCorporation.com
Use SigmaXL to Implement an Attribute MSA
447
© Lean Sigm
a Corporation
Lean Six Sigma Training -SXL
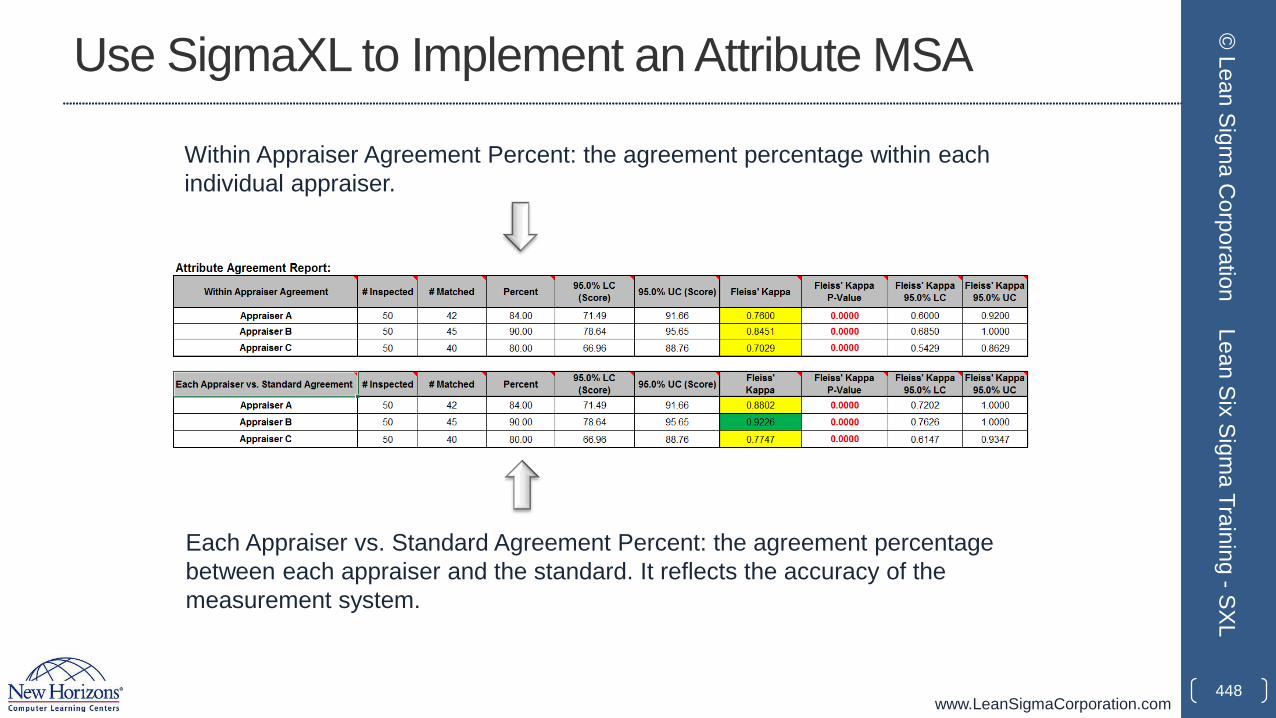
www.LeanSigmaCorporation.com
Use SigmaXL to Implement an Attribute MSA
448
© Lean Sigm
a Corporation
Lean Six Sigma Training -SXL
Within Appraiser Agreement Percent: the agreement percentage within each individual appraiser.
Each Appraiser vs. Standard Agreement Percent: the agreement percentage between each appraiser and the standard. It reflects the accuracy of the measurement system.
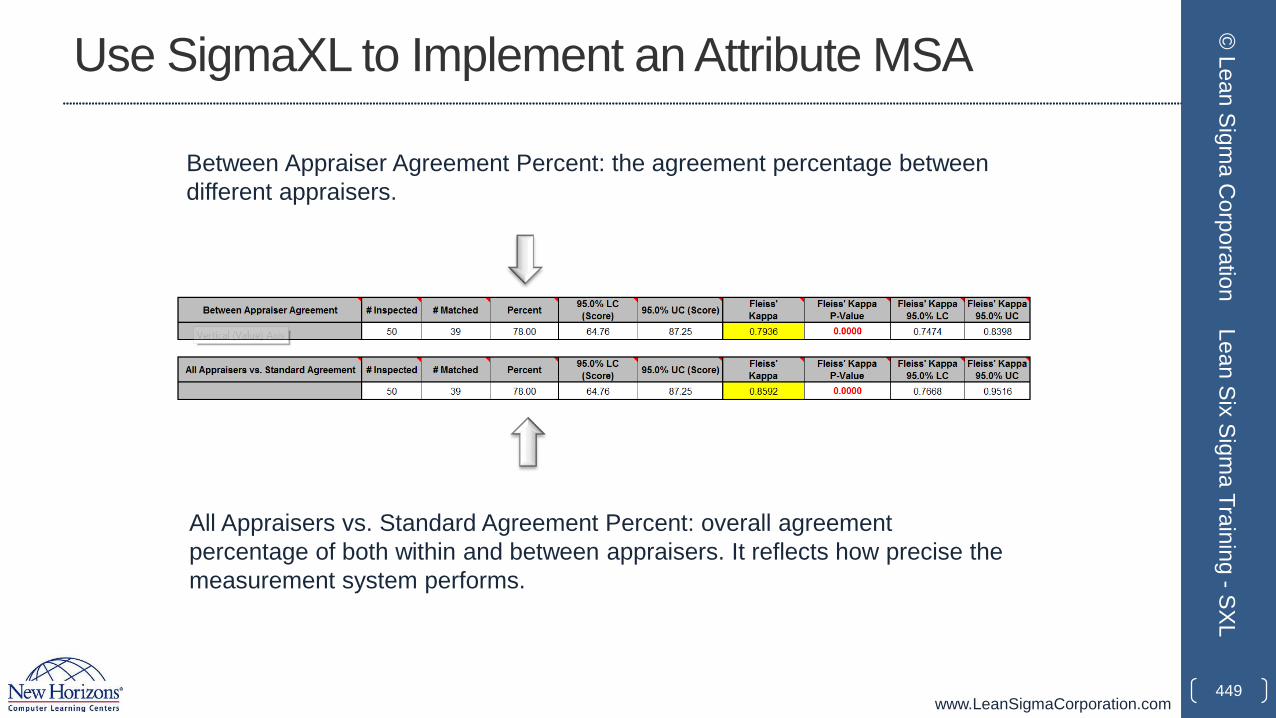
www.LeanSigmaCorporation.com
Use SigmaXL to Implement an Attribute MSA
449
© Lean Sigm
a Corporation
Lean Six Sigma Training -SXL
Between Appraiser Agreement Percent: the agreement percentage between different appraisers.
All Appraisers vs. Standard Agreement Percent: overall agreement percentage of both within and between appraisers. It reflects how precise the measurement system performs.
www.LeanSigmaCorporation.com
Use SigmaXL to Implement an Attribute MSA
• Kappa statistic is a coefficient indicating the agreement percentage above the expected agreement by chance.
• Kappa ranges from -1 (perfect disagreement) to 1 (perfect agreement). • When the observed agreement is less than the chance agreement, Kappa
is negative.• When the observed agreement is greater than the chance agreement,
kappa is positive.• Rule of Thumb: If Kappa is greater than 0.7, the measurement system is
acceptable. If Kappa is greater than 0.9, the measurement system is excellent.
450
© Lean Sigm
a Corporation
Lean Six Sigma Training -SXL
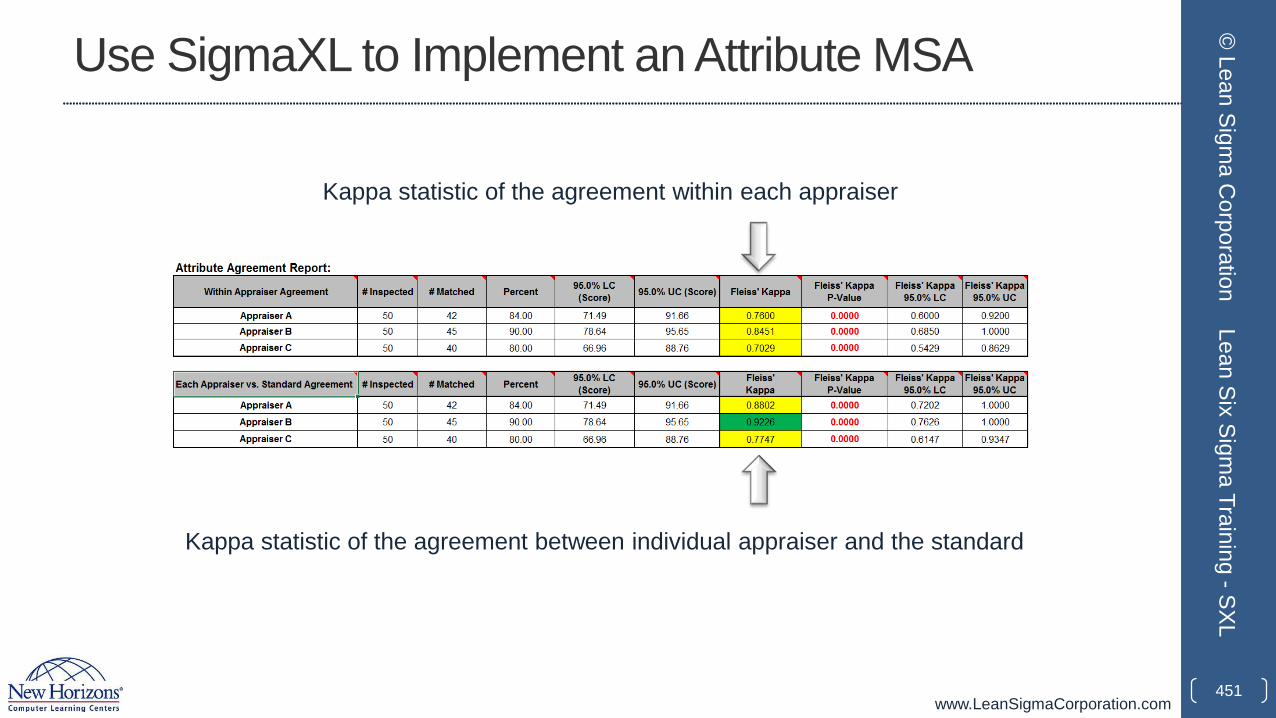
www.LeanSigmaCorporation.com
Use SigmaXL to Implement an Attribute MSA
451
© Lean Sigm
a Corporation
Lean Six Sigma Training -SXL
Kappa statistic of the agreement within each appraiser
Kappa statistic of the agreement between individual appraiser and the standard
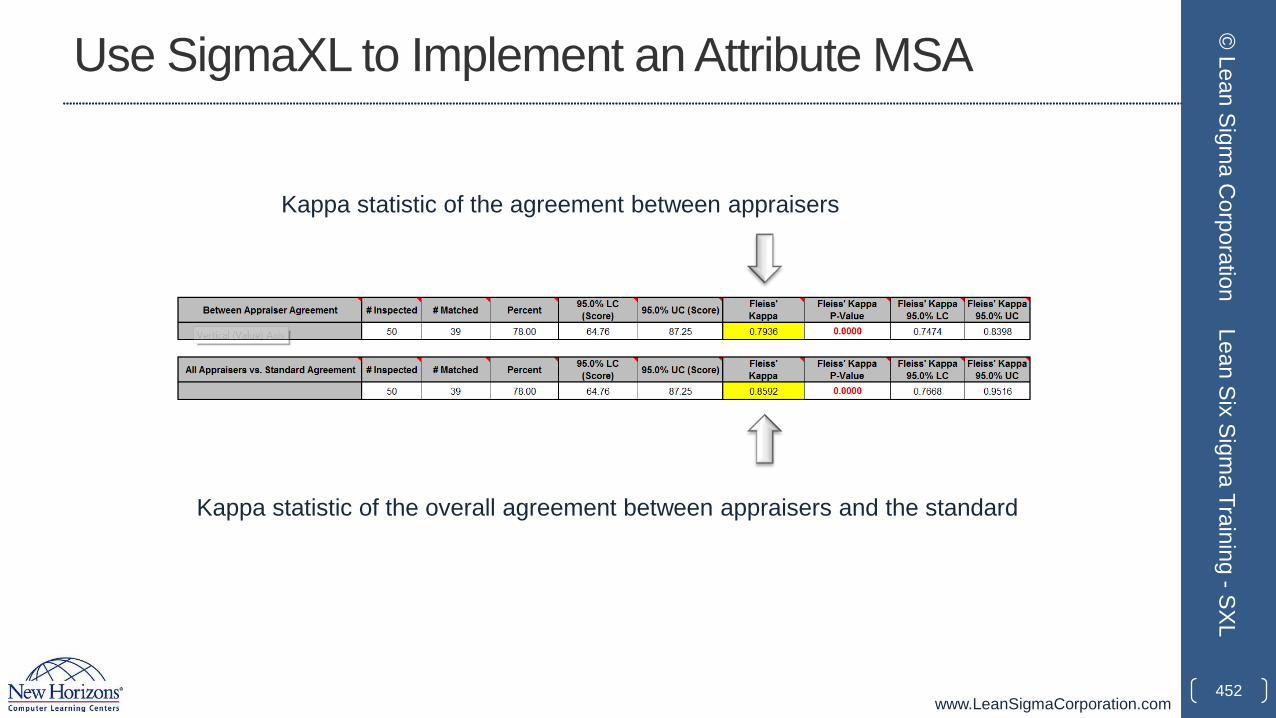
www.LeanSigmaCorporation.com
Use SigmaXL to Implement an Attribute MSA
452
© Lean Sigm
a Corporation
Lean Six Sigma Training -SXL
Kappa statistic of the agreement between appraisers
Kappa statistic of the overall agreement between appraisers and the standard
www.LeanSigmaCorporation.com
2.4 Process Capability
453
© Lean Sigm
a Corporation
Lean Six Sigma Training -SXL
www.LeanSigmaCorporation.com
Yellow Belt Training: Measure Phase2.1 Process Definition
2.1.1 Cause and Effect Diagrams2.1.2 Cause and Effects Matrix2.1.3 Process Mapping2.1.4 FMEA: Failure Modes and Effects Analysis2.1.5 Theory of Constraints
2.2 Six Sigma Statistics2.2.1 Basic Statistics2.2.2 Descriptive Statistics2.2.3 Distributions and Normality2.2.4 Graphical Analysis
2.3 Measurement System Analysis2.3.1 Precision and Accuracy2.3.2 Bias, Linearity, and Stability2.3.3 Gage R&R2.3.4 Variable and Attribute MSA
2.4 Process Capability2.4.1 Capability Analysis2.4.2 Concept of Stability2.4.3 Attribute and Discrete Capability2.4.4 Monitoring Techniques
454
© Lean Sigm
a Corporation
Lean Six Sigma Training -SXL
www.LeanSigmaCorporation.com
2.4.1 Capability Analysis
455
© Lean Sigm
a Corporation
Lean Six Sigma Training -SXL
www.LeanSigmaCorporation.com
What is Process Capability?
• The process capability measures how well the process performs to meet given specified outcome.
• It indicates the conformance of a process to meet given requirements or specifications.
• Capability analysis helps to better understand the performance of the process with respect to meeting customer’s specifications and identify the process improvement opportunities.
456
© Lean Sigm
a Corporation
Lean Six Sigma Training -SXL
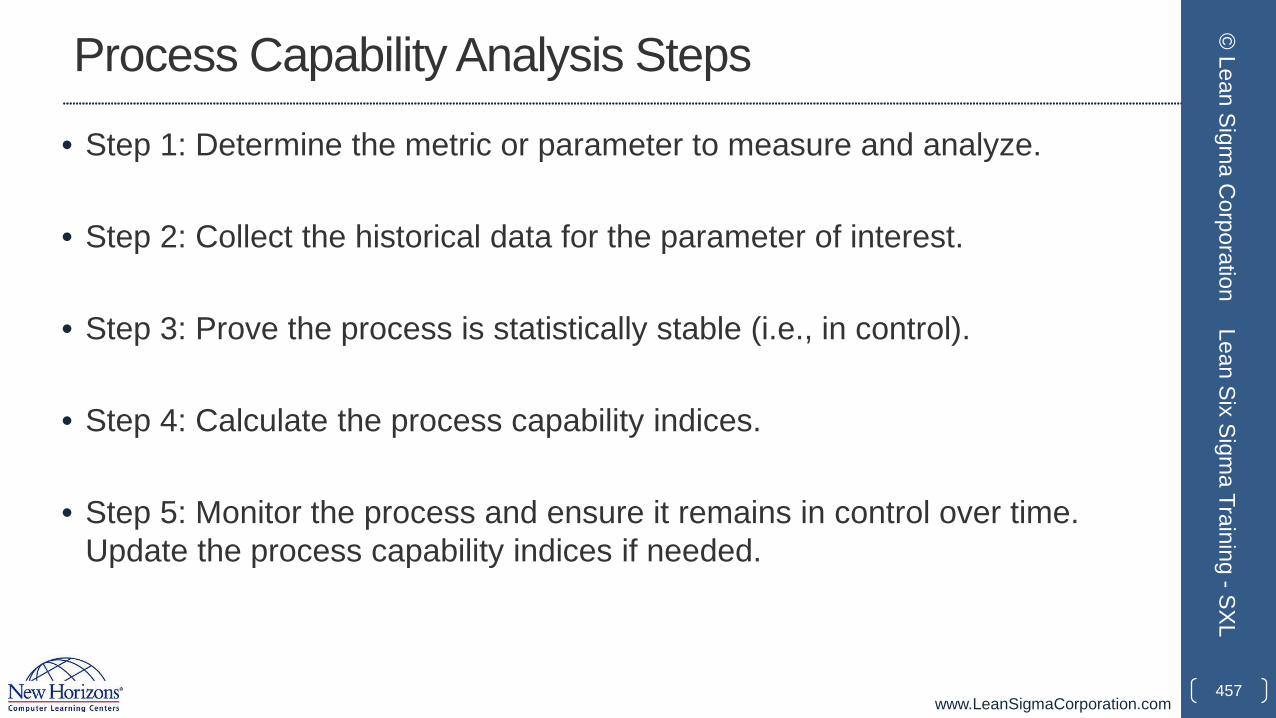
www.LeanSigmaCorporation.com
Process Capability Analysis Steps
• Step 1: Determine the metric or parameter to measure and analyze.
• Step 2: Collect the historical data for the parameter of interest.
• Step 3: Prove the process is statistically stable (i.e., in control).
• Step 4: Calculate the process capability indices.
• Step 5: Monitor the process and ensure it remains in control over time. Update the process capability indices if needed.
457
© Lean Sigm
a Corporation
Lean Six Sigma Training -SXL
www.LeanSigmaCorporation.com
Process Capability Indices
• Process capability can be presented using various indices depending on the nature of the process and the goal of the analysis.
• Popular process capability indices:• Cp
• Pp
• Cpk
• Ppk
• Cpm
458
© Lean Sigm
a Corporation
Lean Six Sigma Training -SXL
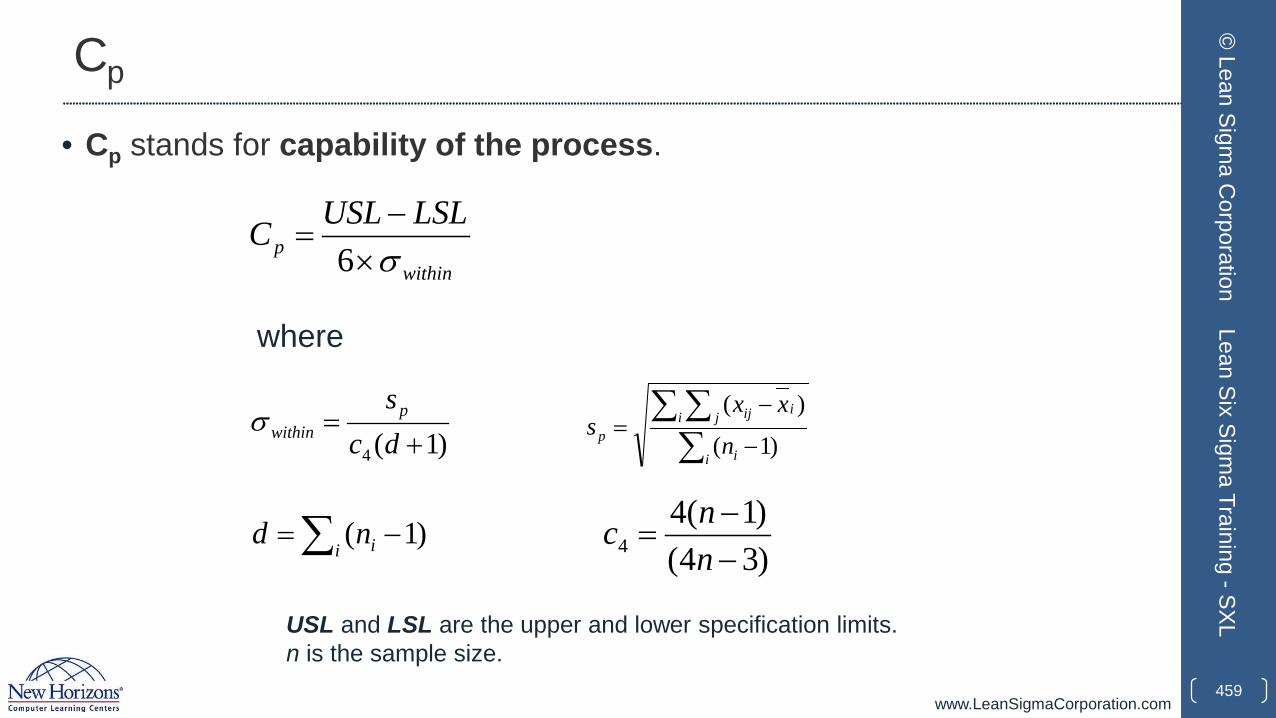
www.LeanSigmaCorporation.com
Cp
• Cp stands for capability of the process.
459
© Lean Sigm
a Corporation
Lean Six Sigma Training -SXL
withinp
LSLUSLCσ×−
=6
where
)1(4 +=
dcsp
withinσ∑
∑ ∑−
−=
i i
i j iijp n
xxs
)1(
)(
∑ −=i ind )1(
)34()1(4
4 −−
=nnc
USL and LSL are the upper and lower specification limits.n is the sample size.
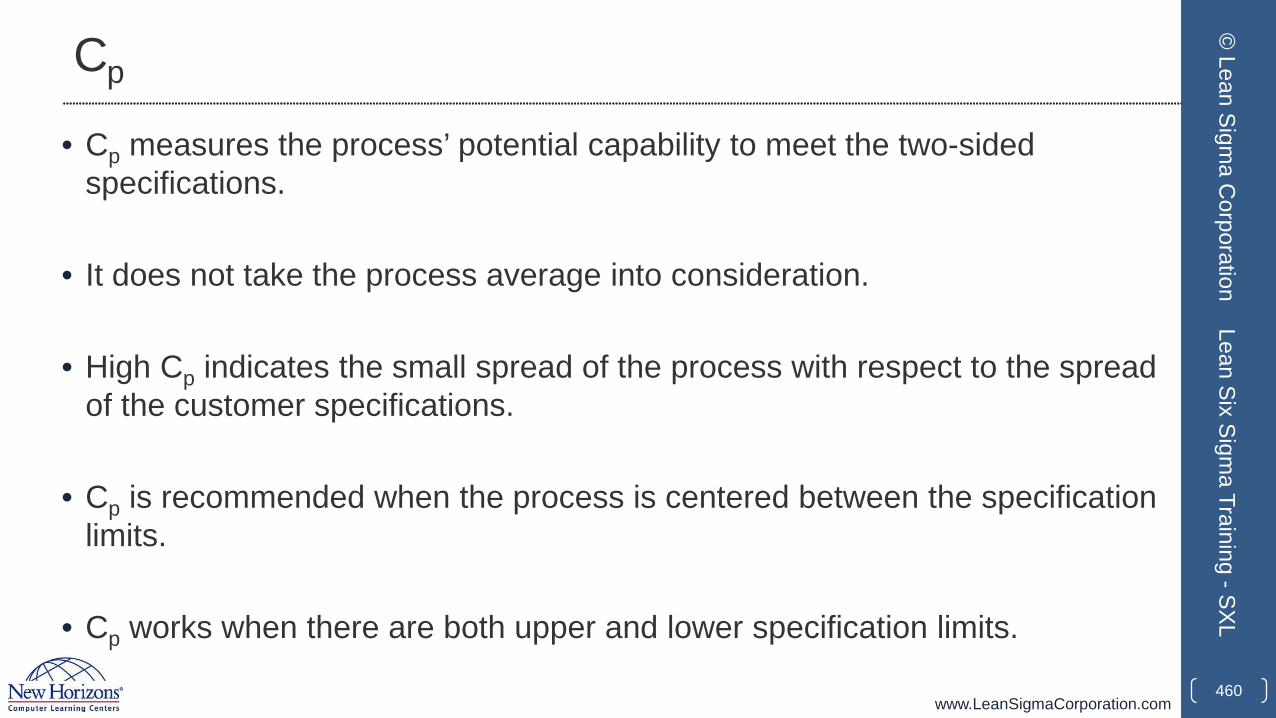
www.LeanSigmaCorporation.com
Cp
• Cp measures the process’ potential capability to meet the two-sided specifications.
• It does not take the process average into consideration.
• High Cp indicates the small spread of the process with respect to the spread of the customer specifications.
• Cp is recommended when the process is centered between the specification limits.
• Cp works when there are both upper and lower specification limits.
460
© Lean Sigm
a Corporation
Lean Six Sigma Training -SXL
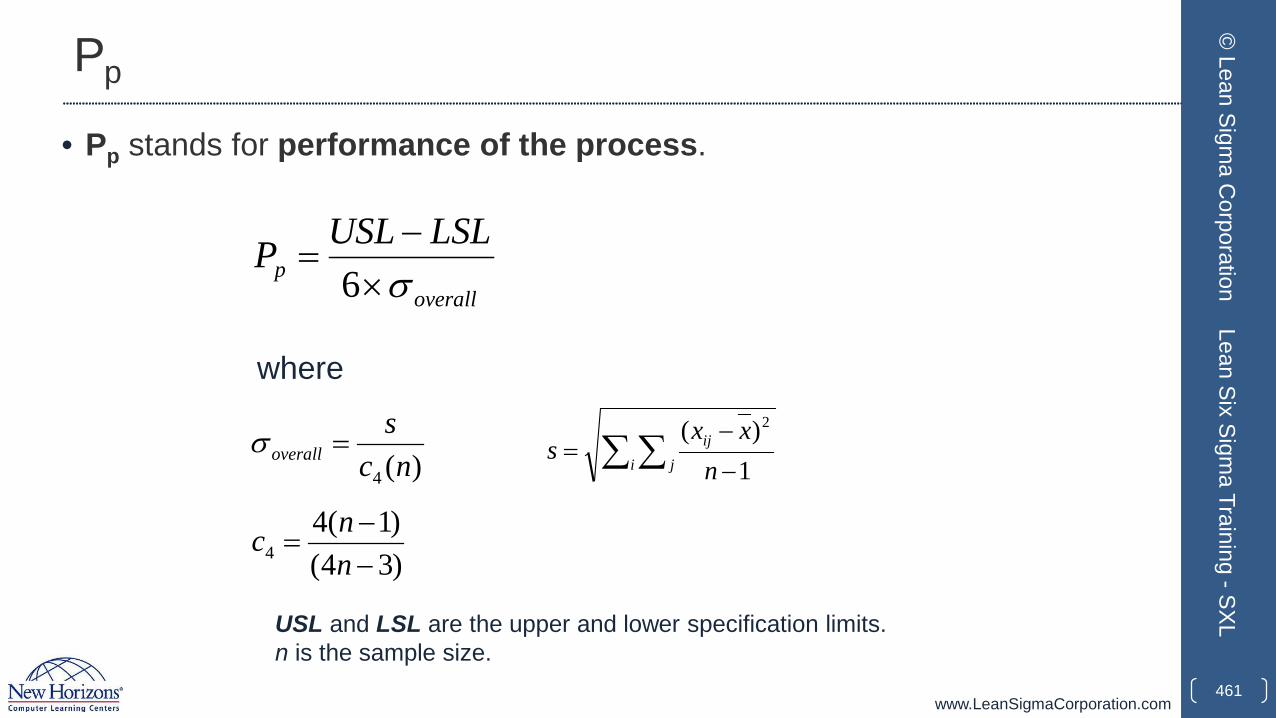
www.LeanSigmaCorporation.com
Pp
• Pp stands for performance of the process.
461
© Lean Sigm
a Corporation
Lean Six Sigma Training -SXL
overallp
LSLUSLPσ×−
=6
where
)(4 ncs
overall =σ ∑ ∑ −
−=
i jij
nxx
s1
)( 2
)34()1(4
4 −−
=nnc
USL and LSL are the upper and lower specification limits.n is the sample size.
www.LeanSigmaCorporation.com
Pp
• Similar to Cp, Pp measures the capability of the process to meet the two-sided specifications.
• It only focuses on the spread and does not take the process centralization into consideration.
• It is recommended when the process is centered between the specification limits.
• Cp considers the within-subgroup standard deviation and Pp considers the total standard deviation from the sample data.
• Pp works when there are both upper and lower specification limits.462
© Lean Sigm
a Corporation
Lean Six Sigma Training -SXL

www.LeanSigmaCorporation.com
Cpk
• Cpk stands for the capability of the process with a k factor adjustment.
463
© Lean Sigm
a Corporation
Lean Six Sigma Training -SXL
ppk CkC ×−= )1(
where
2LSLUSL
mk
−−
=µ
2LSLUSLm +
=
μ is the process mean; n is the sample size.
USL and LSL are the upper and lower specification limits.
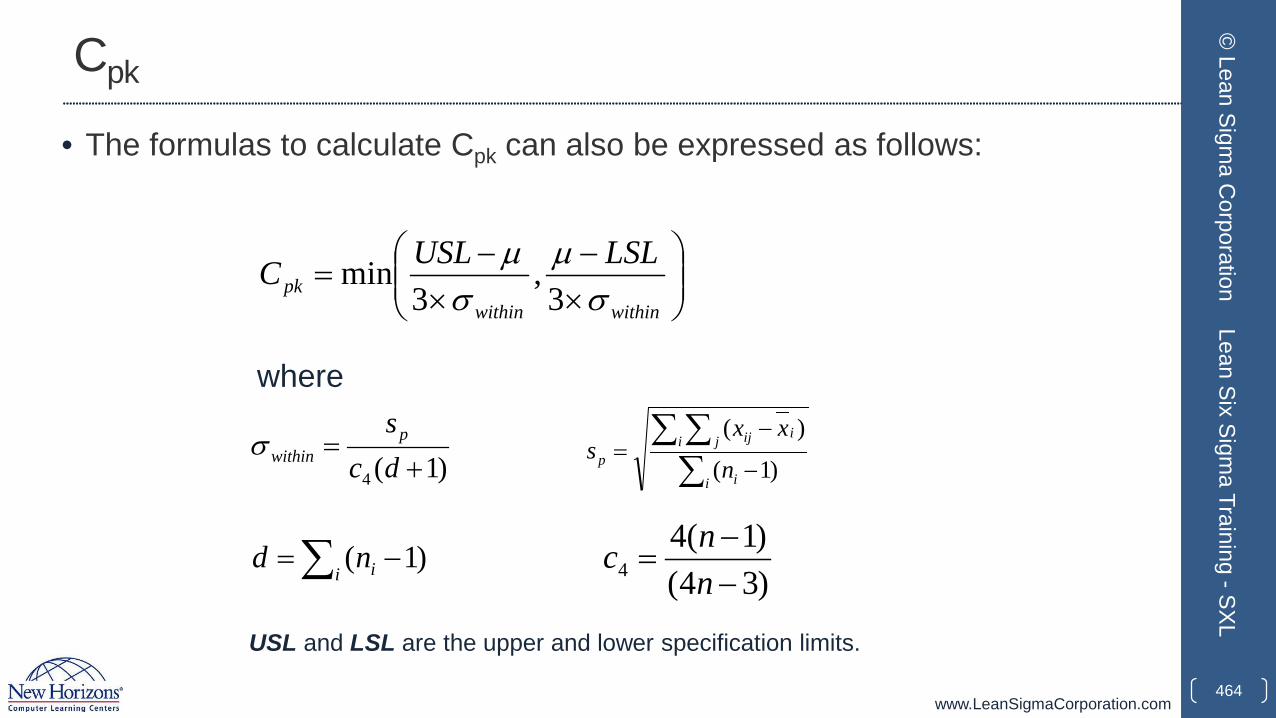
www.LeanSigmaCorporation.com
Cpk
• The formulas to calculate Cpk can also be expressed as follows:
464
© Lean Sigm
a Corporation
Lean Six Sigma Training -SXL
×−
×−
=withinwithin
pkLSLUSLC
σµ
σµ
3,
3min
where
)1(4 +=
dcsp
withinσ∑
∑ ∑−
−=
i i
i j iijp n
xxs
)1(
)(
∑ −=i ind )1(
)34()1(4
4 −−
=nnc
USL and LSL are the upper and lower specification limits.
www.LeanSigmaCorporation.com
Cpk
• Cpk measures the process’ actual capability by taking both the variation and average of the process into consideration.
• The process does not need to be centered between the specification limits to make the index meaningful.
• Cpk is recommended when the process is not in the center between the specification limits.
• When there is only a one-sided limit, Cpk is calculated using Cpu or Cpl.
465
© Lean Sigm
a Corporation
Lean Six Sigma Training -SXL
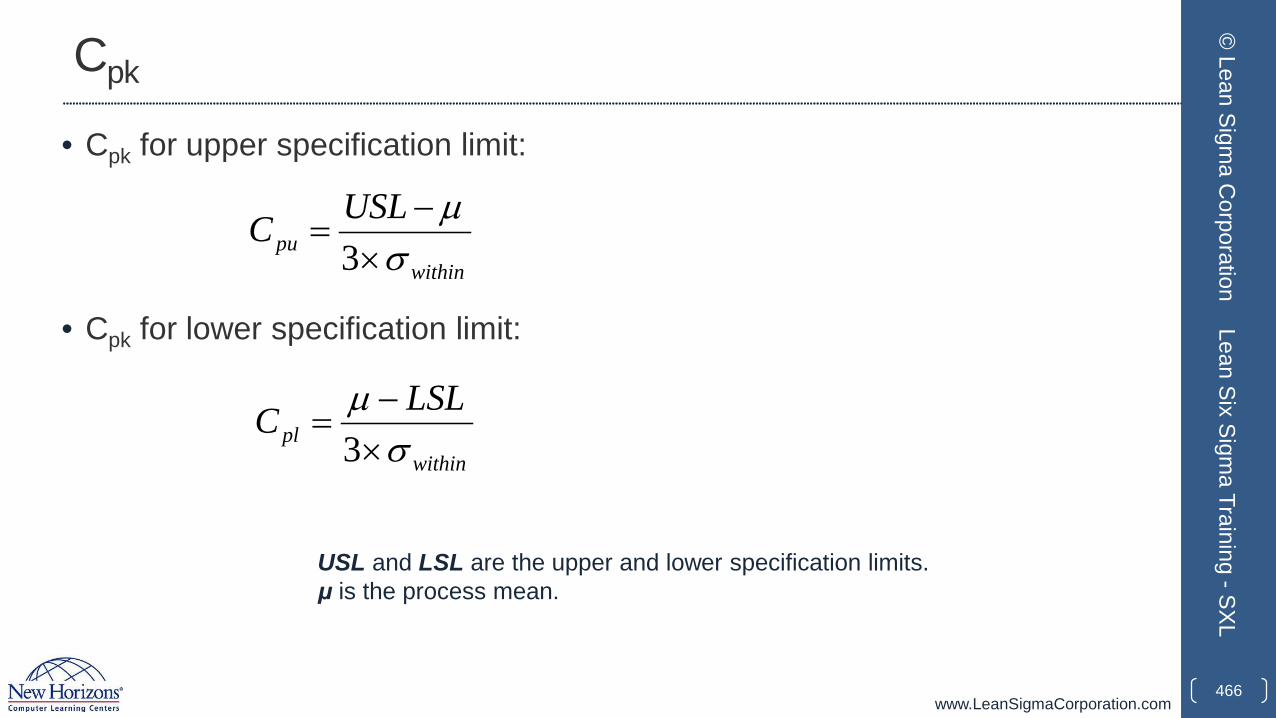
www.LeanSigmaCorporation.com
Cpk
• Cpk for upper specification limit:
• Cpk for lower specification limit:
466
© Lean Sigm
a Corporation
Lean Six Sigma Training -SXL
withinpu
USLCσ
µ×
−=
3
withinpl
LSLCσ
µ×−
=3
USL and LSL are the upper and lower specification limits.μ is the process mean.
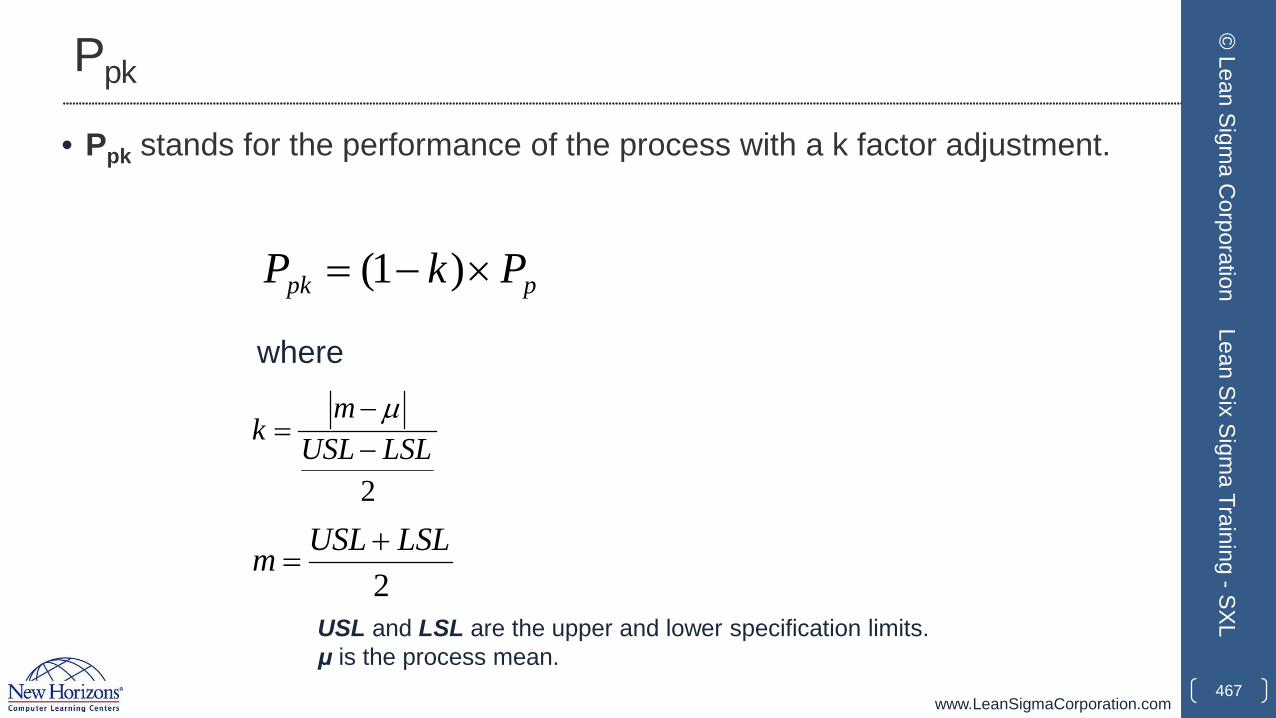
www.LeanSigmaCorporation.com
Ppk
• Ppk stands for the performance of the process with a k factor adjustment.
467
© Lean Sigm
a Corporation
Lean Six Sigma Training -SXL
ppk PkP ×−= )1(
where
2LSLUSL
mk
−−
=µ
2LSLUSLm +
=
USL and LSL are the upper and lower specification limits.μ is the process mean.
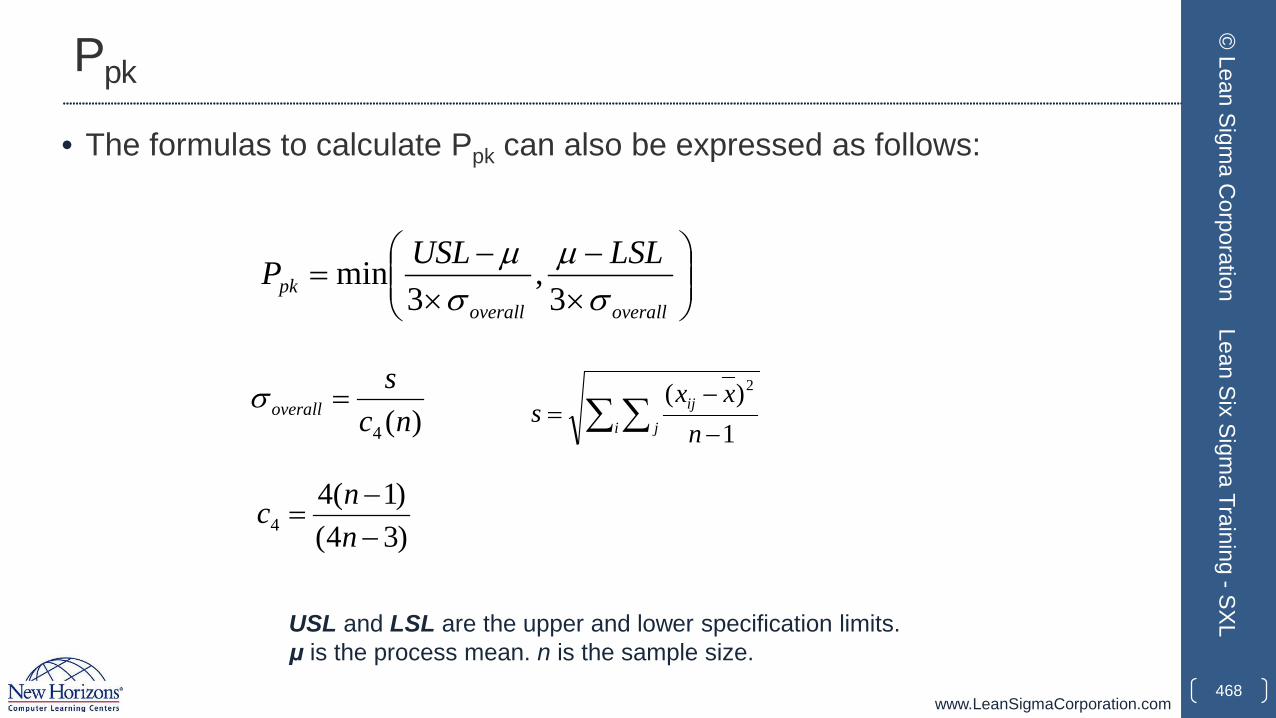
www.LeanSigmaCorporation.com
Ppk
• The formulas to calculate Ppk can also be expressed as follows:
468
© Lean Sigm
a Corporation
Lean Six Sigma Training -SXL
×−
×−
=overalloverall
pkLSLUSLP
σµ
σµ
3,
3min
)(4 ncs
overall =σ ∑ ∑ −
−=
i jij
nxx
s1
)( 2
)34()1(4
4 −−
=nnc
USL and LSL are the upper and lower specification limits.μ is the process mean. n is the sample size.
www.LeanSigmaCorporation.com
Ppk
• Similar to Cpk, Ppk measures the process capability by taking both the variation and the average of the process into consideration.
• Ppk solves the decentralization problem Pp cannot overcome.
• Cpk considers the within-subgroup standard deviation, while Ppk considers the total standard deviation from the sample data.
• When there is only a one-sided specification limit, Ppk is calculated using Ppu or Ppl.
469
© Lean Sigm
a Corporation
Lean Six Sigma Training -SXL
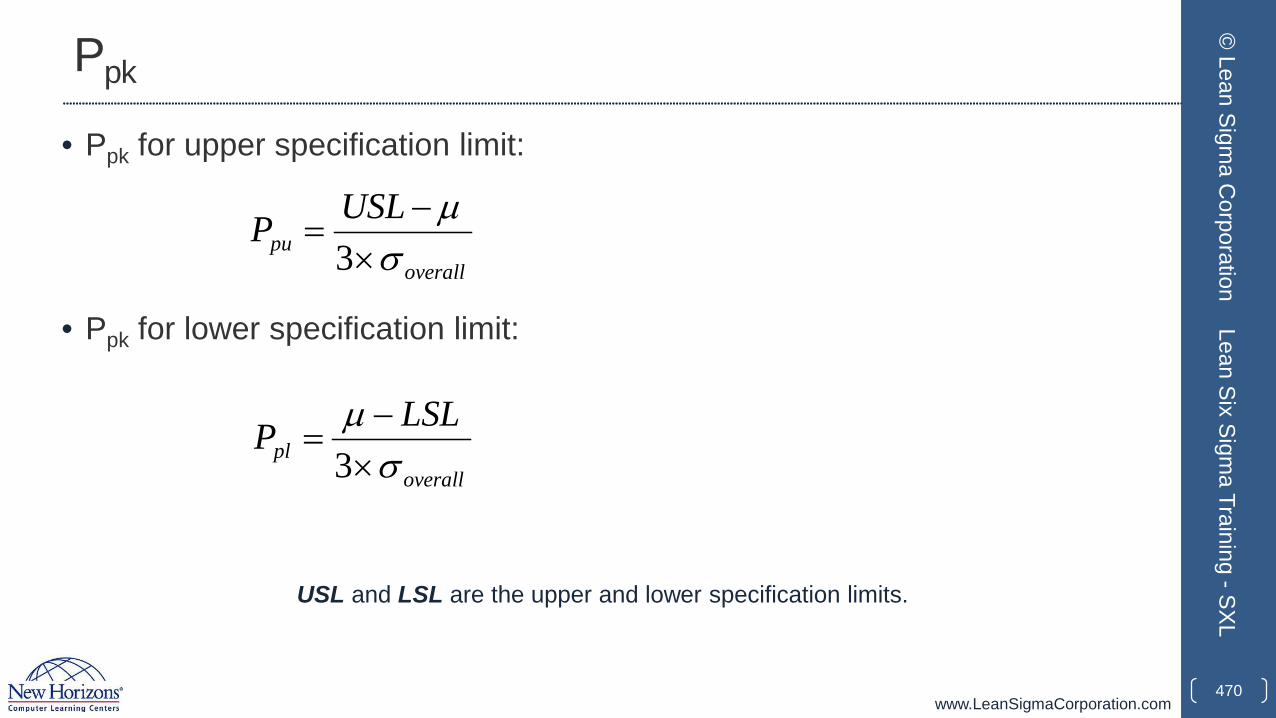
www.LeanSigmaCorporation.com
Ppk
• Ppk for upper specification limit:
• Ppk for lower specification limit:
470
© Lean Sigm
a Corporation
Lean Six Sigma Training -SXL
overallpu
USLPσ
µ×
−=
3
overallpl
LSLPσ
µ×−
=3
USL and LSL are the upper and lower specification limits.
www.LeanSigmaCorporation.com
Cpm
• Cp, Pp, Cpk, and Ppk all consider the variation of the process. Cpk and Ppktake both the variation and the average of the process into consideration when measuring the process capability.
• It is possible that the process average fails to meet the target customers require while the process still remains between the specification limits. Cpm(Taguchi’s capability index) helps to capture the variation from the specified target.
471
© Lean Sigm
a Corporation
Lean Six Sigma Training -SXL
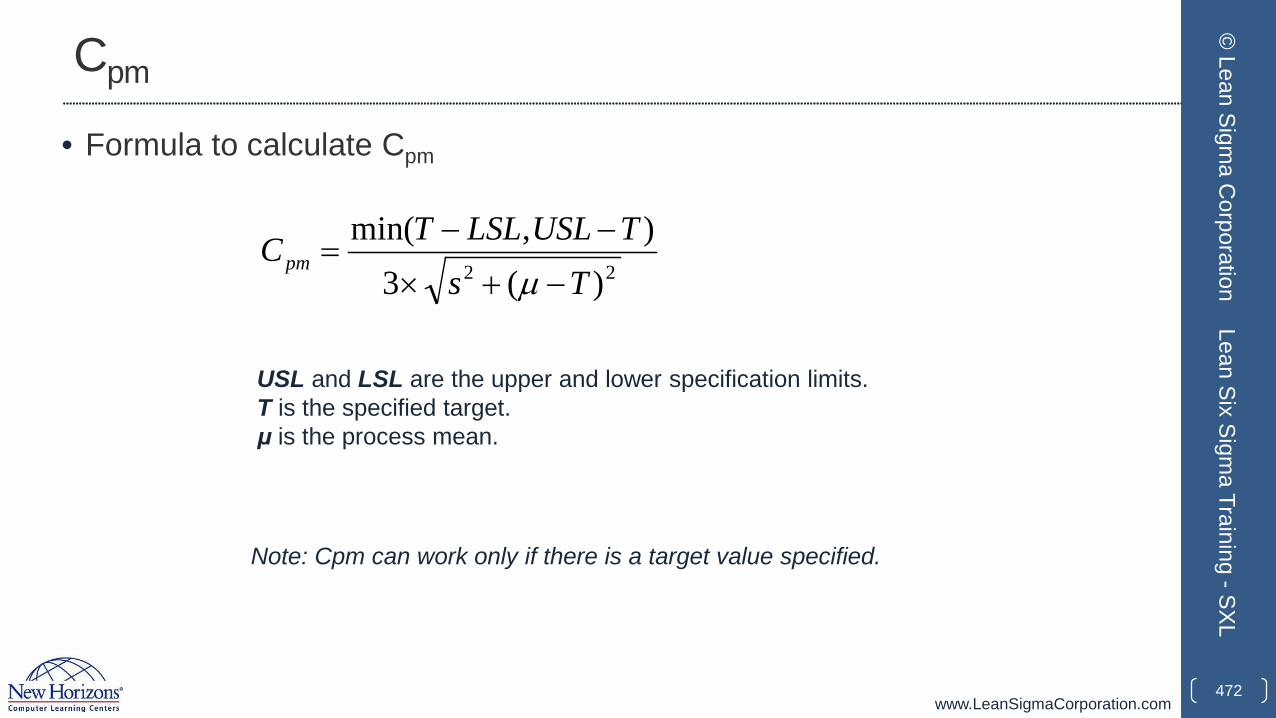
www.LeanSigmaCorporation.com
Cpm
• Formula to calculate Cpm
472
© Lean Sigm
a Corporation
Lean Six Sigma Training -SXL
22 )(3),min(
TsTUSLLSLTCpm
−+×
−−=
µ
USL and LSL are the upper and lower specification limits.T is the specified target.μ is the process mean.
Note: Cpm can work only if there is a target value specified.
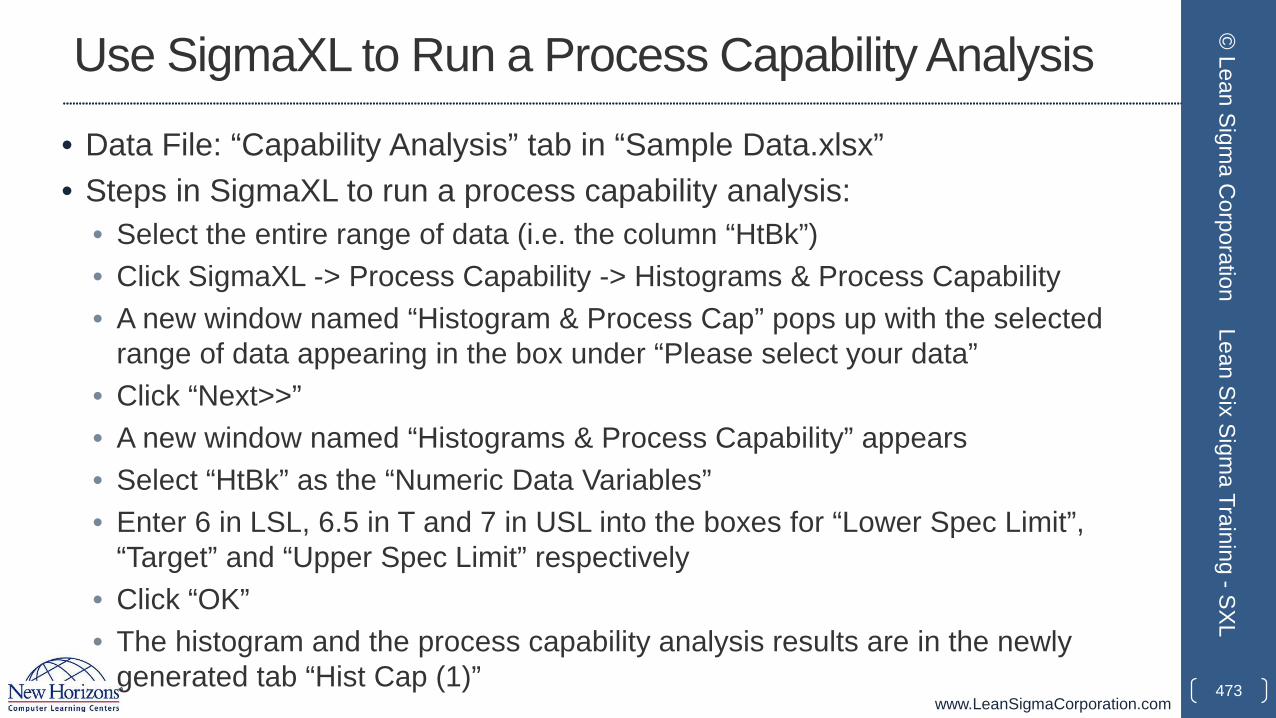
www.LeanSigmaCorporation.com
Use SigmaXL to Run a Process Capability Analysis
• Data File: “Capability Analysis” tab in “Sample Data.xlsx”• Steps in SigmaXL to run a process capability analysis:
• Select the entire range of data (i.e. the column “HtBk”)• Click SigmaXL -> Process Capability -> Histograms & Process Capability• A new window named “Histogram & Process Cap” pops up with the selected
range of data appearing in the box under “Please select your data”• Click “Next>>”• A new window named “Histograms & Process Capability” appears• Select “HtBk” as the “Numeric Data Variables”• Enter 6 in LSL, 6.5 in T and 7 in USL into the boxes for “Lower Spec Limit”,
“Target” and “Upper Spec Limit” respectively• Click “OK”• The histogram and the process capability analysis results are in the newly
generated tab “Hist Cap (1)” 473
© Lean Sigm
a Corporation
Lean Six Sigma Training -SXL
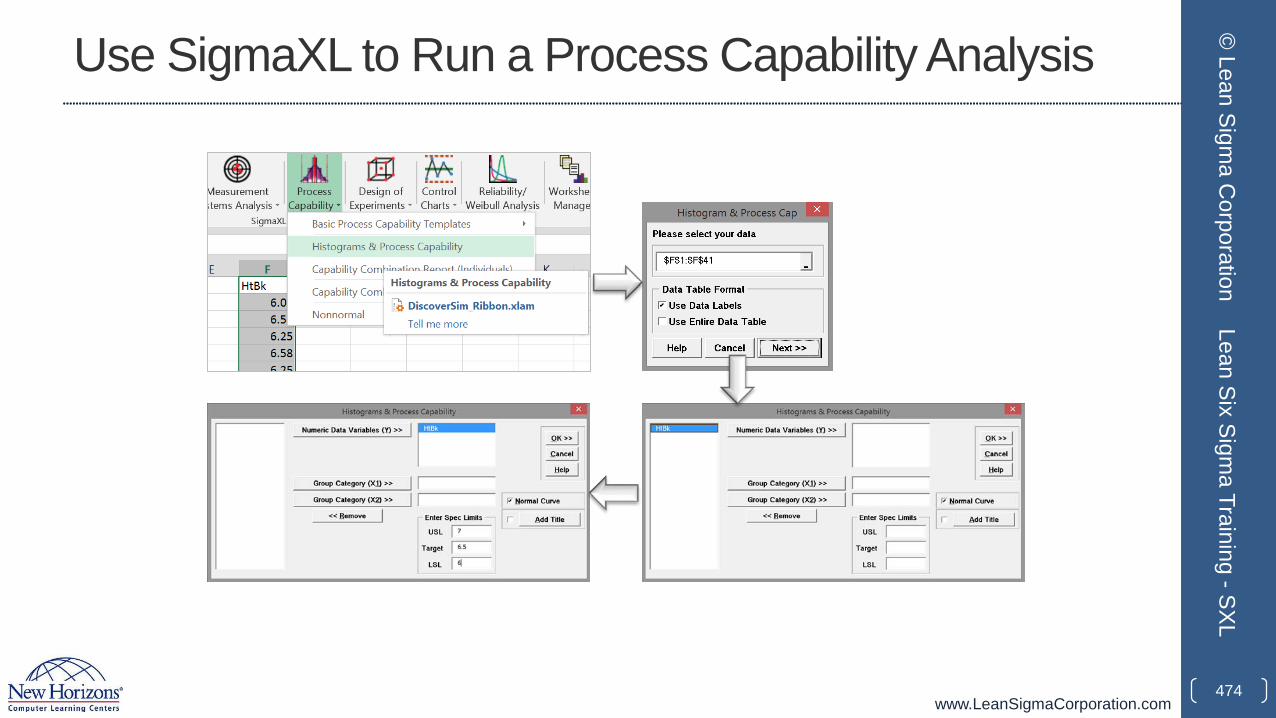
www.LeanSigmaCorporation.com
Use SigmaXL to Run a Process Capability Analysis
474
© Lean Sigm
a Corporation
Lean Six Sigma Training -SXL
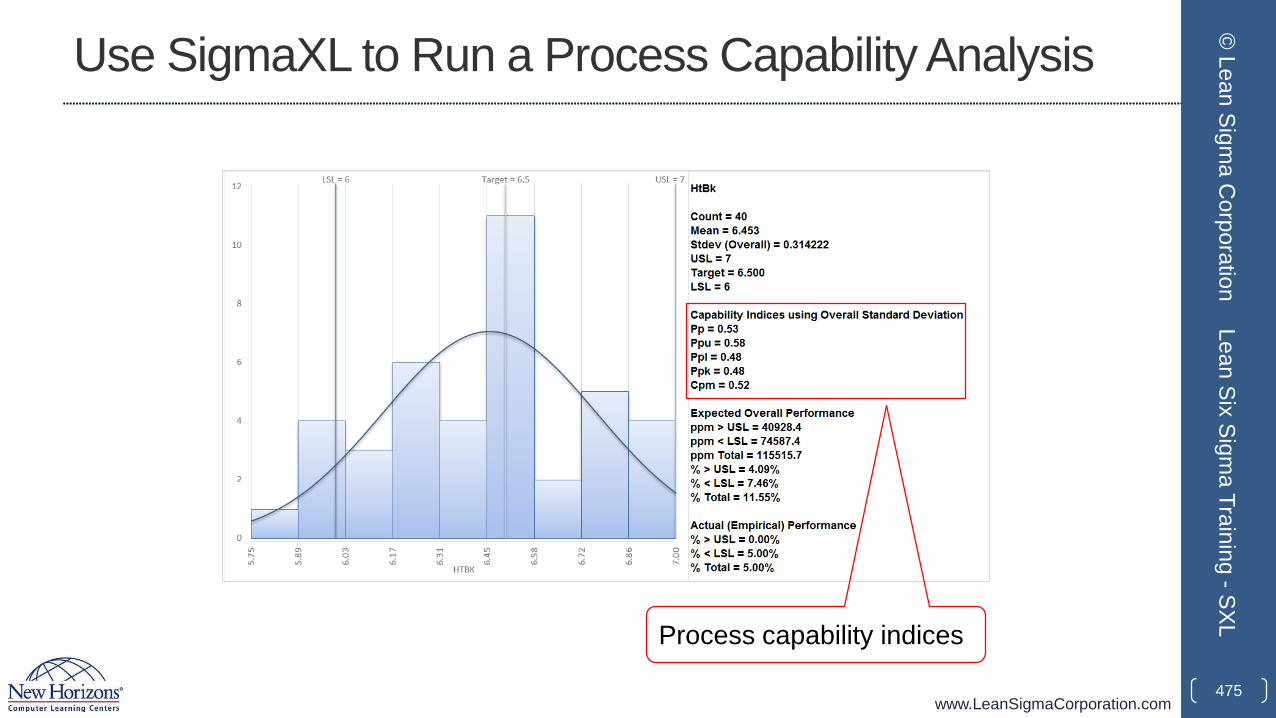
www.LeanSigmaCorporation.com
Use SigmaXL to Run a Process Capability Analysis
475
© Lean Sigm
a Corporation
Lean Six Sigma Training -SXL
Process capability indices
www.LeanSigmaCorporation.com
2.4.2 Concept of Stability
476
© Lean Sigm
a Corporation
Lean Six Sigma Training -SXL
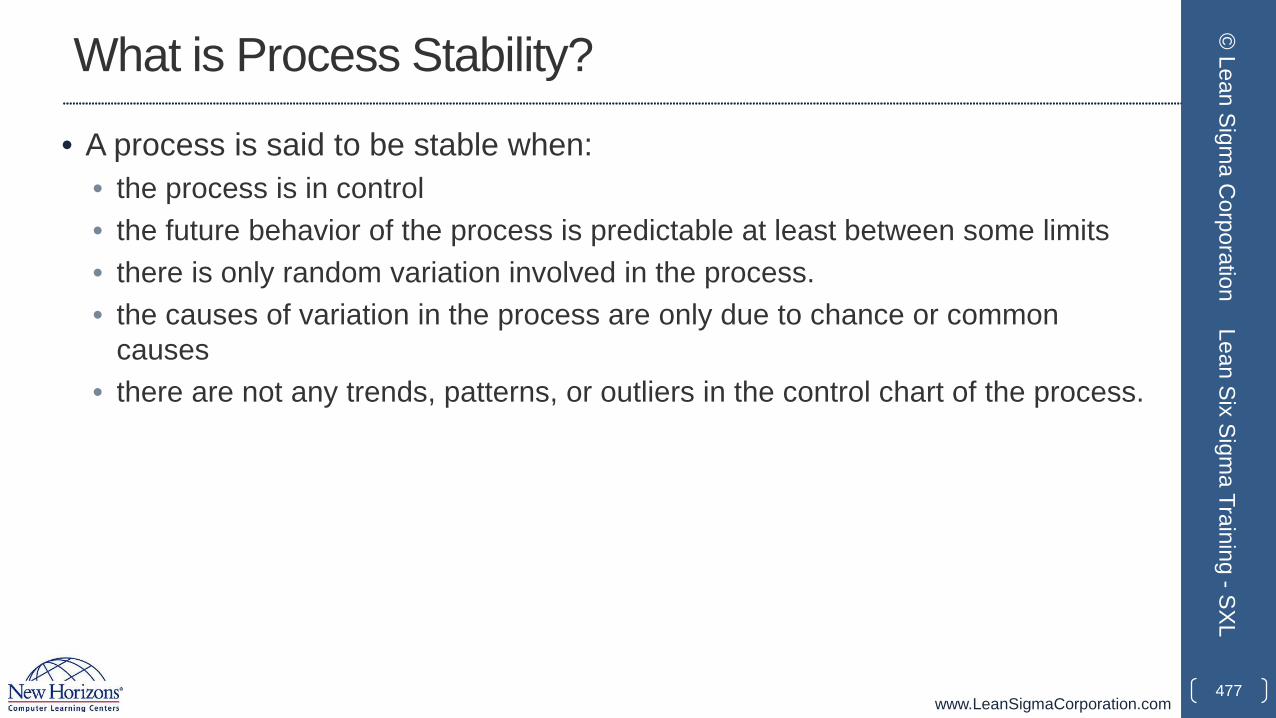
www.LeanSigmaCorporation.com
What is Process Stability?
• A process is said to be stable when:• the process is in control• the future behavior of the process is predictable at least between some limits• there is only random variation involved in the process.• the causes of variation in the process are only due to chance or common
causes• there are not any trends, patterns, or outliers in the control chart of the process.
477
© Lean Sigm
a Corporation
Lean Six Sigma Training -SXL
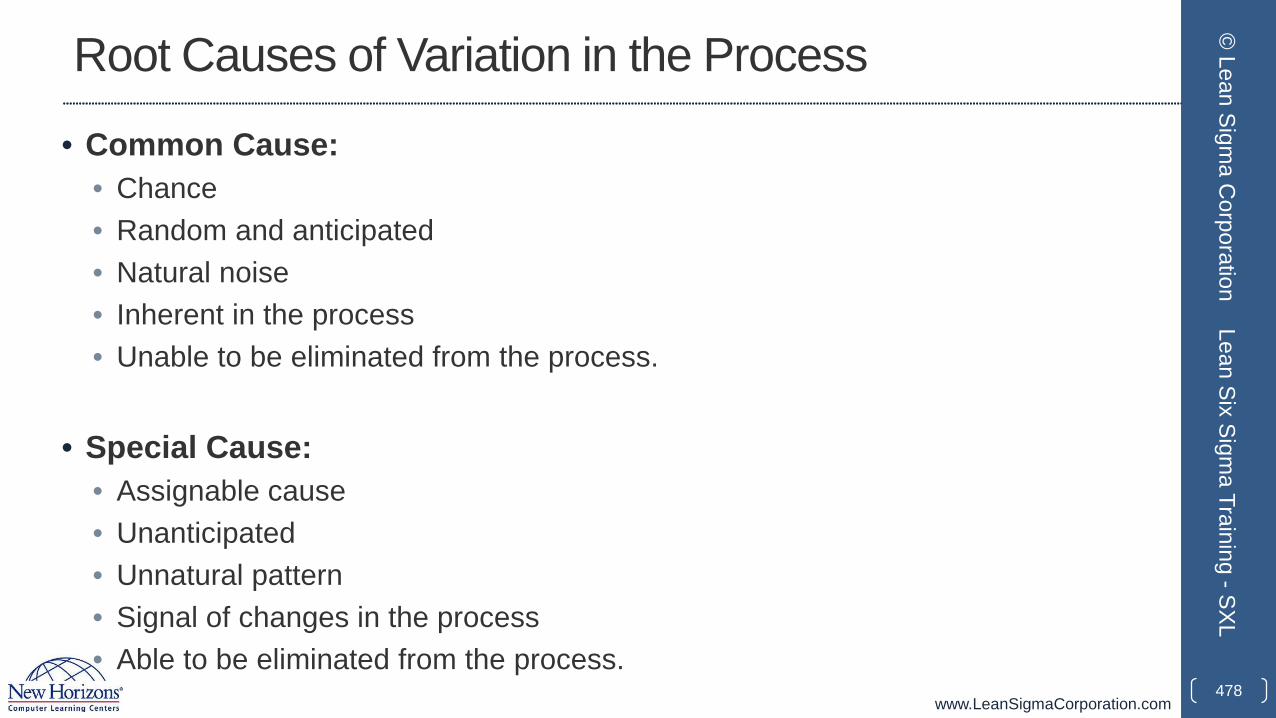
www.LeanSigmaCorporation.com
Root Causes of Variation in the Process
• Common Cause:• Chance• Random and anticipated• Natural noise• Inherent in the process• Unable to be eliminated from the process.
• Special Cause:• Assignable cause• Unanticipated• Unnatural pattern• Signal of changes in the process• Able to be eliminated from the process.
478
© Lean Sigm
a Corporation
Lean Six Sigma Training -SXL
www.LeanSigmaCorporation.com
Control Charts
• Control charts are the graphical tools to analyze the stability of a process.
• A control chart is used to identify the presence of potential special causes in the process and to determine whether the process is statistically in control.
• If the samples or calculations of samples are all in control, the process is stable and the data from the process can be used to predict the future performance of the process.
479
© Lean Sigm
a Corporation
Lean Six Sigma Training -SXL
www.LeanSigmaCorporation.com
Popular Control Charts
• I-MR Chart• Xbar-R Chart• Xbar-S Chart• C Chart• U Chart• P Chart• NP Chart• EWMA Chart• CUSUM Chart
480
© Lean Sigm
a Corporation
Lean Six Sigma Training -SXL
Note: More details of the control charts will be introduced in the Control module.
www.LeanSigmaCorporation.com
Process Stability vs. Process Capability
• Process stability indicates how stable a process performed in the past.
• When the process is stable, we can use the data from the process to predict its future behavior.
• Process capability indicates how well a process performs with respect to meeting the customer’s specifications.
• The process capability analysis is valid only if the process is statistically stable (i.e., in control, predictable).
• Being stable does not guarantee that the process is also capable. However, being stable is the prerequisite to determine whether a process is capable.
481
© Lean Sigm
a Corporation
Lean Six Sigma Training -SXL
www.LeanSigmaCorporation.com
2.4.3 Attribute & Discrete Capability
482
© Lean Sigm
a Corporation
Lean Six Sigma Training -SXL
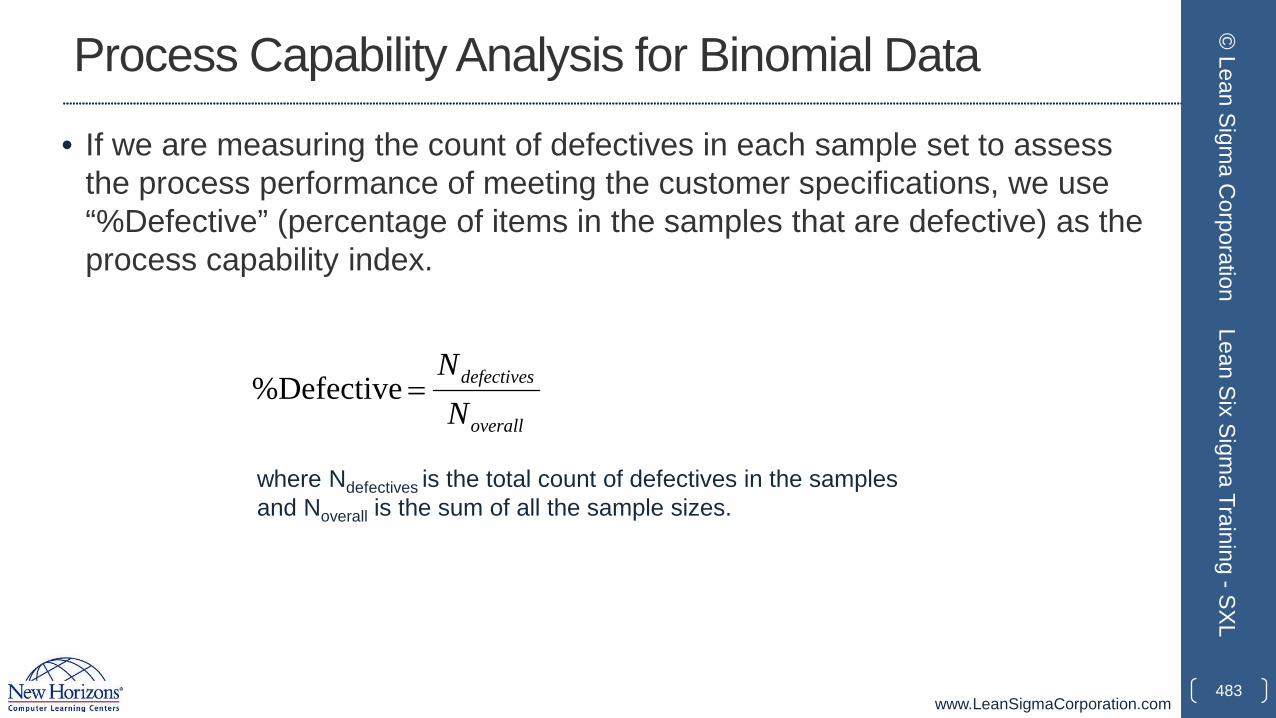
www.LeanSigmaCorporation.com
Process Capability Analysis for Binomial Data
• If we are measuring the count of defectives in each sample set to assess the process performance of meeting the customer specifications, we use “%Defective” (percentage of items in the samples that are defective) as the process capability index.
483
© Lean Sigm
a Corporation
Lean Six Sigma Training -SXL
overall
defectives
NN
=%Defective
where Ndefectives is the total count of defectives in the samples and Noverall is the sum of all the sample sizes.
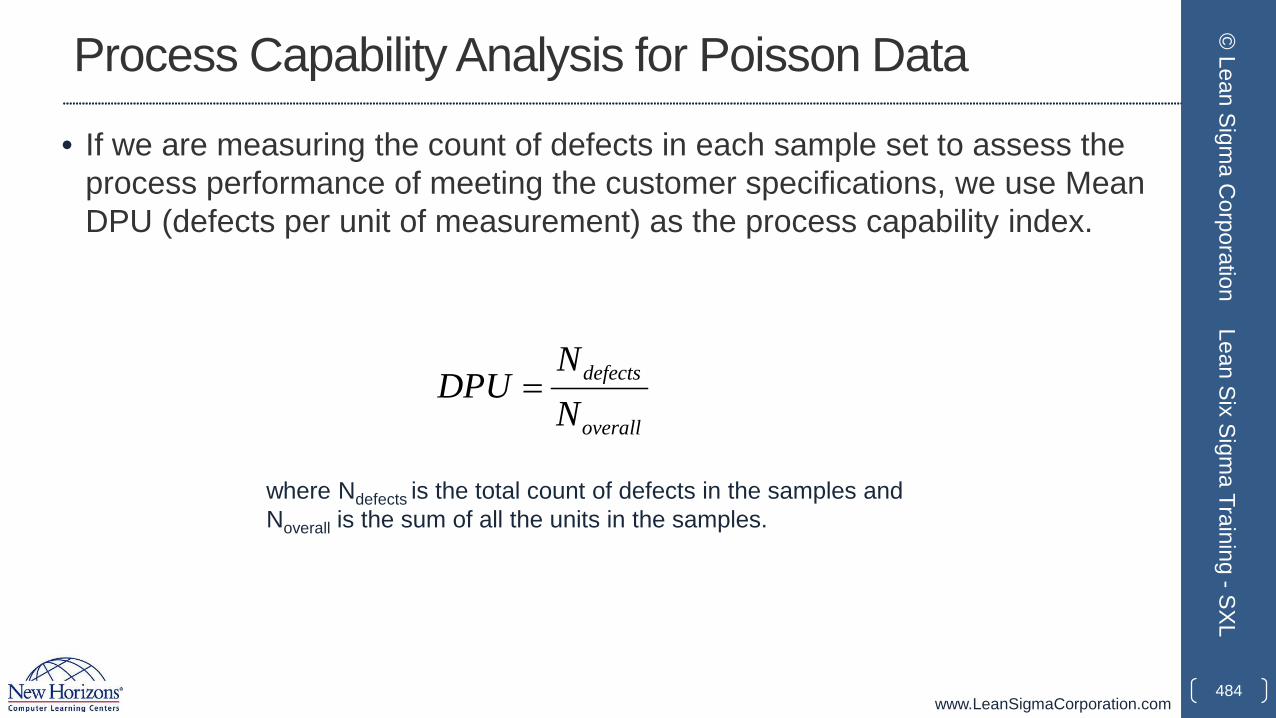
www.LeanSigmaCorporation.com
Process Capability Analysis for Poisson Data
• If we are measuring the count of defects in each sample set to assess the process performance of meeting the customer specifications, we use Mean DPU (defects per unit of measurement) as the process capability index.
484
© Lean Sigm
a Corporation
Lean Six Sigma Training -SXL
overall
defects
NN
DPU =
where Ndefects is the total count of defects in the samples and Noverall is the sum of all the units in the samples.

www.LeanSigmaCorporation.com
2.4.4 Monitoring Techniques
485
© Lean Sigm
a Corporation
Lean Six Sigma Training -SXL
www.LeanSigmaCorporation.com
Capability and Monitoring
• In the Measure phase of the project, process stability analysis and process capability analysis are used to baseline the performance of current process.
• In the Control phase of the project, process stability analysis and process capability analysis are combined to monitor whether the improved process is maintained consistently as expected.
486
© Lean Sigm
a Corporation
Lean Six Sigma Training -SXL

www.LeanSigmaCorporation.com
3.0 Control Phase
487
© Lean Sigm
a Corporation
Lean Six Sigma Training -SXL
www.LeanSigmaCorporation.com
Yellow Belt Training: Control Phase3.1 Lean Controls
3.1.1 Control Methods for 5S3.1.2 Kanban3.1.3 Poka-Yoke (Mistake Proofing)
3.2 Six Sigma Control Plans3.2.1 Cost Benefit Analysis3.2.2 Elements of the Control Plan3.2.3 Elements of the Response Plan
488
© Lean Sigm
a Corporation
Lean Six Sigma Training -SXL
www.LeanSigmaCorporation.com
3.1 Lean Controls
489
© Lean Sigm
a Corporation
Lean Six Sigma Training -SXL
www.LeanSigmaCorporation.com
Yellow Belt Training: Control Phase3.1 Lean Controls
3.1.1 Control Methods for 5S3.1.2 Kanban3.1.3 Poka-Yoke (Mistake Proofing)
3.2 Six Sigma Control Plans3.2.1 Cost Benefit Analysis3.2.2 Elements of the Control Plan3.2.3 Elements of the Response Plan
490
© Lean Sigm
a Corporation
Lean Six Sigma Training -SXL
www.LeanSigmaCorporation.com
3.1.1 Control Methods for 5S
491
© Lean Sigm
a Corporation
Lean Six Sigma Training -SXL
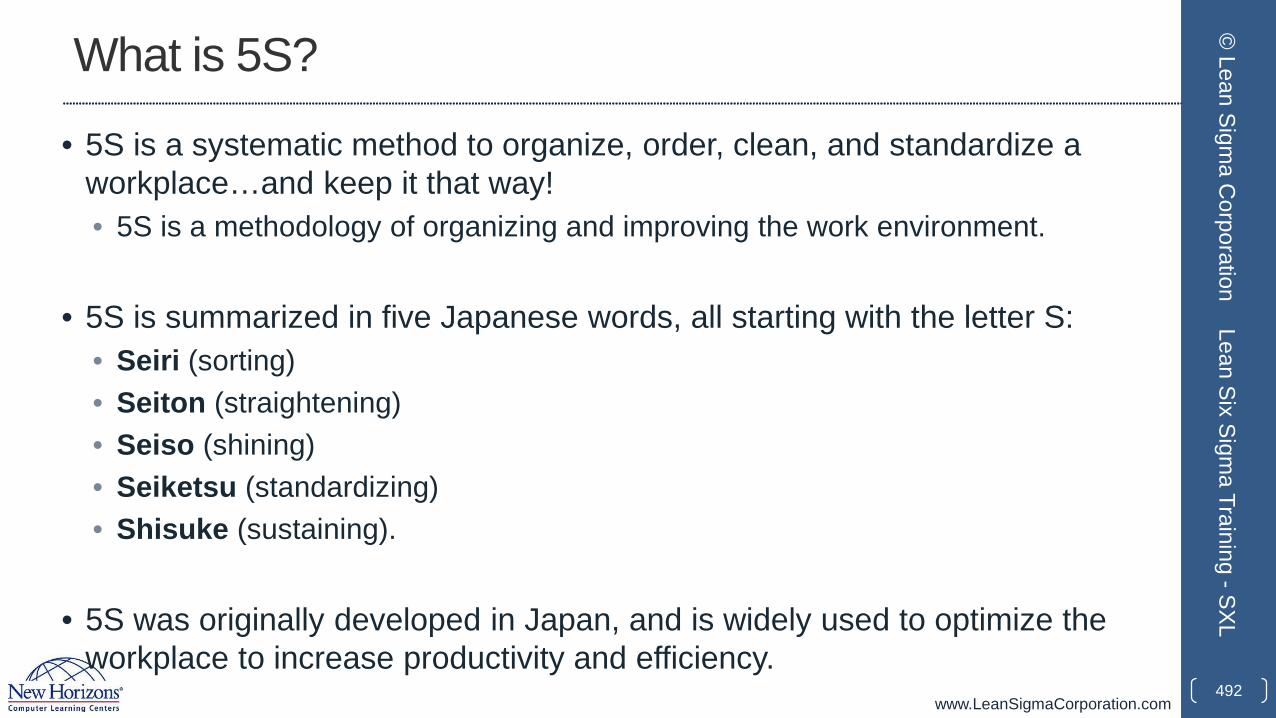
www.LeanSigmaCorporation.com
What is 5S?
• 5S is a systematic method to organize, order, clean, and standardize a workplace…and keep it that way!• 5S is a methodology of organizing and improving the work environment.
• 5S is summarized in five Japanese words, all starting with the letter S:• Seiri (sorting)• Seiton (straightening)• Seiso (shining)• Seiketsu (standardizing)• Shisuke (sustaining).
• 5S was originally developed in Japan, and is widely used to optimize the workplace to increase productivity and efficiency.
492
© Lean Sigm
a Corporation
Lean Six Sigma Training -SXL
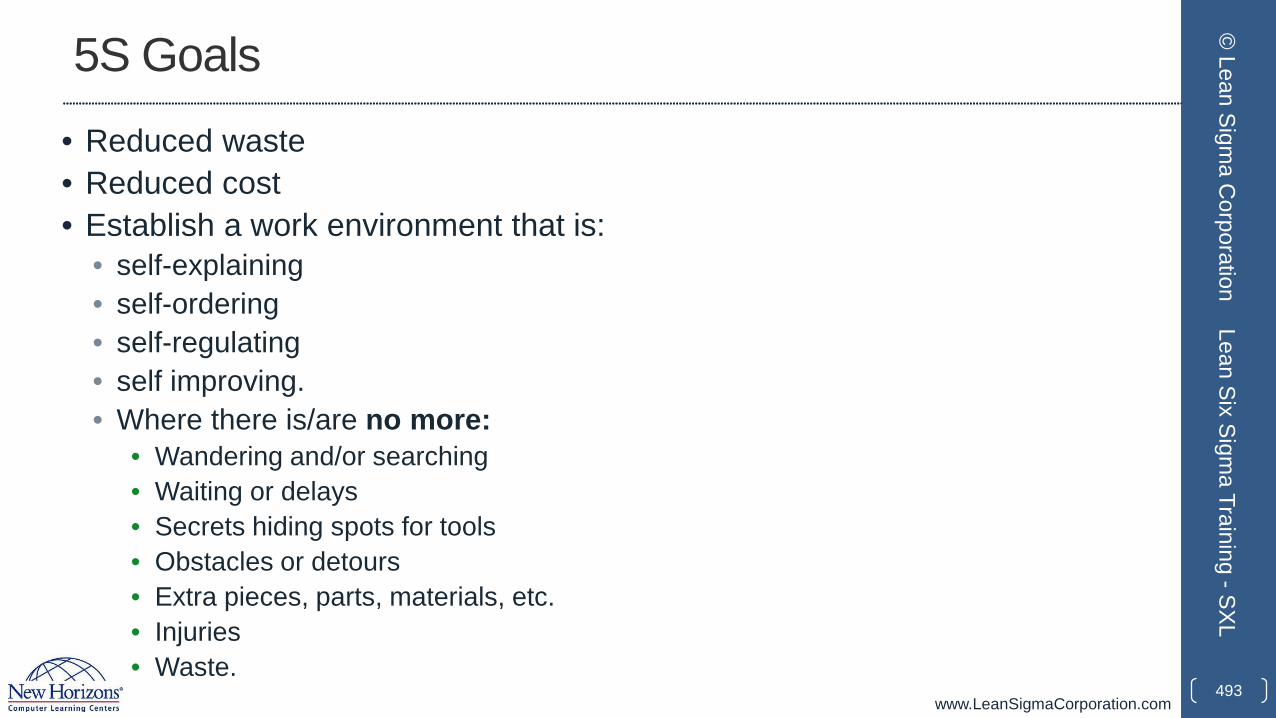
www.LeanSigmaCorporation.com
5S Goals• Reduced waste• Reduced cost• Establish a work environment that is:
• self-explaining• self-ordering• self-regulating• self improving.• Where there is/are no more:
• Wandering and/or searching• Waiting or delays• Secrets hiding spots for tools• Obstacles or detours• Extra pieces, parts, materials, etc.• Injuries• Waste.
493
© Lean Sigm
a Corporation
Lean Six Sigma Training -SXL

www.LeanSigmaCorporation.com
5S Benefits
• Reduced changeovers • Reduced defects• Reduced waste• Reduced delays • Reduced injuries • Reduced breakdowns • Reduced complaints• Reduced red ink• Higher quality• Lower costs• Safer work environment• Greater associate and equipment capacity
494
© Lean Sigm
a Corporation
Lean Six Sigma Training -SXL
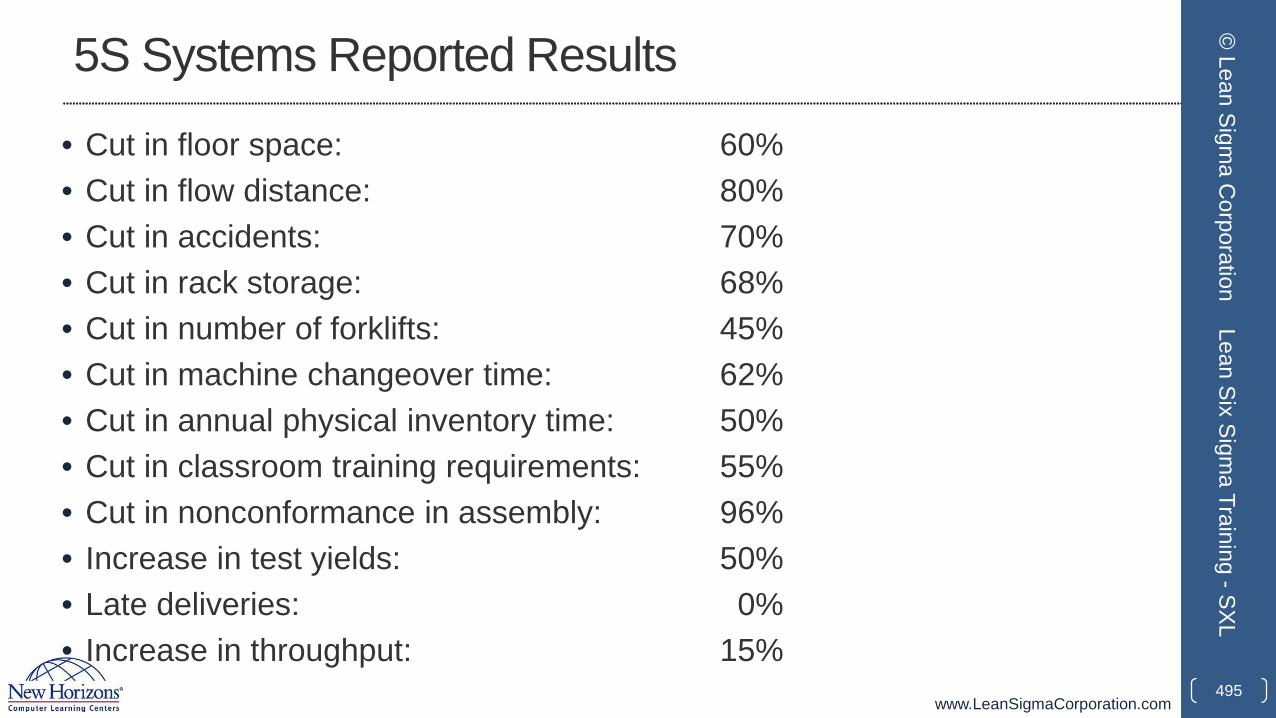
www.LeanSigmaCorporation.com
5S Systems Reported Results
• Cut in floor space: 60%• Cut in flow distance: 80%• Cut in accidents: 70%• Cut in rack storage: 68%• Cut in number of forklifts: 45%• Cut in machine changeover time: 62%• Cut in annual physical inventory time: 50%• Cut in classroom training requirements: 55%• Cut in nonconformance in assembly: 96%• Increase in test yields: 50%• Late deliveries: 0%• Increase in throughput: 15%
495
© Lean Sigm
a Corporation
Lean Six Sigma Training -SXL
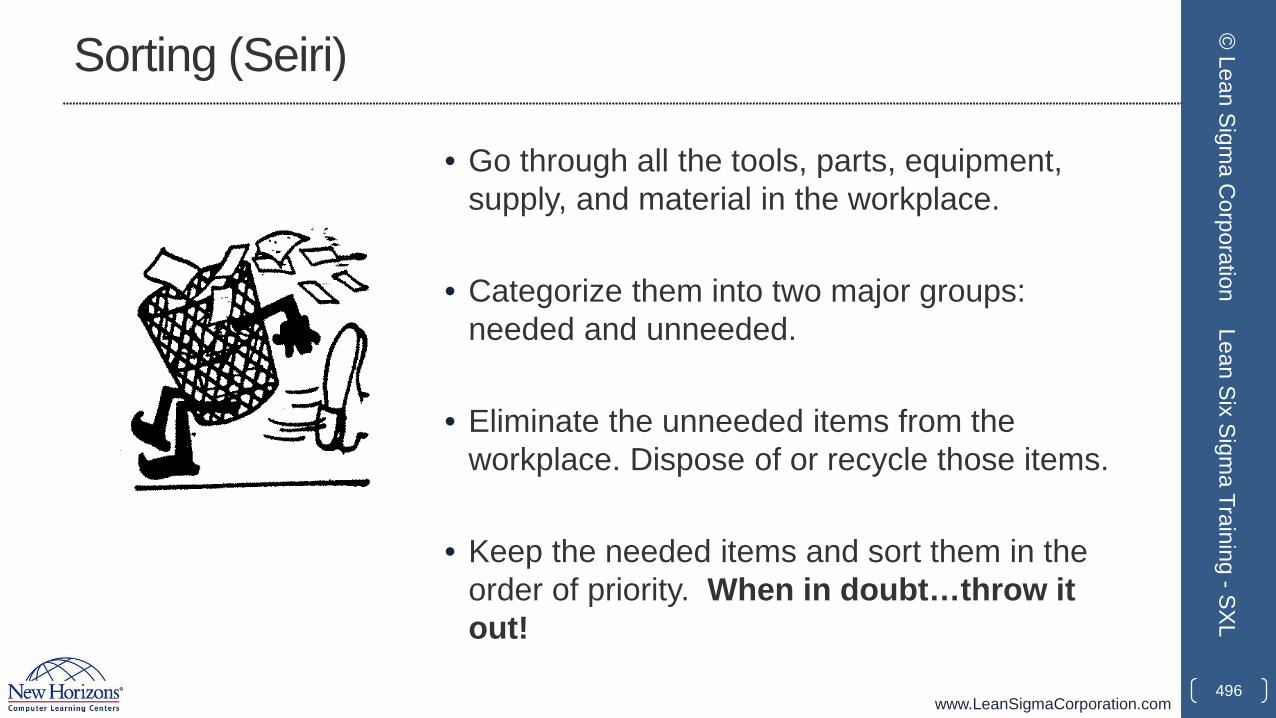
www.LeanSigmaCorporation.com
Sorting (Seiri)
• Go through all the tools, parts, equipment, supply, and material in the workplace.
• Categorize them into two major groups: needed and unneeded.
• Eliminate the unneeded items from the workplace. Dispose of or recycle those items.
• Keep the needed items and sort them in the order of priority. When in doubt…throw it out!
496
© Lean Sigm
a Corporation
Lean Six Sigma Training -SXL
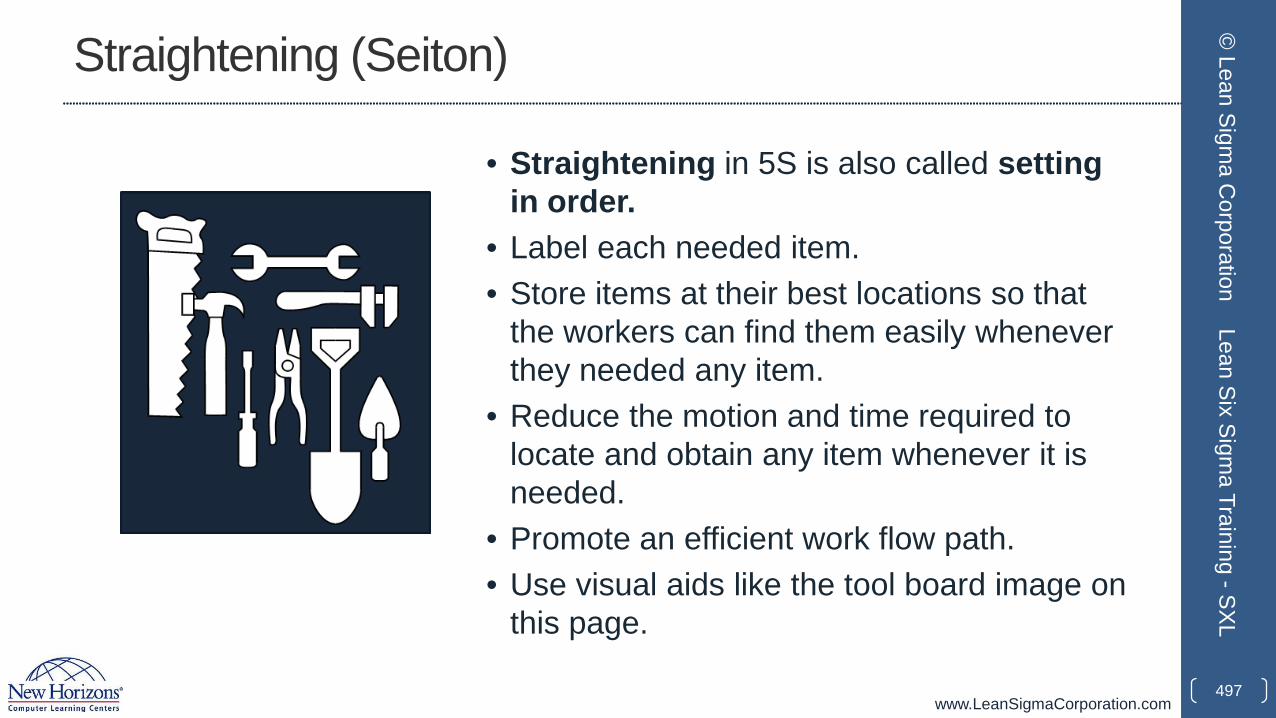
www.LeanSigmaCorporation.com
Straightening (Seiton)
• Straightening in 5S is also called setting in order.
• Label each needed item.• Store items at their best locations so that
the workers can find them easily whenever they needed any item.
• Reduce the motion and time required to locate and obtain any item whenever it is needed.
• Promote an efficient work flow path.• Use visual aids like the tool board image on
this page.
497
© Lean Sigm
a Corporation
Lean Six Sigma Training -SXL
www.LeanSigmaCorporation.com
Shining (Seiso)
• Shining in 5S is also called sweeping.
• Clean the workplace thoroughly.
• Maintain the tidiness of the workplace.
• Make sure every item is located at the specific location where it should be.
• Create the ownership in the team to keep the work area clean and organized.
498
© Lean Sigm
a Corporation
Lean Six Sigma Training -SXL
www.LeanSigmaCorporation.com
Standardizing (Seiketsu )
• Standardize the workstation and the layout of tools, equipment, and parts.
• Create identical workstations with a consistent way of storing the items at their specific locations so that workers can be moved around to any workstation any time and perform the same task.
499
© Lean Sigm
a Corporation
Lean Six Sigma Training -SXL
www.LeanSigmaCorporation.com
Sustaining (Shisuke)
• Sustaining in 5S is also called self-discipline.• Create the culture in the team to follow the first four S’s consistently.• Avoid falling back to the old ways of cluttered and unorganized work
environment.• Keep the momentum of optimizing the workplace.• Promote innovations of workplace improvement.• Sustain the first fours S’s using:
• 5S Maps• 5S Schedules• 5S Job cycle charts• Integration of regular work duties• 5S Blitz schedules• Daily workplace scans.
500
© Lean Sigm
a Corporation
Lean Six Sigma Training -SXL
www.LeanSigmaCorporation.com
Simplified Summary of 5S
• Sort – “when in doubt, move it out.”
• Set in Order – Organize all necessary tools, parts, and components of production. Use visual ordering techniques wherever possible.
• Shine – Clean machines and/or work areas. Set regular cleaning schedules and responsibilities.
• Standardize – Solidify previous three steps, make 5S a regular part of the work environment and everyday life.
• Sustain – Audit, manage, and comply with established five-s guidelines for your business or facility
501
© Lean Sigm
a Corporation
Lean Six Sigma Training -SXL
www.LeanSigmaCorporation.com
3.1.2 Kanban
502
© Lean Sigm
a Corporation
Lean Six Sigma Training -SXL
www.LeanSigmaCorporation.com
What is Kanban?
• The Japanese word “Kanban” means “signboard.”
• Kanban system is a “pull” production scheduling system to determine when to produce, what to produce, and how much to produce based on the demand.
• It was originally developed by Taiichi Ohno in order to reduce the waste in inventory and increase the speed of responding to the immediate demand.
503
© Lean Sigm
a Corporation
Lean Six Sigma Training -SXL
www.LeanSigmaCorporation.com
Kanban System
• Kanban system is a demand-driven system.
• The customer demand is the signal to trigger or pull the production.
• Products are made only to meet the immediate demand. When there is no demand, there is no production.
• It is designed to minimize the in-process inventory and to have the right material with the right amount at the right location at the right time.
504
© Lean Sigm
a Corporation
Lean Six Sigma Training -SXL
www.LeanSigmaCorporation.com
Kanban System
• Principles of the Kanban System:• Only produce products with exactly the same amount that customers consume.• Only produce products when customers consume.
• The production is driven by the actual demand from the customer side instead of the forecasted demand planned by the staff.
505
© Lean Sigm
a Corporation
Lean Six Sigma Training -SXL
www.LeanSigmaCorporation.com
Kanban Card
• The Kanban card is the ticket or signal to authorize the production or movement of materials. It is the message of asking for more.
• It is sent from the end customer up to the chain of production.
• Upon receiving of a Kanban card, the production station would start to produce goods.
• The Kanban card can be a physical card or an electronic signal.
506
© Lean Sigm
a Corporation
Lean Six Sigma Training -SXL
www.LeanSigmaCorporation.com
Kanban System Example
• The simplest example of a Kanban system is the supermarket operation.
• Customers visit the supermarkets and buy what they need.
• The checkout scanners send electronic Kanban cards to the local warehouse asking for more when the items are sold to customers.
• When the warehouse receives the Kanban cards, it starts to replenish the exact goods being sold.
• It the warehouse prepares more than what Kanban cards require, the goods would become obsolete. If it prepares less, the supermarket would not have the goods available when customers need them.
507
© Lean Sigm
a Corporation
Lean Six Sigma Training -SXL
www.LeanSigmaCorporation.com
Kanban System Benefits• Minimize in-process inventory
• Free up space occupied by unnecessary inventory
• Prevent overproduction
• Improve responsiveness to dynamic demand
• Avoid the risk of inaccurate demand forecast
• Streamline the production flow
• Visualize the work flow.508
© Lean Sigm
a Corporation
Lean Six Sigma Training -SXL

www.LeanSigmaCorporation.com
3.1.3 Poka-Yoke
509
© Lean Sigm
a Corporation
Lean Six Sigma Training -SXL
www.LeanSigmaCorporation.com
What is Poka-Yoke?
• The Japanese term “poka-yoke” means “mistake-proofing.”
• It is a mechanism to eliminate defects as early as possible in the process.
• It was originally developed by Shigeo Shingo and was initially called “baka-yoke” (fool-proofing).
510
© Lean Sigm
a Corporation
Lean Six Sigma Training -SXL
www.LeanSigmaCorporation.com
Two Types of Poka-Yoke
• Prevention• Preventing defects from occurring• Removing the possibility that an error could occur• Making the occurrence of an error impossible.
• Detection• Detecting defects once they occur• Highlighting defects to draw workers’ attention immediately • Correcting defects so that they would not reach the next stage.
511
© Lean Sigm
a Corporation
Lean Six Sigma Training -SXL
www.LeanSigmaCorporation.com
Three Methods of Poka-Yoke
• Contact Method• Use of shape, color, size, or any other physical attributes of the items.
• Constant Number Method• Use of a fixed number to make sure a certain number of motions are completed.
• Sequence Method• Use of a checklist to make sure all the prescribed process steps are followed in
the right order.
512
© Lean Sigm
a Corporation
Lean Six Sigma Training -SXL
www.LeanSigmaCorporation.com
Poka-Yoke Devices
• We are surrounded by poka-yoke devices daily.• Prevention Devices
• Example: the dishwasher does not start to run when the door is open.• Detection Devices
• Example: the car starts to beep when the passengers do not buckle their seatbelts.
• Poka-yoke devices can be in any format that can quickly and effectively prevent or detect mistakes.• Visual, electrical, mechanical, procedural, human etc.
513
© Lean Sigm
a Corporation
Lean Six Sigma Training -SXL
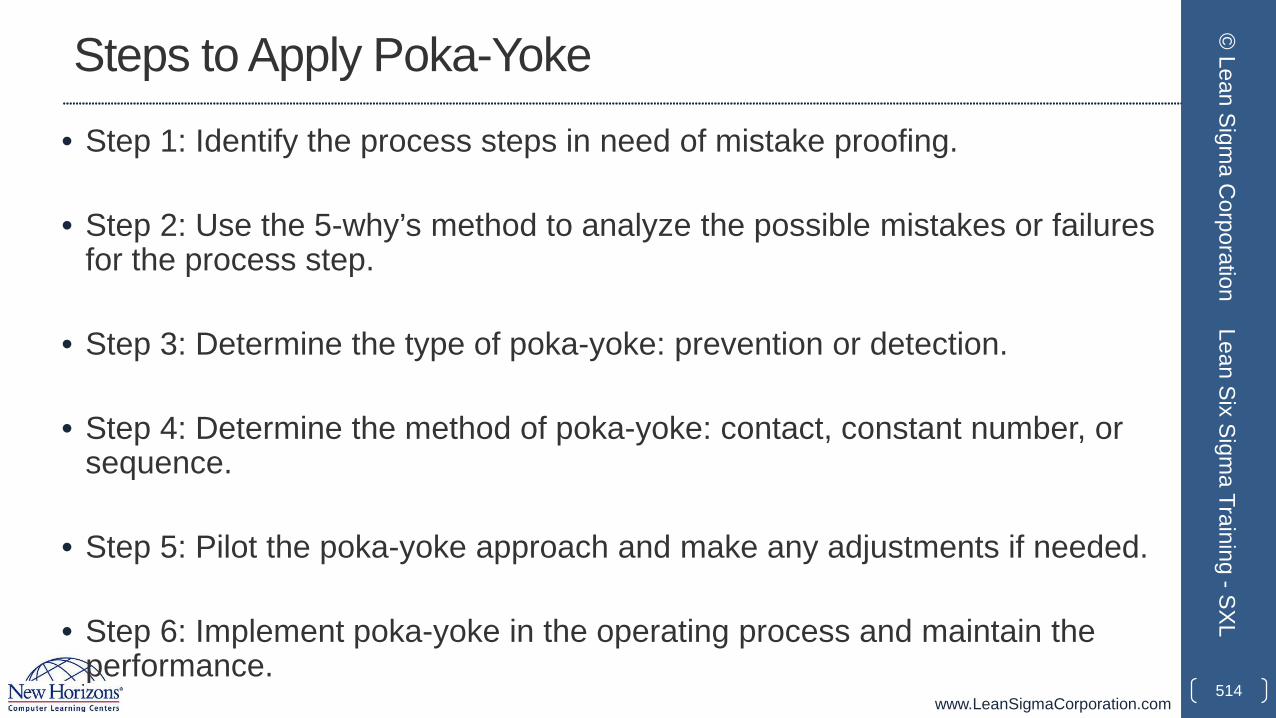
www.LeanSigmaCorporation.com
Steps to Apply Poka-Yoke• Step 1: Identify the process steps in need of mistake proofing.
• Step 2: Use the 5-why’s method to analyze the possible mistakes or failures for the process step.
• Step 3: Determine the type of poka-yoke: prevention or detection.
• Step 4: Determine the method of poka-yoke: contact, constant number, or sequence.
• Step 5: Pilot the poka-yoke approach and make any adjustments if needed.
• Step 6: Implement poka-yoke in the operating process and maintain the performance.
514
© Lean Sigm
a Corporation
Lean Six Sigma Training -SXL

www.LeanSigmaCorporation.com
3.2 Six Sigma Control Plans
515
© Lean Sigm
a Corporation
Lean Six Sigma Training -SXL
www.LeanSigmaCorporation.com
Yellow Belt Training: Control Phase3.1 Lean Controls
3.1.1 Control Methods for 5S3.1.2 Kanban3.1.3 Poka-Yoke (Mistake Proofing)
3.2 Six Sigma Control Plans3.2.1 Cost Benefit Analysis3.2.2 Elements of the Control Plan3.2.3 Elements of the Response Plan
516
© Lean Sigm
a Corporation
Lean Six Sigma Training -SXL

www.LeanSigmaCorporation.com
3.2.1 Cost Benefit Analysis
517
© Lean Sigm
a Corporation
Lean Six Sigma Training -SXL
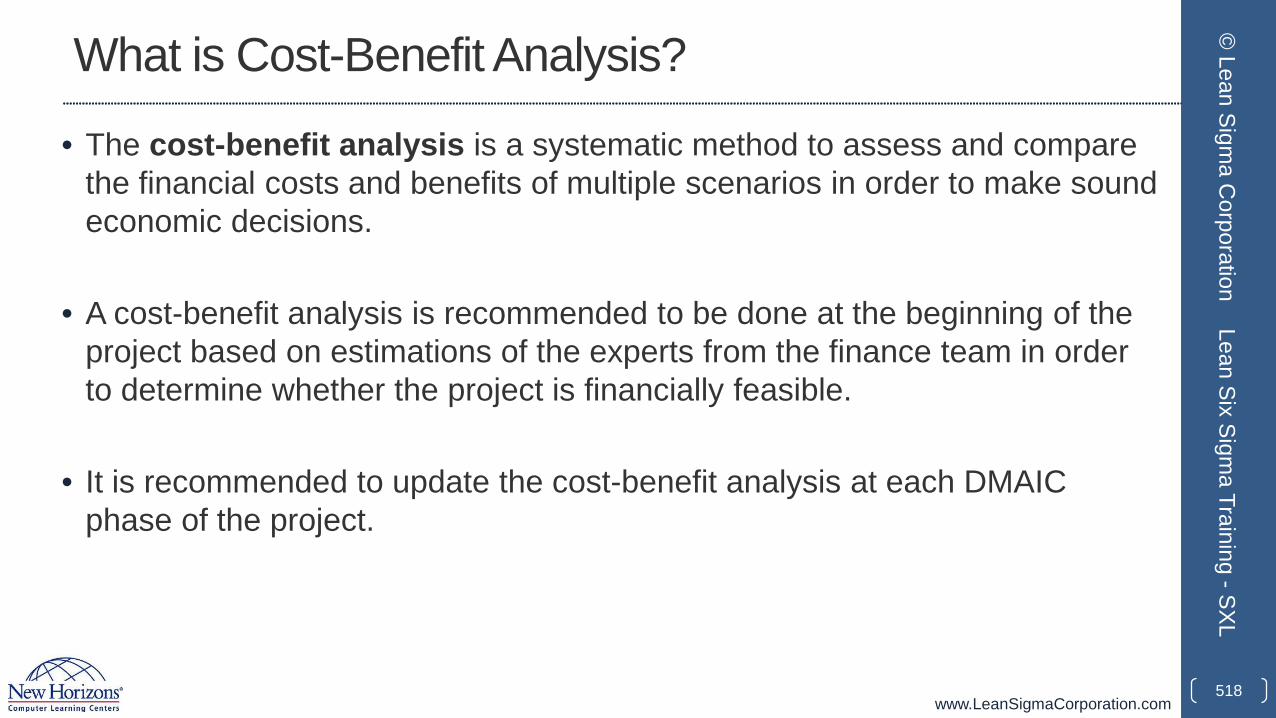
www.LeanSigmaCorporation.com
What is Cost-Benefit Analysis?
• The cost-benefit analysis is a systematic method to assess and compare the financial costs and benefits of multiple scenarios in order to make sound economic decisions.
• A cost-benefit analysis is recommended to be done at the beginning of the project based on estimations of the experts from the finance team in order to determine whether the project is financially feasible.
• It is recommended to update the cost-benefit analysis at each DMAIC phase of the project.
518
© Lean Sigm
a Corporation
Lean Six Sigma Training -SXL
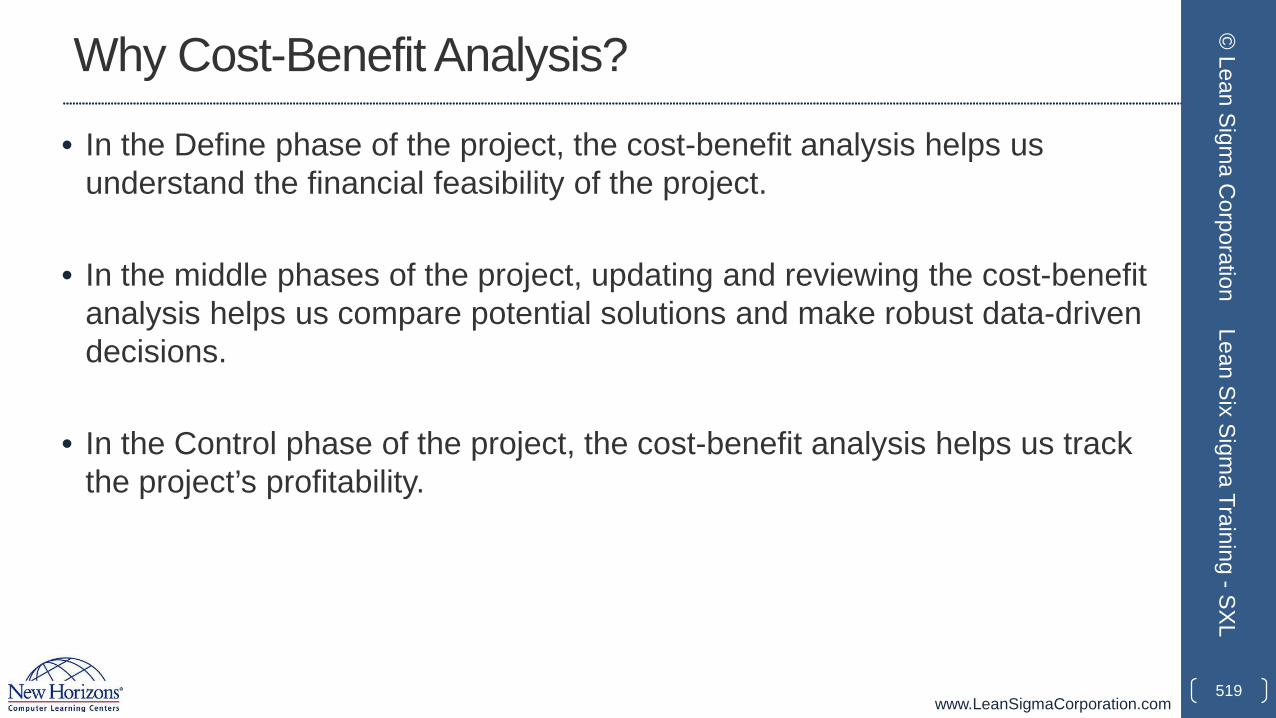
www.LeanSigmaCorporation.com
Why Cost-Benefit Analysis?
• In the Define phase of the project, the cost-benefit analysis helps us understand the financial feasibility of the project.
• In the middle phases of the project, updating and reviewing the cost-benefit analysis helps us compare potential solutions and make robust data-driven decisions.
• In the Control phase of the project, the cost-benefit analysis helps us track the project’s profitability.
519
© Lean Sigm
a Corporation
Lean Six Sigma Training -SXL
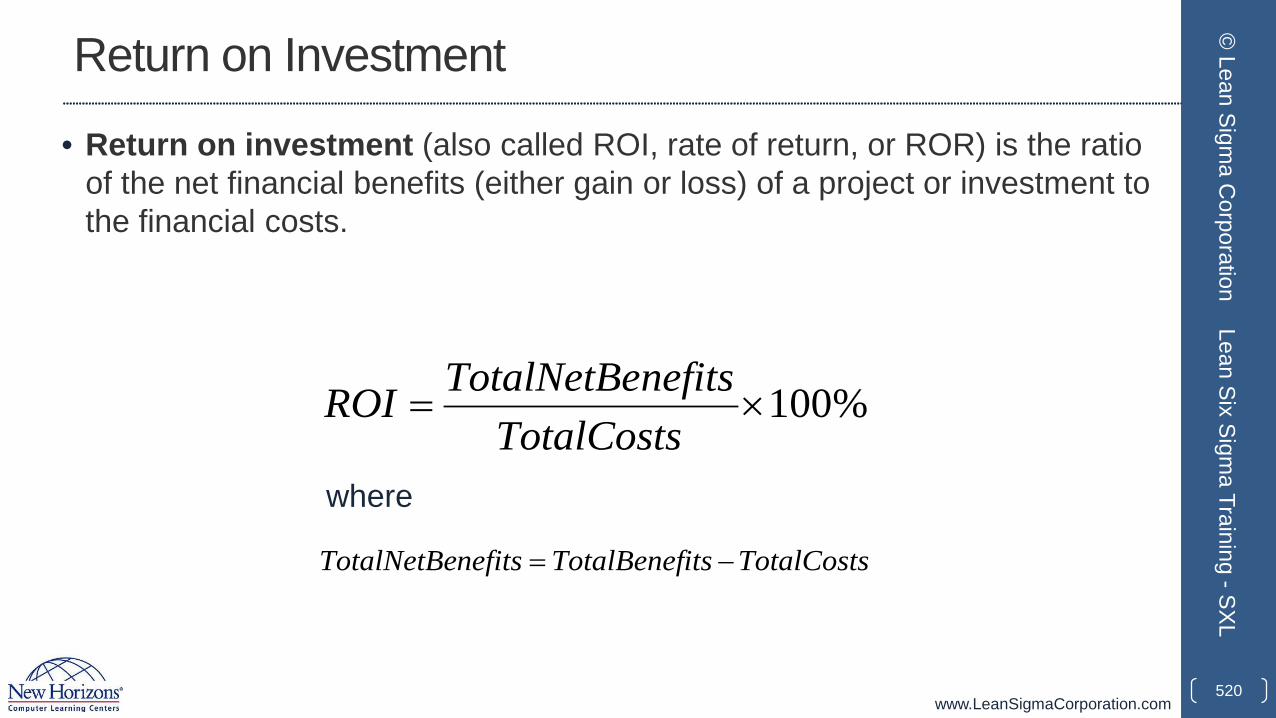
www.LeanSigmaCorporation.com
Return on Investment
• Return on investment (also called ROI, rate of return, or ROR) is the ratio of the net financial benefits (either gain or loss) of a project or investment to the financial costs.
520
© Lean Sigm
a Corporation
Lean Six Sigma Training -SXL
%100×=TotalCosts
nefitsTotalNetBeROI
where
TotalCostsitsTotalBenefnefitsTotalNetBe −=
www.LeanSigmaCorporation.com
Return on Investment (ROI)
• The return on investment is used to evaluate the financial feasibility and profitability of a project or investment.
• If ROI < 0, the investment is not financially viable.• If ROI = 0, the investment has neither gain nor loss.• If ROI > 0, the investment has financial gains.
• The higher the ROI, the more profitable the project.
521
© Lean Sigm
a Corporation
Lean Six Sigma Training -SXL
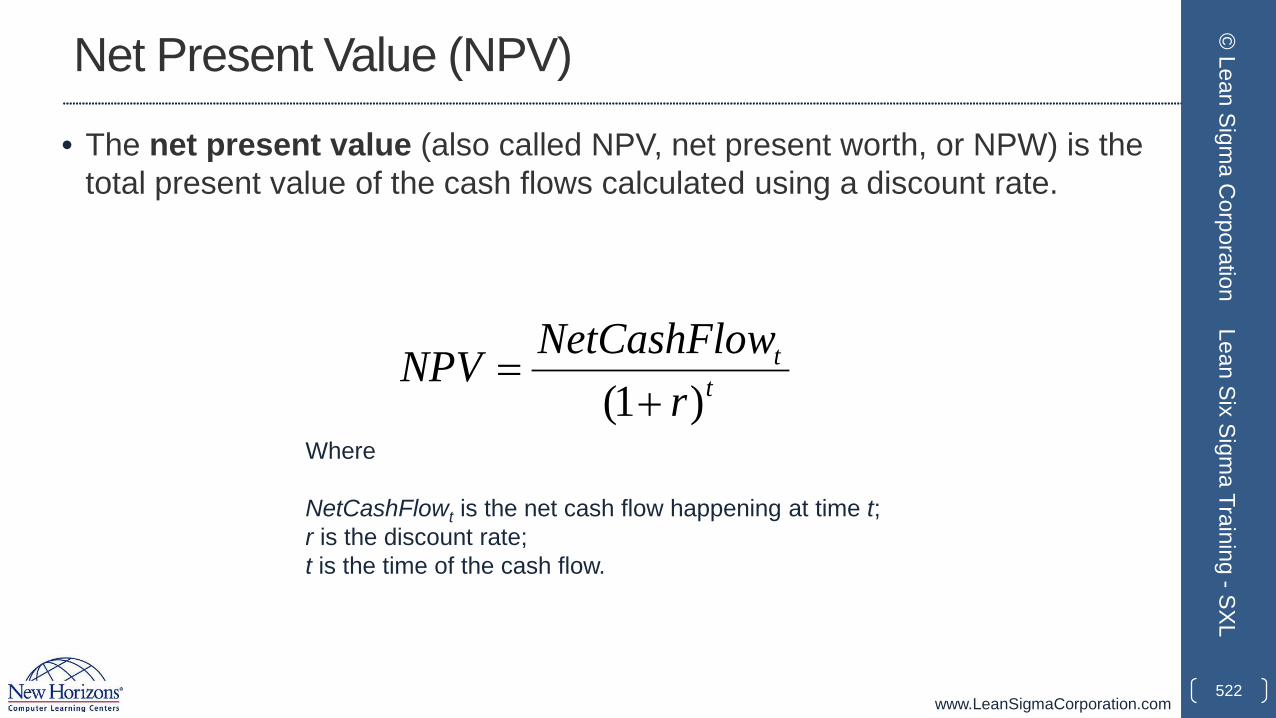
www.LeanSigmaCorporation.com
Net Present Value (NPV)
• The net present value (also called NPV, net present worth, or NPW) is the total present value of the cash flows calculated using a discount rate.
522
© Lean Sigm
a Corporation
Lean Six Sigma Training -SXL
tt
rwNetCashFloNPV
)1( +=
Where
NetCashFlowt is the net cash flow happening at time t;r is the discount rate;t is the time of the cash flow.
www.LeanSigmaCorporation.com
Cost Estimation
• Examples of costs triggered by the project:• Administration• Asset• Equipment• Material• Delivery• Real estate• Labor• Training• Consulting.
523
© Lean Sigm
a Corporation
Lean Six Sigma Training -SXL
www.LeanSigmaCorporation.com
Benefits Estimation
• Examples of benefits generated by the project:• Direct revenue increase• Waste reduction• Operation cost reduction• Quality and productivity improvement• Market share increase• Cost avoidance• Customer satisfaction improvement• Associate satisfaction improvement.
524
© Lean Sigm
a Corporation
Lean Six Sigma Training -SXL
www.LeanSigmaCorporation.com
Challenges in Cost and Benefit Estimation
• Different analysts might come up with different cost and benefit estimations due to their subjectivity in determining:• The discount rate• The time length of the project and its impact• Potential costs of the project• The tangible/intangible benefits of the project• The specific contribution of the project to the relevant financial gains/loss.
525
© Lean Sigm
a Corporation
Lean Six Sigma Training -SXL

www.LeanSigmaCorporation.com
3.2.2 Elements of Control Plans
526
© Lean Sigm
a Corporation
Lean Six Sigma Training -SXL
www.LeanSigmaCorporation.com
Control Plans• The control plans ensure that the changes introduced by a Six Sigma
project are sustained over time.• Benefits of the Control phase:
• Methodical roll-out of changes including standardization of processes and work procedures
• Ensure compliance with changes through methods like auditing and corrective actions
• Transfer solutions and learning across the enterprise• Plan and communicate standardized work procedures• Coordinate ongoing team and individual involvement• Standardize data collection and procedures• Measure process performance, stability, and capability• Plan actions that mitigate possible out-of-control conditions• Sustain changes over time.
527
© Lean Sigm
a Corporation
Lean Six Sigma Training -SXL
www.LeanSigmaCorporation.com
What is a Control Plan?
• A control plan is a management planning tool to identify, describe, and monitor the process performance metrics in order to meet the customer specifications steadily.
• It proposes the plan of monitoring the stability and capability of inputs and outputs of critical process steps in the Control phase of a project.
• It covers the data collection plan of gathering the process performance measurements.
• Control plans are the most overlooked element of most projects. It is critical that a good solution be solidified with a great control plan!
528
© Lean Sigm
a Corporation
Lean Six Sigma Training -SXL
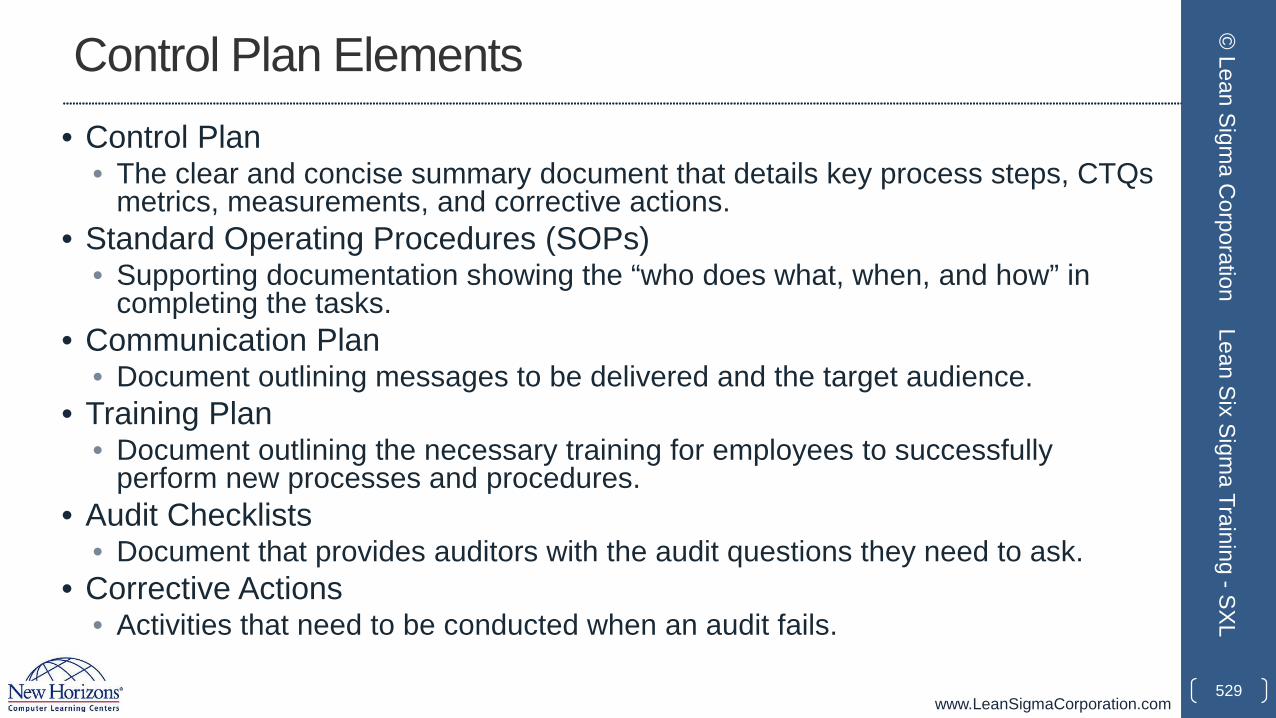
www.LeanSigmaCorporation.com
Control Plan Elements• Control Plan
• The clear and concise summary document that details key process steps, CTQs metrics, measurements, and corrective actions.
• Standard Operating Procedures (SOPs)• Supporting documentation showing the “who does what, when, and how” in
completing the tasks.• Communication Plan
• Document outlining messages to be delivered and the target audience.• Training Plan
• Document outlining the necessary training for employees to successfully perform new processes and procedures.
• Audit Checklists• Document that provides auditors with the audit questions they need to ask.
• Corrective Actions• Activities that need to be conducted when an audit fails.
529
© Lean Sigm
a Corporation
Lean Six Sigma Training -SXL
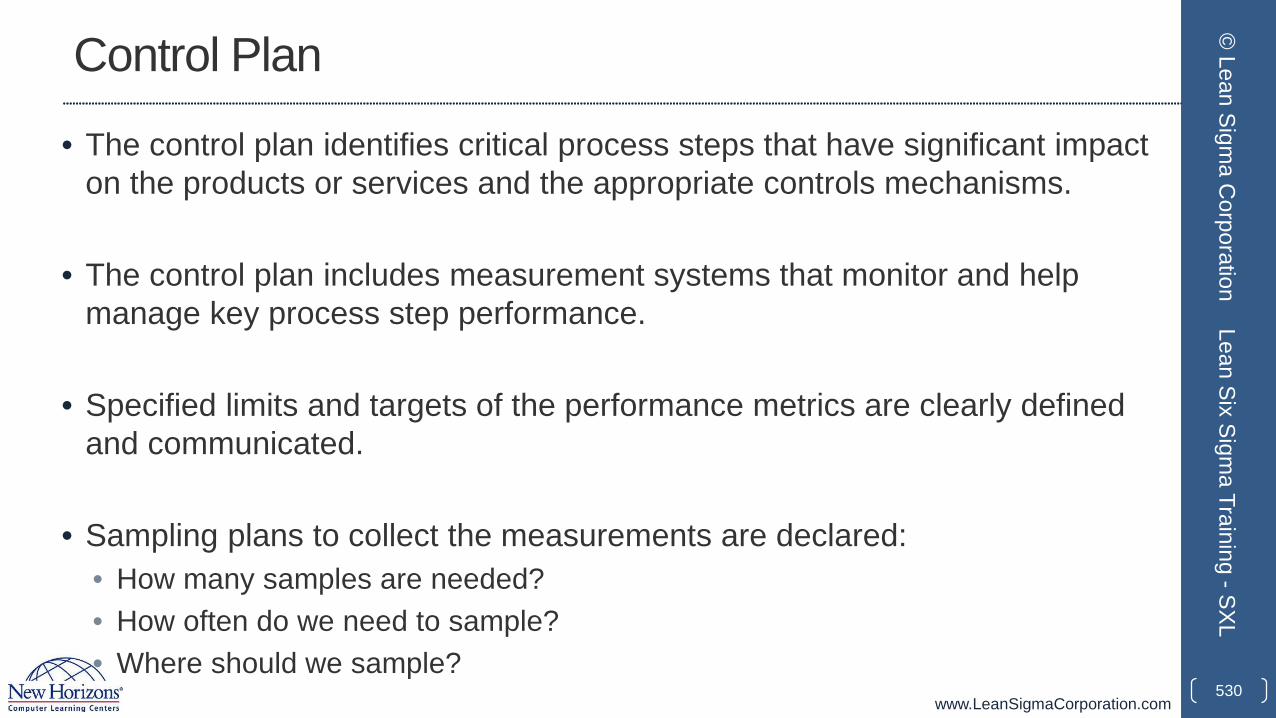
www.LeanSigmaCorporation.com
Control Plan
• The control plan identifies critical process steps that have significant impact on the products or services and the appropriate controls mechanisms.
• The control plan includes measurement systems that monitor and help manage key process step performance.
• Specified limits and targets of the performance metrics are clearly defined and communicated.
• Sampling plans to collect the measurements are declared:• How many samples are needed?• How often do we need to sample?• Where should we sample?
530
© Lean Sigm
a Corporation
Lean Six Sigma Training -SXL

www.LeanSigmaCorporation.com
Control Plan
531
© Lean Sigm
a Corporation
Lean Six Sigma Training -SXL
Key processes and process steps are identified
dCritical information regarding key measurements is documented and clarified
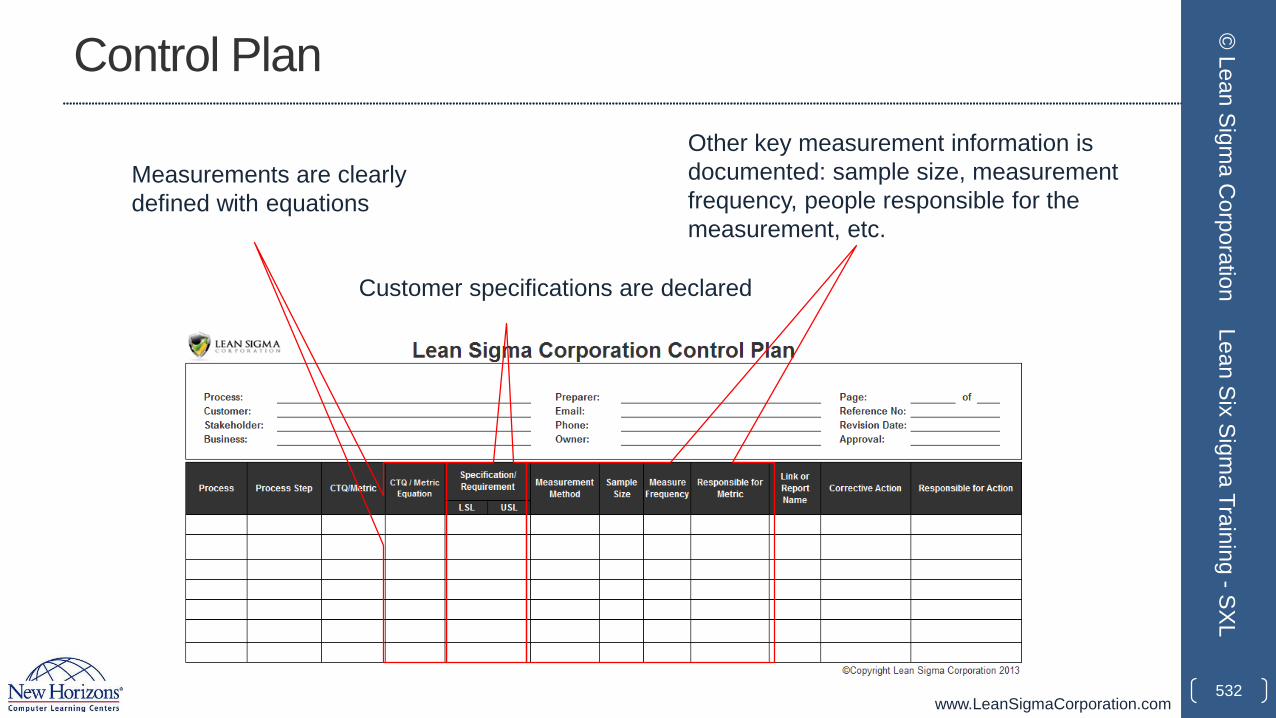
www.LeanSigmaCorporation.com
Control Plan
532
© Lean Sigm
a Corporation
Lean Six Sigma Training -SXL
Measurements are clearly defined with equations
Customer specifications are declared
Other key measurement information is documented: sample size, measurement frequency, people responsible for the measurement, etc.
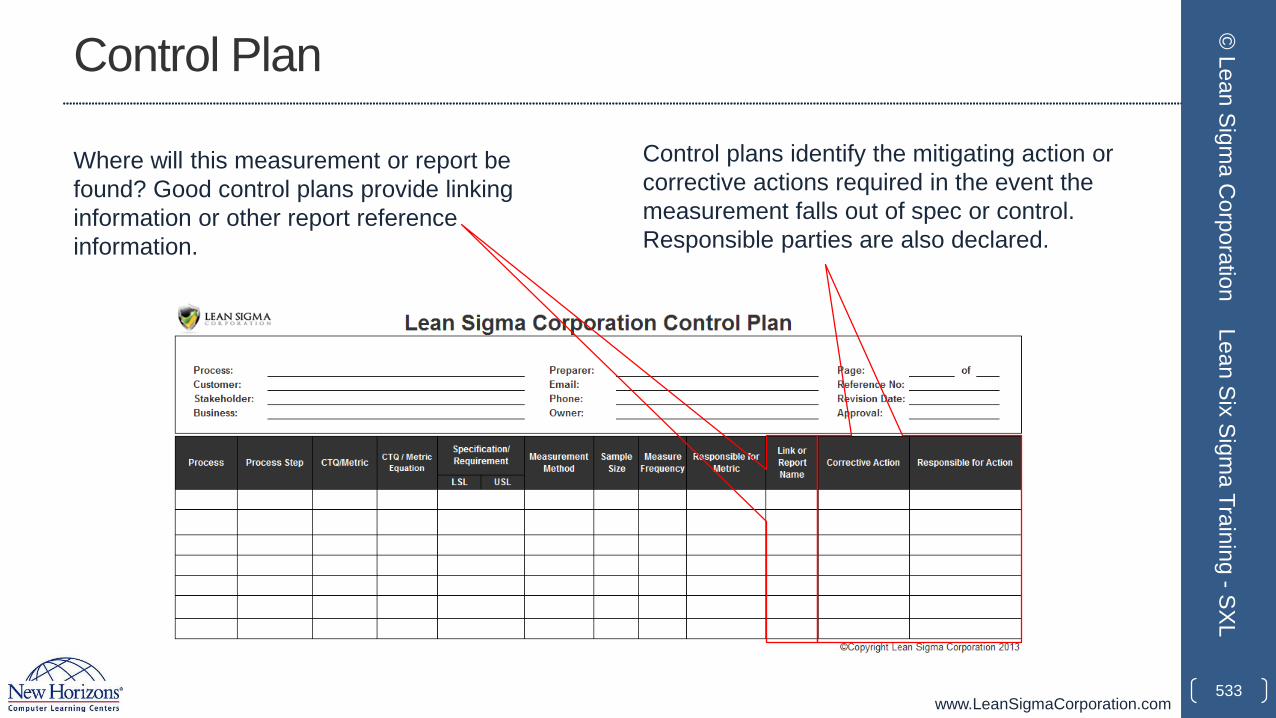
www.LeanSigmaCorporation.com
Control Plan
533
© Lean Sigm
a Corporation
Lean Six Sigma Training -SXL
Where will this measurement or report be found? Good control plans provide linking information or other report reference information.
Control plans identify the mitigating action or corrective actions required in the event the measurement falls out of spec or control. Responsible parties are also declared.
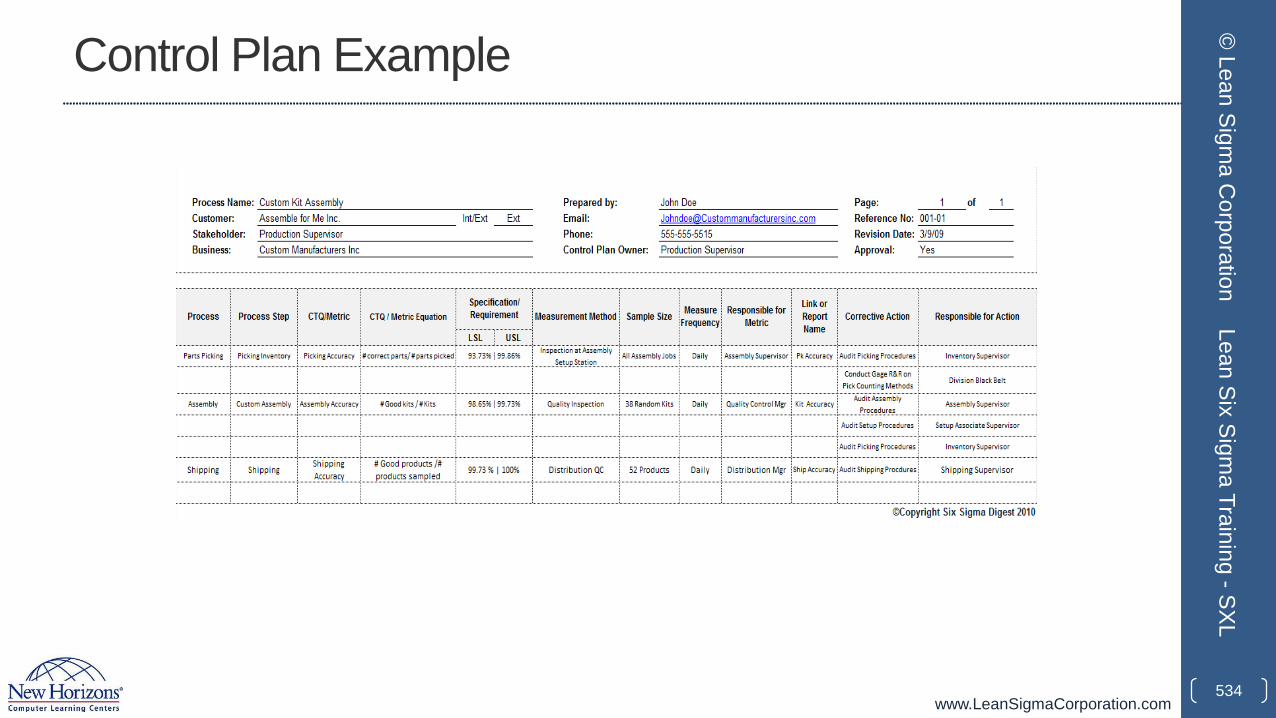
www.LeanSigmaCorporation.com
Control Plan Example
534
© Lean Sigm
a Corporation
Lean Six Sigma Training -SXL
www.LeanSigmaCorporation.com
Standard Operating Procedures (SOPs)• Standard Operating Procedures (SOPs) are documents that focus on
process steps, activities, and specific tasks required to complete an operation.
• SOPs should not be much more than two to four pages.
• SOPs should be written to the user’s level of required detail and information.• The level of detail is dependent on the position’s required skills and training
• Good SOPs are auditable, easy to follow, and not difficult to find.• Auditable characteristics are: observable actions and countable frequencies.
Results should be evident to a third party (compliance to the SOP must be measurable).
535
© Lean Sigm
a Corporation
Lean Six Sigma Training -SXL
www.LeanSigmaCorporation.com
SOP Elements
• SOPs are intended to impart high value information in concise and well-documented manner.
• SOP Title and Version Number: • Provide a title and unique identification number with version information.
• Date: • List the original creation date; add all revision dates.
• Purpose: • State the reason for the SOP and what it intends to accomplish.
• Scope: • Identify all functions, jobs, positions, and/or processes governed or affected by
the SOP.
536
© Lean Sigm
a Corporation
Lean Six Sigma Training -SXL
www.LeanSigmaCorporation.com
SOP Elements
• Responsibilities: • Identify job functions and positions (not people) responsible for carrying out
activities listed in the SOP.• Materials:
• List all material inputs: parts, files, data, information, instruments, etc.• Process Map:
• Show high level or level two to three process maps or other graphical representations of operating steps.
• Process Metrics:• Declare all process metrics and targets or specifications.
• Procedures:• List actual steps required to perform the function.
• References:• List any documents that support the SOP.
537
© Lean Sigm
a Corporation
Lean Six Sigma Training -SXL
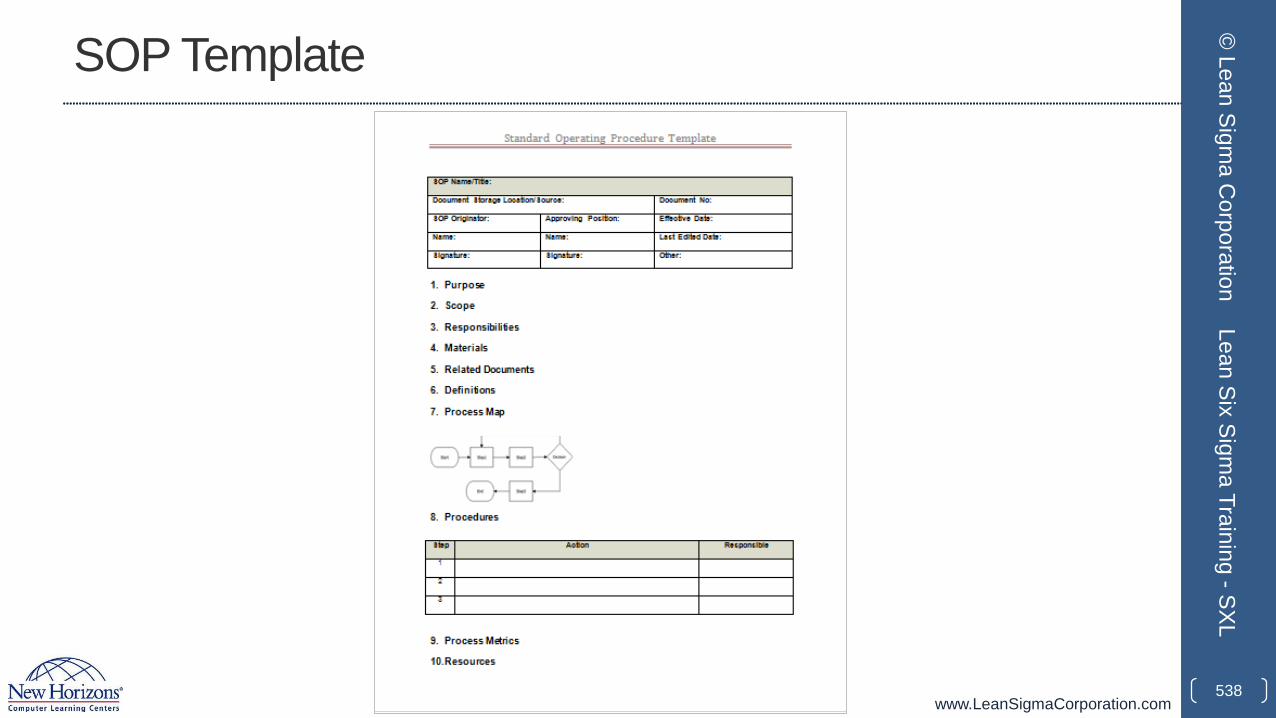
www.LeanSigmaCorporation.com
SOP Template
538
© Lean Sigm
a Corporation
Lean Six Sigma Training -SXL
www.LeanSigmaCorporation.com
Communication Plans• Communication plans are documents that focus on planning and preparing for
the dissemination of information.
• Communication plans organize messages and ensure that the proper audiences receive the correct message at the right time.
• A good communication plan identifies:• Audience• Key points/message• Medium (how the message is to be delivered)• Delivery schedule• Messenger• Dependencies and escalation points• Follow-up messages and delivery mediums.
• Communication plans help develop and execute strategies for delivering changes to an organization.
539
© Lean Sigm
a Corporation
Lean Six Sigma Training -SXL
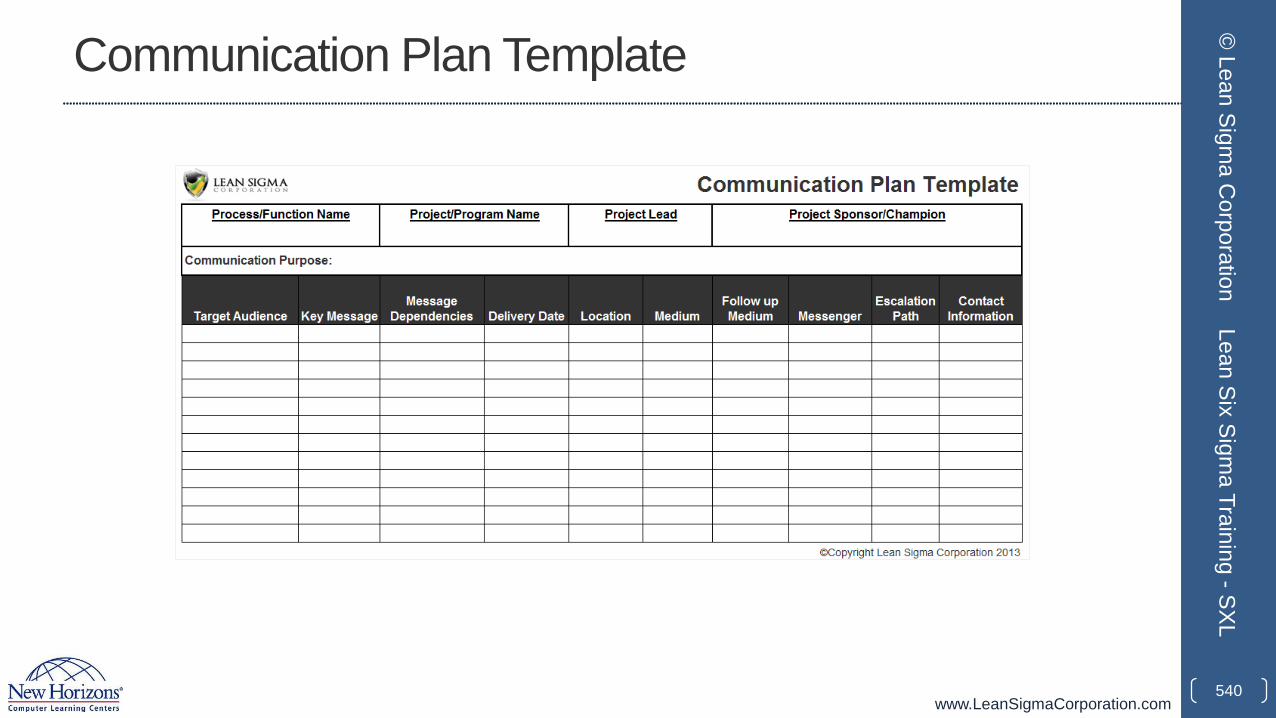
www.LeanSigmaCorporation.com
Communication Plan Template
540
© Lean Sigm
a Corporation
Lean Six Sigma Training -SXL
www.LeanSigmaCorporation.com
Training Plans• Training plans are used to manage the delivery of training for new processes and
procedures.
• Most GB or BB projects will require changes to processes and/or procedures that must be executed or followed by various employees.
• Training plans should incorporate all SOPs related to performing new or modified tasks.
• Training plans use and support existing SOPs and do not supersede them.
• Training plans should include logistics:• One-on-one or classroom• Instruction time • Location of training materials• Master training reference materials• Instructors and intended audience• Trainee names.
541
© Lean Sigm
a Corporation
Lean Six Sigma Training -SXL
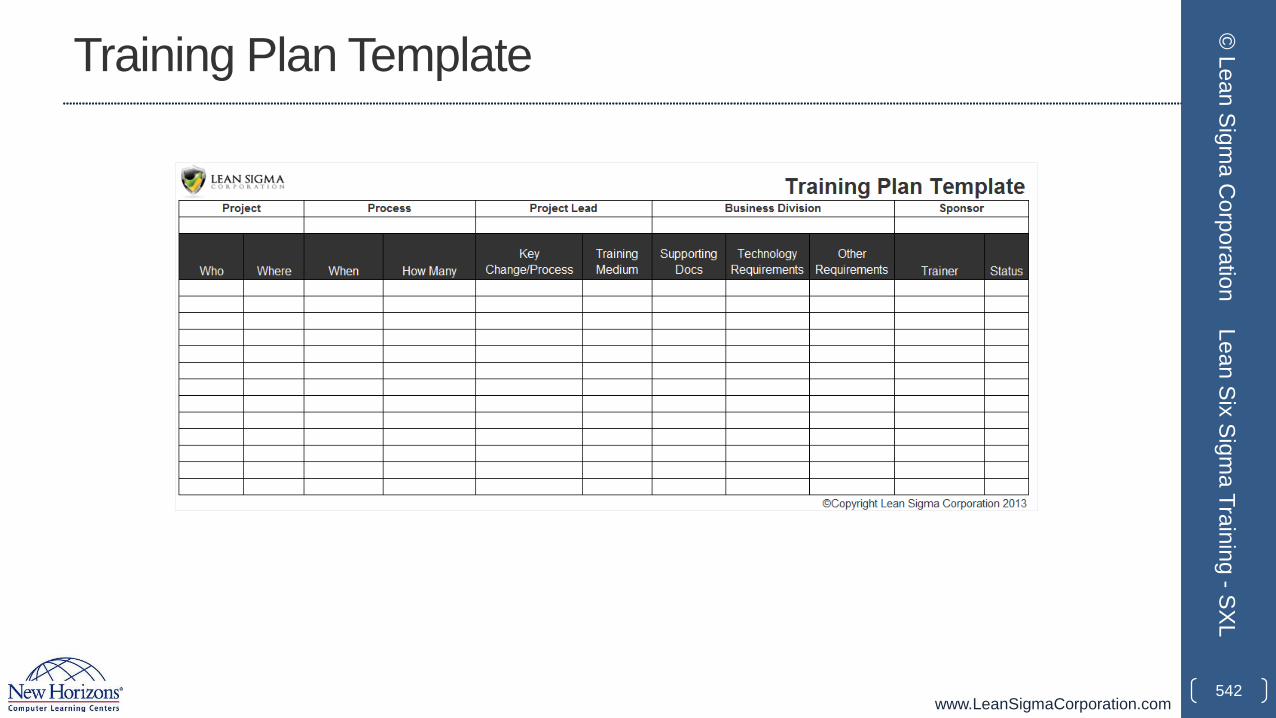
www.LeanSigmaCorporation.com
Training Plan Template
542
© Lean Sigm
a Corporation
Lean Six Sigma Training -SXL
www.LeanSigmaCorporation.com
Audits
• What is an audit?• ISO 9000 defines an Audit as “a systematic and independent examination to
determine whether quality activities and related results comply with planned arrangements and whether these arrangements are implemented effectively and are suitable to achieve objectives.”
• Audits are used to ensure actions, processes, procedures, and other tasks are performed as expected.
543
© Lean Sigm
a Corporation
Lean Six Sigma Training -SXL
www.LeanSigmaCorporation.com
Audit Guidelines• Audits should be directed by managers, supervisors, and other accountable
positions.
• An audit’s purpose must be well-defined and executed by independent unbiased personnel.
• Auditors must:• Be qualified to perform their tasks• Attend and successfully complete an internal auditing training session• Be able to identify whether or not activities are being followed according to the
defined SOP• Base conclusions on facts and objective evidence• Use a well documented audit checklist.
• Audits should confirm compliance or declare non-compliance.544
© Lean Sigm
a Corporation
Lean Six Sigma Training -SXL
www.LeanSigmaCorporation.com
Audit Checklists• Auditors should review the SOPs before preparing checklists or ensure that existing
checklists properly reference SOPs.
• Audit checklists:• Serve as guides for identifying items to be examined • Are used in conjunction with understanding of the procedure• Ensure a well-defined audit scope• Identify needed facts during audits• Provide places to record gathered facts.
• Checklists should include:• A review of training records• A review of maintenance records• Questions or observations that focus on expected behaviors• Questions should be open-ended where possible• Definitive observations yes/no, true/false, present/absent, etc.
545
© Lean Sigm
a Corporation
Lean Six Sigma Training -SXL
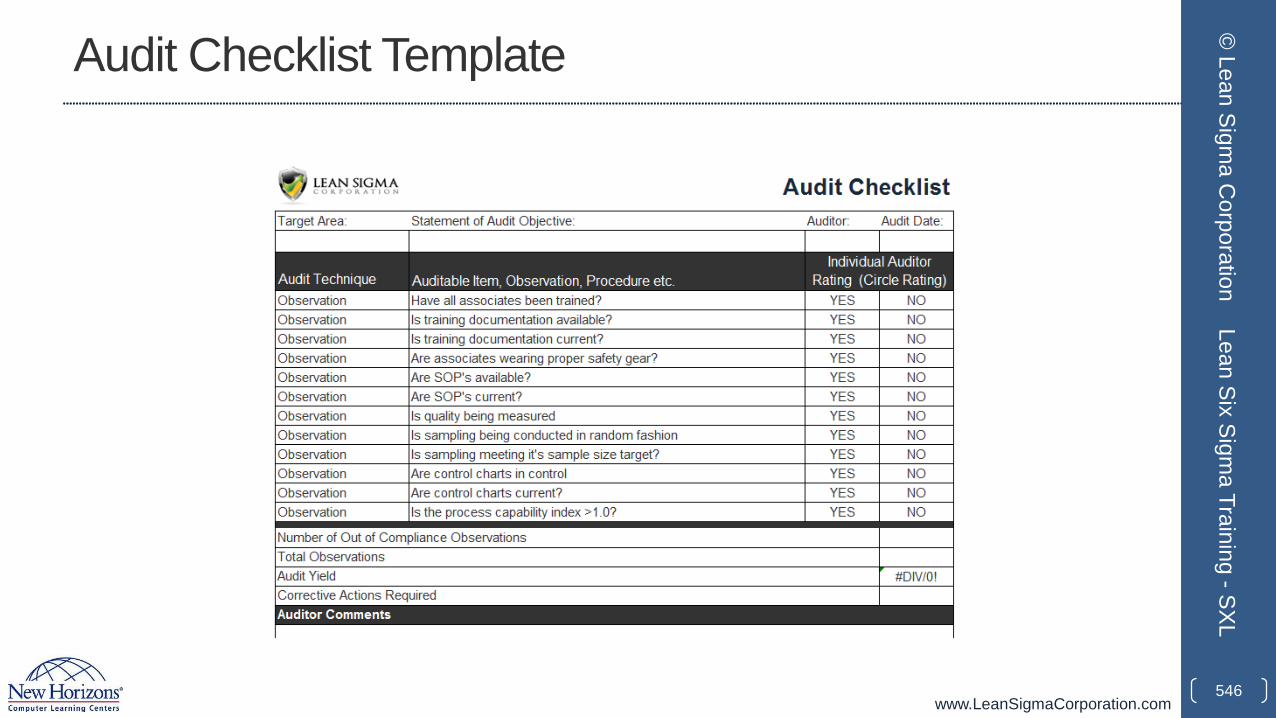
www.LeanSigmaCorporation.com
Audit Checklist Template
546
© Lean Sigm
a Corporation
Lean Six Sigma Training -SXL
www.LeanSigmaCorporation.com
3.2.3 Response Plan Elements
547
© Lean Sigm
a Corporation
Lean Six Sigma Training -SXL

www.LeanSigmaCorporation.com
What is a Response Plan?
• A response plan should be a component of as many control plan elements as possible.
• Response plans are a management planning tool to describe corrective actions necessary in the event of out-of-control situations.
• There is never any guarantee that processes will always perform as designed. Therefore, it is wise to prepare for occasions when special causes are present.
• Response plans help us mitigate risks and, as already mentioned, should be part of several control plan elements.
548
© Lean Sigm
a Corporation
Lean Six Sigma Training -SXL
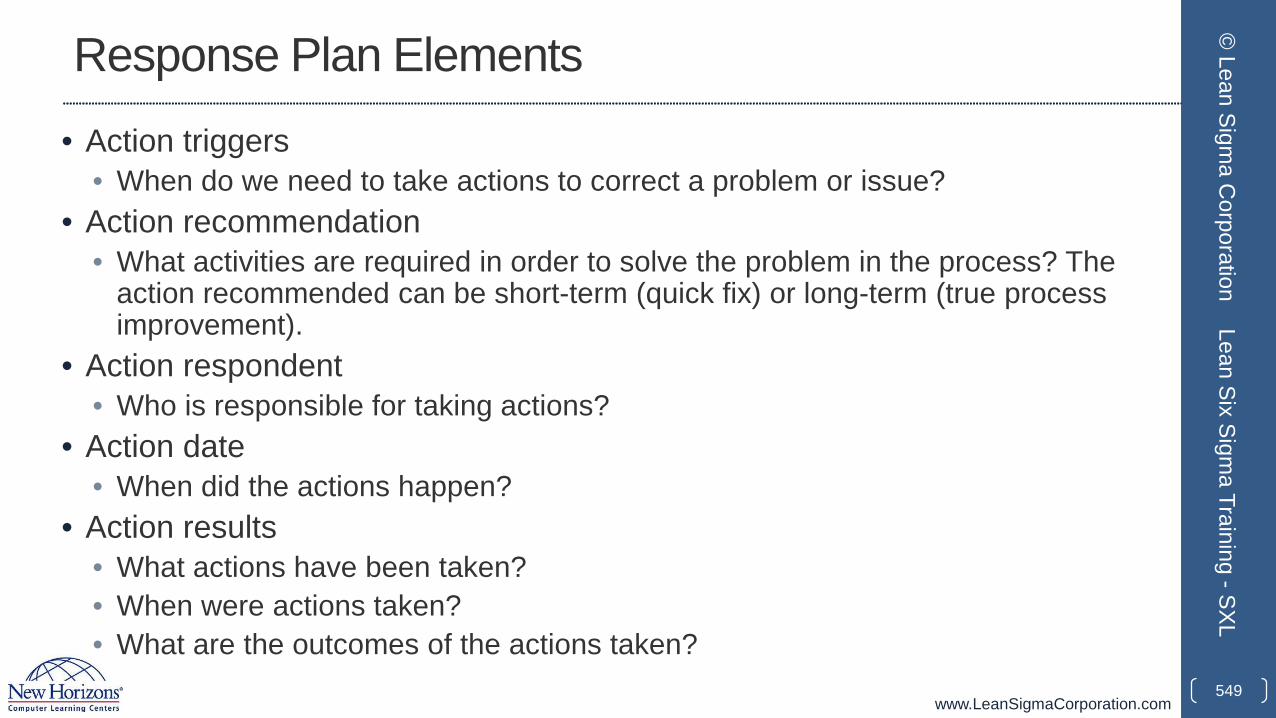
www.LeanSigmaCorporation.com
Response Plan Elements• Action triggers
• When do we need to take actions to correct a problem or issue?• Action recommendation
• What activities are required in order to solve the problem in the process? The action recommended can be short-term (quick fix) or long-term (true process improvement).
• Action respondent• Who is responsible for taking actions?
• Action date• When did the actions happen?
• Action results• What actions have been taken?• When were actions taken?• What are the outcomes of the actions taken?
549
© Lean Sigm
a Corporation
Lean Six Sigma Training -SXL
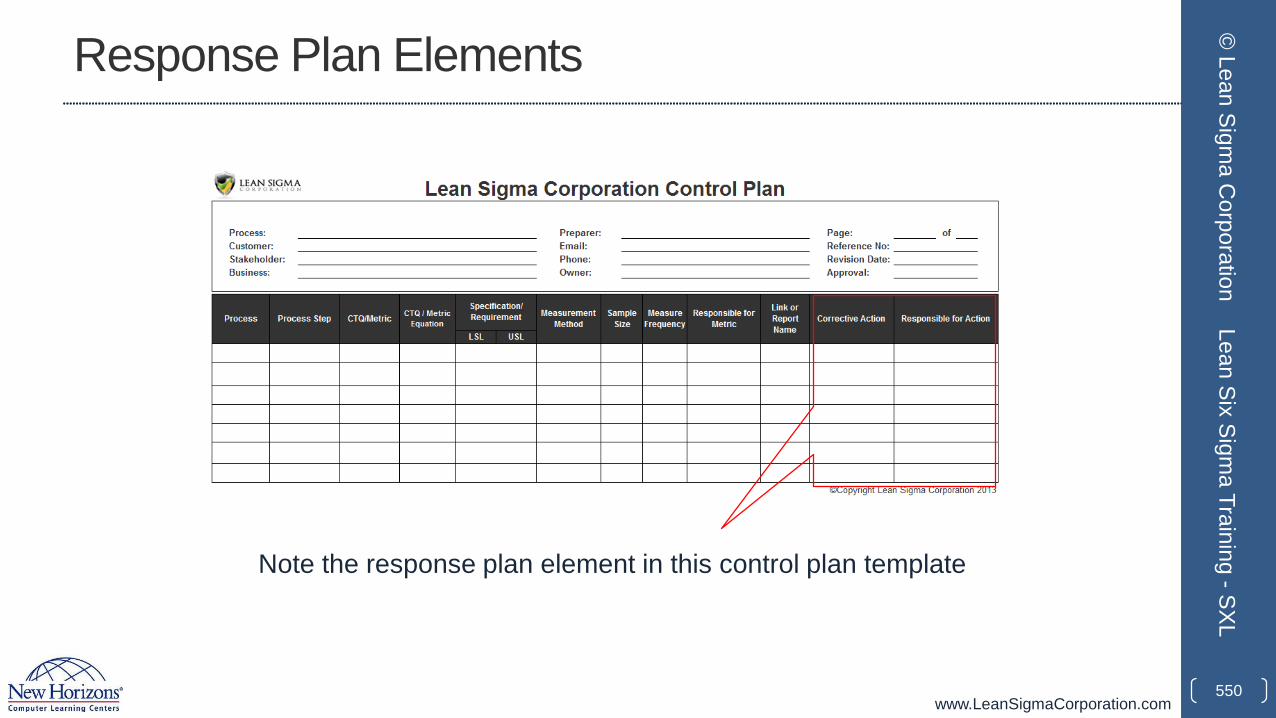
www.LeanSigmaCorporation.com
Response Plan Elements
550
© Lean Sigm
a Corporation
Lean Six Sigma Training -SXL
Note the response plan element in this control plan template
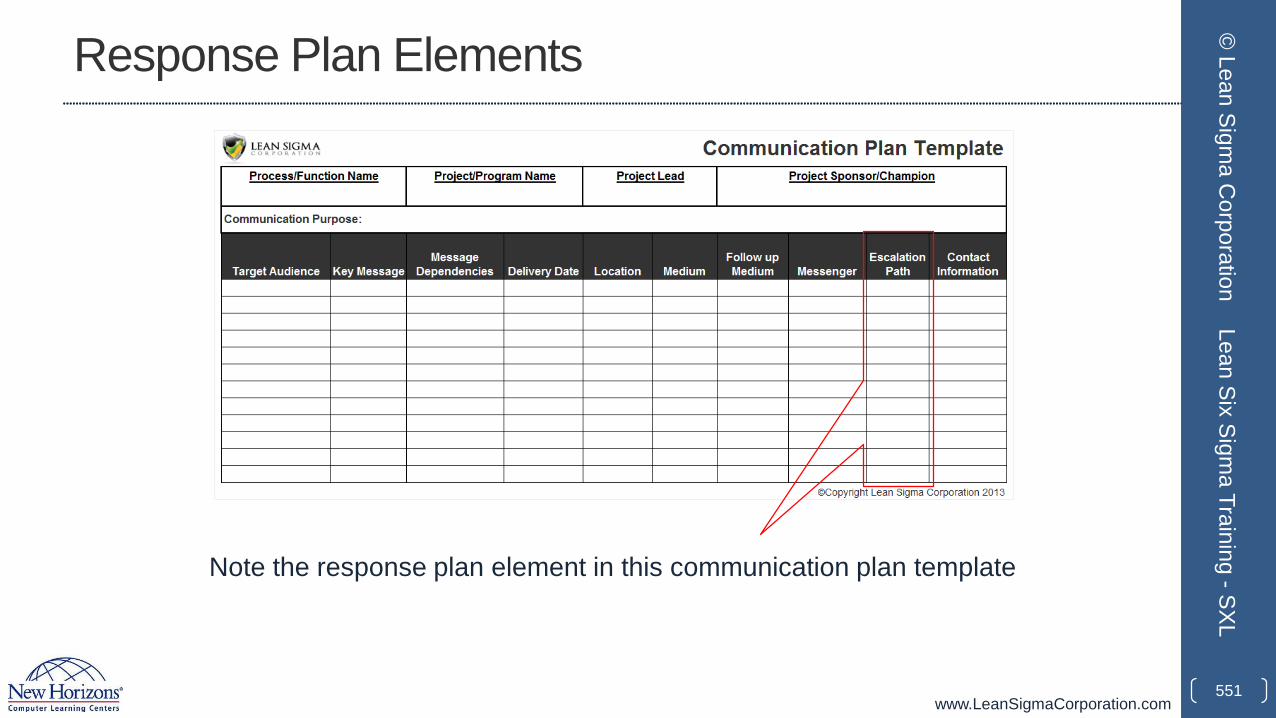
www.LeanSigmaCorporation.com
Response Plan Elements
551
© Lean Sigm
a Corporation
Lean Six Sigma Training -SXL
Note the response plan element in this communication plan template
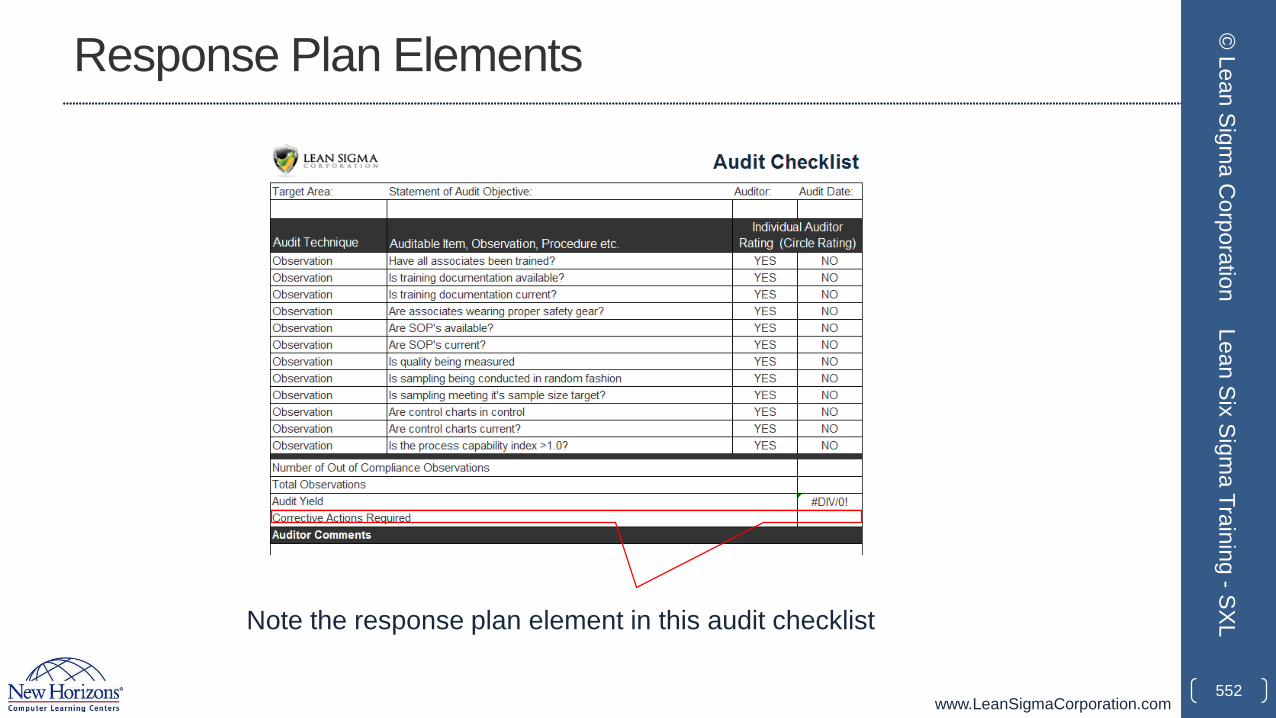
www.LeanSigmaCorporation.com
Response Plan Elements
552
© Lean Sigm
a Corporation
Lean Six Sigma Training -SXLNote the response plan element in this audit checklist
www.LeanSigmaCorporation.com553
© Lean Sigm
a Corporation
Lean Six Sigma Training -SXL
Lean Six Sigma Yellow Belt Training Featuring Examples from SigmaXL