Embed Size (px)
Citation preview

Lean Six Sigma
Project
Management in the
Public Sector
Resource Handbook

What is Lean Six Sigma?
Our mission Our vision
Lean Six Sigma (LSS) is a process improvement methodology used in private and public industries around the world to
streamline business process through waste elimination and analyze solutions for improvement using numbers.
Develop a culture in the workplace that cultivates the cycle of continuous improvement by using Lean Six Sigma tools.
Inspire and empower all staff to continuously improve operations by
challenging the status quo.
Define Measure Analyze Improve Control

Identify and control root causes of variance and defects
Increase speed
Understand customer requirements
Empower employees to improve efficiency and effectiveness of processes
Eliminate Errors and Variability
Develop solutions to institutional problems based on data, not just assumptions
Improve process understanding
Reduce operational cost
Why does RR/CC Use LSS?

What is the Program About?
As a Lean Department, projects can range from business process improvement in a section to root cause analysis of a public service problem.
Unique to RR/CC – Our process improvement program is a model for the County. We are the first to institutionalize LSS, under the oversight of the Executive Office; we have a dedicated team of experts throughout the entire department, affecting meaningful change every day.
We have the opportunity to innovate in every project, bringing a unique skill set from the Lean Six Sigma training we receive (i.e. process mapping, waste analysis, data driven decision making, facilitation, brainstorming.
Pioneering program – trained over 2,200 Yellow Belt, 700 Green Belts and 23 Black Belts Countywide.
Idea Boards facilitate discussion of problems/solution and assist operations in implementing process improvements.

Structure and Roles
Meets with each Champion to get updates on completed and in process projects for each section.
The Facilitator is the leader of process improvement in a specific operation.
• Ensure that meetings are scheduled twice amonth and are rescheduled in the event of acancellation.
• Facilitate idea board meetings, fill outSummary Sheets, use Trello to track projectprogress and listen to the ideas of staff.
• Attend meetings with other sections/bureausas it relates to their projects
• Use LSS tools to complete projects thatemerge from the boards.
• Transmit Summary Sheets to the Consultantas they are updated.
• Monitors the performance of all the IdeaBoards;
• Ensures that process improvementmethodologies; (e.g. DMAIC, core processmapping, are being implemented)
• Provide project support as needed for allIdea Boards.
• Schedule meetings with other bureauConsultants and Idea Board teams todiscuss emergent issues in which a processextends outside of the bureau or section.
• Attend Idea Board meetings frequently toensure LSS tools are being used to achievecompletion.
• Meet with Champions and QualityAssurance to provide updates.
• Meets with the Consultant monthly to receiveSummary Sheets, give approvals as neededand get project updates of all the boards inthe bureau.
• Ensure that all process improvementopportunities are given a chance to becompleted and they remove any obstaclesor give any approvals needed at the Divisionlevel.
• Take action on lean goals set on transferredroad map.
Receives progress reports on completed/ in process projects, and program development from Chief Deputy.
CONSULTANT
CHIEF DEPUTY
CHAMPION
FACILITATOR
DEPARTMENT HEAD

TWO WAYS TO HIT LSS H MERUNS
WINNER!HOMERUN!!(Monthly parking pass) Idea Board
Complete Summary Sheet
(Collected every 60 days)
Process Improvement in Section
(Include Consultant, if necessary)
Share w/ Champions
Complete Summary Sheet
(Collected every 60 days)
Presentation to Champions &
Executive Office
Green Belt Project(Add Consultant & Key Players)
Idea Board
Quick hits
“Low-hanging fruit”
Improvement is made solely within section
May not require high level approval
ALL STAFF FACILITATORS, ASSISTANT FACILITATORS & CO-FACILITATORS
What is a Yellow Belt Level Project?Yellow Belt Homerun:
Requires coordination and collaboration outside of section
High impact & high effort
Requires high level assistance
What is a Green Belt Level Project?Green Belt Homerun:
WINNER! HOMERUN!!(Departmental Recognition)

IDENTIFY PROBLEM
SIPOC THE PROCESS
GEMBA WALK(Observe the process)
IDENTIFY ROOT CAUSE(S)(Analyze the process)
IMPLEMENT SOLUTION(Map new process)
PROCESS MAP
1
2
3
4
5
6
IDEA BOARD LANDSCAPE

Idea Board Rules
Idea Board attendance and participation is strongly encouraged
All ideas are discussed
Identify root causes/problems from every idea
Meetings should be held at least twice a month
Facilitators are empowered to improve a process within their sections
Each Board should have a designated note taker
Each Board should work on at least one project at a time
All projects should be documented on a Summary Sheet
Use Trello to manage project progress

Measure Analyze Improve Control
LSS SUMMARY SHEET
Date:
Date Approved by Quality Assurance:
Idea Board
Non-Idea Board
Improvement(s) + Benefit(s) (New Data)
Define Project Team Members:
Define the Problem or Defect
Measure the Problem or Defect (Data)
Analyze the Root Cause of the Problem or Defect
Control/Plan for Sustainability
Section:
Consultant:

Measure Analyze Improve Control
LSS SUMMARY SHEET REFERENCE GUIDE
Improvement(s) + Benefit(s) (New Data)
Define
Define the Problem or Defect
Measure the Problem or Defect (Data)
Analyze the Root Cause of the Problem or Defect
Control/Plan for Sustainability
• Explain the current process• Describe the problem or defect in the process• Explain who is impacted by this problem or defect (i.e. customers, department, section, etc.)
Provide data to measure the problem or defect in the current process Cycle Time (i.e. Daily, Monthly, Annually, etc.) Defect Rate Cost Inefficiency (i.e. excessive overtime, expendable supplies, etc.)
• Describe the main source of the problem or defect• Apply the “5 Whys” methodology to the analysis
Asking “Why?” until the root cause is identified by each question
• Describe in detail the solution implemented• Provide the improvement results• Provide the data comparison from pre-improvement + post-improvement
Savings (i.e. time savings, cost savings, etc.)• Defect Rate (% reduction)
• Develop a plan for sustaining the improvement(s) implemented• Explain what methods were applied to ensure sustainability
(i.e) Training, Policies + Procedures, Process Maps, Etc.
Key TermsCycle Time - Work Time + Wait TimeDefect - Inaccurate and/or incomplete information, services or products. Errors that occur in the process over and over.

efects – Something that does not meet customer requirements.
verproduction – Making or producing something that no one will buy or use.
aiting – Work is not completed due to waiting for a previous step to �nish their work.
on-Utilized Talent – Employee creativity is not encouraged and an organization misses out on valuable input.
ransportation (Touches) – When a product is being transported, no value is being added to it.
nventory - Inventory is product that is there due to some ine�ciency or uncertainty; it takes up space.
otion – Motion of the people in a process means more time and energy required for the job to get done.
xtra-Processing – Unnecessary steps that bog down a process, increase lead time, and impede e�ciency
D
O
W
N
T
I
M
E
The 8 WastesLean Process: Remove waste or any activity not required to complete a process.
What are the 8 Wastes?
• Eliminate the cause of the waste where possible
• Simplify the process or step that is creating the waste
• Streamline—especially with complex processes
• Minimize the amount of waste in the process
What to do with the waste?
Los Angeles County Registrar-Recorder/County Clerk

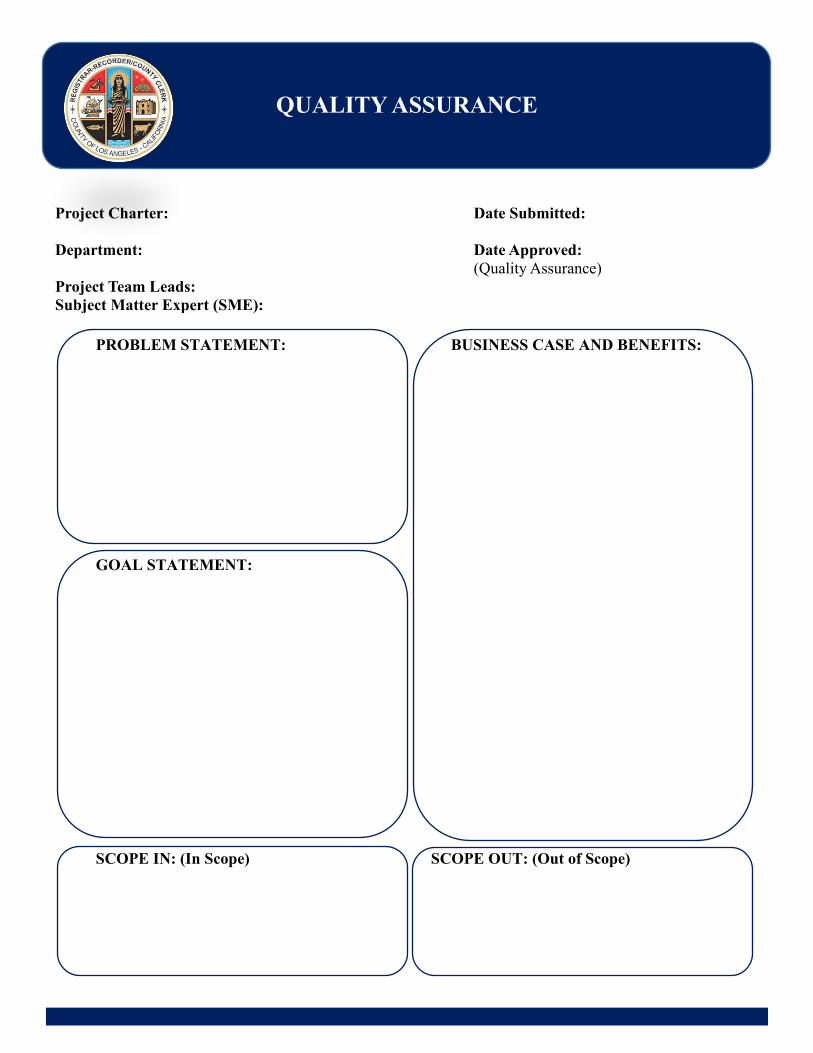
PROBLEM STATEMENT:
Describe the current issue(s) theteam is trying to resolve.
Explain why you think the issue isoccurring and the current process.
Be specific on who is impacted bythis issue and how they are impacted.*Provide preliminary data (e.g. how often thisoccurs, how many people are impacted, etc.)*
QUALITY ASSURANCE
Q: Why do we need to complete a Project Charter?
A: A Project Charter is the 1st step to starting a project at Green Belt level or higher, and it allows us to define the scope of the project, define the issue(s), set a clear goal/outcome, and project the anticipated subsequent benefits to the Organization/Customers.
BUSINESS CASE AND BENEFITS:
Explain why the issue(s) should beresolved.
GOAL STATEMENT:
Define the goal of this project. What isthe team trying to resolve?
Explain if the goal is to reduce cycletime, decrease error rate (defect), etc.Describe the exact area/step in theprocess where the improvement istargeted.
*Provide preliminary data [e.g. reduce thenumber of occurrence by(x), increaseaccuracy by (x),etc.]*
Describe the potential outcome if noaction were taken to remedy theproblem.
List the potential benefits for theorganization that could result fromthe project (I.E. Compliance,Customer Service, etc.)
SCOPE IN: (In Scope) SCOPE OUT: (Out of Scope) List the things that are within
your scope/control to change.(I.E. Internal processes, TrainingDevelopment, etc.)
List the things not that are not withinyour scope/control to change.(I.E. Dept. Policy, System Design,State/Federal mandates)
LAvote.net 12400 Imperial Highway, Norwalk, CA 90650
QUALITY ASSURANCE
Project Charter: Date Submitted:
Department: Date Approved: (Quality Assurance)
Project Team Leads: Subject Matter Expert (SME):
PROBLEM STATEMENT: BUSINESS CASE AND BENEFITS:
GOAL STATEMENT:
SCOPE IN: (In Scope) SCOPE OUT: (Out of Scope)

TEAMS SHOULD ABIDE BY THE FOLLOWING:
DOCUMENTATION
DATA
BE A GOOD LISTENER
GEMBA WALK
RULESGemba is a Japanese term meaning: the 'real place'
Introduction.
Your subject matter expert (SME) may never haveparticipated in a gemba walk. It is important tomention the purpose of a gemba walk, namely, toobserve and learn about the process from a SME. It is not a test!
Detailed note taking of each process step iskey to producing a detailed process map.
With the exception of the lead interviewer, all teammembers should take detailed notes of processsteps and commentary from the SME. Following thegemba walk, all notes should be used to create adetailed process map.
Obtain metrics from SME.
Prior to gemba walk, metrics should have beenidentified for the project. During gemba walk, inquirewhere or how data could be obtained. Additionally,collect anecedotal evidence from SME (i.e. cycletime).
Refrain from educating, informing orcorrecting the SME.
If a team member has additional knowledge orinformation regarding the process, discuss during aseparate project meeting. Be accepting of any ideas,suggestions and/or recommendations, even if theymay not be feasible.

Gemba Process Walk
Date:
Interviewer:
Interviewee:
Step: Process Step Name:
Questions Notes 1. How Many Staff work in this step of the
process?
a. Do these employees have othertasks in addition to thisprocess?
b. Of these, how many areassigned to other sections?
2. How long does it take for work to bemade available to you?
a. Are there delays in receivingwork?
3. How long does it take for you tocomplete this step?
a. Do you experienceinterruptions while working onthis step in the process?
b. How long would it take tocomplete this activity if youcould work on it uninterrupted?
4. Once this step is complete, how longdoes it take before it can be handed offto the next step in the process?
a. Are there delays in the hand-offof the work?
b. Is it batch or single piece flow?
c. How often is work moved tothe next process?
d. Are there barriers to processingat a single piece flow?
5. What percentage of the work iscomplete when received?
a. How much of the work is inprocess (WIP)?
b. What is the Oldest date of thework in process (WIP)/queue(backlog)?

6. Do you need time to set-up for yourprocess?
a. If yes, how much time isneeded?
7. How do you obtain the requiredinformation to complete this step of theprocess?
8. How do you track the progress?
a. What technology andequipment are being used?
9. Are there steps in the process that youbelieve may be unnecessary?

QUALITY ASSURANCE
Project Management Data Collection What are you measuring?
What is the Operational Definition?
What is the source of the
data?
What are stratification factors to consider?
Sampling Notes Who & How?
EX: Defects SNAG DIMS Database Sort data by City & type of snag
-25% of data-Gather data fromthe last 3 years
-Data Analytics,provide reportsvia email

Sub-cause
Sub-cause
Sub-cause
Sub-cause
Sub-cause
Sub-cause
Sub-cause
Sub-cause
Sub-cause
Sub-cause
Sub-cause
Sub-cause
Sub-cause
Sub-cause
Sub-cause
Sub-cause
Sub-cause
Sub-cause
ENVIRONMENT
MATERIALSMANAGEMENT
PEOPLE EQUIPMENT
PROCESS
PROBLEM
Fishbone Diagram

Green Belt Project Management
Hypothesis Statement(s) Examples
Possible Root Cause (x) Hypothesis Sales Cancellations Most of the cancellations are sales cancellations
Production Withdrawals Production withdrawals and “sold-outs” contribute a significant amount to the fall-off%
Pre-Book Deadline A significant amount of the cancelled orders is because the pre-book deadline was missed
Majors A high percentage of cancellations come from the large accounts (Majors)
Customer Tier Customer tier is a contributing factor to the sales cancellation percentage
Cancellation Codes There is inconsistency in the use of the cancellation codes by people entering orders

Green Belt Project Management
Hypothesis Statement(s)
Possible Root Cause (x) Hypothesis