Embed Size (px)
Citation preview
© of CBEPL
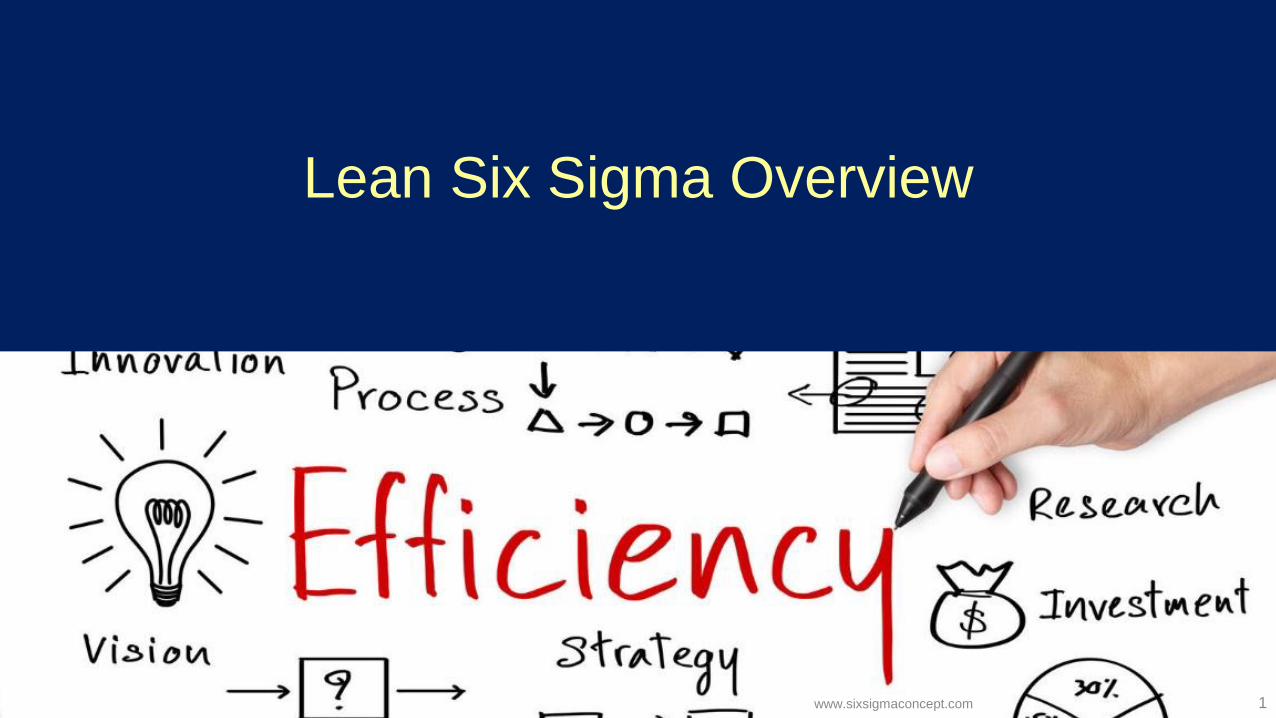
Lean Six Sigma Overview
1 www.sixsigmaconcept.com
© of CBEPL
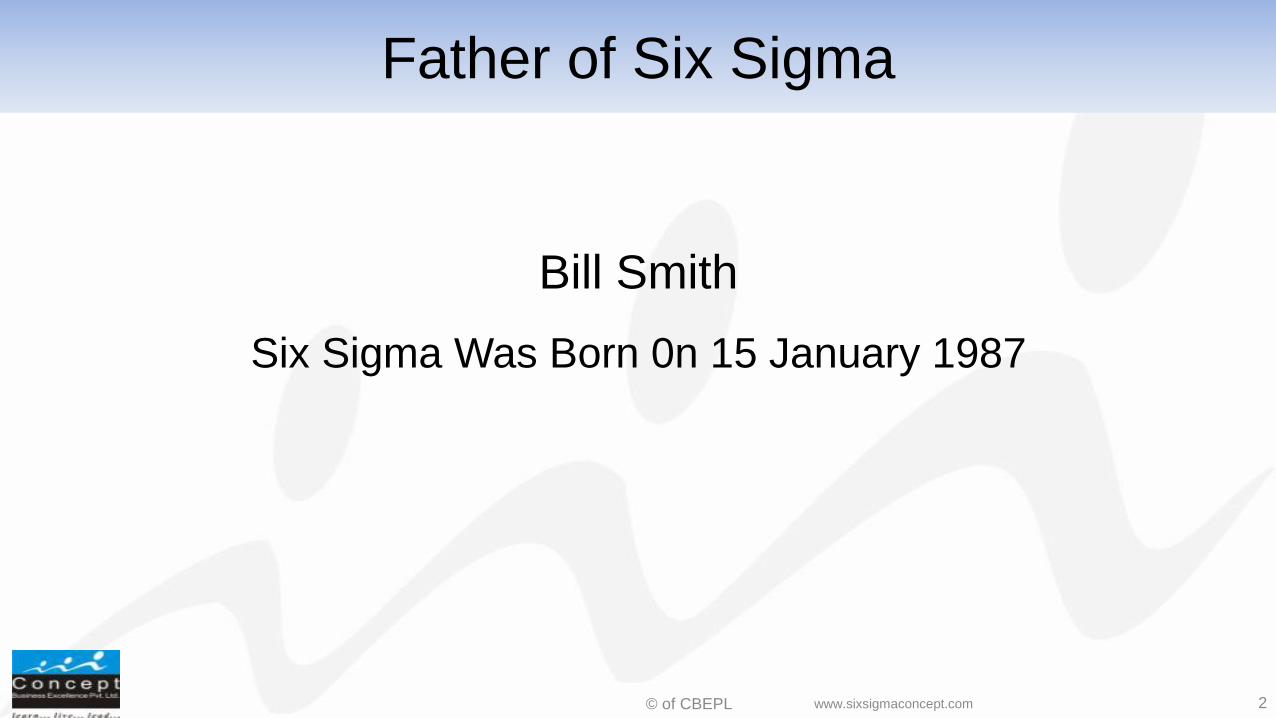
Bill Smith
Six Sigma Was Born 0n 15 January 1987
Father of Six Sigma
2 www.sixsigmaconcept.com
© of CBEPL
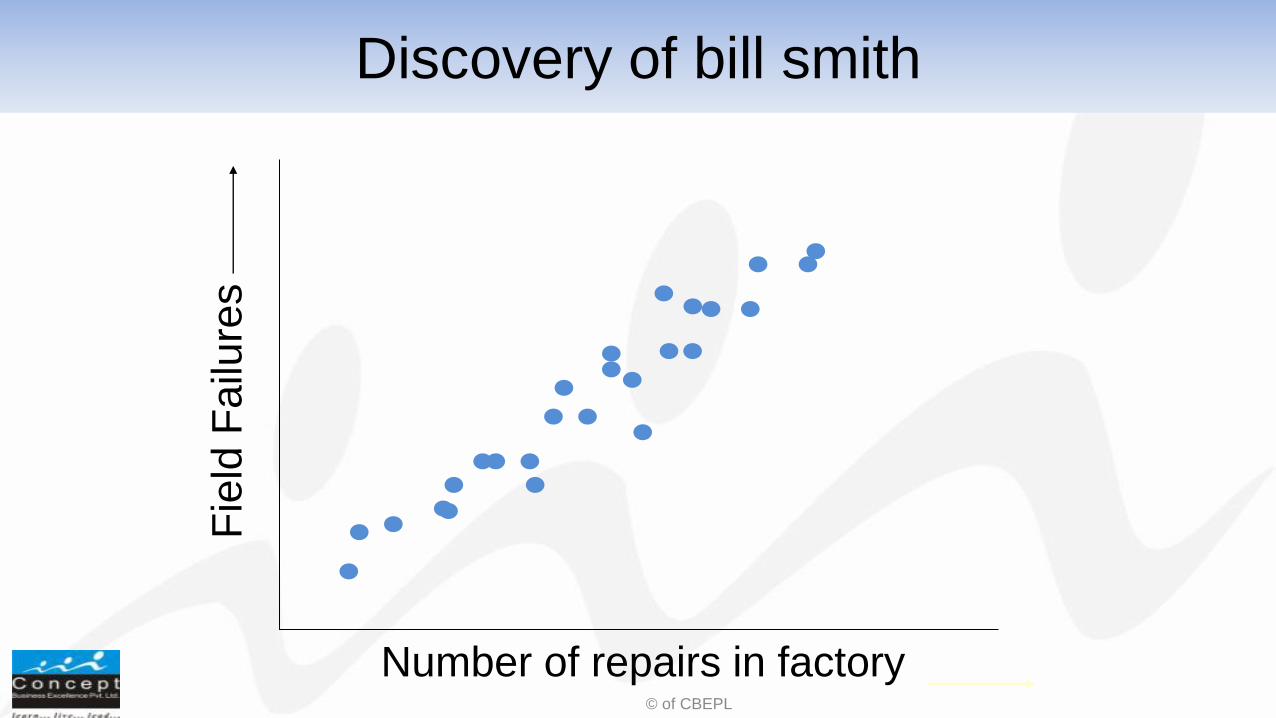
Number of repairs in factory
Fie
ld F
ailu
res
Discovery of bill smith
3 www.sixsigmaconcept.com
© of CBEPL
Realization at Motorola
• To reduce field failures, much higher level of internal quality is
required.
• Done right, improving quality will reduce cost.
• Cost of correcting poor quality ranged $800-$900 million per
year.
4 www.sixsigmaconcept.com
© of CBEPL
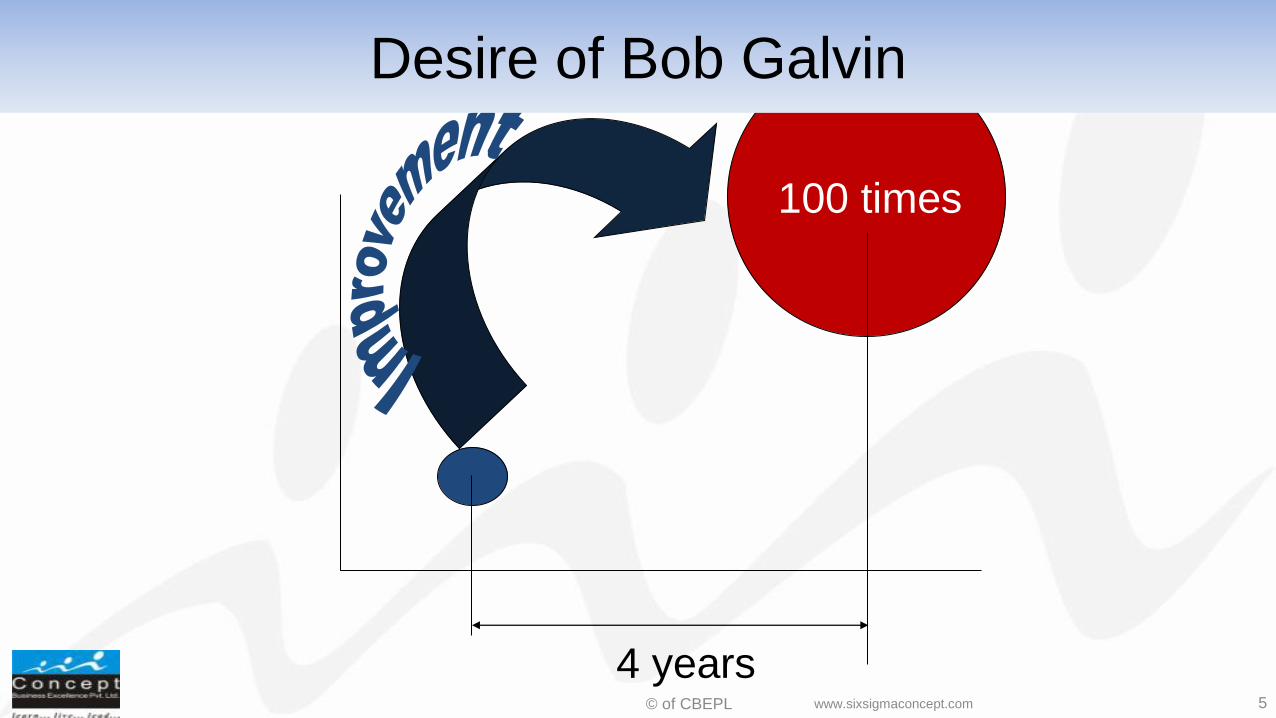
100 times
4 years
Desire of Bob Galvin
5 www.sixsigmaconcept.com
© of CBEPL
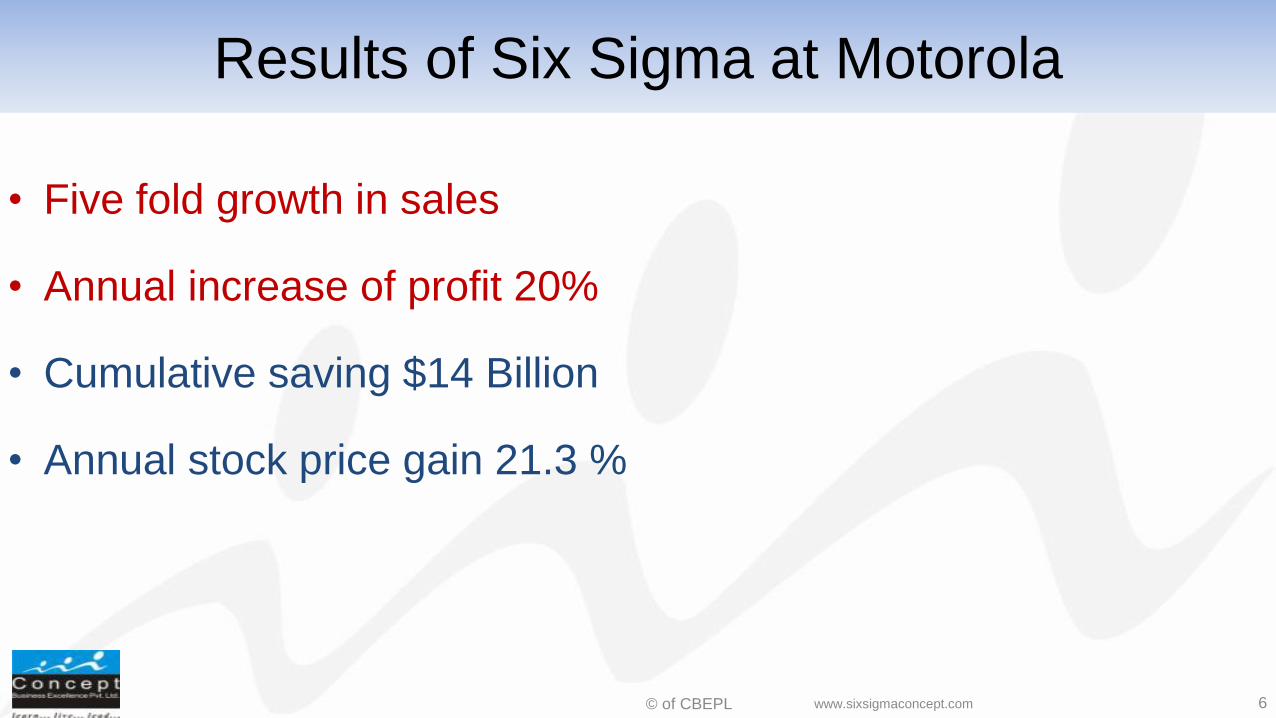
Results of Six Sigma at Motorola
• Five fold growth in sales
• Annual increase of profit 20%
• Cumulative saving $14 Billion
• Annual stock price gain 21.3 %
6 www.sixsigmaconcept.com
© of CBEPL
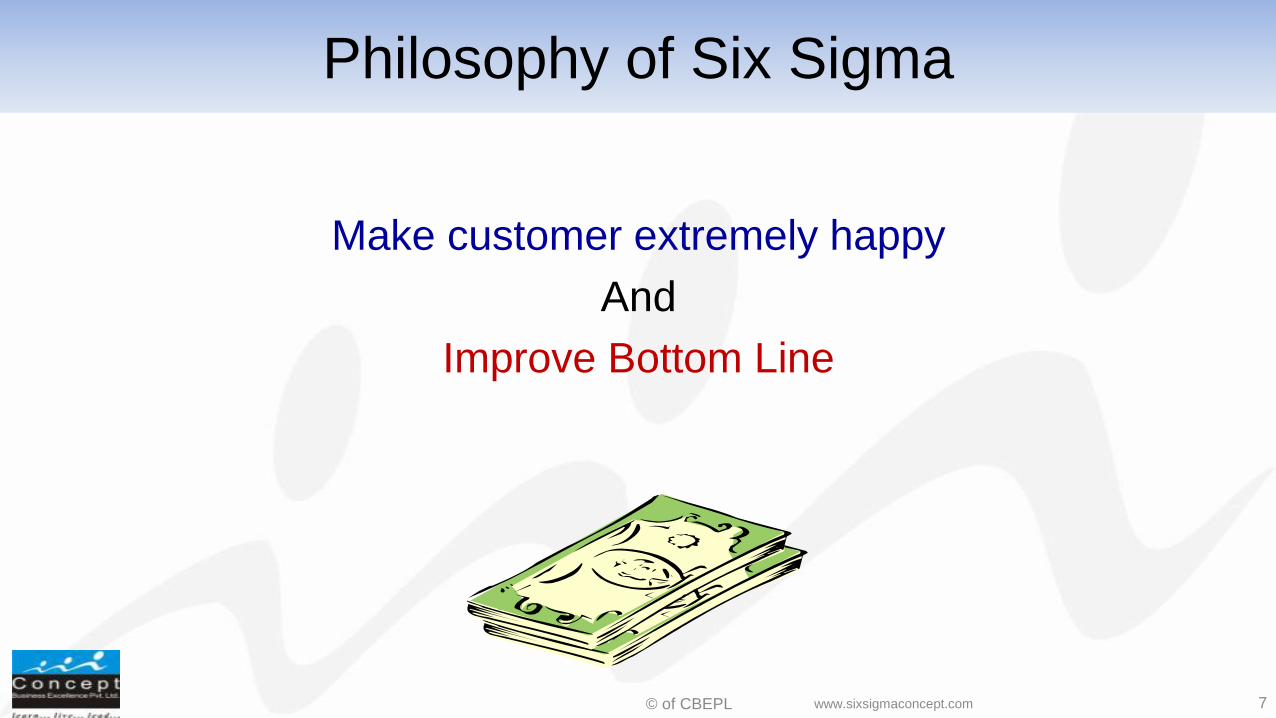
Philosophy of Six Sigma
Make customer extremely happy
And
Improve Bottom Line
7 www.sixsigmaconcept.com
© of CBEPL
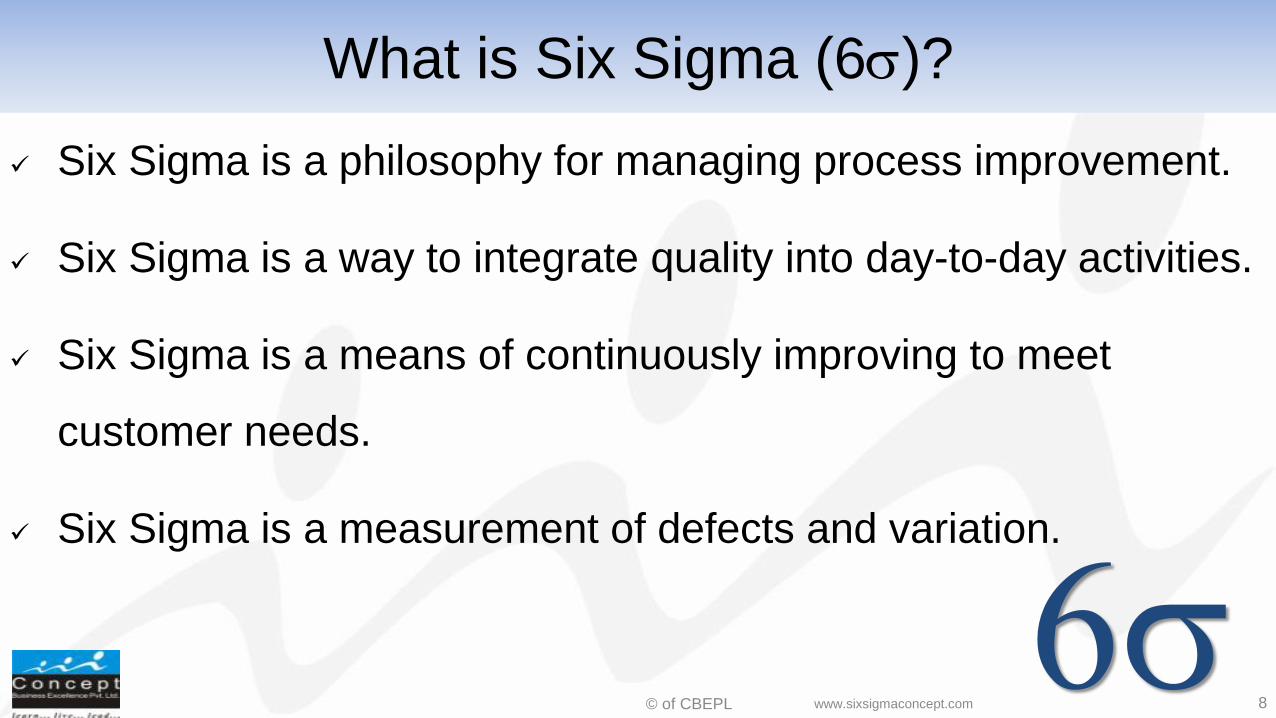
What is Six Sigma (6)?
Six Sigma is a philosophy for managing process improvement.
Six Sigma is a way to integrate quality into day-to-day activities.
Six Sigma is a means of continuously improving to meet
customer needs.
Six Sigma is a measurement of defects and variation.
8 www.sixsigmaconcept.com
© of CBEPL
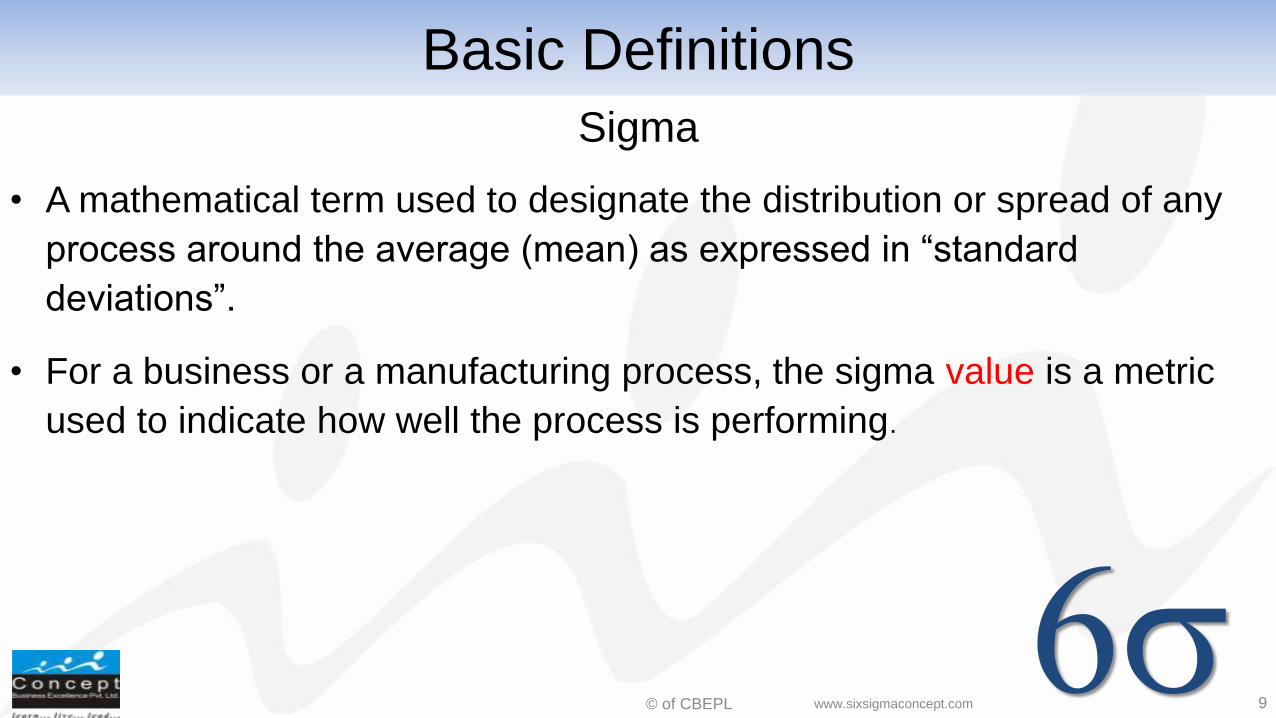
Basic Definitions
Sigma
• A mathematical term used to designate the distribution or spread of any
process around the average (mean) as expressed in “standard
deviations”.
• For a business or a manufacturing process, the sigma value is a metric
used to indicate how well the process is performing.
9 www.sixsigmaconcept.com
© of CBEPL
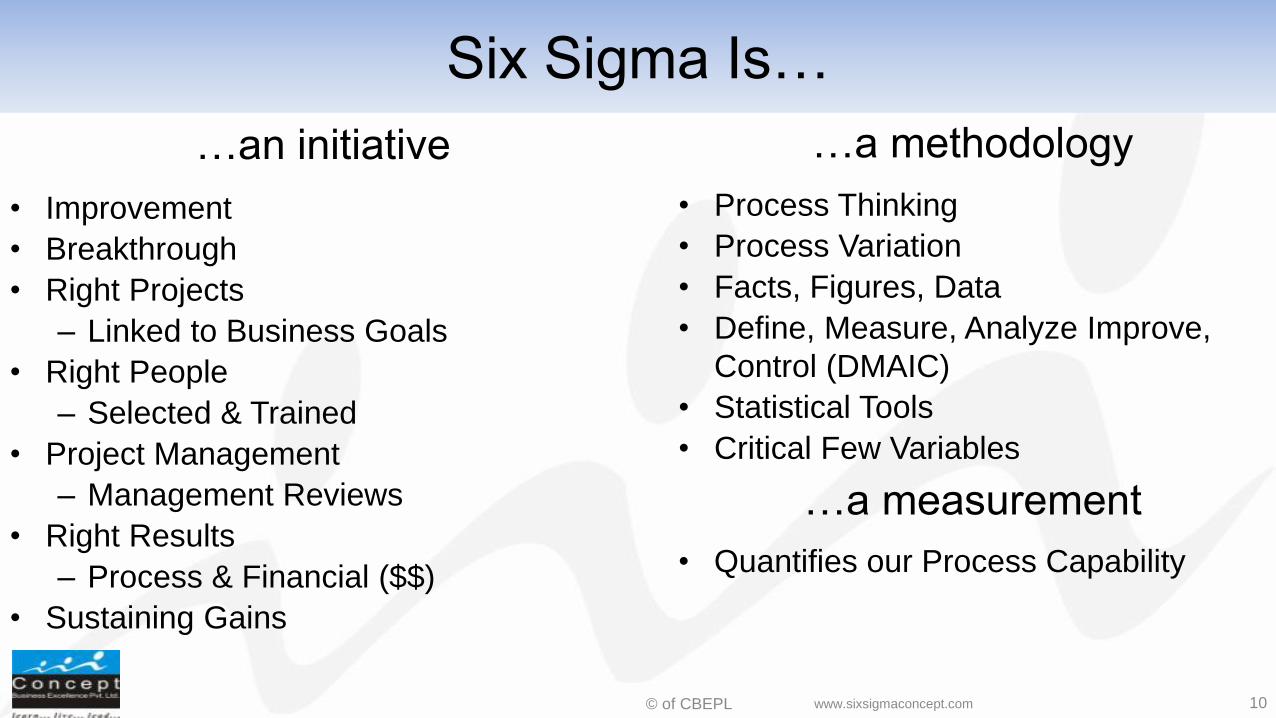
Six Sigma Is…
• Improvement
• Breakthrough
• Right Projects
– Linked to Business Goals
• Right People
– Selected & Trained
• Project Management
– Management Reviews
• Right Results
– Process & Financial ($$)
• Sustaining Gains
• Process Thinking
• Process Variation
• Facts, Figures, Data
• Define, Measure, Analyze Improve,
Control (DMAIC)
• Statistical Tools
• Critical Few Variables
…an initiative …a methodology
…a measurement
• Quantifies our Process Capability
10 www.sixsigmaconcept.com
© of CBEPL
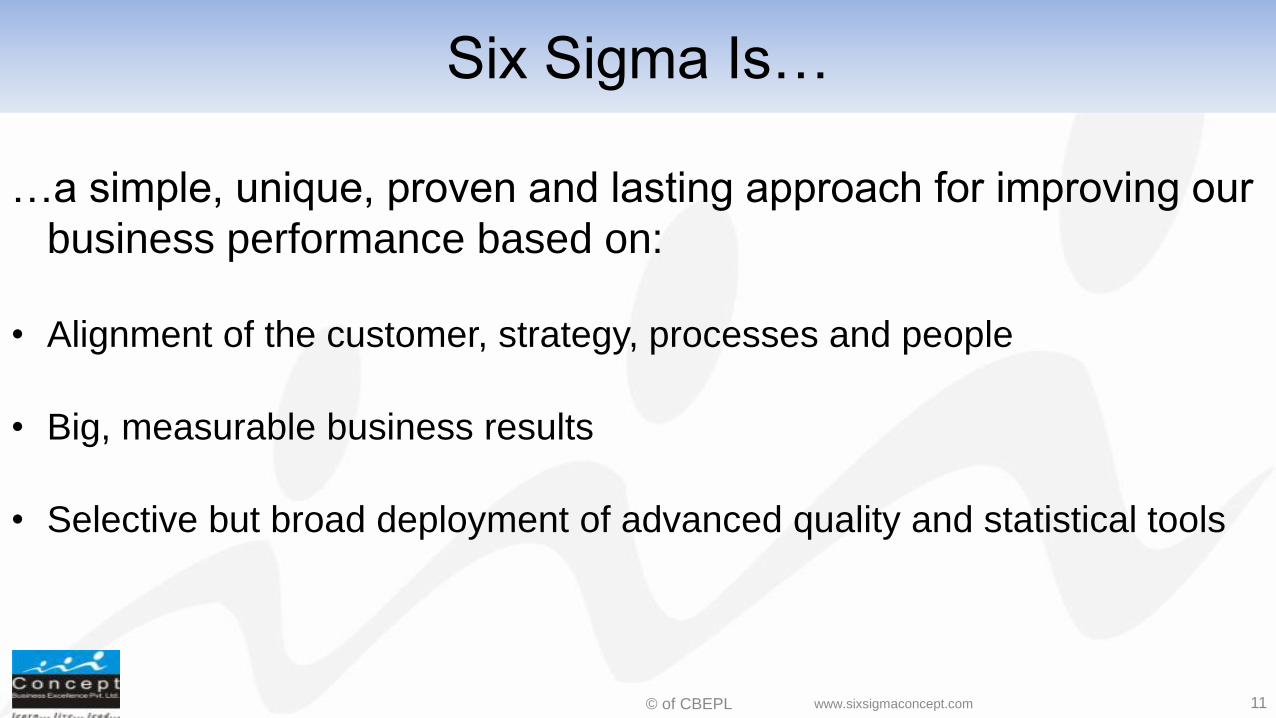
Six Sigma Is…
…a simple, unique, proven and lasting approach for improving our
business performance based on:
• Alignment of the customer, strategy, processes and people
• Big, measurable business results
• Selective but broad deployment of advanced quality and statistical tools
11 www.sixsigmaconcept.com
© of CBEPL
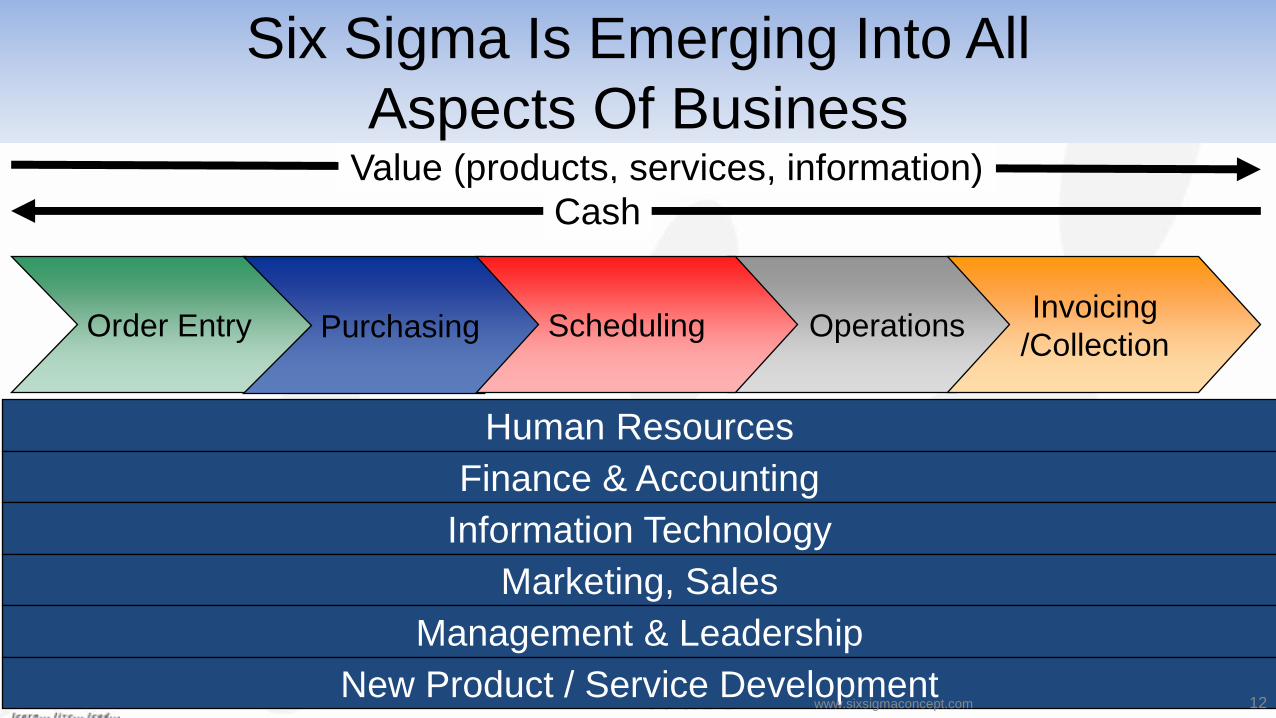
Operations Order Entry Purchasing Scheduling Invoicing
/Collection
Value (products, services, information)
Cash
Human Resources
Finance & Accounting
Information Technology
Marketing, Sales
Management & Leadership
New Product / Service Development
Six Sigma Is Emerging Into All
Aspects Of Business
12 www.sixsigmaconcept.com
© of CBEPL
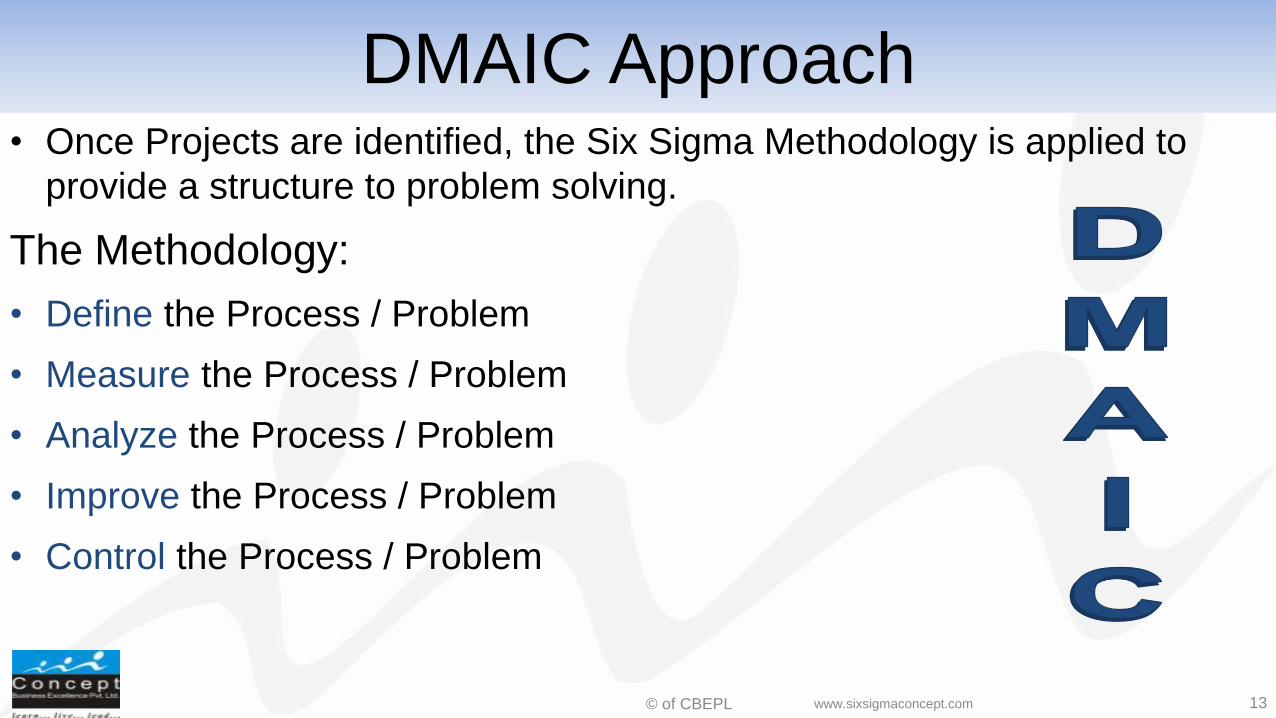
DMAIC Approach • Once Projects are identified, the Six Sigma Methodology is applied to
provide a structure to problem solving.
The Methodology:
• Define the Process / Problem
• Measure the Process / Problem
• Analyze the Process / Problem
• Improve the Process / Problem
• Control the Process / Problem
13 www.sixsigmaconcept.com
© of CBEPL
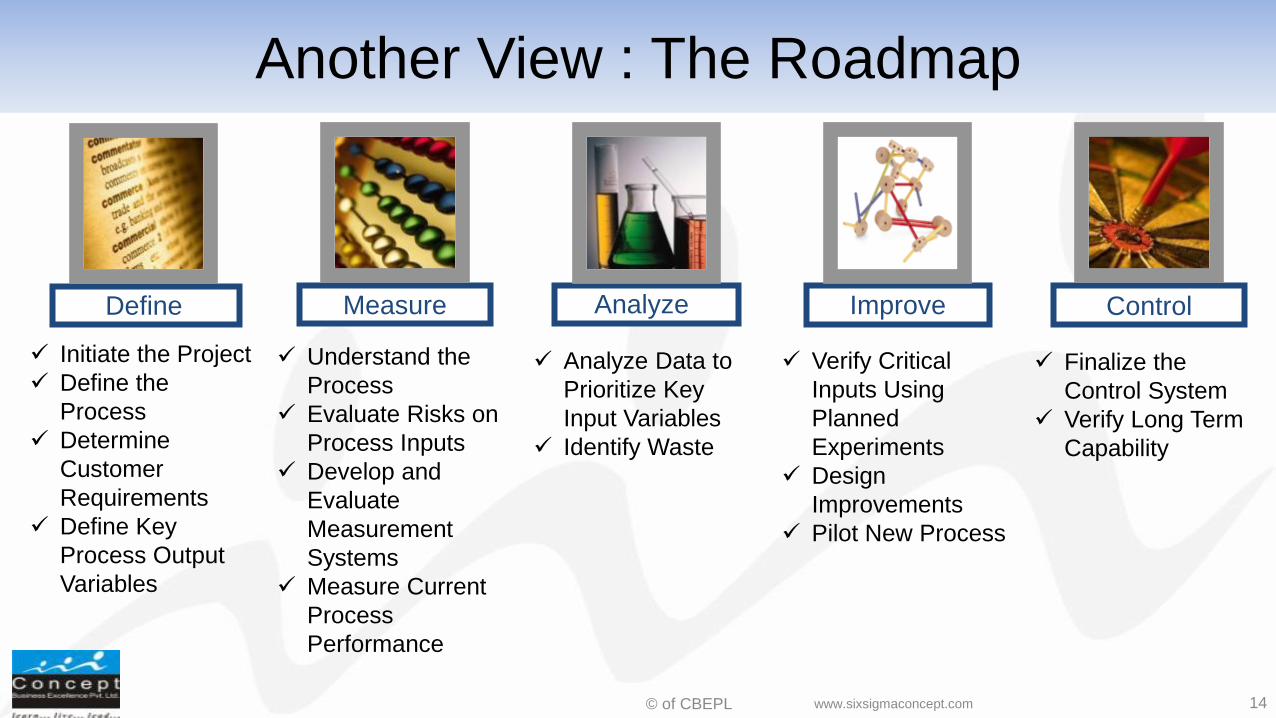
Another View : The Roadmap
Measure Analyze Improve Control
Initiate the Project
Define the
Process
Determine
Customer
Requirements
Define Key
Process Output
Variables
Verify Critical
Inputs Using
Planned
Experiments
Design
Improvements
Pilot New Process
Analyze Data to
Prioritize Key
Input Variables
Identify Waste
Finalize the
Control System
Verify Long Term
Capability
Understand the
Process
Evaluate Risks on
Process Inputs
Develop and
Evaluate
Measurement
Systems
Measure Current
Process
Performance
Define
14 www.sixsigmaconcept.com
© of CBEPL
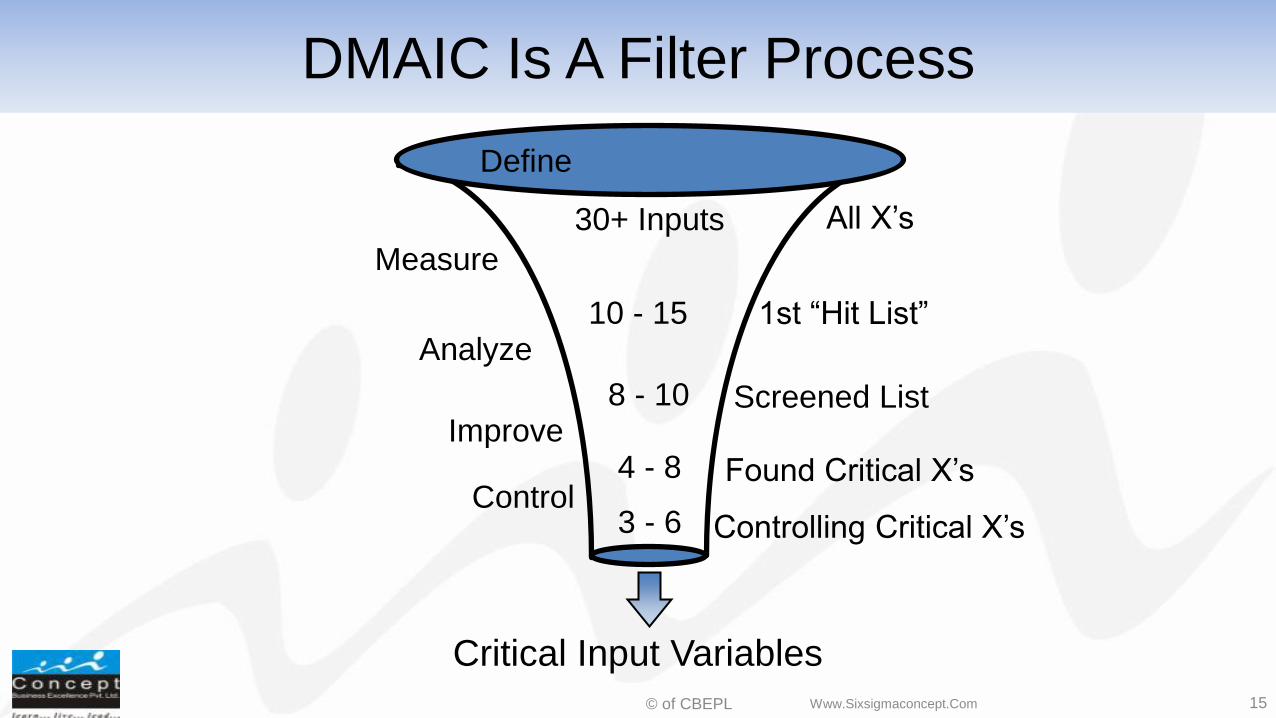
Critical Input Variables
30+ Inputs
8 - 10
4 - 8
Define
3 - 6
Found Critical X’s
Controlling Critical X’s
10 - 15
All X’s
1st “Hit List”
Screened List
Analyze
Improve
Control
DMAIC Is A Filter Process
Measure
15 Www.Sixsigmaconcept.Com
© of CBEPL
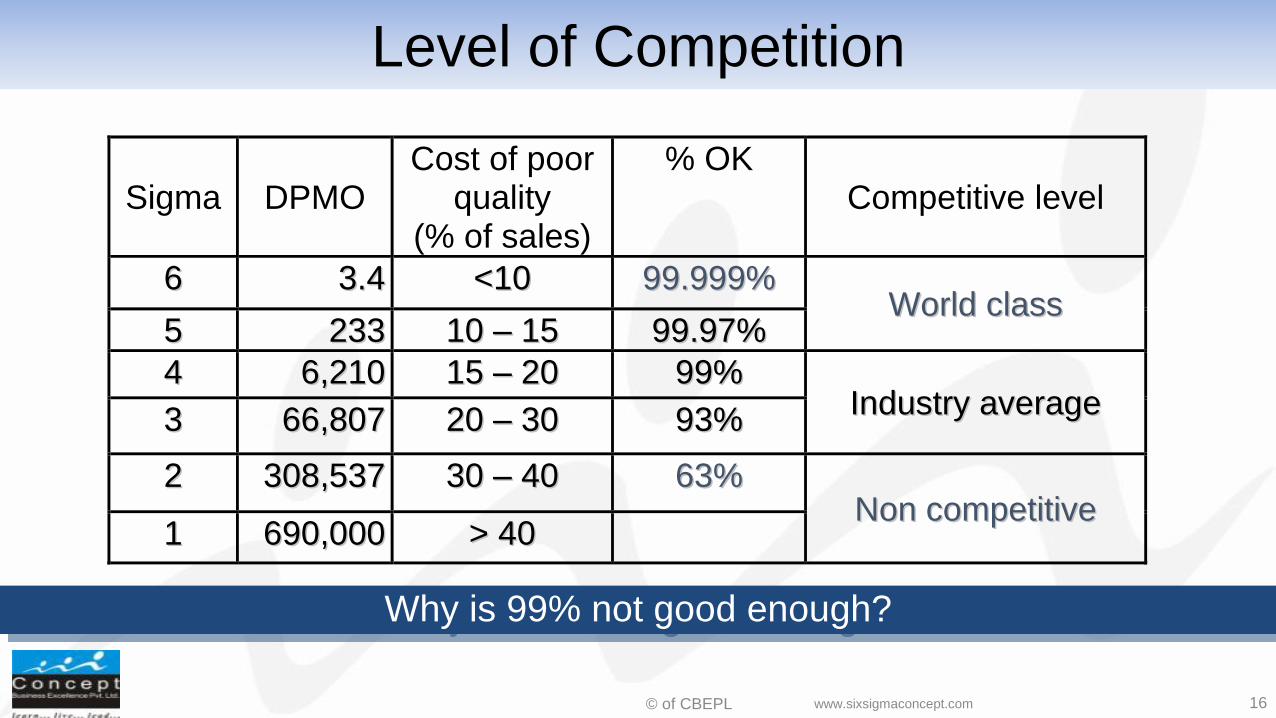
Level of Competition
Sigma DPMO Cost of poor
quality (% of sales)
% OK Competitive level
66 33..44 <<1100 9999..999999%% WWoorrlldd ccllaassss
55 223333 1100 –– 1155 9999..9977%%
44 66,,221100 1155 –– 2200 9999%% IInndduussttrryy aavveerraaggee
33 6666,,880077 2200 –– 3300 9933%%
22 330088,,553377 3300 –– 4400 6633%% NNoonn ccoommppeettiittiivvee
11 669900,,000000 >> 4400
Why is 99% not good enough?
16 www.sixsigmaconcept.com
© of CBEPL
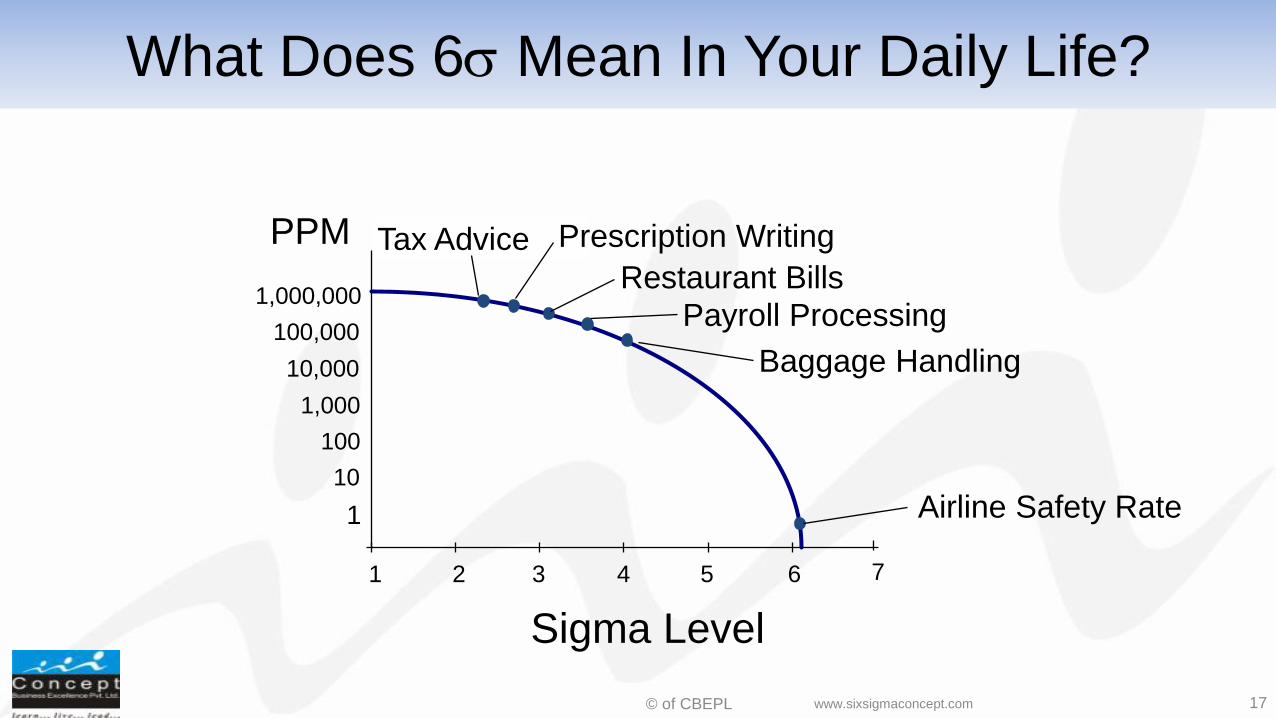
What Does 6 Mean In Your Daily Life?
Tax Advice
7
Sigma Level
1,000,000
100,000
10,000
1,000
100
10
1
PPM
Restaurant Bills
Payroll Processing
Prescription Writing
Baggage Handling
Airline Safety Rate
3 4 5 6 2 1
17 www.sixsigmaconcept.com
© of CBEPL
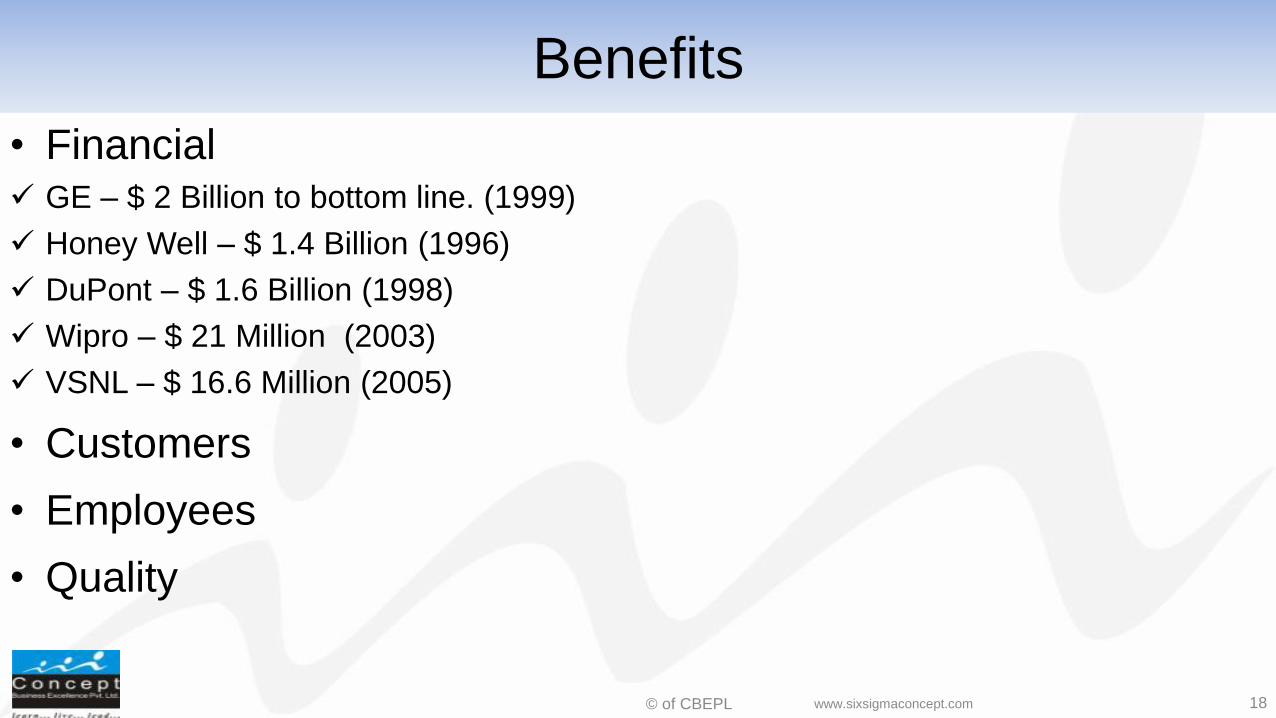
Benefits
• Financial GE – $ 2 Billion to bottom line. (1999)
Honey Well – $ 1.4 Billion (1996)
DuPont – $ 1.6 Billion (1998)
Wipro – $ 21 Million (2003)
VSNL – $ 16.6 Million (2005)
• Customers
• Employees
• Quality
18 www.sixsigmaconcept.com
© of CBEPL
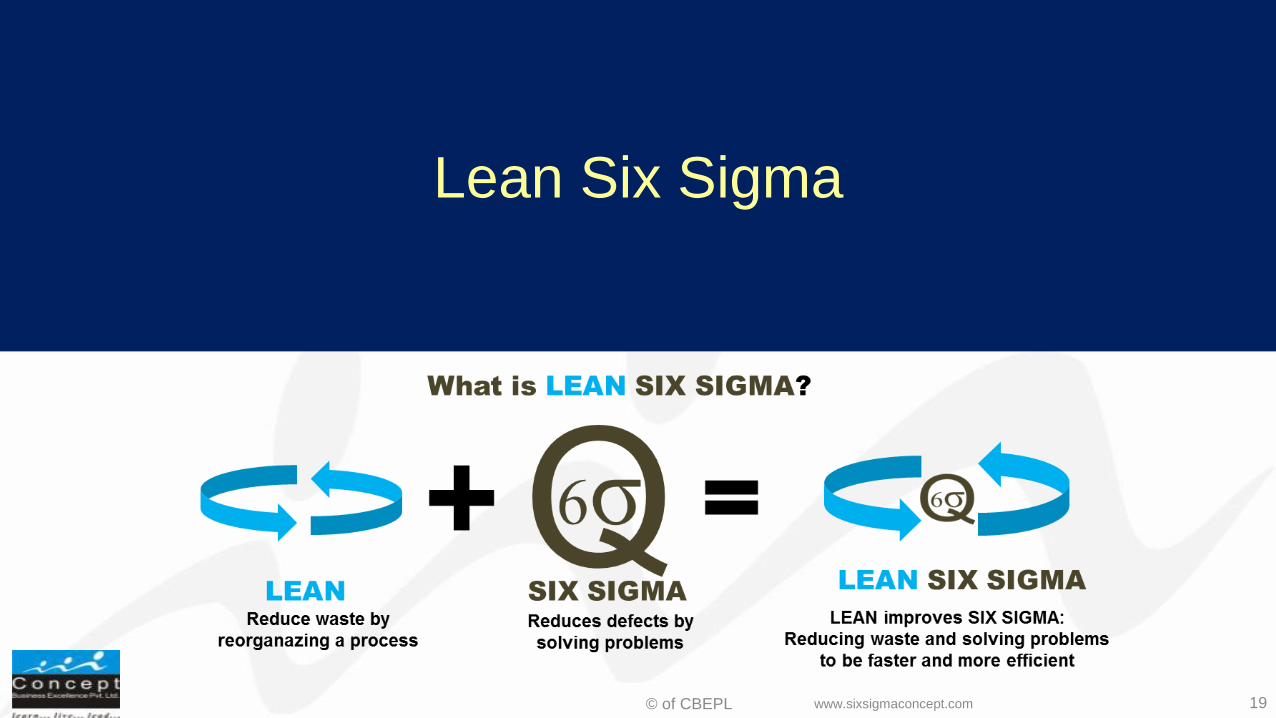
Lean Six Sigma
19 www.sixsigmaconcept.com
© of CBEPL
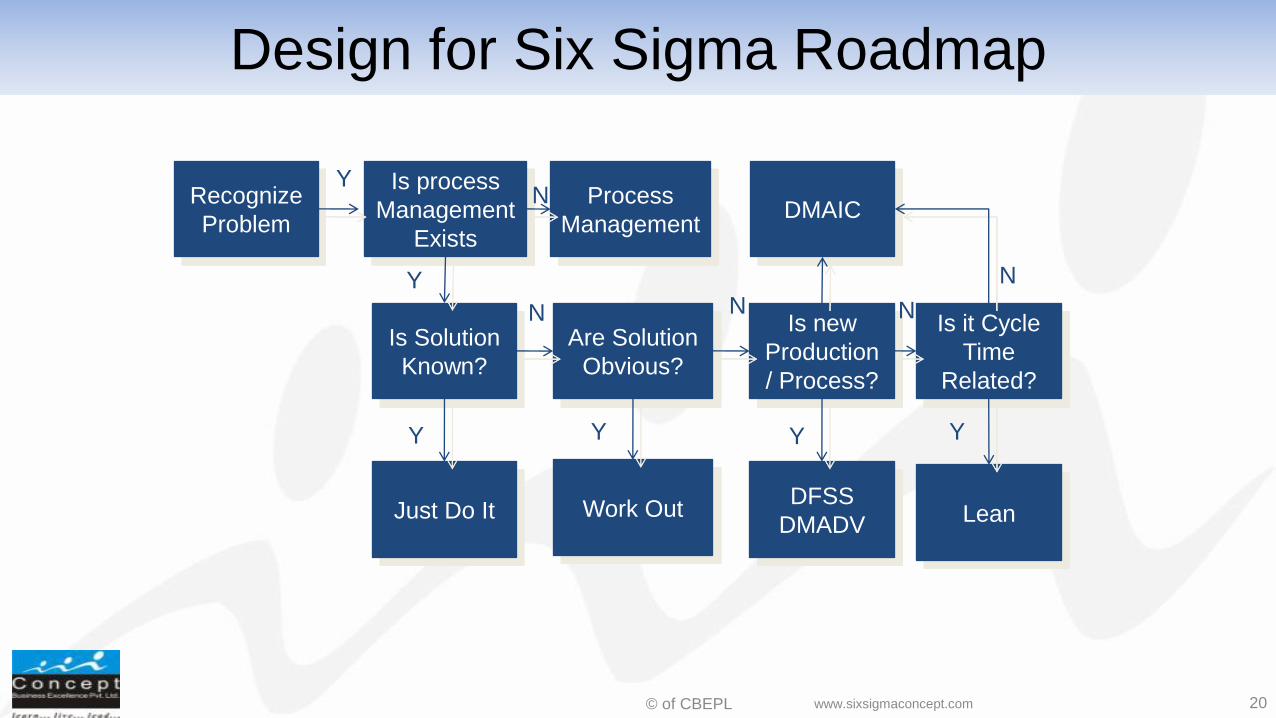
Design for Six Sigma Roadmap
Recognize
Problem
Is process
Management
Exists
Process
Management
Is Solution
Known?
Just Do It
Are Solution
Obvious?
Work Out
Is new
Production
/ Process?
DFSS
DMADV
Is it Cycle
Time
Related?
Lean
DMAIC
Y N
Y
Y Y Y Y
N N N
20 www.sixsigmaconcept.com
N
© of CBEPL
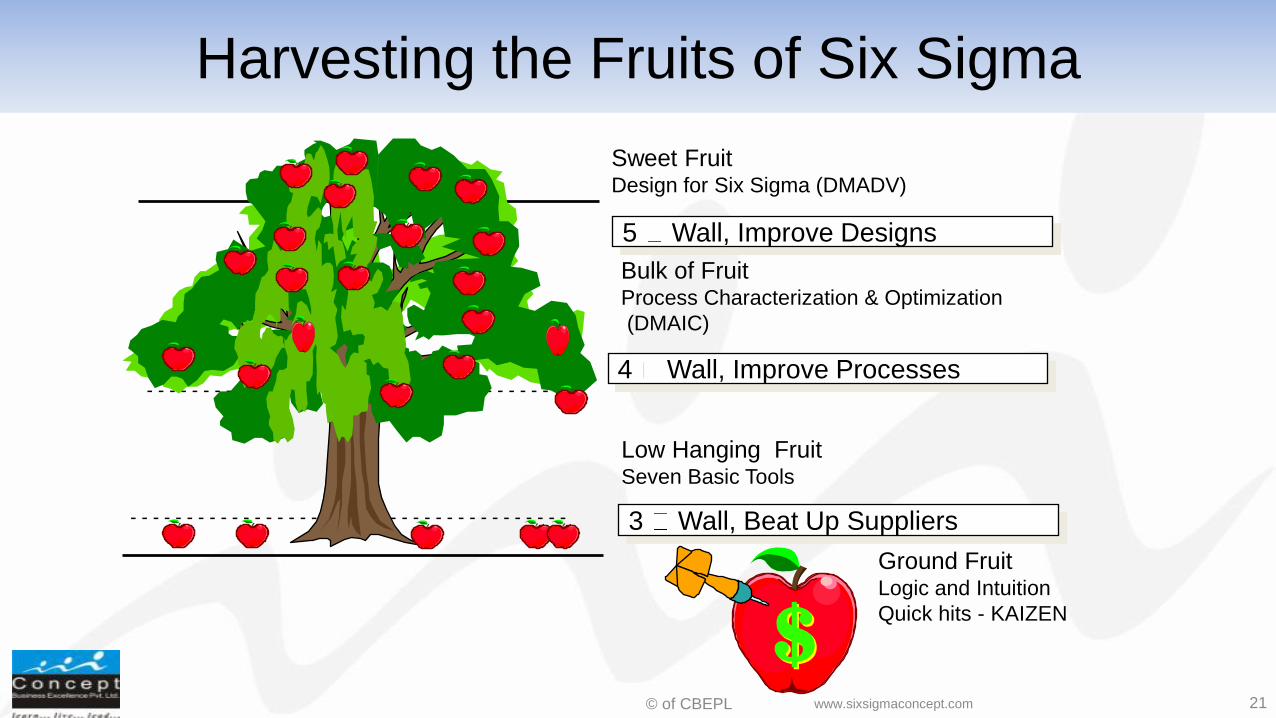
Harvesting the Fruits of Six Sigma
- - - - - - - - - - - - - - - - - - - - - - - - - - - - - - - - - - - - - - -
Sweet Fruit Design for Six Sigma (DMADV)
Bulk of Fruit Process Characterization & Optimization
(DMAIC)
Low Hanging Fruit Seven Basic Tools
Ground Fruit Logic and Intuition
Quick hits - KAIZEN
- - - - - - - - - - - - - - - - - - - - - - - - - - - - - - - - - - - - - - -
3 Wall, Beat Up Suppliers
4 Wall, Improve Processes
5 Wall, Improve Designs
21 www.sixsigmaconcept.com
© of CBEPL
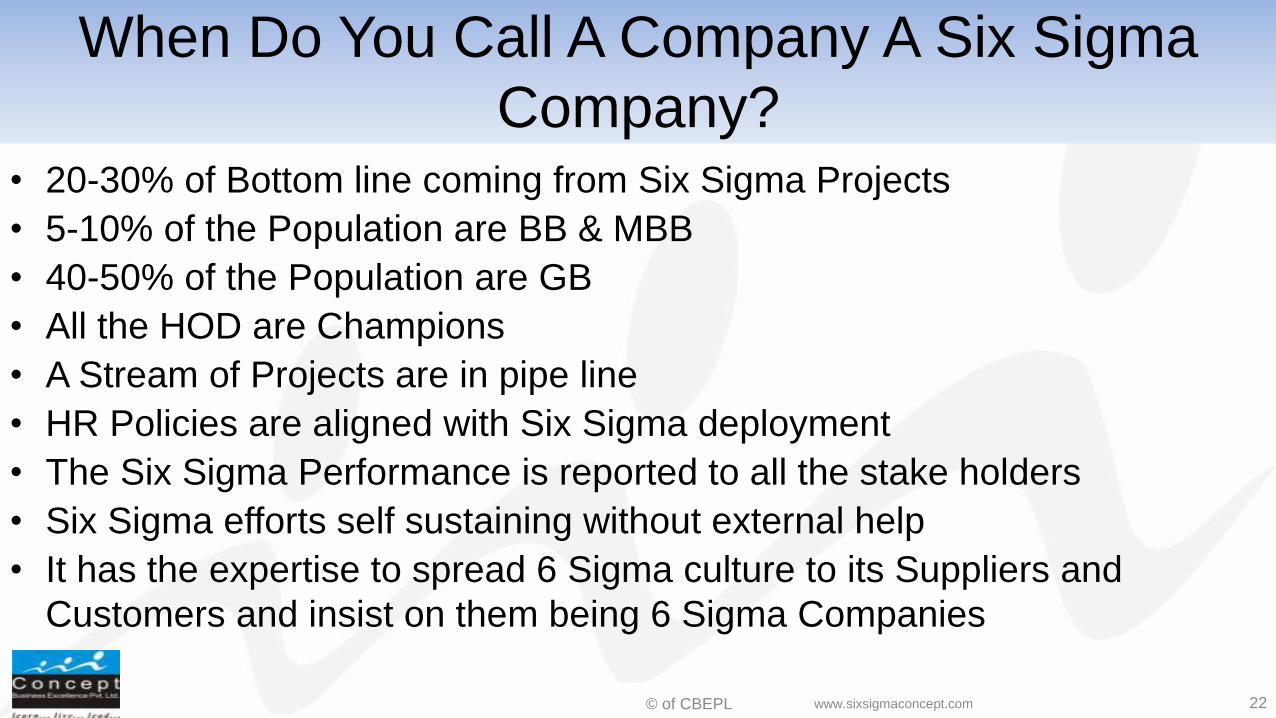
When Do You Call A Company A Six Sigma
Company? • 20-30% of Bottom line coming from Six Sigma Projects
• 5-10% of the Population are BB & MBB
• 40-50% of the Population are GB
• All the HOD are Champions
• A Stream of Projects are in pipe line
• HR Policies are aligned with Six Sigma deployment
• The Six Sigma Performance is reported to all the stake holders
• Six Sigma efforts self sustaining without external help
• It has the expertise to spread 6 Sigma culture to its Suppliers and
Customers and insist on them being 6 Sigma Companies
22 www.sixsigmaconcept.com
© of CBEPL
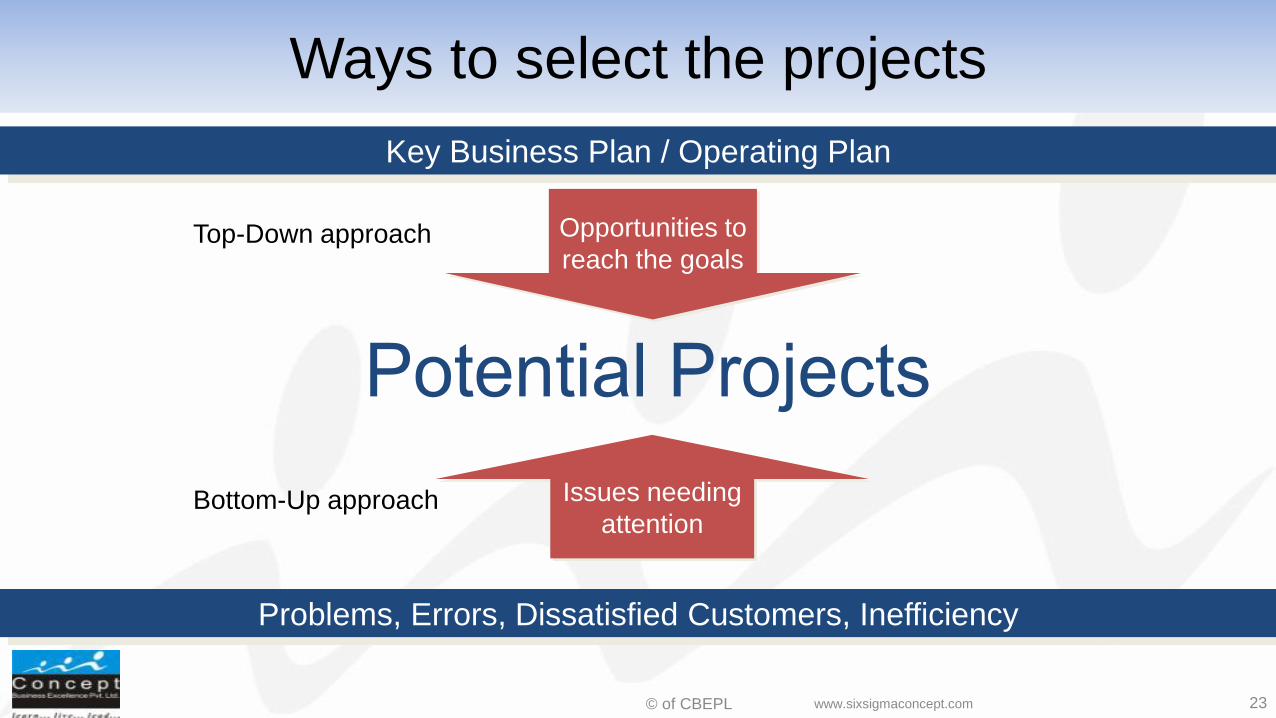
Ways to select the projects
Key Business Plan / Operating Plan
Opportunities to
reach the goals Top-Down approach
Problems, Errors, Dissatisfied Customers, Inefficiency
Issues needing
attention Bottom-Up approach
23 www.sixsigmaconcept.com
© of CBEPL
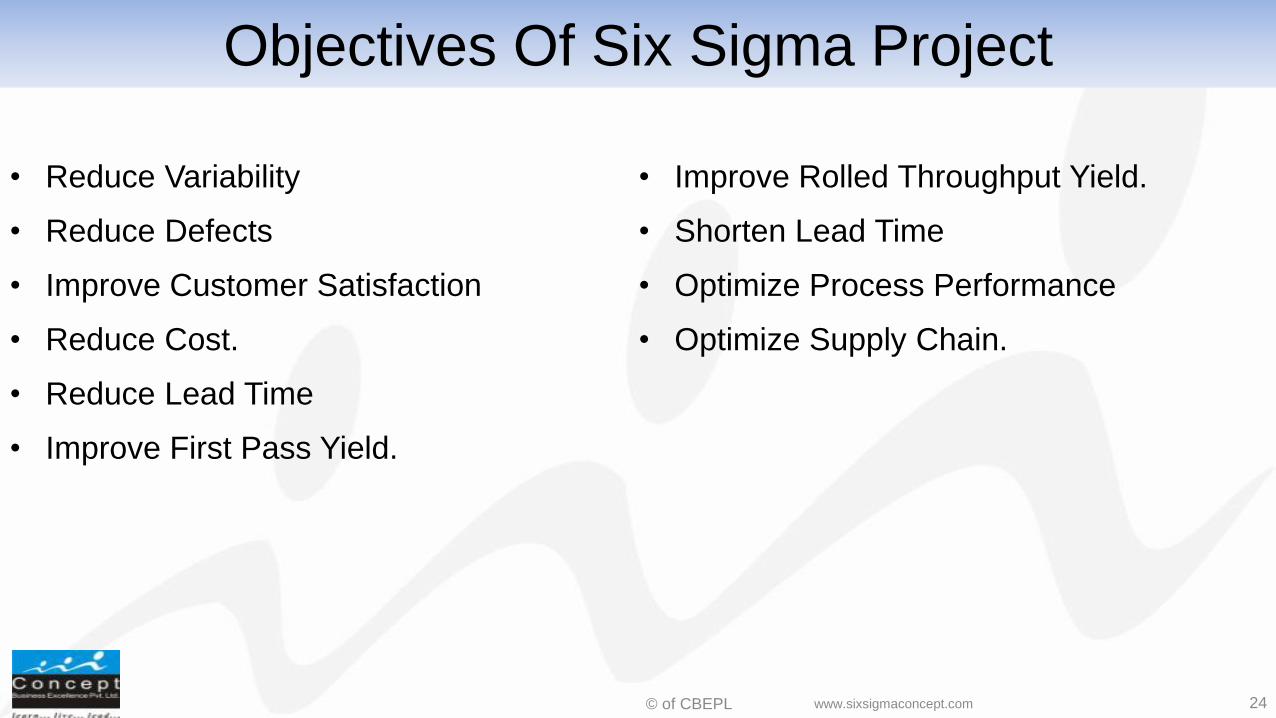
Objectives Of Six Sigma Project
• Reduce Variability
• Reduce Defects
• Improve Customer Satisfaction
• Reduce Cost.
• Reduce Lead Time
• Improve First Pass Yield.
• Improve Rolled Throughput Yield.
• Shorten Lead Time
• Optimize Process Performance
• Optimize Supply Chain.
24 www.sixsigmaconcept.com
© of CBEPL
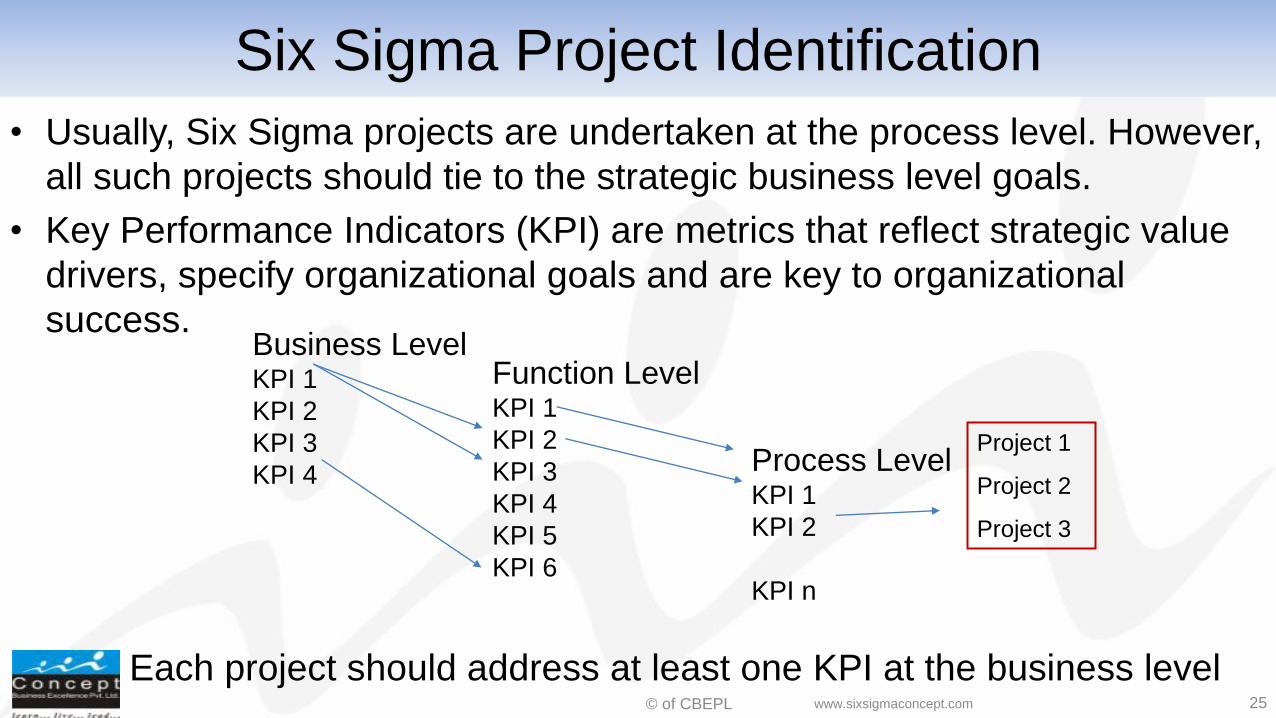
Six Sigma Project Identification
• Usually, Six Sigma projects are undertaken at the process level. However,
all such projects should tie to the strategic business level goals.
• Key Performance Indicators (KPI) are metrics that reflect strategic value
drivers, specify organizational goals and are key to organizational
success. Business Level KPI 1
KPI 2
KPI 3
KPI 4
Function Level KPI 1
KPI 2
KPI 3
KPI 4
KPI 5
KPI 6
Process Level KPI 1
KPI 2
KPI n
Project 1
Project 2
Project 3
Each project should address at least one KPI at the business level 25 www.sixsigmaconcept.com
© of CBEPL
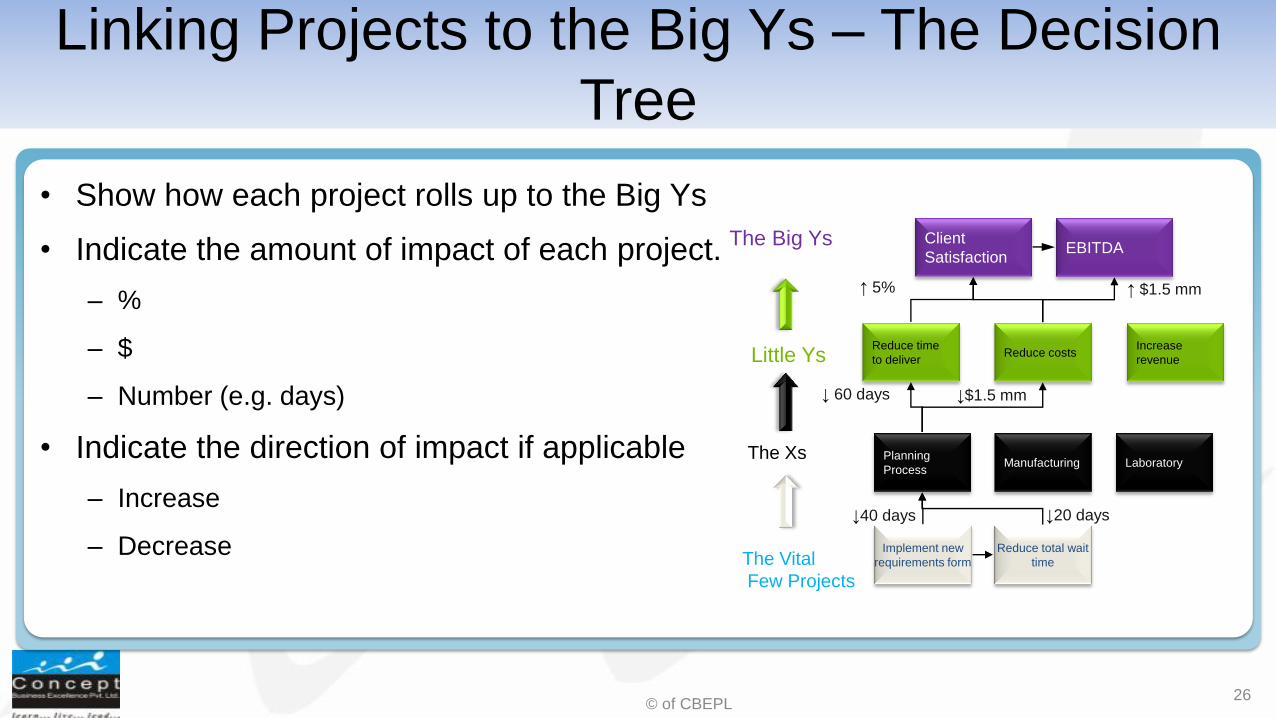
Linking Projects to the Big Ys – The Decision
Tree
• Show how each project rolls up to the Big Ys
• Indicate the amount of impact of each project.
– %
– $
– Number (e.g. days)
• Indicate the direction of impact if applicable
– Increase
– Decrease
Client
Satisfaction The Big Ys
The Xs
The Vital
Few Projects
Little Ys
EBITDA
Planning
Process
Reduce total wait
time
Reduce costs Increase
revenue
Manufacturing
Implement new
requirements form
Reduce time
to deliver
Laboratory
↓20 days
↓$1.5 mm ↓ 60 days
↑ $1.5 mm ↑ 5%
↓40 days
26
www.sixsigmaconcept.com

© of CBEPL
Six Sigma - Define
27 www.sixsigmaconcept.com
© of CBEPL
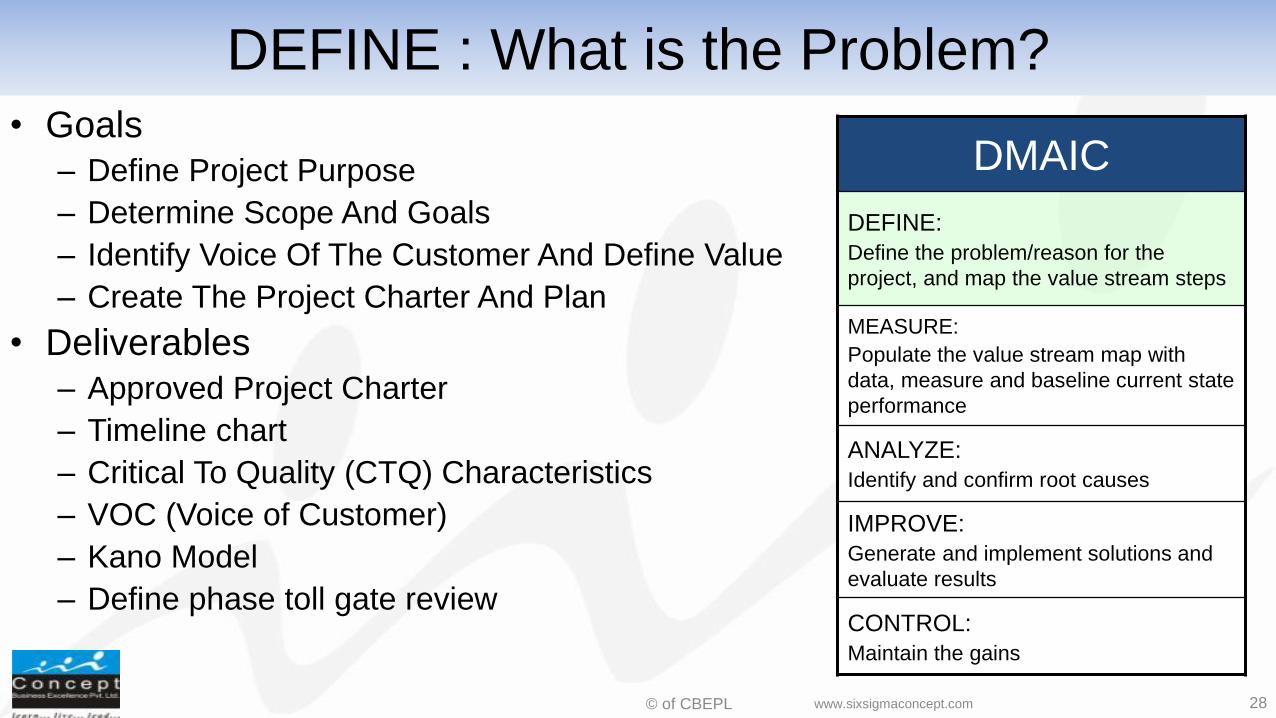
DEFINE : What is the Problem? • Goals
– Define Project Purpose
– Determine Scope And Goals
– Identify Voice Of The Customer And Define Value
– Create The Project Charter And Plan
• Deliverables
– Approved Project Charter
– Timeline chart
– Critical To Quality (CTQ) Characteristics
– VOC (Voice of Customer)
– Kano Model
– Define phase toll gate review
DMAIC
DEFINE:
Define the problem/reason for the
project, and map the value stream steps
MEASURE:
Populate the value stream map with
data, measure and baseline current state
performance
ANALYZE:
Identify and confirm root causes
IMPROVE:
Generate and implement solutions and
evaluate results
CONTROL:
Maintain the gains
28 www.sixsigmaconcept.com
© of CBEPL
Six Sigma – Measure
29 www.sixsigmaconcept.com
© of CBEPL
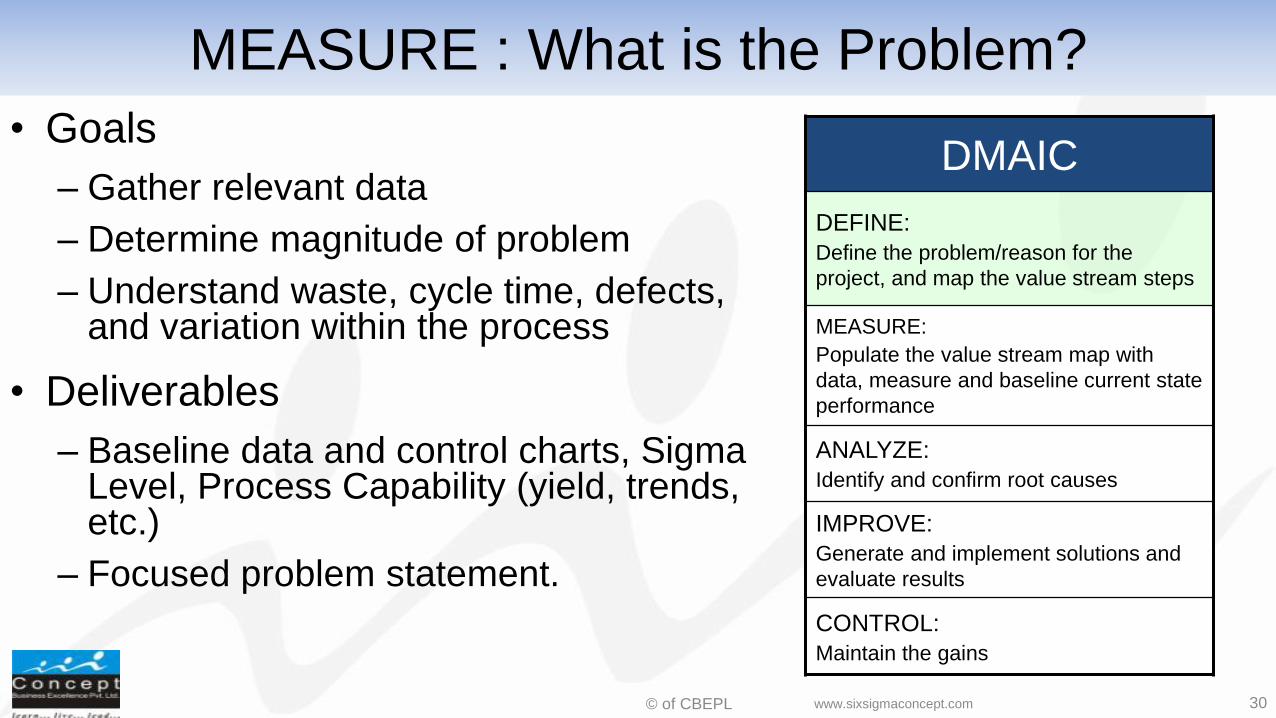
MEASURE : What is the Problem?
• Goals
– Gather relevant data
– Determine magnitude of problem
– Understand waste, cycle time, defects, and variation within the process
• Deliverables
– Baseline data and control charts, Sigma Level, Process Capability (yield, trends, etc.)
– Focused problem statement.
DMAIC
DEFINE:
Define the problem/reason for the
project, and map the value stream steps
MEASURE:
Populate the value stream map with
data, measure and baseline current state
performance
ANALYZE:
Identify and confirm root causes
IMPROVE:
Generate and implement solutions and
evaluate results
CONTROL:
Maintain the gains
30 www.sixsigmaconcept.com

© of CBEPL
Six Sigma – Analyse
31 www.sixsigmaconcept.com
© of CBEPL
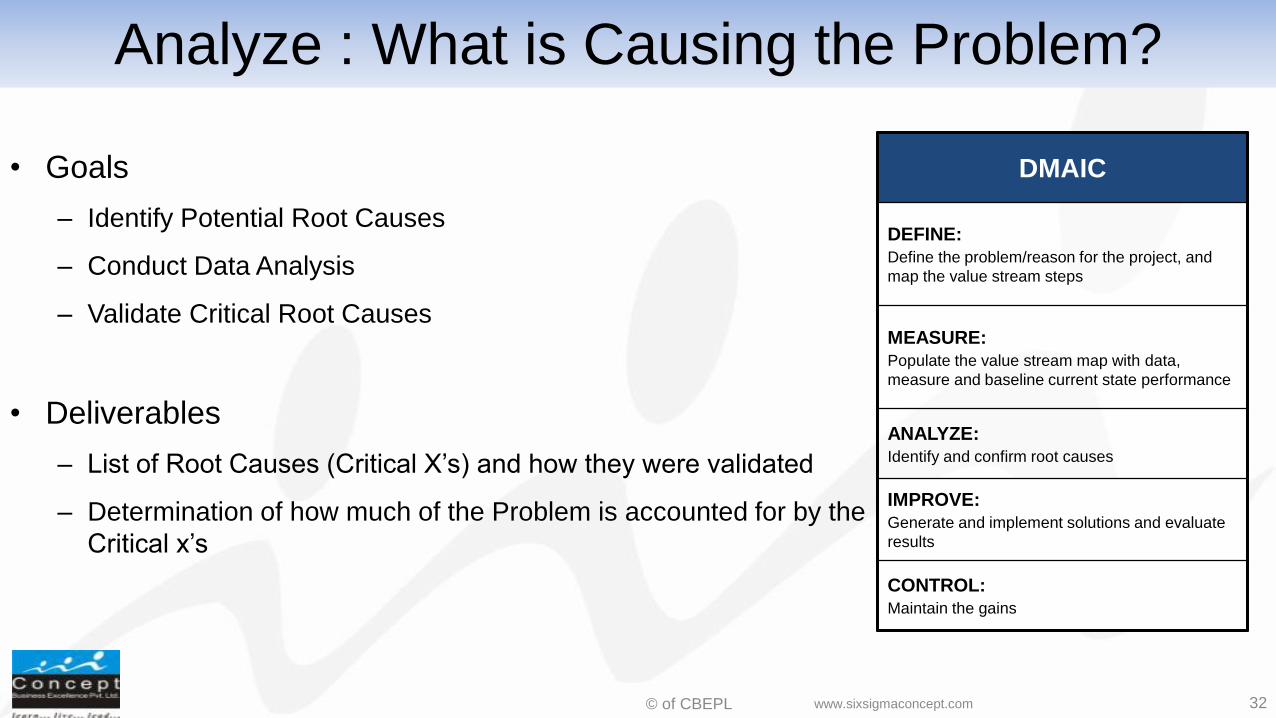
Analyze : What is Causing the Problem?
• Goals
– Identify Potential Root Causes
– Conduct Data Analysis
– Validate Critical Root Causes
• Deliverables
– List of Root Causes (Critical X’s) and how they were validated
– Determination of how much of the Problem is accounted for by the
Critical x’s
DMAIC
DEFINE:
Define the problem/reason for the project, and
map the value stream steps
MEASURE:
Populate the value stream map with data,
measure and baseline current state performance
ANALYZE:
Identify and confirm root causes
IMPROVE:
Generate and implement solutions and evaluate
results
CONTROL:
Maintain the gains
32 www.sixsigmaconcept.com
© of CBEPL 33
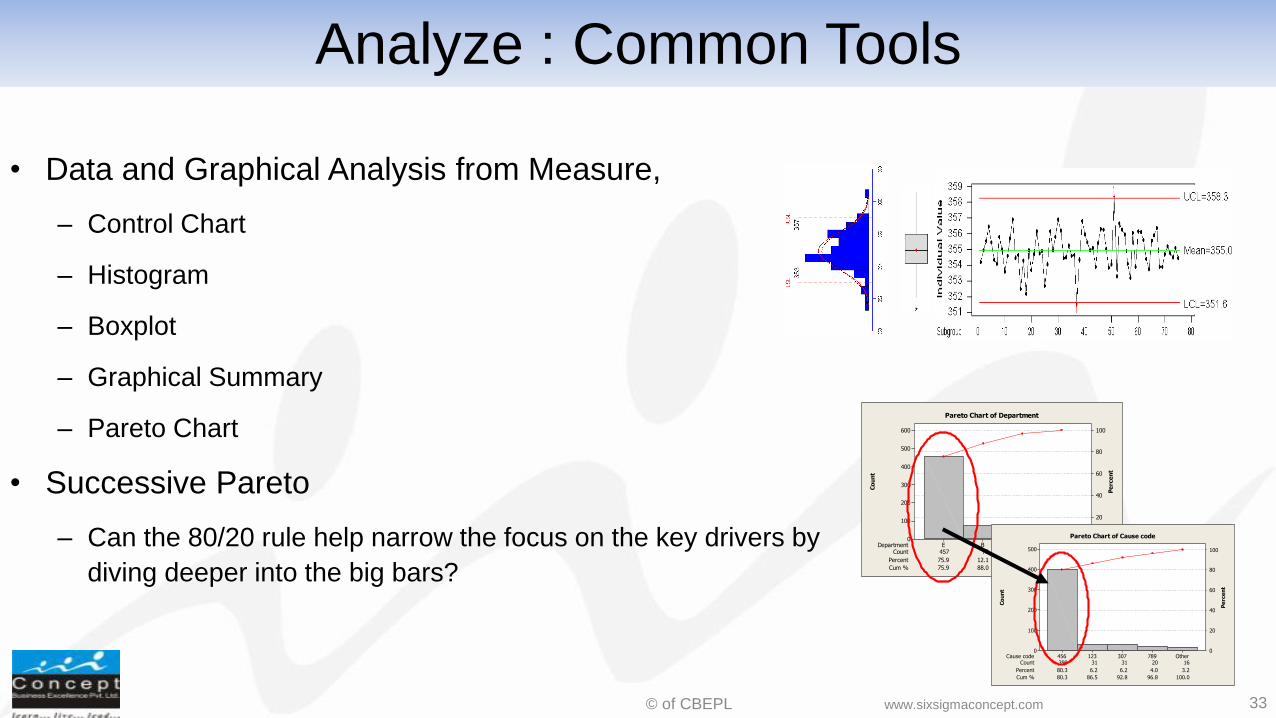
Analyze : Common Tools
• Data and Graphical Analysis from Measure,
– Control Chart
– Histogram
– Boxplot
– Graphical Summary
– Pareto Chart
• Successive Pareto
– Can the 80/20 rule help narrow the focus on the key drivers by
diving deeper into the big bars? Count 457 73 53 19
Percent 75.9 12.1 8.8 3.2
Cum % 75.9 88.0 96.8 100.0
Co
un
t
Pe
rce
nt
Department OtherABE
600
500
400
300
200
100
0
100
80
60
40
20
0
Pareto Chart of Department
Count 399 31 31 20 16
Percent 80.3 6.2 6.2 4.0 3.2
Cum % 80.3 86.5 92.8 96.8 100.0
Cause code Other789307123456
500
400
300
200
100
0
100
80
60
40
20
0
Co
un
t
Pe
rce
nt
Pareto Chart of Cause code
www.sixsigmaconcept.com
© of CBEPL
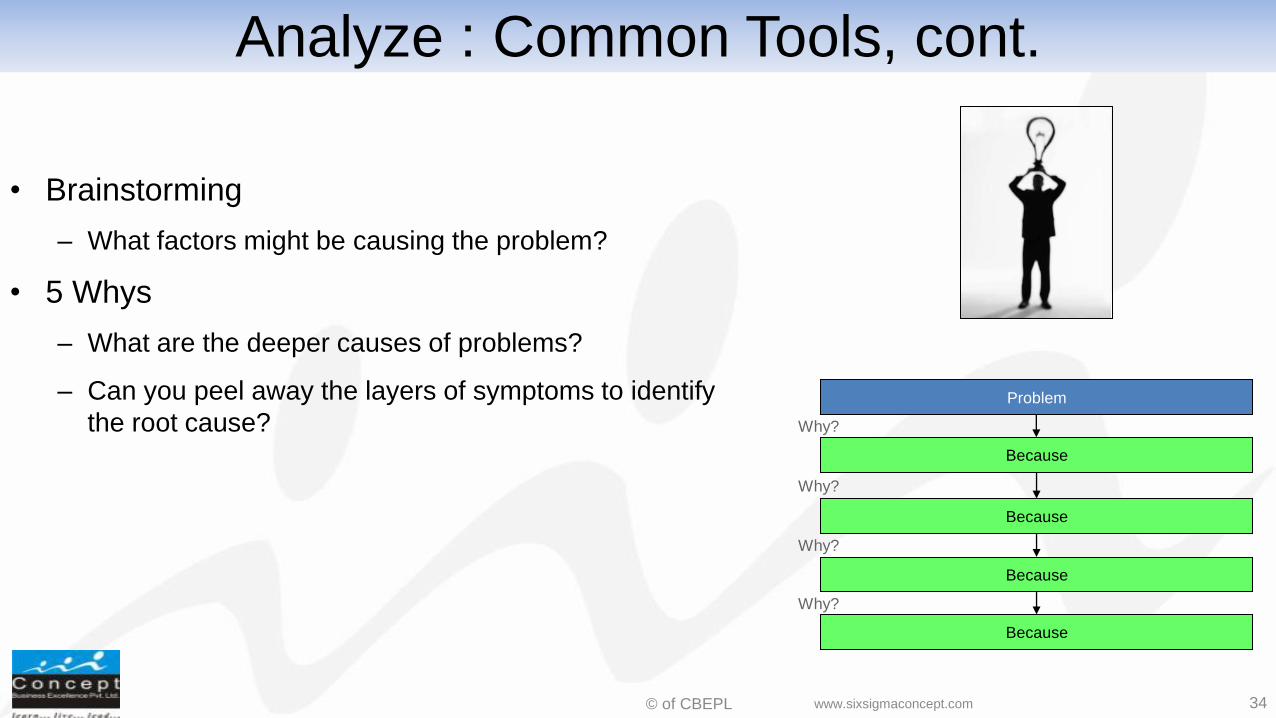
Analyze : Common Tools, cont.
• Brainstorming
– What factors might be causing the problem?
• 5 Whys
– What are the deeper causes of problems?
– Can you peel away the layers of symptoms to identify
the root cause?
Problem
Why?
Because
Because
Because
Because
Why?
Why?
Why?
34 www.sixsigmaconcept.com
© of CBEPL
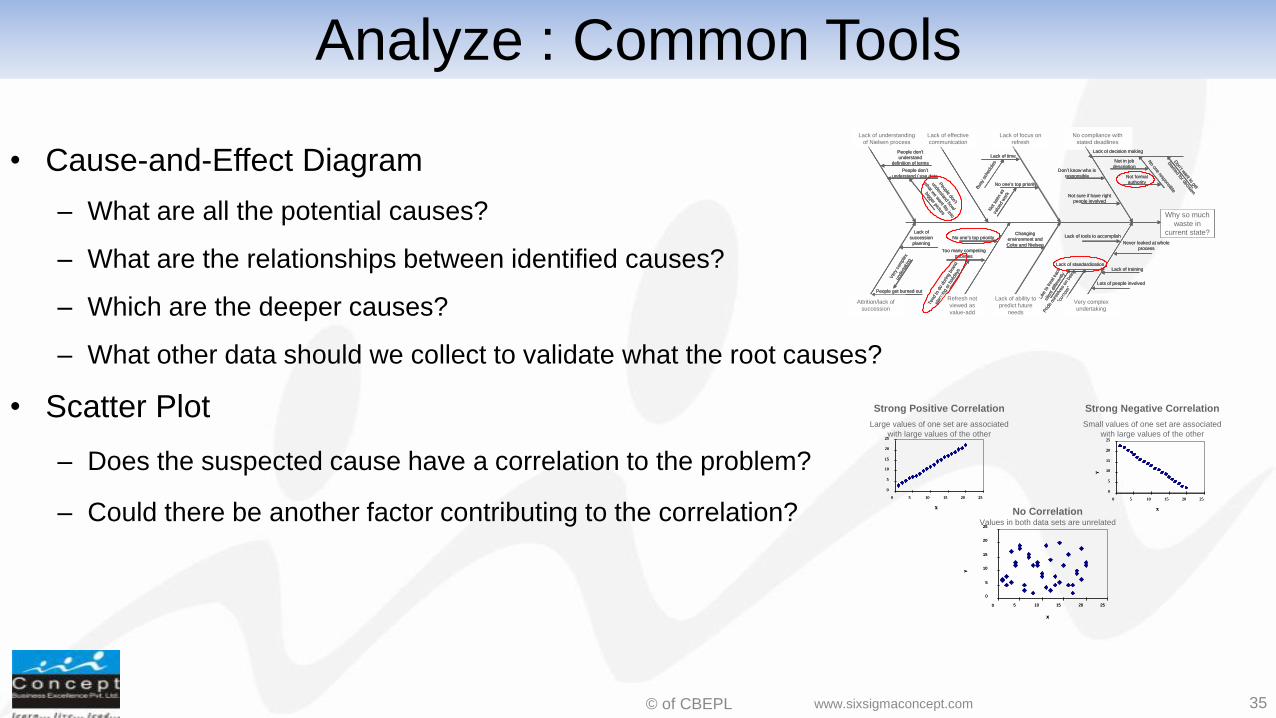
Analyze : Common Tools
• Cause-and-Effect Diagram
– What are all the potential causes?
– What are the relationships between identified causes?
– Which are the deeper causes?
– What other data should we collect to validate what the root causes?
• Scatter Plot
– Does the suspected cause have a correlation to the problem?
– Could there be another factor contributing to the correlation?
Why so much
waste in
current state?
Very complex
undertaking
Lack of ability to
predict future
needs
Lack of focus on
refresh
No compliance with
stated deadlines
Lack of effective
communication
Refresh not
viewed as
value-add
Attrition/lack of
succession
Lack of understanding
of Nielsen process
No one responsible
Don’t w
ant to get
blamed for decision
Don’t know who is
responsible
Never looked at whole
process
Lack of tools to accomplish
Lack of standardization
Prid
e ou
rsel
ves
on b
eing
“cus
tom
”
Lik
e to
treat e
ach
clie
nt d
iffere
ntly
Not in job
description
Lack of decision making
Not formal
authority
Not sure if have right
people involved
Changing
environment and
Coke and Nielsen
Lack of time
Bus
y sc
hedul
es
No one’s top priority
Not s
een a
s
valu
ed w
ork
Lots of people involved
No one’s top priority
Too many competing
priorities
Tend
to d
o d
urin
g b
rand
pla
nnin
g o
r holid
ays
People don't
understand
definition of terms
People don’t
understand / use data
People don't
understand how/
what w
e want fits into
bigger picture
People get burned out
Lack of
succession
planning
Ver
y co
mple
x
unde
rtak
ing
Lack of training
0
5
10
15
20
25
0 5 10 15 20 25
X
0
5
10
15
20
25
0 5 10 15 20 25
X
Strong Positive Correlation
Large values of one set are associated
with large values of the other
10
15
20
25
5 10 15 20 25
X
Y
0
5
0
10
15
20
25
5 10 15 20 25
X
Y
0
5
0
No CorrelationValues in both data sets are unrelated
0
5
10
15
20
25
0 5 10 15 20 25
X
Y
0
5
10
15
20
25
0 5 10 15 20 25
X
Y
Strong Negative Correlation
Small values of one set are associated
with large values of the other
35 www.sixsigmaconcept.com
© of CBEPL
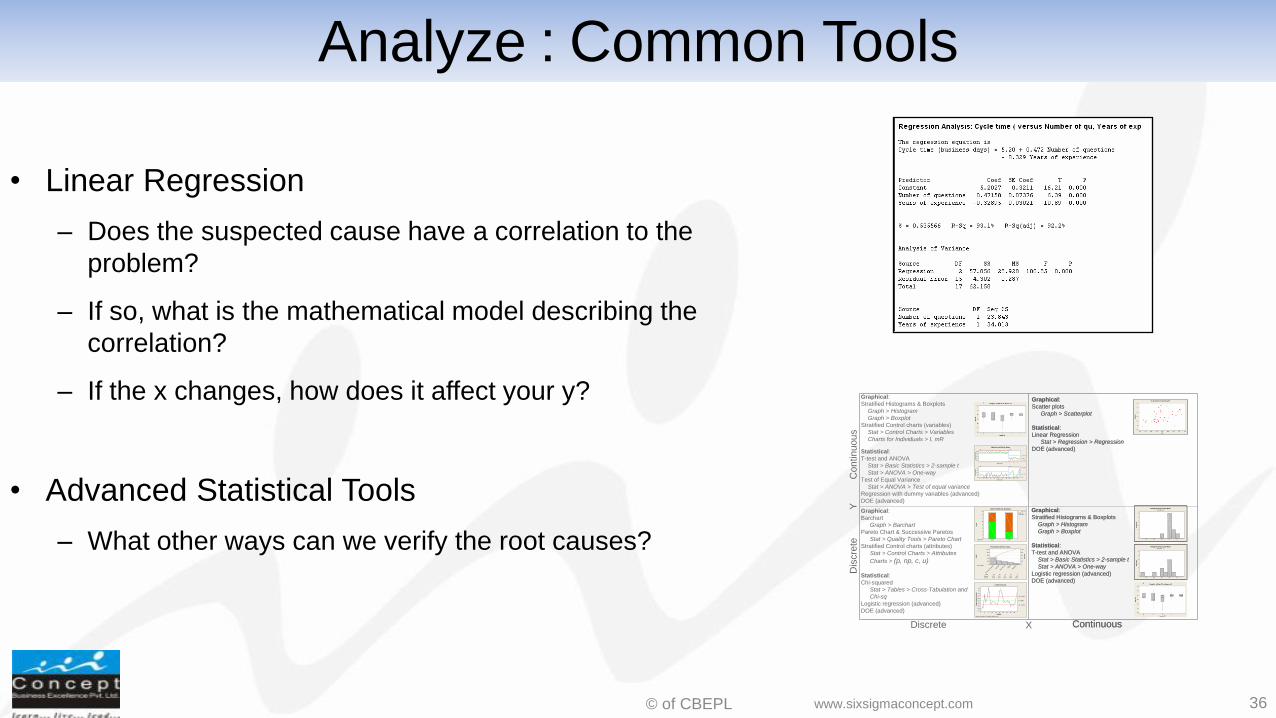
Analyze : Common Tools
• Linear Regression
– Does the suspected cause have a correlation to the
problem?
– If so, what is the mathematical model describing the
correlation?
– If the x changes, how does it affect your y?
• Advanced Statistical Tools
– What other ways can we verify the root causes?
X
YC
on
tin
uou
sD
iscre
te
Continuous
Graphical:
Scatter plots
Graph > Scatterplot
Statistical:
Linear Regression
Stat > Regression > Regression
DOE (advanced)
Fre
qu
en
cy
5150494847
6
5
4
3
2
1
0
Histogram of Hours per WeekAssociate = A
Fre
qu
en
cy
5150494847
6
5
4
3
2
1
0
Histogram of Hours per WeekAssociate = BGraphical:
Stratified Histograms & Boxplots
Graph > Histogram
Graph > Boxplot
Statistical:
T-test and ANOVA
Stat > Basic Statistics > 2-sample t
Stat > ANOVA > One-way
Logistic regression (advanced)
DOE (advanced)
Discrete
Graphical:
Stratified Histograms & Boxplots
Graph > Histogram
Graph > Boxplot
Stratified Control charts (variables)
Stat > Control Charts > Variables
Charts for Individuals > I, mR
Graphical:
Barchart
Graph > Barchart
Pareto Chart & Successive Paretos
Stat > Quality Tools > Pareto Chart
Stratified Control charts (attributes)
Stat > Control Charts > Attributes
Charts > (p, np, c, u)
Statistical:
Chi-squared
Stat > Tables > Cross-Tabulation and
Chi-sq
Logistic regression (advanced)
DOE (advanced)
Co
un
t
Client size SmallLarge
16
14
12
10
8
6
4
2
0
Negative
Positive
Response
Chart of Client size, Response
Count 43 22 17 12 6
Percent 43.0 22.0 17.0 12.0 6.0
Cum % 43.0 65.0 82.0 94.0 100.0
Co
un
t
Pe
rce
nt
Error reason
Missp
ellin
g
Illeg
ible
Inco
rrec
t fac
t
Gram
mar
Inco
rrec
t pu
nctuation
100
80
60
40
20
0
100
80
60
40
20
0
Pareto Chart of Error reason
Sample
Sa
mp
le C
ou
nt P
er
Un
it
28252219161310741
1.3
1.2
1.1
1.0
0.9
0.8
0.7
0.6
0.5
0.4
_U=0.8098
UCL=0.9819
LCL=0.6376
1
11
1
1
1
1
1
1
11
1
U Chart of errors
Tests performed with unequal sample sizes
Obser vation
In
div
idu
al
Va
lue
51464136312621161161
260
240
220
200
180
_X=200.47
UC L=221.55
LCL=179.38
O ld New
Obser vation
Mo
vin
g R
an
ge
51464136312621161161
24
18
12
6
0
__MR=7.93
UC L=25.90
LCL=0
O ld New
I-MR Chart of bills by Phase
Statistical:
T-test and ANOVA
Stat > Basic Statistics > 2-sample t
Stat > ANOVA > One-way
Test of Equal Variance
Stat > ANOVA > Test of equal variance
Regression with dummy variables (advanced)
DOE (advanced)
36 www.sixsigmaconcept.com
© of CBEPL
Six Sigma – Improve
37 www.sixsigmaconcept.com
© of CBEPL
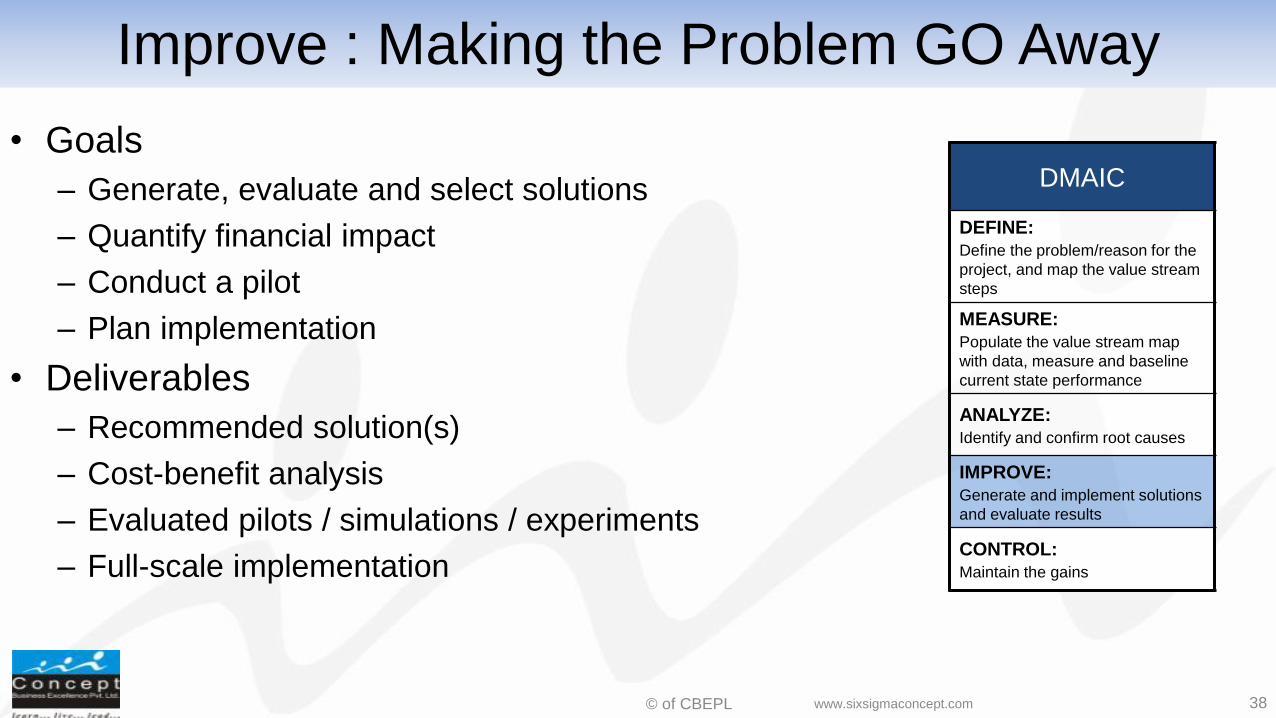
Improve : Making the Problem GO Away
• Goals
– Generate, evaluate and select solutions
– Quantify financial impact
– Conduct a pilot
– Plan implementation
• Deliverables
– Recommended solution(s)
– Cost-benefit analysis
– Evaluated pilots / simulations / experiments
– Full-scale implementation
DMAIC
DEFINE:
Define the problem/reason for the
project, and map the value stream
steps
MEASURE:
Populate the value stream map
with data, measure and baseline
current state performance
ANALYZE:
Identify and confirm root causes
IMPROVE:
Generate and implement solutions
and evaluate results
CONTROL:
Maintain the gains
38 www.sixsigmaconcept.com
© of CBEPL
Improve : Common Tools
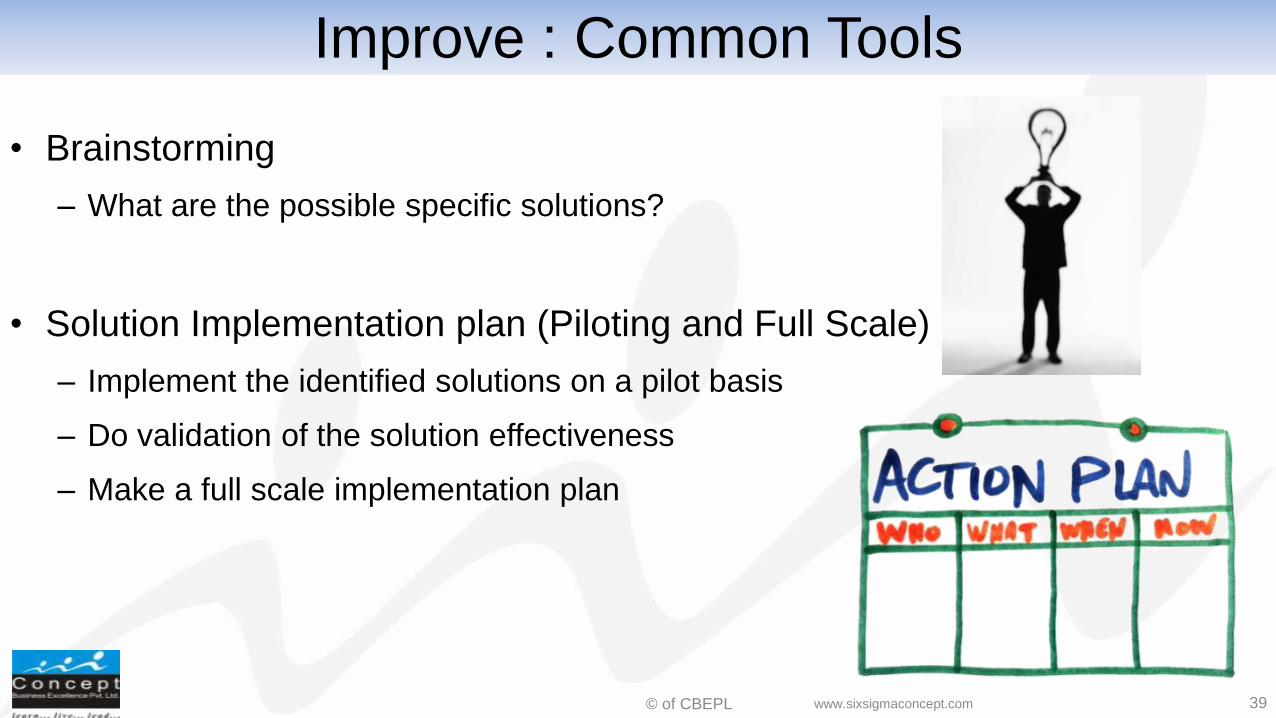
• Brainstorming
– What are the possible specific solutions?
• Solution Implementation plan (Piloting and Full Scale)
– Implement the identified solutions on a pilot basis
– Do validation of the solution effectiveness
– Make a full scale implementation plan
39 www.sixsigmaconcept.com
© of CBEPL
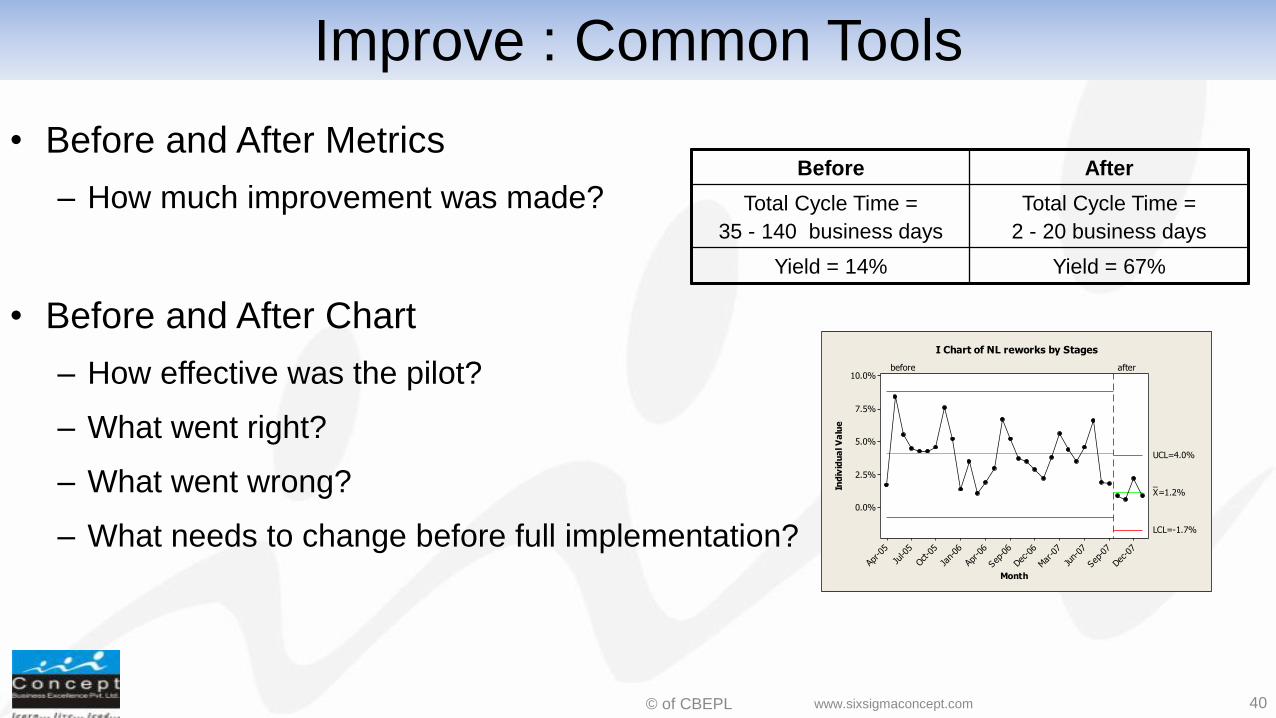
• Before and After Metrics
– How much improvement was made?
• Before and After Chart
– How effective was the pilot?
– What went right?
– What went wrong?
– What needs to change before full implementation?
Before After
Total Cycle Time =
35 - 140 business days
Total Cycle Time =
2 - 20 business days
Yield = 14% Yield = 67%
Dec-07
Sep-07
Jun-
07
Mar
-07
Dec-0
6
Sep-06
Apr-06
Jan-06
Oct-0
5
Jul-0
5
Apr-05
10.0%
7.5%
5.0%
2.5%
0.0%
Month
Ind
ivid
ua
l V
alu
e
_X=1.2%
UCL=4.0%
LCL=-1.7%
before after
I Chart of NL reworks by Stages
Improve : Common Tools
40 www.sixsigmaconcept.com
© of CBEPL
Six Sigma – Control
41 www.sixsigmaconcept.com
© of CBEPL
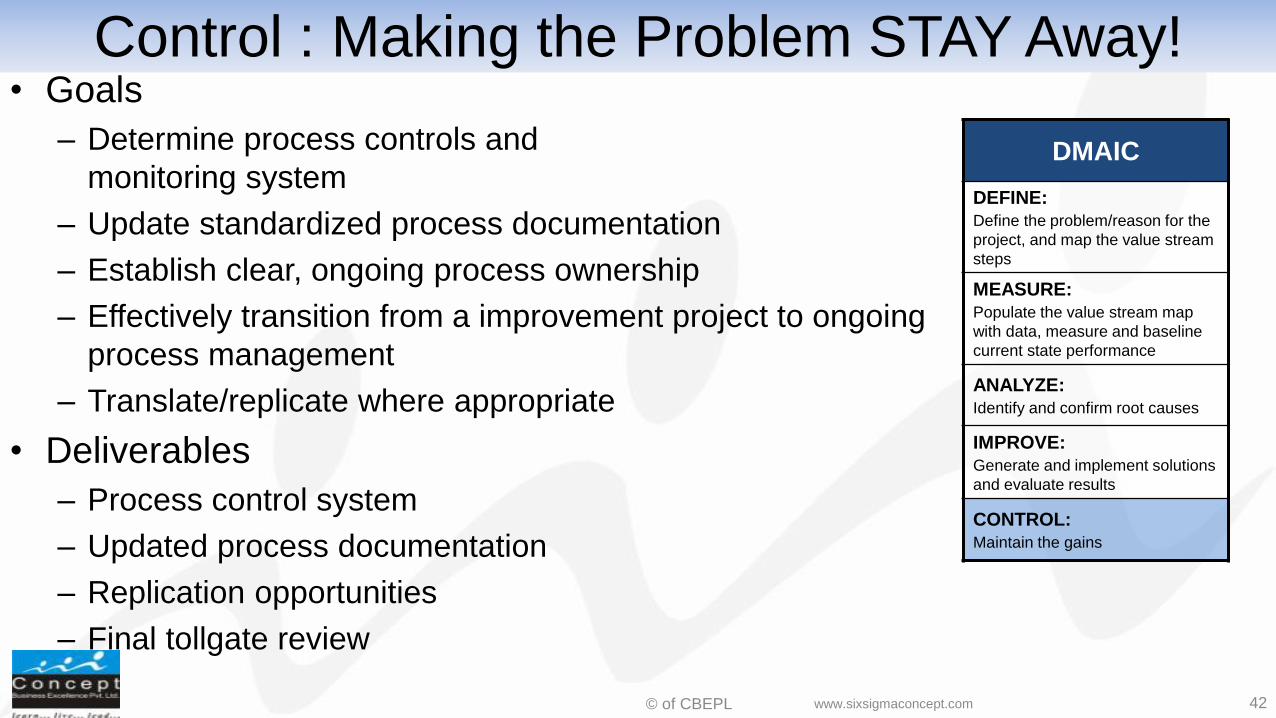
Control : Making the Problem STAY Away! • Goals
– Determine process controls and
monitoring system
– Update standardized process documentation
– Establish clear, ongoing process ownership
– Effectively transition from a improvement project to ongoing
process management
– Translate/replicate where appropriate
• Deliverables
– Process control system
– Updated process documentation
– Replication opportunities
– Final tollgate review
DMAIC
DEFINE:
Define the problem/reason for the
project, and map the value stream
steps
MEASURE:
Populate the value stream map
with data, measure and baseline
current state performance
ANALYZE:
Identify and confirm root causes
IMPROVE:
Generate and implement solutions
and evaluate results
CONTROL:
Maintain the gains
42 www.sixsigmaconcept.com
© of CBEPL
Control : Common Tools
• Monitoring Plan
– How will we monitor the process
in the future?
– How will we monitor and control
the x’s in order to prevent problems with the y’s?
• Control Chart
– How will we make sure the process stays in control and
continues to meet customer requirements?
– How will we identity future improvement opportunities?
28252219161310741
25
20
15
10
5
0
Observation
Ind
ivid
ua
l V
alu
e
_X=13.26
UCL=18.31
LCL=8.20
Individuals Control Chart
USL
LSL
43 www.sixsigmaconcept.com
© of CBEPL
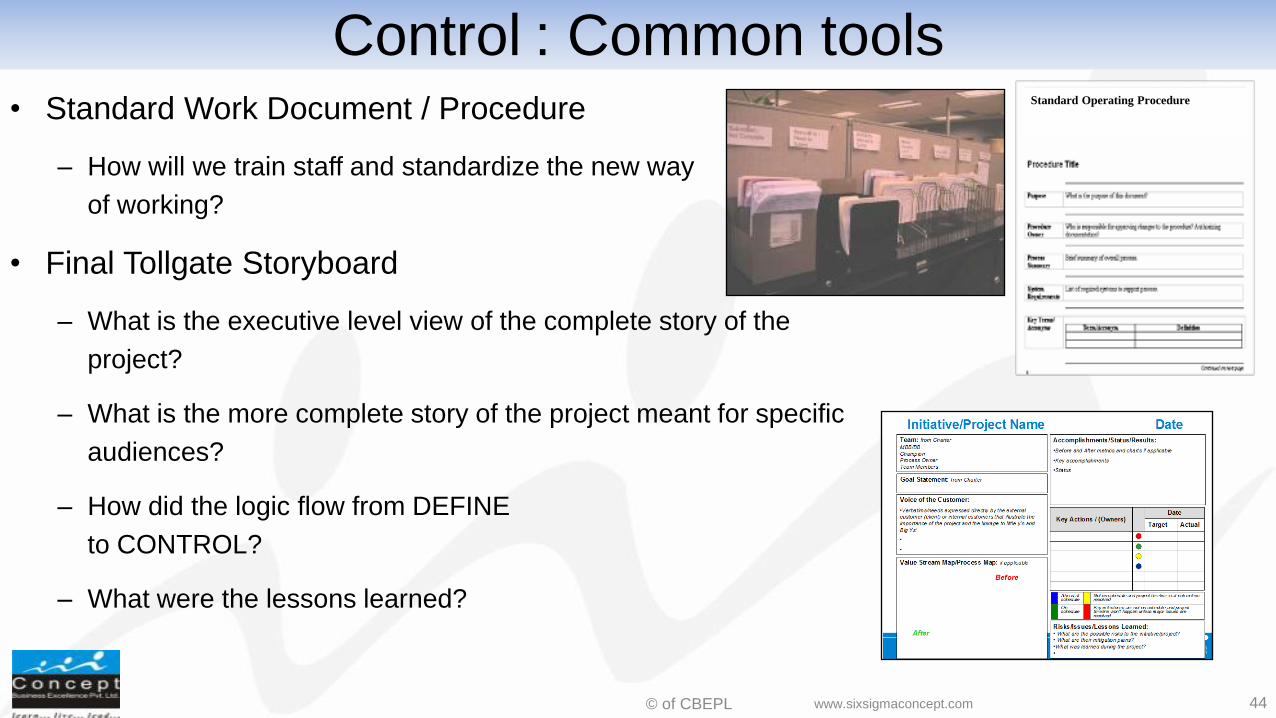
Control : Common tools • Standard Work Document / Procedure
– How will we train staff and standardize the new way
of working?
• Final Tollgate Storyboard
– What is the executive level view of the complete story of the
project?
– What is the more complete story of the project meant for specific
audiences?
– How did the logic flow from DEFINE
to CONTROL?
– What were the lessons learned?
Standard Operating Procedure
44 www.sixsigmaconcept.com

© of CBEPL
Thank You!!!
45 www.sixsigmaconcept.com