Embed Size (px)
Citation preview
All right reserved. © Copyright 2010 Invistics 1 www.invistics.com
Lean Pull Design Webinar
August 24, 2010
Tom Knight, Invistics
All right reserved. © Copyright 2010 Invistics www.invistics.com
• Founder & CEO, Invistics
• Manufacturing & Supply Chain Career
About Today’s Speaker
• IIE Member and Frequent Speaker
Tom Knight

All right reserved. © Copyright 2010 Invistics www.invistics.com
Agenda
Urgent Manufacturing Challenges
Implementing Lean & Pull in High-Mix Manufacturing
Best Practices & Case Studies
Questions & Discussion

All right reserved. © Copyright 2010 Invistics www.invistics.com
– Fierce offshore competition
– Shorter product life cycles
– More product variants and SKUs
– Standardizing best practices across plants
– Complex global supply networks
– Heightened regulatory compliance
Urgent Manufacturing Challenges

All right reserved. © Copyright 2010 Invistics www.invistics.com
Increased demands by customers:
Consumer Products adding 20% more SKUs each year
Chemicals experiencing 60% volatility in some SKUs
Product Proliferation is Hitting Every Industry

All right reserved. © Copyright 2010 Invistics www.invistics.com
Then Now
• Long runs
• High utilization
• Dedicated
equipment
• Repetitive
• Stable demand
• Short runs
• Faster changeovers
• Shared equipment
• Responsiveness
• Highly variable demand
High-volume High-mix
Every Industry Is Changing

All right reserved. © Copyright 2010 Invistics www.invistics.com
• It’s not about the high-
volume assembly line
• It’s about :
– flexibility & customer service
– time to market
– new product introductions
– off-shore competition
– reducing cost & inventory
Manufacturing has changed

All right reserved. © Copyright 2010 Invistics www.invistics.com
Agenda
Urgent Manufacturing Challenges
Implementing Lean & Pull in High-Mix Manufacturing
Best Practices & Case Studies
Questions & Discussion
All right reserved. © Copyright 2010 Invistics www.invistics.com
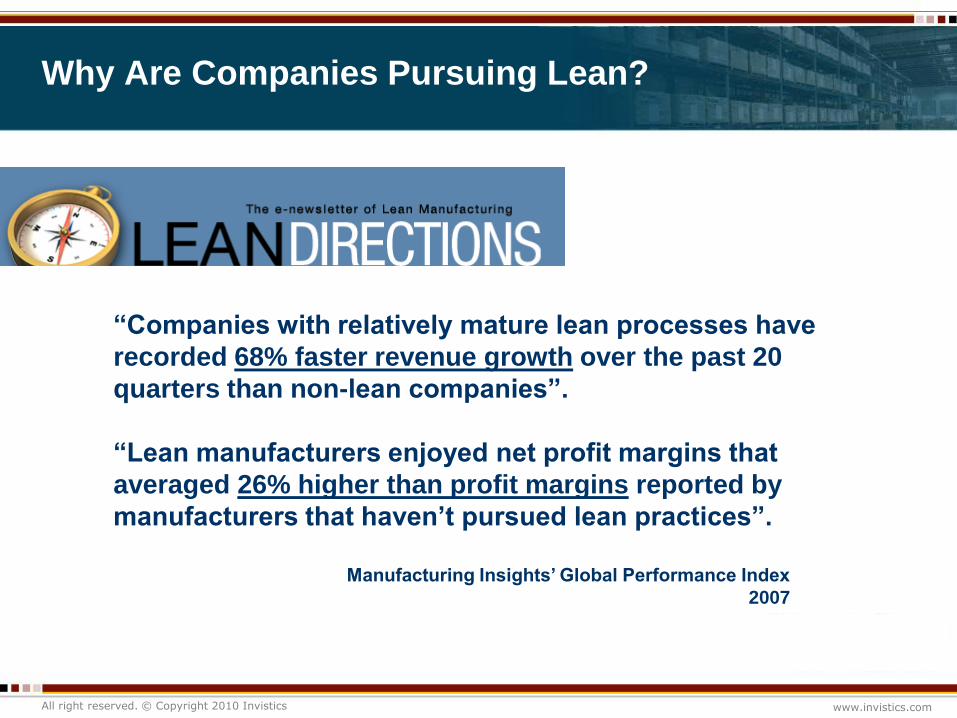
“Companies with relatively mature lean processes have
recorded 68% faster revenue growth over the past 20
quarters than non-lean companies”.
“Lean manufacturers enjoyed net profit margins that
averaged 26% higher than profit margins reported by
manufacturers that haven’t pursued lean practices”.
Manufacturing Insights’ Global Performance Index
2007
Why Are Companies Pursuing Lean?

All right reserved. © Copyright 2010 Invistics www.invistics.com
Non-value Added Time
Movement
Storage
Waiting in Queue
Waiting for Inspection
95%5%
Value Added
“Touch Time”
Non-value Added
95+% of Time for an Order is Non-Value Added Waste

All right reserved. © Copyright 2010 Invistics www.invistics.com
Lean Provides the Tools for Eliminating Waste

All right reserved. © Copyright 2010 Invistics www.invistics.com
Push
Produces product using forecasts or schedules, without regard for what has been consumed
Leads to excess inventory since no “cap” in place
ERP/MRP is an example
Pull
Controls the flow of product by replacing only what has been consumed
“Caps” inventory and replenishes what was sold, usually in appropriate lot sizes
Kanban is an example
Push vs. Pull
All right reserved. © Copyright 2010 Invistics www.invistics.com
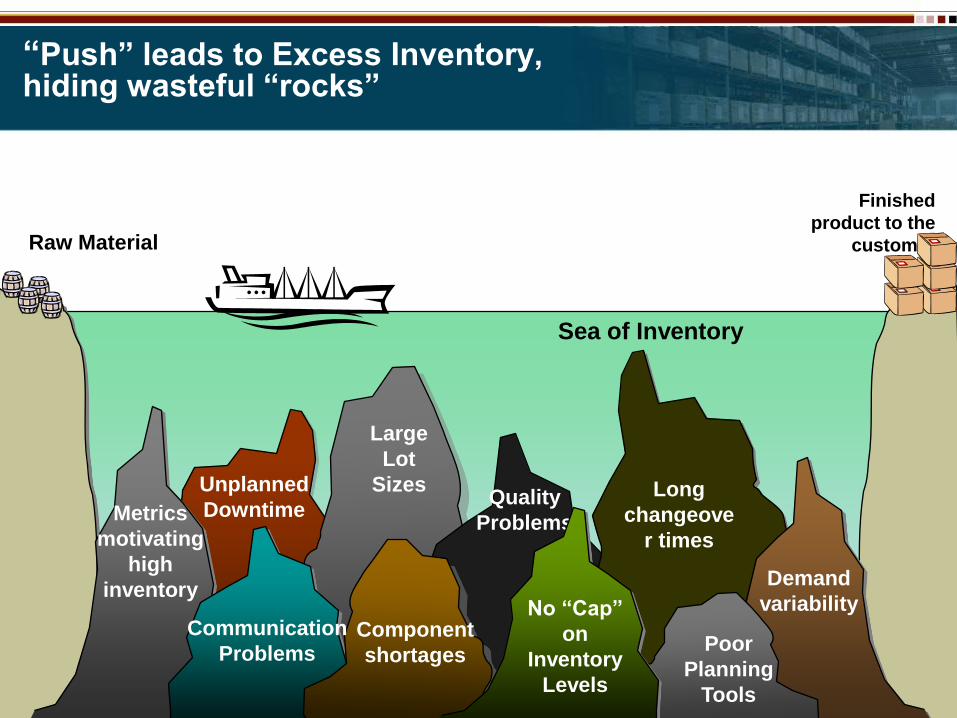
Raw Material
“Push” leads to Excess Inventory, hiding wasteful “rocks”
Sea of Inventory
Finished
product to the
customer
Long
changeove
r times
Quality
Problems
Large
Lot
Sizes
Component
shortages
Communication
Problems
Metrics
motivating
high
inventory
Unplanned
Downtime
No “Cap”
on
Inventory
Levels
Demand
variability
Poor
Planning
Tools

All right reserved. © Copyright 2010 Invistics www.invistics.com
Raw Material
“Pull” sets “cap” on inventory, providing the discipline to remove wasteful “rocks”
Long
changeove
r times
Quality
Problems
Large
Lot
Sizes
Component
shortages
Communication
Problems
Metrics
motivating
high
inventory
Unplanned
Downtime
Sea of Inventory
Finished
product to the
customer
No “Cap”
on
Inventory
Levels
Demand
variability
Lower the Water &
Remove the
Rocks
Poor
Planning
Tools

All right reserved. © Copyright 2010 Invistics www.invistics.com
Kanban
Squares
A Simple “Pull” Example

All right reserved. © Copyright 2010 Invistics www.invistics.com
Machine
1
Machine
2
Machine
3
Raw
Materials
Fin.
Goods
Kanban Card
Part Number: 12345
Quantity: 10
Stage: Machine 2
12345
Kanban Card
Part Number: 12345
Quantity: 10
Stage: Machine 3
12345
Kanban Card
Part Number: 12345
Quantity: 10
Stage: Machine 3
12345
Kanban Card
Part Number: 12345
Quantity: 10
Stage: Machine 2
12345
Kanban Card
Part Number: 12345
Quantity: 10
Stage: Machine 2
12345
Kanban Card
Part Number: 12345
Quantity: 10
Stage: Fin Goods
12345
Kanban Card
Part Number: 12345
Quantity: 10
Stage: Fin Goods
12345
Kanban Card
Part Number: 12345
Quantity: 10
Stage: Fin Goods
Kanban Card
Part Number: 12345
Quantity: 10
Stage: Fin Goods
Pull Using “Kanban” Cards
All right reserved. © Copyright 2010 Invistics www.invistics.com
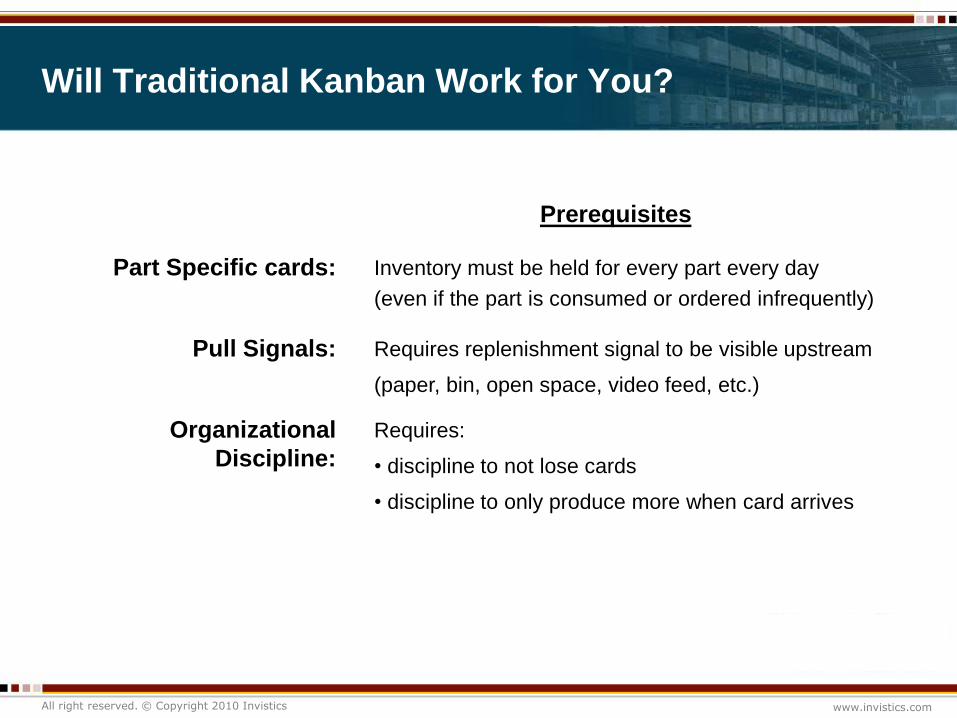
Prerequisites
Part Specific cards: Inventory must be held for every part every day
(even if the part is consumed or ordered infrequently)
Pull Signals: Requires replenishment signal to be visible upstream
(paper, bin, open space, video feed, etc.)
Organizational
Discipline:
Requires:
• discipline to not lose cards
• discipline to only produce more when card arrives
Will Traditional Kanban Work for You?
All right reserved. © Copyright 2010 Invistics www.invistics.com
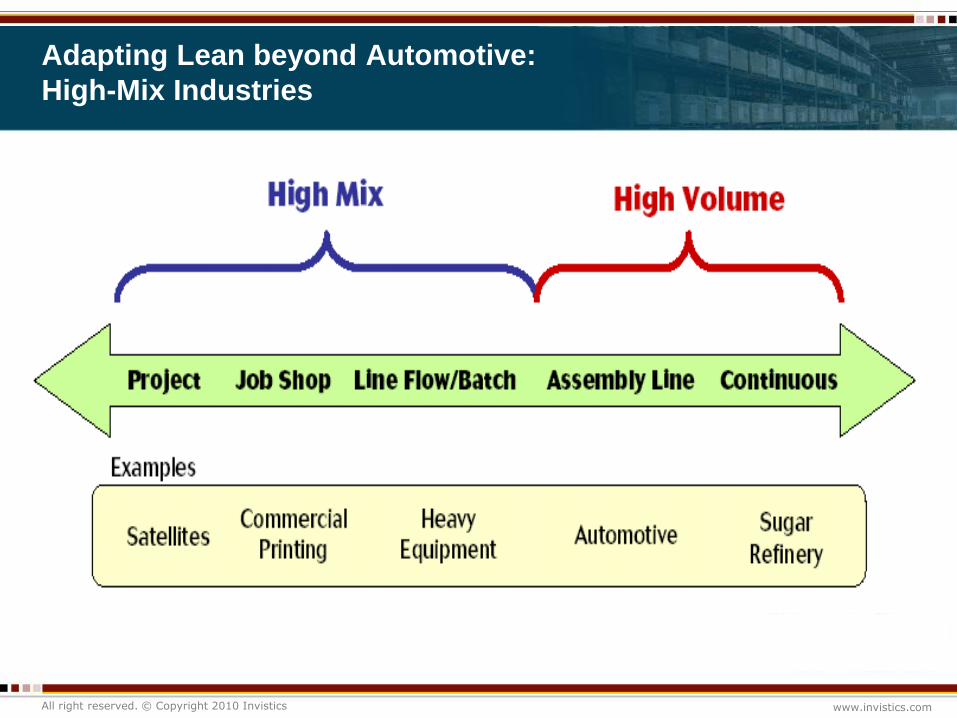
Adapting Lean beyond Automotive:
High-Mix Industries

All right reserved. © Copyright 2010 Invistics www.invistics.com
What is Different in High Mix Industries?
Manufacturing
CharacteristicAutomotive
High Mix Industries
(Discrete & Process)
Product Demand Stable Variable
Product Volume High Variable
Product Mix Low High
Production Flows Dedicated Equip. Shared Equipment
Equipment Utilization Low (3rd shift free) High
Equipment Changeovers Short, Infrequent Long, Frequent
Equipment Reliability Reliable Unreliable
All right reserved. © Copyright 2010 Invistics www.invistics.com
Beware of
“automotive” lean tools in
high-mix manufacturing environments
All right reserved. © Copyright 2010 Invistics www.invistics.com
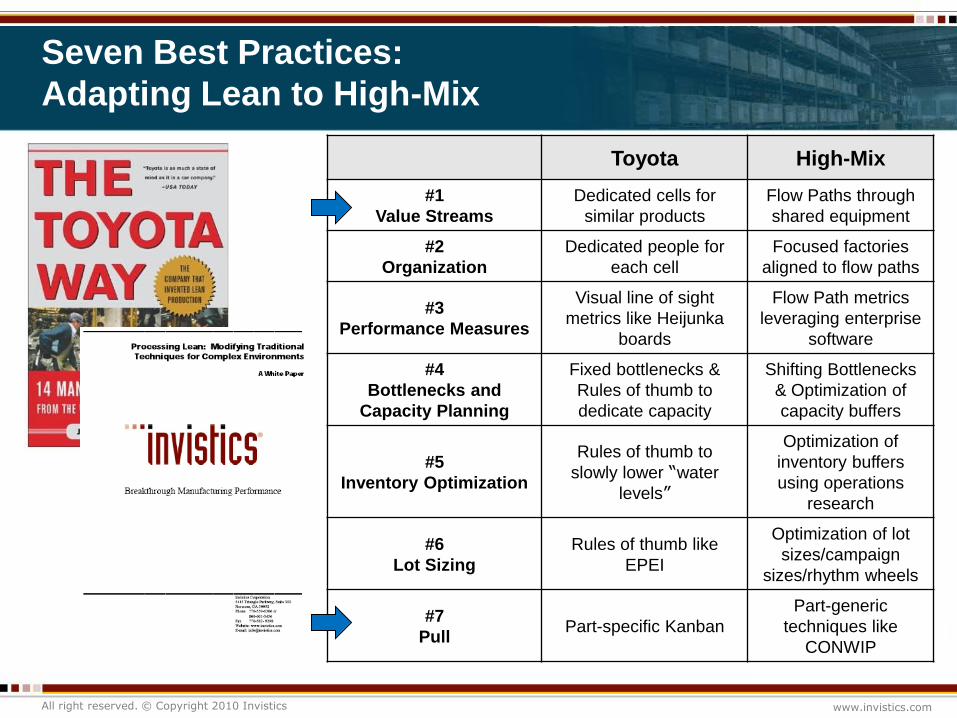
Toyota High-Mix
#1
Value Streams
Dedicated cells for
similar products
Flow Paths through
shared equipment
#2
Organization
Dedicated people for
each cell
Focused factories
aligned to flow paths
#3
Performance Measures
Visual line of sight
metrics like Heijunka
boards
Flow Path metrics
leveraging enterprise
software
#4
Bottlenecks and
Capacity Planning
Fixed bottlenecks &
Rules of thumb to
dedicate capacity
Shifting Bottlenecks
& Optimization of
capacity buffers
#5
Inventory Optimization
Rules of thumb to
slowly lower “water
levels”
Optimization of
inventory buffers
using operations
research
#6
Lot Sizing
Rules of thumb like
EPEI
Optimization of lot
sizes/campaign
sizes/rhythm wheels
#7
PullPart-specific Kanban
Part-generic
techniques like
CONWIP
Seven Best Practices:
Adapting Lean to High-Mix
All right reserved. © Copyright 2010 Invistics www.invistics.com
Agenda
Urgent Manufacturing Challenges
Implementing Lean & Pull in High-Mix Manufacturing
Best Practices & Case Studies
Questions & Discussion
All right reserved. © Copyright 2010 Invistics www.invistics.com
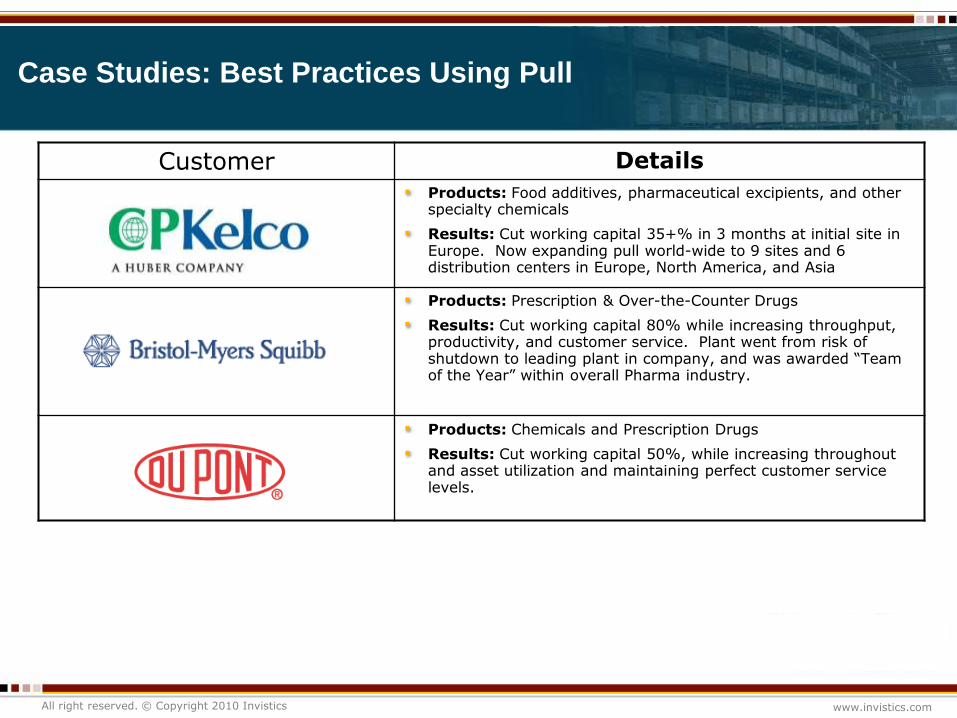
Customer Details
Products: Food additives, pharmaceutical excipients, and other specialty chemicals
Results: Cut working capital 35+% in 3 months at initial site in Europe. Now expanding pull world-wide to 9 sites and 6 distribution centers in Europe, North America, and Asia
Products: Prescription & Over-the-Counter Drugs
Results: Cut working capital 80% while increasing throughput, productivity, and customer service. Plant went from risk of shutdown to leading plant in company, and was awarded “Team of the Year” within overall Pharma industry.
Products: Chemicals and Prescription Drugs
Results: Cut working capital 50%, while increasing throughout and asset utilization and maintaining perfect customer service levels.
Case Studies: Best Practices Using Pull

All right reserved. © Copyright 2010 Invistics www.invistics.com
Prerequisites for Pull
Necessary
Leadership with lean experience and a commitment to pull
Organizational Culture
Receptivity to change
Discipline to produce only when more inventory is needed
Nice But Not Necessary
Accurate forecasts
Stable demand
Reliable equipment
On-time vendors
Dedicated cells
Fast changeovers
Small lot sizes
All right reserved. © Copyright 2010 Invistics www.invistics.com
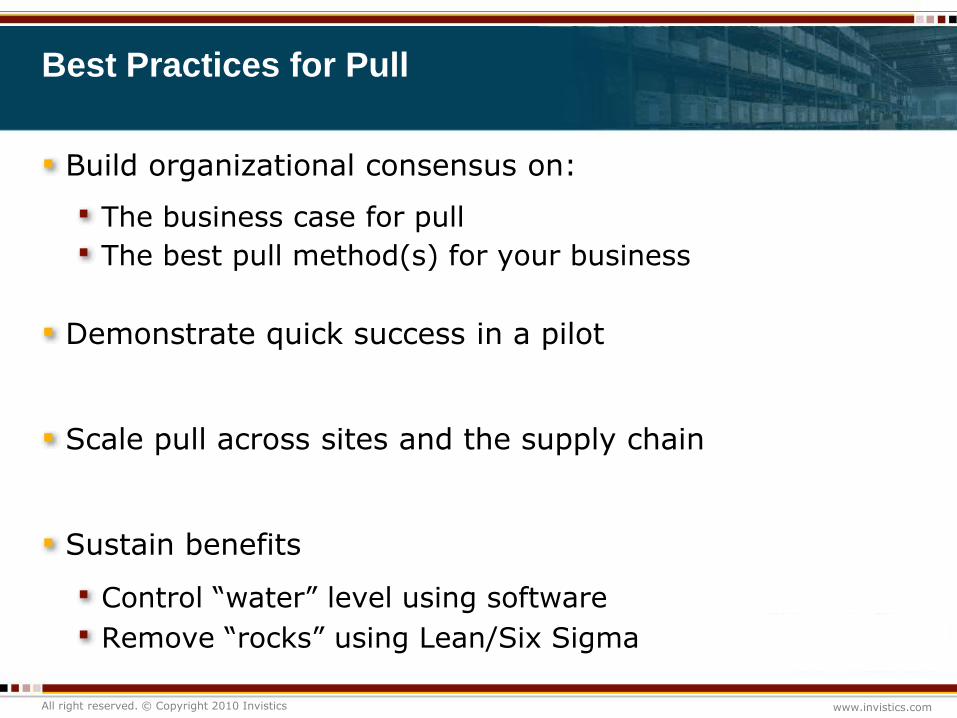
Best Practices for Pull
Build organizational consensus on:
The business case for pull
The best pull method(s) for your business
Demonstrate quick success in a pilot
Scale pull across sites and the supply chain
Sustain benefits
Control “water” level using software
Remove “rocks” using Lean/Six Sigma

All right reserved. © Copyright 2010 Invistics www.invistics.com
1. Analyze four key metrics:
• Inventory
• Cycle Time/Throughput Time
• Customer Service
• Throughput
2. Estimate the value of inventory reductions:
• What is the value of reducing cycle time by 1 day?
• What other savings will result as inventory is reduced?
3. Estimate additional benefits, such as
• Improved customer service due to shorter cycle times
• Improved first pass quality or yield due to shorter cycle times
• Ability to better prioritize „rock removal‟ projects
Building The Business Case

All right reserved. © Copyright 2010 Invistics www.invistics.com
Typical ROI for Pull is often >300%,
with payback in < 1Year
All right reserved. © Copyright 2010 Invistics www.invistics.com
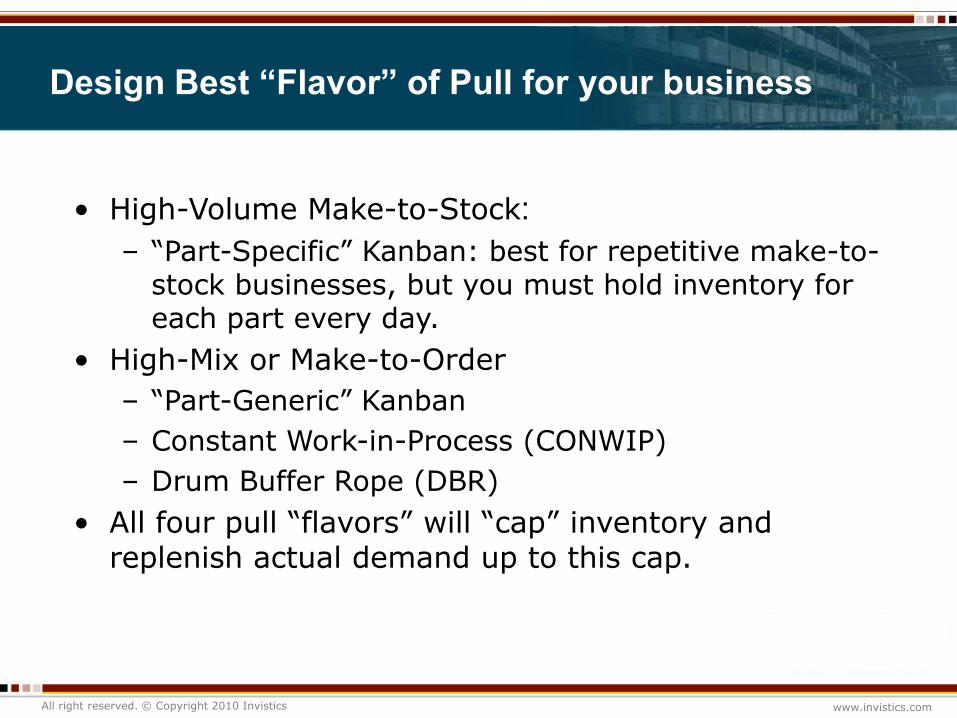
• High-Volume Make-to-Stock:
– “Part-Specific” Kanban: best for repetitive make-to-stock businesses, but you must hold inventory for each part every day.
• High-Mix or Make-to-Order
– “Part-Generic” Kanban
– Constant Work-in-Process (CONWIP)
– Drum Buffer Rope (DBR)
• All four pull “flavors” will “cap” inventory and replenish actual demand up to this cap.
Design Best “Flavor” of Pull for your business
All right reserved. © Copyright 2010 Invistics www.invistics.com
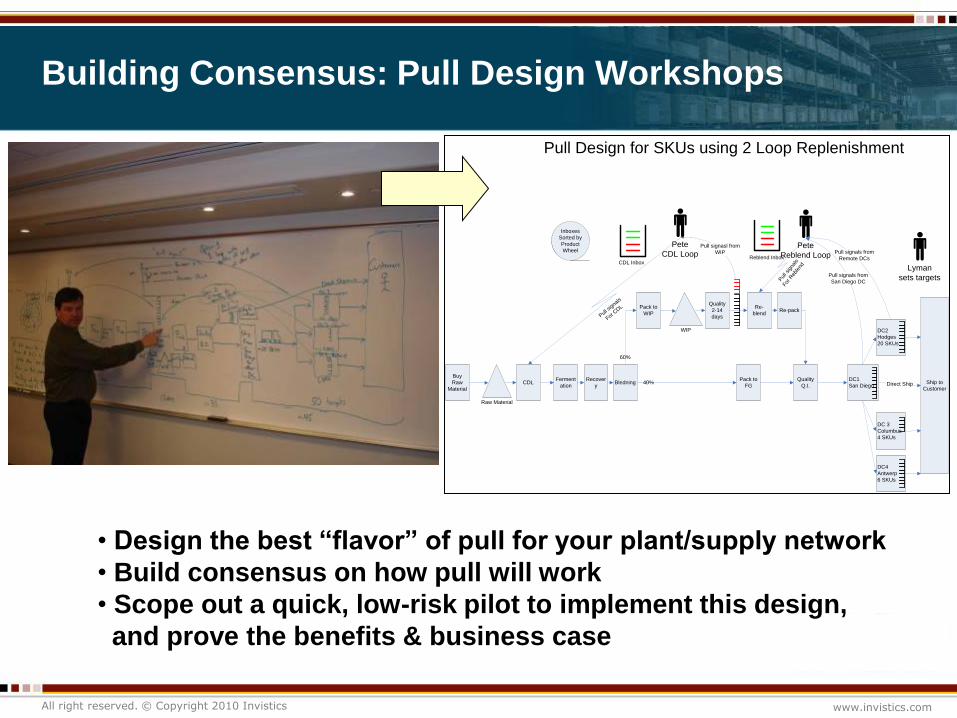
Building Consensus: Pull Design Workshops
DC 3
Columbus
4 SKUs
Inboxes
Sorted by
Product
Wheel
Ferment
ationBledning
Recover
y
Pack to
WIP
Re-
blend
Pack to
FG
Raw Material
WIP
Re-pack
Quality
Q.I.
DC2
Hodges
20 SKUs
DC4
Antwerp
6 SKUs
Ship to
Customer
Buy
Raw
MaterialDirect Ship40%
60%
Pete
Reblend Loop
Pull sig
nals
For CDL
Quality
2-14
days
CDL
Pull signals from
Remote DCs
DC1
San Diego
Pull signals from
San Diego DC
Lyman
sets targetsPul
l sig
nals
For R
eble
nd
Pull signasl from
WIP
Pull Design for SKUs using 2 Loop Replenishment
Pete
CDL LoopCDL Inbox
Reblend Inbox
• Design the best “flavor” of pull for your plant/supply network
• Build consensus on how pull will work
• Scope out a quick, low-risk pilot to implement this design,
and prove the benefits & business case

All right reserved. © Copyright 2010 Invistics www.invistics.com
Option 1: “Generic” Kanban
Allows you to have 100‟s of part numbers with each part family
Pull Design Options
Authorize
Inventory
Authorize
Inventory
Authorize
Inventory
Authorize
Inventory
Authorize
Inventory
Weigh Kit &
Assign to
batch
Initial
Blend
Final
Blend
1
Compress
1
Compress
2
Coating
Pack & Ship
Final
Blend
2Encapsulate
Wet
Granulation
Part Family 1
Part Family 2
Authorize
Inventory
Authorize
Inventory
Authorize
Inventory
Authorize
Inventory

All right reserved. © Copyright 2010 Invistics www.invistics.com
Option 2: Constant Work in Process (CONWIP)
A series of operations with a single inventory target
Pull signal sent to first operation when inventory reaches target level
Similar to eKanban, but more flexible in number of operations in each loop
Pull Design Options
Weigh Kit &
Assign to
batch
Initial
Blend
Final
Blend
1
Compress
1
Compress
2
Coating
Pack & Ship
Final
Blend
2Encapsulate
Wet
Granulation
Part Family 1
Product 2
Authorize
Inventory
Authorize
Inventory

All right reserved. © Copyright 2010 Invistics www.invistics.com
Option 3: “Drum-Buffer-Rope
Based on “Theory of Constraints”
Similar to CONWIP but loops always end at bottlenecks
Pull Design Options
Weigh Kit &
Assign to
batch
Initial
Blend
Final
Blend
1
Compress
1
Compress
2
Coating
Pack & Ship
Final
Blend
2Encapsulate
Wet
Granulation
BOTTLENECK
BOTTLENECK
Product Family 1
Product Family 2
Authorize
Inventory
Authorize
Inventory
Eli Goldratt

All right reserved. © Copyright 2010 Invistics www.invistics.com
Case Study: Pull using
Constant Work-in-Process (CONWIP)
Bottleneck
Weigh-up More of Product 2
When WIP Drops Below Target
Weigh-up More of Product 1
When WIP Drops Below Target
Initial
Blend
1
Product 1Final
Blend
1
Compr.
1CoatingE E
Product 2Final
Blend
2Wet
Granulation
Encap-
sulationE
Weigh
Kit &
Assign
to Batch
Compr.
2Pack
&
ShipBottleneck
All right reserved. © Copyright 2010 Invistics www.invistics.com
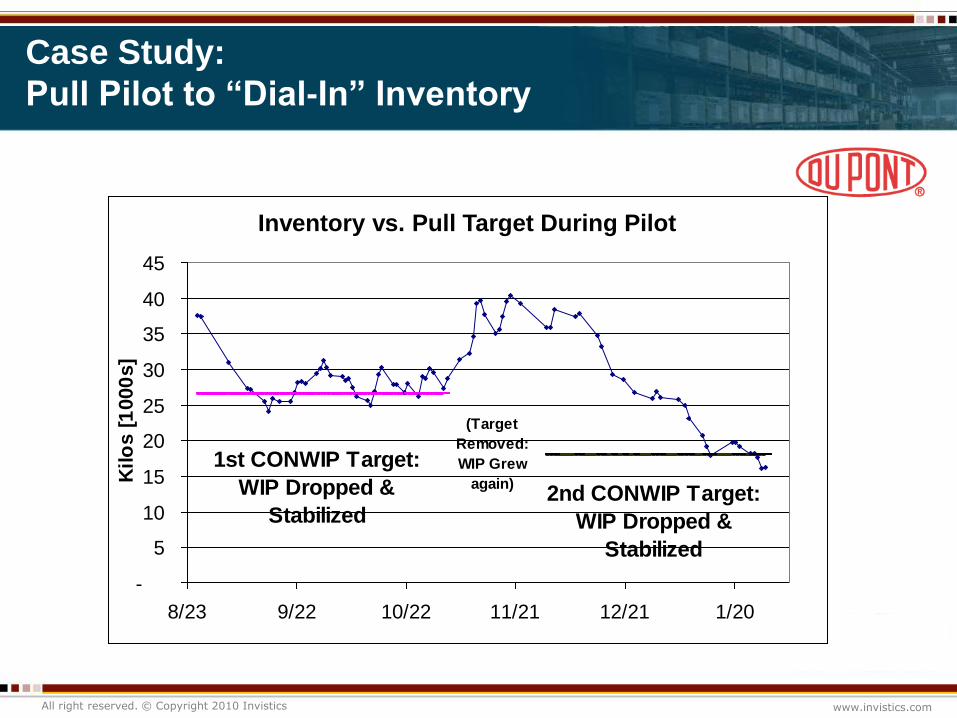
Case Study:
Pull Pilot to “Dial-In” Inventory
WIP vs. CONWIP Target during Pilot Project
-
5
10
15
20
25
30
35
40
45
8/23 9/22 10/22 11/21 12/21 1/20
Kilo
s [
1000
s]
1st CONWIP Target:
WIP Dropped &
Stabilized2nd CONWIP Target:
WIP Dropped &
Stabilized
(Target
Removed:
WIP Grew
again)
Inventory vs. Pull Target During Pilot

All right reserved. © Copyright 2010 Invistics www.invistics.com
Case Study: Implement pull using web pages and existing data

All right reserved. © Copyright 2010 Invistics www.invistics.com
Case Study:
Pull Design Workshop
FGFGWIPWIPRMRM
Mas
h W
eigh
Ste
rili
zati
on
Gel
lan
12 L
iter
See
d T
ank
Mas
h W
eigh
& M
ake
Up
Ste
rili
zati
on
Fer
men
tati
on
Post
T
reat
men
ts
Bee
r W
ells
KO
H
Ad
dit
ion
Gel
lan
Pas
teu
riza
tion
Fil
ter
/ p
H
adju
stm
ent
Pre
cip
itat
ion
3
De
Wat
er
Pre
ss 3
Extr
ud
er
Dry
ing 3
Mil
lin
g 3
Ble
nd
ing 8
Fin
e M
illi
ng
4
Sp
ecia
lty
Ble
nd
5, 11
, 1
2, 1
3
FG
Pac
kag
ing
Rec
on.
Syst
em
Ble
nd
Pre
cip
itat
ion
2
Post
T
reat
men
t
De
Wat
er 2
Pre
ss 2
Dry
ing 2
Mil
lin
g 2
Ble
nd
ing 2
, 3
, 4 F
ine
Mil
lin
g
J10
Sp
ecia
lty
Ble
nd
1
0, 5
Sh
ake
Fla
sk
Gly
. T
rmn
tB
ld2
Post
T
reat
men
ts
CB
M
Dil
uti
on
H2
O
Dil
.
L2
P
aste
uri
zat
ion
Ble
nd
2
Fin
e M
illi
ng
4,
J10
Sp
ecia
lty
Ble
nd
4
,5,1
0,1
1,1
2,
13
All
Oth
er 1
2 L
iter
IP IP
IPQ
C
Q
C
Q
C
Q
C
Q
C
Q
C
1
4
3 3
Gellan
GelRite
Xanthan 3 / NAWX
Rhamsan
Dispersable Xthn
Xanthan 2
Diutan
Xanthan 1L1
Pas
teu
riza
tion
Pre
cip
itat
ion
1
Pre
ss 1
IPIP
Mil
l 1
Dry
1
Ble
nd
1,6
,7
IPIP IPIP IP
2
Designed for:
• Make-to-order & make-to-stock
• Shared, unreliable equipment
• Large forecast error
• Other process variability
All right reserved. © Copyright 2010 Invistics www.invistics.com
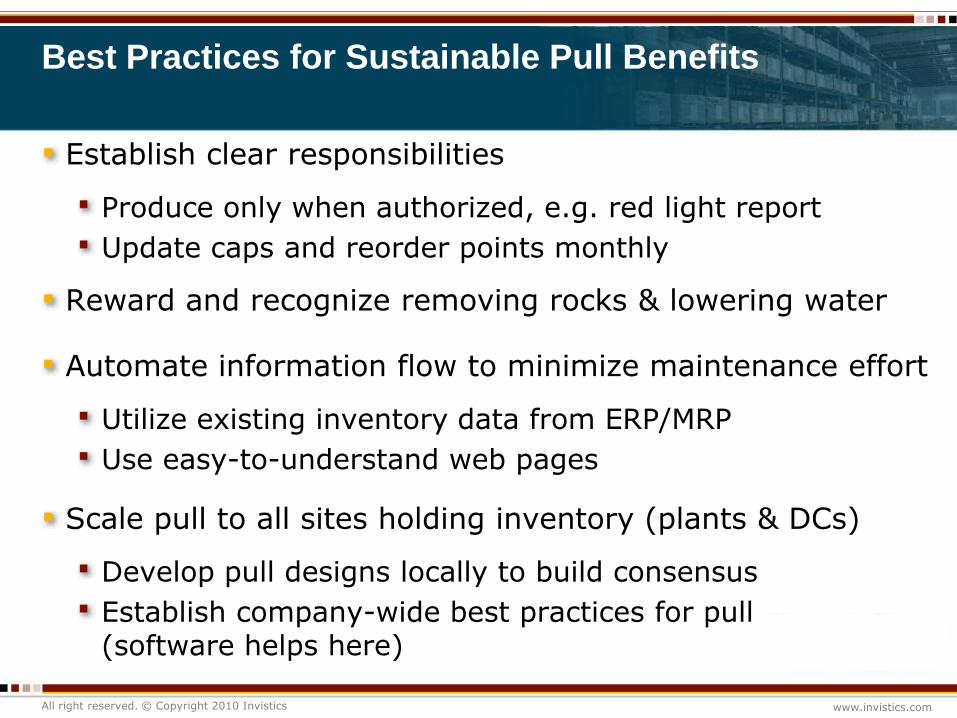
Best Practices for Sustainable Pull Benefits
Establish clear responsibilities
Produce only when authorized, e.g. red light report
Update caps and reorder points monthly
Reward and recognize removing rocks & lowering water
Automate information flow to minimize maintenance effort
Utilize existing inventory data from ERP/MRP
Use easy-to-understand web pages
Scale pull to all sites holding inventory (plants & DCs)
Develop pull designs locally to build consensus
Establish company-wide best practices for pull (software helps here)
All right reserved. © Copyright 2010 Invistics www.invistics.com
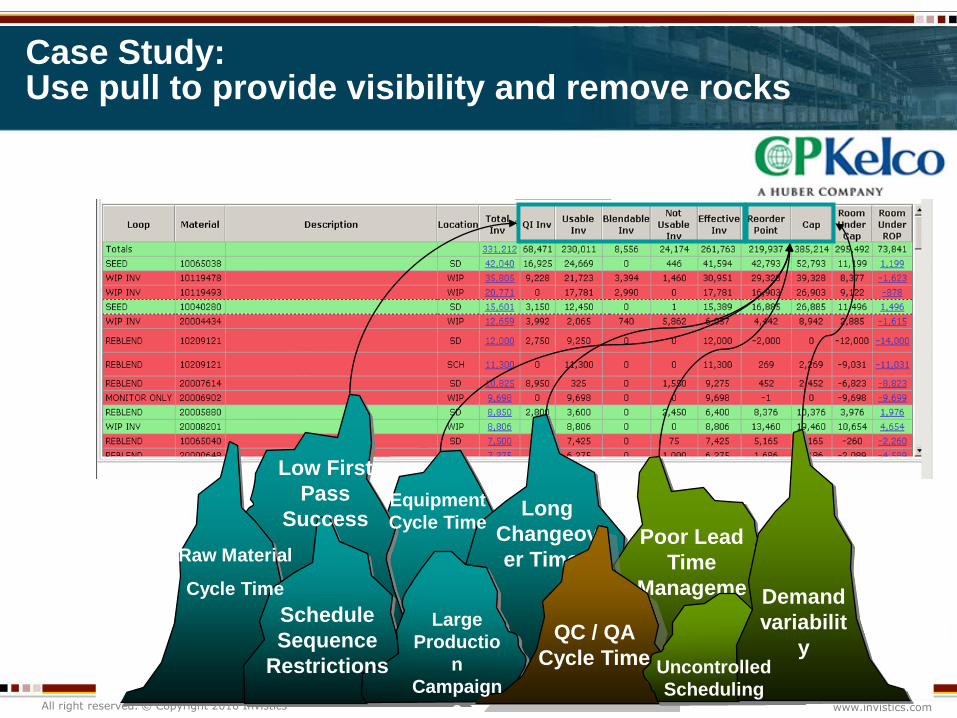
Poor Lead
Time
Manageme
nt
Forecast
Accuracy
Low First
Pass
Success
Raw Material
Cycle Time
Schedule
Sequence
Restrictions
Equipment
Cycle TimeLong
Changeov
er Times
Large
Productio
n
Campaign
s
Demand
variabilit
yQC / QA
Cycle Time Uncontrolled
Scheduling
Case Study: Use pull to provide visibility and remove rocks

All right reserved. © Copyright 2010 Invistics www.invistics.com
Milestones in Your Pull Implementation
Building Consensus: Pull Design Workshop
Ensure organizational readiness for pullDesign pull methods for your supply network (Kanban, CONWIP, DBR, etc.)Confirm the business case, and expected benefits of a pilot2-3 days
Proving the Benefits: Pull Pilot
Quick, low-risk pilot to fix inventory problems using existing ERP dataMost sites see large (20-40%) reductions in working capital 2-3 months
Scaling the Benefits: Expanding Pull
Rapid roll-outs ensure best practices scale across the supply networkUtilize software, as needed, for sustainable success

All right reserved. © Copyright 2010 Invistics www.invistics.com
Tom Knight
Insert
Photo
Here
Thank You! Questions?
For more information:
• Call 770-559-6386
• Email [email protected], or
• Visit www.invistics.com


![Harnessing the Power of Lean Six Sigma: Military Healthcare Evaluation [Institute of Industrial & Systems Engineers: Engineering Lean & Six Sigma Conference 2015]](https://img.pdfslide.us/doc/110x75/58eca1be1a28ab072a8b464f/harnessing-the-power-of-lean-six-sigma-military-healthcare-evaluation-institute.jpg)