Embed Size (px)
Citation preview
ARTICLE IN PRESS
Contents lists available at ScienceDirect
Int. J. Production Economics
Int. J. Production Economics 114 (2008) 313– 332
0925-52
doi:10.1
� Cor
E-m
journal homepage: www.elsevier.com/locate/ijpe
Lean product development: Maximizing the customer perceivedvalue through design change (redesign)
Naveen Gautam a,�, Nanua Singh b
a Hella India Electronics, Plot P-46, Rajeev Gandhi Infotech Park Phase I, Hinjewadi, Pune, Maharashtra 411057, Indiab Department of Industrial and Manufacturing Engineering, Wayne State University, Detroit, MI 48202, USA
a r t i c l e i n f o
Article history:
Received 20 November 2004
Accepted 28 December 2006Available online 18 March 2008
Keywords:
Lean product development
Customer perceived value
Design change
Decision making
Optimization
73/$ - see front matter & 2008 Elsevier B.V
016/j.ijpe.2006.12.070
responding author. Tel.: +91 2066730700/80
ail address: [email protected] (N. Gautam
a b s t r a c t
With the incremental product development, one of the main objectives is to make it more
attractive and valuable for the customer, which leads to increased sales and higher profit.
When existing product design is modified to improve its perceived value, each change
needs resource commitment. It is important to identify and pursue only those changes,
which give maximum improvement in the perceived value. In this paper a mathematical
model is presented for perceived value and step-by-step methodology is provided to
capture the optimized design changes with cost implications. With the help of a case
study on automotive vehicle development, we show how proposed model and method
can be used for highest value added change selection. Application of optimization model
for perceived value and change trade-off in general is presented along with some special
policy cases for different scenarios.
& 2008 Elsevier B.V. All rights reserved.
1. Introduction
Any company can stay in market if and only if it makesprofit and keeps its customer excited about its products.Therefore, product improvement by incremental develop-ment is the heart of any sustained business venture(Gilvan et al., 2004; Morgan et al., 2001). With productimprovement, we here imply bringing the new features,technologies, attractive designs and improved quality tothe market. However, this is possible generally byintroducing changes in the existing product. In this studyour scope is limited to the products being developedbased on existing products such as automotives, compu-ters, and printers, etc.
This evolutionary product development for suchproducts needs decision as, what to change and what toreuse. If changes are too many, product development maybe too expensive and development time may be too long.On the other hand, if changes are too few, customer may
. All rights reserved.
0.
).
not be able to see the differences from the last productand unable to get excited (Kosonen and Buhanist, 1995;Lindstedt and Burenius, 2003; Mallik and Chhajed, 2006;Rainey, 2005). However, with aggressive marketing strat-egy some gains can be made which do not last longer(McAdam and Leonard, 2004). Art of sharing the changesand change cost across several product line is outlined bynumber of researchers (Dahan and Hauser, 2002; Gilmoreand Pine, 1997; Meyer and Lehnerd, 1997; Pine, 1999;Richards, 2000). The key to successful product develop-ment is to pursue the changes for which customer cares,while minimizing the overall changes to reduce develop-ment time, cost and risk involved due to these changes.Fisher et al. (1999) presented key costs related optimiza-tion model for component sharing and tradeoffs forvariety and use of over designed parts. In their study,they did not consider impact of customer perception onsharing or reuse of the components across products.Samson and Wacker (1998) provided a broad and generalunderstanding on maximizing the benefits per dollar tothe customer. In their study on automobile industry, theyprovided a good comparison of various players in industryand emphasized the need for focusing more on the
ARTICLE IN PRESS
N. Gautam, N. Singh / Int. J. Production Economics 114 (2008) 313–332314
customer as a new organizational cultural, but did notgive any theoretical model or step by step process tosupport their study. Value of a global product wasanalyzed and compared in cultural context by Boztepe(2007) and Matsui et al. (2007). However, their focus wason localization and standardization of the product.Marketing aspects of customer perceived value has beenextensively reported in literature (Tam, 2004; Ulaga andChacour, 2001), but during product development custo-mer perceived value still needs more attention.
Ulrich and Eppinger (2004) provided steps for identify-ing customer needs and establishing their relativeimportance, but did not provide method for selectingvital few needs based on their perceived value andpractical constraints like budget, development time, riskdue to change, etc. Several researchers (e.g. Hauser andClausing, 1988; Ulrich and Eppinger, 2004; Wheelwrightand Clark, 1992) emphasized the need to first establishcritical customer attributes for the product using QFDapproach. These attributes become the rows of the centralmatrix of the house of quality. Kansei Engineering(Nagamachi, 1989, 1995, 2002) has been developed andsuccessfully applied (Hsiao and Chen, 1997; Ishihara et al.,1995; Jindo and Hirasago, 1997; Lai et al., 2006; Yang et al.,1999) as ‘‘translating technology of a consumer’s feeling(Kansei in Japanese) and image of a product into designelements’’. Han et al. (2004) prioritized customer attri-butes and engineering characteristics in QFD with in-complete information using linear partial orderingapproach and Fung et al. (2006) helped in establishingfunctional relation using fuzzy regression. However, theydid not study the cost implications and impact of changesrequired to implement the prioritized characteristics.Studies of Burke (1992) and Gilvan et al. (2004) wereprimarily based on optimization of development life cycleat the program level. In his study, Burke (1992) did notbring the analysis at the component level. Lin et al. (2008)proposed dynamic development process model, for mana-ging overlapped iterative product development. Ozer(2007) emphasized the need of reducing demand un-certainties by predicting cluster-based methodologies forcustomer opinions. Whereas, Sobek (1997) and Sobek andFord (2005) emphasized the need of knowledge-basedproduct development for any effective and efficient designreuse, but did not discuss how reuse impact the customerperception. Ryan (2004) developed multiple models basedon goal programming for generalized economies of scale.Ulrich (1995) presented the role of the product architec-ture by which function of a product is allocated to aphysical component. He tried to conceptualize thelinkages between product architecture and key areas likeproduct change, product variety, component standardiza-tion, product performance and product developmentmanagement. Krishnan and Ulrich (2001) presented anextensive review of literature on product developmentdecisions. Sousa and Voss (2002) provided review andagenda for future research on multidimensional qualitymanagement and there is evidence of multidimensionalquality construct (Stone-Romero et al., 1997) includingcustomer perceived quality. However, not much has beenreported on perceived value based product design change.
Unlike the existing literature, in this paper we areproposing a method of feature selection during incre-mental product development to maximize the customerperceived value for the changes. In our analysis weincluded cost of change in the form of development cost,tooling cost, per piece cost and increased warranty costdue to increased risk. We also consider the role of coupledproduct architecture and undesired changes on customerperceived value and change cost. Based on binary integeroptimization, we came out with maximized perceivedvalue within the given budgetary constraints. Our resultsalso provide analytical support that perceived value of thenew product is largely depend on part/feature correlationand part complexity within the given budget, but it can besignificantly improved with resource reallocation basedon policies and product strategy.
2. Reasons for a new component design and its impact
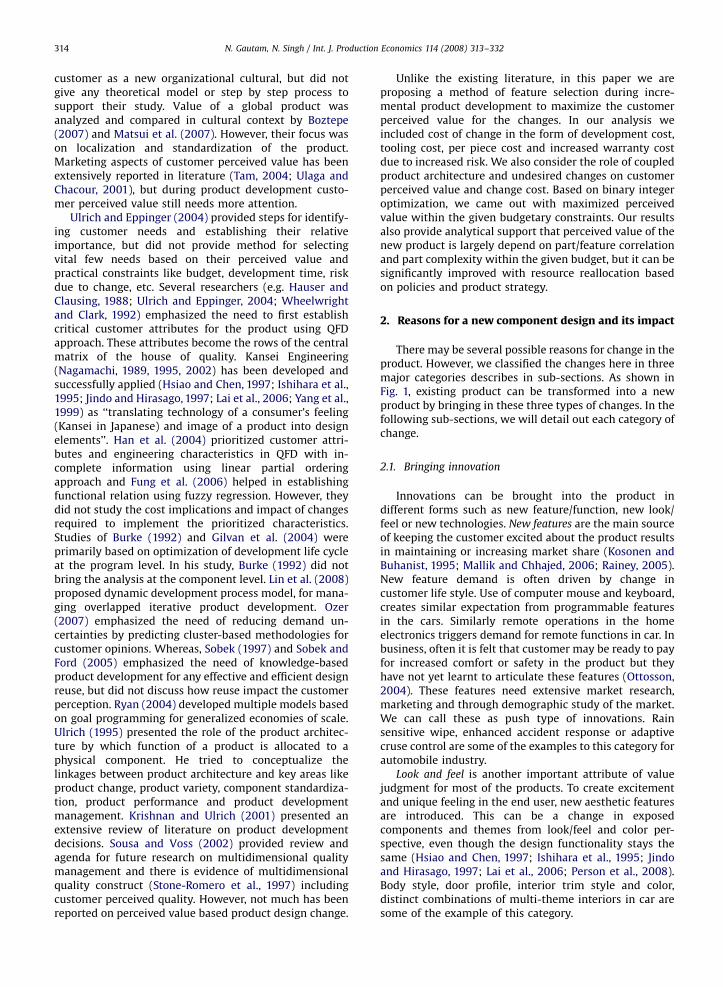
There may be several possible reasons for change in theproduct. However, we classified the changes here in threemajor categories describes in sub-sections. As shown inFig. 1, existing product can be transformed into a newproduct by bringing in these three types of changes. In thefollowing sub-sections, we will detail out each category ofchange.
2.1. Bringing innovation
Innovations can be brought into the product indifferent forms such as new feature/function, new look/feel or new technologies. New features are the main sourceof keeping the customer excited about the product resultsin maintaining or increasing market share (Kosonen andBuhanist, 1995; Mallik and Chhajed, 2006; Rainey, 2005).New feature demand is often driven by change incustomer life style. Use of computer mouse and keyboard,creates similar expectation from programmable featuresin the cars. Similarly remote operations in the homeelectronics triggers demand for remote functions in car. Inbusiness, often it is felt that customer may be ready to payfor increased comfort or safety in the product but theyhave not yet learnt to articulate these features (Ottosson,2004). These features need extensive market research,marketing and through demographic study of the market.We can call these as push type of innovations. Rainsensitive wipe, enhanced accident response or adaptivecruse control are some of the examples to this category forautomobile industry.
Look and feel is another important attribute of valuejudgment for most of the products. To create excitementand unique feeling in the end user, new aesthetic featuresare introduced. This can be a change in exposedcomponents and themes from look/feel and color per-spective, even though the design functionality stays thesame (Hsiao and Chen, 1997; Ishihara et al., 1995; Jindoand Hirasago, 1997; Lai et al., 2006; Person et al., 2008).Body style, door profile, interior trim style and color,distinct combinations of multi-theme interiors in car aresome of the example of this category.
ARTICLE IN PRESS
ExistingDesign
ProductDevelopment
NewDesign
BringingInnovation
NewComponents
In
OldComponents
Out
Reasons forChange
ContinuousImprovement
ForcedChanges
Fig. 1. Reasons for possible changes.
N. Gautam, N. Singh / Int. J. Production Economics 114 (2008) 313–332 315
Technology is rapidly changing and often product isredesigned to incorporate the new technology to staycompetitive in state of art for the industry. Achievingcompetitive advantage and price premiums in manytechnology-based markets requires the incorporation ofadvanced technology in new products (Ottosson, 2004;Reinertsen, 1997). To do so, firms in hyper-competitiveenvironments increasingly plan and design their productsconcurrent with the independent development andvalidation of underlying technologies (Bhattacharyaet al., 2003).
2.2. Continuous improvement
Continuous improvements are always part of productdevelopment strategy (Rainey, 2005; Sobek, 1997). Thereare several ways in which these changes can show up.Some important forms of continuous improvement listedare described in this section.
Performance improvement and cost reduction in theexisting product are assumed as two most importantreasons to pursue the changes for most of the establishedproducts. Whenever new innovation is brought to themarket, due to time pressure and technological con-straints, the maturity level of the design is not very high.Therefore, during the subsequent development cycles, ithas high potential for performance improvement. Simi-larly, when new feature is brought to the market,innovation drives the development (Rainey, 2005), andthe cost factors often stay at low priority (Meyer andLehnerd, 1997). As competitors start bringing similarproducts at relatively competitive cost, organizations areoften forced to go for a new design, which may help inreducing the cost.
Changing to more flexible and modular design is anotherform of continuous improvement. With the new archi-tecture or modification in the existing architecture,flexibility and modularity can be introduced (Ulrich,1995; Pine, 1999). This translates into more featureoptions and configurable product that enables customers
to pick only those features, which are valuable to them.For example, remote key-less entry and power windowoptions can be separated options or DVD player andnavigation system can be offered as independent options,which are generally combined as a package.
Continuous quality improvement is based on theopportunities available during subsequent product devel-opment cycle to rectify the issues and soft points left outin the previous versions of the design. When a new featureis released first time, developers always race against timeand there is a tradeoff between giving a mature designand bringing it first to the customer (Sousa and Voss,2002). Often in this situation, design is being releasedwith an assumption that further refinements can beincorporated in subsequence development cycles.
2.3. Forced changes
Forced changes are often those changes which add verylittle or no value for the customer, but these need to beincorporated in the new design (Krishnan and Ulrich,2001; Ulrich, 1995). Some important forms of changes fallin this category described in this section.
Forced changes are often driven by interfacing system or
components when an introduced innovation triggers chainreaction of changes based on product architecture. Inintegral product architecture often cascading changeeffect is observed by introducing a small change, whereasfor the product based on modular architecture, it is lesslikely that interfacing component drives the non-valueadded changes.
Product design is some times forced to change due tochange in existing regulatory requirements or induction ofnew requirements by the government or insurance industry.These types of changes are often related to environment,passenger safety, vehicle security, and theft protection.Change in acoustic alarm time limits during anti-theftalarming, introduction of stand alone battery require-ments for siren, doubling the turn signal flash rate in the
ARTICLE IN PRESS
N. Gautam, N. Singh / Int. J. Production Economics 114 (2008) 313–332316
event of signal lamp failure are some of the examples forthis category.
Change in interfacing industries’ strategy also forceschange in product. New type of hardware like printer,memory, etc. drive changes in operating system. Droppingout support for micro-controller, drivers and operatingsystem from the last design, often inhibit use of currentinfrastructure.
2.4. Impact and extent of change
As described in the previous sections, change is alwaysdone with single good intention in mind: ‘‘to make theproduct more valuable for the customer’’. However, itoften brings one or more undesired tribulations asfollows:
�
Need to commit development cost � Increase in piece price � Investment in manufacturing and assembly facilities � Changed maintenance and increased cost of partmanagement
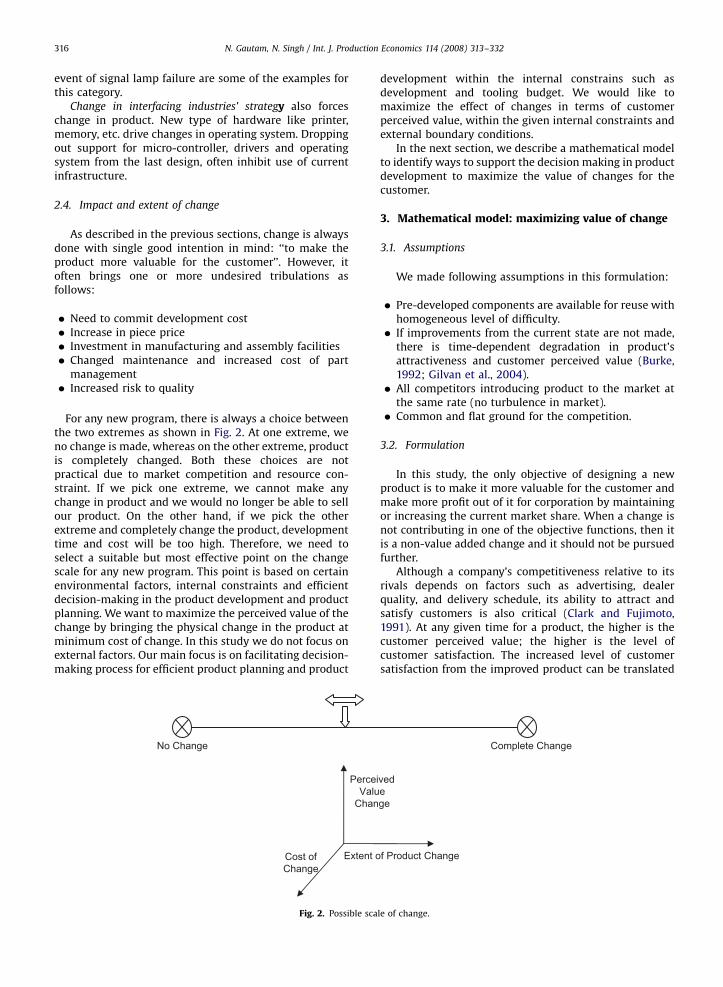
� Increased risk to qualityFor any new program, there is always a choice betweenthe two extremes as shown in Fig. 2. At one extreme, weno change is made, whereas on the other extreme, productis completely changed. Both these choices are notpractical due to market competition and resource con-straint. If we pick one extreme, we cannot make anychange in product and we would no longer be able to sellour product. On the other hand, if we pick the otherextreme and completely change the product, developmenttime and cost will be too high. Therefore, we need toselect a suitable but most effective point on the changescale for any new program. This point is based on certainenvironmental factors, internal constraints and efficientdecision-making in the product development and productplanning. We want to maximize the perceived value of thechange by bringing the physical change in the product atminimum cost of change. In this study we do not focus onexternal factors. Our main focus is on facilitating decision-making process for efficient product planning and product
PerceiValu
Chan
Extent oCost ofChange
No Change
Fig. 2. Possible sca
development within the internal constrains such asdevelopment and tooling budget. We would like tomaximize the effect of changes in terms of customerperceived value, within the given internal constraints andexternal boundary conditions.
In the next section, we describe a mathematical modelto identify ways to support the decision making in productdevelopment to maximize the value of changes for thecustomer.
3. Mathematical model: maximizing value of change
3.1. Assumptions
We made following assumptions in this formulation:
�
vedege
f P
le o
Pre-developed components are available for reuse withhomogeneous level of difficulty.
� If improvements from the current state are not made,there is time-dependent degradation in product’sattractiveness and customer perceived value (Burke,1992; Gilvan et al., 2004).
� All competitors introducing product to the market atthe same rate (no turbulence in market).
� Common and flat ground for the competition.3.2. Formulation
In this study, the only objective of designing a newproduct is to make it more valuable for the customer andmake more profit out of it for corporation by maintainingor increasing the current market share. When a change isnot contributing in one of the objective functions, then itis a non-value added change and it should not be pursuedfurther.
Although a company’s competitiveness relative to itsrivals depends on factors such as advertising, dealerquality, and delivery schedule, its ability to attract andsatisfy customers is also critical (Clark and Fujimoto,1991). At any given time for a product, the higher is thecustomer perceived value; the higher is the level ofcustomer satisfaction. The increased level of customersatisfaction from the improved product can be translated
roduct Change
Complete Change
f change.
ARTICLE IN PRESS
N. Gautam, N. Singh / Int. J. Production Economics 114 (2008) 313–332 317
into increased sells and profit by increasing the netpurchase value of the program. It can be furtheraccomplished with the following two factors:
�
Maximize the customer perceived value of the productdue to change. � Minimize the cost of change.Hence, we need to select the changes, which givemaximum perceived value to the customer but at theminimum cost.
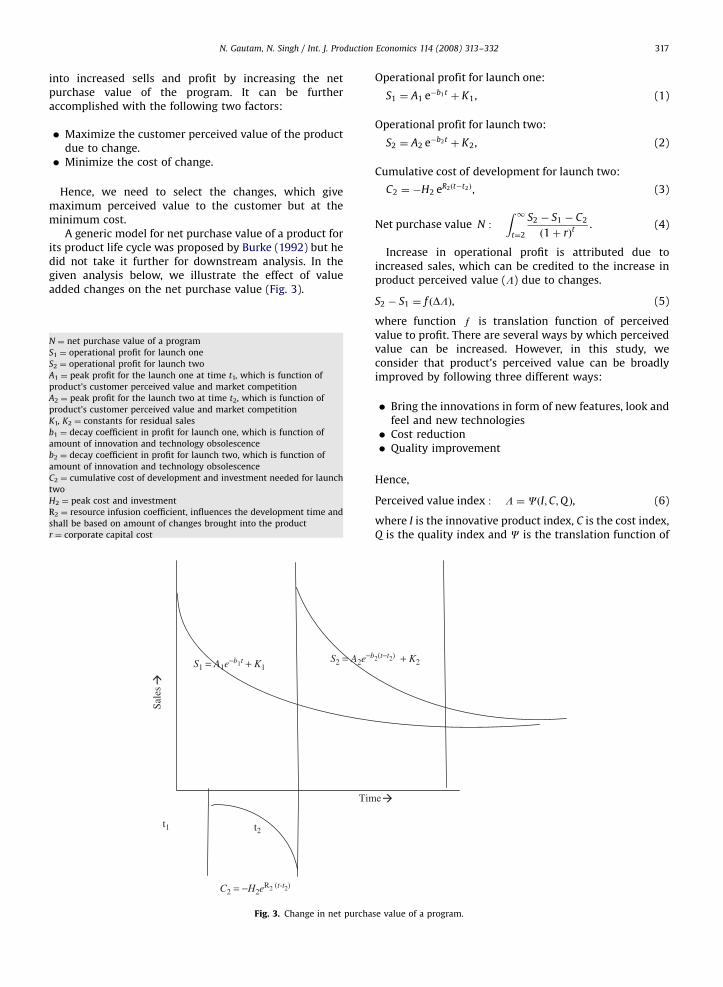
A generic model for net purchase value of a product forits product life cycle was proposed by Burke (1992) but hedid not take it further for downstream analysis. In thegiven analysis below, we illustrate the effect of valueadded changes on the net purchase value (Fig. 3).
N ¼ net purchase value of a program
S1 ¼ operational profit for launch one
S2 ¼ operational profit for launch two
A1 ¼ peak profit for the launch one at time t1, which is function of
product’s customer perceived value and market competition
A2 ¼ peak profit for the launch two at time t2, which is function of
product’s customer perceived value and market competition
K1, K2 ¼ constants for residual sales
b1 ¼ decay coefficient in profit for launch one, which is function of
amount of innovation and technology obsolescence
b2 ¼ decay coefficient in profit for launch two, which is function of
amount of innovation and technology obsolescence
C2 ¼ cumulative cost of development and investment needed for launch
two
H2 ¼ peak cost and investment
R2 ¼ resource infusion coefficient, influences the development time and
shall be based on amount of changes brought into the product
r ¼ corporate capital cost
S2 = A2e−bS1 = A1e−b1t + K1
C2 = −H2eR2 (t-t2)
Tim
Sale
s
t1 t2
Fig. 3. Change in net purcha
Operational profit for launch one:
S1 ¼ A1 e�b1t þ K1, (1)
Operational profit for launch two:
S2 ¼ A2 e�b2t þ K2, (2)
Cumulative cost of development for launch two:
C2 ¼ �H2 eR2ðt�t2Þ, (3)
Net purchase value N :
Z 1t¼2
S2 � S1 � C2
ð1þ rÞt. (4)
Increase in operational profit is attributed due toincreased sales, which can be credited to the increase inproduct perceived value (L) due to changes.
S2 � S1 ¼ f ðDLÞ, (5)
where function e is translation function of perceivedvalue to profit. There are several ways by which perceivedvalue can be increased. However, in this study, weconsider that product’s perceived value can be broadlyimproved by following three different ways:
�
2(t−t
e
se v
Bring the innovations in form of new features, look andfeel and new technologies
� Cost reduction � Quality improvementHence,
Perceived value index : L ¼ CðI;C;Q Þ, (6)
where I is the innovative product index, C is the cost index,Q is the quality index and C is the translation function of
2) + K2
alue of a program.

ARTICLE IN PRESS
RelativePerceived value
Perceived ValueIndex
MarketCompetition
Index
Time
Product InnovationIndex
Product CostIndex
Product QualityIndex
-New Features-Look and Feel-New Technology-Versatility
-Development Cost-Investment Cost-Per piece cost-Risk cost
-Reliability-Durability-Serviceability
Fig. 4. Relationship and dependencies of various indexes.
N. Gautam, N. Singh / Int. J. Production Economics 114 (2008) 313–332318
cost index to perceived value index. In Fig. 4, thecomposition of these indexes is shown.
As mentioned in assumption 2 that after launch, theperceived value of a product changes with time. Therefore,the product is most attractive at launch and as timeelapses, its perceived value goes down. At any time t afterlaunch, product perceived value could be defined as:
Lt ¼ L�at0 , (7)
where L0 is perceived value at launch, a is decay constantbased on product’s competitive position in market.
Since, we are in a market, where ground is flat for thecompetition, any new product from a competitor is goingto reduce our product’s perceived value. Therefore,product’s relative perceived value is based on its compe-titive position in the market. In current study, we assumethat competitors are launching their products at regularinterval in uniformly distributed time horizon. This resultsin a time-dependent decay in the product perceived value.
With the assumption that all the changes are per-suaded to bring in innovation to the vehicle or increase itsquality or to reduce the cost for the customer; increase inperceived value index can be expressed as:
Product perceived value change:Xn
1
PiLi þXn
1
Xn
1
PiPjLj
¼ CXn
1
PiIi þXn
1
Xn
1
PiPjIj
!(
þXn
1
PiCi þXn
1
Xn
1
PiPjCj
!
�Xn
1
PiQi þXn
1
Xn
1
PiPjQj
!), (8)
where Pi is binary for part change, and is one if ith partchanges and zero if it does not change. When ith part
changes, it contributes Li towards product perceivedvalue. When ith and jth parts are coupled together insuch a way that change in ith part forces a change in jthpart (PiPj ¼ 1), resulting Lj as change in perceived value ofpart ‘‘j’’ due to changed interface. These forced changes areassumed to be most often negative due to increased costand increased quality risk. For each change there is aseparate value for the customer. Let us assume that, theproduct is composed of n number of parts and each partcontributes in overall perceived value of the product.
In order to implement required changes to increaseperceived value, four major types (engineering, tooling,variable per piece cost and risk cost) of resources areconsidered.
Engineering cost of change depends on the complexityof the component and the level of change. Let us takethree levels of change and three levels of complexityderiving nine levels of cost of change, one being leastexpensive and nine being the most expensive change (fordetails please refer Appendix A).
Total engineering cost of the change ¼ cost of intendedchange+cost of forced change:
Engineering cost index of the change :
¼Xn
1
PiCEi þXn
1
Xn
1
PiPjCEj; (9)
Perceived value change per unit engineering cost :
¼
Pn1PiLi þ
Pn1
Pn1PiPjLijPn
1PiCEi þPn
1
Pn1PiPjCEj
, (10)
subjected to Pi and Pj ¼ 1 or 0 (integer, part has changed ornot).
The objective in this analysis is to maximize theperceived value within the limited cost.
Tooling cost of change depends on the complexity of thetooling and the level of change. As parts are changed,tooling investment is required in the production and
ARTICLE IN PRESS
N. Gautam, N. Singh / Int. J. Production Economics 114 (2008) 313–332 319
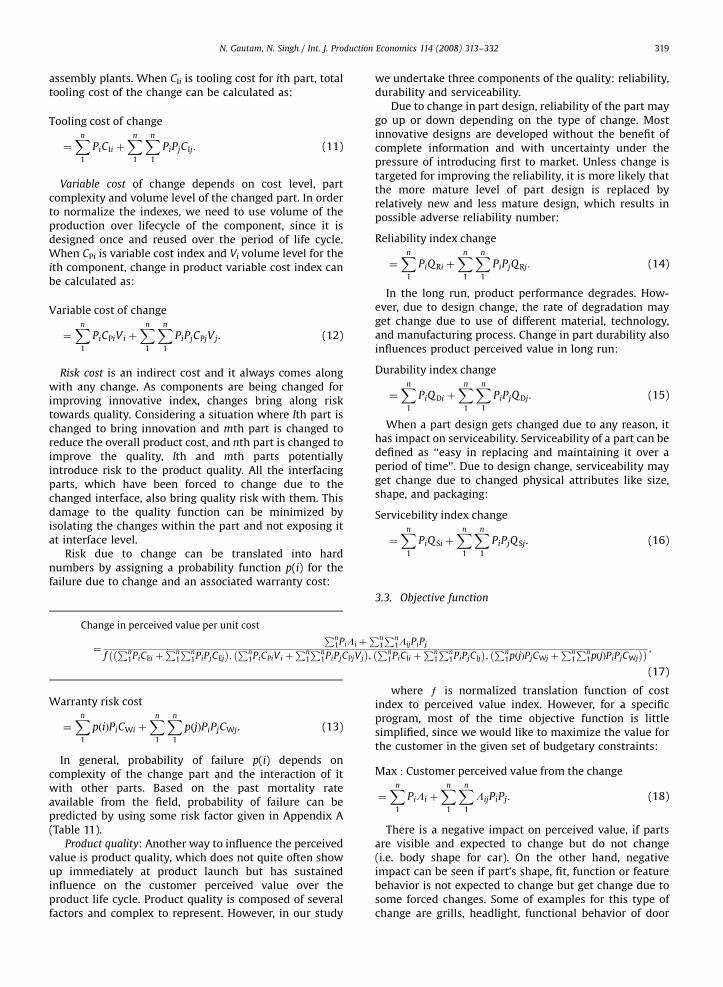
assembly plants. When CIi is tooling cost for ith part, totaltooling cost of the change can be calculated as:
Tooling cost of change
¼Xn
1
PiCIi þXn
1
Xn
1
PiPjCIj: (11)
Variable cost of change depends on cost level, partcomplexity and volume level of the changed part. In orderto normalize the indexes, we need to use volume of theproduction over lifecycle of the component, since it isdesigned once and reused over the period of life cycle.When CPi is variable cost index and Vi volume level for theith component, change in product variable cost index canbe calculated as:
Variable cost of change
¼Xn
1
PiCPiV i þXn
1
Xn
1
PiPjCPjV j. (12)
Risk cost is an indirect cost and it always comes alongwith any change. As components are being changed forimproving innovative index, changes bring along risktowards quality. Considering a situation where lth part ischanged to bring innovation and mth part is changed toreduce the overall product cost, and nth part is changed toimprove the quality, lth and mth parts potentiallyintroduce risk to the product quality. All the interfacingparts, which have been forced to change due to thechanged interface, also bring quality risk with them. Thisdamage to the quality function can be minimized byisolating the changes within the part and not exposing itat interface level.
Risk due to change can be translated into hardnumbers by assigning a probability function p(i) for thefailure due to change and an associated warranty cost:
Change in perceived value per unit cost
¼
Pn1PiLi þ
Pn1
Pn1LijPiPj
fPn
1PiCEi þPn
1
Pn1PiPjCEj
� �;Pn
1PiCPiV i þPn
1
Pn1PiPjCPjVj
� �;Pn
1PiCIi þPn
1
Pn1PiPjCIj
� �;Pn
1pðjÞPjCWj þPn
1
Pn1pðjÞPiPjCWj
� �� � ,
(17)
Warranty risk cost
¼Xn
1
pðiÞPiCWi þXn
1
Xn
1
pðjÞPiPjCWj. (13)
In general, probability of failure p(i) depends oncomplexity of the change part and the interaction of itwith other parts. Based on the past mortality rateavailable from the field, probability of failure can bepredicted by using some risk factor given in Appendix A(Table 11).
Product quality: Another way to influence the perceivedvalue is product quality, which does not quite often showup immediately at product launch but has sustainedinfluence on the customer perceived value over theproduct life cycle. Product quality is composed of severalfactors and complex to represent. However, in our study
we undertake three components of the quality: reliability,durability and serviceability.
Due to change in part design, reliability of the part maygo up or down depending on the type of change. Mostinnovative designs are developed without the benefit ofcomplete information and with uncertainty under thepressure of introducing first to market. Unless change istargeted for improving the reliability, it is more likely thatthe more mature level of part design is replaced byrelatively new and less mature design, which results inpossible adverse reliability number:
Reliability index change
¼Xn
1
PiQRi þXn
1
Xn
1
PiPjQRj: (14)
In the long run, product performance degrades. How-ever, due to design change, the rate of degradation mayget change due to use of different material, technology,and manufacturing process. Change in part durability alsoinfluences product perceived value in long run:
Durability index change
¼Xn
1
PiQDi þXn
1
Xn
1
PiPjQDj: (15)
When a part design gets changed due to any reason, ithas impact on serviceability. Serviceability of a part can bedefined as ‘‘easy in replacing and maintaining it over aperiod of time’’. Due to design change, serviceability mayget change due to changed physical attributes like size,shape, and packaging:
Servicebility index change
¼Xn
1
PiQSi þXn
1
Xn
1
PiPjQSj. (16)
3.3. Objective function
where e is normalized translation function of costindex to perceived value index. However, for a specificprogram, most of the time objective function is littlesimplified, since we would like to maximize the value forthe customer in the given set of budgetary constraints:
Max : Customer perceived value from the change
¼Xn
1
PiLi þXn
1
Xn
1
LijPiPj. (18)
There is a negative impact on perceived value, if partsare visible and expected to change but do not change(i.e. body shape for car). On the other hand, negativeimpact can be seen if part’s shape, fit, function or featurebehavior is not expected to change but get change due tosome forced changes. Some of examples for this type ofchange are grills, headlight, functional behavior of door
ARTICLE IN PRESS
N. Gautam, N. Singh / Int. J. Production Economics 114 (2008) 313–332320
lock, etc., where customers have strong perception andstable expectation from a brand. Similarly, for some parts,functionality and reliability is the most important andlook or feel does not have much influence on customer(i.e. battery).
There is also penalty associated if parts are notchanged in time and left behind in technology. Mostoften, it is more expensive and time-consuming tomaintain the old technology than upgrading. Also to catchup with the technology and upgrade as a tail ender ismore difficult and expensive and frequently reflected asmore expensive development cost for wider developmentcycles.
3.4. Constraints
Any new product development program has sometargets and budgetary constraints. These constraints aregiven to product team by top management at thebeginning of the program. Following major cost-basedconstraints are considered in this analysis:
Engineering cost:Xn
1
PiCEi þXn
1
Xn
1
PiPjCEjpEngineering budget; (19)
Tooling cost:Xn
1
PiCIi þXn
1
Xn
1
PiPjCIjpTooling budget; (20)
Variable cost:Xn
1
PiCPiV i þXn
1
Xn
1
PiPjCPjVjpVariable target cost; (21)
Risk cost:Xn
1
pðiÞPiCWi þPn1
Pn1
pðjÞPiPjCWjpRisk target cost:
When ith and jth parts are coupled together in such a waythat change in ith part forces a change in jth part(PiPj ¼ 1):
Interfacing component forced change:
if PiX1 then Pj ¼ 1 else Pjp1, (23)
Pi subjected to 0 if ith part does not change and 1 if itchanges.
Binary constraint : Pi ¼ 0 or 1. (24)
3.5. Decisions variables
Pj ¼1 if ith component is selected for change in the solution
0 if ith component is not selected for change in the solution
(
(25)
Since parts are just physical medium of realizing aspecific customer desire, change in a single part is not goodfor anything. In order to make a change effective and visibleto the customer, often a set of parts need to change for
conveying a meaningful change to the end user. Therefore,we select the features and functions experienced by theend user as atomic unit of change for this study.
Let us take {R1, R2, y, Rm} are possible customer needswith different customer ratings and carry {L1, L2, y, Lm}customer perceived value, respectively. However, in orderto implement Rj, we need to make change in {P1j, P2j, y,Pnj} set of parts. This form of participation introducesadditional set of decision variables and constraints. Here ‘i’is part index and ‘j’ is feature index.
Rj ¼1 if jth feature is considered in solution
0 if jth feature is not considered in solution
(
(26)
Pij ¼1 if ith part participates in jth feature
0 if ith part does not participate in jth feature
(
(27)
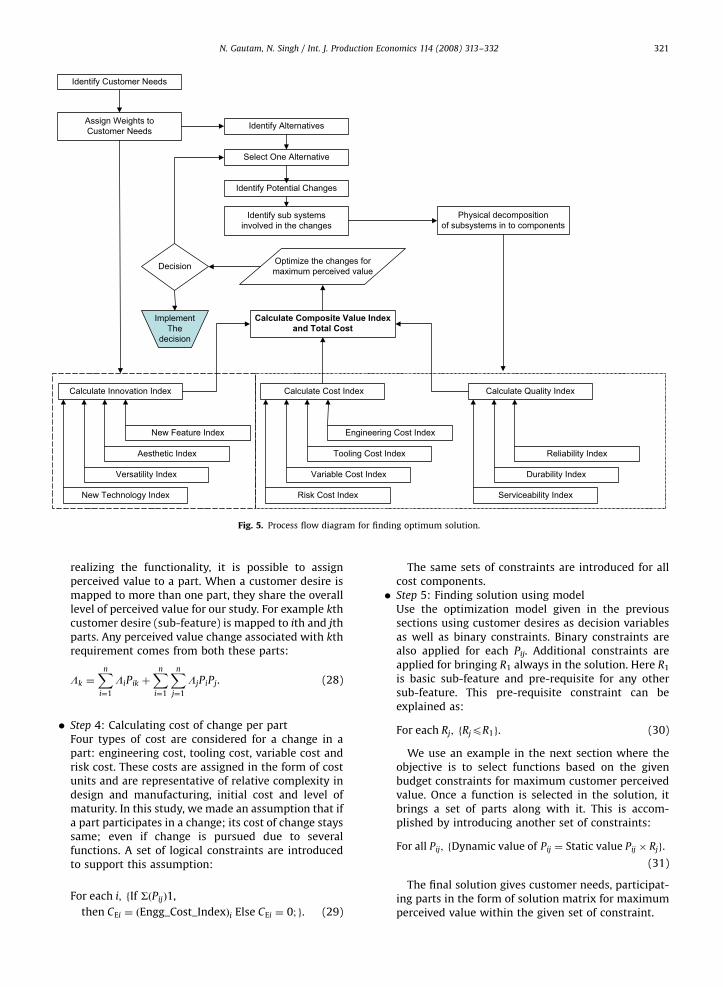
4. Methodology for selection
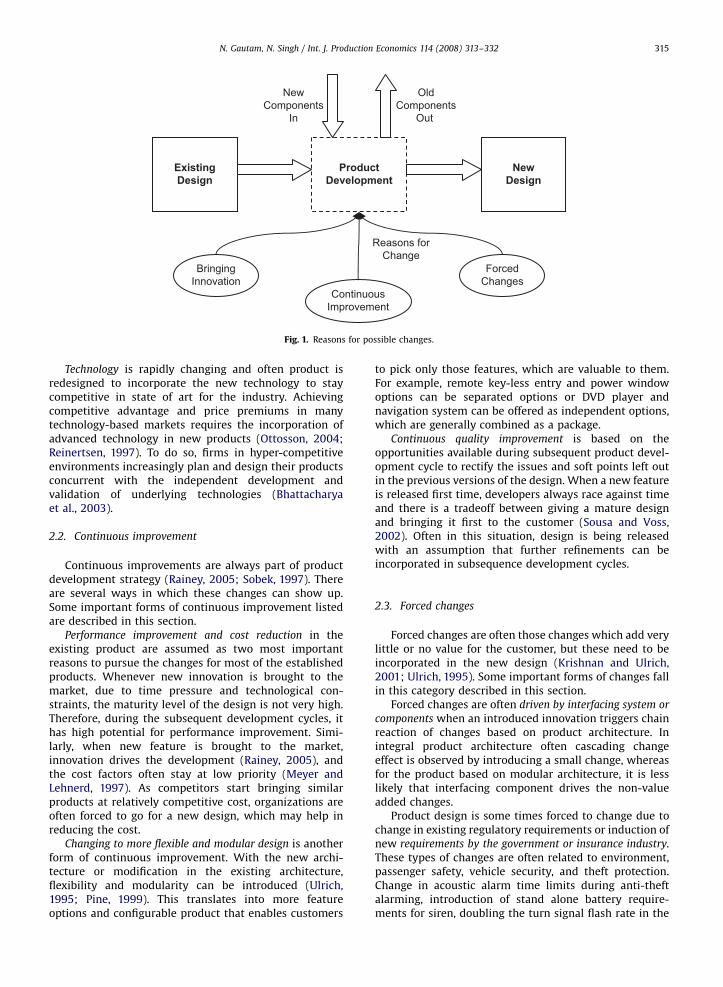
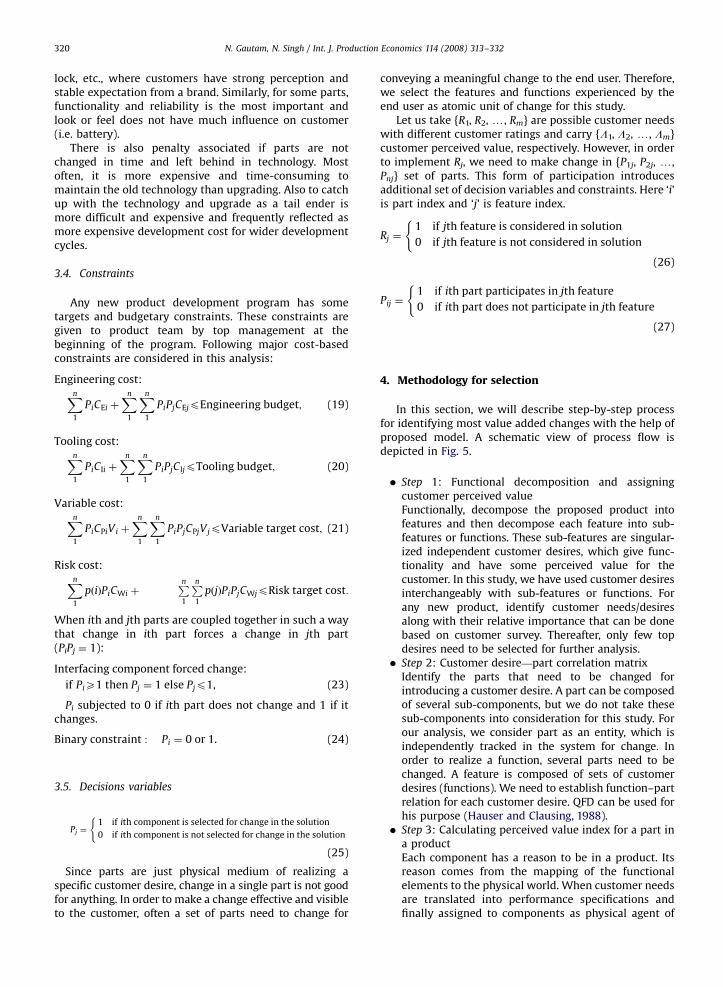
In this section, we will describe step-by-step processfor identifying most value added changes with the help ofproposed model. A schematic view of process flow isdepicted in Fig. 5.
�
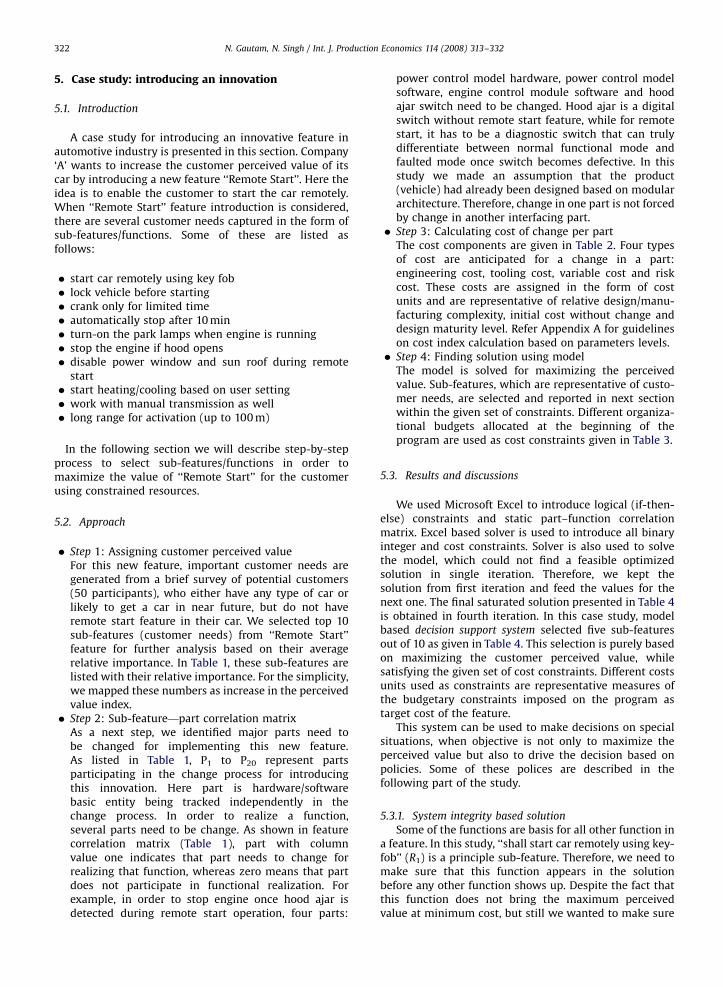
Step 1: Functional decomposition and assigningcustomer perceived valueFunctionally, decompose the proposed product intofeatures and then decompose each feature into sub-features or functions. These sub-features are singular-ized independent customer desires, which give func-tionality and have some perceived value for thecustomer. In this study, we have used customer desiresinterchangeably with sub-features or functions. Forany new product, identify customer needs/desiresalong with their relative importance that can be donebased on customer survey. Thereafter, only few topdesires need to be selected for further analysis. � Step 2: Customer desire—part correlation matrixIdentify the parts that need to be changed forintroducing a customer desire. A part can be composedof several sub-components, but we do not take thesesub-components into consideration for this study. Forour analysis, we consider part as an entity, which isindependently tracked in the system for change. Inorder to realize a function, several parts need to bechanged. A feature is composed of sets of customerdesires (functions). We need to establish function–partrelation for each customer desire. QFD can be used forhis purpose (Hauser and Clausing, 1988).
� Step 3: Calculating perceived value index for a part ina productEach component has a reason to be in a product. Itsreason comes from the mapping of the functionalelements to the physical world. When customer needsare translated into performance specifications andfinally assigned to components as physical agent of
ARTICLE IN PRESS
Select One Alternative
Physical decompositionof subsystems in to components
Calculate Innovation Index
New Feature Index
Aesthetic Index
Versatility Index
New Technology Index
Calculate Cost Index
Engineering Cost Index
Tooling Cost Index
Variable Cost Index
Risk Cost Index
Calculate Quality Index
Reliability Index
Durability Index
Serviceability Index
Calculate Composite Value Indexand Total Cost
Identify sub systemsinvolved in the changes
Identify Customer Needs
Assign Weights toCustomer Needs Identify Alternatives
Optimize the changes formaximum perceived valueDecision
Identify Potential Changes
ImplementThe
decision
Fig. 5. Process flow diagram for finding optimum solution.
N. Gautam, N. Singh / Int. J. Production Economics 114 (2008) 313–332 321
realizing the functionality, it is possible to assignperceived value to a part. When a customer desire ismapped to more than one part, they share the overalllevel of perceived value for our study. For example kthcustomer desire (sub-feature) is mapped to ith and jthparts. Any perceived value change associated with kthrequirement comes from both these parts:
Lk ¼Xn
i¼1
LiPik þXn
i¼1
Xn
j¼1
LjPiPj. (28)
�
Step 4: Calculating cost of change per partFour types of cost are considered for a change in apart: engineering cost, tooling cost, variable cost andrisk cost. These costs are assigned in the form of costunits and are representative of relative complexity indesign and manufacturing, initial cost and level ofmaturity. In this study, we made an assumption that ifa part participates in a change; its cost of change stayssame; even if change is pursued due to severalfunctions. A set of logical constraints are introducedto support this assumption:For each i; fIf SðPijÞ1,
then CEi ¼ ðEngg_Cost_IndexÞi Else CEi ¼ 0; g. (29)
The same sets of constraints are introduced for allcost components.
� Step 5: Finding solution using modelUse the optimization model given in the previoussections using customer desires as decision variablesas well as binary constraints. Binary constraints arealso applied for each Pij. Additional constraints areapplied for bringing R1 always in the solution. Here R1
is basic sub-feature and pre-requisite for any othersub-feature. This pre-requisite constraint can beexplained as:
For each Rj; fRjpR1g. (30)
We use an example in the next section where theobjective is to select functions based on the givenbudget constraints for maximum customer perceivedvalue. Once a function is selected in the solution, itbrings a set of parts along with it. This is accom-plished by introducing another set of constraints:
For all Pij; fDynamic value of Pij ¼ Static value Pij � Rjg.
(31)
The final solution gives customer needs, participat-ing parts in the form of solution matrix for maximumperceived value within the given set of constraint.
ARTICLE IN PRESS
N. Gautam, N. Singh / Int. J. Production Economics 114 (2008) 313–332322
5. Case study: introducing an innovation
5.1. Introduction
A case study for introducing an innovative feature inautomotive industry is presented in this section. Company‘A’ wants to increase the customer perceived value of itscar by introducing a new feature ‘‘Remote Start’’. Here theidea is to enable the customer to start the car remotely.When ‘‘Remote Start’’ feature introduction is considered,there are several customer needs captured in the form ofsub-features/functions. Some of these are listed asfollows:
�
start car remotely using key fob � lock vehicle before starting � crank only for limited time � automatically stop after 10 min � turn-on the park lamps when engine is running � stop the engine if hood opens � disable power window and sun roof during remotestart
� start heating/cooling based on user setting � work with manual transmission as well � long range for activation (up to 100 m)In the following section we will describe step-by-stepprocess to select sub-features/functions in order tomaximize the value of ‘‘Remote Start’’ for the customerusing constrained resources.
5.2. Approach
�
Step 1: Assigning customer perceived valueFor this new feature, important customer needs aregenerated from a brief survey of potential customers(50 participants), who either have any type of car orlikely to get a car in near future, but do not haveremote start feature in their car. We selected top 10sub-features (customer needs) from ‘‘Remote Start’’feature for further analysis based on their averagerelative importance. In Table 1, these sub-features arelisted with their relative importance. For the simplicity,we mapped these numbers as increase in the perceivedvalue index. � Step 2: Sub-feature—part correlation matrixAs a next step, we identified major parts need tobe changed for implementing this new feature.As listed in Table 1, P1 to P20 represent partsparticipating in the change process for introducingthis innovation. Here part is hardware/softwarebasic entity being tracked independently in thechange process. In order to realize a function,several parts need to be change. As shown in featurecorrelation matrix (Table 1), part with columnvalue one indicates that part needs to change forrealizing that function, whereas zero means that partdoes not participate in functional realization. Forexample, in order to stop engine once hood ajar isdetected during remote start operation, four parts:
power control model hardware, power control modelsoftware, engine control module software and hoodajar switch need to be changed. Hood ajar is a digitalswitch without remote start feature, while for remotestart, it has to be a diagnostic switch that can trulydifferentiate between normal functional mode andfaulted mode once switch becomes defective. In thisstudy we made an assumption that the product(vehicle) had already been designed based on modulararchitecture. Therefore, change in one part is not forcedby change in another interfacing part.
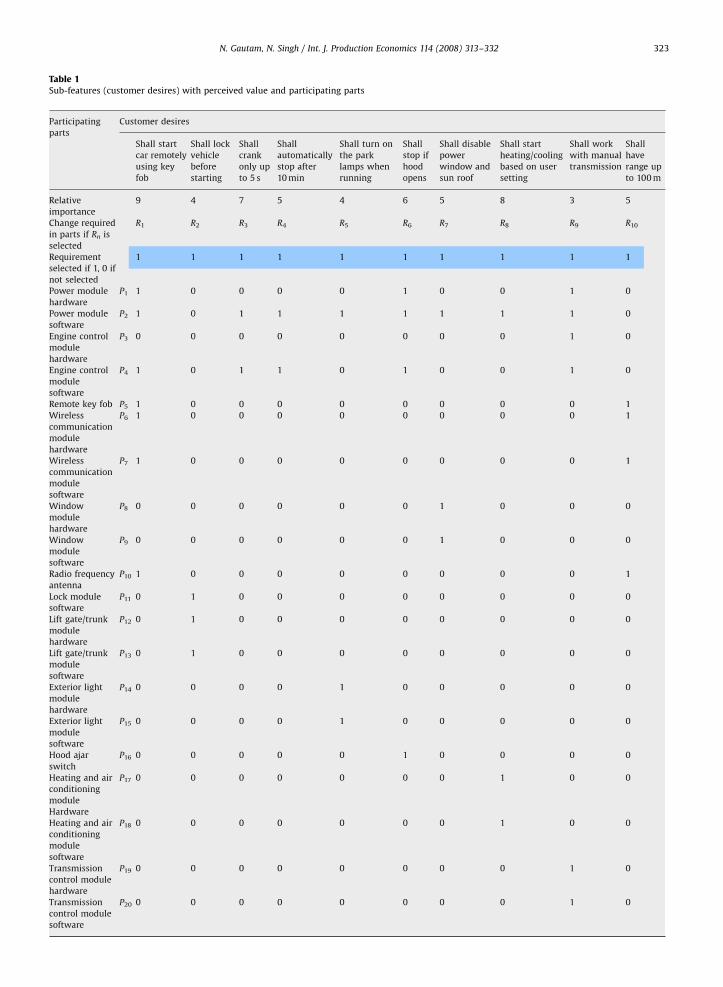
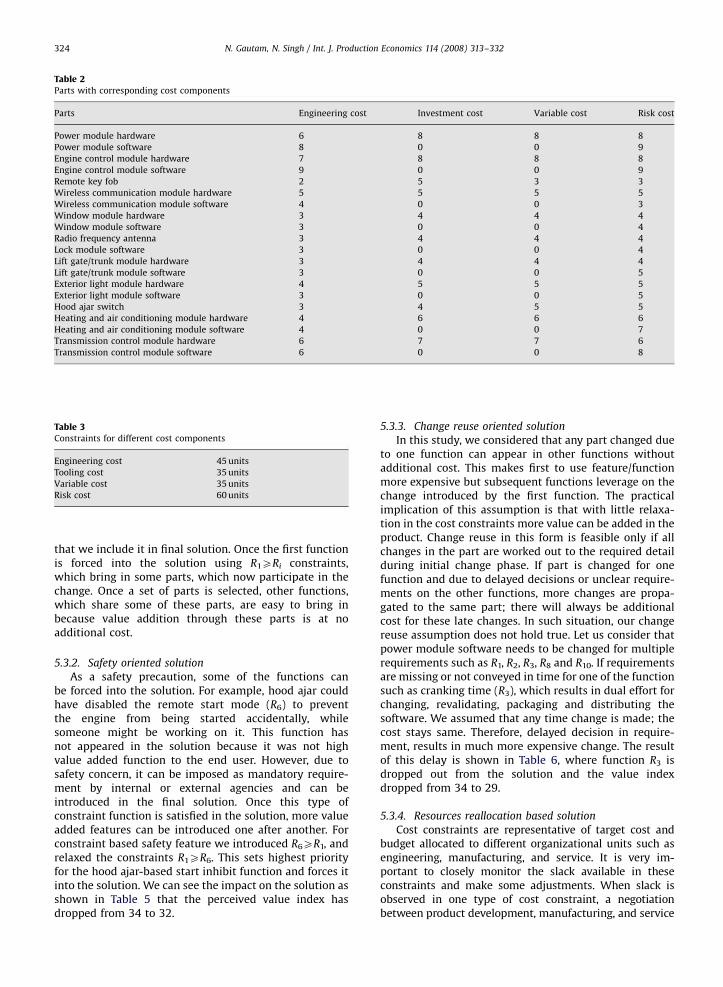
� Step 3: Calculating cost of change per partThe cost components are given in Table 2. Four typesof cost are anticipated for a change in a part:engineering cost, tooling cost, variable cost and riskcost. These costs are assigned in the form of costunits and are representative of relative design/manu-facturing complexity, initial cost without change anddesign maturity level. Refer Appendix A for guidelineson cost index calculation based on parameters levels.
� Step 4: Finding solution using modelThe model is solved for maximizing the perceivedvalue. Sub-features, which are representative of custo-mer needs, are selected and reported in next sectionwithin the given set of constraints. Different organiza-tional budgets allocated at the beginning of theprogram are used as cost constraints given in Table 3.
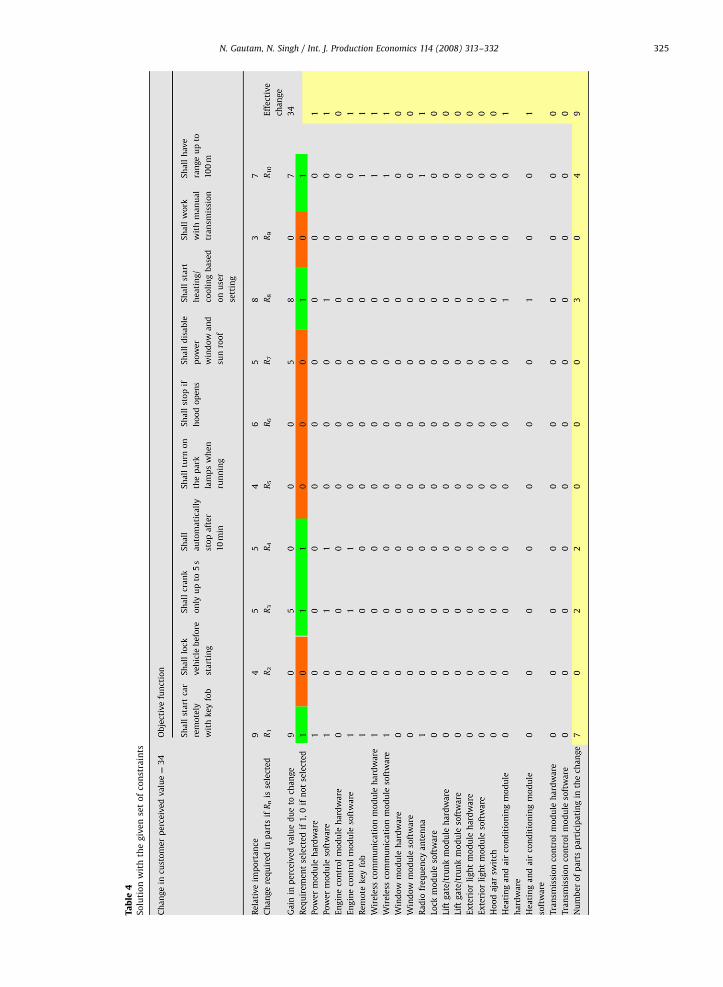
5.3. Results and discussions
We used Microsoft Excel to introduce logical (if-then-else) constraints and static part–function correlationmatrix. Excel based solver is used to introduce all binaryinteger and cost constraints. Solver is also used to solvethe model, which could not find a feasible optimizedsolution in single iteration. Therefore, we kept thesolution from first iteration and feed the values for thenext one. The final saturated solution presented in Table 4is obtained in fourth iteration. In this case study, modelbased decision support system selected five sub-featuresout of 10 as given in Table 4. This selection is purely basedon maximizing the customer perceived value, whilesatisfying the given set of cost constraints. Different costsunits used as constraints are representative measures ofthe budgetary constraints imposed on the program astarget cost of the feature.
This system can be used to make decisions on specialsituations, when objective is not only to maximize theperceived value but also to drive the decision based onpolicies. Some of these polices are described in thefollowing part of the study.
5.3.1. System integrity based solution
Some of the functions are basis for all other function ina feature. In this study, ‘‘shall start car remotely using key-fob’’ (R1) is a principle sub-feature. Therefore, we need tomake sure that this function appears in the solutionbefore any other function shows up. Despite the fact thatthis function does not bring the maximum perceivedvalue at minimum cost, but still we wanted to make sure
ARTICLE IN PRESS
Table 1Sub-features (customer desires) with perceived value and participating parts
N. Gautam, N. Singh / Int. J. Production Economics 114 (2008) 313–332 323
ARTICLE IN PRESS
Table 2Parts with corresponding cost components
Parts Engineering cost Investment cost Variable cost Risk cost
Power module hardware 6 8 8 8
Power module software 8 0 0 9
Engine control module hardware 7 8 8 8
Engine control module software 9 0 0 9
Remote key fob 2 5 3 3
Wireless communication module hardware 5 5 5 5
Wireless communication module software 4 0 0 3
Window module hardware 3 4 4 4
Window module software 3 0 0 4
Radio frequency antenna 3 4 4 4
Lock module software 3 0 0 4
Lift gate/trunk module hardware 3 4 4 4
Lift gate/trunk module software 3 0 0 5
Exterior light module hardware 4 5 5 5
Exterior light module software 3 0 0 5
Hood ajar switch 3 4 5 5
Heating and air conditioning module hardware 4 6 6 6
Heating and air conditioning module software 4 0 0 7
Transmission control module hardware 6 7 7 6
Transmission control module software 6 0 0 8
Table 3Constraints for different cost components
Engineering cost 45 units
Tooling cost 35 units
Variable cost 35 units
Risk cost 60 units
N. Gautam, N. Singh / Int. J. Production Economics 114 (2008) 313–332324
that we include it in final solution. Once the first functionis forced into the solution using R1XRi constraints,which bring in some parts, which now participate in thechange. Once a set of parts is selected, other functions,which share some of these parts, are easy to bring inbecause value addition through these parts is at noadditional cost.
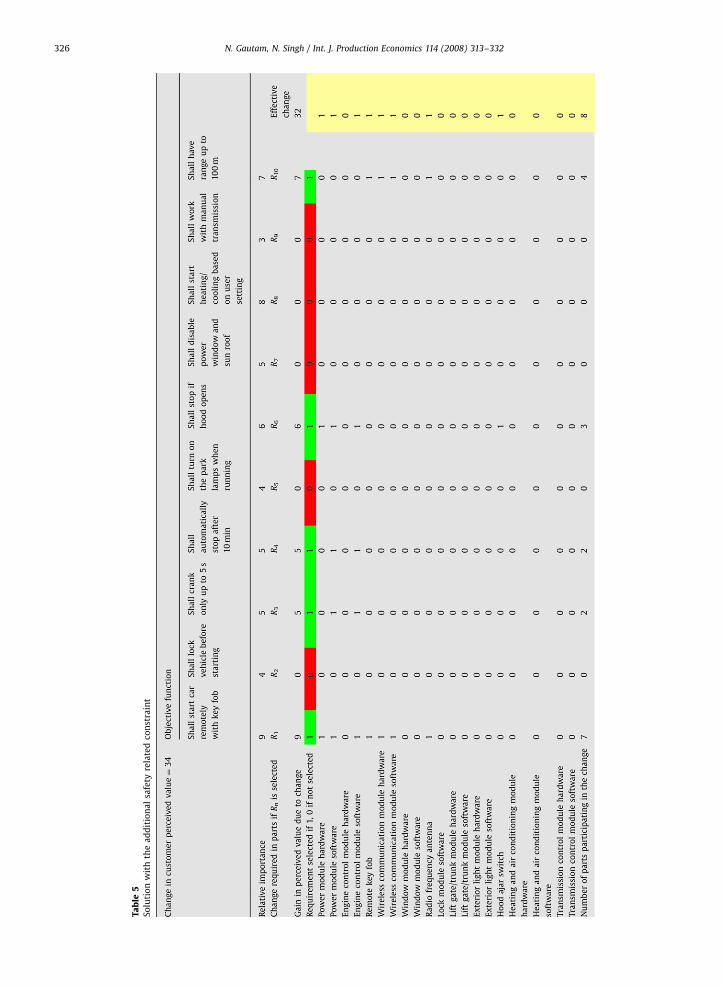
5.3.2. Safety oriented solution
As a safety precaution, some of the functions canbe forced into the solution. For example, hood ajar couldhave disabled the remote start mode (R6) to preventthe engine from being started accidentally, whilesomeone might be working on it. This function hasnot appeared in the solution because it was not highvalue added function to the end user. However, due tosafety concern, it can be imposed as mandatory require-ment by internal or external agencies and can beintroduced in the final solution. Once this type ofconstraint function is satisfied in the solution, more valueadded features can be introduced one after another. Forconstraint based safety feature we introduced R6XR1, andrelaxed the constraints R1XR6. This sets highest priorityfor the hood ajar-based start inhibit function and forces itinto the solution. We can see the impact on the solution asshown in Table 5 that the perceived value index hasdropped from 34 to 32.
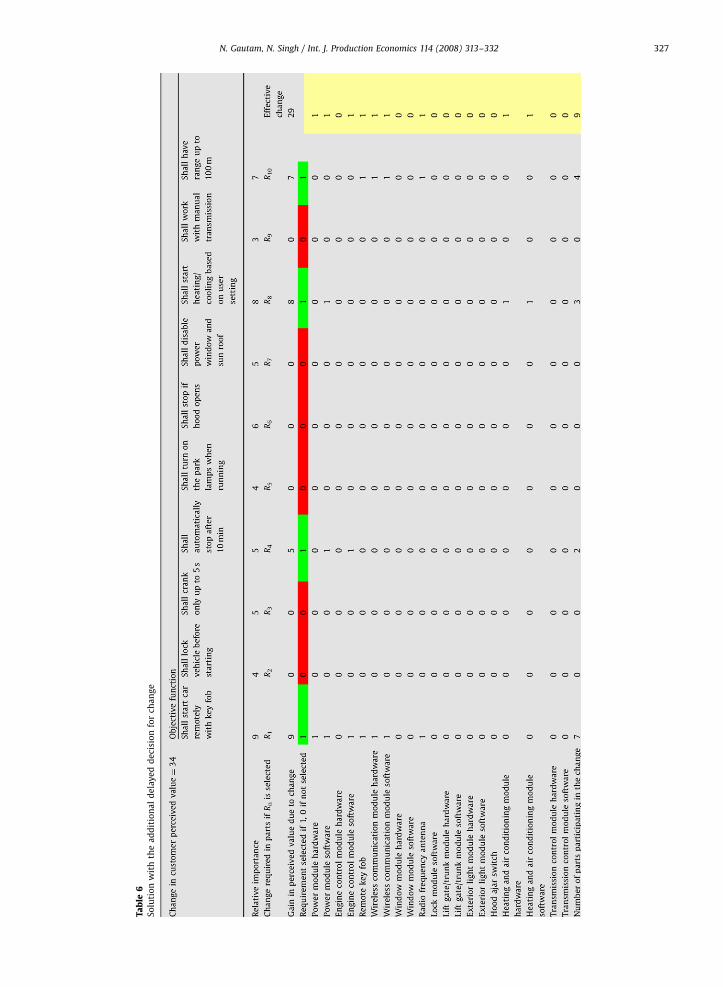
5.3.3. Change reuse oriented solution
In this study, we considered that any part changed dueto one function can appear in other functions withoutadditional cost. This makes first to use feature/functionmore expensive but subsequent functions leverage on thechange introduced by the first function. The practicalimplication of this assumption is that with little relaxa-tion in the cost constraints more value can be added in theproduct. Change reuse in this form is feasible only if allchanges in the part are worked out to the required detailduring initial change phase. If part is changed for onefunction and due to delayed decisions or unclear require-ments on the other functions, more changes are propa-gated to the same part; there will always be additionalcost for these late changes. In such situation, our changereuse assumption does not hold true. Let us consider thatpower module software needs to be changed for multiplerequirements such as R1, R2, R3, R8 and R10. If requirementsare missing or not conveyed in time for one of the functionsuch as cranking time (R3), which results in dual effort forchanging, revalidating, packaging and distributing thesoftware. We assumed that any time change is made; thecost stays same. Therefore, delayed decision in require-ment, results in much more expensive change. The resultof this delay is shown in Table 6, where function R3 isdropped out from the solution and the value indexdropped from 34 to 29.
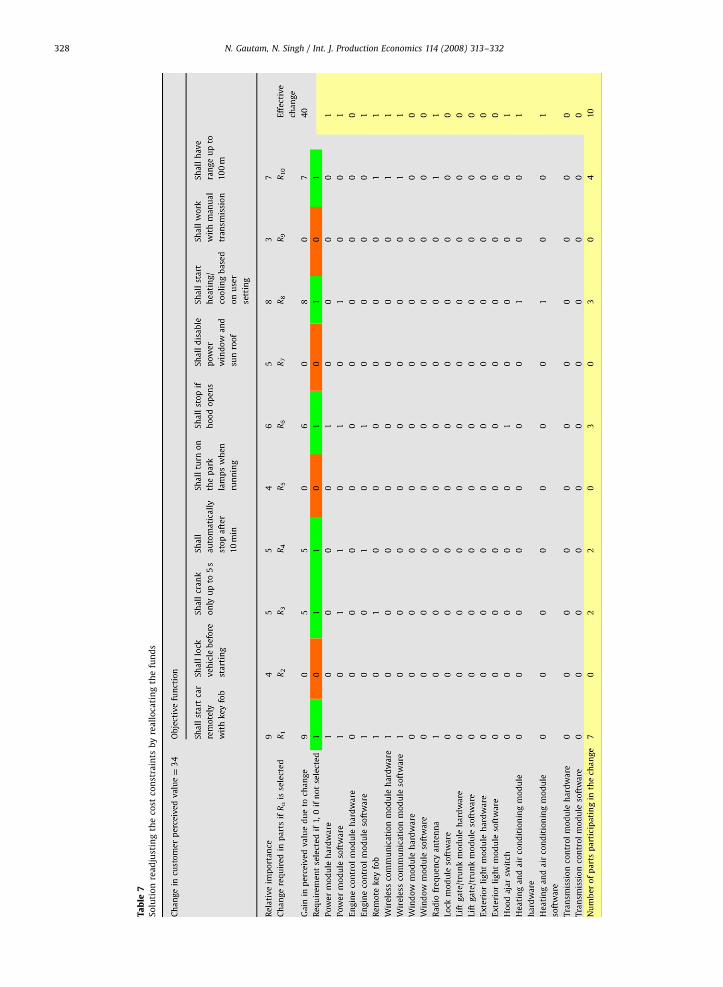
5.3.4. Resources reallocation based solution
Cost constraints are representative of target cost andbudget allocated to different organizational units such asengineering, manufacturing, and service. It is very im-portant to closely monitor the slack available in theseconstraints and make some adjustments. When slack isobserved in one type of cost constraint, a negotiationbetween product development, manufacturing, and service
ARTICLE IN PRESS
Ta
ble
4S
olu
tio
nw
ith
the
giv
en
set
of
con
stra
ints
N. Gautam, N. Singh / Int. J. Production Economics 114 (2008) 313–332 325
ARTICLE IN PRESS
Ta
ble
5S
olu
tio
nw
ith
the
ad
dit
ion
al
safe
tyre
late
dco
nst
rain
t
N. Gautam, N. Singh / Int. J. Production Economics 114 (2008) 313–332326
ARTICLE IN PRESS
Ta
ble
6S
olu
tio
nw
ith
the
ad
dit
ion
al
de
lay
ed
de
cisi
on
for
cha
ng
e
N. Gautam, N. Singh / Int. J. Production Economics 114 (2008) 313–332 327
ARTICLE IN PRESS
Ta
ble
7S
olu
tio
nre
ad
just
ing
the
cost
con
stra
ints
by
rea
llo
cati
ng
the
fun
ds
N. Gautam, N. Singh / Int. J. Production Economics 114 (2008) 313–332328
ARTICLE IN PRESS
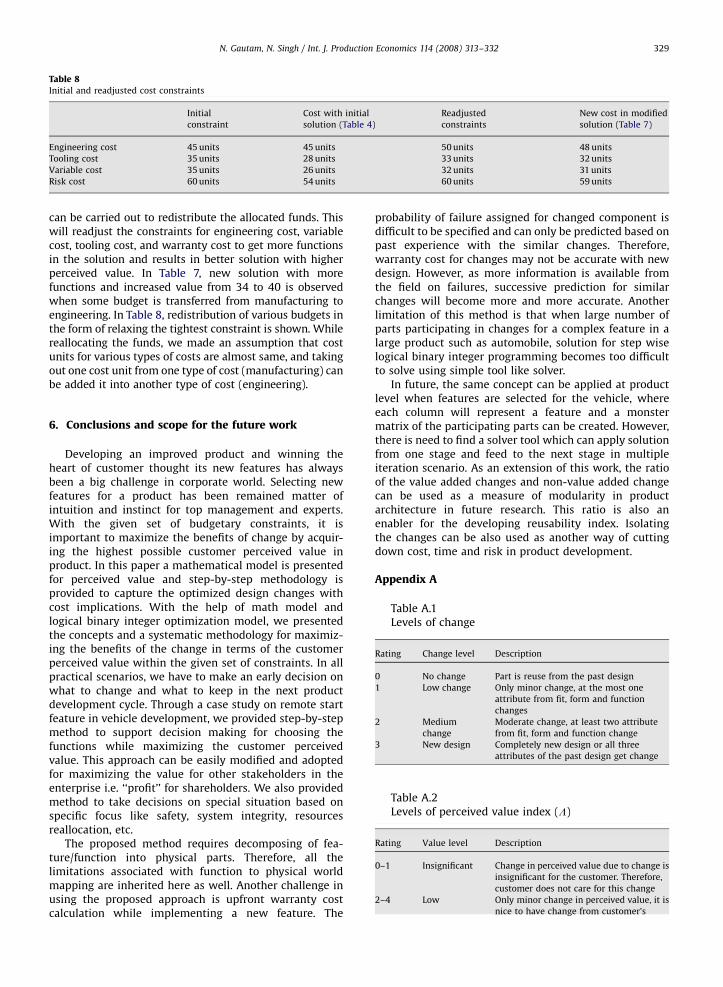
Table 8Initial and readjusted cost constraints
Initial
constraint
Cost with initial
solution (Table 4)
Readjusted
constraints
New cost in modified
solution (Table 7)
Engineering cost 45 units 45 units 50 units 48 units
Tooling cost 35 units 28 units 33 units 32 units
Variable cost 35 units 26 units 32 units 31 units
Risk cost 60 units 54 units 60 units 59 units
N. Gautam, N. Singh / Int. J. Production Economics 114 (2008) 313–332 329
can be carried out to redistribute the allocated funds. Thiswill readjust the constraints for engineering cost, variablecost, tooling cost, and warranty cost to get more functionsin the solution and results in better solution with higherperceived value. In Table 7, new solution with morefunctions and increased value from 34 to 40 is observedwhen some budget is transferred from manufacturing toengineering. In Table 8, redistribution of various budgets inthe form of relaxing the tightest constraint is shown. Whilereallocating the funds, we made an assumption that costunits for various types of costs are almost same, and takingout one cost unit from one type of cost (manufacturing) canbe added it into another type of cost (engineering).
6. Conclusions and scope for the future work
Developing an improved product and winning theheart of customer thought its new features has alwaysbeen a big challenge in corporate world. Selecting newfeatures for a product has been remained matter ofintuition and instinct for top management and experts.With the given set of budgetary constraints, it isimportant to maximize the benefits of change by acquir-ing the highest possible customer perceived value inproduct. In this paper a mathematical model is presentedfor perceived value and step-by-step methodology isprovided to capture the optimized design changes withcost implications. With the help of math model andlogical binary integer optimization model, we presentedthe concepts and a systematic methodology for maximiz-ing the benefits of the change in terms of the customerperceived value within the given set of constraints. In allpractical scenarios, we have to make an early decision onwhat to change and what to keep in the next productdevelopment cycle. Through a case study on remote startfeature in vehicle development, we provided step-by-stepmethod to support decision making for choosing thefunctions while maximizing the customer perceivedvalue. This approach can be easily modified and adoptedfor maximizing the value for other stakeholders in theenterprise i.e. ‘‘profit’’ for shareholders. We also providedmethod to take decisions on special situation based onspecific focus like safety, system integrity, resourcesreallocation, etc.
The proposed method requires decomposing of fea-ture/function into physical parts. Therefore, all thelimitations associated with function to physical worldmapping are inherited here as well. Another challenge inusing the proposed approach is upfront warranty costcalculation while implementing a new feature. The
probability of failure assigned for changed component isdifficult to be specified and can only be predicted based onpast experience with the similar changes. Therefore,warranty cost for changes may not be accurate with newdesign. However, as more information is available fromthe field on failures, successive prediction for similarchanges will become more and more accurate. Anotherlimitation of this method is that when large number ofparts participating in changes for a complex feature in alarge product such as automobile, solution for step wiselogical binary integer programming becomes too difficultto solve using simple tool like solver.
In future, the same concept can be applied at productlevel when features are selected for the vehicle, whereeach column will represent a feature and a monstermatrix of the participating parts can be created. However,there is need to find a solver tool which can apply solutionfrom one stage and feed to the next stage in multipleiteration scenario. As an extension of this work, the ratioof the value added changes and non-value added changecan be used as a measure of modularity in productarchitecture in future research. This ratio is also anenabler for the developing reusability index. Isolatingthe changes can be also used as another way of cuttingdown cost, time and risk in product development.
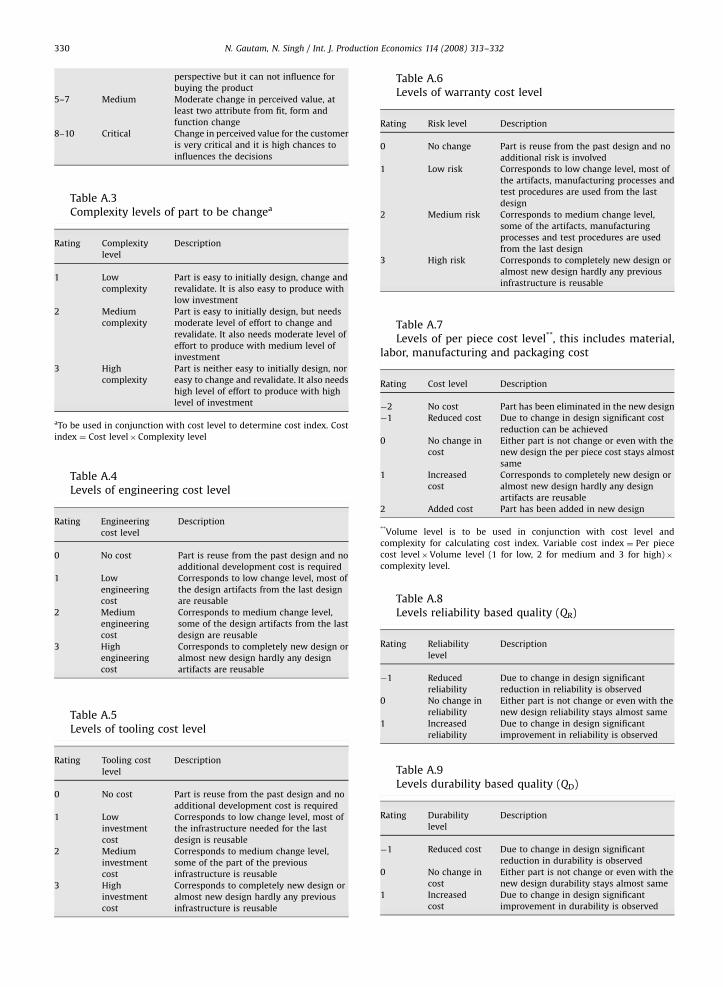
Appendix A
Table A.1Levels of change
Rating
Change level Description0
No change Part is reuse from the past design1
Low change Only minor change, at the most oneattribute from fit, form and function
changes
2
Mediumchange
Moderate change, at least two attribute
from fit, form and function change
3
New design Completely new design or all threeattributes of the past design get change
Table A.2Levels of perceived value index (L)
Rating
Value level Description0–1
Insignificant Change in perceived value due to change isinsignificant for the customer. Therefore,
customer does not care for this change
2–4
Low Only minor change in perceived value, it isnice to have change from customer’s
ARTICLE IN PRESS
N. Gautam, N. Singh / Int. J. Production330
perspective but it can not influence for
buying the product
5–7
Medium Moderate change in perceived value, atleast two attribute from fit, form and
function change
8–10
Critical Change in perceived value for the customeris very critical and it is high chances to
influences the decisions
Table A.3Complexity levels of part to be changea
Rating
Complexitylevel
Description
1
Lowcomplexity
Part is easy to initially design, change and
revalidate. It is also easy to produce with
low investment
2
Mediumcomplexity
Part is easy to initially design, but needs
moderate level of effort to change and
revalidate. It also needs moderate level of
effort to produce with medium level of
investment
3
Highcomplexity
Part is neither easy to initially design, nor
easy to change and revalidate. It also needs
high level of effort to produce with high
level of investment
aTo be used in conjunction with cost level to determine cost index. Cost
index ¼ Cost level�Complexity level
Table A.4Levels of engineering cost level
Rating
Engineeringcost level
Description
0
No cost Part is reuse from the past design and noadditional development cost is required
1
Lowengineering
cost
Corresponds to low change level, most of
the design artifacts from the last design
are reusable
2
Mediumengineering
cost
Corresponds to medium change level,
some of the design artifacts from the last
design are reusable
3
Highengineering
cost
Corresponds to completely new design or
almost new design hardly any design
artifacts are reusable
Table A.5Levels of tooling cost level
Rating
Tooling costlevel
Description
0
No cost Part is reuse from the past design and noadditional development cost is required
1
Lowinvestment
cost
Corresponds to low change level, most of
the infrastructure needed for the last
design is reusable
2
Mediuminvestment
cost
Corresponds to medium change level,
some of the part of the previous
infrastructure is reusable
3
Highinvestment
cost
Corresponds to completely new design or
almost new design hardly any previous
infrastructure is reusable
Table A.6Levels of warranty cost level
Economics 114 (2008) 313–332
Rating
Risk level Description0
No change Part is reuse from the past design and noadditional risk is involved
1
Low risk Corresponds to low change level, most ofthe artifacts, manufacturing processes and
test procedures are used from the last
design
2
Medium risk Corresponds to medium change level,some of the artifacts, manufacturing
processes and test procedures are used
from the last design
3
High risk Corresponds to completely new design oralmost new design hardly any previous
infrastructure is reusable
Table A.7Levels of per piece cost level**, this includes material,
labor, manufacturing and packaging cost
Rating
Cost level Description�2
No cost Part has been eliminated in the new design�1
Reduced cost Due to change in design significant costreduction can be achieved
0
No change incost
Either part is not change or even with the
new design the per piece cost stays almost
same
1
Increasedcost
Corresponds to completely new design or
almost new design hardly any design
artifacts are reusable
2
Added cost Part has been added in new design**Volume level is to be used in conjunction with cost level and
complexity for calculating cost index. Variable cost index ¼ Per piece
cost level�Volume level (1 for low, 2 for medium and 3 for high)�
complexity level.
Table A.8Levels reliability based quality (QR)
Rating
Reliabilitylevel
Description
�1
Reducedreliability
Due to change in design significant
reduction in reliability is observed
0
No change inreliability
Either part is not change or even with the
new design reliability stays almost same
1
Increasedreliability
Due to change in design significant
improvement in reliability is observed
Table A.9Levels durability based quality (QD)
Rating
Durabilitylevel
Description
�1
Reduced cost Due to change in design significantreduction in durability is observed
0
No change incost
Either part is not change or even with the
new design durability stays almost same
1
Increasedcost
Due to change in design significant
improvement in durability is observed
ARTICLE IN PRESS
uction Economics 114 (2008) 313–332 331
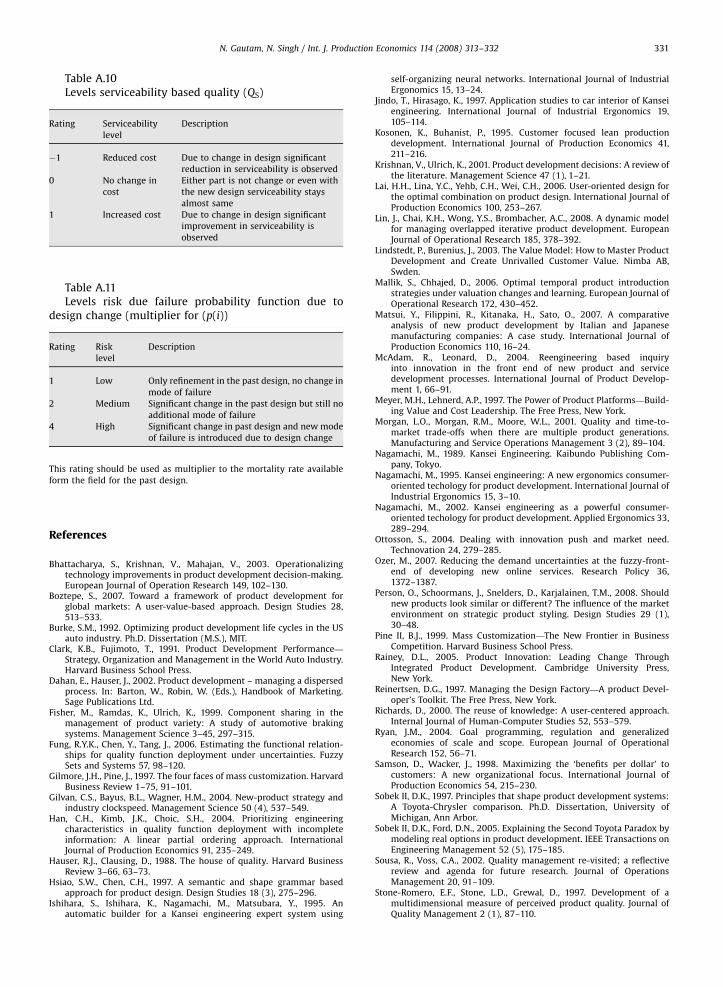
Table A.10Levels serviceability based quality (QS)
N. Gautam, N. Singh / Int. J. Prod
Rating
Serviceabilitylevel
Description
�1
Reduced cost Due to change in design significantreduction in serviceability is observed
0
No change incost
Either part is not change or even with
the new design serviceability stays
almost same
1
Increased cost Due to change in design significantimprovement in serviceability is
observed
Table A.11Levels risk due failure probability function due to
design change (multiplier for (p(i))
Rating
Risklevel
Description
1
Low Only refinement in the past design, no change inmode of failure
2
Medium Significant change in the past design but still noadditional mode of failure
4
High Significant change in past design and new modeof failure is introduced due to design change
This rating should be used as multiplier to the mortality rate available
form the field for the past design.
References
Bhattacharya, S., Krishnan, V., Mahajan, V., 2003. Operationalizingtechnology improvements in product development decision-making.European Journal of Operation Research 149, 102–130.
Boztepe, S., 2007. Toward a framework of product development forglobal markets: A user-value-based approach. Design Studies 28,513–533.
Burke, S.M., 1992. Optimizing product development life cycles in the USauto industry. Ph.D. Dissertation (M.S.), MIT.
Clark, K.B., Fujimoto, T., 1991. Product Development Performance—
Strategy, Organization and Management in the World Auto Industry.Harvard Business School Press.
Dahan, E., Hauser, J., 2002. Product development – managing a dispersedprocess. In: Barton, W., Robin, W. (Eds.), Handbook of Marketing.Sage Publications Ltd.
Fisher, M., Ramdas, K., Ulrich, K., 1999. Component sharing in themanagement of product variety: A study of automotive brakingsystems. Management Science 3–45, 297–315.
Fung, R.Y.K., Chen, Y., Tang, J., 2006. Estimating the functional relation-ships for quality function deployment under uncertainties. FuzzySets and Systems 57, 98–120.
Gilmore, J.H., Pine, J., 1997. The four faces of mass customization. HarvardBusiness Review 1–75, 91–101.
Gilvan, C.S., Bayus, B.L., Wagner, H.M., 2004. New-product strategy andindustry clockspeed. Management Science 50 (4), 537–549.
Han, C.H., Kimb, J.K., Choic, S.H., 2004. Prioritizing engineeringcharacteristics in quality function deployment with incompleteinformation: A linear partial ordering approach. InternationalJournal of Production Economics 91, 235–249.
Hauser, R.J., Clausing, D., 1988. The house of quality. Harvard BusinessReview 3–66, 63–73.
Hsiao, S.W., Chen, C.H., 1997. A semantic and shape grammar basedapproach for product design. Design Studies 18 (3), 275–296.
Ishihara, S., Ishihara, K., Nagamachi, M., Matsubara, Y., 1995. Anautomatic builder for a Kansei engineering expert system using
self-organizing neural networks. International Journal of IndustrialErgonomics 15, 13–24.
Jindo, T., Hirasago, K., 1997. Application studies to car interior of Kanseiengineering. International Journal of Industrial Ergonomics 19,105–114.
Kosonen, K., Buhanist, P., 1995. Customer focused lean productiondevelopment. International Journal of Production Economics 41,211–216.
Krishnan, V., Ulrich, K., 2001. Product development decisions: A review ofthe literature. Management Science 47 (1), 1–21.
Lai, H.H., Lina, Y.C., Yehb, C.H., Wei, C.H., 2006. User-oriented design forthe optimal combination on product design. International Journal ofProduction Economics 100, 253–267.
Lin, J., Chai, K.H., Wong, Y.S., Brombacher, A.C., 2008. A dynamic modelfor managing overlapped iterative product development. EuropeanJournal of Operational Research 185, 378–392.
Lindstedt, P., Burenius, J., 2003. The Value Model: How to Master ProductDevelopment and Create Unrivalled Customer Value. Nimba AB,Swden.
Mallik, S., Chhajed, D., 2006. Optimal temporal product introductionstrategies under valuation changes and learning. European Journal ofOperational Research 172, 430–452.
Matsui, Y., Filippini, R., Kitanaka, H., Sato, O., 2007. A comparativeanalysis of new product development by Italian and Japanesemanufacturing companies: A case study. International Journal ofProduction Economics 110, 16–24.
McAdam, R., Leonard, D., 2004. Reengineering based inquiryinto innovation in the front end of new product and servicedevelopment processes. International Journal of Product Develop-ment 1, 66–91.
Meyer, M.H., Lehnerd, A.P., 1997. The Power of Product Platforms—Build-ing Value and Cost Leadership. The Free Press, New York.
Morgan, L.O., Morgan, R.M., Moore, W.L., 2001. Quality and time-to-market trade-offs when there are multiple product generations.Manufacturing and Service Operations Management 3 (2), 89–104.
Nagamachi, M., 1989. Kansei Engineering. Kaibundo Publishing Com-pany, Tokyo.
Nagamachi, M., 1995. Kansei engineering: A new ergonomics consumer-oriented techology for product development. International Journal ofIndustrial Ergonomics 15, 3–10.
Nagamachi, M., 2002. Kansei engineering as a powerful consumer-oriented techology for product development. Applied Ergonomics 33,289–294.
Ottosson, S., 2004. Dealing with innovation push and market need.Technovation 24, 279–285.
Ozer, M., 2007. Reducing the demand uncertainties at the fuzzy-front-end of developing new online services. Research Policy 36,1372–1387.
Person, O., Schoormans, J., Snelders, D., Karjalainen, T.M., 2008. Shouldnew products look similar or different? The influence of the marketenvironment on strategic product styling. Design Studies 29 (1),30–48.
Pine II, B.J., 1999. Mass Customization—The New Frontier in BusinessCompetition. Harvard Business School Press.
Rainey, D.L., 2005. Product Innovation: Leading Change ThroughIntegrated Product Development. Cambridge University Press,New York.
Reinertsen, D.G., 1997. Managing the Design Factory—A product Devel-oper’s Toolkit. The Free Press, New York.
Richards, D., 2000. The reuse of knowledge: A user-centered approach.Internal Journal of Human-Computer Studies 52, 553–579.
Ryan, J.M., 2004. Goal programming, regulation and generalizedeconomies of scale and scope. European Journal of OperationalResearch 152, 56–71.
Samson, D., Wacker, J., 1998. Maximizing the ‘benefits per dollar’ tocustomers: A new organizational focus. International Journal ofProduction Economics 54, 215–230.
Sobek II, D.K., 1997. Principles that shape product development systems:A Toyota-Chrysler comparison. Ph.D. Dissertation, University ofMichigan, Ann Arbor.
Sobek II, D.K., Ford, D.N., 2005. Explaining the Second Toyota Paradox bymodeling real options in product development. IEEE Transactions onEngineering Management 52 (5), 175–185.
Sousa, R., Voss, C.A., 2002. Quality management re-visited; a reflectivereview and agenda for future research. Journal of OperationsManagement 20, 91–109.
Stone-Romero, E.F., Stone, L.D., Grewal, D., 1997. Development of amultidimensional measure of perceived product quality. Journal ofQuality Management 2 (1), 87–110.

ARTICLE IN PRESS
N. Gautam, N. Singh / Int. J. Production Economics 114 (2008) 313–332332
Tam, J.L.M., 2004. Customer satisfaction, service quality and perceivedvalue: An integrative model. Journal of Marketing Management 20(7–8), 897–917.
Ulaga, W., Chacour, S., 2001. Measuring customer perceived values inbusiness markets. Industrial Marketing management 30 (6),525–540.
Ulrich, K., 1995. The role of product architecture in the manufacturingfirm. Research Policy 43, 419–440.
Ulrich, K., Eppinger, S.D., 2004. Product Design and Development, thirded. McGraw-Hill, New York.
Wheelwright, S.C., Clark, K.B., 1992. Revolutionizing Product Develop-ment Quantum Leaps in Speed Efficiency and Quality. The Free Press,New York.
Yang, S.M., Nagamachi, M., Lee, S.Y., 1999. Rule-based inference model forthe Kansei Engineering System. International Journal of IndustrialErgonomics 24, 459–471.