Embed Size (px)
Citation preview
Lean Process Improvement
Alexis Naiknimbalkar & Robyn PenningtonSeptember 2012
About UsRobyn Pennington, MBA, SPHR, GBAChief of Staff, Business and FinanceCalifornia State University Chancellor’s [email protected]
Alexis Naiknimbalkar, MBAAssistant Director, Quality and Special InitiativesCalifornia State University Chancellor’s [email protected]
About You• In 1 minute or LESS:
– Name/Title– Institution– Primary job responsibilities– Number of years working in higher education– This workshop will have been a success and
made good use of my time if?
Agenda• Lean Background & Thinking• Lean Tools: 5s; Waste• Process Mapping:
– Current & Future State Process Mapping– Current and Future State Value Stream
Mapping• Initiating and completing your project:
– Project Identification/Charter; A3; Action/Implementation Plan; Change Management Considerations
General Process Improvement Approach
5
• Project Organization– Charters, team members, resources, timeline,
responsibilities.• Examine Current Process
– SIPOC, Cross Functional Flowchart or Value Stream Map– Observe/walk the process– Baseline performance data– Customer/user experience
• Design the Future Process– Lean; remove waste and non value added steps– Streamline process steps
• Plan• Implement• Check performance against baseline• Adjust
Key Terms
6
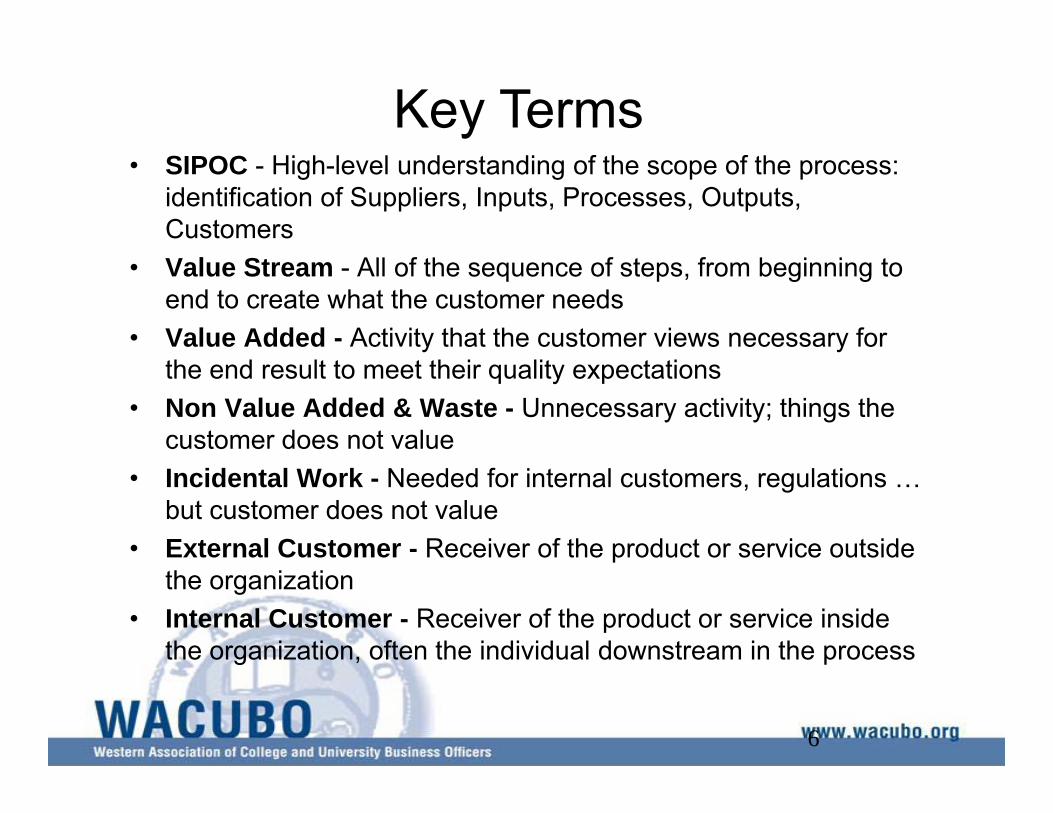
• SIPOC - High-level understanding of the scope of the process: identification of Suppliers, Inputs, Processes, Outputs, Customers
• Value Stream - All of the sequence of steps, from beginning to end to create what the customer needs
• Value Added - Activity that the customer views necessary for the end result to meet their quality expectations
• Non Value Added & Waste - Unnecessary activity; things the customer does not value
• Incidental Work - Needed for internal customers, regulations … but customer does not value
• External Customer - Receiver of the product or service outside the organization
• Internal Customer - Receiver of the product or service inside the organization, often the individual downstream in the process
Lean Thinking
Books:The Machine That Changed the World by Womack, Jones, Roos
Lean Thinking By Womack, Jones
$5-million worldwide
benchmarking study on the auto
industry
History of Industry: Toyota Post War
The Need:• High-quality (the first time around)• Work based on demand vs work for work’s
sake• Dramatically lower costs
History of Industry: Toyota Post War
The Solution:• Flow production: make what is needed
when it’s needed– No inventory– Based on customer demand and
specifications• Highly flexible, highly capable, efficient
processes• Consider what customer wants: ‘voice of
customer’
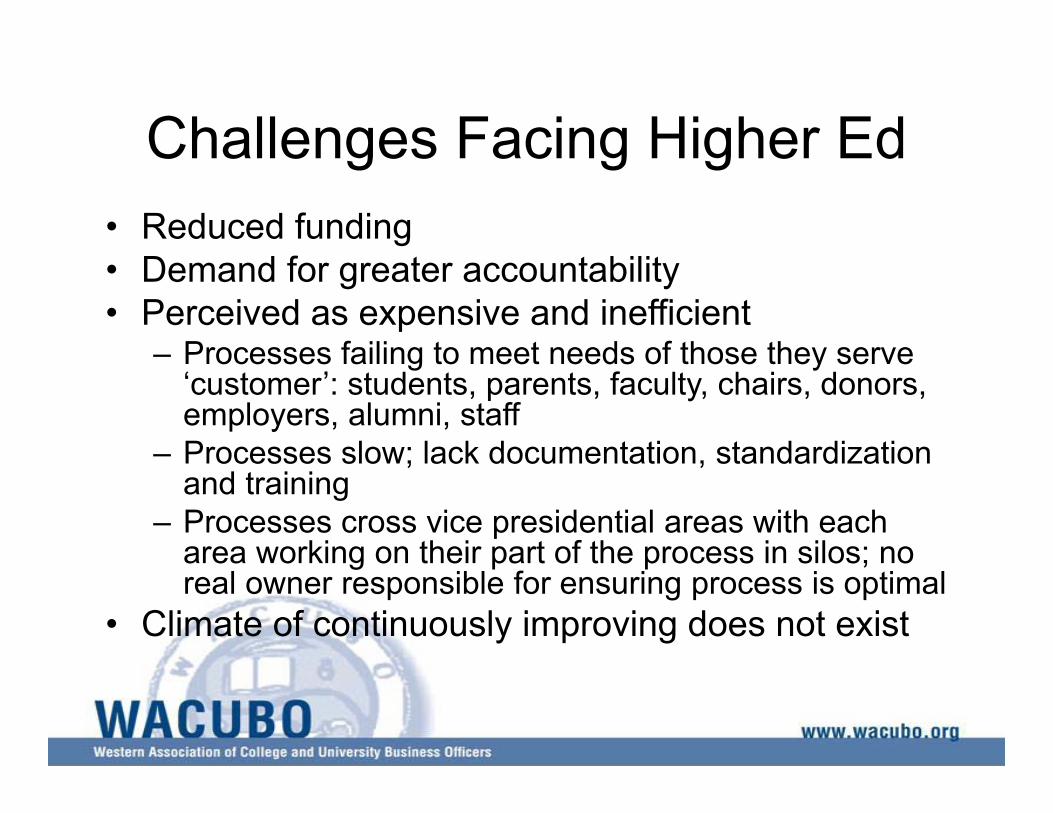
Challenges Facing Higher Ed• Reduced funding• Demand for greater accountability• Perceived as expensive and inefficient
– Processes failing to meet needs of those they serve ‘customer’: students, parents, faculty, chairs, donors, employers, alumni, staff
– Processes slow; lack documentation, standardization and training
– Processes cross vice presidential areas with each area working on their part of the process in silos; no real owner responsible for ensuring process is optimal
• Climate of continuously improving does not exist
The Competitive Universe“I WANT IT ON TIME and in the proper hands. I want it done correctly, accurately, exactly, precisely, perfectly, efficiently, reliably, expertly, proficiently, faithfully, totally, absolutely, unequivocally, unmitigatedly, maturely, lawlessly, supremely, unsurpassedly and certainly without fault. I want it unharmed, unbotched, untainted and unscrewed-up. And most of all I want it done CHEAP!”
“Our Most Important Package Is Yours.”
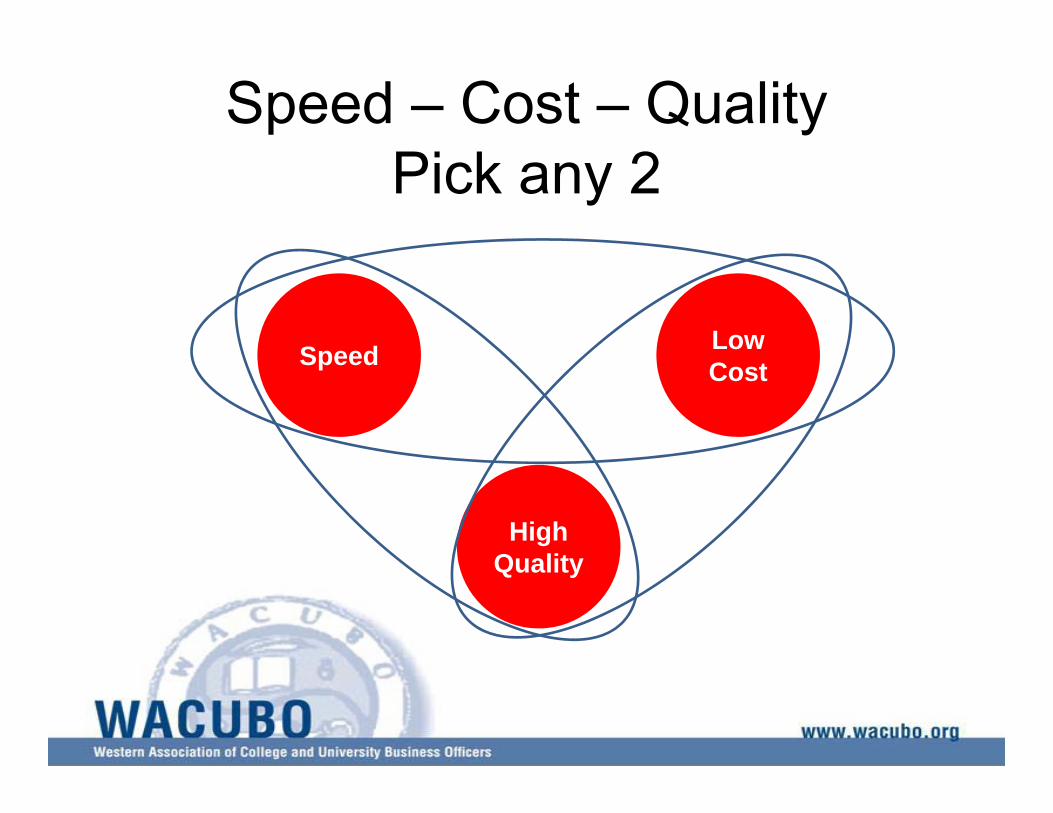
Speed – Cost – QualityPick any 2
Speed LowCost
High Quality
What Is Lean?• What have you heard?• Isn’t this stuff for people who make cars?
Lean ThinkingA simple definition:
Deliver the most valuefrom your customer’s perspective
while consuming the fewest resources
Customer is King
What is a Customer?
Why a Lean Office? Does It Apply to Higher Ed?
• Most organizational costs are administrative
• Work completed faster and more accurately
• Improves productivity and morale
Lean Thinking: The Fundamental Insight
• Focus on each product/service and its value stream (how it’s created)
• Ask which activities are waste and which truly create value
• Enhance the value and eliminate the waste to optimize the whole!
How do we gauge success? Time
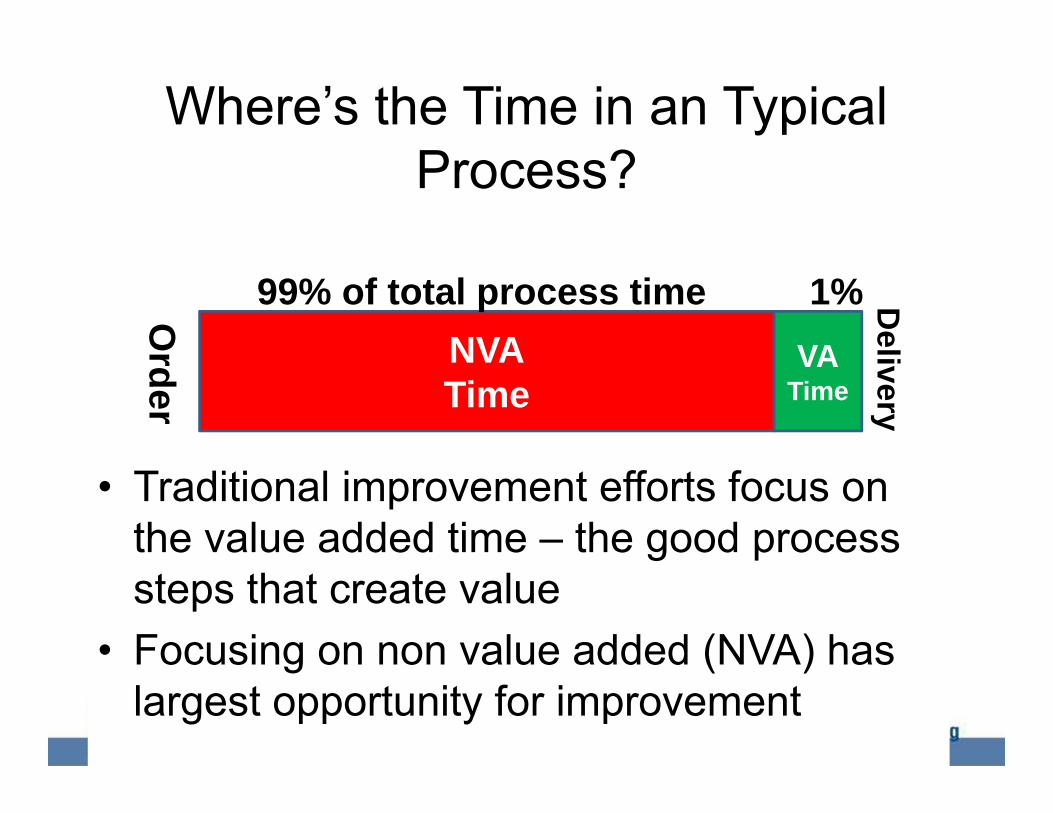
Where’s the Time in an Typical Process?
• Traditional improvement efforts focus on the value added time – the good process steps that create value
• Focusing on non value added (NVA) has largest opportunity for improvement
NVATime
VATime
99% of total process time 1% Delivery
Order
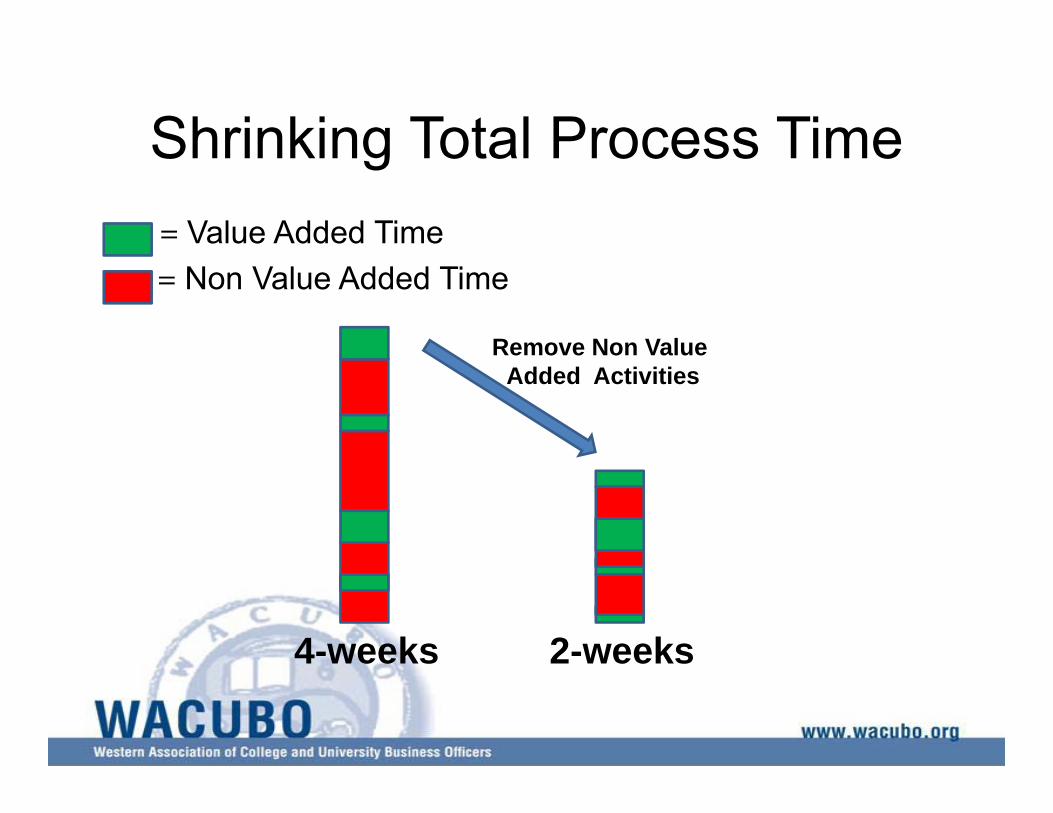
Shrinking Total Process Time= Value Added Time= Non Value Added Time
Remove Non Value Added Activities
4-weeks 2-weeks
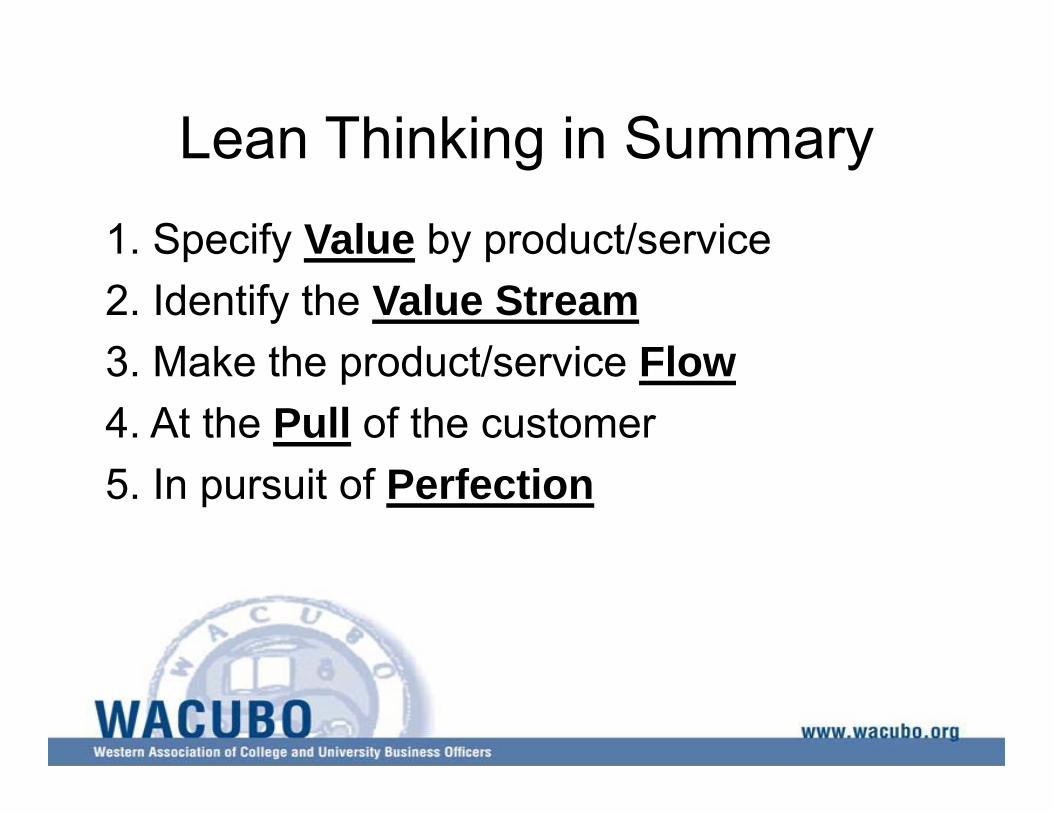
Lean Thinking in Summary1. Specify Value by product/service2. Identify the Value Stream3. Make the product/service Flow4. At the Pull of the customer5. In pursuit of Perfection
Lean Thinking1. Specify Value by product from the
standpoint of the customer
– Applies to “services” as well as “goods”: Most customers just want a solution to their problem!
Lean Thinking2. Identify the Value Stream from the start
of the process to the end
– Eliminate steps that don’t create value and cause waste
Lean Thinking3. Make the product/service Flow
continuously
Avoid defects and bottlenecks– Rework– Errors– Waiting
Lean Thinking4. At the Pull of the Customer:
– Delivering only what is needed, when it’s needed
Lean Thinking5. In pursuit of Perfection
– Perfection is the complete elimination of waste and non value added activities; requires a continuous improvement mentality
Lean Principles• The customers always define value for the
process• Lean distinguishes steps that create value from
those that do not• Lean reduces waste and builds in quality• The people who do the work are the experts• Learning to improve work is as important as
producing the work output
Lean Tools:5S & Waste
5SA five-step improvement process to create and maintain a clean, neat, and high performance workplace. Used to READY the workplace for future continuous improvement efforts.1. Sort - distinguish needed items from unneeded;
eliminate unneeded2. Straighten - keep needed items in the correct place
for easy access3. Shine - keep workplace tidy4. Standardize - method of making the steps above a
habit5. Sustain - establish procedures
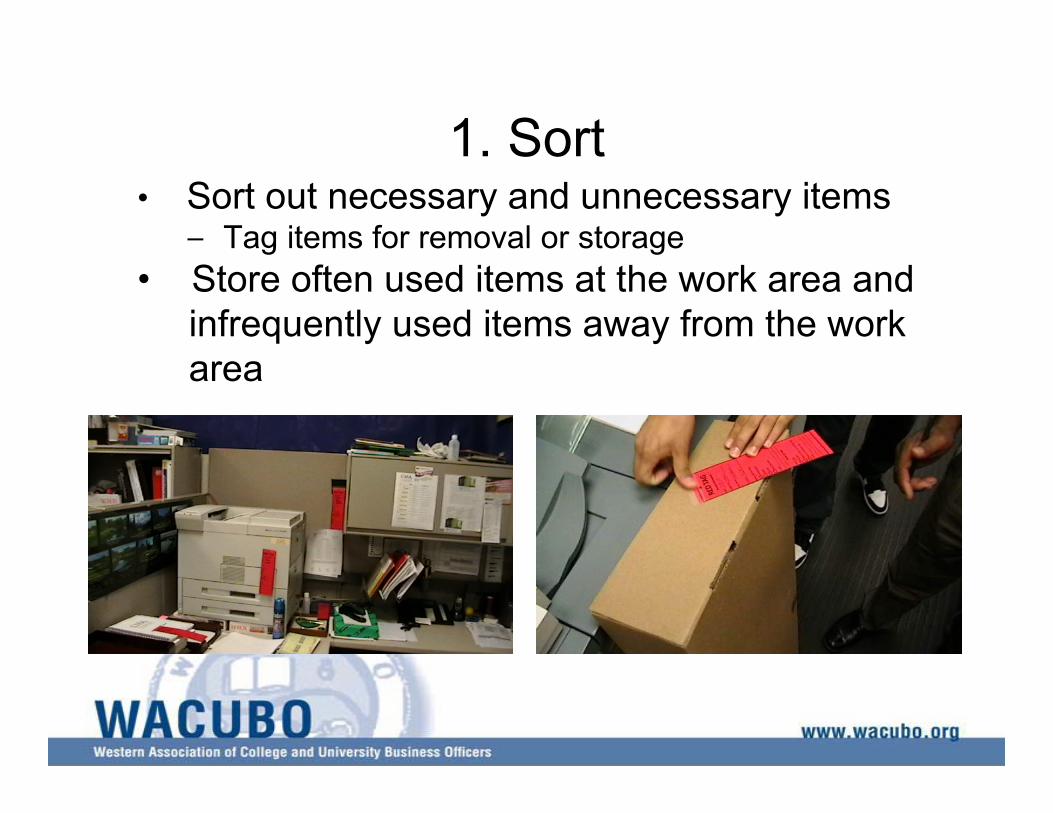
1. Sort• Sort out necessary and unnecessary items
− Tag items for removal or storage• Store often used items at the work area and
infrequently used items away from the workarea
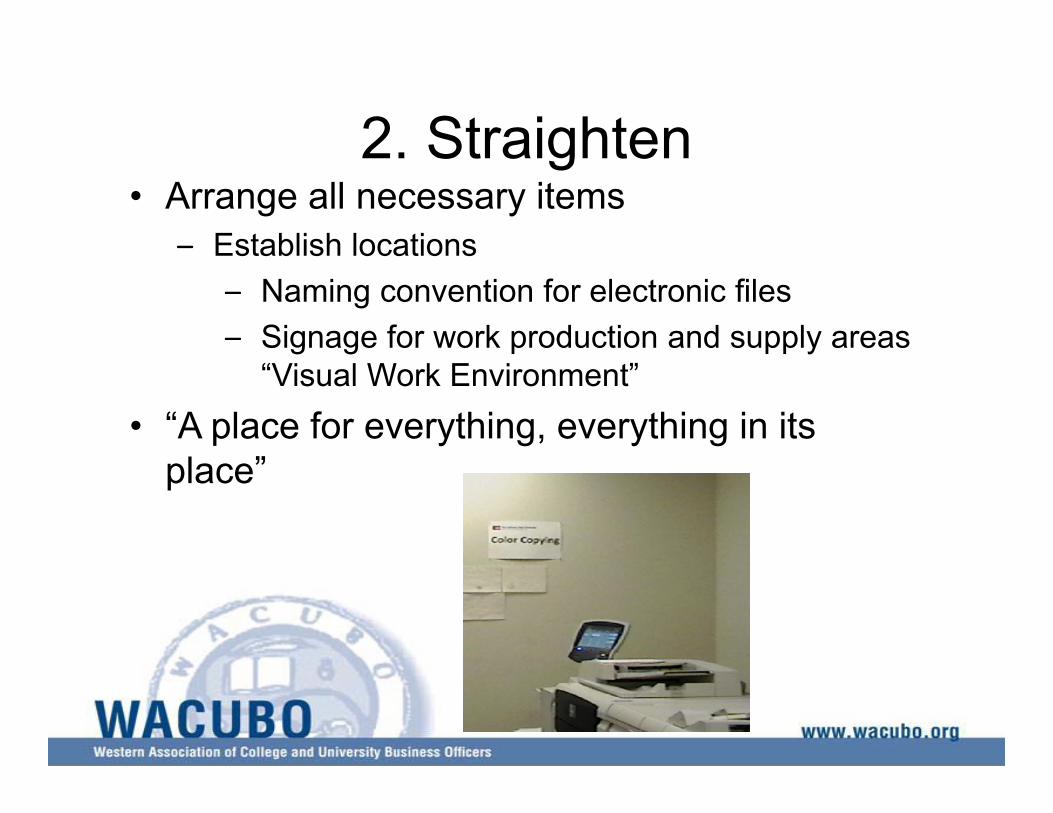
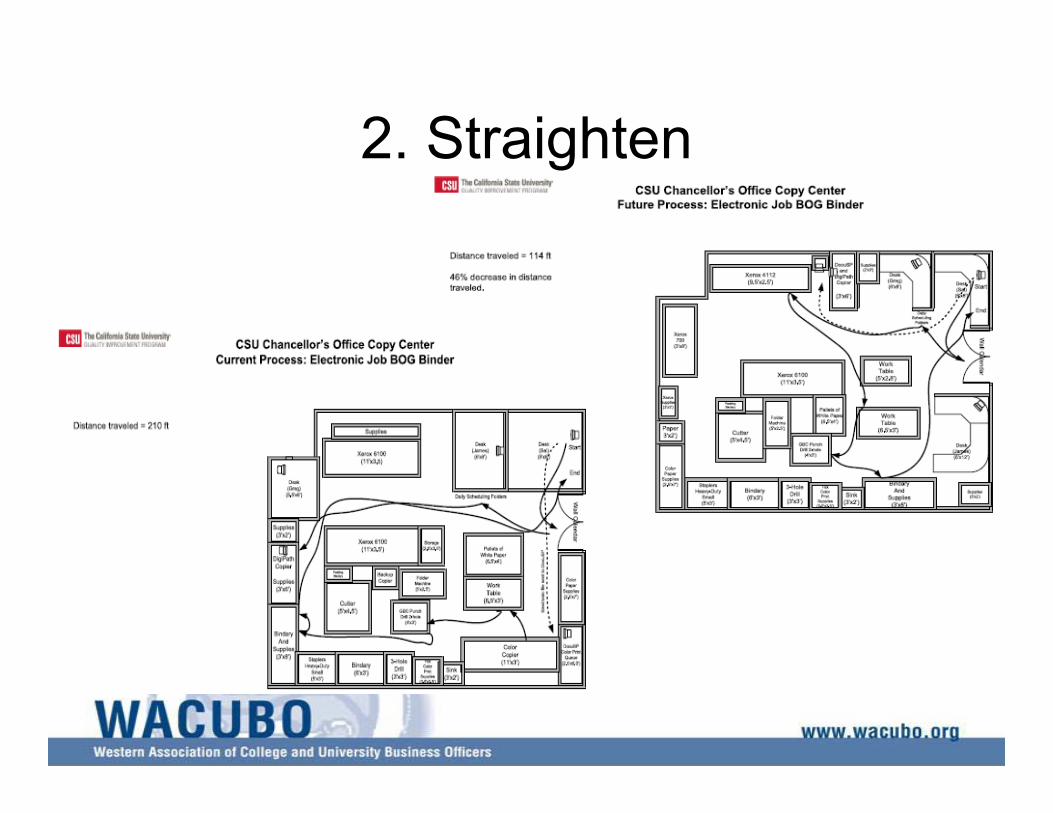
2. Straighten• Arrange all necessary items
– Establish locations– Naming convention for electronic files– Signage for work production and supply areas
“Visual Work Environment”• “A place for everything, everything in its
place”
2. Straighten
3. Shine• To keep your area clean on a continuing
basis– Physically clean– Clean electronic folders on
– a regular basis; no outdated – versions
– Can a colleague find it– No unused icons/shortcuts
4. Standardize• To maintain guidelines – Sort, Straighten and
Sweep– Develop schedules, checklists, audits, information
boards– Periodically evaluate area using 5S spreadsheet
– Workgroup agrees on naming conventions, where to save/store/retrieve data
• Prevents regression back to an unclean/disorganized environment (return items to where they belong)
• Continually improve neatness
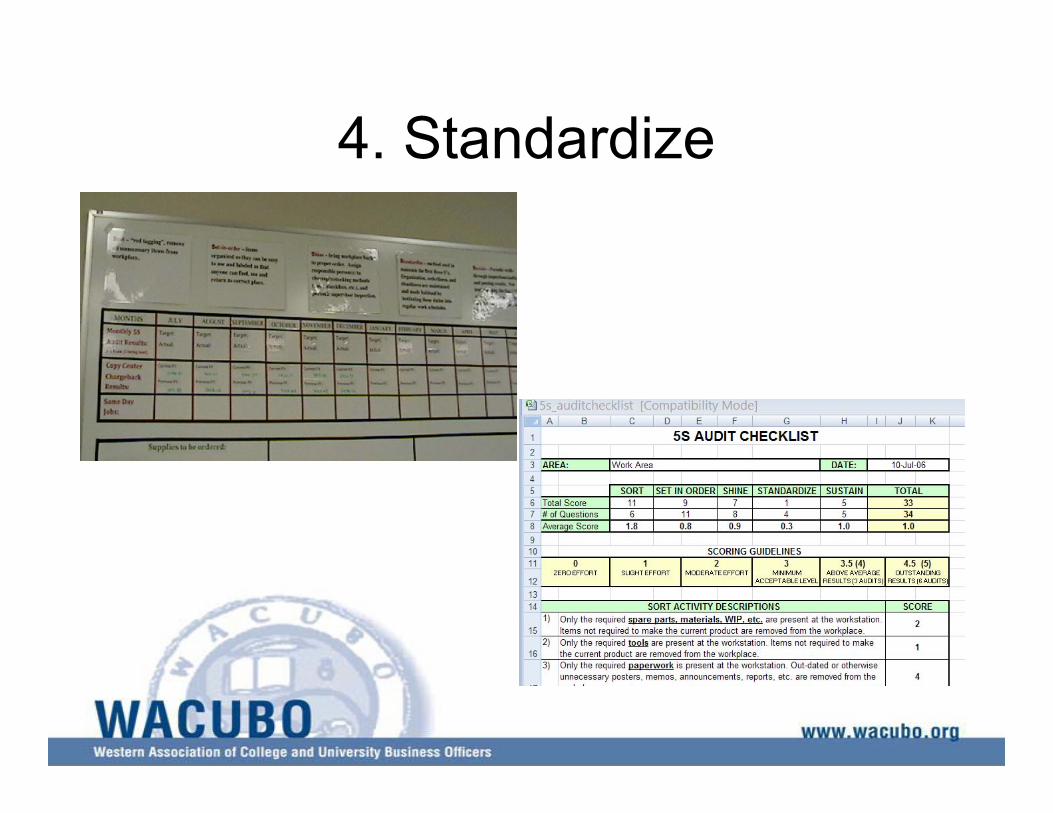
4. Standardize
5. Sustain• To maintain discipline, we need to practice
and repeat until it becomes a way of life– Training everyone is vital– Involvement from all is necessary
• To build housekeeping into every day process– Commitment and discipline toward housekeeping
is essential in taking the first step in being World Class
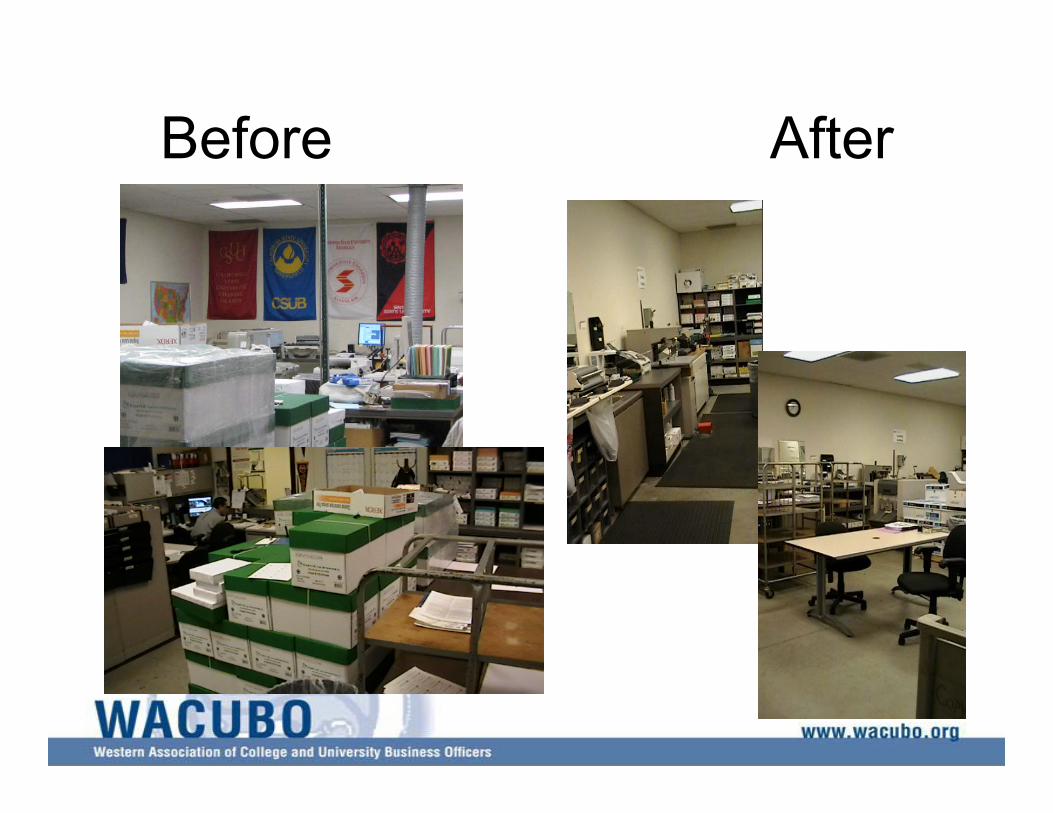
Before After
Benefits of 5S• Organized workplace• Reduces stress• Reduces waste• More pleasant place to work• Credibility/impress customers• Safer work environment• Foundation for other improvement projects
What is Waste?• The elements of an activity that do not add
value from the customer perspective• Adds cost & time
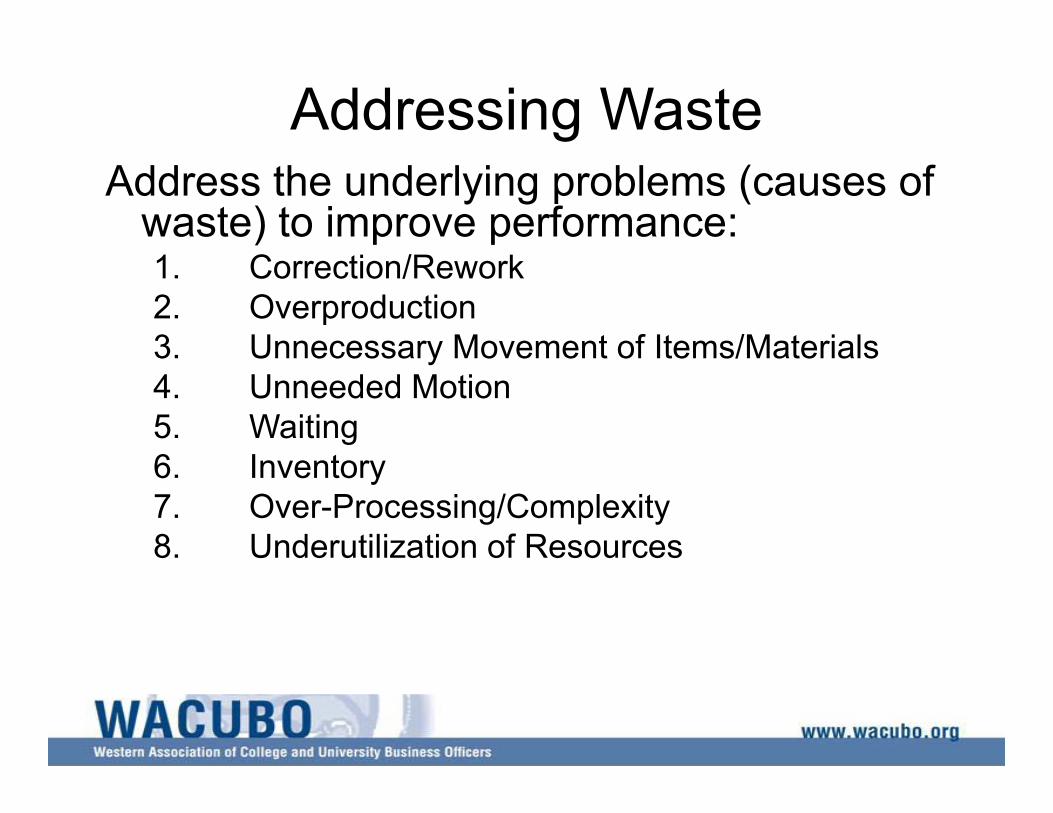
Addressing WasteAddress the underlying problems (causes of
waste) to improve performance: 1. Correction/Rework2. Overproduction3. Unnecessary Movement of Items/Materials4. Unneeded Motion5. Waiting6. Inventory7. Over-Processing/Complexity8. Underutilization of Resources
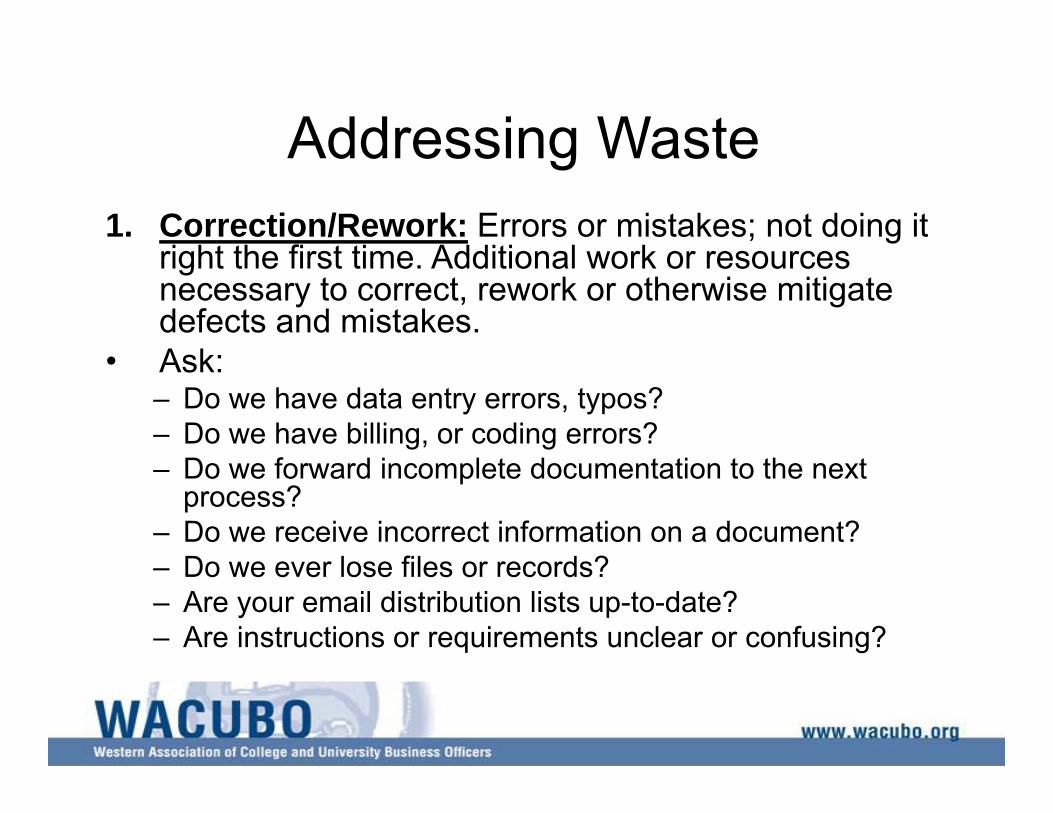
Addressing Waste1. Correction/Rework: Errors or mistakes; not doing it
right the first time. Additional work or resources necessary to correct, rework or otherwise mitigate defects and mistakes.
• Ask:– Do we have data entry errors, typos?– Do we have billing, or coding errors?– Do we forward incomplete documentation to the next
process?– Do we receive incorrect information on a document?– Do we ever lose files or records?– Are your email distribution lists up-to-date?– Are instructions or requirements unclear or confusing?
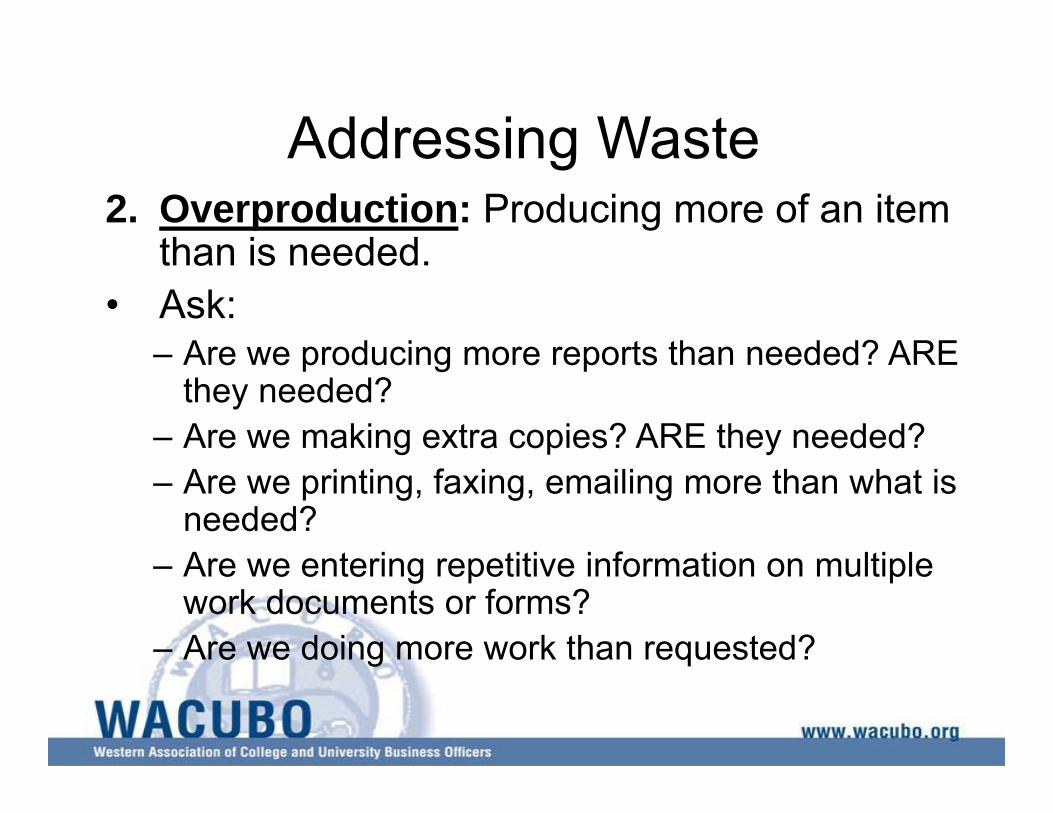
Addressing Waste2. Overproduction: Producing more of an item
than is needed.• Ask:
– Are we producing more reports than needed? ARE they needed?
– Are we making extra copies? ARE they needed?– Are we printing, faxing, emailing more than what is
needed?– Are we entering repetitive information on multiple
work documents or forms?– Are we doing more work than requested?
Addressing Waste3. Unnecessary Movement of
Items/Materials: Unneeded travel or movement of materials used when producing an item.
• Ask:– Are you delivering/routing documents that are
not required?– Are you doing excessive filing of work
documents that will never be used again?
Addressing Waste4. Unneeded Motion: Unnecessary motion required by
a worker to complete a task.• Ask:
– Are you searching for computer files on your desktop? Unable to find or too many layers in electronic files?
– Are you searching for work documents (files) in cabinets and/or drawers? Digging through stacks of paper?
– Are you hand-carrying paper work to another process or department regularly?
– Are you walking to a copier or printer?– Are you spending a lot of time traveling to meetings?
Addressing Waste5. Waiting: Idle time while individuals wait for work to
arrive; customers waiting for service.• Ask:
– Are there bottlenecks?– Are there excessive signatures or approvals required?
(long approval cycles)– Is there too much dependency on others to complete a
task?– Are there cross-departmental resource commitments
issues? How do they know how to prioritize?– Are there delays in receiving information?– Is there time spent waiting for decisions?– Are there system downtimes, slow systems?
Addressing Waste6. Inventory: Excessive inventory that ties up
space and capital.• Ask:
– Are files (work) sitting in an inbox (backlog of work)?
– Are we processing information in batches?– Are we purchasing excessive supplies of any
kind?– Do we have any obsolete files/folders/equipment
in the area?
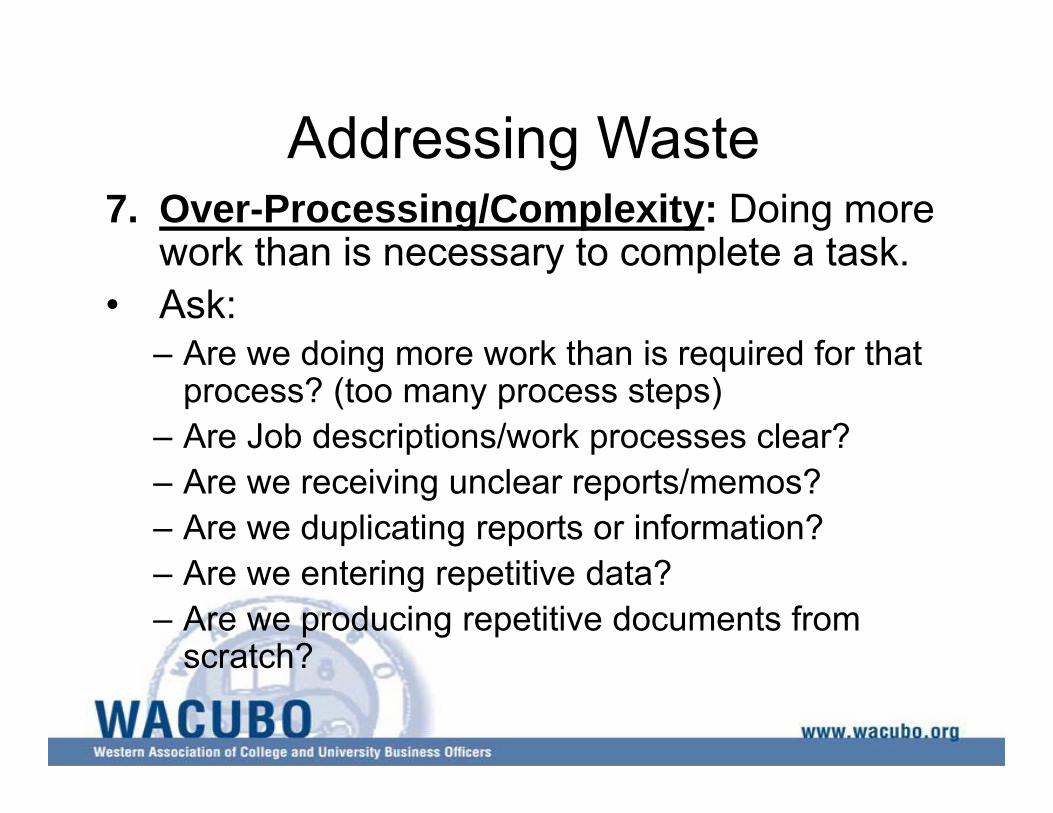
Addressing Waste7. Over-Processing/Complexity: Doing more
work than is necessary to complete a task.• Ask:
– Are we doing more work than is required for that process? (too many process steps)
– Are Job descriptions/work processes clear?– Are we receiving unclear reports/memos?– Are we duplicating reports or information?– Are we entering repetitive data?– Are we producing repetitive documents from
scratch?
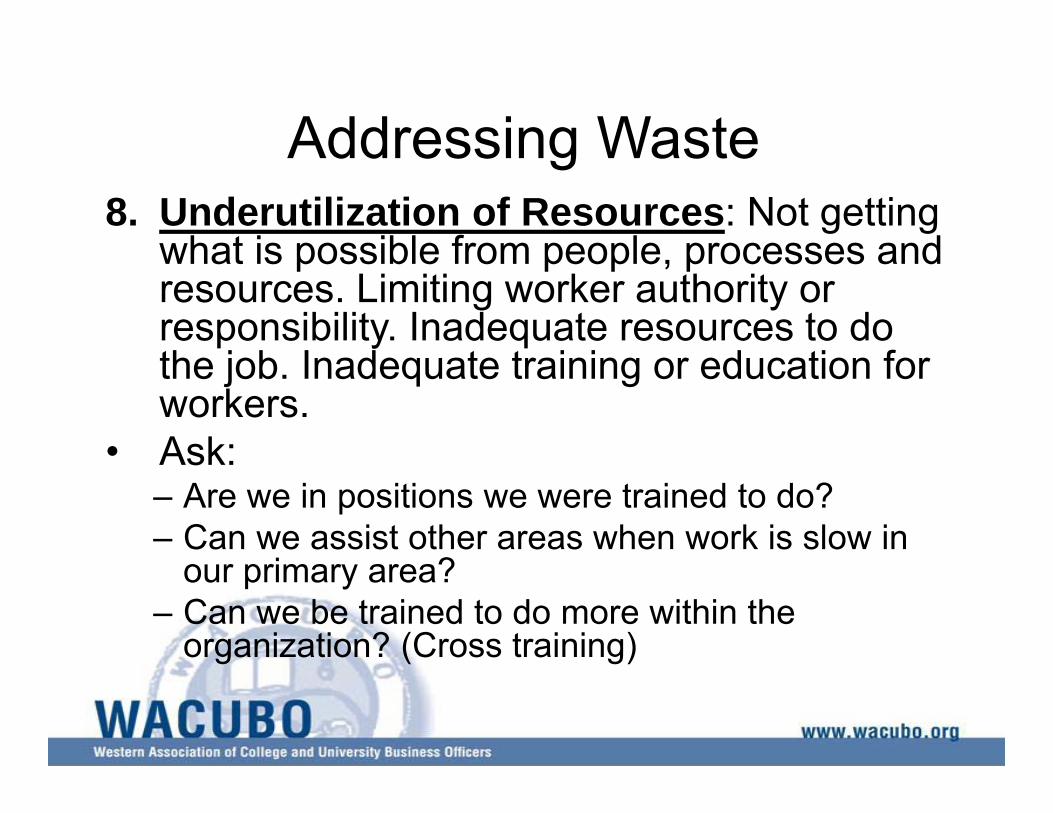
Addressing Waste8. Underutilization of Resources: Not getting
what is possible from people, processes and resources. Limiting worker authority or responsibility. Inadequate resources to do the job. Inadequate training or education for workers.
• Ask:– Are we in positions we were trained to do?– Can we assist other areas when work is slow in
our primary area?– Can we be trained to do more within the
organization? (Cross training)
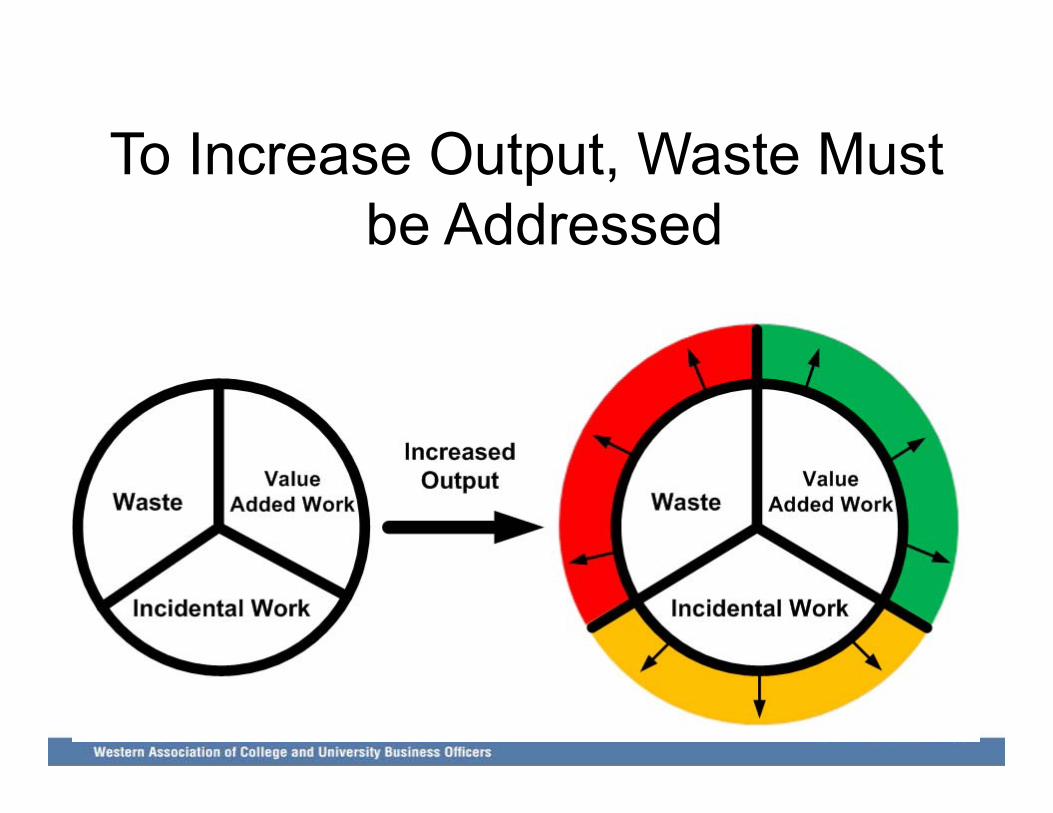
To Increase Output, Waste Must be Addressed
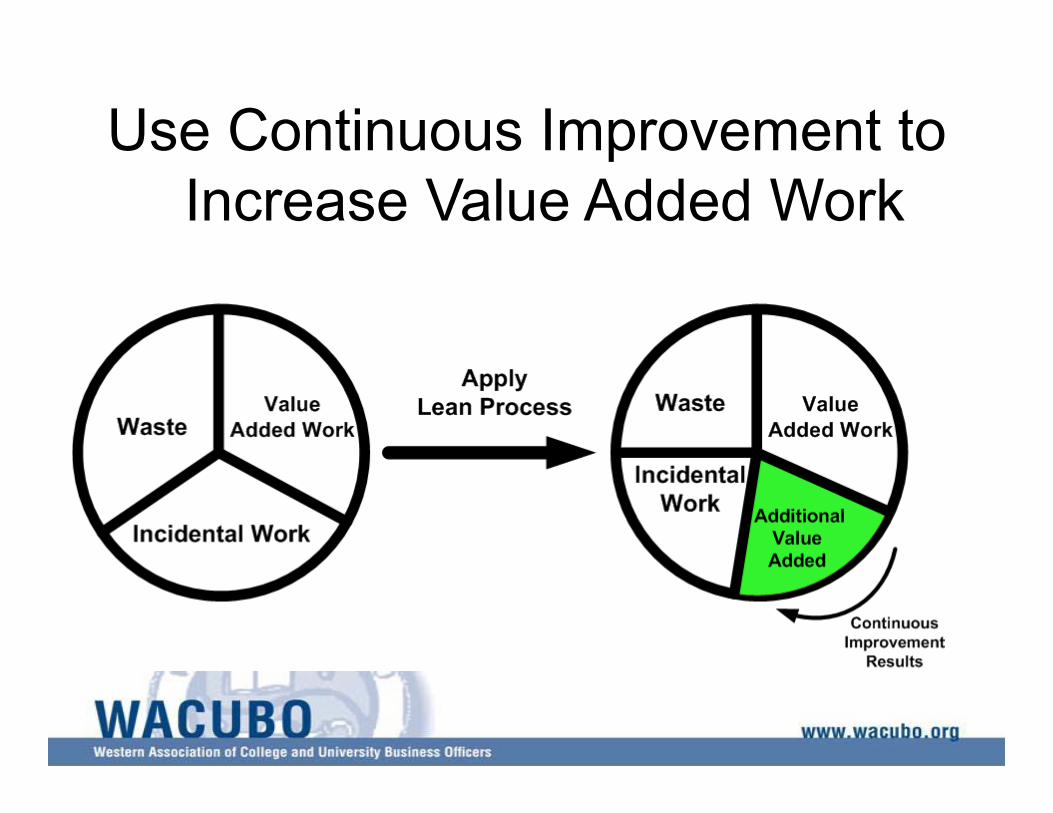
Use Continuous Improvement to Increase Value Added Work
Defining/Identifying Current Process
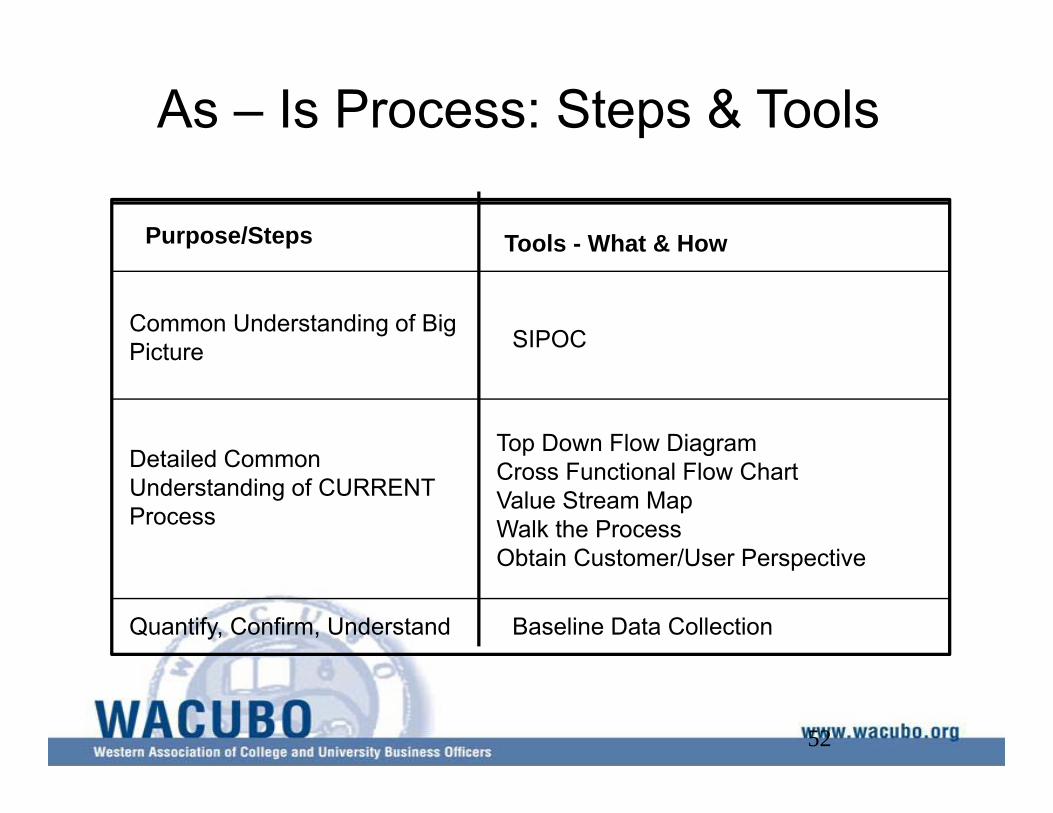
As – Is Process: Steps & Tools
52
Purpose/Steps Tools - What & How
Common Understanding of Big Picture SIPOC
Detailed Common Understanding of CURRENT Process
Top Down Flow DiagramCross Functional Flow ChartValue Stream MapWalk the ProcessObtain Customer/User Perspective
Quantify, Confirm, Understand Baseline Data Collection
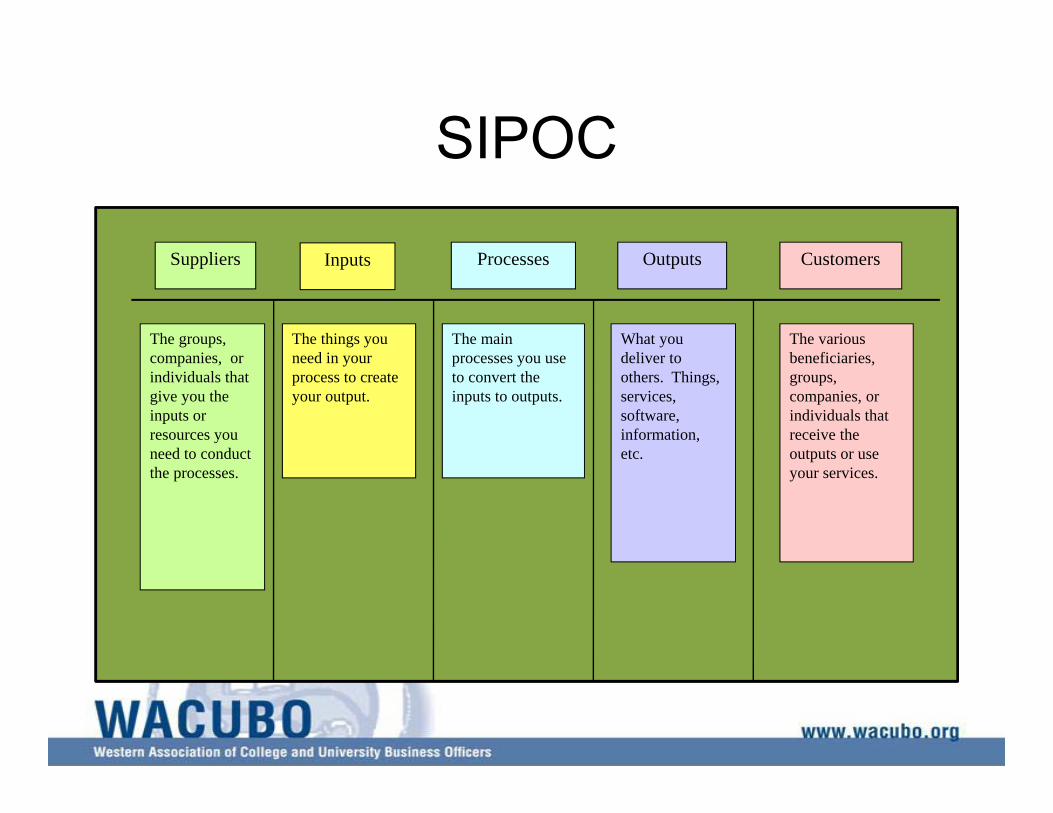
SIPOC
Suppliers Inputs Processes Outputs Customers
The groups, companies, or individuals that give you the inputs or resources you need to conduct the processes.
The things you need in your process to create your output.
The main processes you use to convert the inputs to outputs.
What you deliver to others. Things, services, software, information, etc.
The various beneficiaries, groups, companies, or individuals that receive the outputs or use your services.
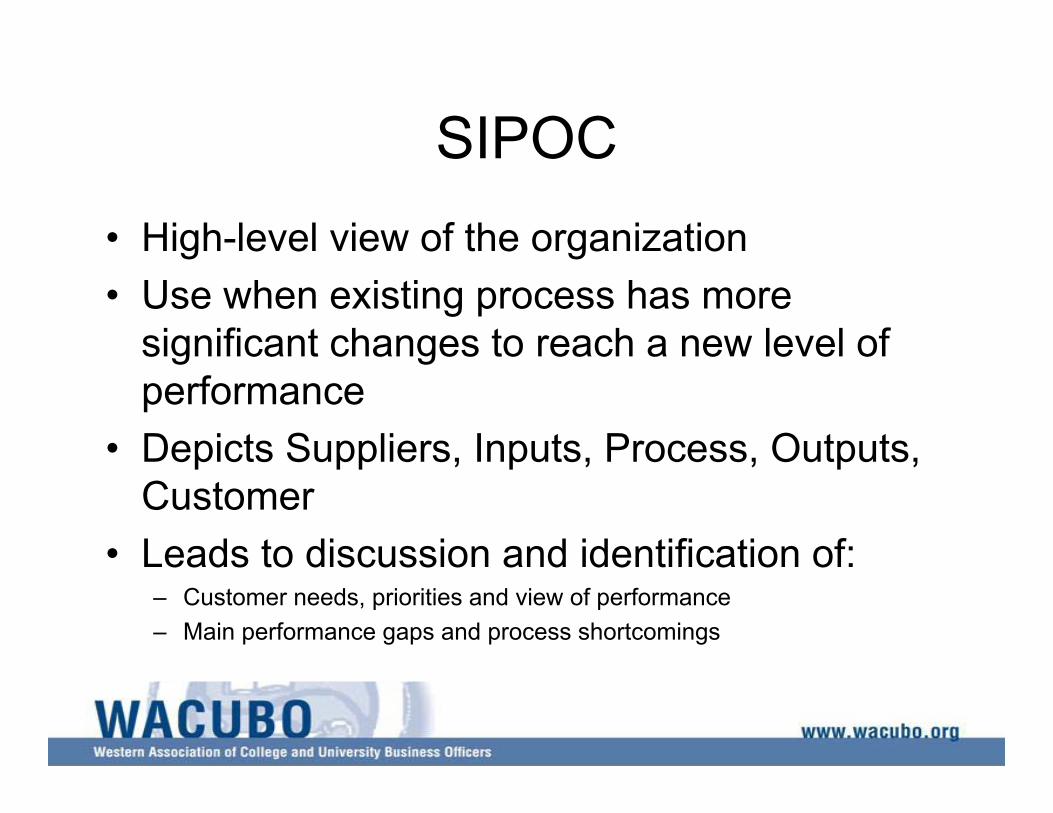
SIPOC• High-level view of the organization• Use when existing process has more
significant changes to reach a new level of performance
• Depicts Suppliers, Inputs, Process, Outputs, Customer
• Leads to discussion and identification of:– Customer needs, priorities and view of performance– Main performance gaps and process shortcomings
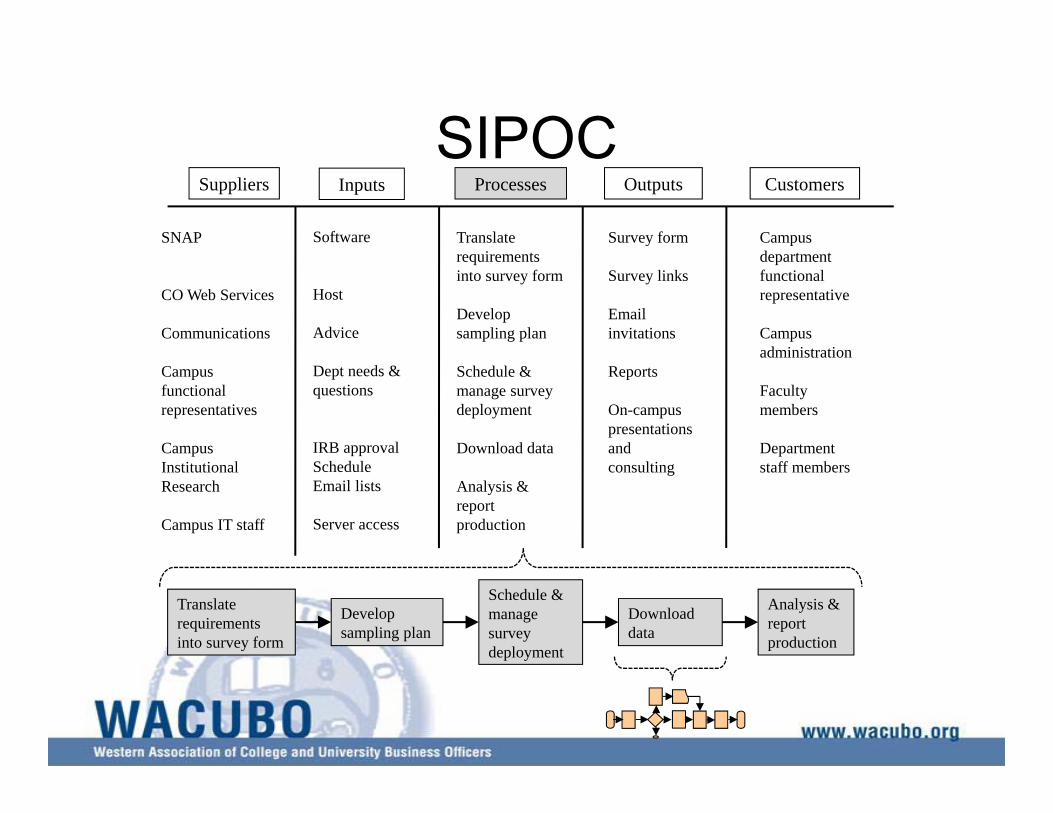
SIPOCSuppliers Inputs Processes Outputs Customers
SNAP
CO Web Services
Communications
Campus functional representatives
Campus Institutional Research
Campus IT staff
Software
Host
Advice
Dept needs & questions
IRB approvalScheduleEmail lists
Server access
Translate requirements into survey form
Develop sampling plan
Schedule & manage survey deployment
Download data
Analysis & report production
Survey form
Survey links
Email invitations
Reports
On-campus presentations and consulting
Campus department functional representative
Campus administration
Faculty members
Department staff members
Translate requirements into survey form
Develop sampling plan
Analysis & report production
Schedule & manage survey deployment
Download data
Process Mapping
What is a Process?
A process describes a sequence of events required to get results
Process Thinking at Toyota“Brilliant process management is our
strategy.We get brilliant results from average people
managing brilliant processes.We observe that our competitors often get
average (or worse) results from brilliant people managing broken processes.”
What is Process Mapping?
• A graphical representation of how work is done that shows tasks in sequence and makes work visible
• Clarifies roles and responsibilities − What activities are completed by whom
and in what sequence
Why Process Mapping?• Orient and train employees and customers• Improve a process:
– Identify opportunities for improvement– Streamline activities and eliminate
redundancies– Automate processes– Identify metrics (costs, resource allocation
etc.) to improve
Why are there Process Issues?• Process was not designed well initially• Customer needs changed but process did
not• Technology changed but process did not• Process was changed over time
– Added steps, approvals, checks on accuracy• Process dependent on a few individuals
but not documented
Why are there Process Issues?• Process owners rarely take/have the time
to review a process• Those working on a process don’t have a
mechanism to fix the process
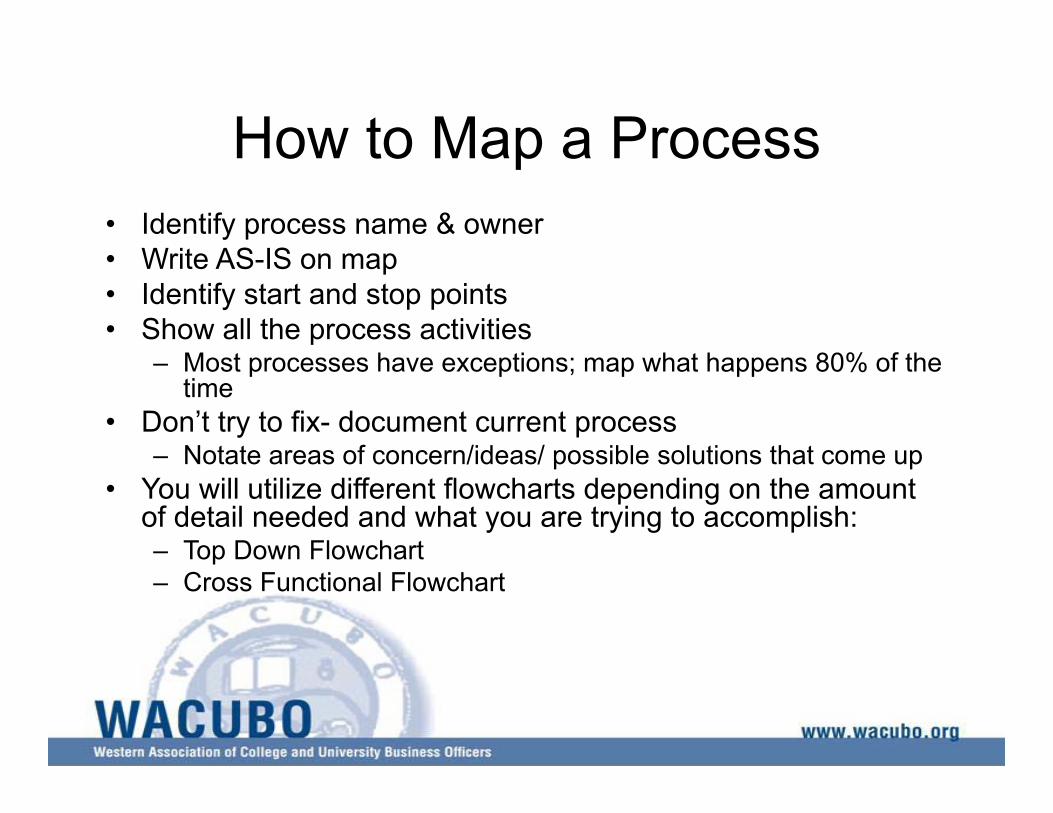
How to Map a Process• Identify process name & owner• Write AS-IS on map• Identify start and stop points• Show all the process activities
– Most processes have exceptions; map what happens 80% of the time
• Don’t try to fix- document current process– Notate areas of concern/ideas/ possible solutions that come up
• You will utilize different flowcharts depending on the amount of detail needed and what you are trying to accomplish:– Top Down Flowchart– Cross Functional Flowchart
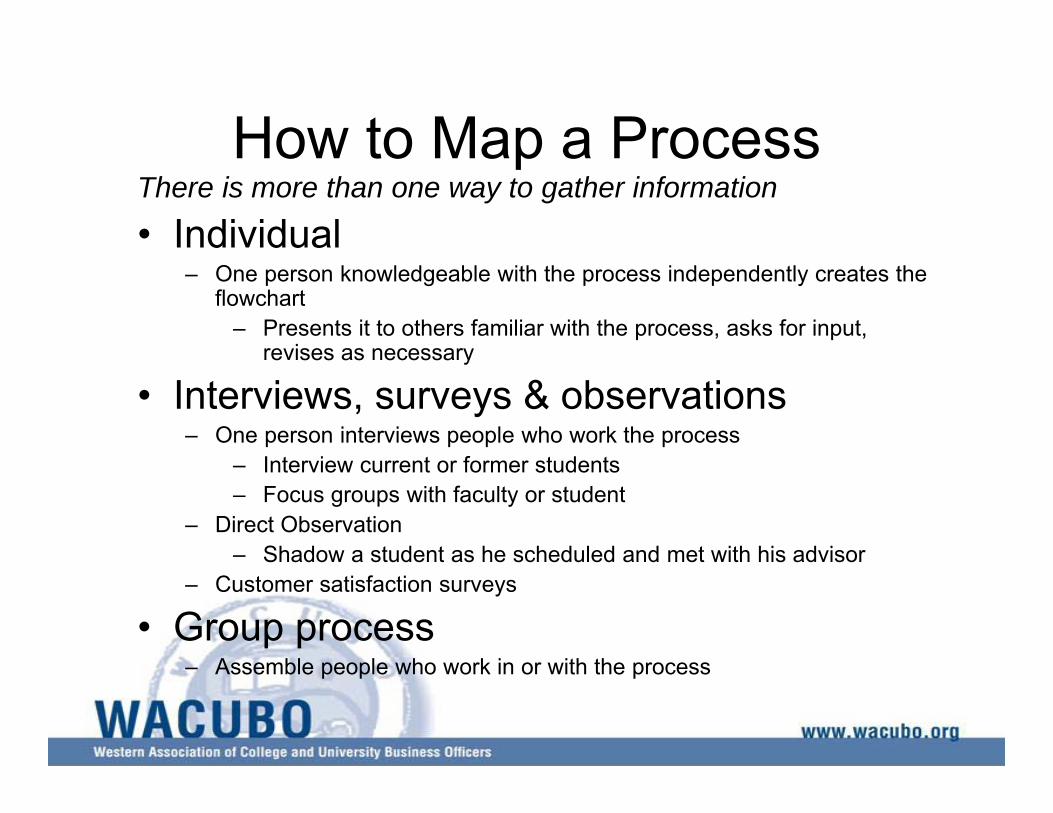
How to Map a ProcessThere is more than one way to gather information
• Individual– One person knowledgeable with the process independently creates the
flowchart– Presents it to others familiar with the process, asks for input,
revises as necessary
• Interviews, surveys & observations– One person interviews people who work the process
– Interview current or former students– Focus groups with faculty or student
– Direct Observation– Shadow a student as he scheduled and met with his advisor
– Customer satisfaction surveys
• Group process– Assemble people who work in or with the process
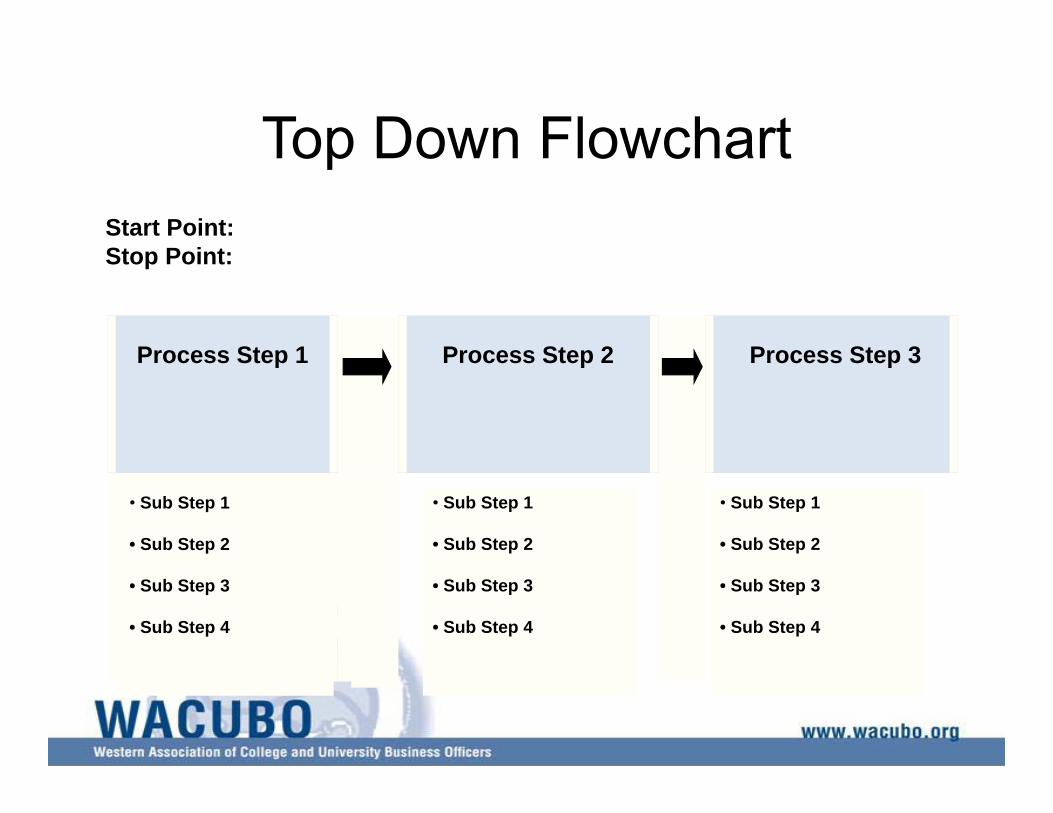
Top Down Flowchart
• Sub Step 1
• Sub Step 2
• Sub Step 3
• Sub Step 4
Process Step 1 Process Step 2 Process Step 3
Start Point:Stop Point:
• Sub Step 1
• Sub Step 2
• Sub Step 3
• Sub Step 4
• Sub Step 1
• Sub Step 2
• Sub Step 3
• Sub Step 4
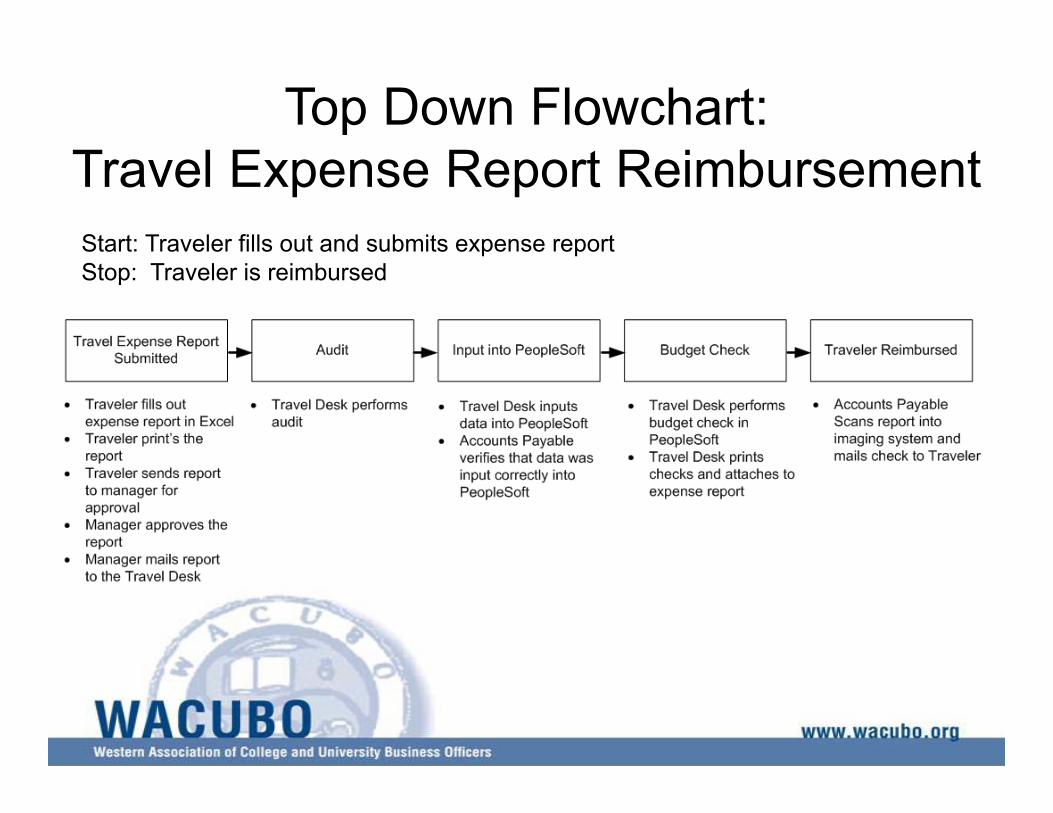
Top Down Flowchart: Travel Expense Report ReimbursementStart: Traveler fills out and submits expense reportStop: Traveler is reimbursed
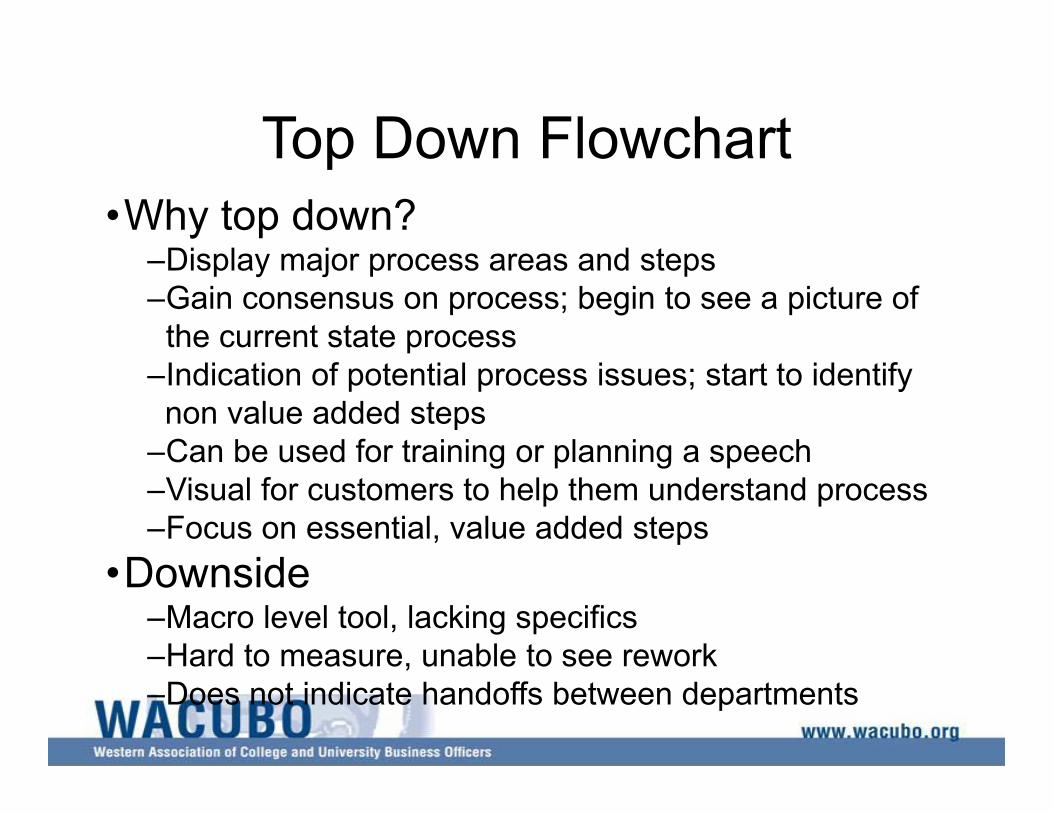
Top Down Flowchart•Why top down?
–Display major process areas and steps–Gain consensus on process; begin to see a picture of
the current state process–Indication of potential process issues; start to identify non value added steps
–Can be used for training or planning a speech–Visual for customers to help them understand process–Focus on essential, value added steps
•Downside–Macro level tool, lacking specifics–Hard to measure, unable to see rework–Does not indicate handoffs between departments
Top Down Flowchart
•Procedure– Define start and stop points– List the main steps (4-12)– Arrange them in order– Identify key tasks under each step
•Class exercise:–Getting to work in the morning
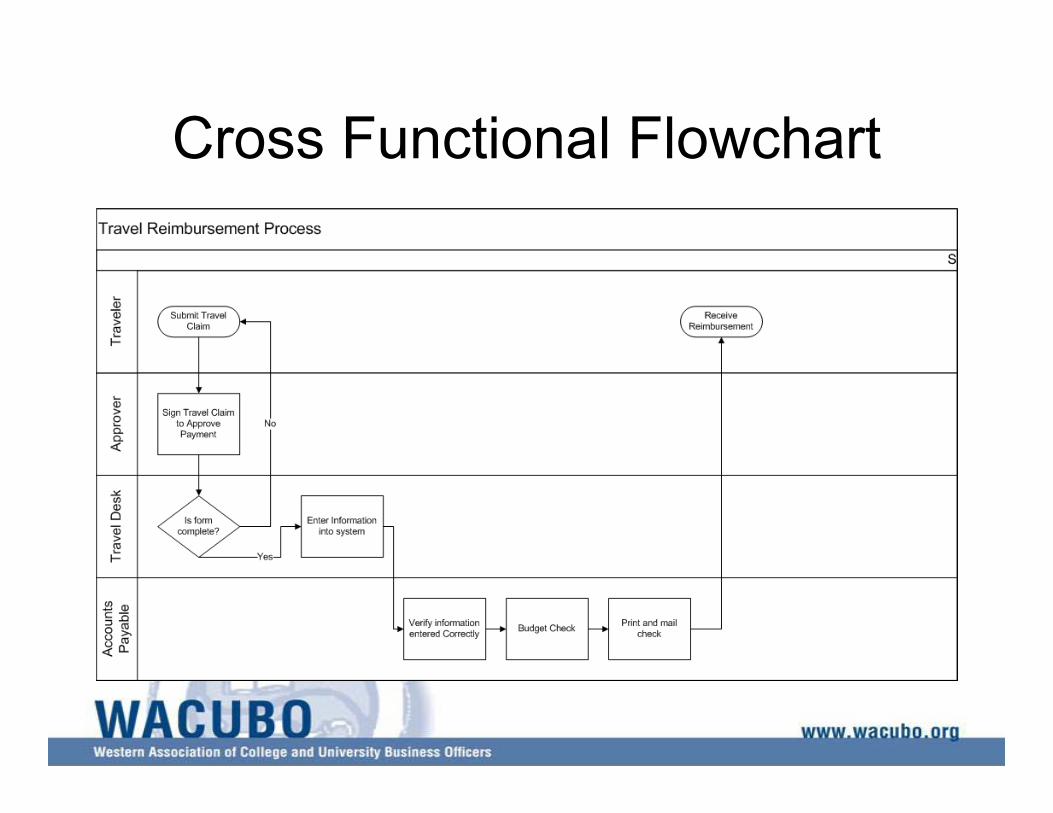
Cross Functional Flowchart
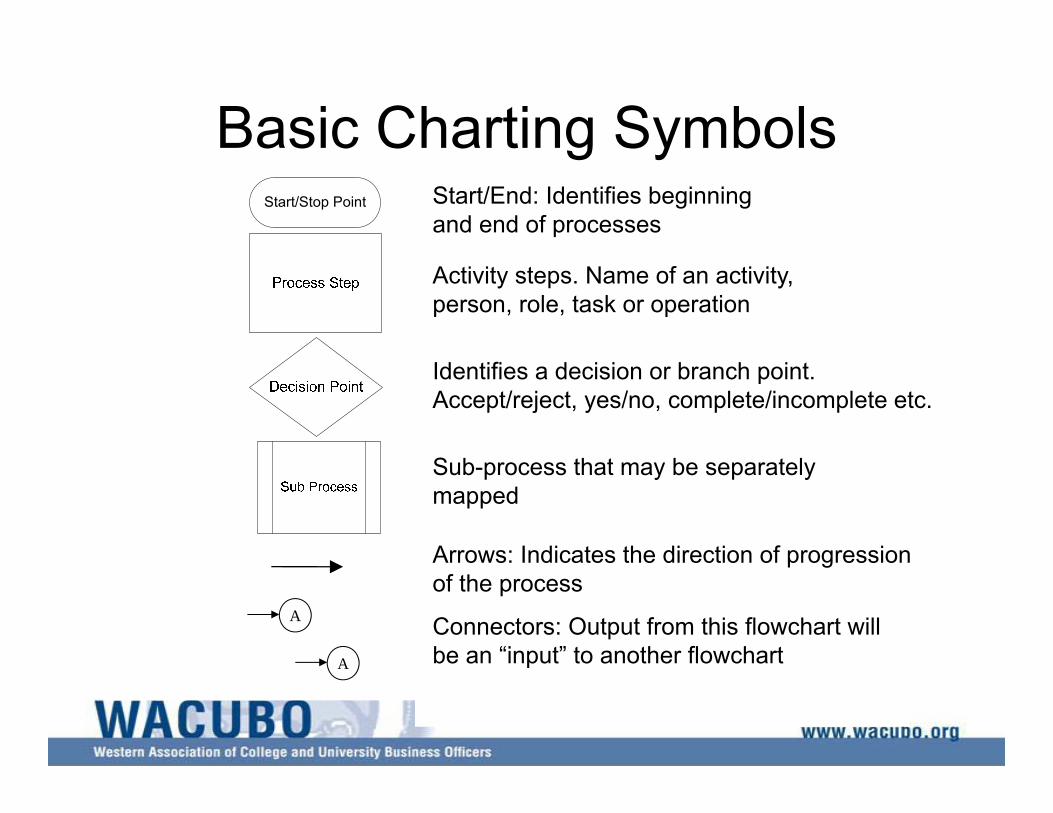
Basic Charting SymbolsStart/End: Identifies beginning and end of processes
Activity steps. Name of an activity, person, role, task or operation
Identifies a decision or branch point.Accept/reject, yes/no, complete/incomplete etc.
Arrows: Indicates the direction of progression of the process
A
A
Connectors: Output from this flowchart will be an “input” to another flowchart
Sub-process that may be separately mapped
Start/Stop Point
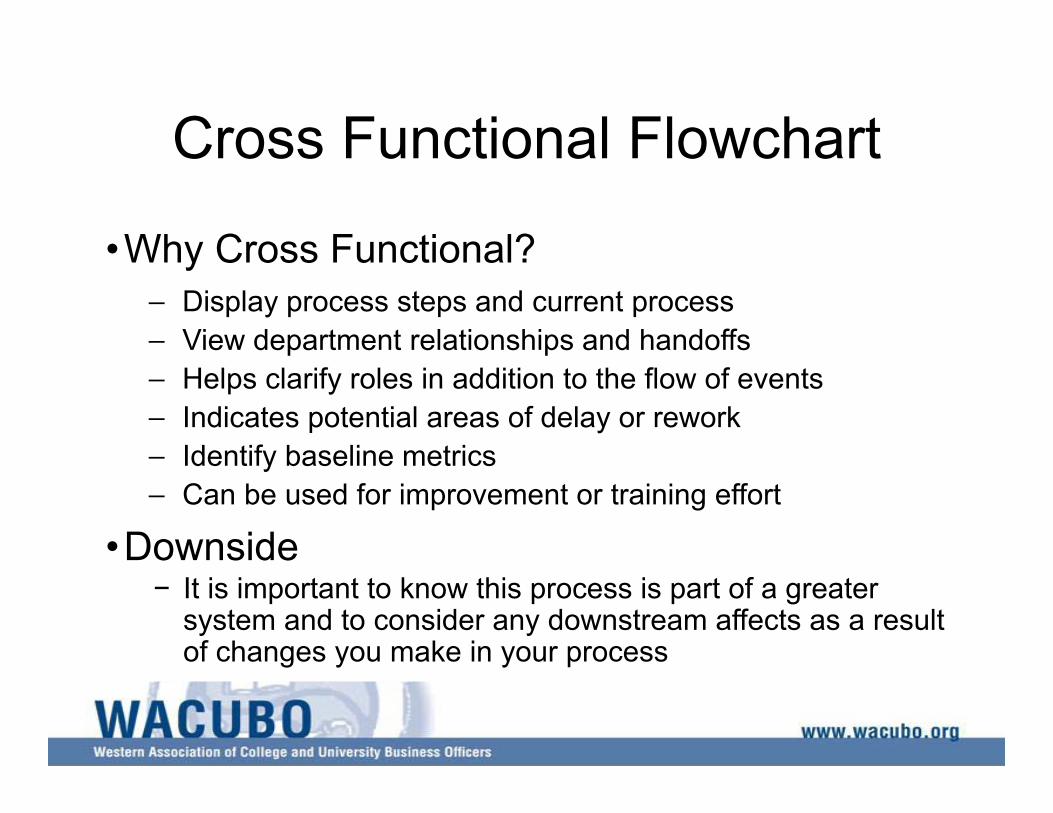
Cross Functional Flowchart
•Why Cross Functional?– Display process steps and current process– View department relationships and handoffs– Helps clarify roles in addition to the flow of events– Indicates potential areas of delay or rework– Identify baseline metrics– Can be used for improvement or training effort
•Downside− It is important to know this process is part of a greater
system and to consider any downstream affects as a result of changes you make in your process
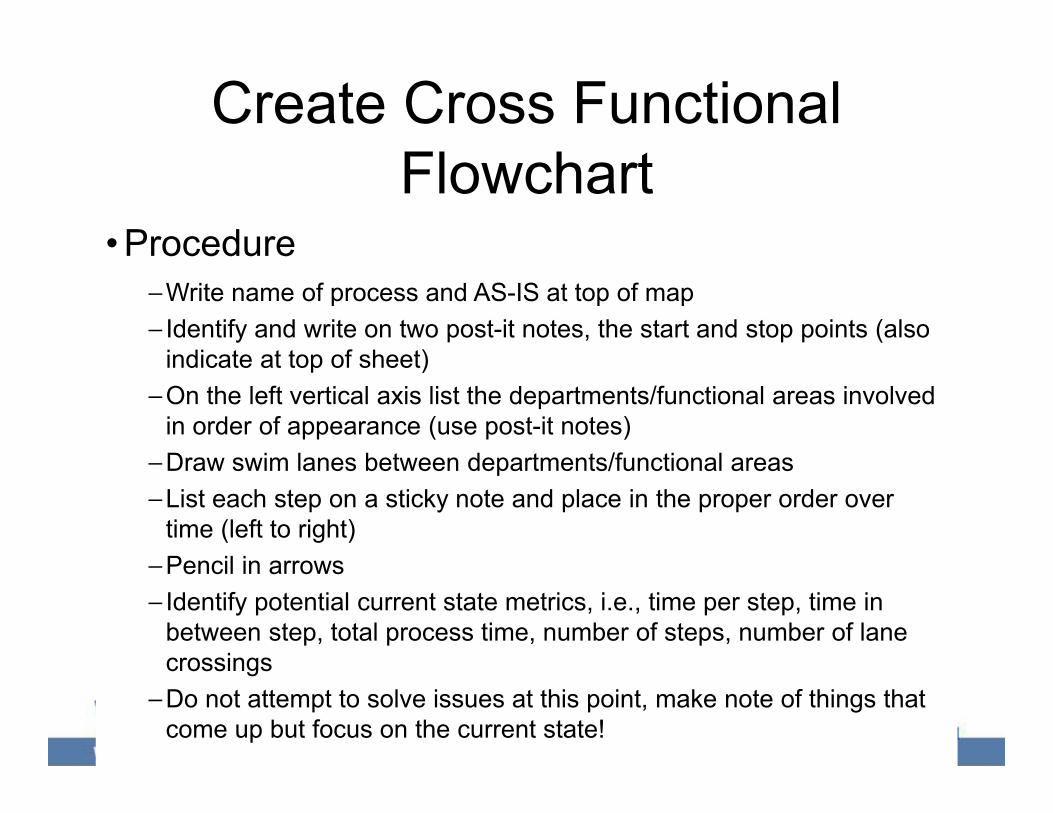
Create Cross Functional Flowchart
• Procedure–Write name of process and AS-IS at top of map– Identify and write on two post-it notes, the start and stop points (also
indicate at top of sheet)–On the left vertical axis list the departments/functional areas involved
in order of appearance (use post-it notes)–Draw swim lanes between departments/functional areas–List each step on a sticky note and place in the proper order over
time (left to right)–Pencil in arrows– Identify potential current state metrics, i.e., time per step, time in
between step, total process time, number of steps, number of lane crossings
–Do not attempt to solve issues at this point, make note of things that come up but focus on the current state!
Create Cross Functional Flowchart
•Group Exercise– Map the new hire process
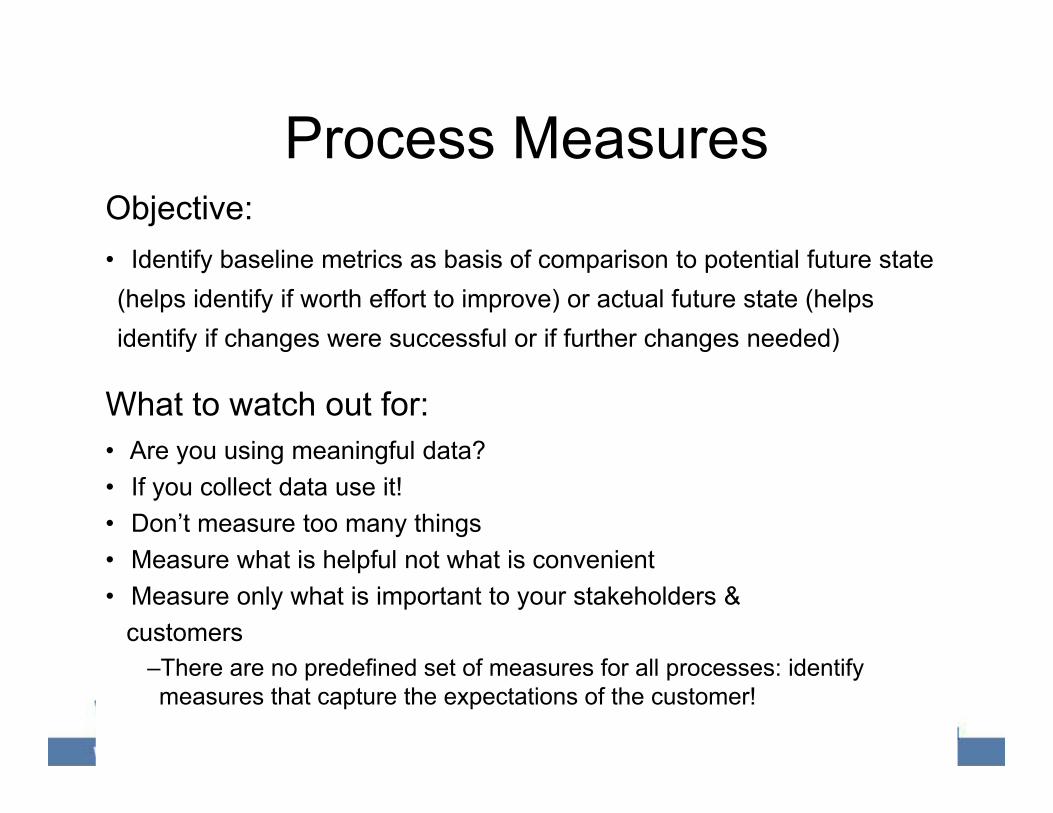
Process MeasuresObjective:• Identify baseline metrics as basis of comparison to potential future state (helps identify if worth effort to improve) or actual future state (helps identify if changes were successful or if further changes needed)
What to watch out for:• Are you using meaningful data? • If you collect data use it!• Don’t measure too many things• Measure what is helpful not what is convenient• Measure only what is important to your stakeholders &
customers–There are no predefined set of measures for all processes: identify measures that capture the expectations of the customer!
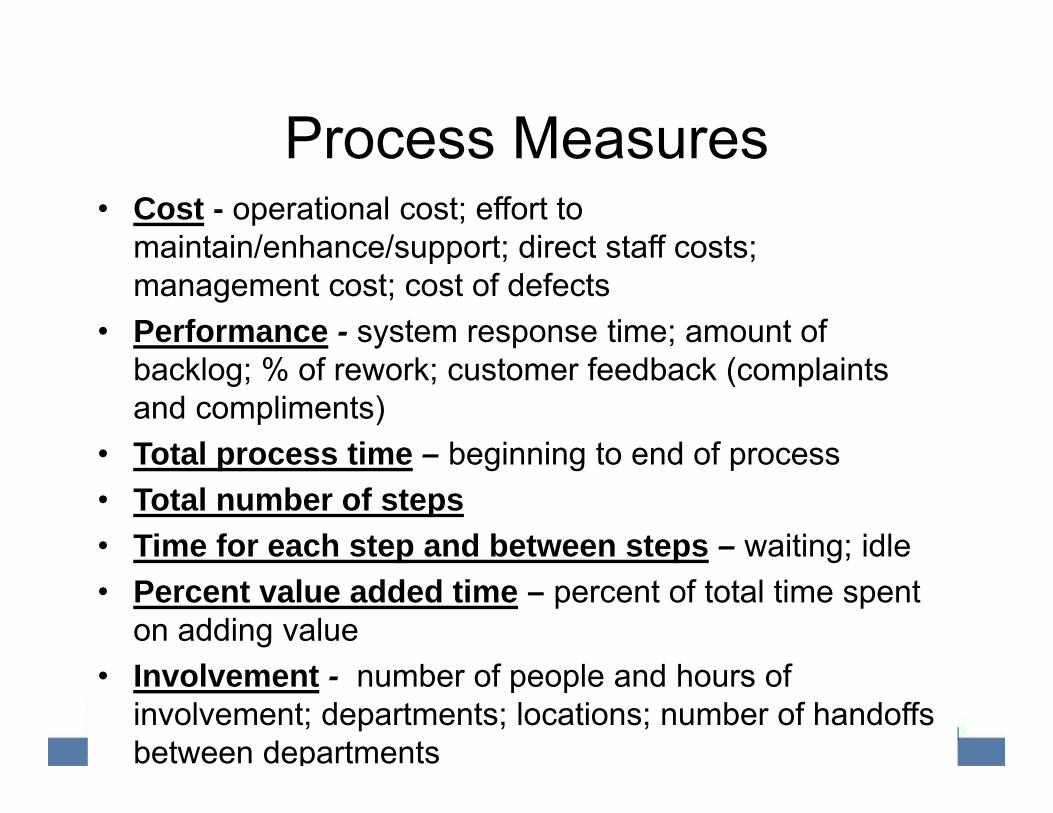
Process Measures• Cost - operational cost; effort to
maintain/enhance/support; direct staff costs; management cost; cost of defects
• Performance - system response time; amount of backlog; % of rework; customer feedback (complaints and compliments)
• Total process time – beginning to end of process• Total number of steps• Time for each step and between steps – waiting; idle• Percent value added time – percent of total time spent
on adding value• Involvement - number of people and hours of
involvement; departments; locations; number of handoffs between departments
Process Measures• Problems must be quantified, exposed and confronted;
lean cannot address an unacknowledged issue• If you can measure it, you can change it• MEASURE RESULTS, not effort and process
compliance
Your recommendations are only as good as your analysis; your analysis is only as good as your data; your data is only as good as your measurement system…DATA INTEGRITY IS THE FOUNDATION OF A CREDIBLE PROJECT
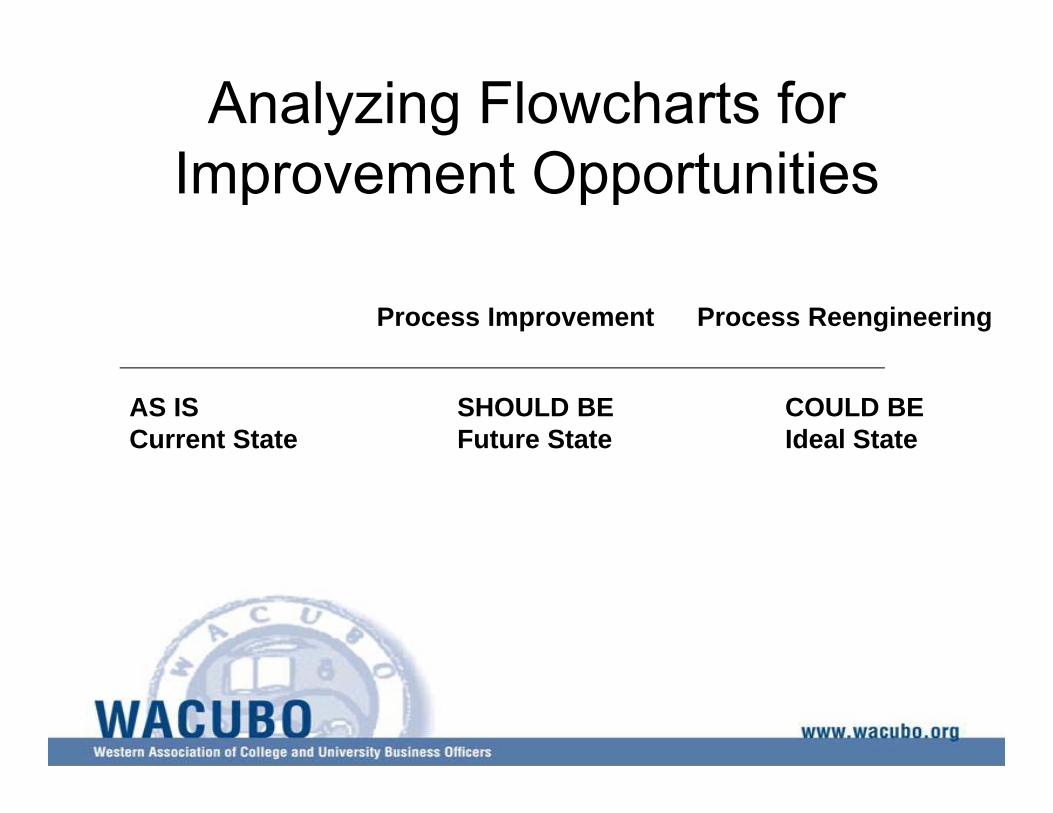
Analyzing Flowcharts for Improvement Opportunities
AS ISCurrent State
SHOULD BEFuture State
COULD BEIdeal State
Process Improvement Process Reengineering
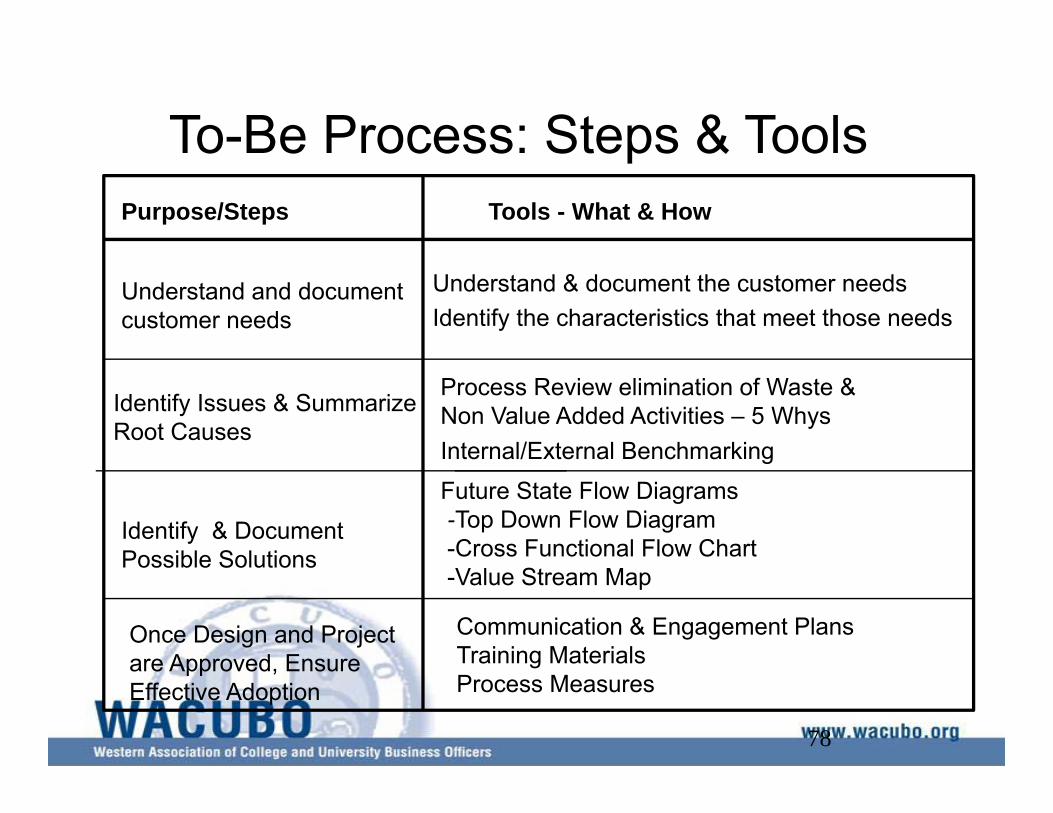
To-Be Process: Steps & Tools
78
Purpose/Steps Tools - What & How
Identify & Document Possible Solutions
Internal/External Benchmarking
Once Design and Project are Approved, Ensure Effective Adoption
Communication & Engagement PlansTraining MaterialsProcess Measures
Future State Flow Diagrams-Top Down Flow Diagram-Cross Functional Flow Chart-Value Stream Map
Identify Issues & Summarize Root Causes
Process Review elimination of Waste & Non Value Added Activities – 5 Whys
Understand and document customer needs
Understand & document the customer needsIdentify the characteristics that meet those needs
Analyzing Flowcharts for Improvement Opportunities
• Identify future state ‘should be’ map – Where you can be in 30/60/90 days with
current resources• Identify ideal state ‘could be’ map
– Longer term with automation/technology or other resources/infrastructure not yet in place
– Consider strategic vision and where organization/department wants to be
Analyzing Flowcharts for Improvement Opportunities
•What to look for:- Any activity that is not important to the customer- Waste or non value added steps: delays rework,
storage, etc.- Frequently repeated steps: inspections, rework,
signatures, etc.- No control points: need to add inspections & decisions- Optimal positioning of process participants- Excessive hand offs / lane changes
Analyzing Flowcharts for Improvement Opportunities
• Improve the process:– Clarify handoffs: what’s needed by whom, when, why– Clarify steps that are not understood– Reorder steps to be more logical– Minimize motion and distance traveled– Minimize time to perform a task– Ensure appropriate resources are used/available– Ensure appropriate amounts are produced/worked
• Activities can be….- Combined- Run concurrently, instead in serial- Made faster or reduce labor required via automation- Eliminated if proven to be unnecessary- Add steps if they are early and prevent rework later
Analyzing Flowcharts for Improvement Opportunities
Continually ask ‘why this activity/step is necessary’
Value Stream Mapping (VSM)
What is a Value Stream?A value stream is all the steps, both value
creating and non value creating, required to complete a product or service from beginning to end
VSM: It’s Not Just Another Processing Mapping Tool!
• Uses a systems perspective• Focuses on customer requirements• Links work and information flow• Documents delivery and quality
performance• Highlights problems• Allows process redesign to meet specific
agreed-upon objectives
Value Stream Mapping: WhyVSM helps us:• understand how the process works now and
how well it’s working• expose waste and problems with flow in the
value stream• reach agreements on what changes need to
be made to improve the process• reach agreements on how to ensure that
those changes are made
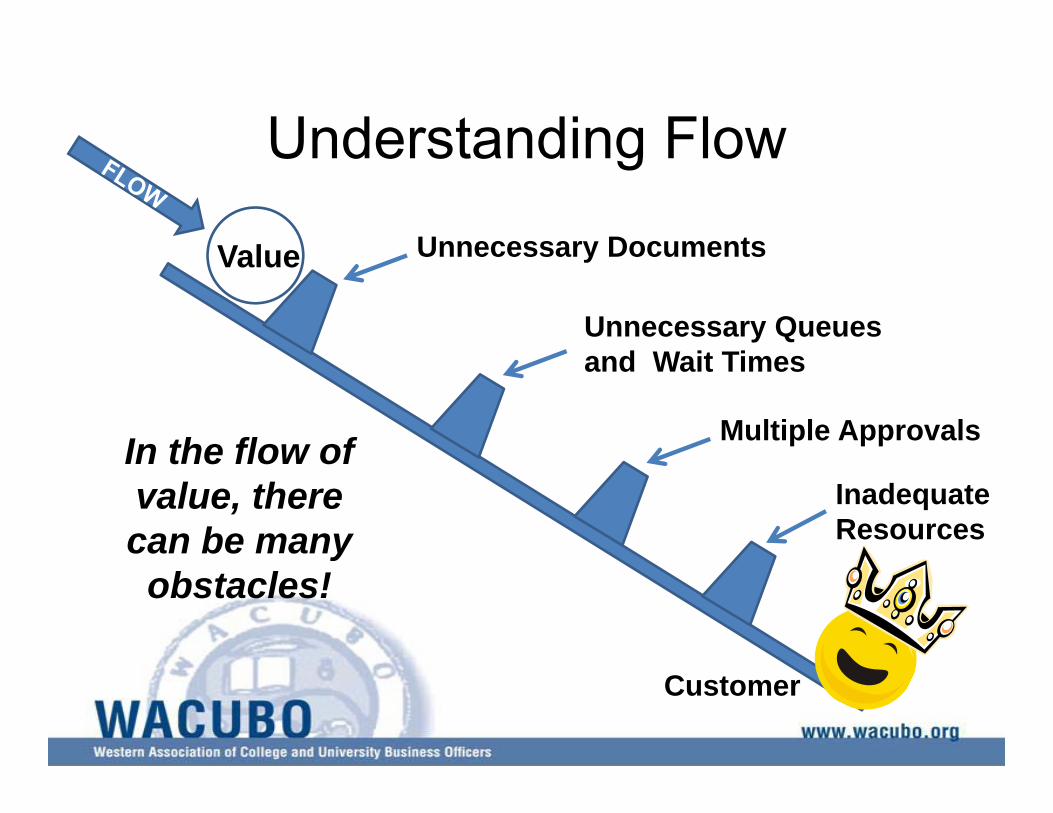
Understanding Flow
Value
In the flow of value, there can be many obstacles!
Unnecessary Documents
Unnecessary Queues and Wait Times
Multiple Approvals
Inadequate Resources
Customer
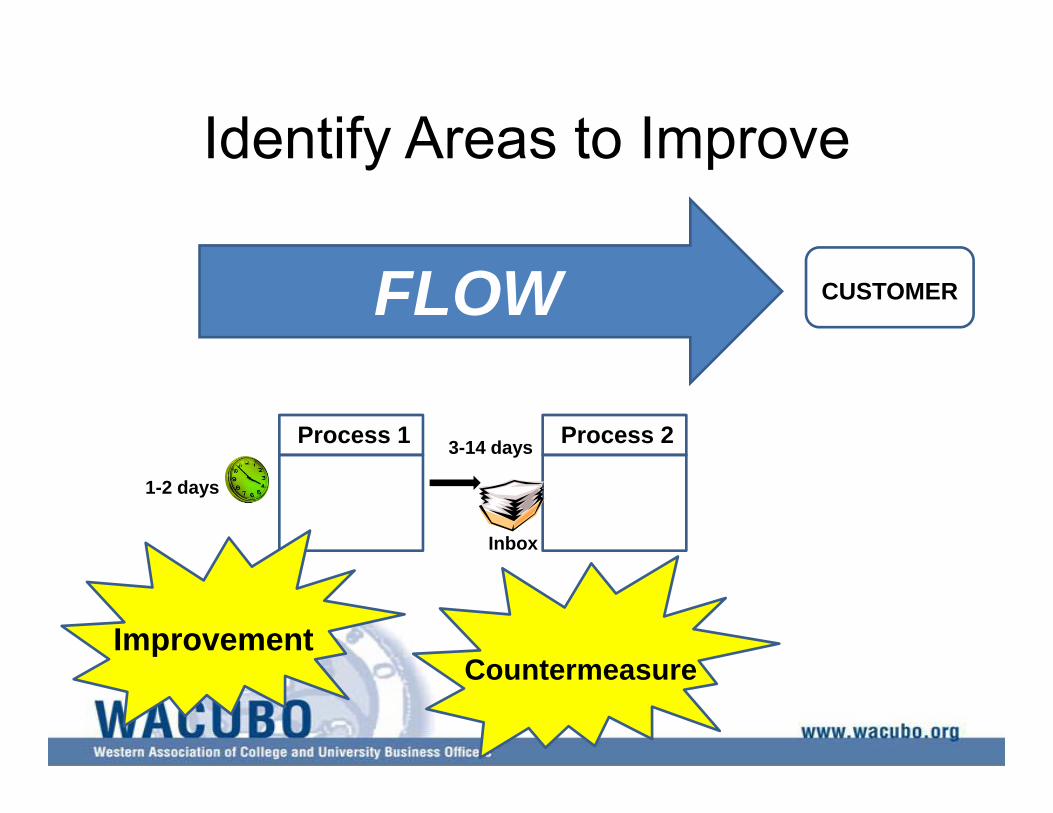
Identify Areas to Improve
Process 1 Process 2
Inbox
3-14 days
1-2 days
ImprovementCountermeasure
FLOW CUSTOMER
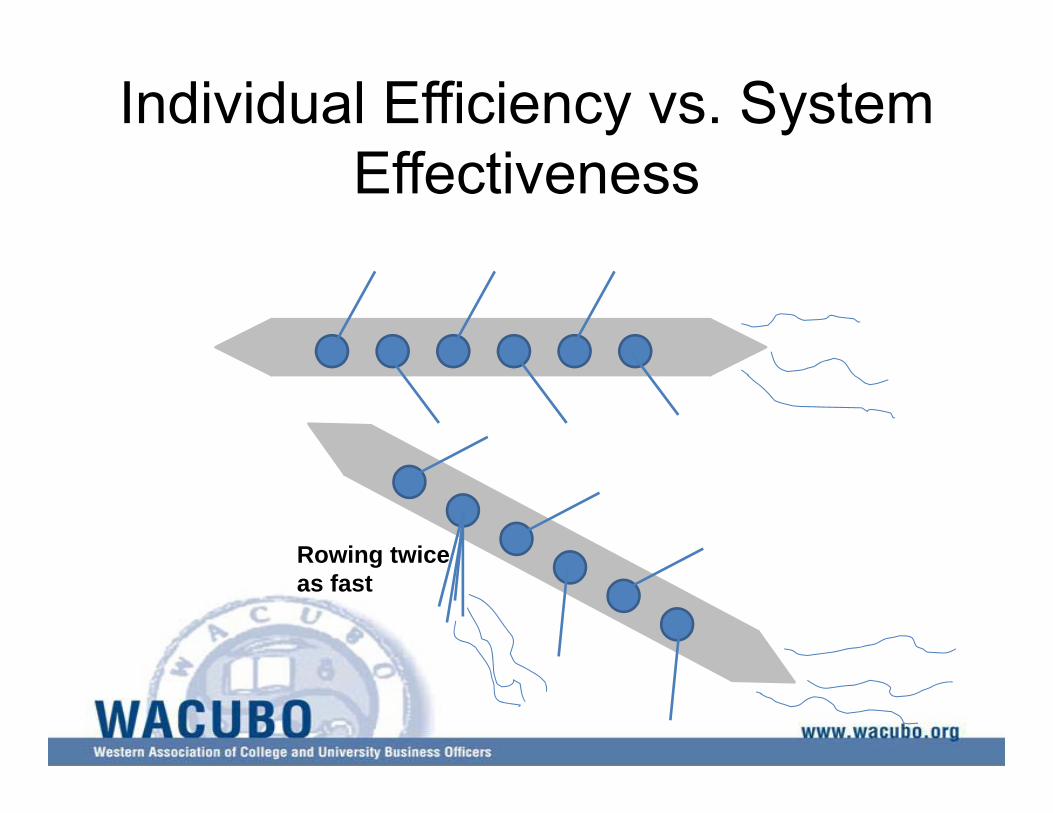
Individual Efficiency vs. System Effectiveness
Rowing twiceas fast
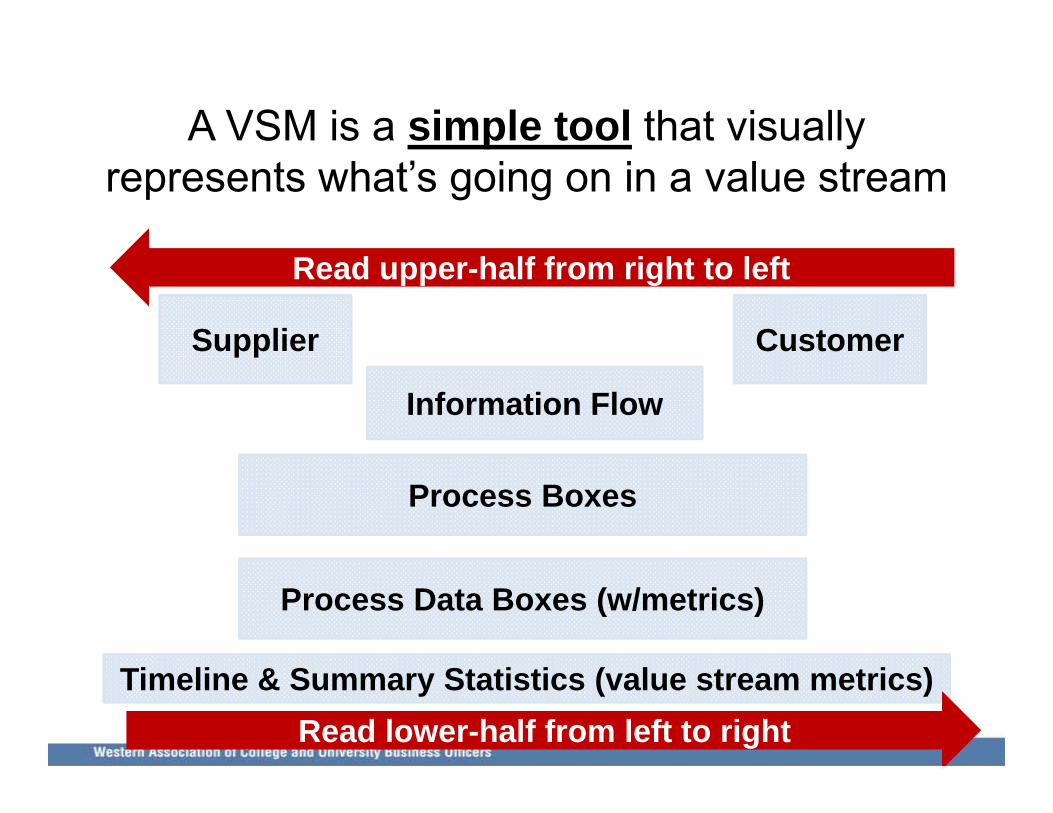
A VSM is a simple tool that visually represents what’s going on in a value stream
Read upper-half from right to left
Supplier Customer
Information Flow
Process Boxes
Process Data Boxes (w/metrics)
Timeline & Summary Statistics (value stream metrics)Read lower-half from left to right
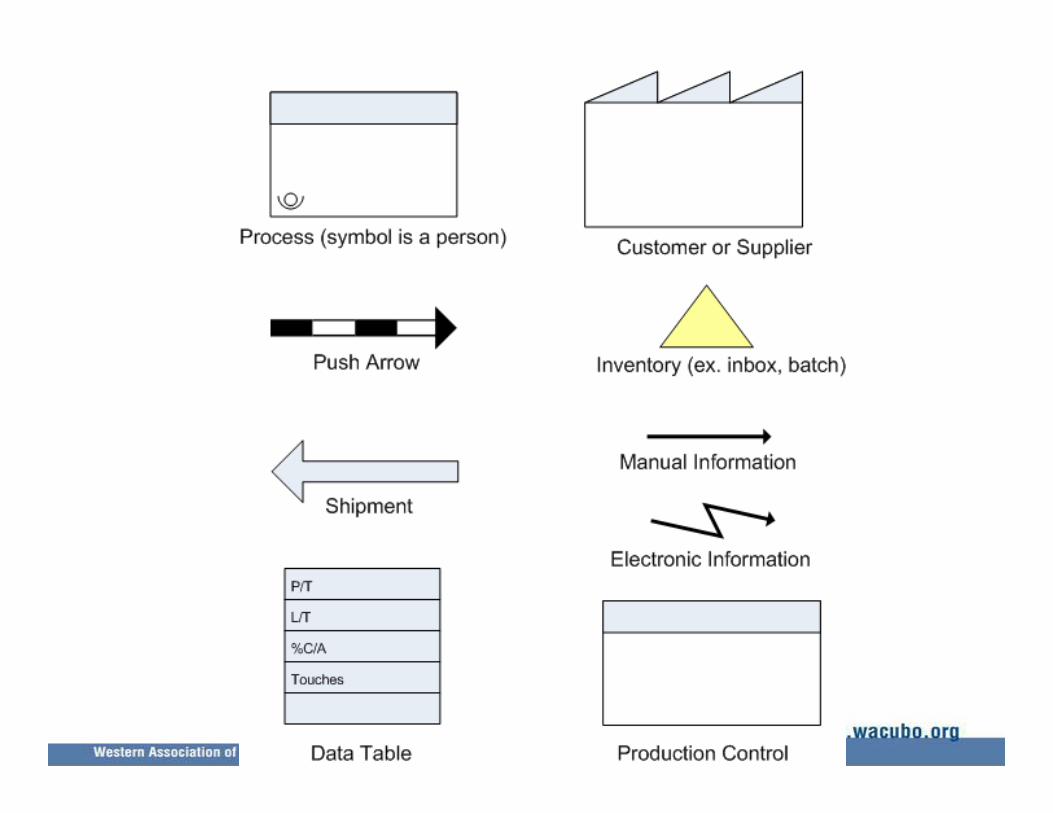
Typical VSM Icons

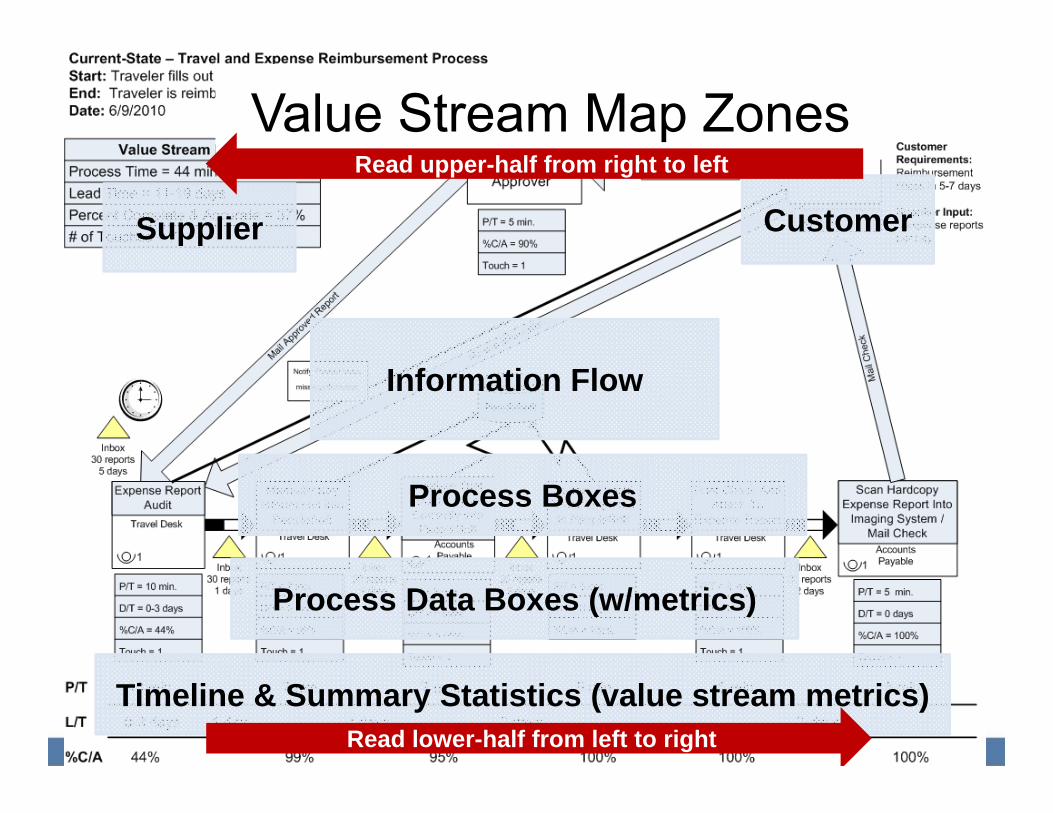
Value Stream Map Zones
Supplier Customer
Information Flow
Process Boxes
Process Data Boxes (w/metrics)
Timeline & Summary Statistics (value stream metrics)Read lower-half from left to right
Read upper-half from right to left
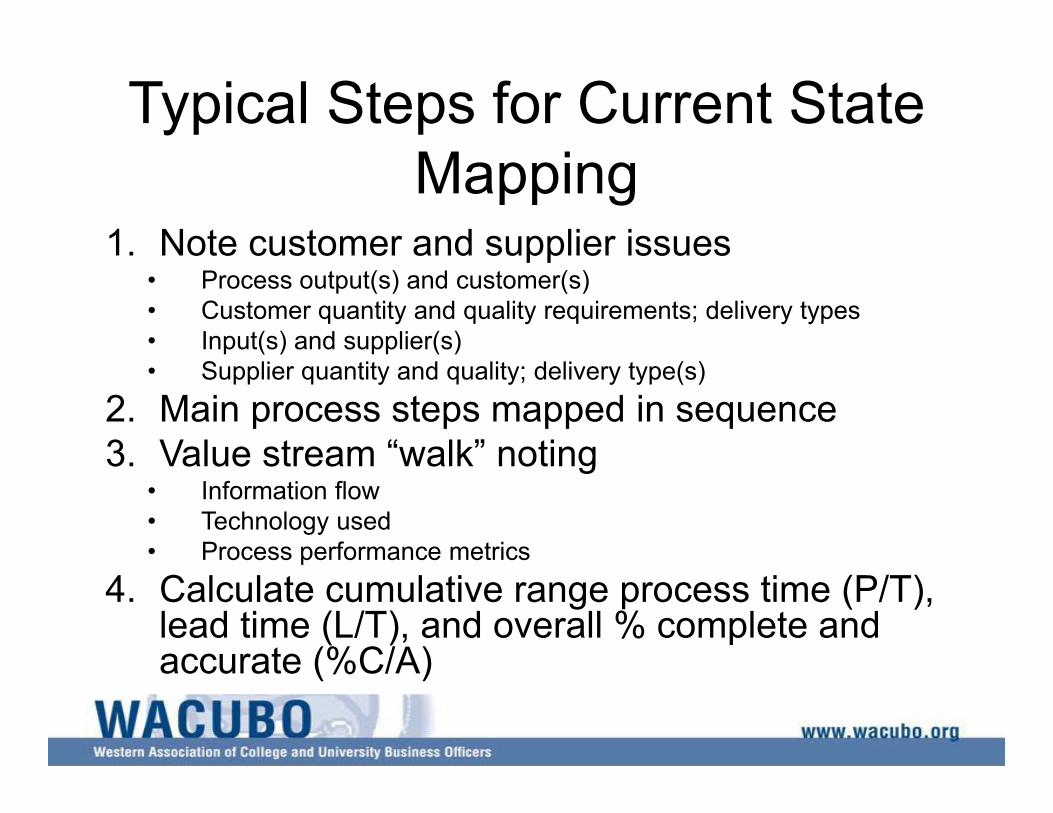
Typical Steps for Current State Mapping
1. Note customer and supplier issues• Process output(s) and customer(s)• Customer quantity and quality requirements; delivery types• Input(s) and supplier(s)• Supplier quantity and quality; delivery type(s)
2. Main process steps mapped in sequence3. Value stream “walk” noting
• Information flow• Technology used• Process performance metrics
4. Calculate cumulative range process time (P/T), lead time (L/T), and overall % complete and accurate (%C/A)
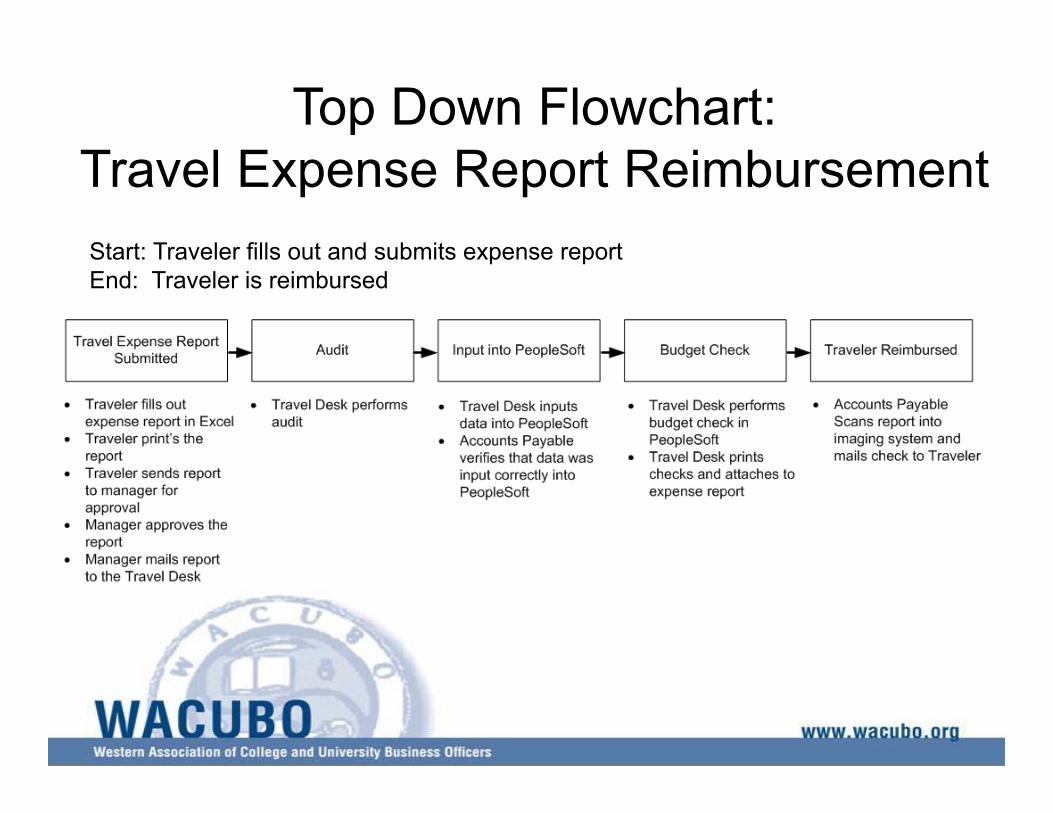
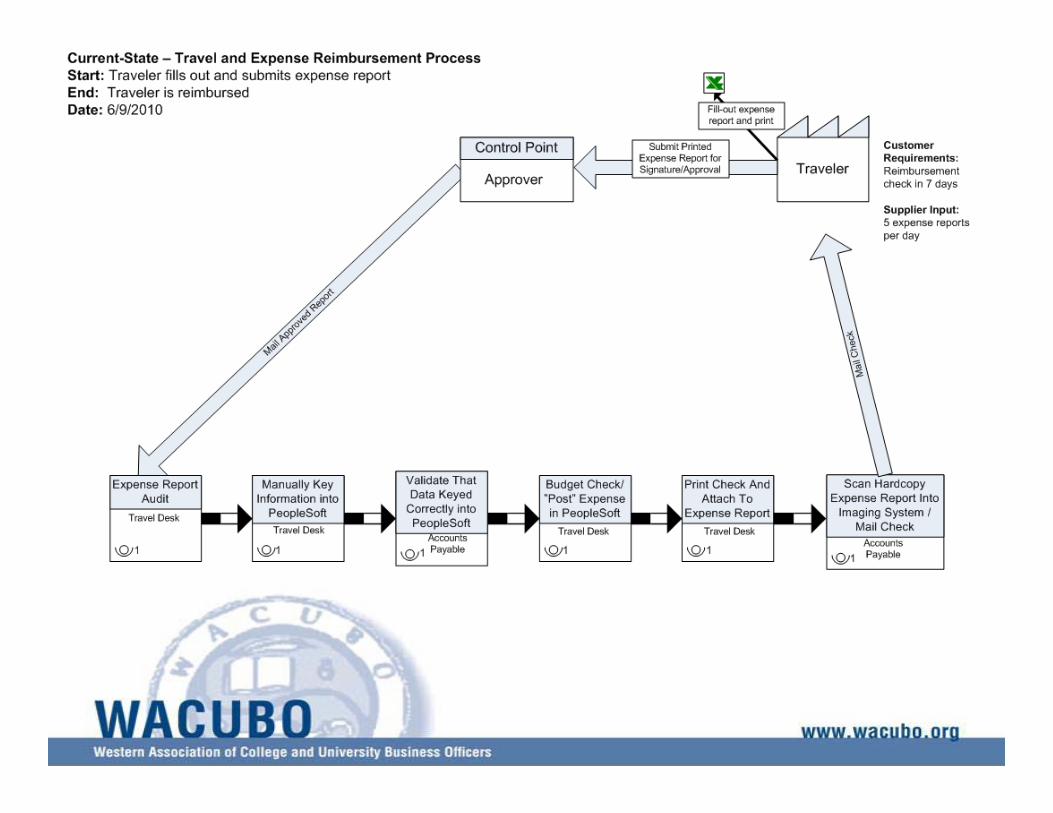
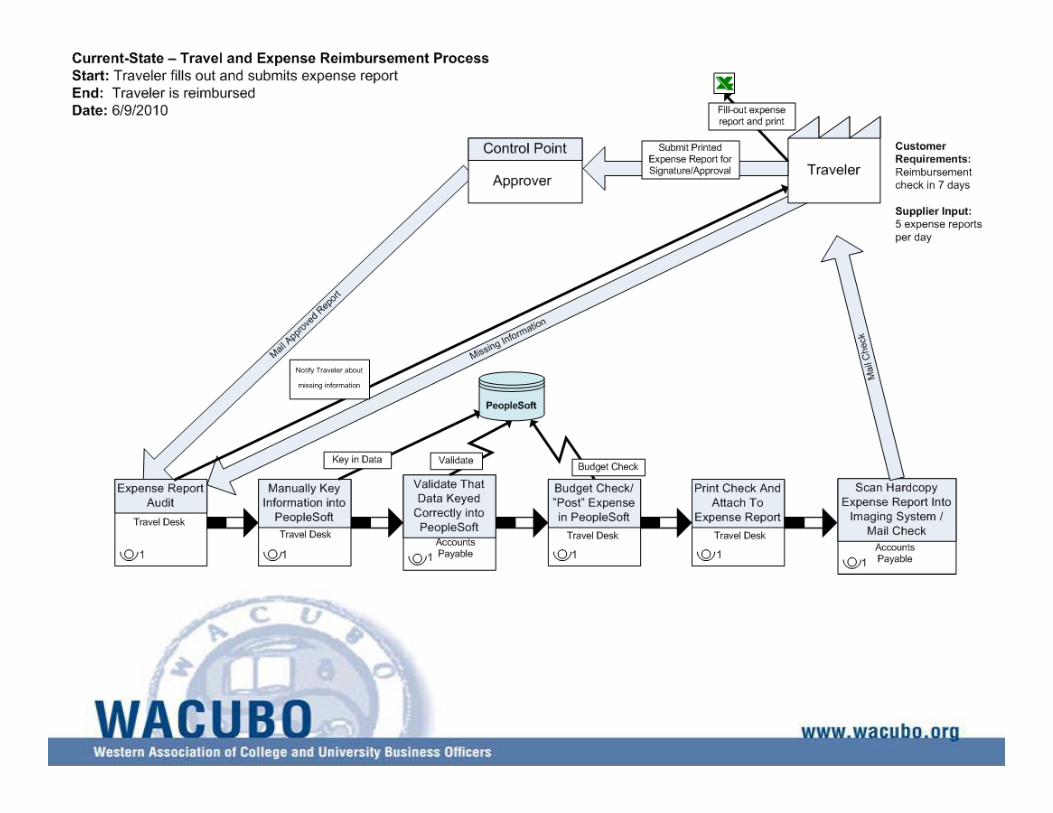
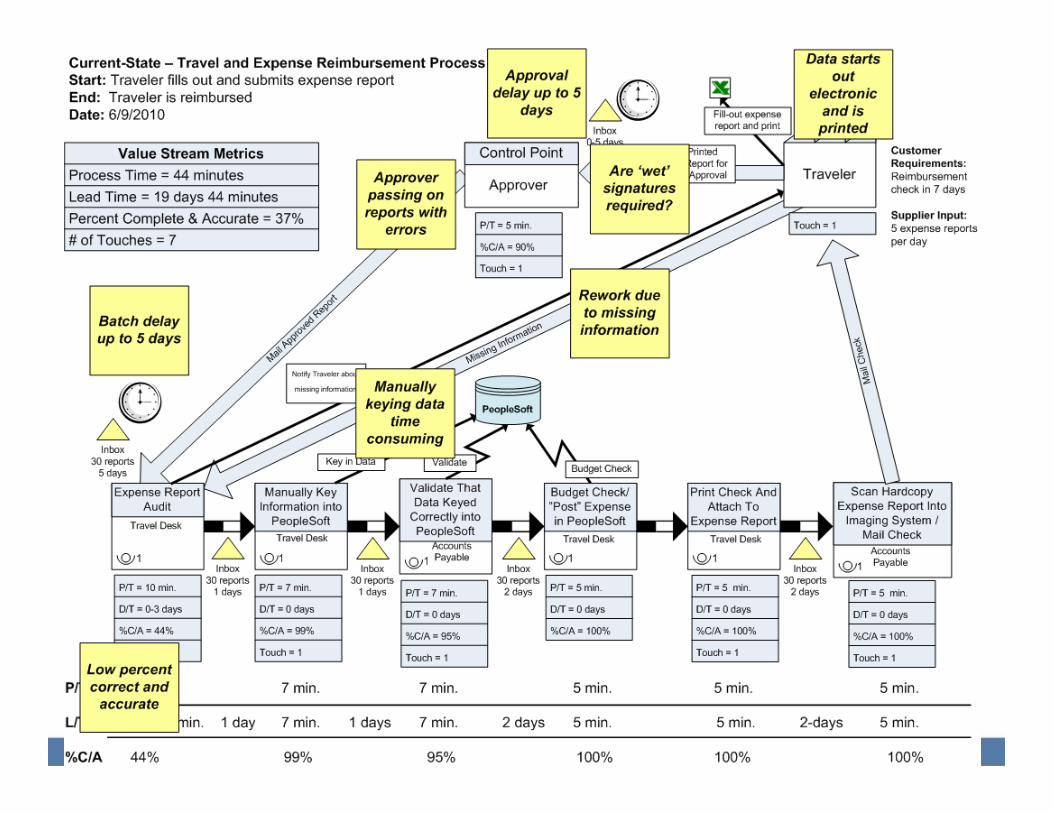
Top Down Flowchart: Travel Expense Report ReimbursementStart: Traveler fills out and submits expense reportEnd: Traveler is reimbursed
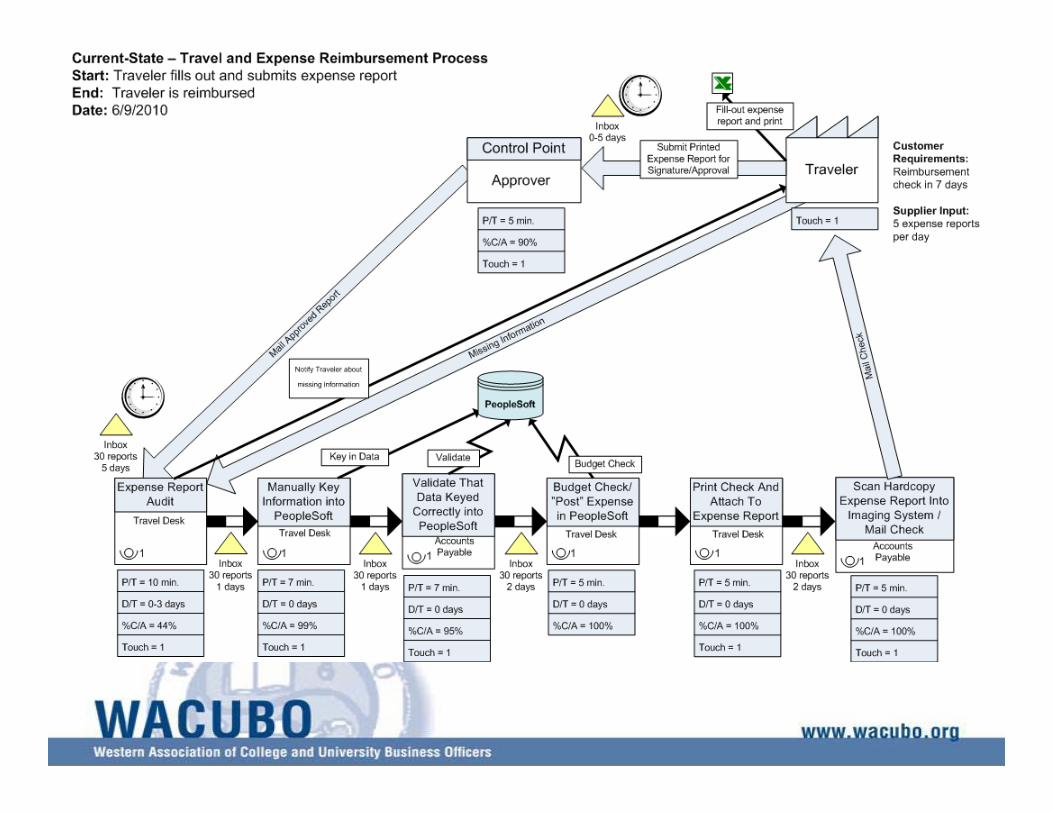
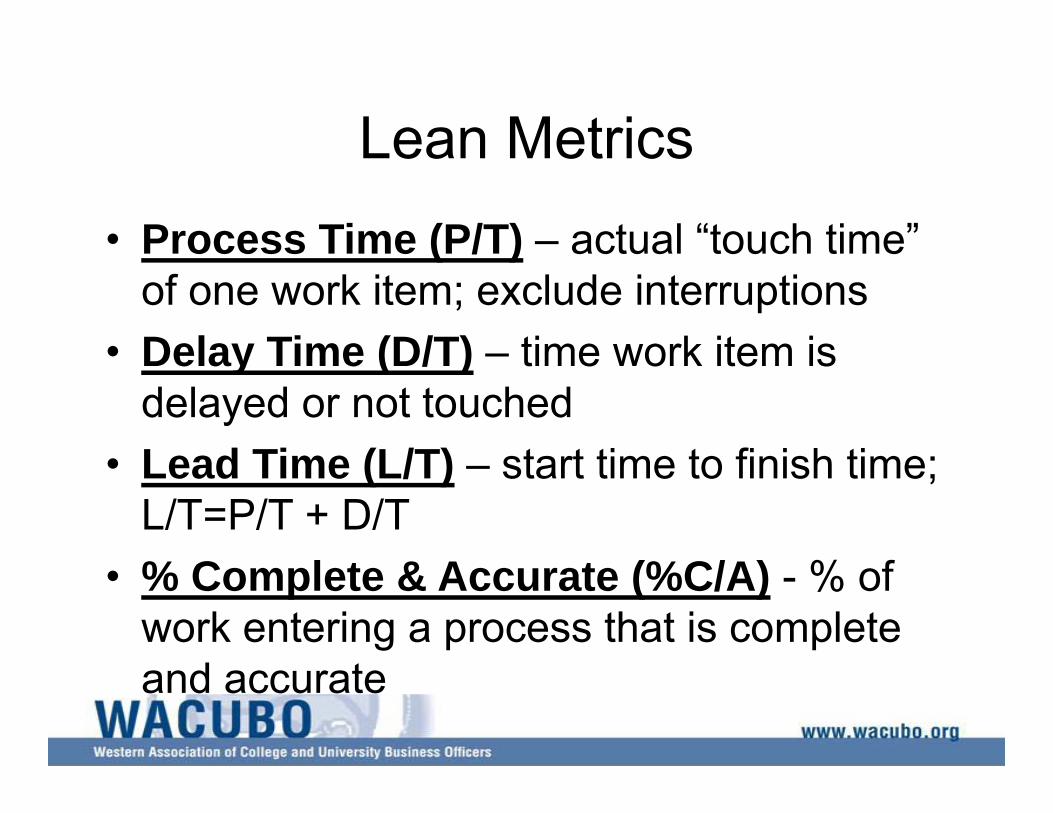
Lean Metrics• Process Time (P/T) – actual “touch time”
of one work item; exclude interruptions• Delay Time (D/T) – time work item is
delayed or not touched• Lead Time (L/T) – start time to finish time;
L/T=P/T + D/T• % Complete & Accurate (%C/A) - % of
work entering a process that is complete and accurate

Analyzing the Current State VSM: What’s a Problem?
A “problem” is… the gap between the way things are now and the way they’re supposed to be, or you want them to be, in the future
Problem CategoriesTo improve a process look for problems in:• Meeting customer requirements• Making work flow• Doing the work• Managing to improve and learn
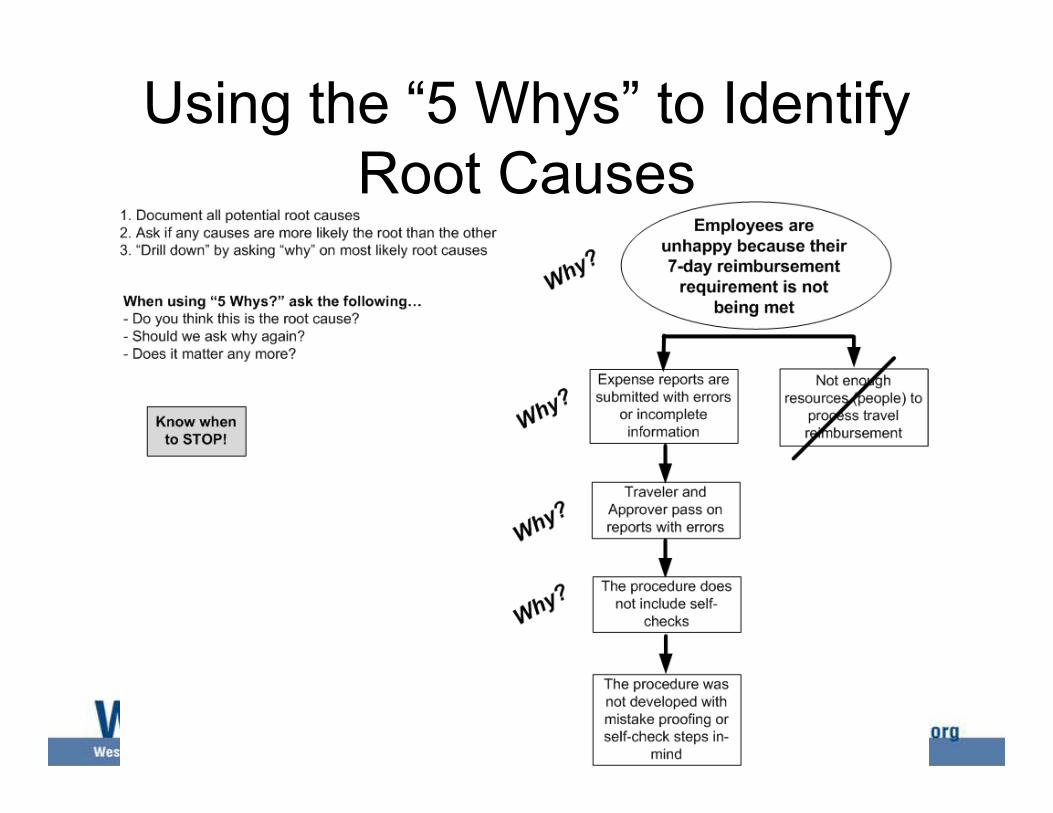
Using the “5 Whys” to Identify Root Causes
Identifying Current State Problems: Group Activity
1. Review the current state map2. Write problems on post-its3. Post problems where they appear on the
current state map4. Don’t solve, just identify!
Current State VSM Reflection1. What have you learned thus far that
changes how you think about your work?2. What do you need to think/learn more
about before you use it?3. What can you immediately apply to your
work?
Current State Mapping Tips1. Identify the basic process boxes before
performing the actual walk through.2. Identify the metrics that the team will collect
for each process box.3. Add other information (via visual icons or
metrics) as you observe the process steps in motion.
4. Guard against making the map too unwieldy; start simply, and add boxes as necessary.
Current State Mapping Tips5. Walk the value stream to gather the
performance data associated with creating the value.
6. Ask questions regarding activities and issues you see to understand potential barriers in designing future states.
7. Map the whole value stream as a team. 8. Assign team members specific tasks to
perform in the mapping process.9. Always draw by hand and in pencil.
What is a “Lean Value Stream”?• Value - from the perspective of the
customer• Flow - no waiting or rework• Work - standardized, built-in quality• Monitoring performance - milestones,
checkpoints, and lean metrics
Creating a Future State Map1. Define customer requirements2. Determine scope of change
• Radical vs. incremental3. Make the work flow
• Optimize value creating steps• Apply appropriate lean tools/approaches
Creating a Future State Map4. Improve work quality and reliability
• Control variation• Standardize
5. Monitoring performance • Milestones• Regular checks and reflection• Feedback learning
6. Estimate your results• Quality and process improvements
(% C/A, P/T, L/T)
Quality at the Source• People must be certain that the
product/information they are passing to the next work area is complete and accurate
• People must be given the means to perform inspection at the source, before they pass it along
Techniques for Catching Defects as Close to Source as Possible
• Posted procedures & checklists (for both work steps & quality requirements)
• Self checking (visual confirmations built into work sequence)
• Successive checking (following process checks)• Mistake proofing (automatic error detection)• Zone control (checks before leaving the group or
area)• Product checks (final or functional inspection)• Systems for immediate giving feedback about
abnormalities to the processes where they originated
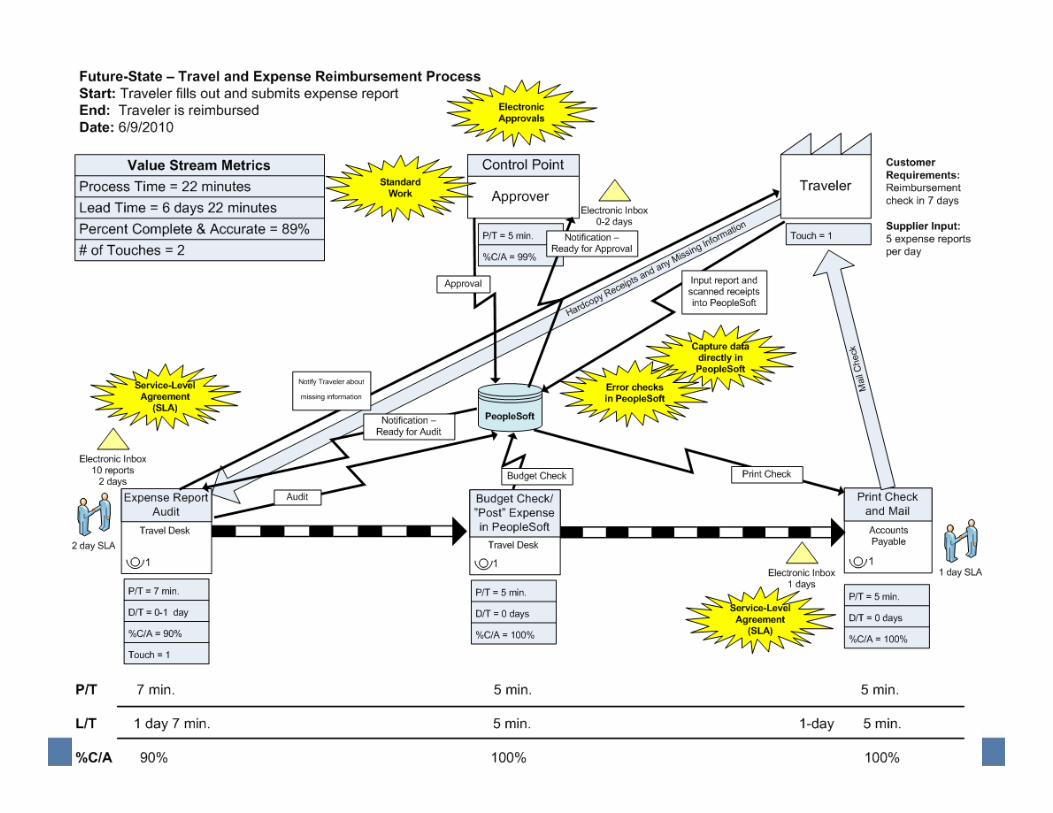
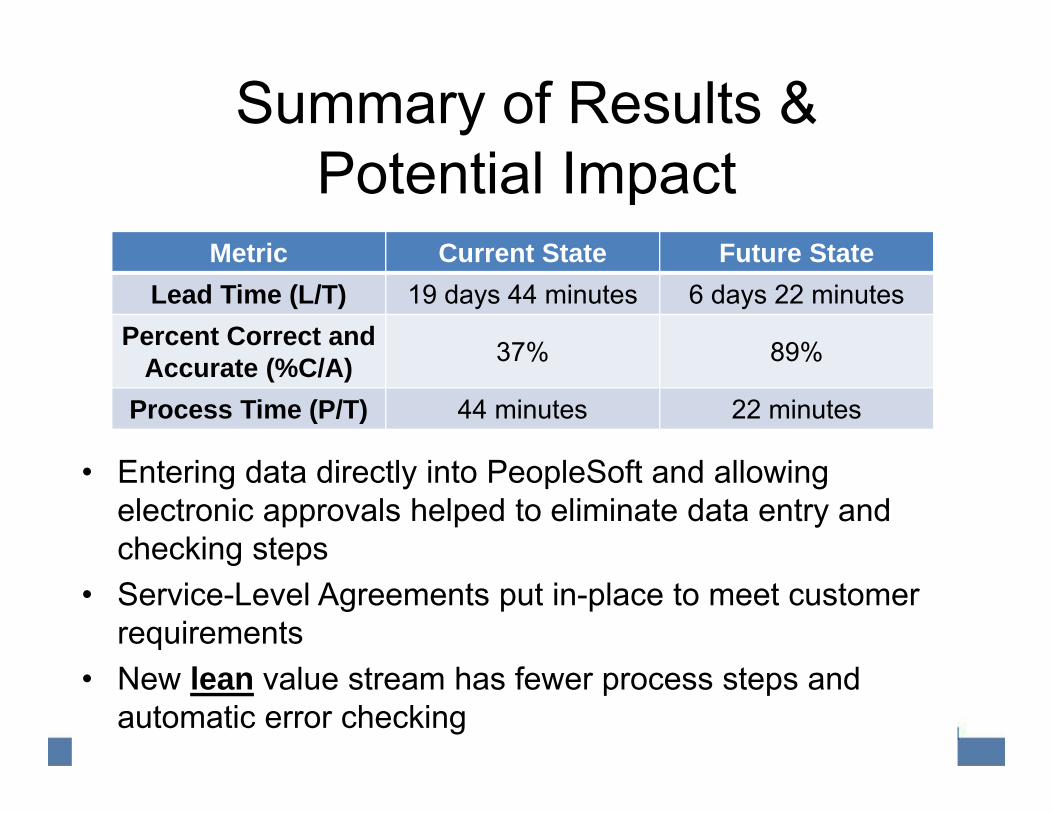
Summary of Results & Potential Impact
• Entering data directly into PeopleSoft and allowing electronic approvals helped to eliminate data entry and checking steps
• Service-Level Agreements put in-place to meet customer requirements
• New lean value stream has fewer process steps and automatic error checking
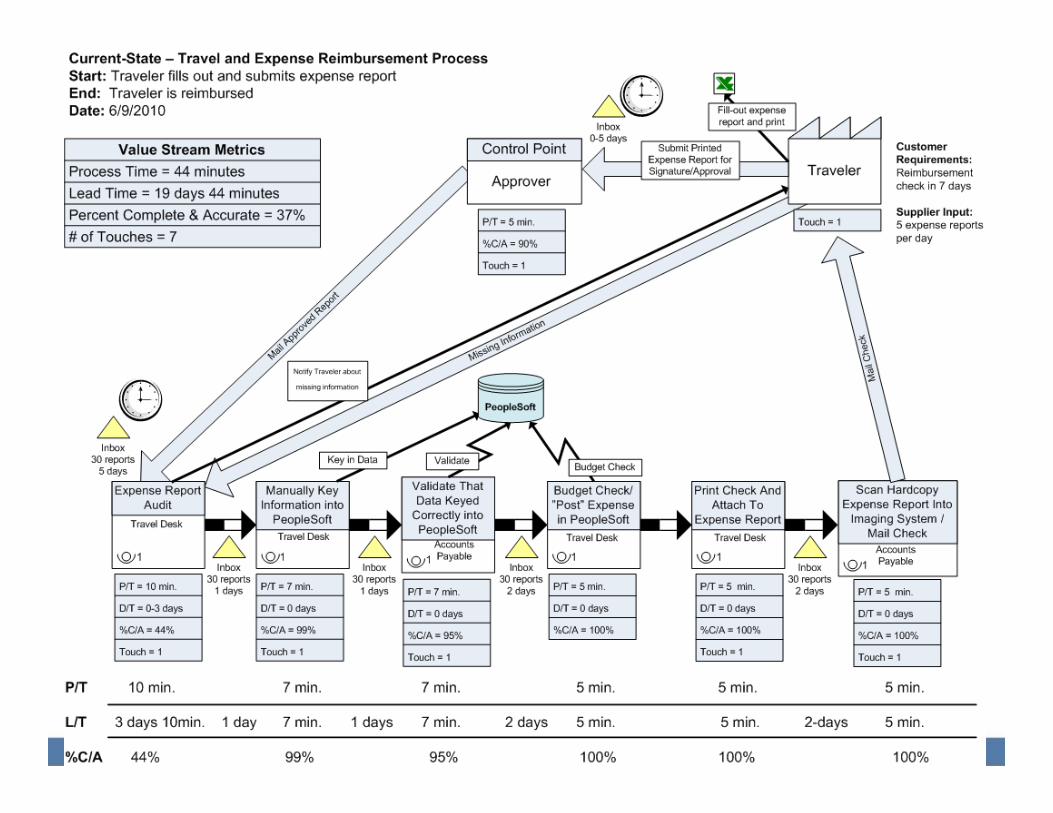
Metric Current State Future StateLead Time (L/T) 19 days 44 minutes 6 days 22 minutes
Percent Correct and Accurate (%C/A) 37% 89%
Process Time (P/T) 44 minutes 22 minutes
Project Identification, Planning & Implementation
Project SelectionLeadership endorsement, dedicated
resources, and commitment to change a process that:
1. Consumes too many resources or has significant quality, cost or delivery problems
2. Has a compelling business case3. Has clear ownership4. Can be mapped, with defined scope and
performance metrics5. Is worth the time and effort to improve
Project Selection• Broken processes/processes in crises may
already be known and identified• Projects can also be identified and prioritized
by conducting organizational assessments and surveys
• Selection criteria will depend on organization• Low hanging fruit• High impact on students• Where is support?
– Organizational wide project vs Individual department
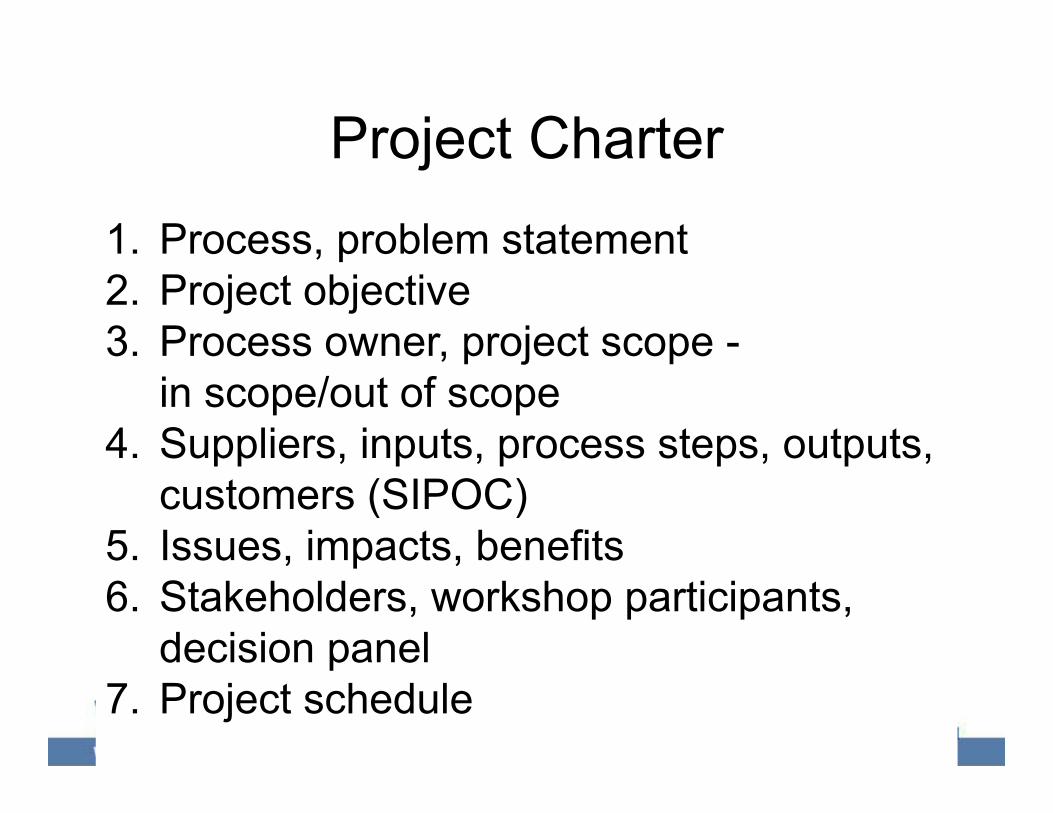
Project Charter1. Process, problem statement2. Project objective3. Process owner, project scope -
in scope/out of scope4. Suppliers, inputs, process steps, outputs,
customers (SIPOC)5. Issues, impacts, benefits6. Stakeholders, workshop participants,
decision panel7. Project schedule
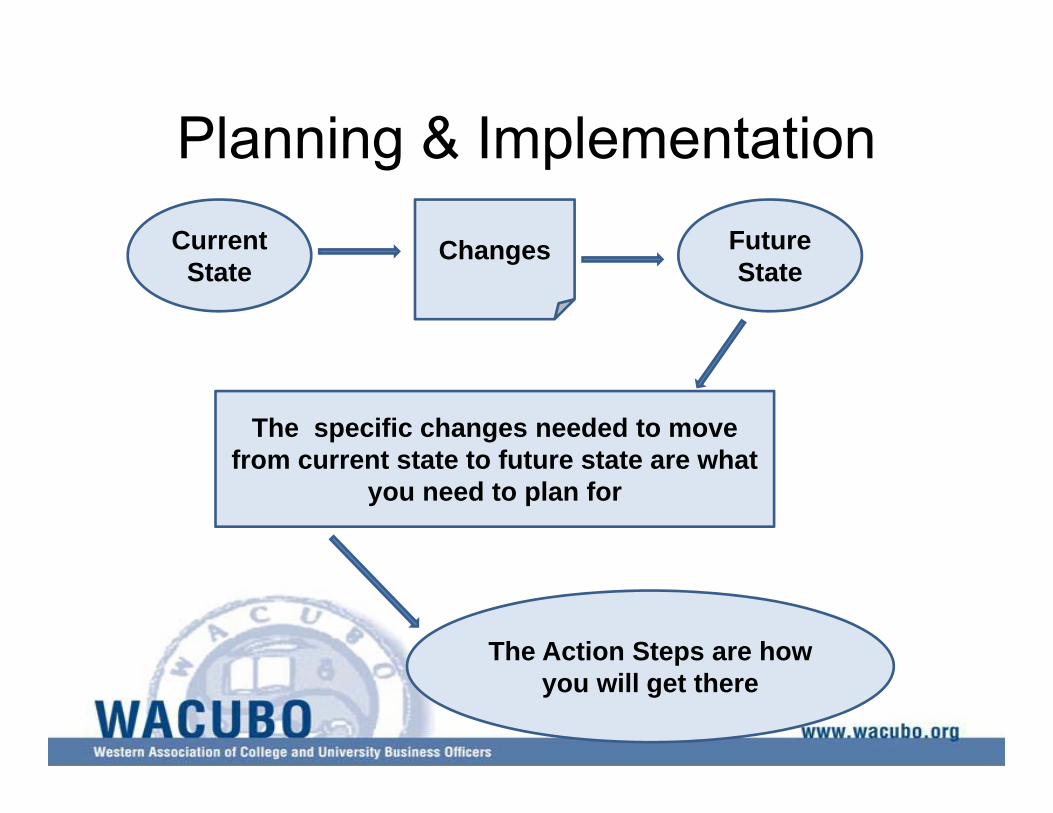
Current State
Changes Future State
The specific changes needed to move from current state to future state are what
you need to plan for
The Action Steps are how you will get there
Planning & Implementation
What is a Plan?A set of agreements for making a
change or series of changes
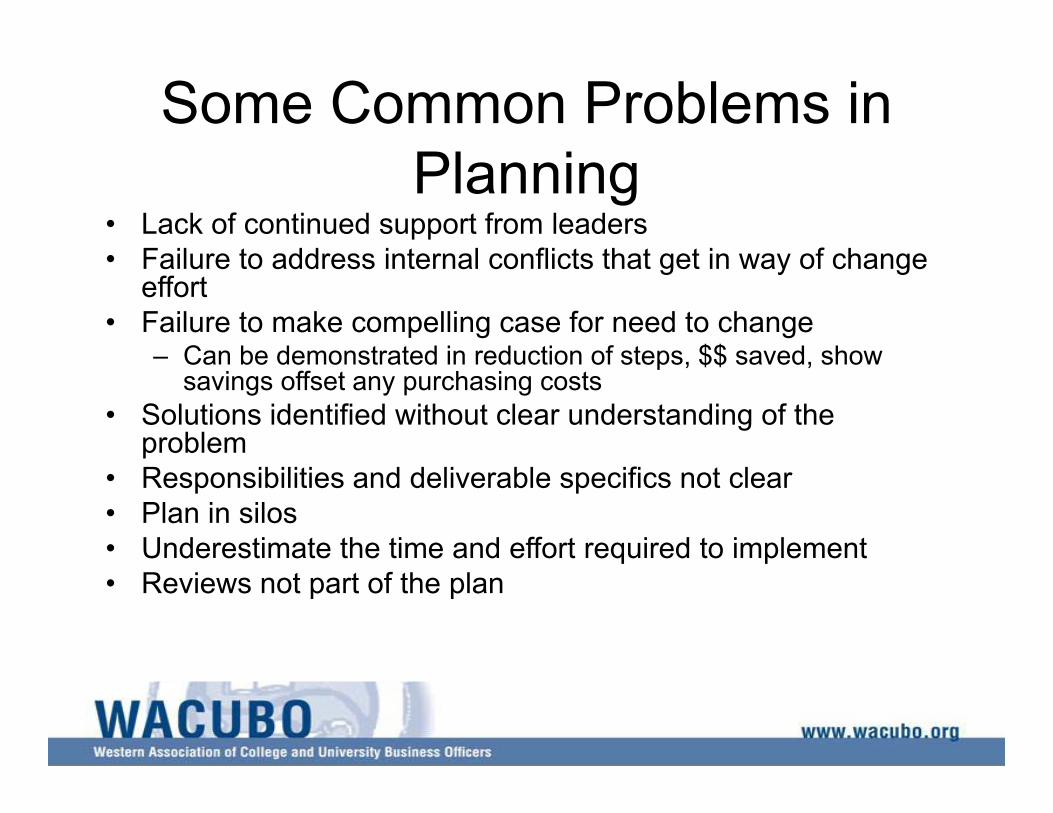
Some Common Problems in Planning
• Lack of continued support from leaders• Failure to address internal conflicts that get in way of change
effort• Failure to make compelling case for need to change
– Can be demonstrated in reduction of steps, $$ saved, show savings offset any purchasing costs
• Solutions identified without clear understanding of the problem
• Responsibilities and deliverable specifics not clear• Plan in silos• Underestimate the time and effort required to implement• Reviews not part of the plan
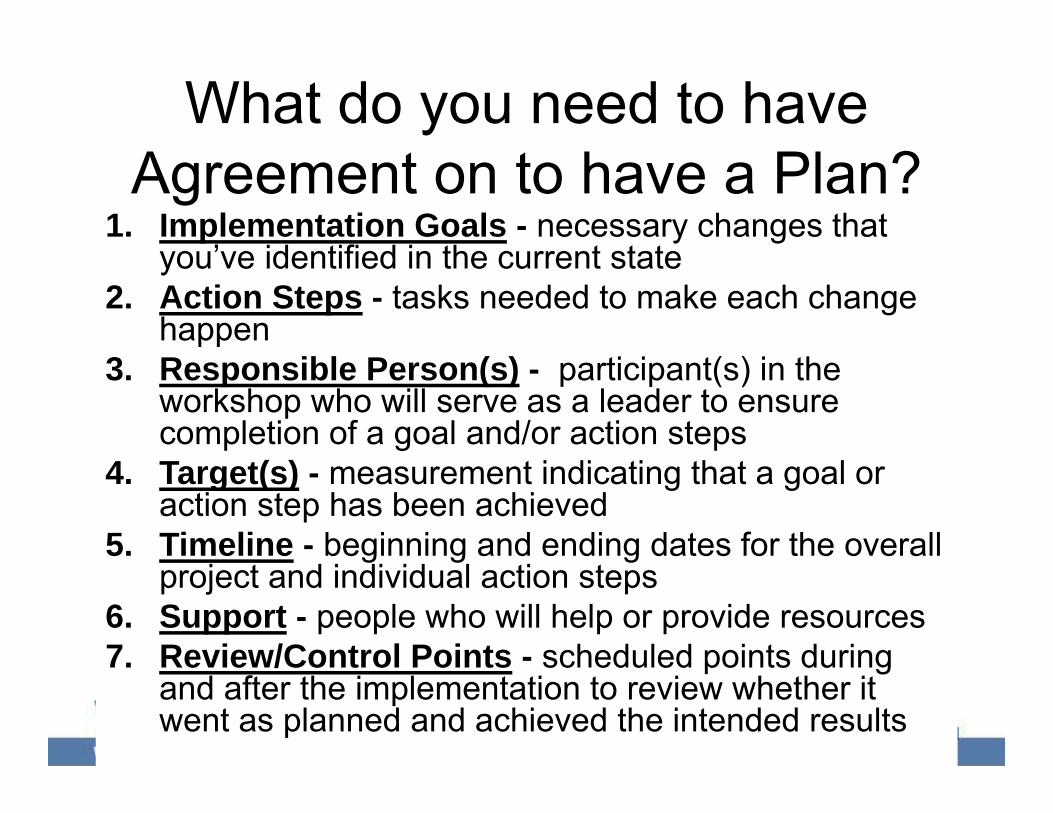
What do you need to have Agreement on to have a Plan?
1. Implementation Goals - necessary changes that you’ve identified in the current state
2. Action Steps - tasks needed to make each change happen
3. Responsible Person(s) - participant(s) in the workshop who will serve as a leader to ensure completion of a goal and/or action steps
4. Target(s) - measurement indicating that a goal or action step has been achieved
5. Timeline - beginning and ending dates for the overall project and individual action steps
6. Support - people who will help or provide resources7. Review/Control Points - scheduled points during
and after the implementation to review whether it went as planned and achieved the intended results
Goals vs. Actions
A goal is not the same as an action.It is an outcome or new condition
that needs to be achieved
An action is what you do to get the outcome (your real purpose)
You need commitment to the outcome----not just to the action

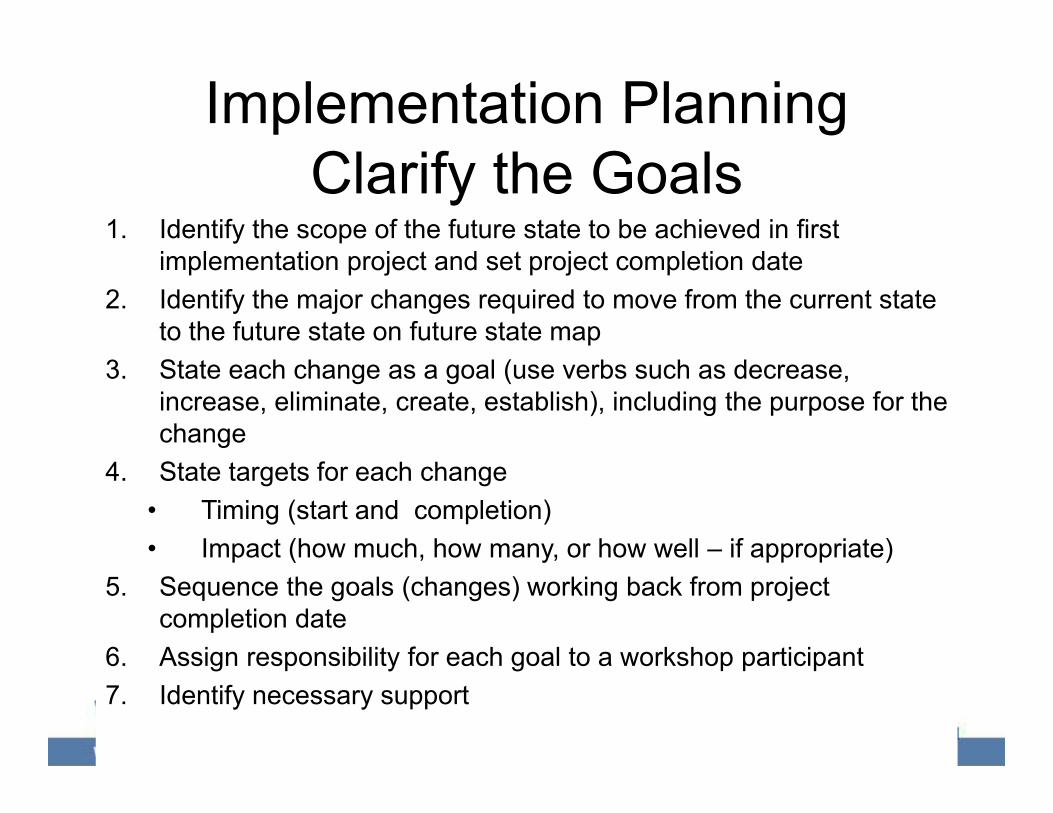
Implementation PlanningClarify the Goals
1. Identify the scope of the future state to be achieved in first implementation project and set project completion date
2. Identify the major changes required to move from the current state to the future state on future state map
3. State each change as a goal (use verbs such as decrease, increase, eliminate, create, establish), including the purpose for the change
4. State targets for each change• Timing (start and completion)• Impact (how much, how many, or how well – if appropriate)
5. Sequence the goals (changes) working back from project completion date
6. Assign responsibility for each goal to a workshop participant7. Identify necessary support
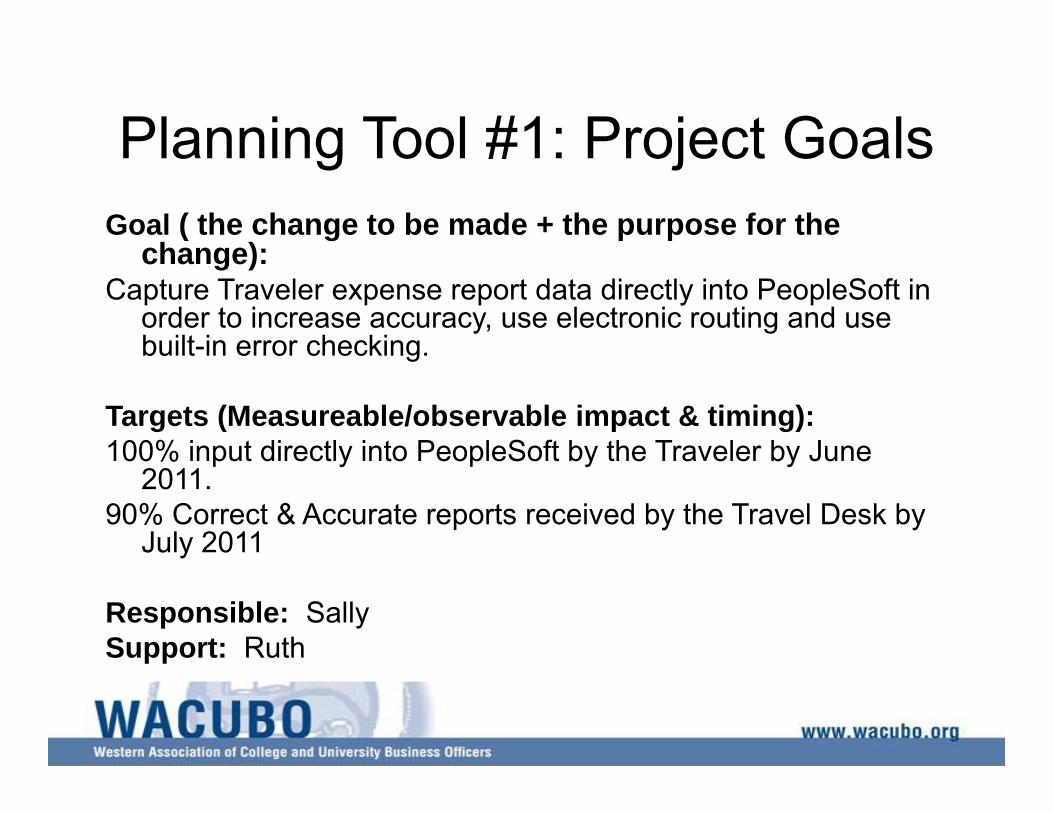
Planning Tool #1: Project GoalsGoal ( the change to be made + the purpose for the
change):Capture Traveler expense report data directly into PeopleSoft in
order to increase accuracy, use electronic routing and use built-in error checking.
Targets (Measureable/observable impact & timing):100% input directly into PeopleSoft by the Traveler by June
2011.90% Correct & Accurate reports received by the Travel Desk by
July 2011
Responsible: SallySupport: Ruth
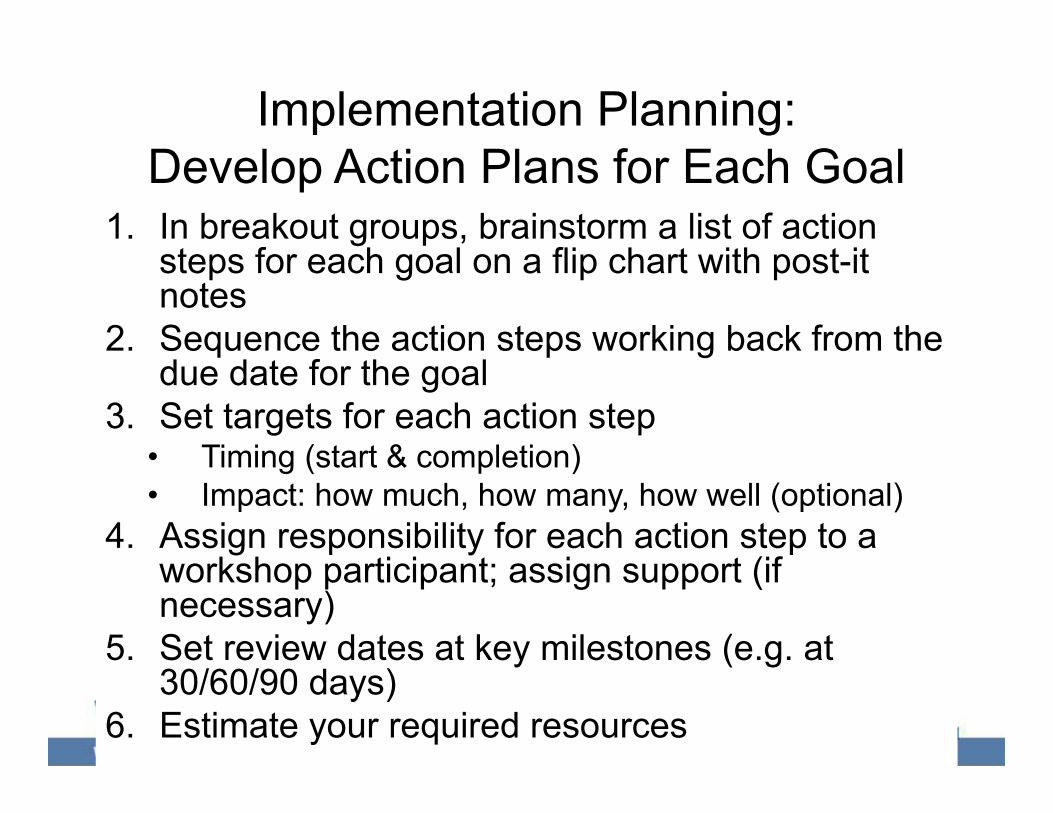
Implementation Planning:Develop Action Plans for Each Goal
1. In breakout groups, brainstorm a list of action steps for each goal on a flip chart with post-it notes
2. Sequence the action steps working back from the due date for the goal
3. Set targets for each action step• Timing (start & completion)• Impact: how much, how many, how well (optional)
4. Assign responsibility for each action step to a workshop participant; assign support (if necessary)
5. Set review dates at key milestones (e.g. at 30/60/90 days)
6. Estimate your required resources
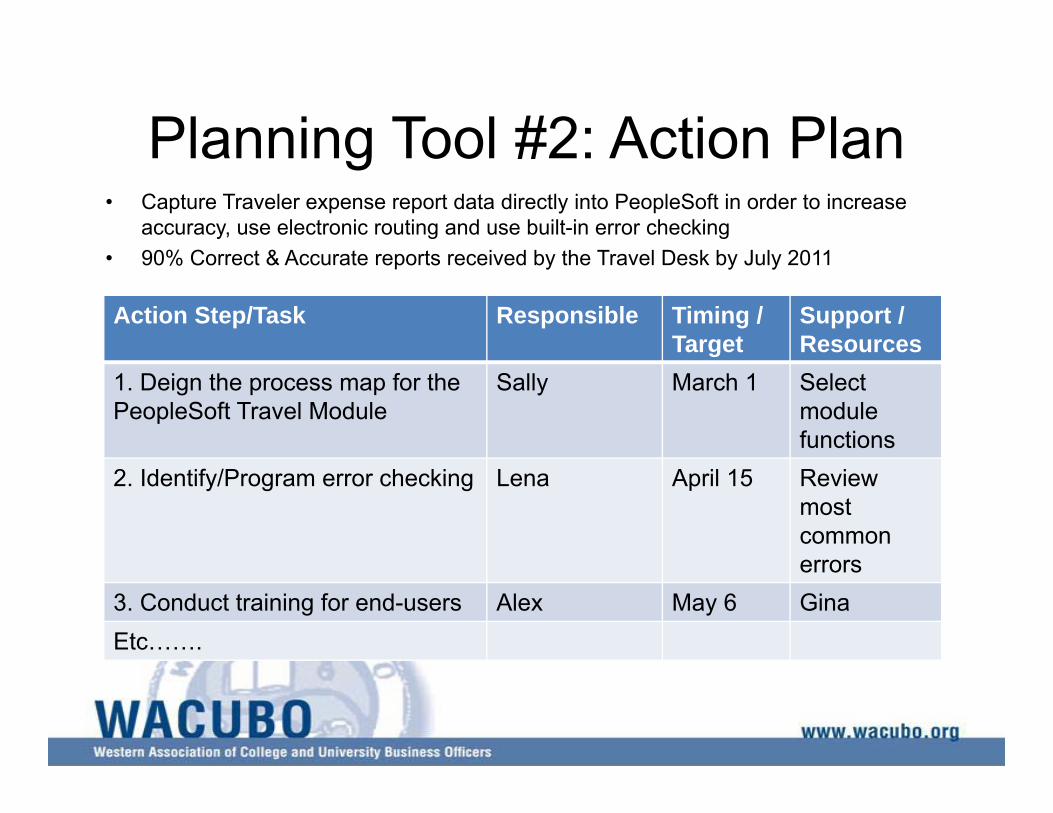
Planning Tool #2: Action Plan• Capture Traveler expense report data directly into PeopleSoft in order to increase
accuracy, use electronic routing and use built-in error checking• 90% Correct & Accurate reports received by the Travel Desk by July 2011
Action Step/Task Responsible Timing / Target
Support / Resources
1. Deign the process map for the PeopleSoft Travel Module
Sally March 1 Selectmodule functions
2. Identify/Program error checking Lena April 15 Review most commonerrors
3. Conduct training for end-users Alex May 6 GinaEtc…….
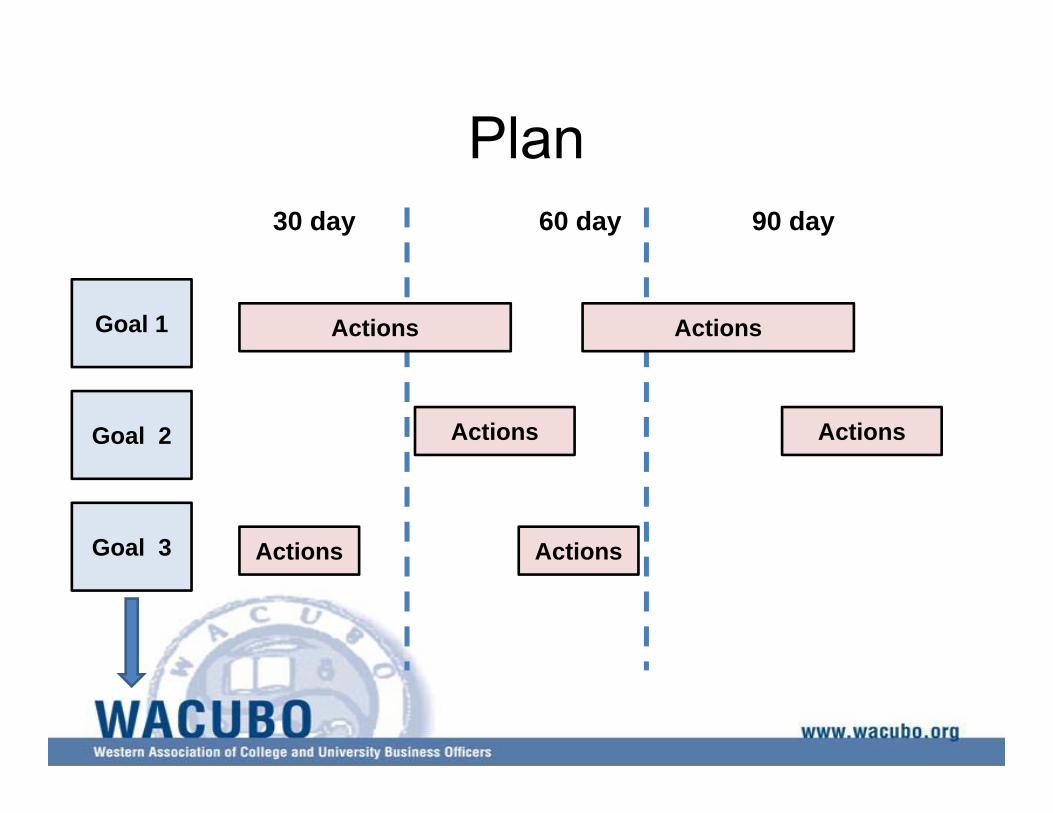
Plan
Goal 1
Goal 2
Goal 3
30 day 60 day 90 day
Actions Actions
Actions Actions
Actions Actions
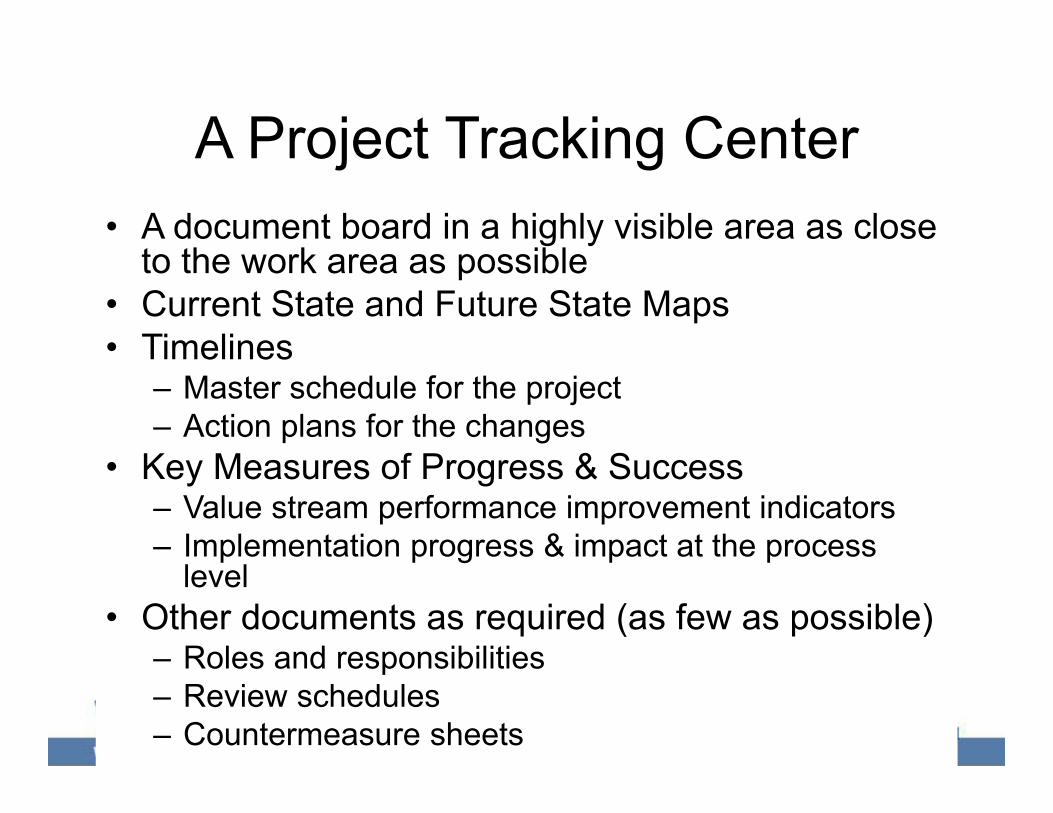
A Project Tracking Center• A document board in a highly visible area as close
to the work area as possible• Current State and Future State Maps• Timelines
– Master schedule for the project– Action plans for the changes
• Key Measures of Progress & Success– Value stream performance improvement indicators– Implementation progress & impact at the process
level• Other documents as required (as few as possible)
– Roles and responsibilities– Review schedules– Countermeasure sheets
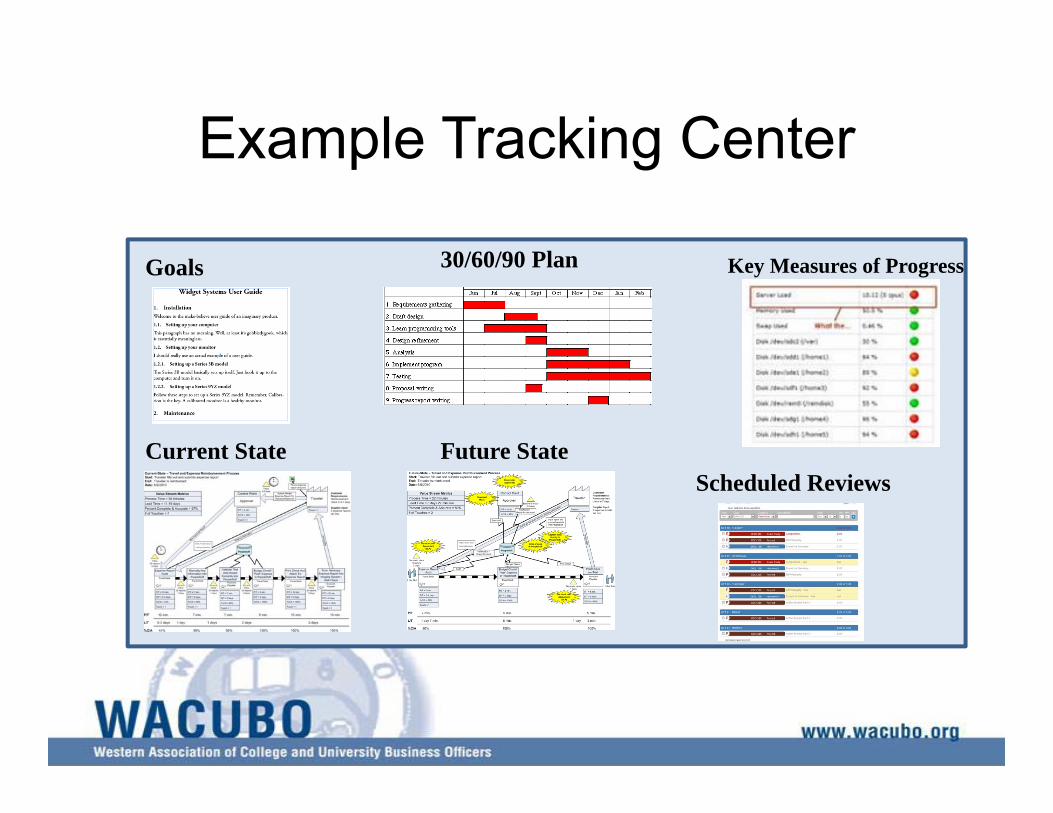
Example Tracking Center
30/60/90 Plan
Current State Future State
Goals Key Measures of Progress
Scheduled Reviews

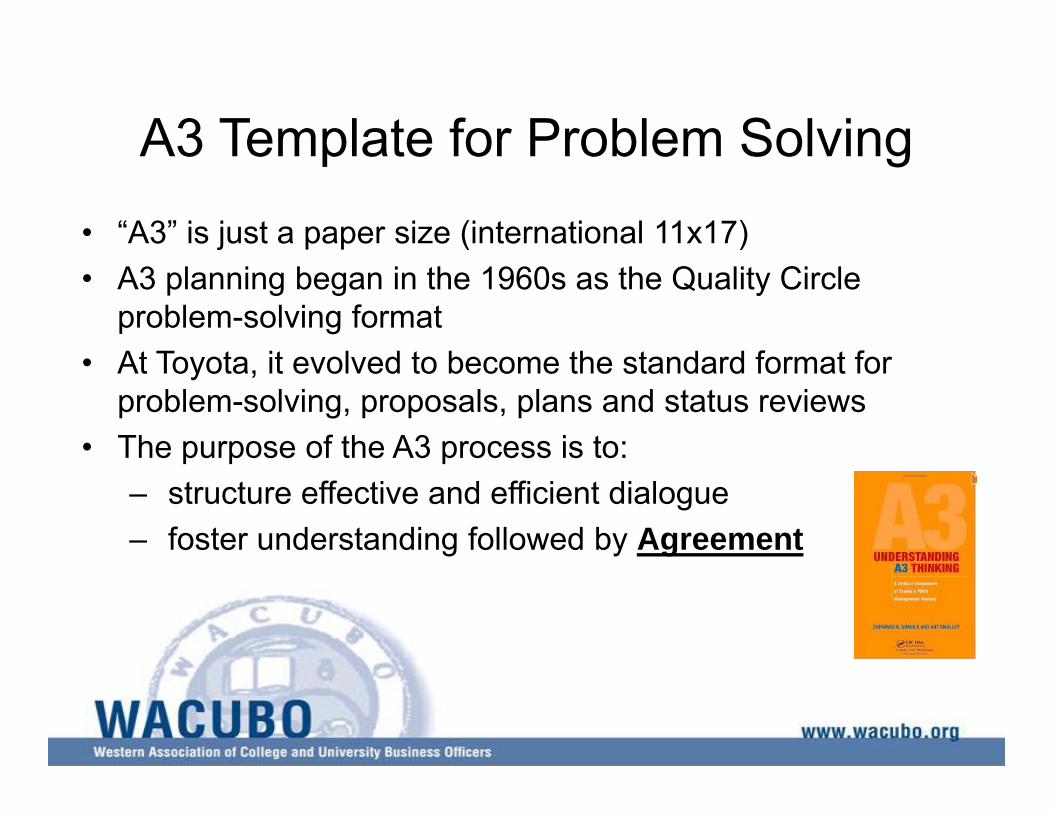
A3 Template for Problem Solving• “A3” is just a paper size (international 11x17)• A3 planning began in the 1960s as the Quality Circle
problem-solving format• At Toyota, it evolved to become the standard format for
problem-solving, proposals, plans and status reviews• The purpose of the A3 process is to:
– structure effective and efficient dialogue– foster understanding followed by Agreement
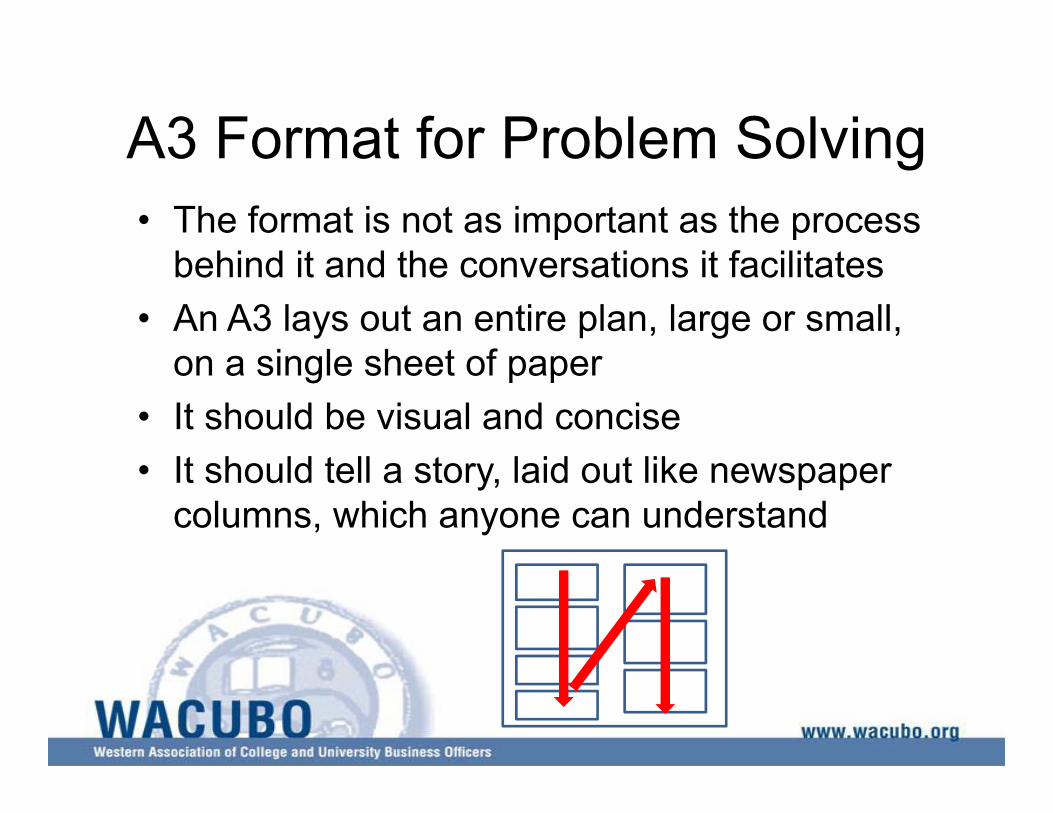
A3 Format for Problem Solving• The format is not as important as the process
behind it and the conversations it facilitates• An A3 lays out an entire plan, large or small,
on a single sheet of paper• It should be visual and concise• It should tell a story, laid out like newspaper
columns, which anyone can understand
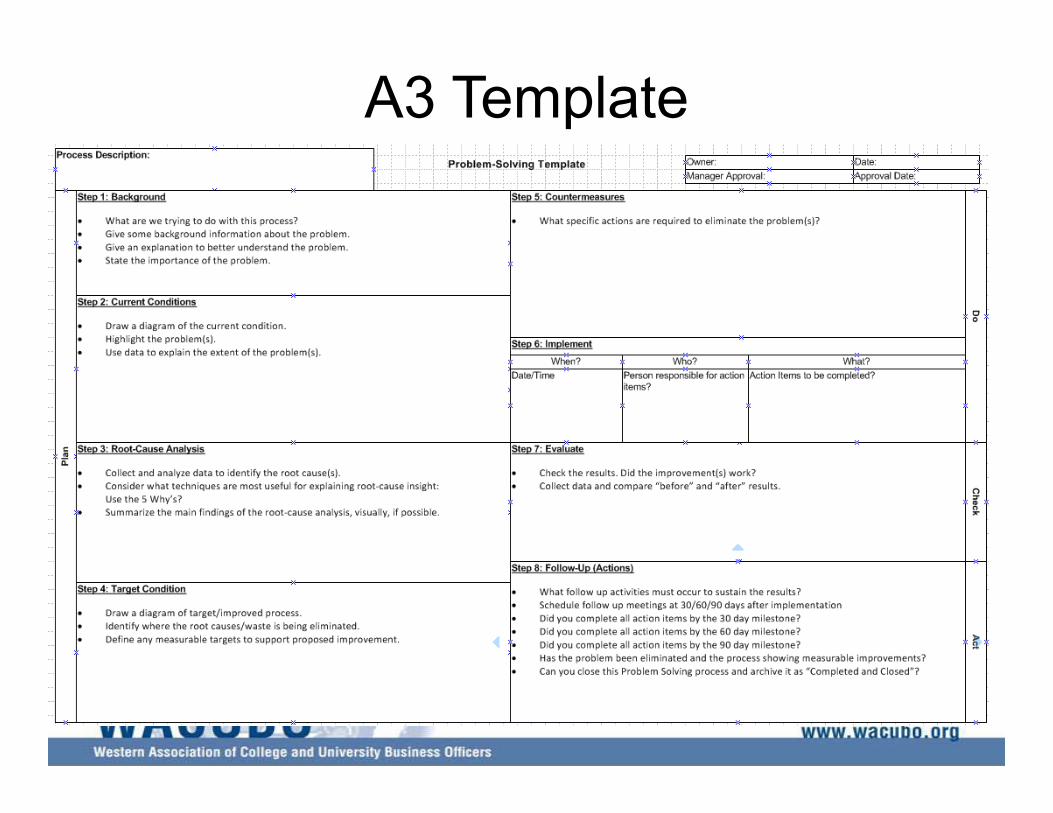
A3 Template
Background:Of all our problems, why are we talking about this one?Historical/organizational/business context…
Title: What are we talking about. Date: Owner: Approval:
Plan Do, Check, Act
Current Situation:Where do we stand?
Trend chart, current state value stream map, current gap…..
Goal:What is the specific change you want to accomplish now?
Analysis:What are the root causes of the problem? 5 whys, fishbone
What requirements, constraints and alternatives need to be considered?
Recommendations:What are you proposed countermeasures, strategies, alternatives?
Include options
Plan:What, Who, When?
What activities will be required for implementation and who will be responsible for what and when?
Follow-up:How will we know if the actions have the impact needed? What remaining issues can be anticipated? When/how will we follow-up?
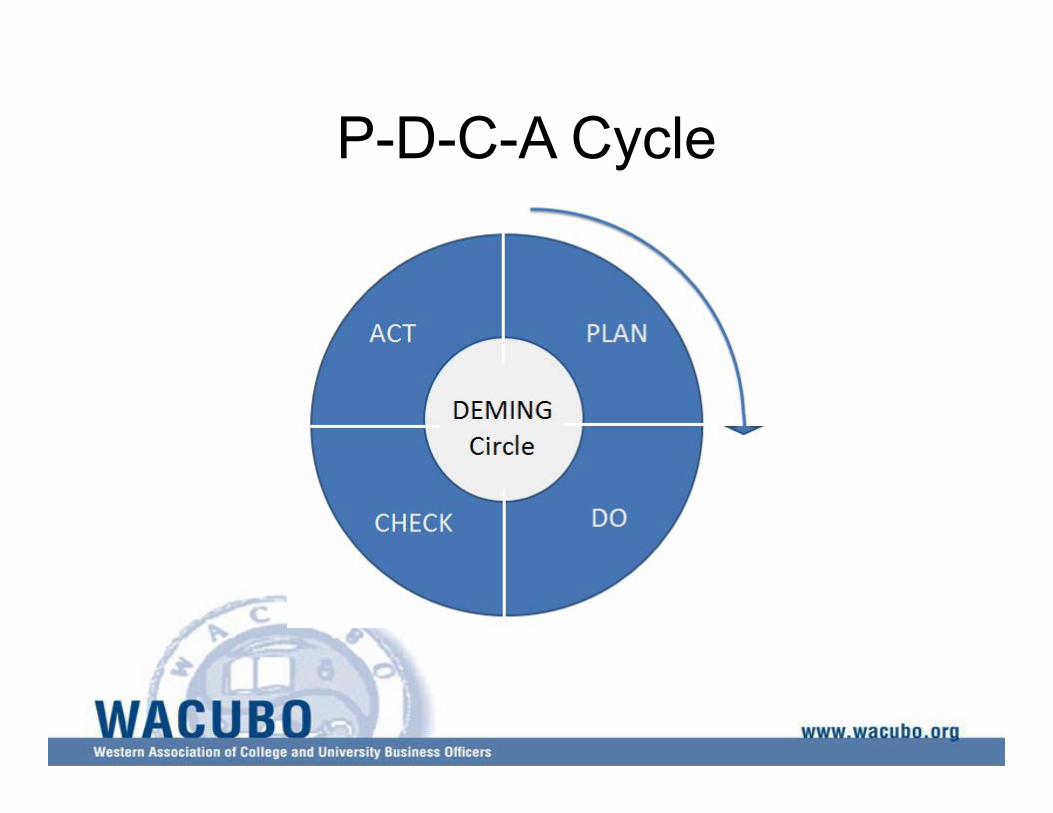
P-D-C-A Cycle
Step 1: Background
• What are we trying to do with this process?• Give some background information about
the problem• Give an explanation to better understand
the problem• State the importance of the problem
Step 2: Current Conditions
• Draw a diagram of the current condition• Highlight the problem(s)• Use data to explain the extent of the
problem(s)
Step 3: Root-Cause Analysis
• Collect and analyze data to identify the root cause(s)
• Consider what techniques are most useful for explaining root-cause insight: – Use the 5 Whys?
• Summarize the main findings of the root-cause analysis, visually, if possible
Step 4: Target Condition
• Draw a diagram of target/improved process• Identify where the root causes/waste is
being eliminated• Define any measurable targets to support
proposed improvement
Step 5: Countermeasures
• What specific actions are required to eliminate the problem(s)?
Step 6: Implement
• When? - Date/Time • Who? - Person responsible for action
items• What? - Action items to be completed?
Step 7: Effect Confirmation (Results)
• Check the results: did the improvement(s) work?
• Collect data and compare “before” and “after” results
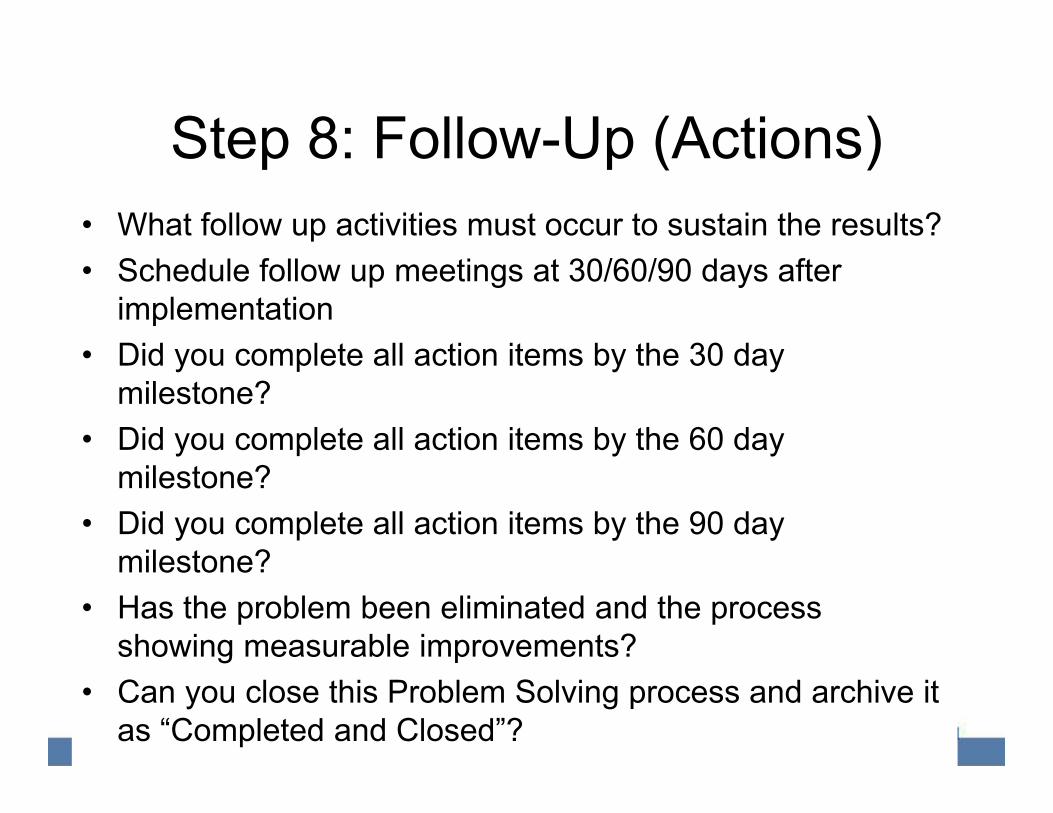
Step 8: Follow-Up (Actions)• What follow up activities must occur to sustain the results?• Schedule follow up meetings at 30/60/90 days after
implementation• Did you complete all action items by the 30 day
milestone?• Did you complete all action items by the 60 day
milestone?• Did you complete all action items by the 90 day
milestone?• Has the problem been eliminated and the process
showing measurable improvements?• Can you close this Problem Solving process and archive it
as “Completed and Closed”?
A3 Benefits• It forces you to slow down and not jump to
conclusions• It fosters dialogue within the organization• It develops thinking problem-solvers• It exposes lack of agreement that can
undermine plans• It encourages PDCA (Plan, Do, Check, Act)• It clarifies the link (or lack of link) among
problems, root causes, countermeasures
Organizational Change
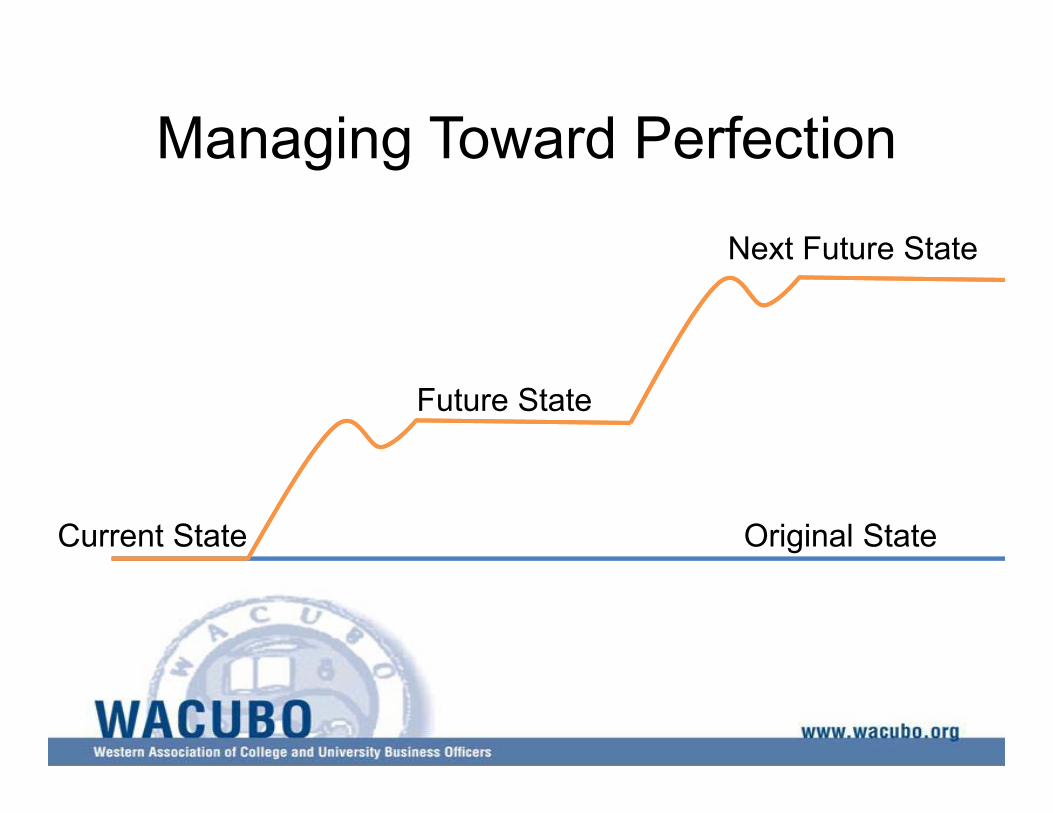
Managing Toward Perfection
Original StateCurrent State
Future State
Next Future State
Organizational Change Challenges
• Perceived resistance to change– People are willing to change, just need a compelling
reason– Show how change benefits them and solves their problem
– How does change help students?– Allowing employees input in process improvement effort
may enrich jobs and enhance own satisfaction– Address any perceived threats to jobs – do not use Lean
to reduce workforce!
• University culture may not be set up to continuously improve– Employees know process is ‘broken’ but there is no formal
mechanism to share suggestions
Organizational Change Solutions
• Ask:– What are some low-hanging fruit?– What can be done immediately to improve customer
satisfaction?
• Look to:– Create a culture of continuous improvement
– Communicate improvements to gain momentum for future efforts
– Remove silos: if a process crosses divisions an improvement by one department may have negative upstream/downstream consequences: COULD MAKE PROCESS LESS EFFICIENT
– Solicit and accept feedback– Have no fear of failure
Leadership’s Role• Create vision
– Where are we going and why?– Goals and objectives
• Participate in the process• Commit resources• Remove barriers• Communicate
– Vision, results, lessons learned, and desire for culture of continuous improvement
President Cho of Toyota:Three Keys to Lean Leadership
• Go see– Senior Management must spent time on the
ground observing the process– “You can observe a lot by just watching” – Yogi Berra
• Ask why– “Use the “Why?” technique daily”
• Show respect– “Respect your people”– Harness their creativity to solve problems
Continuing the Quality Journey• Organizations & Resources
– ASQ www.asq.org– NCCI (Higher Ed) http://www.ncci-cu.org– Lean Enterprise Institute www.lean.org– CCE (California) www.calexcellence.org
• Certifications– ASQ
– Certified Manager of Quality/Organizational Excellence– Quality process Analyst
– PMI www.pmi.org– PMP
Slide Content Adapted from:• Lean Higher Education: Increasing the Value and Performance of University Processes by William
K. Balzer • Lean Thinking: Banish Waste and Create Wealth in Your Corporation by James P. Womack and
Daniel T. Jones • Lean Thinking with Six Sigma presentation by Kurt E. Robertson• Learning to See: Value Stream Mapping to Add Value and Eliminate MUDA by Mike Rother, John
Shook, Jim Womack and Dan Jones• Mapping to See Participant Guide by Beau Keyte• Managing to Learn: Using the A3 Management Process by John Shook • The Machine That Changed the World : The Story of Lean Production by James P. Womack,
Daniel T. Jones and Daniel Roos• The Basics of Process Mapping by Robert Damelio• The Team Handbook by Peter Scholtes• The Complete Lean Enterprise: Value Stream Mapping for Administrative and Office Processes by
Beau Keyte and Drew Locher• The New Lean Office Training Set by Don Tapping• Understanding A3 Thinking: A Critical Component of Toyota's PDCA Management System by
Durward K. Sobek II. and Art Smalley• The Kaizen Event Planner by Karen Martin and Mike Osterling• Lean in Government Starter Kit Version 2.0 from the United States Environmental Protection
Agency