Embed Size (px)
Citation preview
Lean Miller Cycle System Development for Light-Duty Vehicles
This presentation does not contain any proprietary, confidential, or otherwise restricted information
Project ID #ACE093
2015 U.S. DOE Vehicle Technologies Program Annual Merit Review and Peer Evaluation
Meeting - Arlington, VAJune 11, 2015
David P. SczomakPrincipal Investigator
General Motors Powertrain
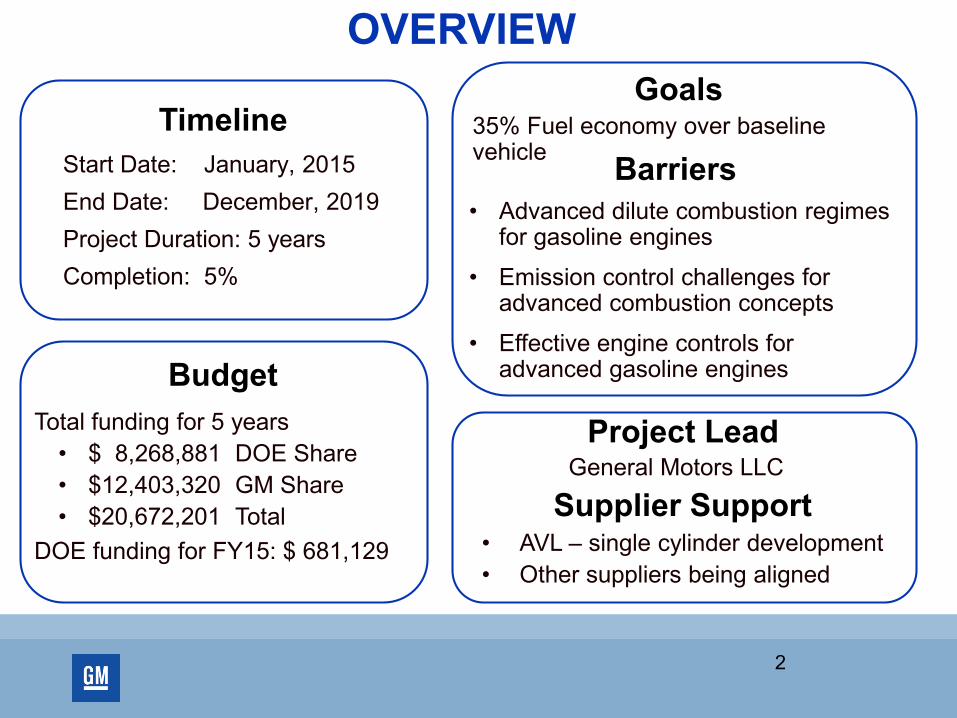
Start Date: January, 2015End Date: December, 2019Project Duration: 5 yearsCompletion: 5%
35% Fuel economy over baseline vehicle
Total funding for 5 years• $ 8,268,881 DOE Share• $12,403,320 GM Share• $20,672,201 Total
DOE funding for FY15: $ 681,129
Timeline
Budget
Goals
• AVL – single cylinder development• Other suppliers being aligned
Supplier Support
OVERVIEW
Project LeadGeneral Motors LLC
• Advanced dilute combustion regimes for gasoline engines
• Emission control challenges for advanced combustion concepts
• Effective engine controls for advanced gasoline engines
Barriers
2
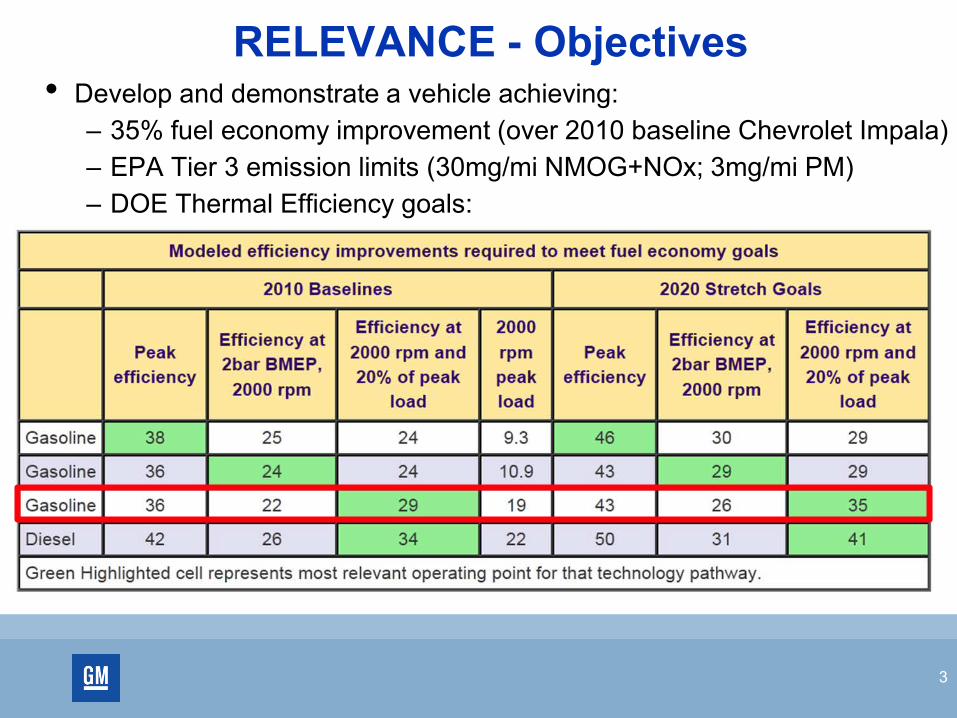
RELEVANCE - Objectives• Develop and demonstrate a vehicle achieving:
– 35% fuel economy improvement (over 2010 baseline Chevrolet Impala)– EPA Tier 3 emission limits (30mg/mi NMOG+NOx; 3mg/mi PM)– DOE Thermal Efficiency goals:
3

APPROACH – Overall Milestones 4 Annual Go / No-Go Decision Reviews
1. Dec. 2015 Baseline SCE Design & Testing 2. Dec. 2016 Lean Miller Cycle Assessment3. Dec. 2017 Multicylinder Efficiency vs. Targets 4. Dec. 2018 Full Dyno Assessment – FE / Performance / Emissions
Project Completion 5. Dec. 2019 Final Vehicle Demonstration
Lean Miller Cycle System Development for Light-Duty Vehicles 2015 2016 2017 2018 2019DE-EE0006853 Q1 Q2 Q3 Q4 Q1 Q2 Q3 Q4 Q1 Q2 Q3 Q4 Q1 Q2 Q3 Q4 Q1 Q2 Q3 Q4 Q1TASK D J F M A M J J A S O N D J F M A M J J A S O N D J F M A M J J A S O N D J F M A M J J A S O N D J F M A M J J A S O N D J F M
Program TimelineNotification of AwardQuarterly Report & Milestones 1 2 3 4 5 6 7 8 9Yearly Go / No-Go Decision
Phases (Budget Periods)
Phase 1: SCE Design & Build <=== Phase 1 ===>
Phase 2: SCE Combustion Development <=== Phase 2 ===>
Phase 3: Engine Build & Development <=== Phase 3 ===>
Phase 4: Engine Calibration <=== Phase 4 ===>
Phase 5: Vehicle Demonstration <=== Phase 5 ===>
16 17 18 19 2010 11 12 13 14 15
Phases:1. SCE Design & Build2. SCE Combustion Dev.3. Engine Build & Dev.4. Engine Calibration5. Vehicle Demonstration
Notification of AwardQuarterly Rept. & MilestonesGo / No-Go Decisions
Project Timeline Status
4

APPROACH – 2015 / 2016 MilestonesIncludes Annual Decision Points
Task Number
Task Title or Subtask Title
Milestone or Go/No-Go
Decision Point
Milestone or Go/No-Go
Decision Point Number
Milestone Description (Go/No-Go Decision
Criteria)
Milestone Verification Process (What, How,
Who, Where)
Anticipated Date (Months from
Start of Project)
Anticipated Quarter (from
Start of Project)
1.2Initial 1D/3D Simulations
Milestone M1.2Complete Initial 1D/3D
SimulationGM - Analysis Simulation 3 1
1.3Single Cyl Hardware
DesignMilestone M1.3
Complete Single Cylinder Designs
GM - Design Data (External Supplier)
6 2
1.4Procure Single Cyl
HardwareMilestone M1.4
Procured Single Cylinder Hardware
GM - Build Data (External Supplier)
9 3
1.5.1 Baseline SCE Design Milestone M1.5.1SCE Engine Fired on
DynoGM - Dyno Data
(External Supplier)12 4
1.5.1 Baseline SCE DesignGo/No-Go
Decision PointGNG #1
Baseline SCE Testing Complete
GM - Dyno Data (External Supplier)
12 4
1.5.2Multi-Hole Inj Head
DesignMilestone M1.5.2
Multi-Hole Inj Head Design #1 Completed
GM - Dyno Data (External Supplier)
15 5
1.5.3 Piezo Inj Head Design Milestone M1.5.3Piezo Inj Head Design
#1 CompletedGM - Dyno Data
(External Supplier)18 6
1.5.4Piston, Inj, Plug Optimization
Milestone M1.5.4Single Cylinder
Optimization CompletedGM - Dyno Data
(External Supplier)21 7
1.5.5 Final Single Cyl Design Milestone M1.5.5Final Single Cylinder Design Completed
GM - Dyno Data (External Supplier)
24 8
1LMC Single Cylinder
TestingGo/No-Go
Decision PointGNG #2
Lean Miller Cycle Assessment
GM - Dyno Data (External Supplier)
24 8
5
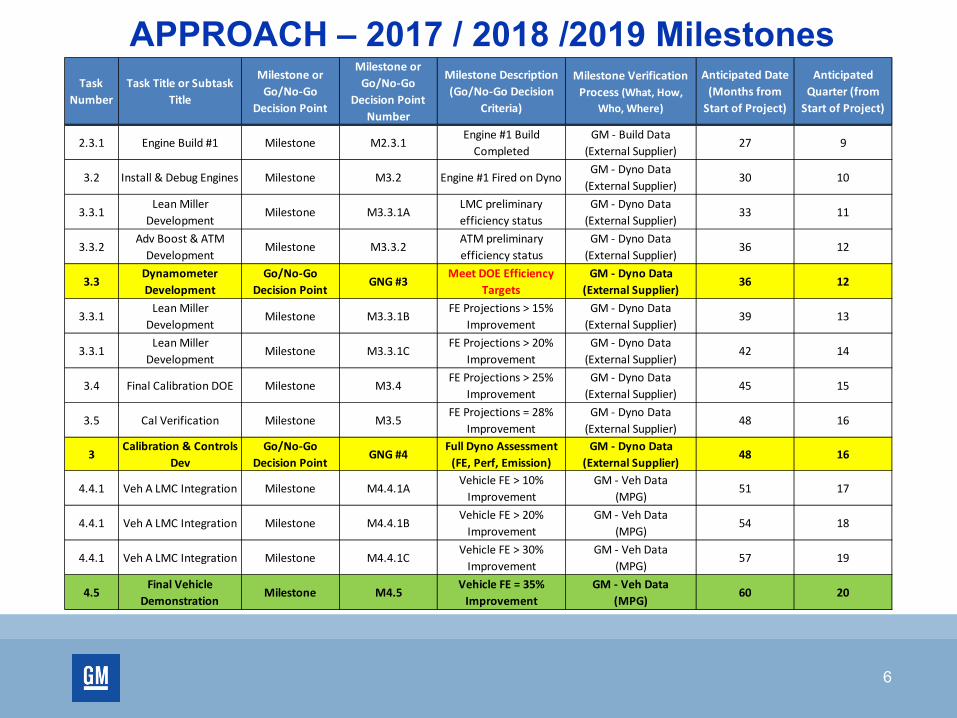
APPROACH – 2017 / 2018 /2019 MilestonesTask
NumberTask Title or Subtask
Title
Milestone or Go/No-Go
Decision Point
Milestone or Go/No-Go
Decision Point Number
Milestone Description (Go/No-Go Decision
Criteria)
Milestone Verification Process (What, How,
Who, Where)
Anticipated Date (Months from
Start of Project)
Anticipated Quarter (from
Start of Project)
2.3.1 Engine Build #1 Milestone M2.3.1Engine #1 Build
CompletedGM - Build Data
(External Supplier)27 9
3.2 Install & Debug Engines Milestone M3.2 Engine #1 Fired on DynoGM - Dyno Data
(External Supplier)30 10
3.3.1Lean Miller
DevelopmentMilestone M3.3.1A
LMC preliminary efficiency status
GM - Dyno Data (External Supplier)
33 11
3.3.2Adv Boost & ATM
DevelopmentMilestone M3.3.2
ATM preliminary efficiency status
GM - Dyno Data (External Supplier)
36 12
3.3Dynamometer Development
Go/No-Go Decision Point
GNG #3Meet DOE Efficiency
TargetsGM - Dyno Data
(External Supplier)36 12
3.3.1Lean Miller
DevelopmentMilestone M3.3.1B
FE Projections > 15% Improvement
GM - Dyno Data (External Supplier)
39 13
3.3.1Lean Miller
DevelopmentMilestone M3.3.1C
FE Projections > 20% Improvement
GM - Dyno Data (External Supplier)
42 14
3.4 Final Calibration DOE Milestone M3.4FE Projections > 25%
ImprovementGM - Dyno Data
(External Supplier)45 15
3.5 Cal Verification Milestone M3.5FE Projections = 28%
ImprovementGM - Dyno Data
(External Supplier)48 16
3Calibration & Controls
DevGo/No-Go
Decision PointGNG #4
Full Dyno Assessment (FE, Perf, Emission)
GM - Dyno Data (External Supplier)
48 16
4.4.1 Veh A LMC Integration Milestone M4.4.1AVehicle FE > 10%
ImprovementGM - Veh Data
(MPG)51 17
4.4.1 Veh A LMC Integration Milestone M4.4.1BVehicle FE > 20%
ImprovementGM - Veh Data
(MPG)54 18
4.4.1 Veh A LMC Integration Milestone M4.4.1CVehicle FE > 30%
ImprovementGM - Veh Data
(MPG)57 19
4.5Final Vehicle
DemonstrationMilestone M4.5
Vehicle FE = 35% Improvement
GM - Veh Data (MPG)
60 20
6
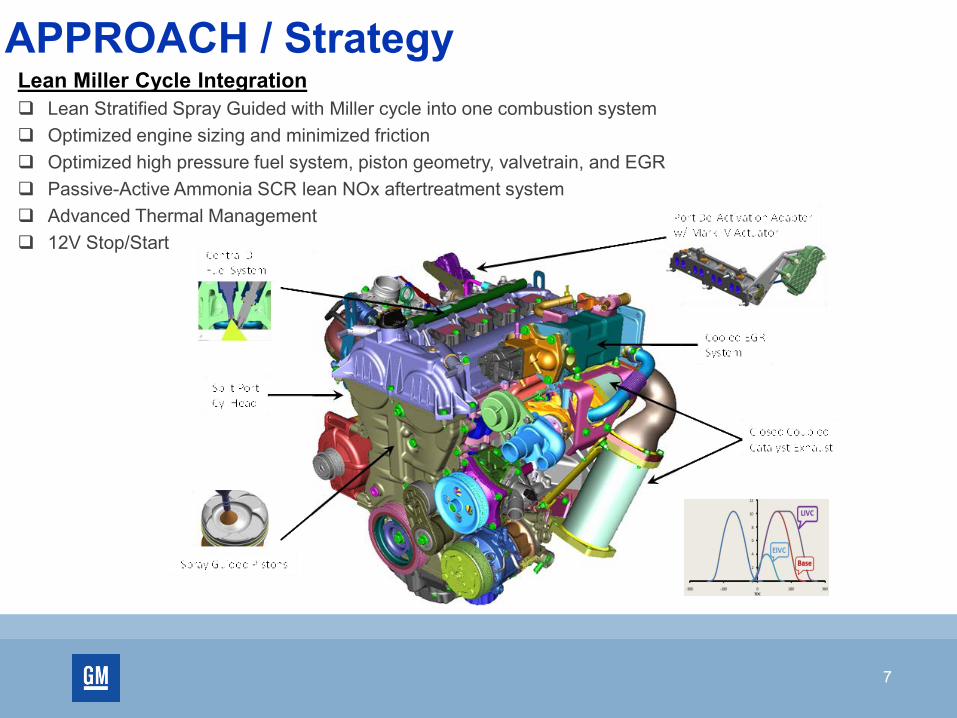
APPROACH / StrategyLean Miller Cycle Integration Lean Stratified Spray Guided with Miller cycle into one combustion system Optimized engine sizing and minimized friction Optimized high pressure fuel system, piston geometry, valvetrain, and EGR Passive-Active Ammonia SCR lean NOx aftertreatment system Advanced Thermal Management 12V Stop/Start
7
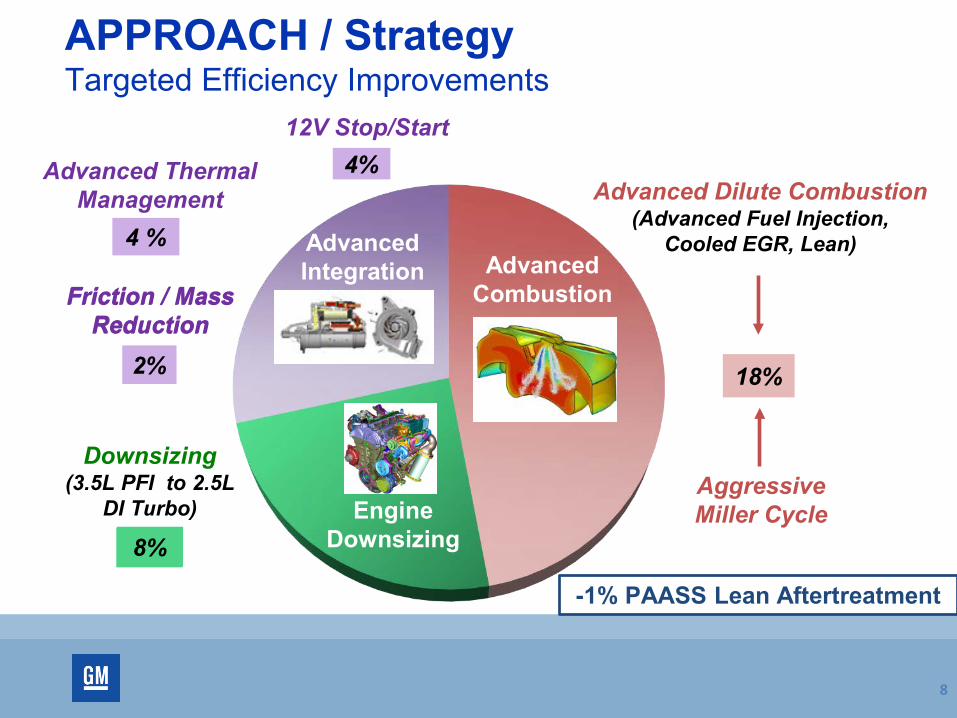
APPROACH / Strategy Targeted Efficiency Improvements
8
Advanced Dilute Combustion(Advanced Fuel Injection,
Cooled EGR, Lean)
12V Stop/Start
Downsizing(3.5L PFI to 2.5L
DI Turbo)
8%
18%
Advanced ThermalManagement
2%
4%
4 %
Aggressive Miller Cycle
Friction / Mass Reduction
-1% PAASS Lean Aftertreatment
Advanced Combustion
Advanced Integration
Engine Downsizing8%
Friction / Mass Reduction
TECHNICAL ACCOMPLISHMENTS AND PROGRESS
• Project kick-off January, 2015
• AVL selected for single cylinder testing
• Initial 1D and 3D modeling started
• Initial tasks identified:
– Optimizing displacement for best lean stratified / downsizing balance
– Optimizing piston bowl design for both high load Miller and light load stratified performance
This will be the focus of analysis and single cylinder design and development
9
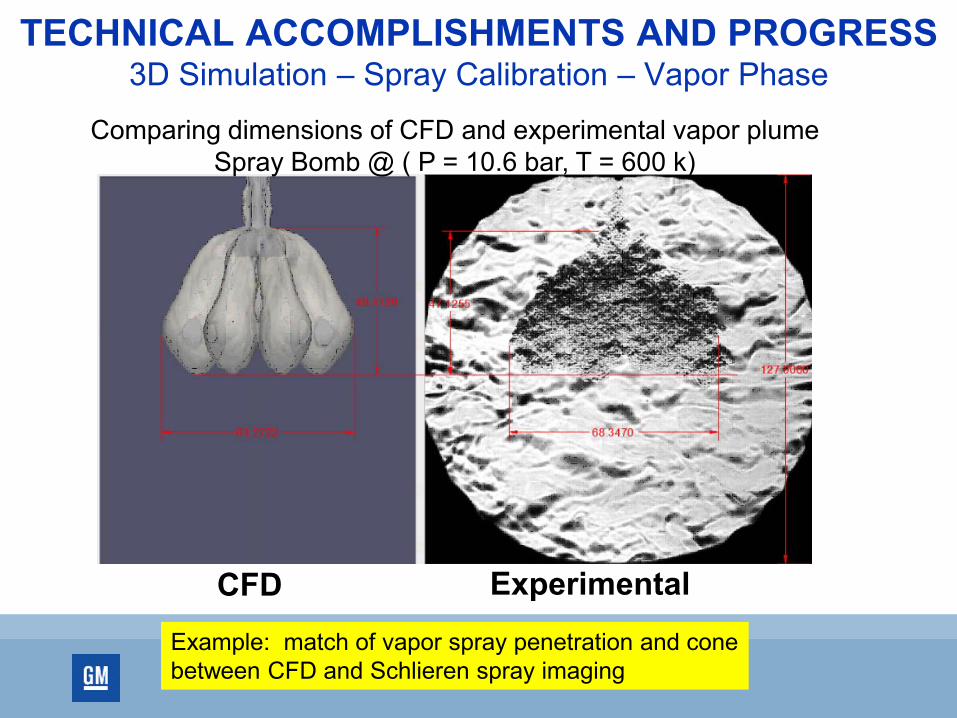
TECHNICAL ACCOMPLISHMENTS AND PROGRESS3D Simulation – Spray Calibration – Vapor Phase
Comparing dimensions of CFD and experimental vapor plumeSpray Bomb @ ( P = 10.6 bar, T = 600 k)
Example: match of vapor spray penetration and cone between CFD and Schlieren spray imaging
CFD Experimental
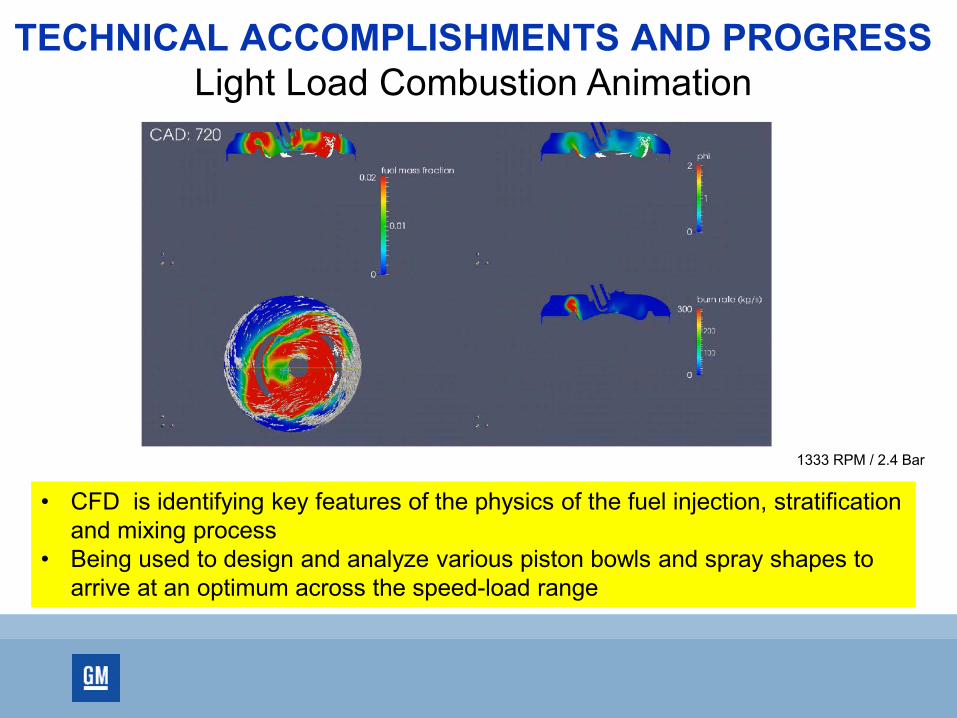
TECHNICAL ACCOMPLISHMENTS AND PROGRESS Light Load Combustion Animation
• CFD is identifying key features of the physics of the fuel injection, stratification and mixing process
• Being used to design and analyze various piston bowls and spray shapes to arrive at an optimum across the speed-load range
1333 RPM / 2.4 Bar
Responses to Previous Year Reviewer’s Comments• New project – not reviewed last year
12
Collaboration and CoordinationAVL – Single cylinder testing subcontractorHardware design supportEngine buildsEngine testing
Surveying several additional system suppliersFuel injectionIgnition Boost Aftertreatment
13
Challenges (Near-Term)Select displacement for best lean stratified /
downsizing balance
Optimize piston bowl design for both part-load stratified and high-load Miller performance
Tradeoffs between effective compression ratio vs. knock limit, surface to volume, mixing
14

Proposed Future WorkFY 2015 Develop combustion system hardware designs using 1D
and 3D modeling
Implement single cylinder for optimization and complete baseline testing in homogeneous mode
FY 2016 Investigate Miller cycle strategies (LIVC, EIVC) along
with compression ratio to optimize fuel consumption
Optimize lean stratified combustion system on single cylinder engine – piston bowl, spray patterns, mixture motion, dilution strategies
15
SummaryLean Miller Cycle System Development
New project – kicked off January, 2015
Initial 1D and 3D modeling work is underway
Started designing and analyzing piston bowls for operation across speed load range
Work is moving on track to meet 2015 milestones
16

THANK YOU!
17
Technical Back-Up Slides
18
GM PowertrainAdvanced Engineering
This presentation does not contain any proprietary, confidential, or otherwise restricted information
GM PowertrainAdvanced Engineering
This presentation does not contain any proprietary, confidential, or otherwise restricted information
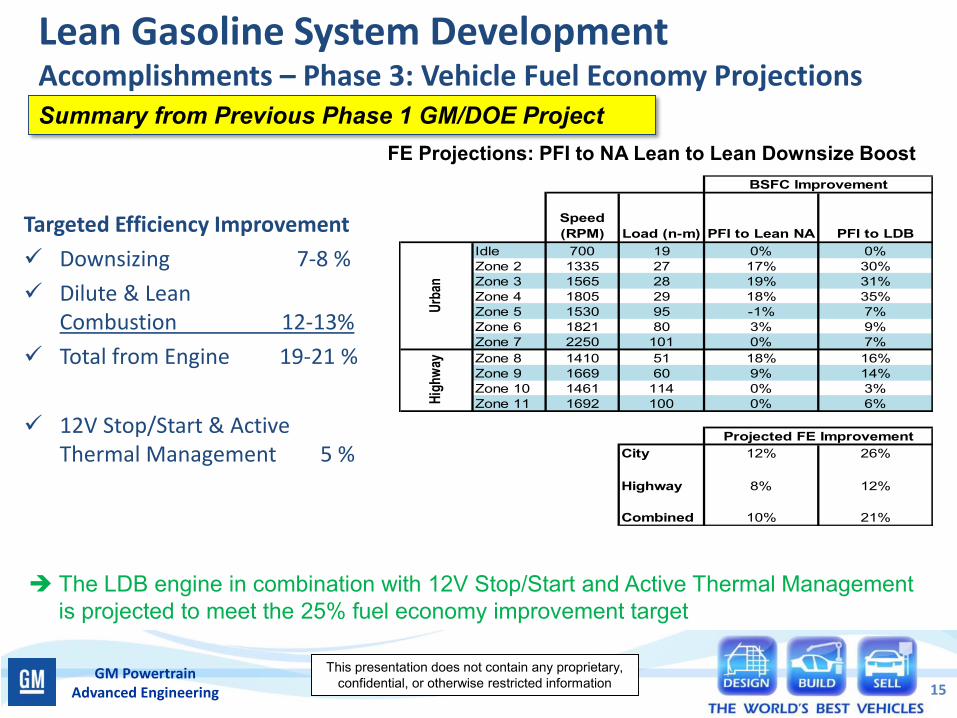
Targeted Efficiency Improvement Downsizing 7-8 % Dilute & Lean
Combustion 12-13% Total from Engine 19-21 %
12V Stop/Start & Active Thermal Management 5 %
Lean Gasoline System DevelopmentAccomplishments – Phase 3: Vehicle Fuel Economy Projections
The LDB engine in combination with 12V Stop/Start and Active Thermal Management is projected to meet the 25% fuel economy improvement target
FE Projections: PFI to NA Lean to Lean Downsize Boost
Speed (RPM) Load (n-m) PFI to Lean NA PFI to LDB
Idle 700 19 0% 0%Zone 2 1335 27 17% 30%Zone 3 1565 28 19% 31%Zone 4 1805 29 18% 35%Zone 5 1530 95 -1% 7%Zone 6 1821 80 3% 9%Zone 7 2250 101 0% 7%Zone 8 1410 51 18% 16%Zone 9 1669 60 9% 14%Zone 10 1461 114 0% 3%Zone 11 1692 100 0% 6%
City 12% 26%
Highway 8% 12%
Combined 10% 21%
BSFC Improvement
Projected FE ImprovementUr
ban
High
way
Summary from Previous Phase 1 GM/DOE Project
15