Embed Size (px)
Citation preview
Dr. David F. Rico, PMP, CSEP, FCP, FCT, ACP, CSM, SAFE, DEVOPS
Twitter: @dr_david_f_ricoWebsite: http://www.davidfrico.com
LinkedIn: http://www.linkedin.com/in/davidfricoAgile Capabilities: http://davidfrico.com/rico-capability-agile.pdf
Agile Cost of Quality: http://www.davidfrico.com/agile-vs-trad-coq.pdfDevOps Return on Investment (ROI): http://davidfrico.com/rico-devops-roi.pdf
Dave’s NEW Business Agility Video: https://www.youtube.com/watch?v=-wTXqN-OBzADave’s NEWER Development Operations Security Video: https://vimeo.com/214895416DoD Fighter Jets vs. Amazon Web Services: http://davidfrico.com/dod-agile-principles.pdf
Lean & AgilePerformance Measurement30 Metrics for Managing SAFe 4.5
Portfolios, Programs, & Teams
Author Background Gov’t contractor with 34+ years of IT experience B.S. Comp. Sci., M.S. Soft. Eng., & D.M. Info. Sys. Large gov’t projects in U.S., Far/Mid-East, & Europe
2
Career systems & software engineering methodologist Lean-Agile, Six Sigma, CMMI, ISO 9001, DoD 5000NASA, USAF, Navy, Army, DISA, & DARPA projects Published seven books & numerous journal articles Intn’l keynote speaker, 195+ talks to 14,300 people Specializes in metrics, models, & cost engineeringCloud Computing, SOA, Web Services, FOSS, etc. Professor at 7 Washington, DC-area universities
3
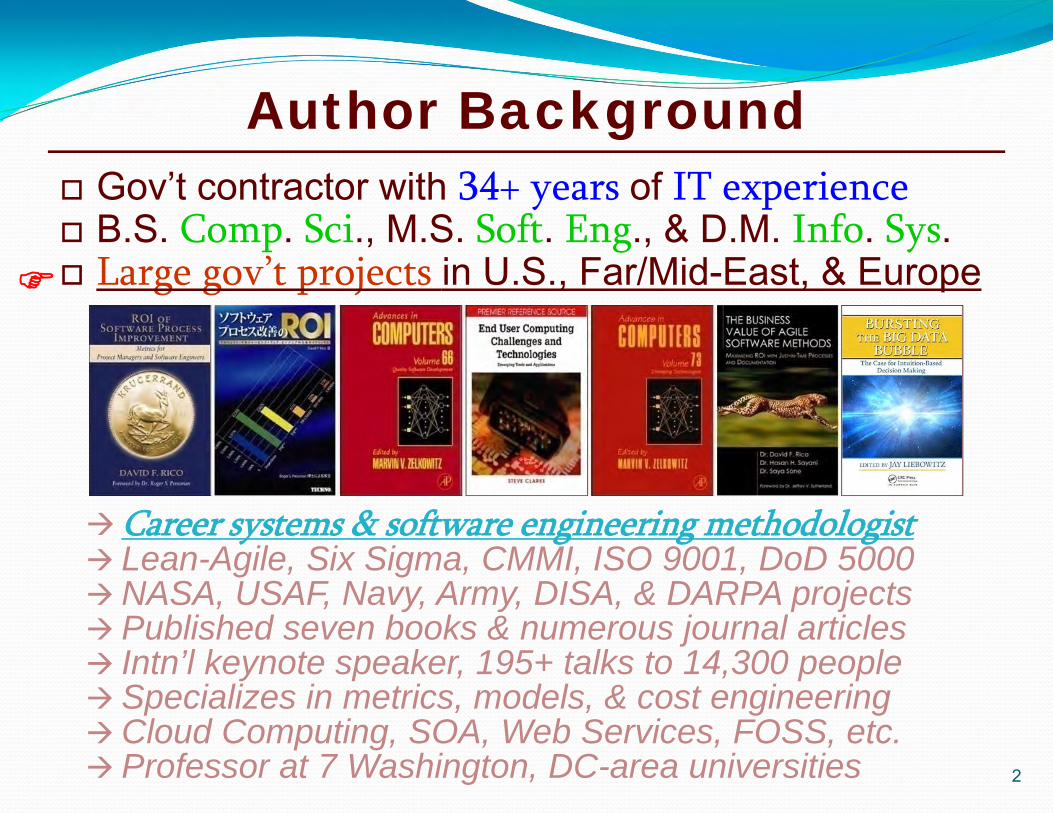
On Metrics—Lord Kelvin
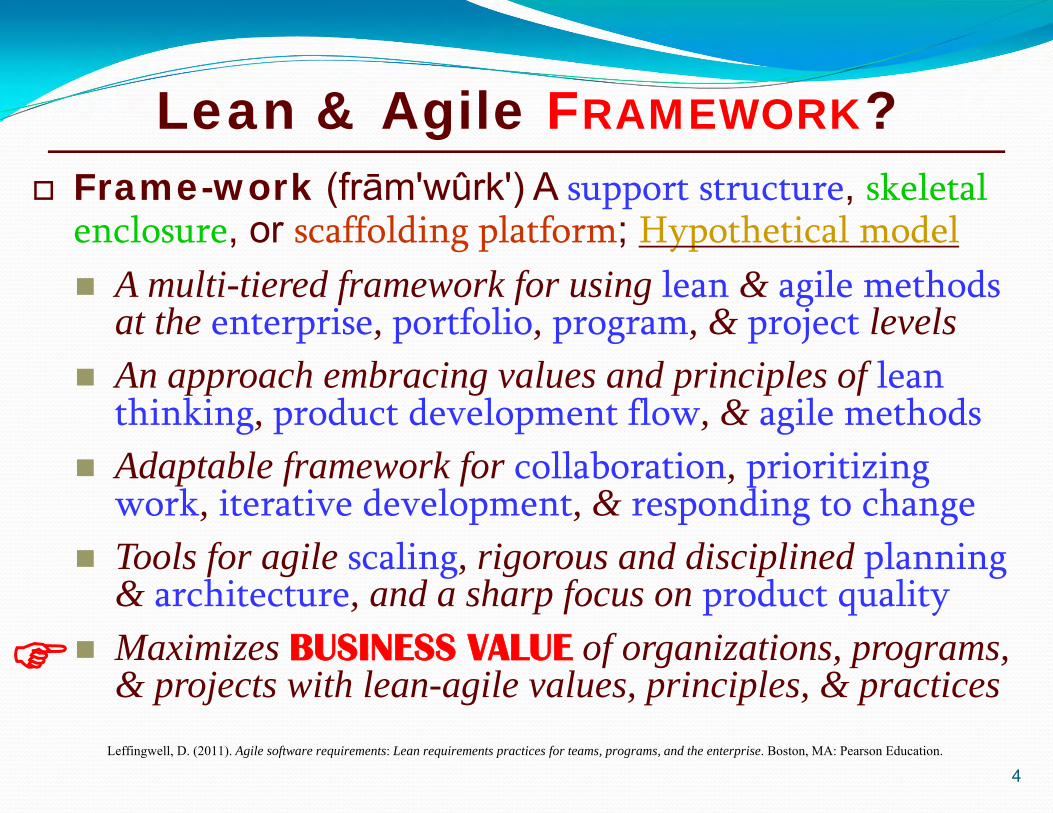
Lean & Agile FRAMEWORK? Frame-work (frām'wûrk') A support structure, skeletal
enclosure, or scaffolding platform; Hypothetical model A multi-tiered framework for using lean & agile methods
at the enterprise, portfolio, program, & project levels An approach embracing values and principles of lean
thinking, product development flow, & agile methods Adaptable framework for collaboration, prioritizing
work, iterative development, & responding to change Tools for agile scaling, rigorous and disciplined planning
& architecture, and a sharp focus on product quality Maximizes BUSINESS VALUE of organizations, programs,
& projects with lean-agile values, principles, & practicesLeffingwell, D. (2011). Agile software requirements: Lean requirements practices for teams, programs, and the enterprise. Boston, MA: Pearson Education.
4
5
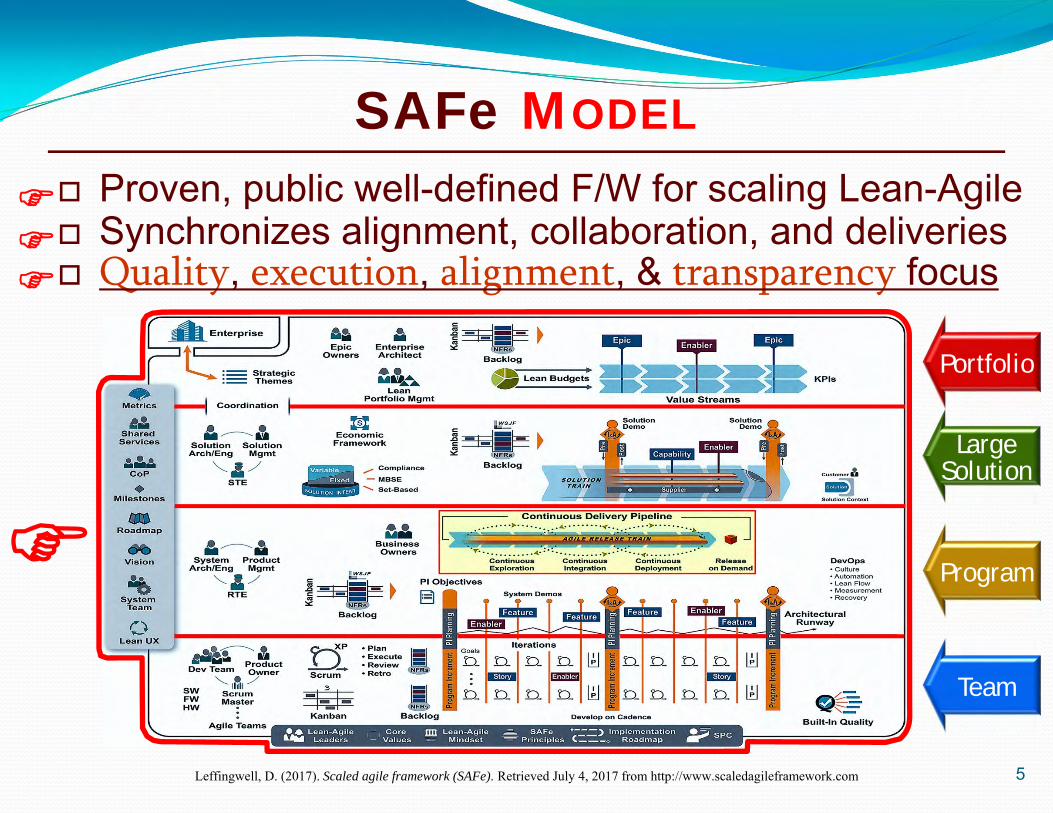
Proven, public well-defined F/W for scaling Lean-Agile Synchronizes alignment, collaboration, and deliveries Quality, execution, alignment, & transparency focus
Leffingwell, D. (2017). Scaled agile framework (SAFe). Retrieved July 4, 2017 from http://www.scaledagileframework.com
Portfolio
Team
Program
LargeSolution
SAFe MODEL
How do Lean & Agile INTERSECT?
6
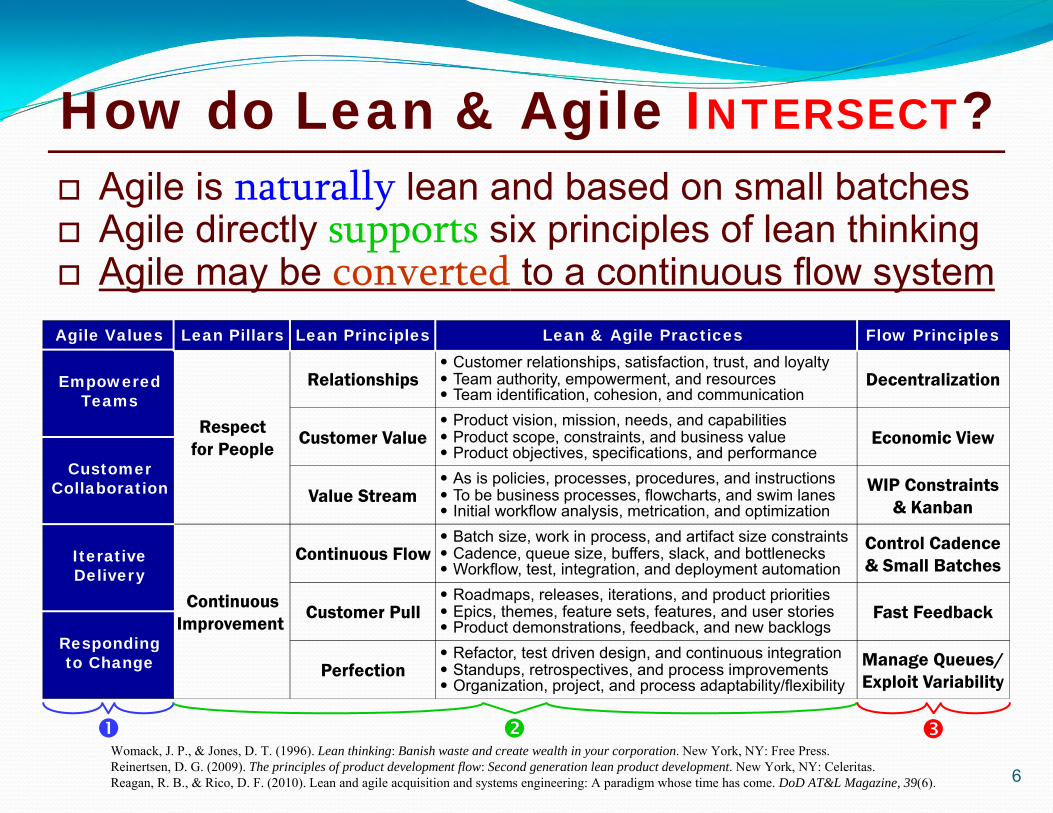
Agile is naturally lean and based on small batches Agile directly supports six principles of lean thinking Agile may be converted to a continuous flow system
Womack, J. P., & Jones, D. T. (1996). Lean thinking: Banish waste and create wealth in your corporation. New York, NY: Free Press.Reinertsen, D. G. (2009). The principles of product development flow: Second generation lean product development. New York, NY: Celeritas.Reagan, R. B., & Rico, D. F. (2010). Lean and agile acquisition and systems engineering: A paradigm whose time has come. DoD AT&L Magazine, 39(6).
Economic View
Decentralization
Fast Feedback
Control Cadence& Small Batches
Manage Queues/Exploit Variability
WIP Constraints& Kanban
Flow PrinciplesAgile Values
CustomerCollaboration
EmpoweredTeams
IterativeDelivery
Respondingto Change
Lean Pillars
Respectfor People
ContinuousImprovement
Customer Value
Relationships
Customer Pull
Continuous Flow
Perfection
Value Stream
Lean Principles Customer relationships, satisfaction, trust, and loyalty Team authority, empowerment, and resources Team identification, cohesion, and communication
Lean & Agile Practices
Product vision, mission, needs, and capabilities Product scope, constraints, and business value Product objectives, specifications, and performance As is policies, processes, procedures, and instructions To be business processes, flowcharts, and swim lanes Initial workflow analysis, metrication, and optimization Batch size, work in process, and artifact size constraints Cadence, queue size, buffers, slack, and bottlenecks Workflow, test, integration, and deployment automation Roadmaps, releases, iterations, and product priorities Epics, themes, feature sets, features, and user stories Product demonstrations, feedback, and new backlogs Refactor, test driven design, and continuous integration Standups, retrospectives, and process improvements Organization, project, and process adaptability/flexibility
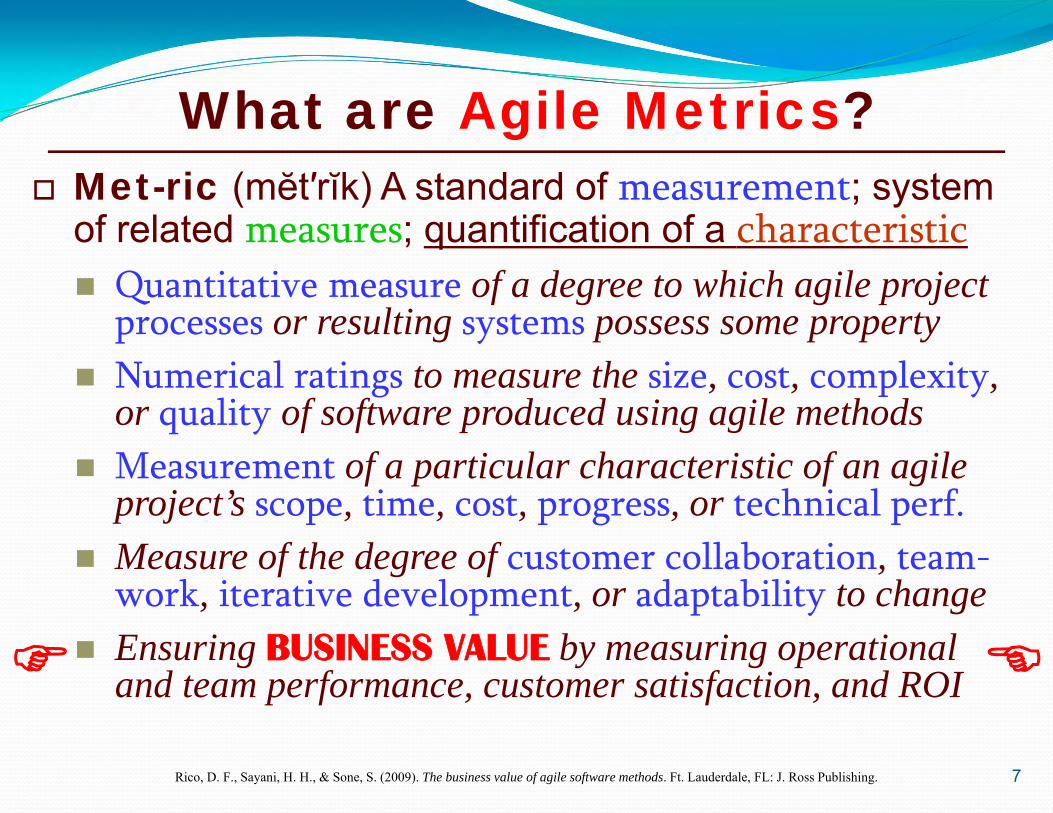
What are Agile Metrics? Met-ric (mĕt′rĭk) A standard of measurement; system
of related measures; quantification of a characteristic Quantitative measure of a degree to which agile project
processes or resulting systems possess some property Numerical ratings to measure the size, cost, complexity,
or quality of software produced using agile methods Measurement of a particular characteristic of an agile
project’s scope, time, cost, progress, or technical perf. Measure of the degree of customer collaboration, team-
work, iterative development, or adaptability to change Ensuring BUSINESS VALUE by measuring operational
and team performance, customer satisfaction, and ROI
7
Rico, D. F., Sayani, H. H., & Sone, S. (2009). The business value of agile software methods. Ft. Lauderdale, FL: J. Ross Publishing.
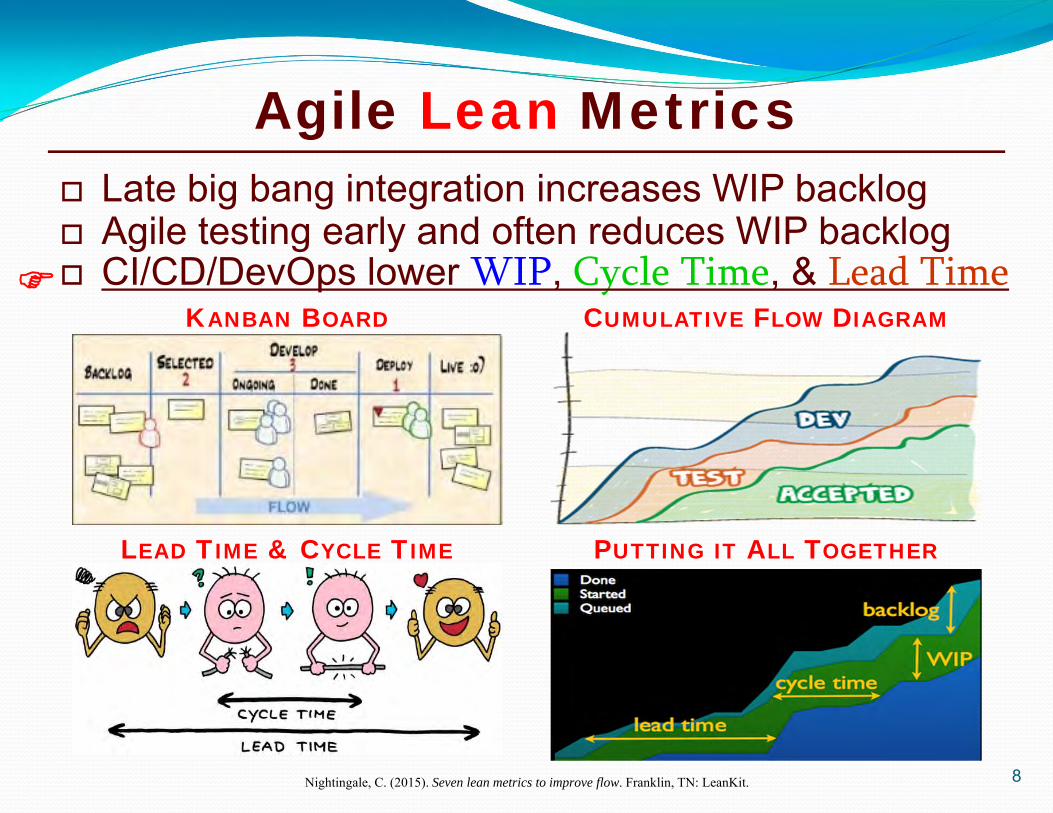
Agile Lean Metrics
8
Late big bang integration increases WIP backlog Agile testing early and often reduces WIP backlog CI/CD/DevOps lower WIP, Cycle Time, & Lead Time
Nightingale, C. (2015). Seven lean metrics to improve flow. Franklin, TN: LeanKit.
KANBAN BOARD CUMULATIVE FLOW DIAGRAM
LEAD TIME & CYCLE TIME PUTTING IT ALL TOGETHER
Port
folio
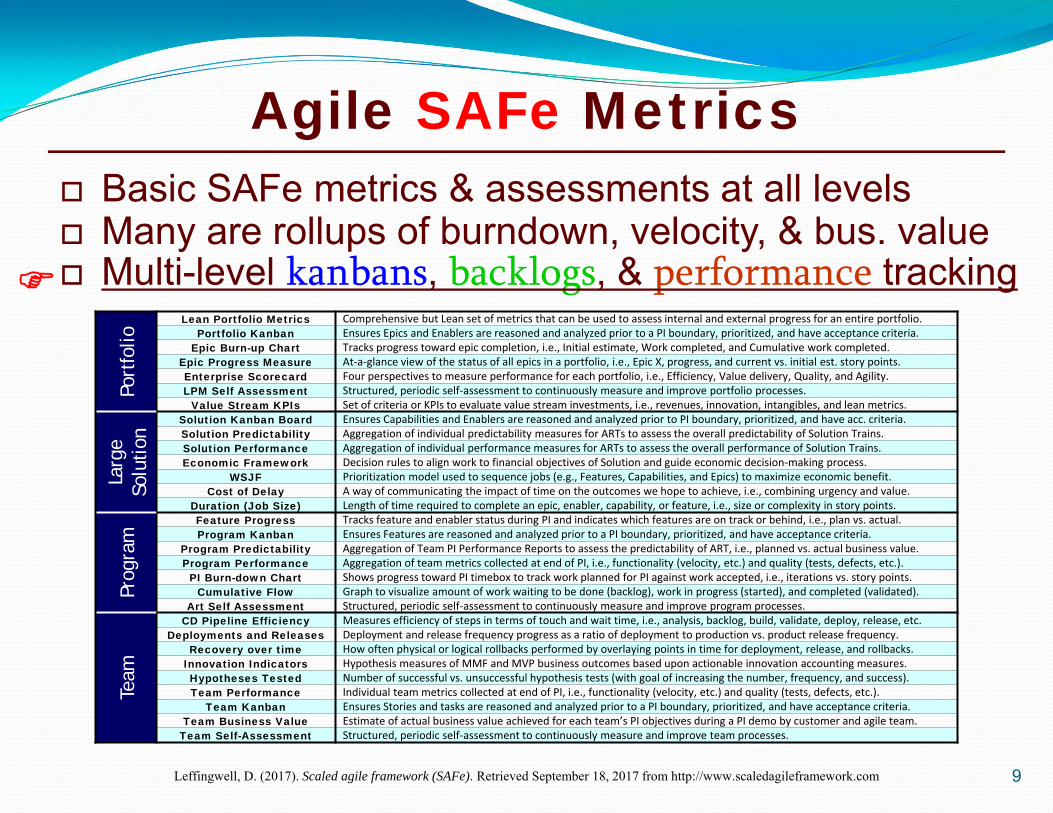
Lean Portfolio Metrics Comprehensive but Lean set of metrics that can be used to assess internal and external progress for an entire portfolio.Portfolio Kanban Ensures Epics and Enablers are reasoned and analyzed prior to a PI boundary, prioritized, and have acceptance criteria.
Epic Burn-up Chart Tracks progress toward epic completion, i.e., Initial estimate, Work completed, and Cumulative work completed.Epic Progress Measure At‐a‐glance view of the status of all epics in a portfolio, i.e., Epic X, progress, and current vs. initial est. story points.Enterprise Scorecard Four perspectives to measure performance for each portfolio, i.e., Efficiency, Value delivery, Quality, and Agility.LPM Self Assessment Structured, periodic self‐assessment to continuously measure and improve portfolio processes.
Value Stream KPIs Set of criteria or KPIs to evaluate value stream investments, i.e., revenues, innovation, intangibles, and lean metrics.
Larg
e So
luti
on
Solution Kanban Board Ensures Capabilities and Enablers are reasoned and analyzed prior to PI boundary, prioritized, and have acc. criteria.Solution Predictability Aggregation of individual predictability measures for ARTs to assess the overall predictability of Solution Trains.Solution Performance Aggregation of individual performance measures for ARTs to assess the overall performance of Solution Trains.Economic Framework Decision rules to align work to financial objectives of Solution and guide economic decision‐making process.
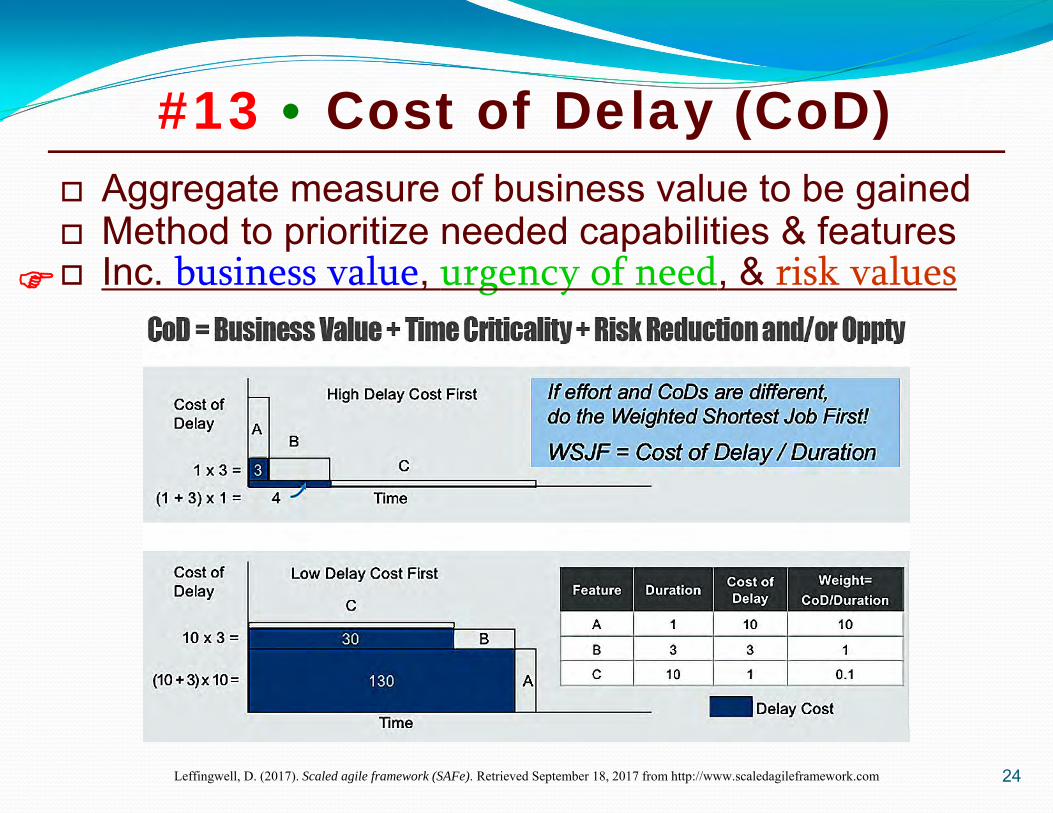
WSJF Prioritization model used to sequence jobs (e.g., Features, Capabilities, and Epics) to maximize economic benefit.Cost of Delay A way of communicating the impact of time on the outcomes we hope to achieve, i.e., combining urgency and value.
Duration (Job Size) Length of time required to complete an epic, enabler, capability, or feature, i.e., size or complexity in story points.
Prog
ram
Feature Progress Tracks feature and enabler status during PI and indicates which features are on track or behind, i.e., plan vs. actual.Program Kanban Ensures Features are reasoned and analyzed prior to a PI boundary, prioritized, and have acceptance criteria.
Program Predictability Aggregation of Team PI Performance Reports to assess the predictability of ART, i.e., planned vs. actual business value.Program Performance Aggregation of team metrics collected at end of PI, i.e., functionality (velocity, etc.) and quality (tests, defects, etc.).PI Burn-down Chart Shows progress toward PI timebox to track work planned for PI against work accepted, i.e., iterations vs. story points.
Cumulative Flow Graph to visualize amount of work waiting to be done (backlog), work in progress (started), and completed (validated).Art Self Assessment Structured, periodic self‐assessment to continuously measure and improve program processes.
Team
CD Pipeline Efficiency Measures efficiency of steps in terms of touch and wait time, i.e., analysis, backlog, build, validate, deploy, release, etc.Deployments and Releases Deployment and release frequency progress as a ratio of deployment to production vs. product release frequency.
Recovery over time How often physical or logical rollbacks performed by overlaying points in time for deployment, release, and rollbacks.Innovation Indicators Hypothesis measures of MMF and MVP business outcomes based upon actionable innovation accounting measures.Hypotheses Tested Number of successful vs. unsuccessful hypothesis tests (with goal of increasing the number, frequency, and success).Team Performance Individual team metrics collected at end of PI, i.e., functionality (velocity, etc.) and quality (tests, defects, etc.).
Team Kanban Ensures Stories and tasks are reasoned and analyzed prior to a PI boundary, prioritized, and have acceptance criteria.Team Business Value Estimate of actual business value achieved for each team’s PI objectives during a PI demo by customer and agile team.
Team Self-Assessment Structured, periodic self‐assessment to continuously measure and improve team processes.
9
Basic SAFe metrics & assessments at all levels Many are rollups of burndown, velocity, & bus. value Multi-level kanbans, backlogs, & performance tracking
Agile SAFe Metrics
Leffingwell, D. (2017). Scaled agile framework (SAFe). Retrieved September 18, 2017 from http://www.scaledagileframework.com
10
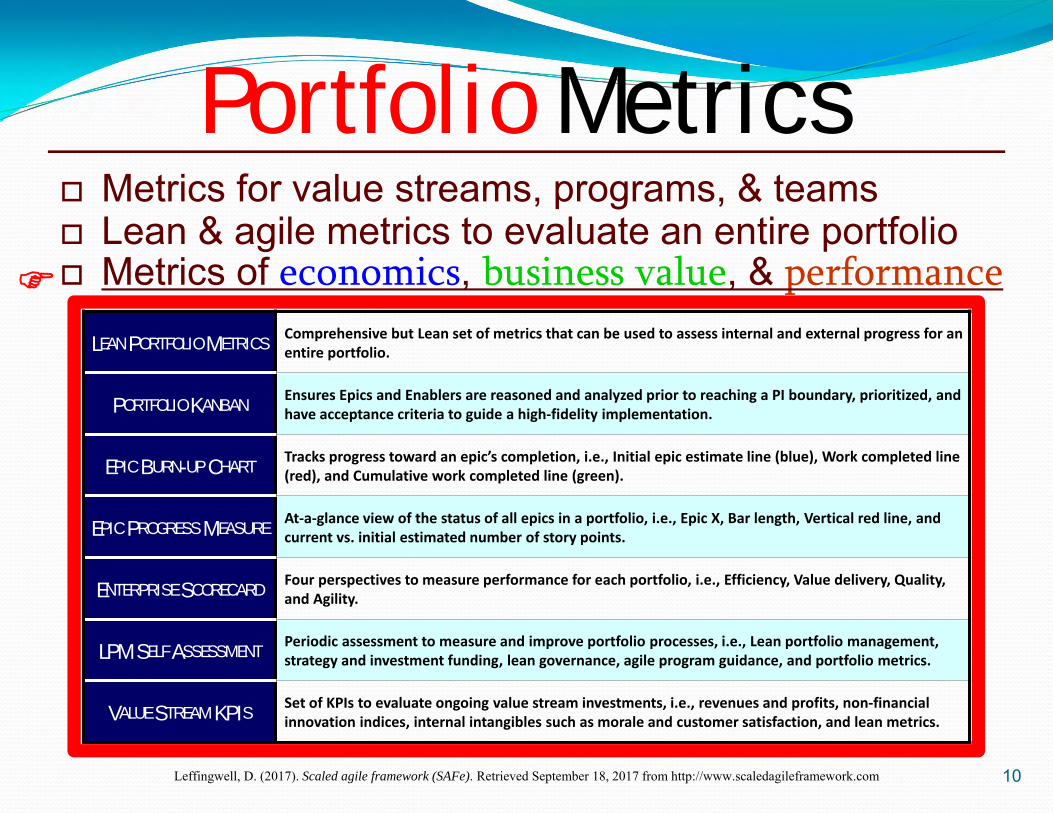
Metrics for value streams, programs, & teams Lean & agile metrics to evaluate an entire portfolio Metrics of economics, business value, & performance
Portfolio Metrics
LEAN PORTFOLIO METRICSComprehensive but Lean set of metrics that can be used to assess internal and external progress for an entire portfolio.
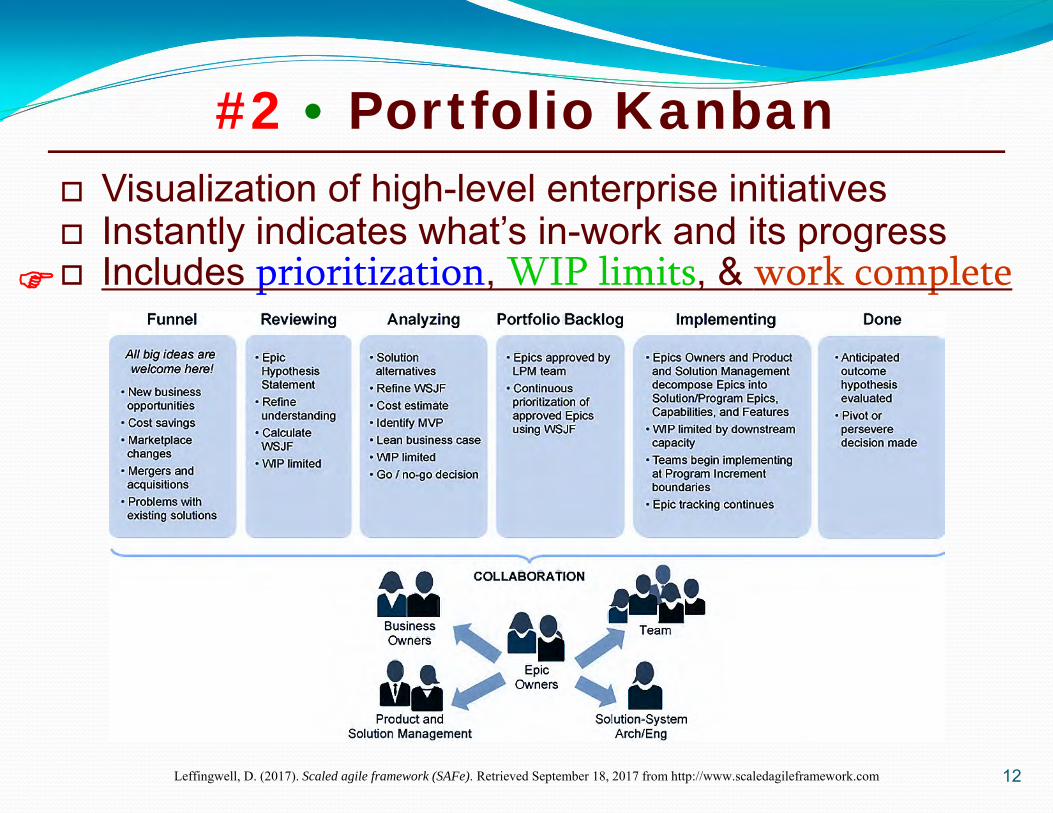
PORTFOLIO KANBANEnsures Epics and Enablers are reasoned and analyzed prior to reaching a PI boundary, prioritized, and have acceptance criteria to guide a high‐fidelity implementation.
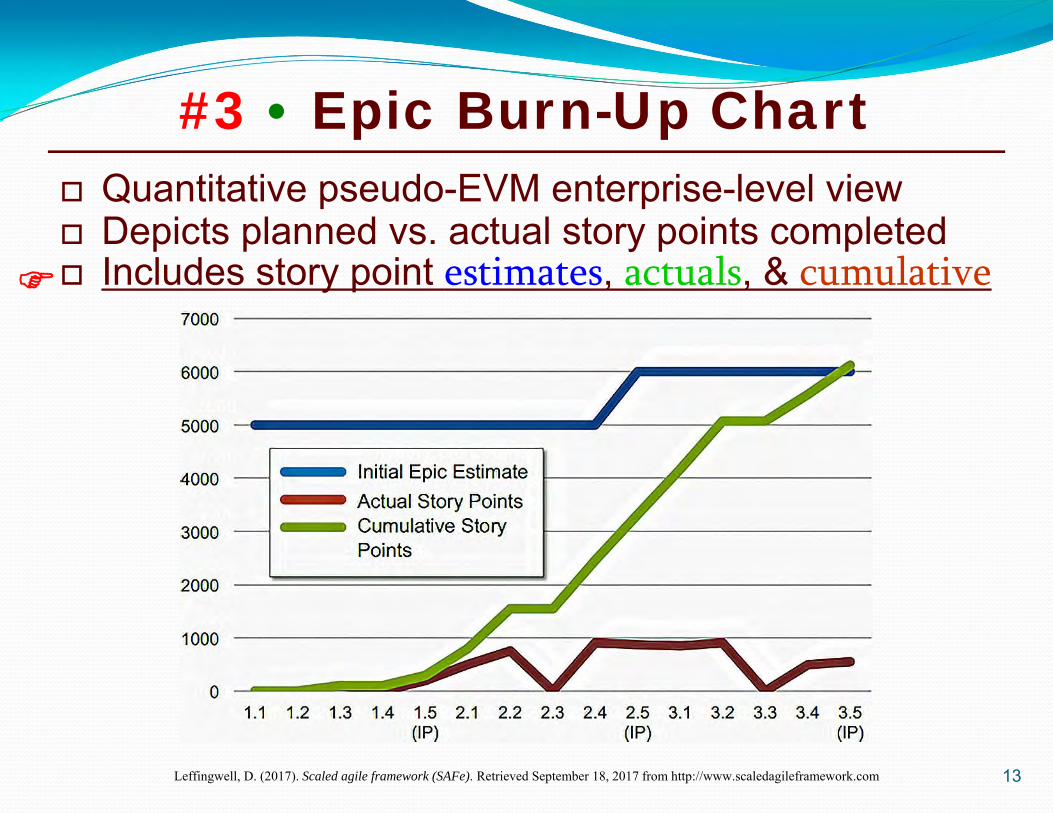
EPIC BURN-UP CHARTTracks progress toward an epic’s completion, i.e., Initial epic estimate line (blue), Work completed line (red), and Cumulative work completed line (green).
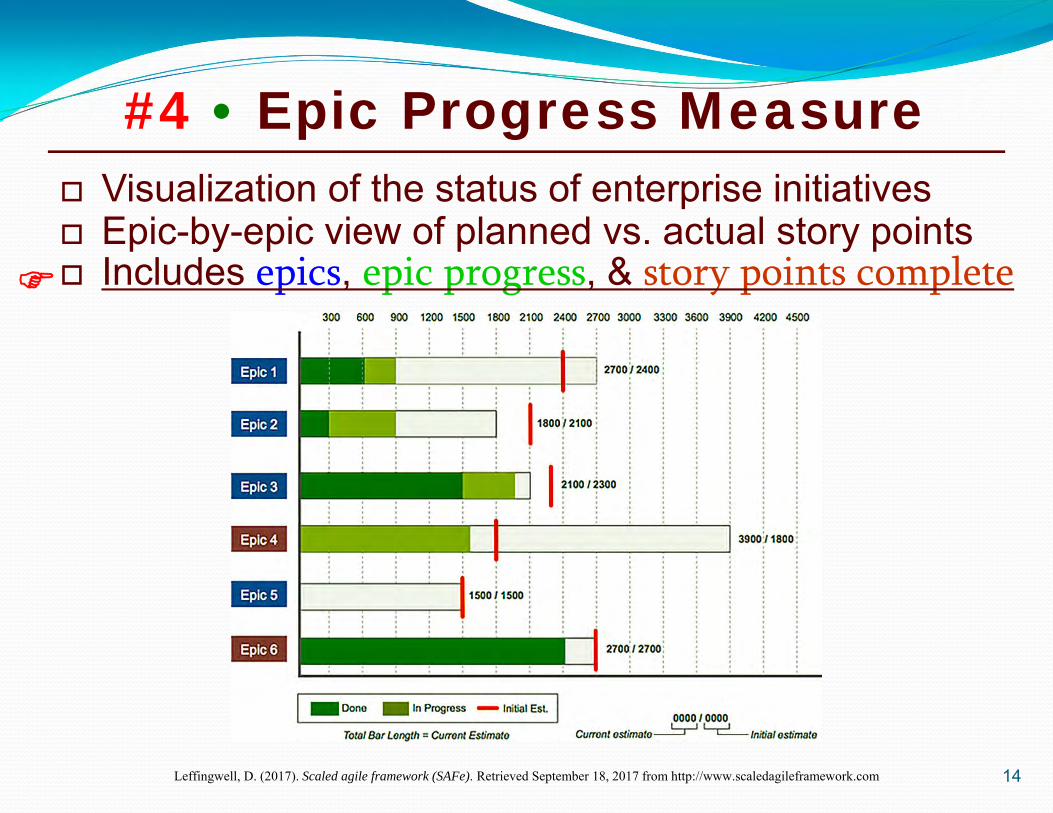
EPIC PROGRESS MEASUREAt‐a‐glance view of the status of all epics in a portfolio, i.e., Epic X, Bar length, Vertical red line, and current vs. initial estimated number of story points.
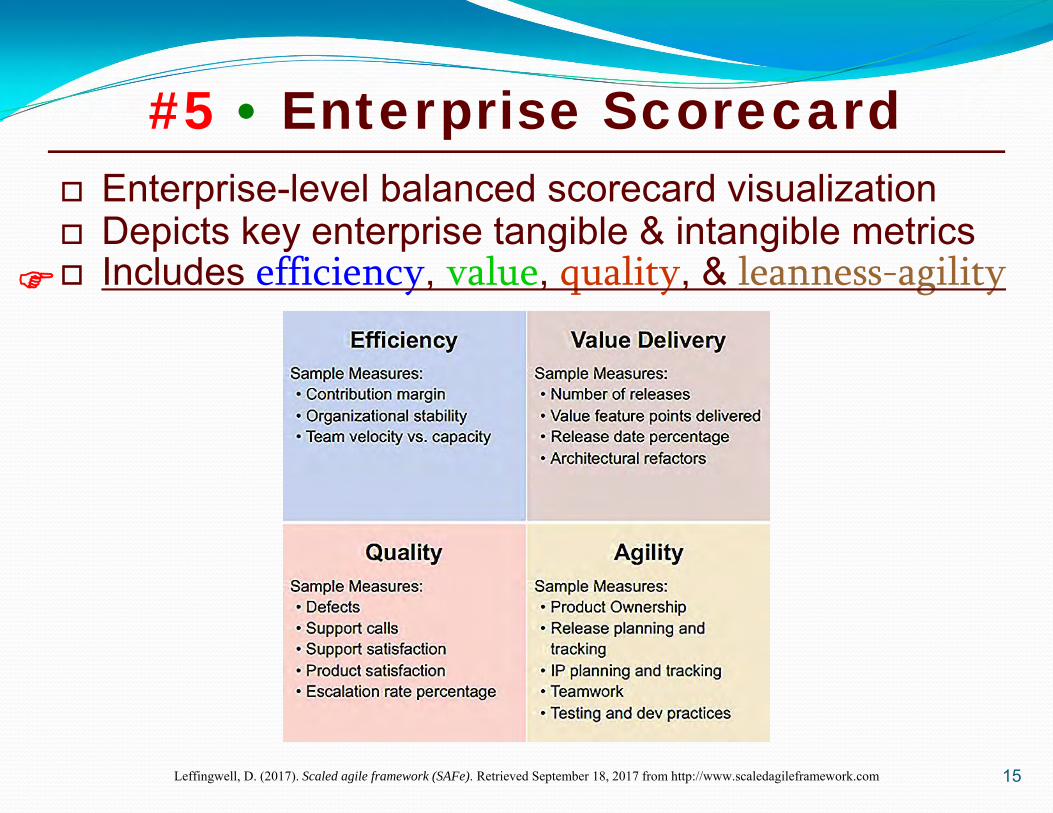
ENTERPRISE SCORECARDFour perspectives to measure performance for each portfolio, i.e., Efficiency, Value delivery, Quality, and Agility.
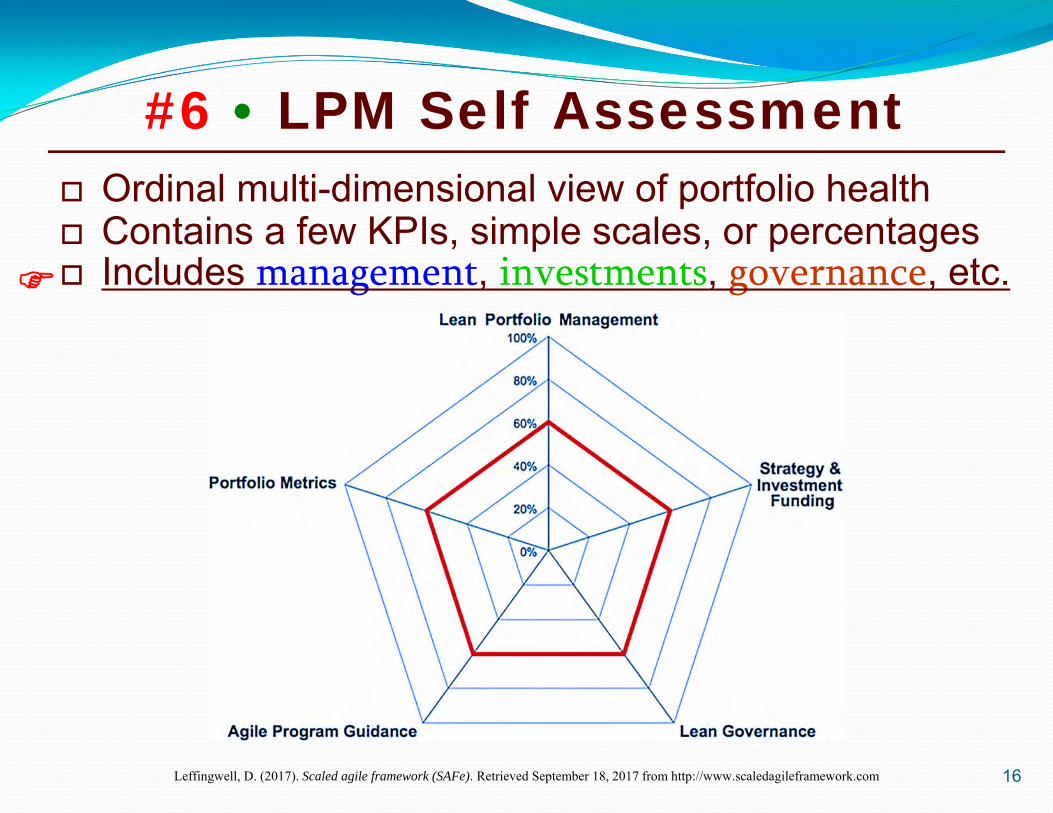
LPM SELF ASSESSMENTPeriodic assessment to measure and improve portfolio processes, i.e., Lean portfolio management, strategy and investment funding, lean governance, agile program guidance, and portfolio metrics.
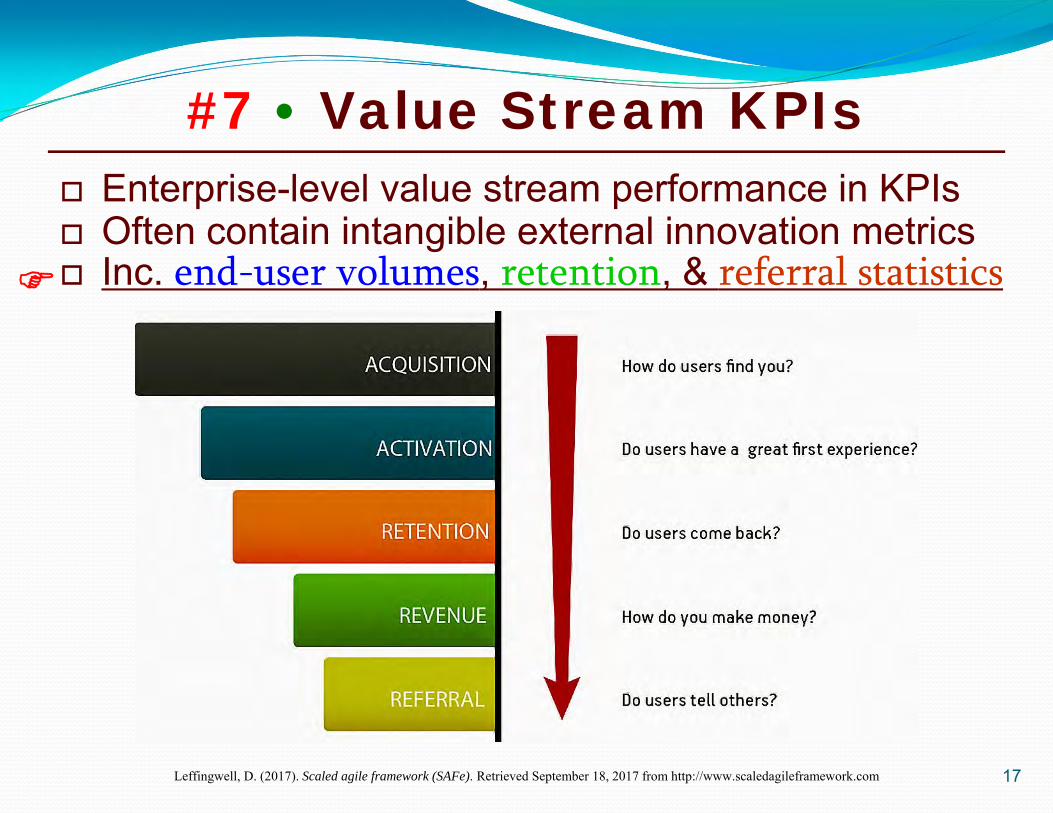
VALUE STREAM KPISSet of KPIs to evaluate ongoing value stream investments, i.e., revenues and profits, non‐financial innovation indices, internal intangibles such as morale and customer satisfaction, and lean metrics.
Leffingwell, D. (2017). Scaled agile framework (SAFe). Retrieved September 18, 2017 from http://www.scaledagileframework.com
11
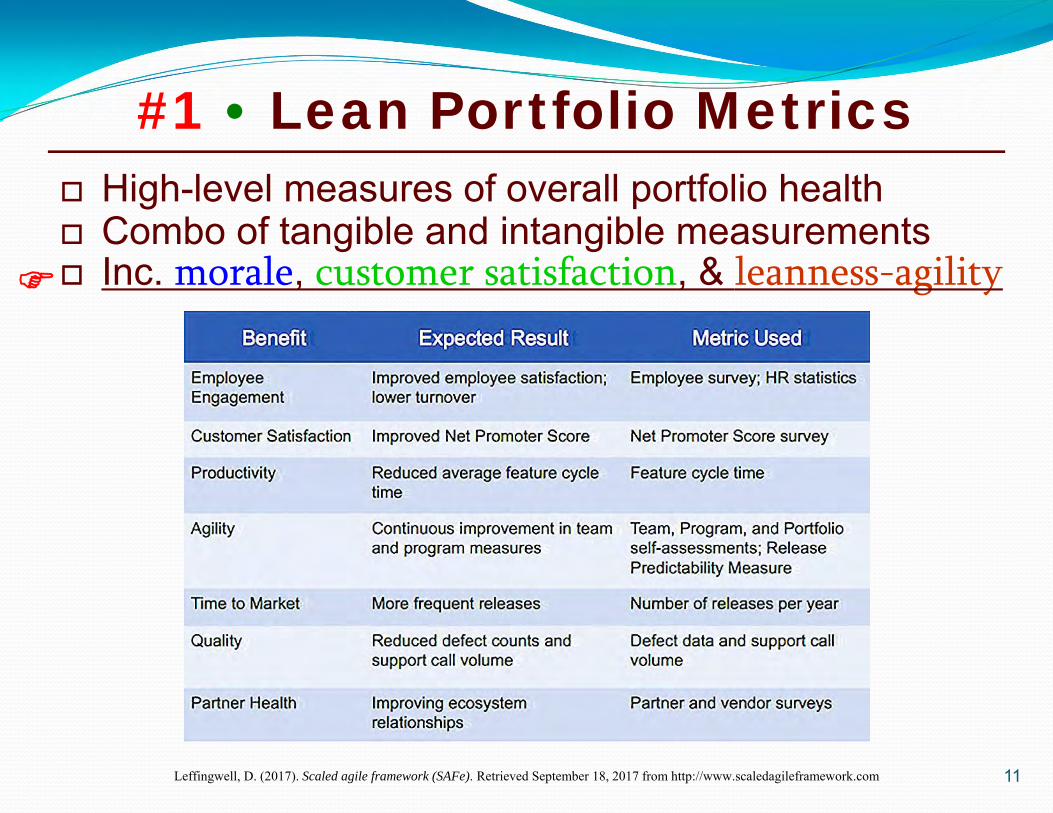
High-level measures of overall portfolio health Combo of tangible and intangible measurements Inc. morale, customer satisfaction, & leanness-agility
#1 • Lean Portfolio Metrics
Leffingwell, D. (2017). Scaled agile framework (SAFe). Retrieved September 18, 2017 from http://www.scaledagileframework.com
12
Visualization of high-level enterprise initiatives Instantly indicates what’s in-work and its progress Includes prioritization, WIP limits, & work complete
#2 • Portfolio Kanban
Leffingwell, D. (2017). Scaled agile framework (SAFe). Retrieved September 18, 2017 from http://www.scaledagileframework.com
13
Quantitative pseudo-EVM enterprise-level view Depicts planned vs. actual story points completed Includes story point estimates, actuals, & cumulative
#3 • Epic Burn-Up Chart
Leffingwell, D. (2017). Scaled agile framework (SAFe). Retrieved September 18, 2017 from http://www.scaledagileframework.com
14
Visualization of the status of enterprise initiatives Epic-by-epic view of planned vs. actual story points Includes epics, epic progress, & story points complete
#4 • Epic Progress Measure
Leffingwell, D. (2017). Scaled agile framework (SAFe). Retrieved September 18, 2017 from http://www.scaledagileframework.com
15
Enterprise-level balanced scorecard visualization Depicts key enterprise tangible & intangible metrics Includes efficiency, value, quality, & leanness-agility
#5 • Enterprise Scorecard
Leffingwell, D. (2017). Scaled agile framework (SAFe). Retrieved September 18, 2017 from http://www.scaledagileframework.com
16
Ordinal multi-dimensional view of portfolio health Contains a few KPIs, simple scales, or percentages Includes management, investments, governance, etc.
#6 • LPM Self Assessment
Leffingwell, D. (2017). Scaled agile framework (SAFe). Retrieved September 18, 2017 from http://www.scaledagileframework.com
17
Enterprise-level value stream performance in KPIs Often contain intangible external innovation metrics Inc. end-user volumes, retention, & referral statistics
#7 • Value Stream KPIs
Leffingwell, D. (2017). Scaled agile framework (SAFe). Retrieved September 18, 2017 from http://www.scaledagileframework.com
18
Large Solution Metrics
Leffingwell, D. (2017). Scaled agile framework (SAFe). Retrieved September 18, 2017 from http://www.scaledagileframework.com
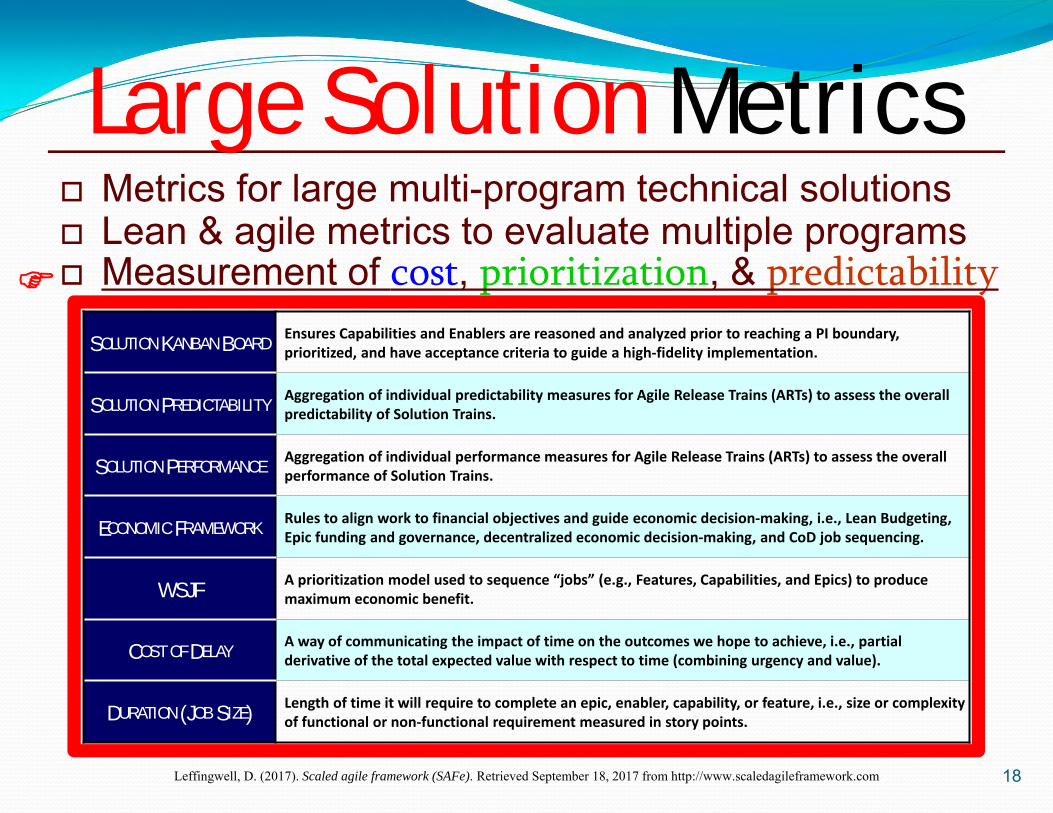
SOLUTION KANBAN BOARDEnsures Capabilities and Enablers are reasoned and analyzed prior to reaching a PI boundary, prioritized, and have acceptance criteria to guide a high‐fidelity implementation.
SOLUTION PREDICTABILITYAggregation of individual predictability measures for Agile Release Trains (ARTs) to assess the overall predictability of Solution Trains.
SOLUTION PERFORMANCEAggregation of individual performance measures for Agile Release Trains (ARTs) to assess the overall performance of Solution Trains.
ECONOMIC FRAMEWORKRules to align work to financial objectives and guide economic decision‐making, i.e., Lean Budgeting, Epic funding and governance, decentralized economic decision‐making, and CoD job sequencing.
WSJFA prioritization model used to sequence “jobs” (e.g., Features, Capabilities, and Epics) to produce maximum economic benefit.
COST OF DELAYA way of communicating the impact of time on the outcomes we hope to achieve, i.e., partial derivative of the total expected value with respect to time (combining urgency and value).
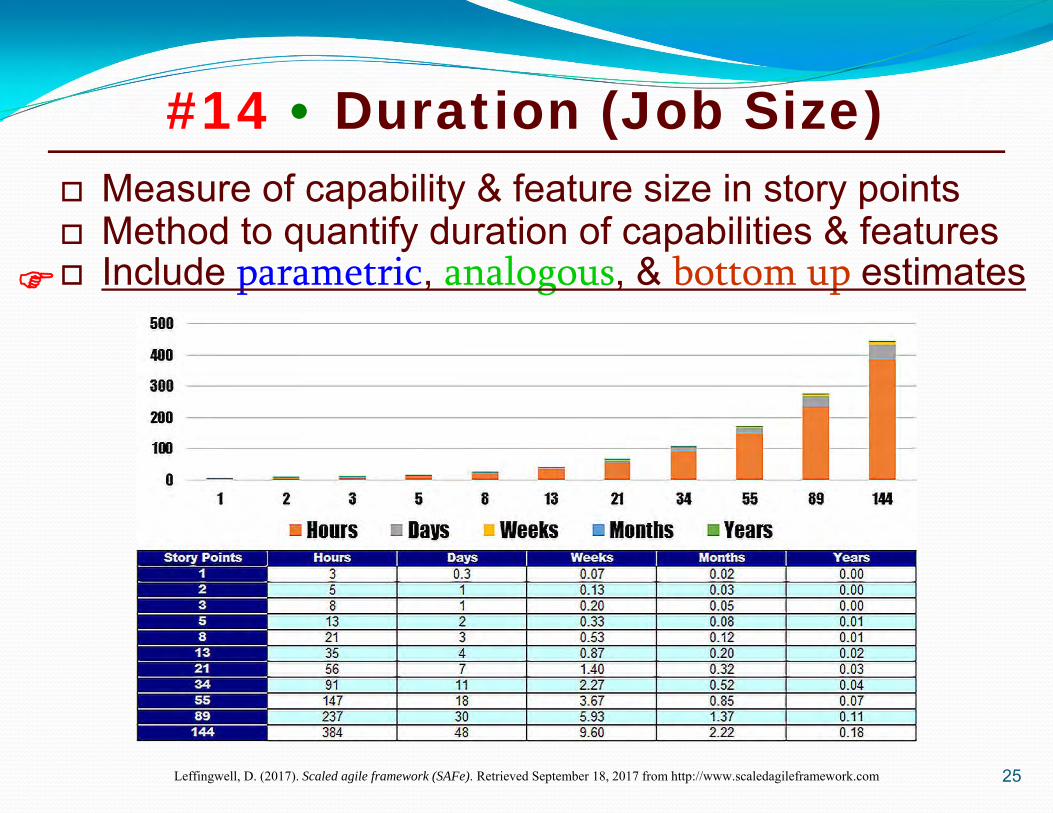
DURATION (JOB SIZE)Length of time it will require to complete an epic, enabler, capability, or feature, i.e., size or complexity of functional or non‐functional requirement measured in story points.
Metrics for large multi-program technical solutions Lean & agile metrics to evaluate multiple programs Measurement of cost, prioritization, & predictability
19
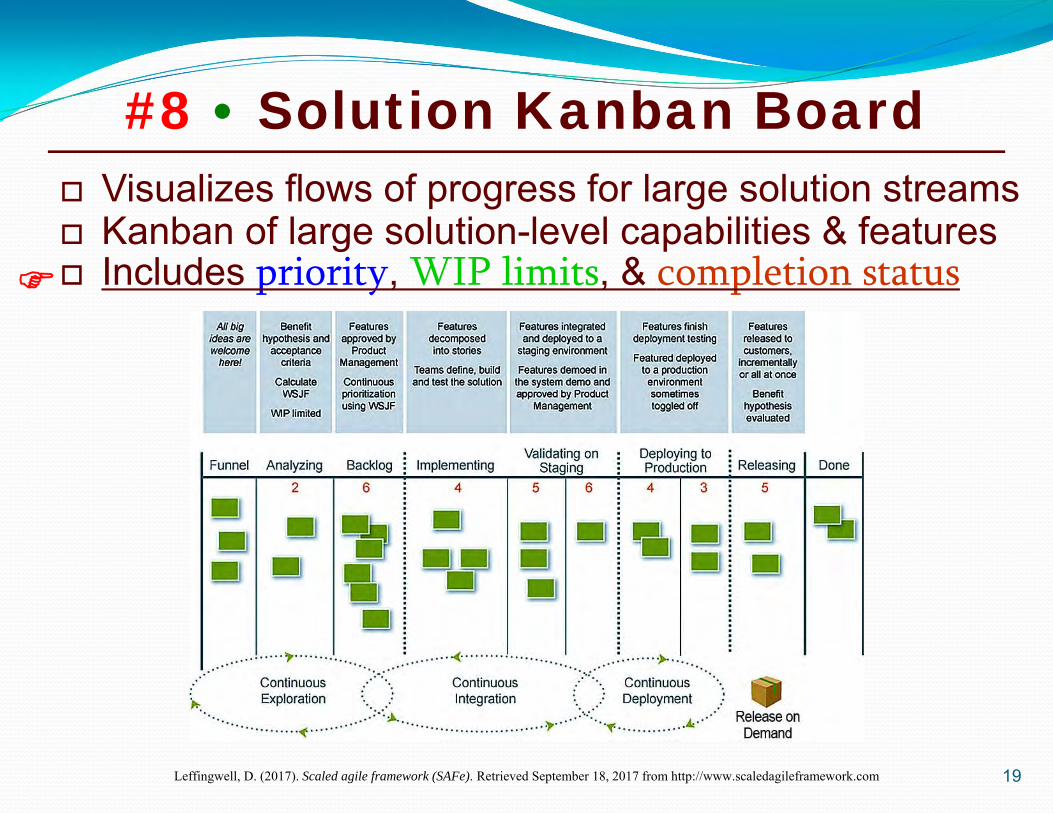
Visualizes flows of progress for large solution streams Kanban of large solution-level capabilities & features Includes priority, WIP limits, & completion status
#8 • Solution Kanban Board
Leffingwell, D. (2017). Scaled agile framework (SAFe). Retrieved September 18, 2017 from http://www.scaledagileframework.com
20
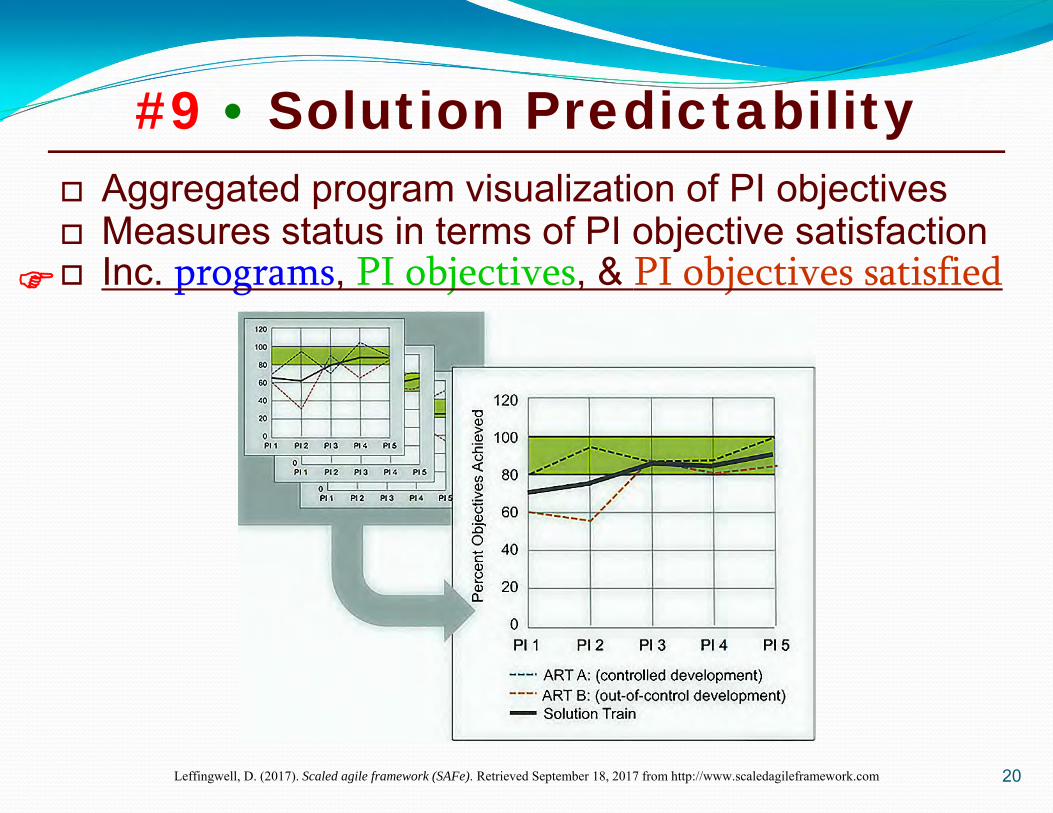
Aggregated program visualization of PI objectives Measures status in terms of PI objective satisfaction Inc. programs, PI objectives, & PI objectives satisfied
#9 • Solution Predictability
Leffingwell, D. (2017). Scaled agile framework (SAFe). Retrieved September 18, 2017 from http://www.scaledagileframework.com
21
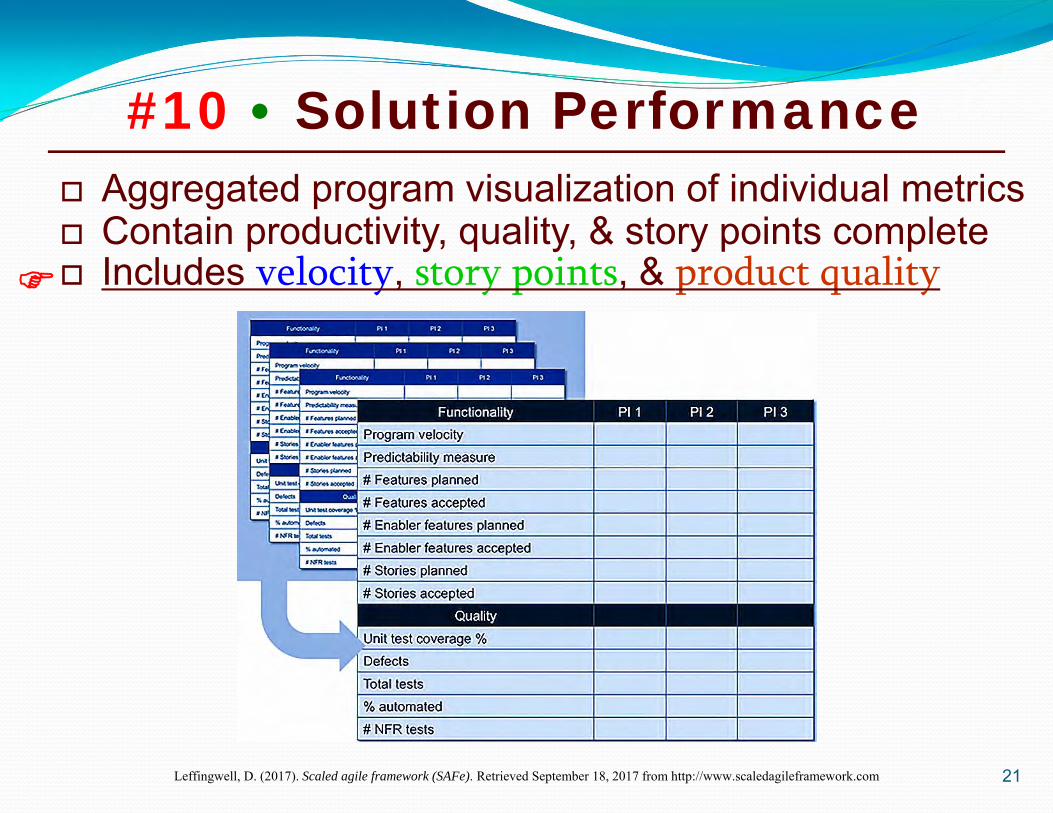
Aggregated program visualization of individual metrics Contain productivity, quality, & story points complete Includes velocity, story points, & product quality
#10 • Solution Performance
Leffingwell, D. (2017). Scaled agile framework (SAFe). Retrieved September 18, 2017 from http://www.scaledagileframework.com
22
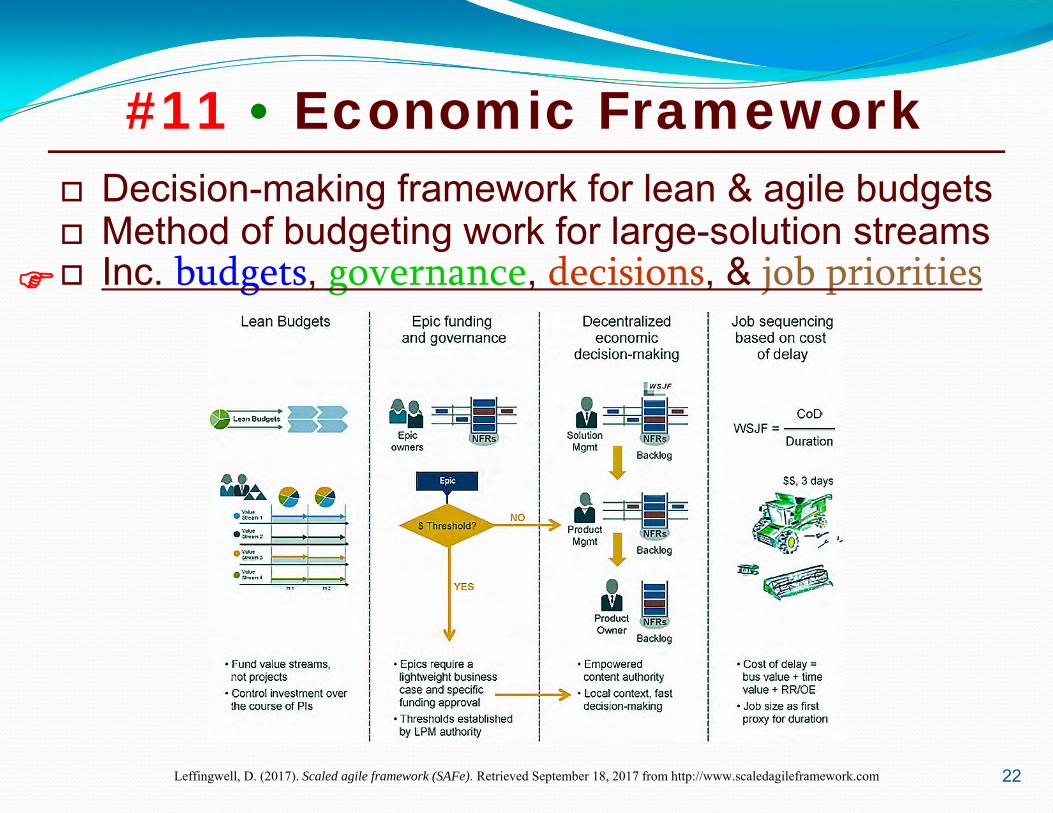
Decision-making framework for lean & agile budgets Method of budgeting work for large-solution streams Inc. budgets, governance, decisions, & job priorities
#11 • Economic Framework
Leffingwell, D. (2017). Scaled agile framework (SAFe). Retrieved September 18, 2017 from http://www.scaledagileframework.com
23
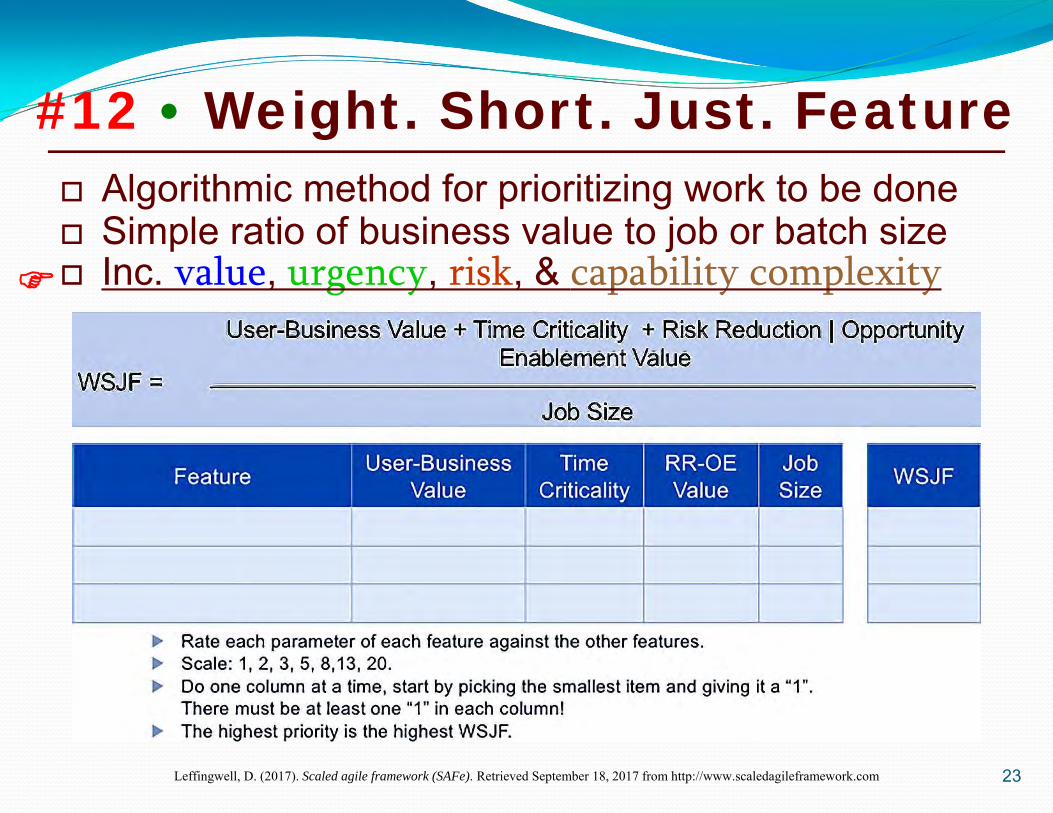
Algorithmic method for prioritizing work to be done Simple ratio of business value to job or batch size Inc. value, urgency, risk, & capability complexity
#12 • Weight. Short. Just. Feature
Leffingwell, D. (2017). Scaled agile framework (SAFe). Retrieved September 18, 2017 from http://www.scaledagileframework.com
24
Aggregate measure of business value to be gained Method to prioritize needed capabilities & features Inc. business value, urgency of need, & risk values
#13 • Cost of Delay (CoD)
Leffingwell, D. (2017). Scaled agile framework (SAFe). Retrieved September 18, 2017 from http://www.scaledagileframework.com
25
Measure of capability & feature size in story points Method to quantify duration of capabilities & features Include parametric, analogous, & bottom up estimates
#14 • Duration (Job Size)
Leffingwell, D. (2017). Scaled agile framework (SAFe). Retrieved September 18, 2017 from http://www.scaledagileframework.com
26
Program Metrics
Leffingwell, D. (2017). Scaled agile framework (SAFe). Retrieved September 18, 2017 from http://www.scaledagileframework.com
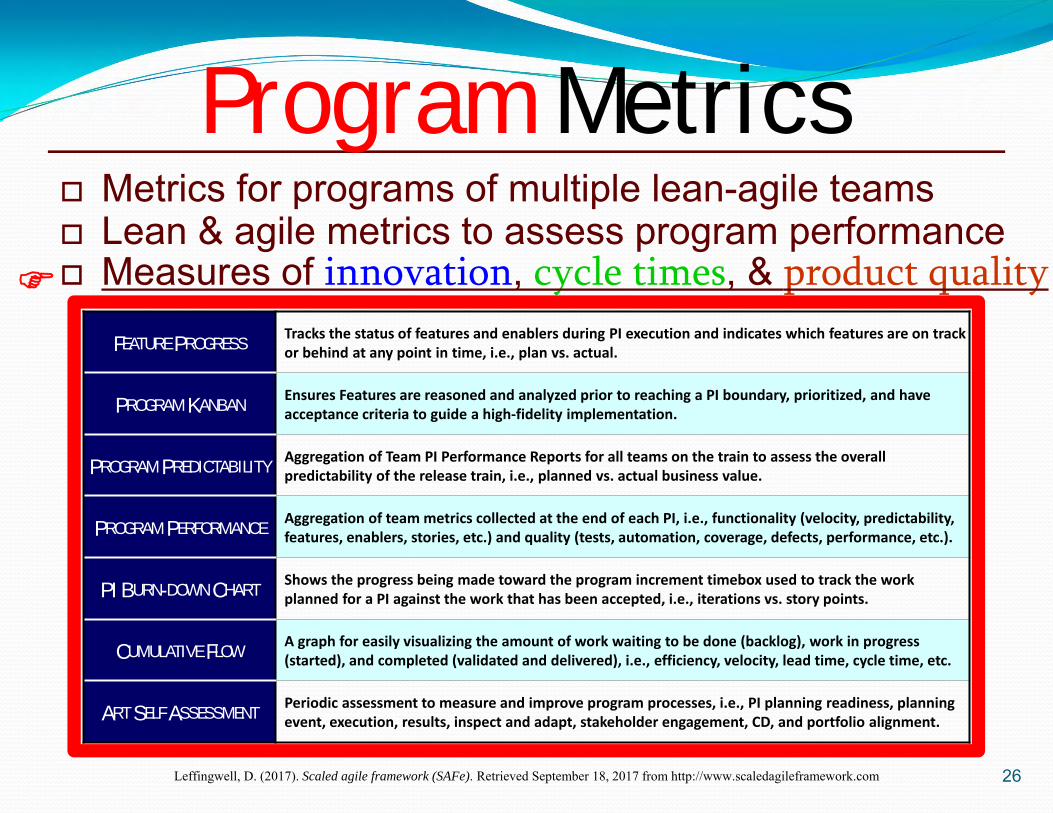
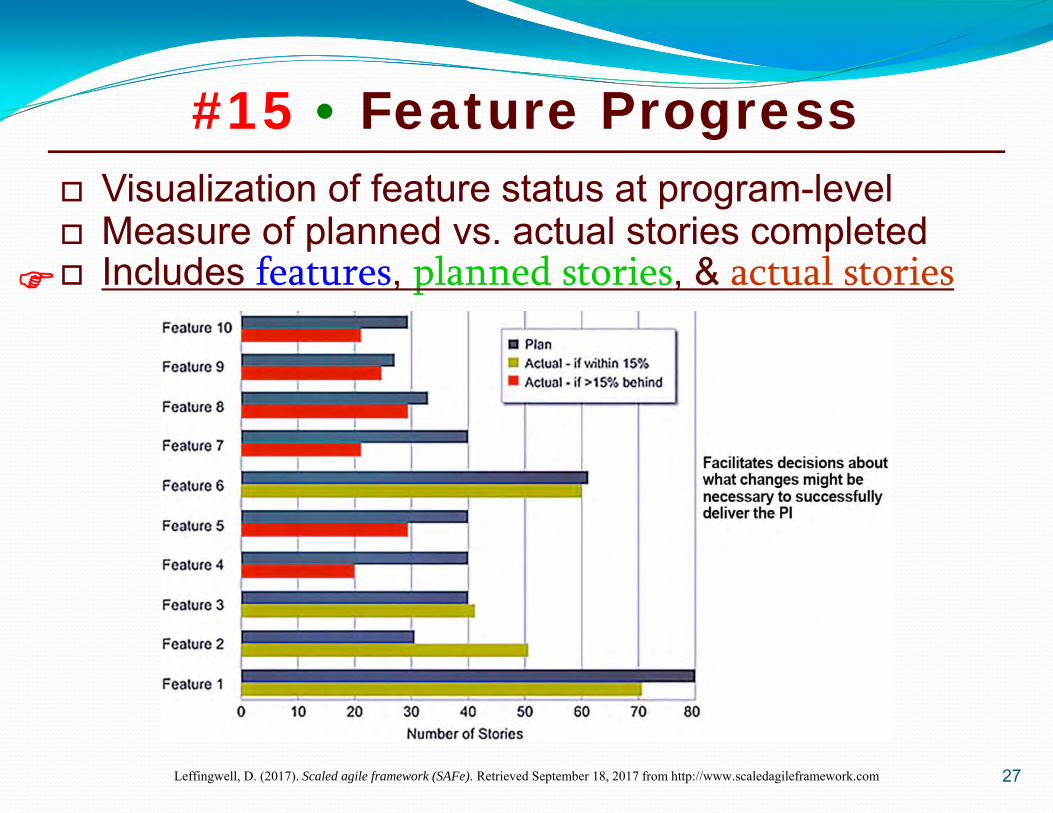
FEATURE PROGRESSTracks the status of features and enablers during PI execution and indicates which features are on track or behind at any point in time, i.e., plan vs. actual.
PROGRAM KANBANEnsures Features are reasoned and analyzed prior to reaching a PI boundary, prioritized, and have acceptance criteria to guide a high‐fidelity implementation.
PROGRAM PREDICTABILITYAggregation of Team PI Performance Reports for all teams on the train to assess the overall predictability of the release train, i.e., planned vs. actual business value.
PROGRAM PERFORMANCEAggregation of team metrics collected at the end of each PI, i.e., functionality (velocity, predictability, features, enablers, stories, etc.) and quality (tests, automation, coverage, defects, performance, etc.).
PI BURN-DOWN CHARTShows the progress being made toward the program increment timebox used to track the work planned for a PI against the work that has been accepted, i.e., iterations vs. story points.
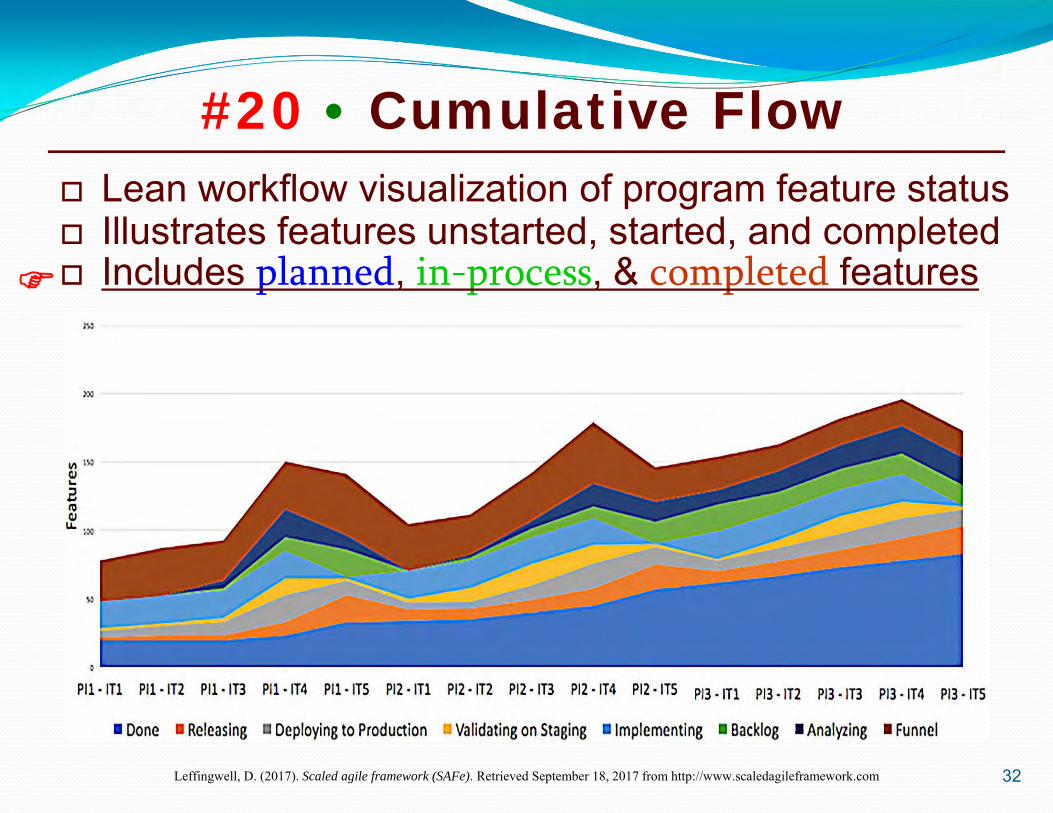
CUMULATIVE FLOWA graph for easily visualizing the amount of work waiting to be done (backlog), work in progress (started), and completed (validated and delivered), i.e., efficiency, velocity, lead time, cycle time, etc.
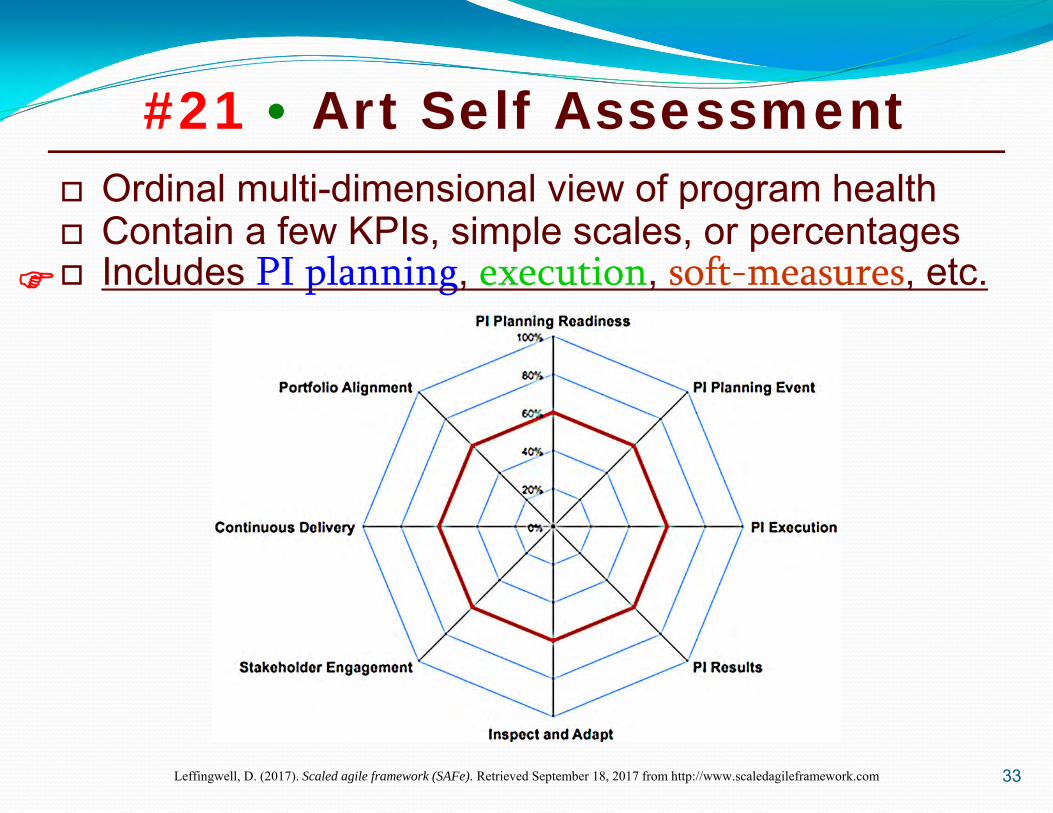
ART SELF ASSESSMENTPeriodic assessment to measure and improve program processes, i.e., PI planning readiness, planning event, execution, results, inspect and adapt, stakeholder engagement, CD, and portfolio alignment.
Metrics for programs of multiple lean-agile teams Lean & agile metrics to assess program performance Measures of innovation, cycle times, & product quality
27
Visualization of feature status at program-level Measure of planned vs. actual stories completed Includes features, planned stories, & actual stories
#15 • Feature Progress
Leffingwell, D. (2017). Scaled agile framework (SAFe). Retrieved September 18, 2017 from http://www.scaledagileframework.com
28
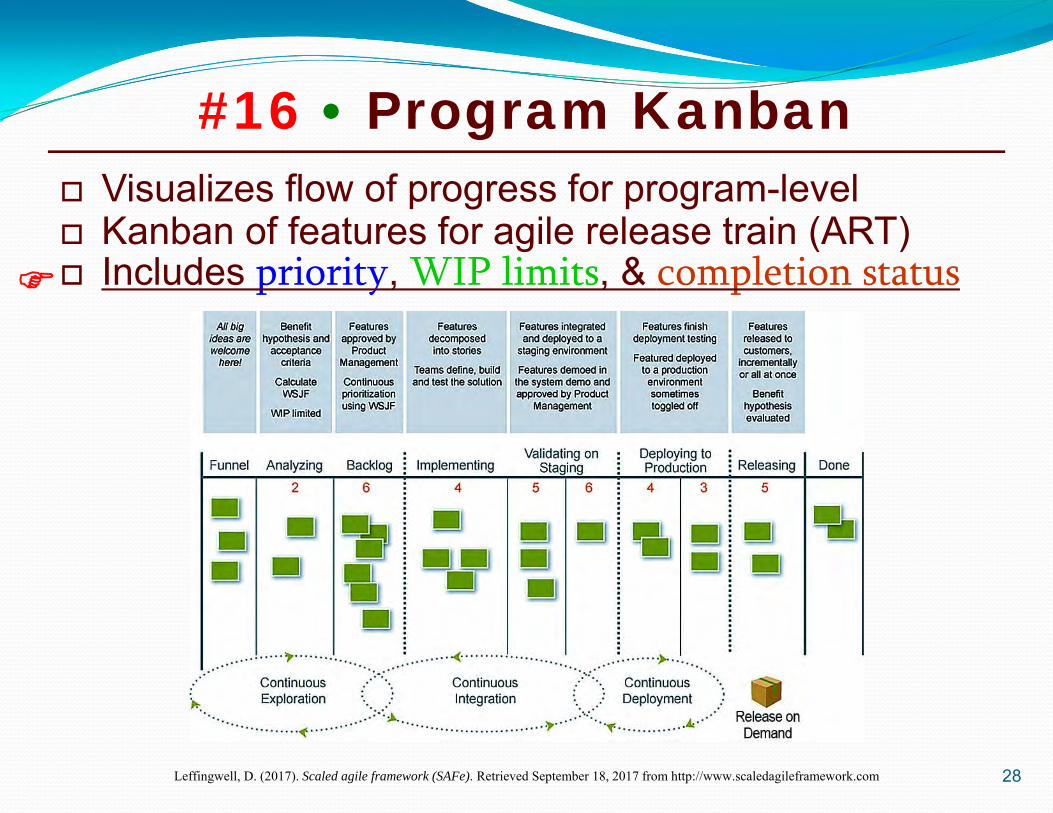
#16 • Program Kanban
Leffingwell, D. (2017). Scaled agile framework (SAFe). Retrieved September 18, 2017 from http://www.scaledagileframework.com
Visualizes flow of progress for program-level Kanban of features for agile release train (ART) Includes priority, WIP limits, & completion status
29
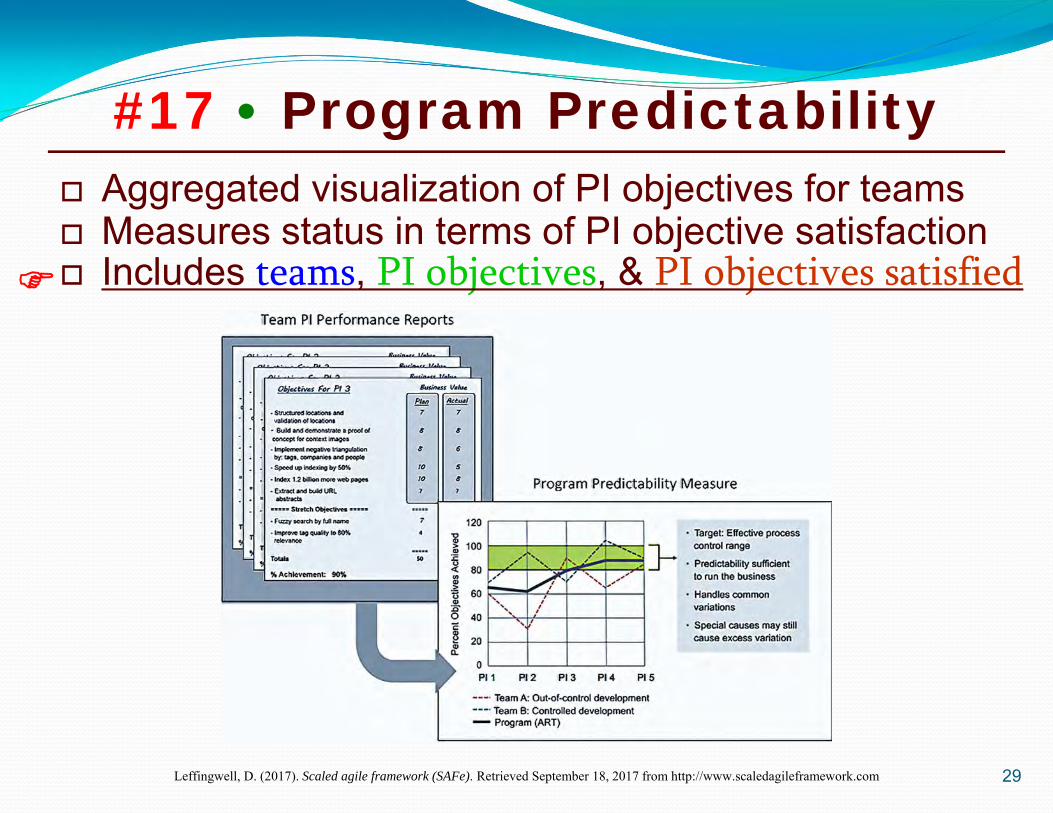
#17 • Program Predictability
Leffingwell, D. (2017). Scaled agile framework (SAFe). Retrieved September 18, 2017 from http://www.scaledagileframework.com
Aggregated visualization of PI objectives for teams Measures status in terms of PI objective satisfaction Includes teams, PI objectives, & PI objectives satisfied
30
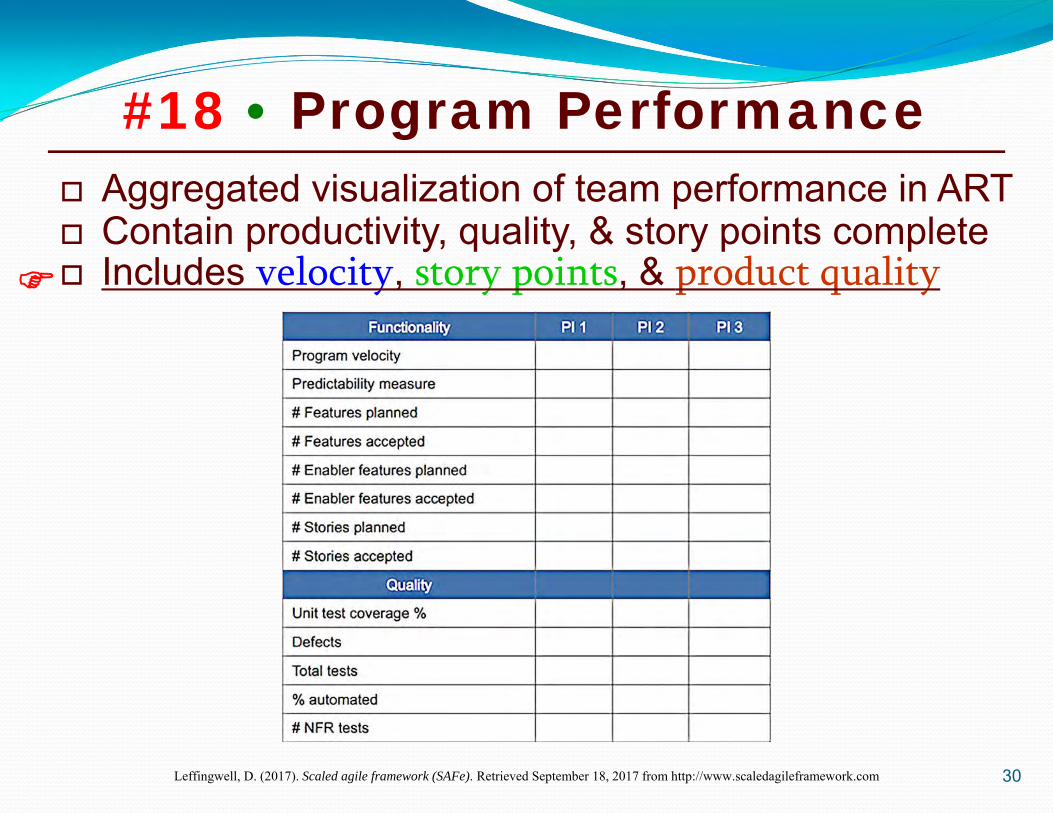
#18 • Program Performance
Leffingwell, D. (2017). Scaled agile framework (SAFe). Retrieved September 18, 2017 from http://www.scaledagileframework.com
Aggregated visualization of team performance in ART Contain productivity, quality, & story points complete Includes velocity, story points, & product quality
31
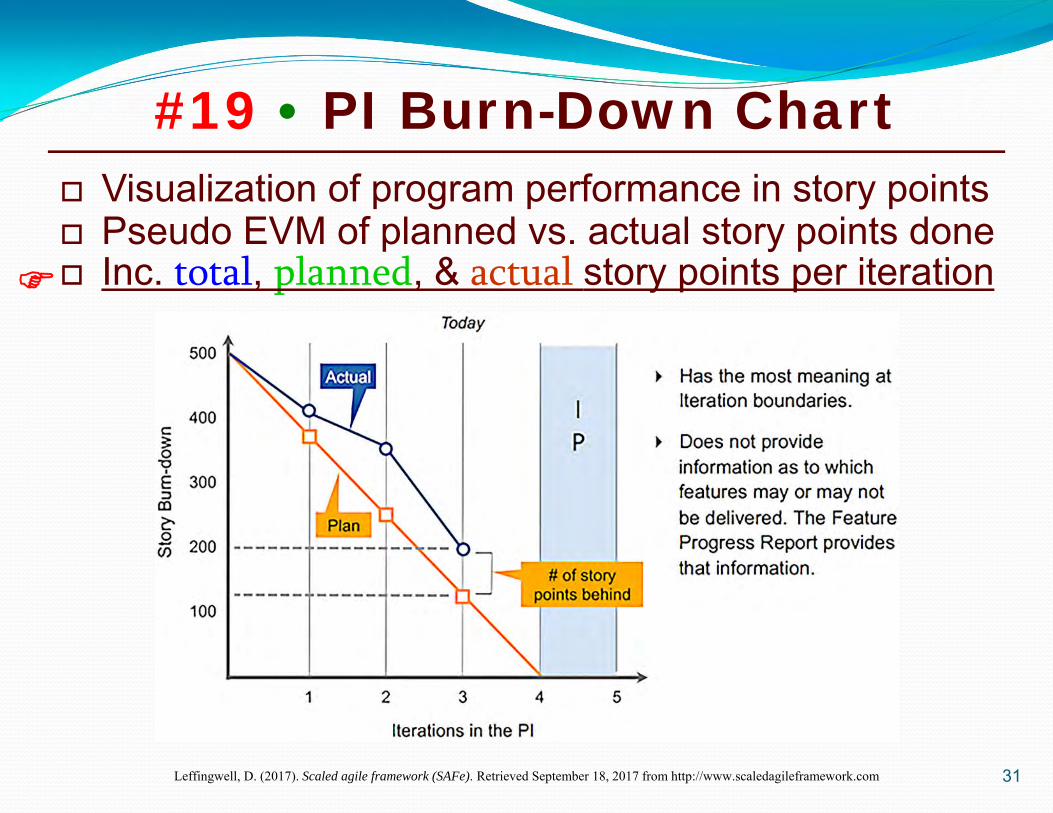
Visualization of program performance in story points Pseudo EVM of planned vs. actual story points done Inc. total, planned, & actual story points per iteration
#19 • PI Burn-Down Chart
Leffingwell, D. (2017). Scaled agile framework (SAFe). Retrieved September 18, 2017 from http://www.scaledagileframework.com
32
Lean workflow visualization of program feature status Illustrates features unstarted, started, and completed Includes planned, in-process, & completed features
#20 • Cumulative Flow
Leffingwell, D. (2017). Scaled agile framework (SAFe). Retrieved September 18, 2017 from http://www.scaledagileframework.com
33
#21 • Art Self Assessment
Leffingwell, D. (2017). Scaled agile framework (SAFe). Retrieved September 18, 2017 from http://www.scaledagileframework.com
Ordinal multi-dimensional view of program health Contain a few KPIs, simple scales, or percentages Includes PI planning, execution, soft-measures, etc.
34
Team Metrics
Leffingwell, D. (2017). Scaled agile framework (SAFe). Retrieved September 18, 2017 from http://www.scaledagileframework.com
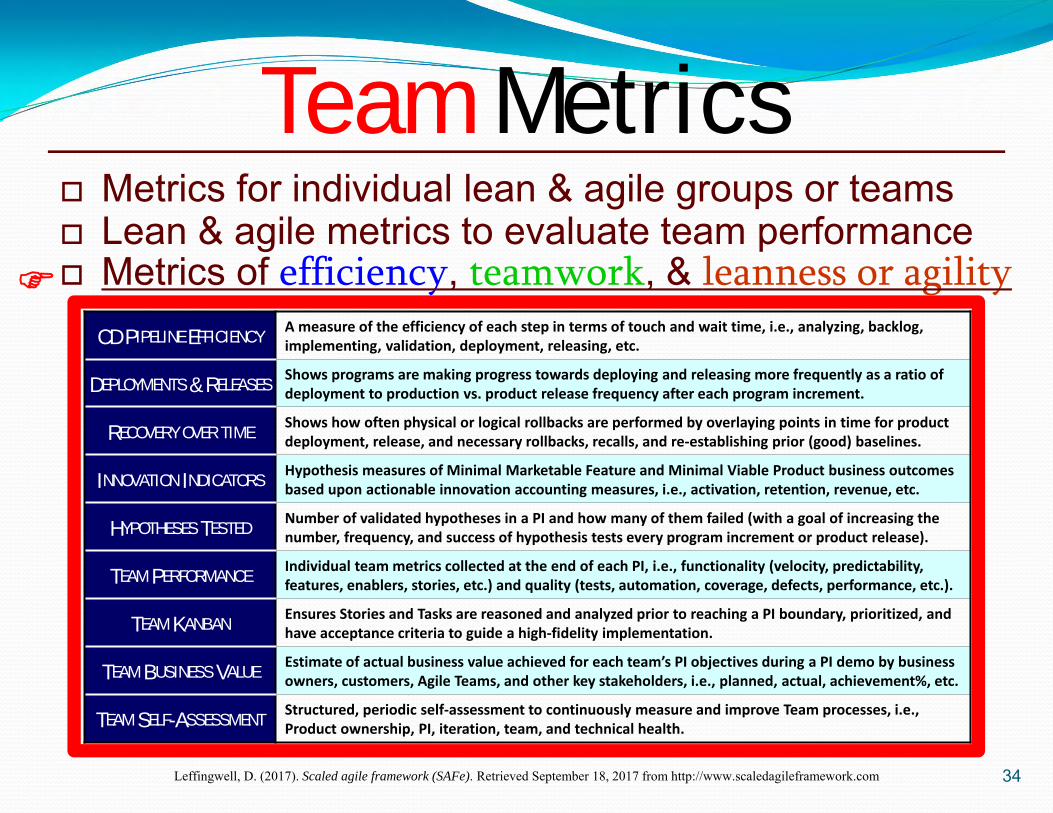
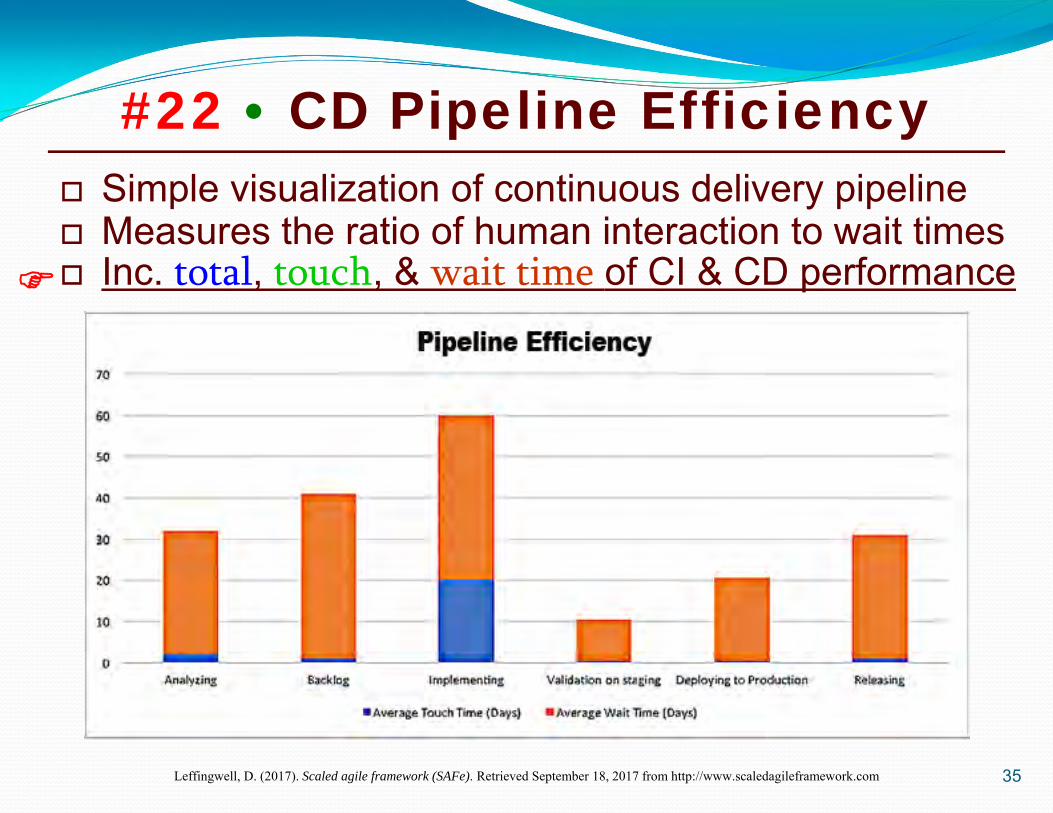
CD PIPELINE EFFICIENCYA measure of the efficiency of each step in terms of touch and wait time, i.e., analyzing, backlog, implementing, validation, deployment, releasing, etc.
DEPLOYMENTS & RELEASESShows programs are making progress towards deploying and releasing more frequently as a ratio of deployment to production vs. product release frequency after each program increment.
RECOVERY OVER TIMEShows how often physical or logical rollbacks are performed by overlaying points in time for product deployment, release, and necessary rollbacks, recalls, and re‐establishing prior (good) baselines.
INNOVATION INDICATORSHypothesis measures of Minimal Marketable Feature and Minimal Viable Product business outcomes based upon actionable innovation accounting measures, i.e., activation, retention, revenue, etc.
HYPOTHESES TESTEDNumber of validated hypotheses in a PI and how many of them failed (with a goal of increasing the number, frequency, and success of hypothesis tests every program increment or product release).
TEAM PERFORMANCEIndividual team metrics collected at the end of each PI, i.e., functionality (velocity, predictability, features, enablers, stories, etc.) and quality (tests, automation, coverage, defects, performance, etc.).
TEAM KANBANEnsures Stories and Tasks are reasoned and analyzed prior to reaching a PI boundary, prioritized, and have acceptance criteria to guide a high‐fidelity implementation.
TEAM BUSINESS VALUEEstimate of actual business value achieved for each team’s PI objectives during a PI demo by business owners, customers, Agile Teams, and other key stakeholders, i.e., planned, actual, achievement%, etc.
TEAM SELF-ASSESSMENTStructured, periodic self‐assessment to continuously measure and improve Team processes, i.e., Product ownership, PI, iteration, team, and technical health.
Metrics for individual lean & agile groups or teams Lean & agile metrics to evaluate team performance Metrics of efficiency, teamwork, & leanness or agility
35
Simple visualization of continuous delivery pipeline Measures the ratio of human interaction to wait times Inc. total, touch, & wait time of CI & CD performance
#22 • CD Pipeline Efficiency
Leffingwell, D. (2017). Scaled agile framework (SAFe). Retrieved September 18, 2017 from http://www.scaledagileframework.com
36
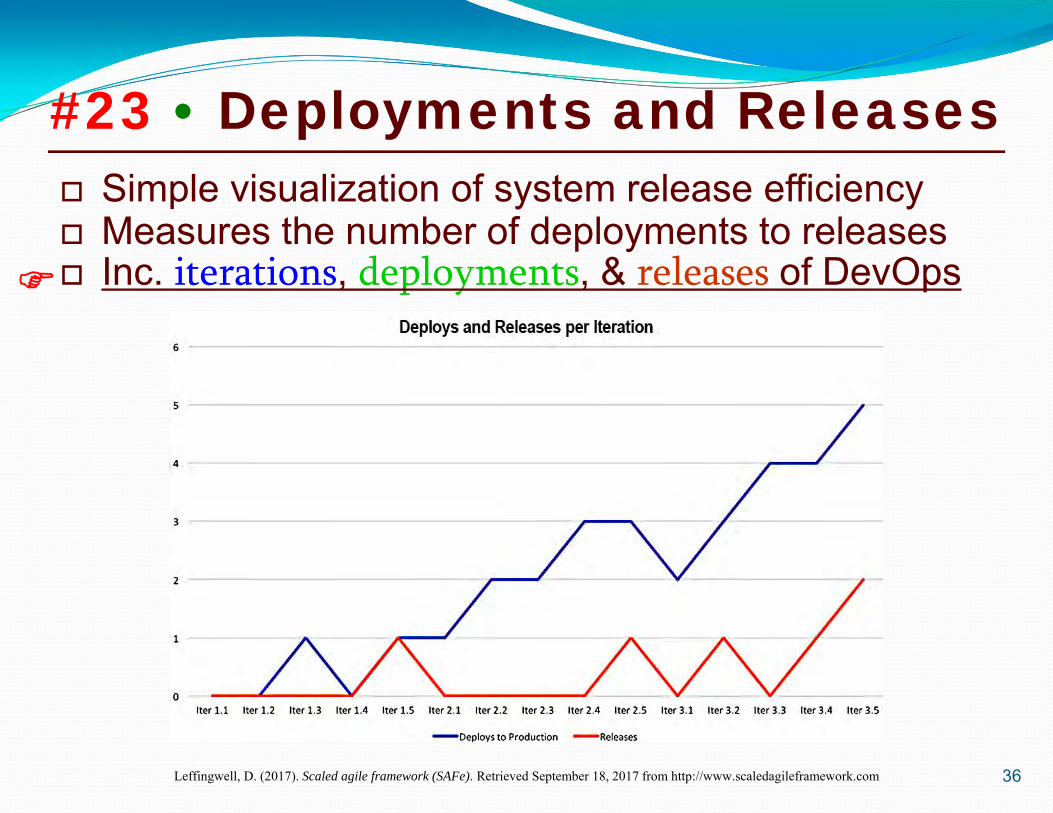
#23 • Deployments and Releases
Leffingwell, D. (2017). Scaled agile framework (SAFe). Retrieved September 18, 2017 from http://www.scaledagileframework.com
Simple visualization of system release efficiency Measures the number of deployments to releases Inc. iterations, deployments, & releases of DevOps
37
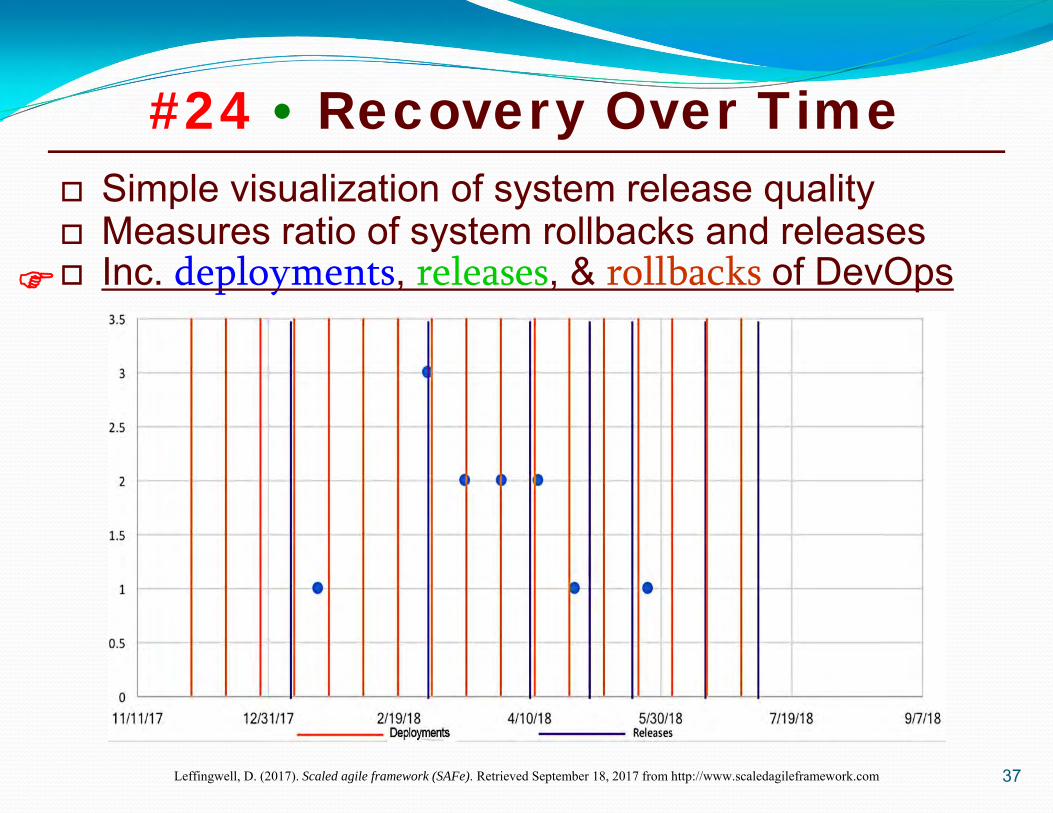
#24 • Recovery Over Time
Leffingwell, D. (2017). Scaled agile framework (SAFe). Retrieved September 18, 2017 from http://www.scaledagileframework.com
Simple visualization of system release quality Measures ratio of system rollbacks and releases Inc. deployments, releases, & rollbacks of DevOps
38
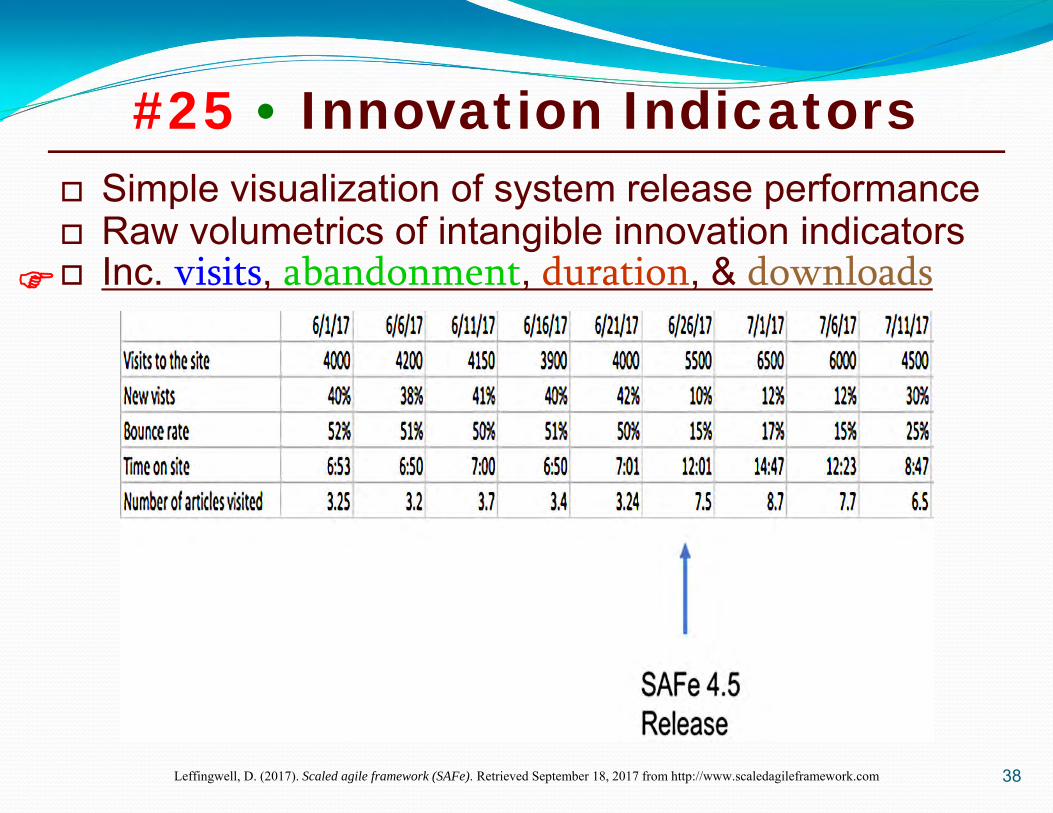
Simple visualization of system release performance Raw volumetrics of intangible innovation indicators Inc. visits, abandonment, duration, & downloads
#25 • Innovation Indicators
Leffingwell, D. (2017). Scaled agile framework (SAFe). Retrieved September 18, 2017 from http://www.scaledagileframework.com
39
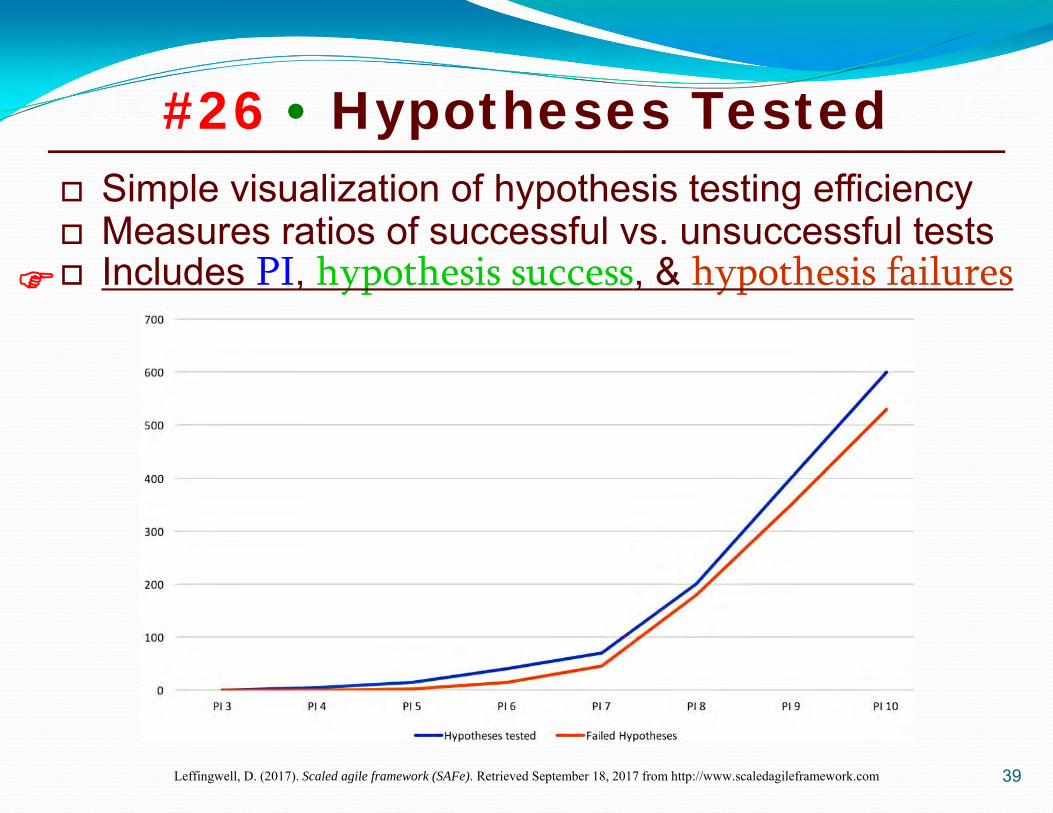
Simple visualization of hypothesis testing efficiency Measures ratios of successful vs. unsuccessful tests Includes PI, hypothesis success, & hypothesis failures
#26 • Hypotheses Tested
Leffingwell, D. (2017). Scaled agile framework (SAFe). Retrieved September 18, 2017 from http://www.scaledagileframework.com
40
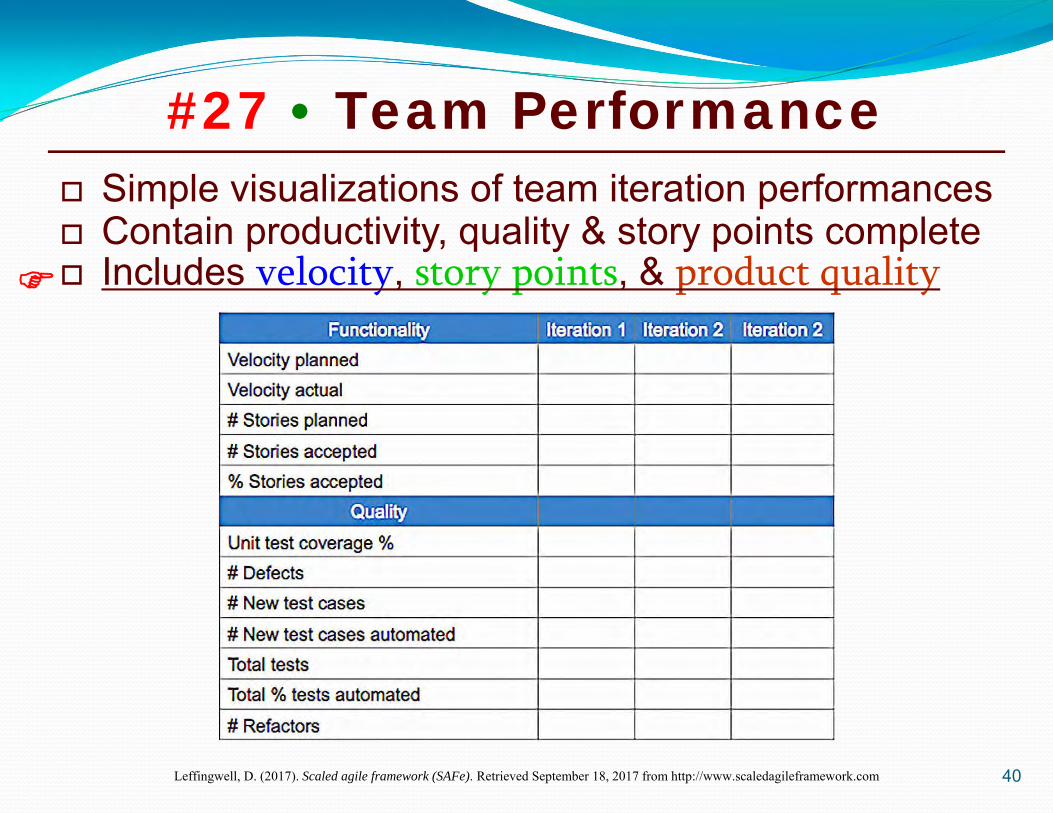
#27 • Team Performance
Leffingwell, D. (2017). Scaled agile framework (SAFe). Retrieved September 18, 2017 from http://www.scaledagileframework.com
Simple visualizations of team iteration performances Contain productivity, quality & story points complete Includes velocity, story points, & product quality
41
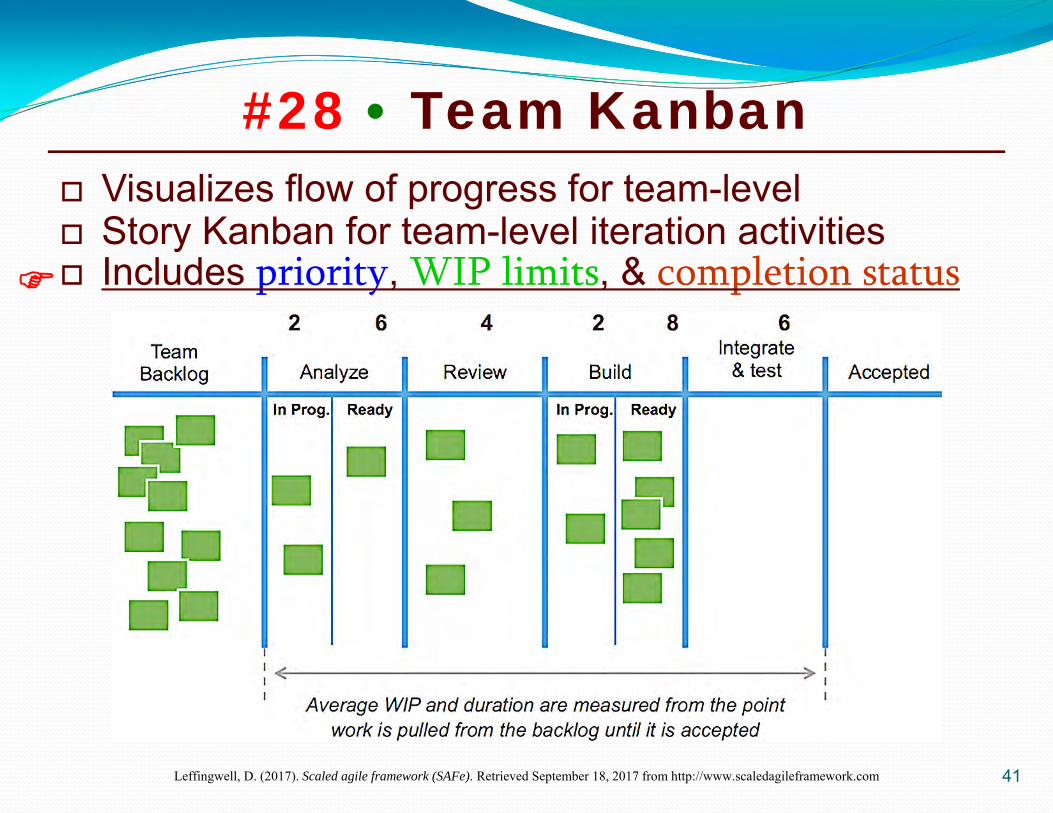
#28 • Team Kanban
Leffingwell, D. (2017). Scaled agile framework (SAFe). Retrieved September 18, 2017 from http://www.scaledagileframework.com
Visualizes flow of progress for team-level Story Kanban for team-level iteration activities Includes priority, WIP limits, & completion status
42
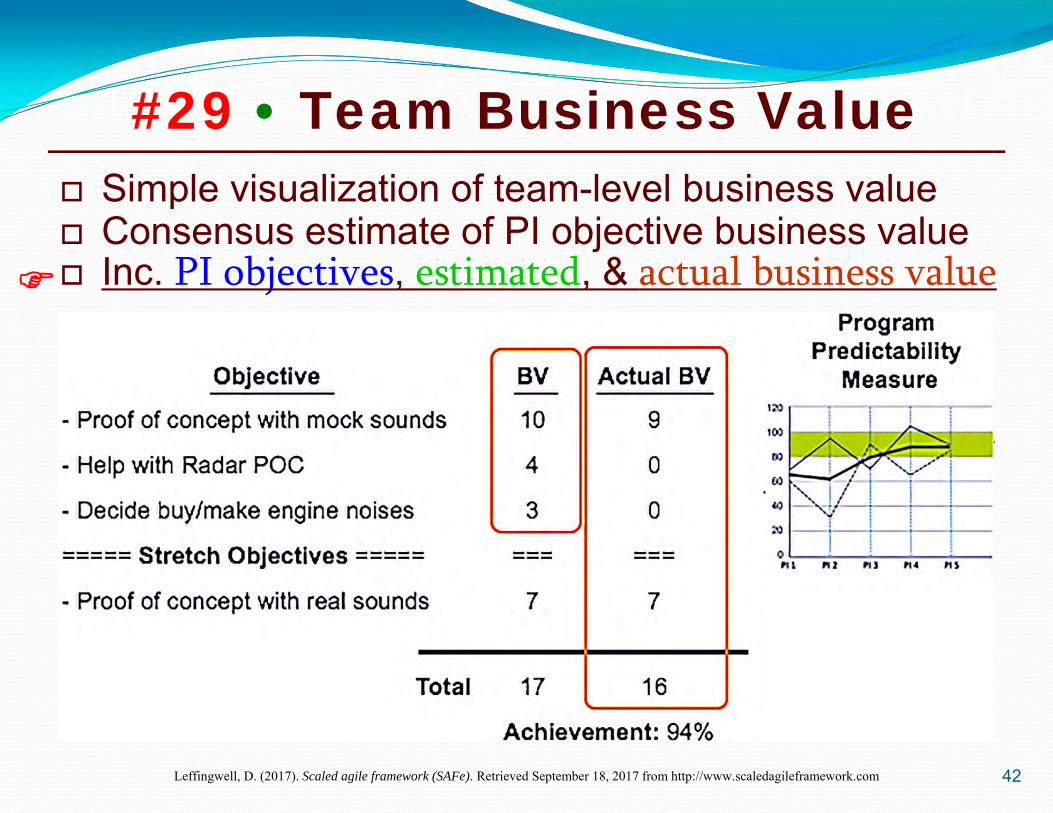
#29 • Team Business Value
Leffingwell, D. (2017). Scaled agile framework (SAFe). Retrieved September 18, 2017 from http://www.scaledagileframework.com
Simple visualization of team-level business value Consensus estimate of PI objective business value Inc. PI objectives, estimated, & actual business value
43
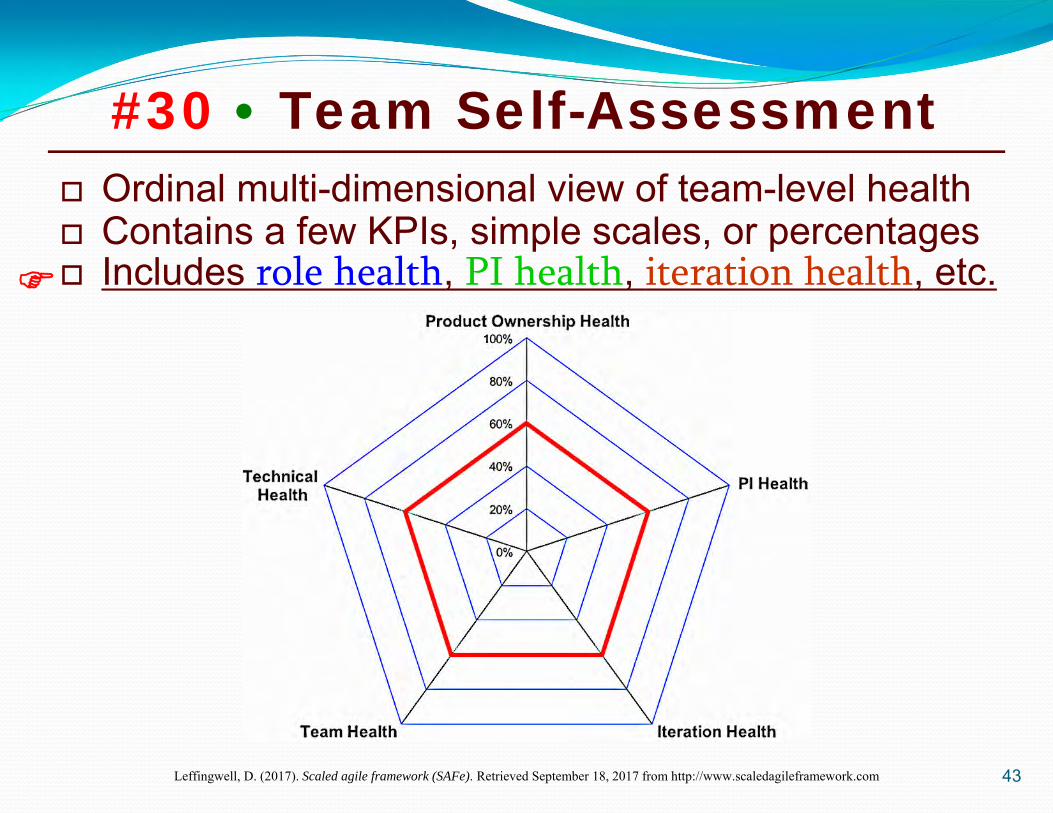
#30 • Team Self-Assessment
Leffingwell, D. (2017). Scaled agile framework (SAFe). Retrieved September 18, 2017 from http://www.scaledagileframework.com
Ordinal multi-dimensional view of team-level health Contains a few KPIs, simple scales, or percentages Includes role health, PI health, iteration health, etc.
SAFe BENEFITS
44Leffingwell, D. (2014). Scaled agile framework (SAFe) case studies. Denver, CO: Leffingwell, LLC.Rico, D. F. (2014). Scaled agile framework (SAFe) benefits. Retrieved June 2, 2014, from http://davidfrico.com/safe-benefits.txt
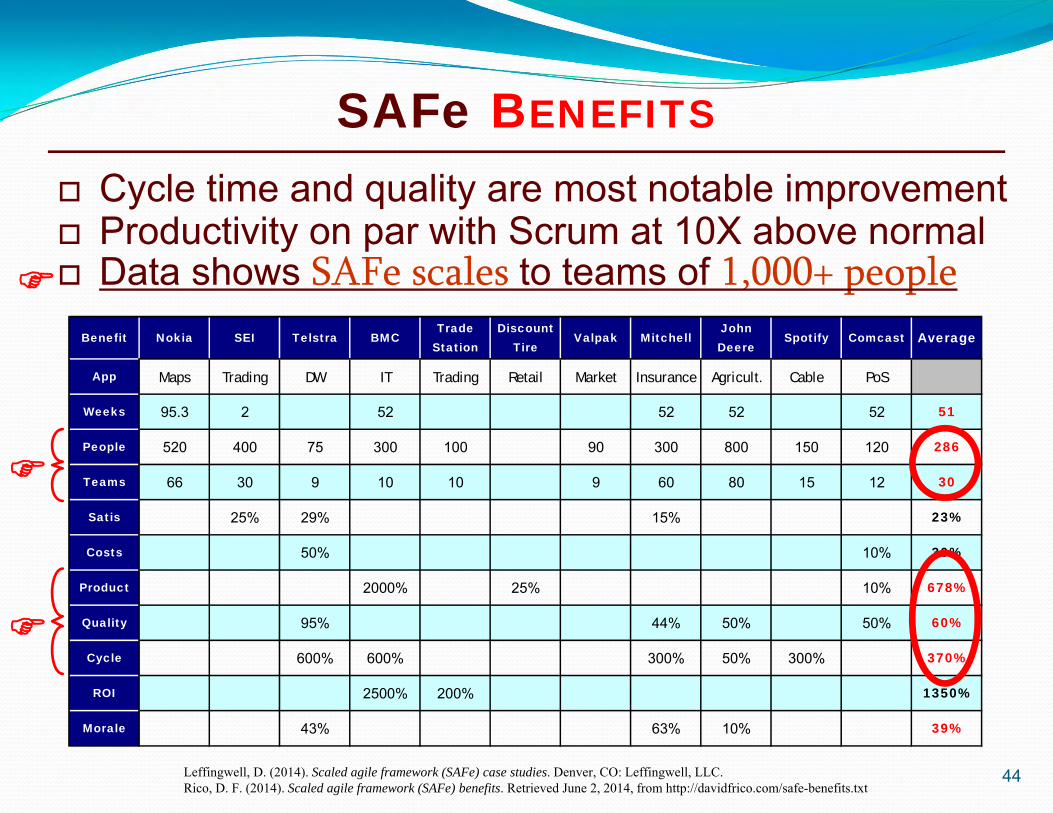
Cycle time and quality are most notable improvement Productivity on par with Scrum at 10X above normal Data shows SAFe scales to teams of 1,000+ people
Benefit Nokia SEI Telstra BMCTrade
StationDiscount
TireValpak Mitchell
John Deere
Spotify Comcast Average
App Maps Trading DW IT Trading Retail Market Insurance Agricult. Cable PoS
Weeks 95.3 2 52 52 52 52 51
People 520 400 75 300 100 90 300 800 150 120 286
Teams 66 30 9 10 10 9 60 80 15 12 30
Satis 25% 29% 15% 23%
Costs 50% 10% 30%
Product 2000% 25% 10% 678%
Quality 95% 44% 50% 50% 60%
Cycle 600% 600% 300% 50% 300% 370%
ROI 2500% 200% 1350%
Morale 43% 63% 10% 39%
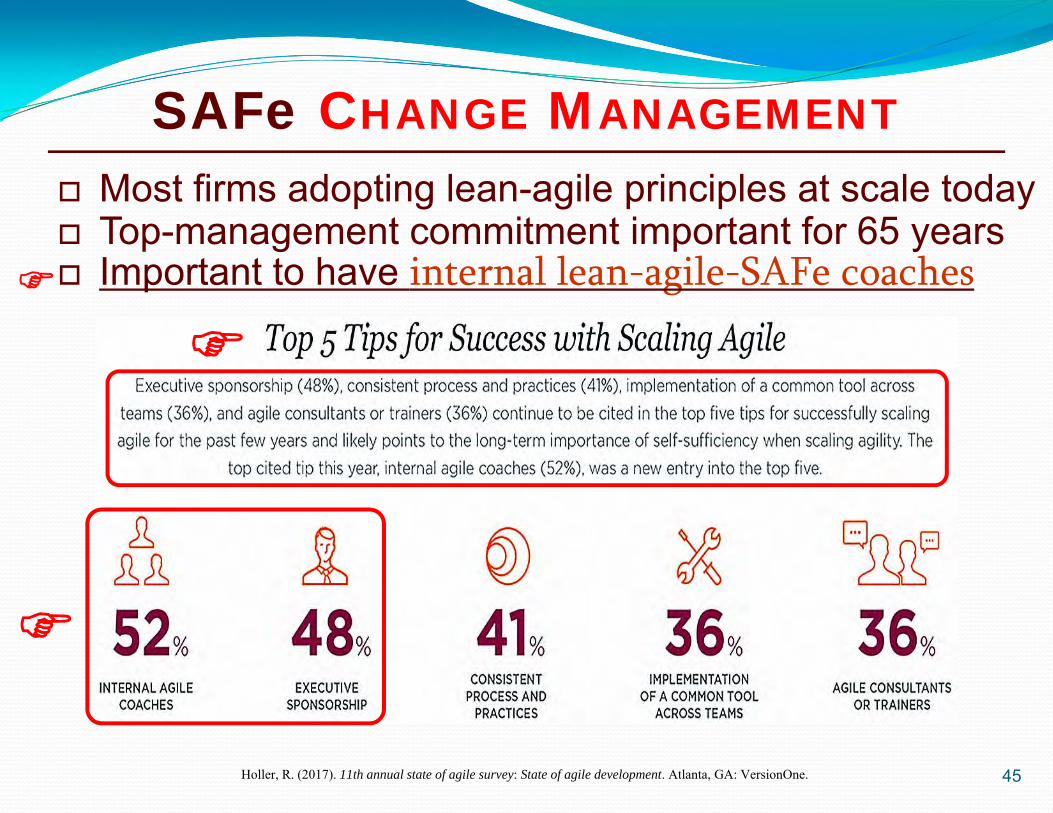
SAFe CHANGE MANAGEMENT Most firms adopting lean-agile principles at scale today Top-management commitment important for 65 years Important to have internal lean-agile-SAFe coaches
45
Holler, R. (2017). 11th annual state of agile survey: State of agile development. Atlanta, GA: VersionOne.
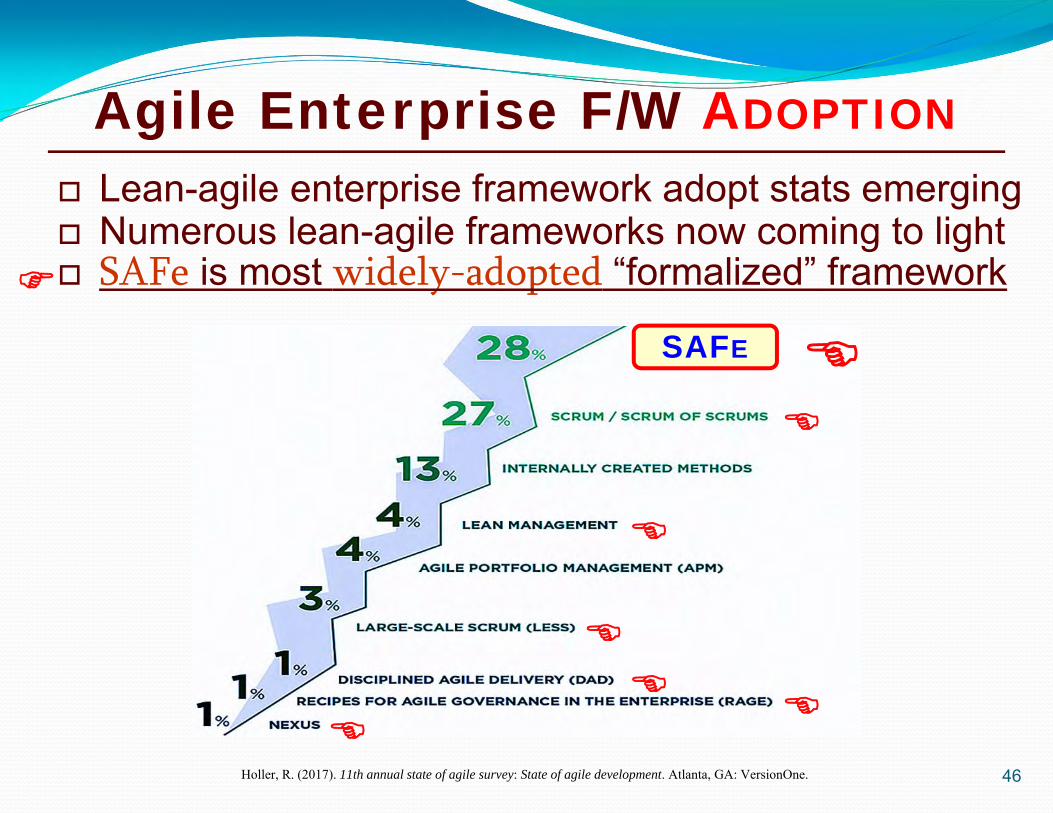
Agile Enterprise F/W ADOPTION Lean-agile enterprise framework adopt stats emerging Numerous lean-agile frameworks now coming to light SAFe is most widely-adopted “formalized” framework
46
Holler, R. (2017). 11th annual state of agile survey: State of agile development. Atlanta, GA: VersionOne.
SAFE
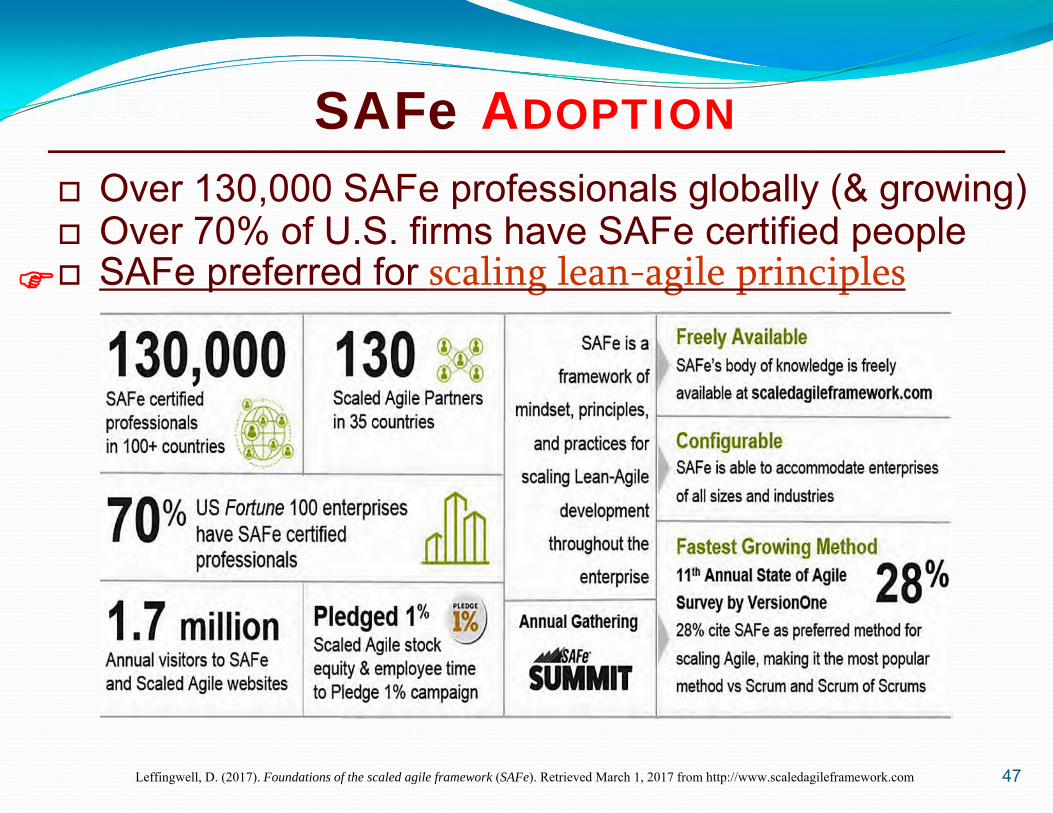
SAFe ADOPTION Over 130,000 SAFe professionals globally (& growing) Over 70% of U.S. firms have SAFe certified people SAFe preferred for scaling lean-agile principles
47
Leffingwell, D. (2017). Foundations of the scaled agile framework (SAFe). Retrieved March 1, 2017 from http://www.scaledagileframework.com
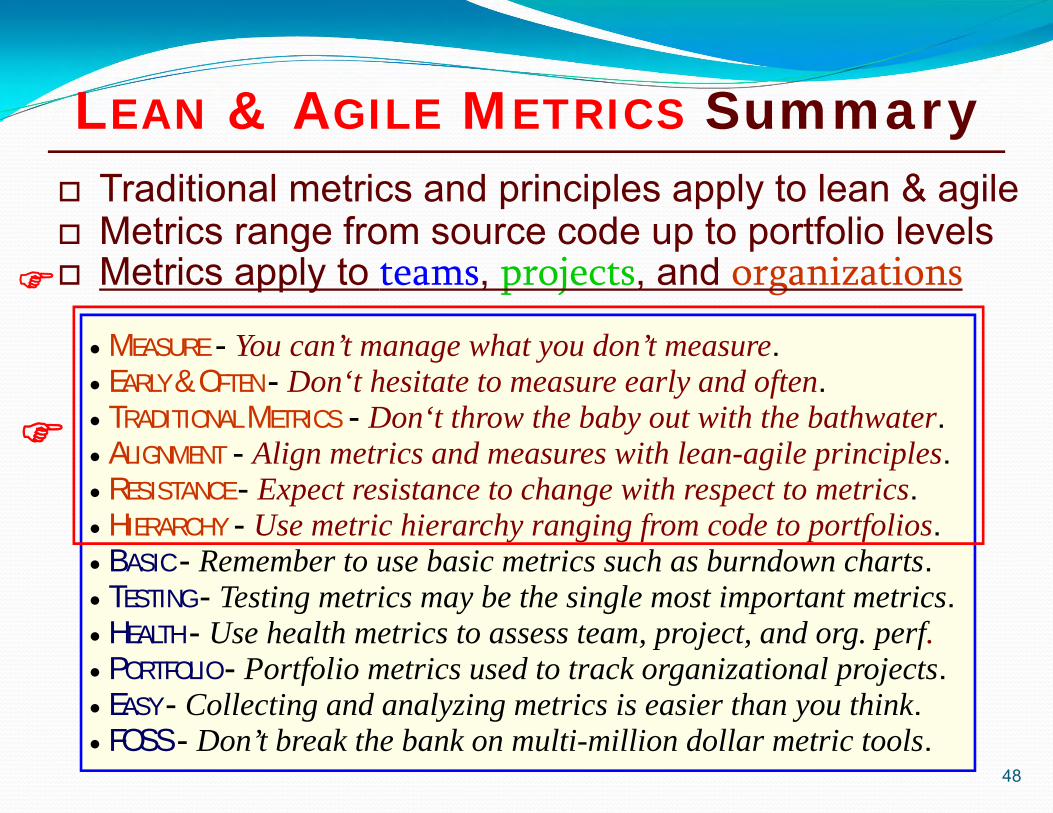
LEAN & AGILE METRICS Summary Traditional metrics and principles apply to lean & agile Metrics range from source code up to portfolio levels Metrics apply to teams, projects, and organizations
48
MEASURE - You can’t manage what you don’t measure. EARLY & OFTEN - Don‘t hesitate to measure early and often. TRADITIONAL METRICS - Don‘t throw the baby out with the bathwater. ALIGNMENT - Align metrics and measures with lean-agile principles. RESISTANCE - Expect resistance to change with respect to metrics. HIERARCHY - Use metric hierarchy ranging from code to portfolios. BASIC - Remember to use basic metrics such as burndown charts. TESTING - Testing metrics may be the single most important metrics. HEALTH - Use health metrics to assess team, project, and org. perf. PORTFOLIO - Portfolio metrics used to track organizational projects. EASY - Collecting and analyzing metrics is easier than you think. FOSS - Don’t break the bank on multi-million dollar metric tools.
49
Bottom Line—Peter Drucker
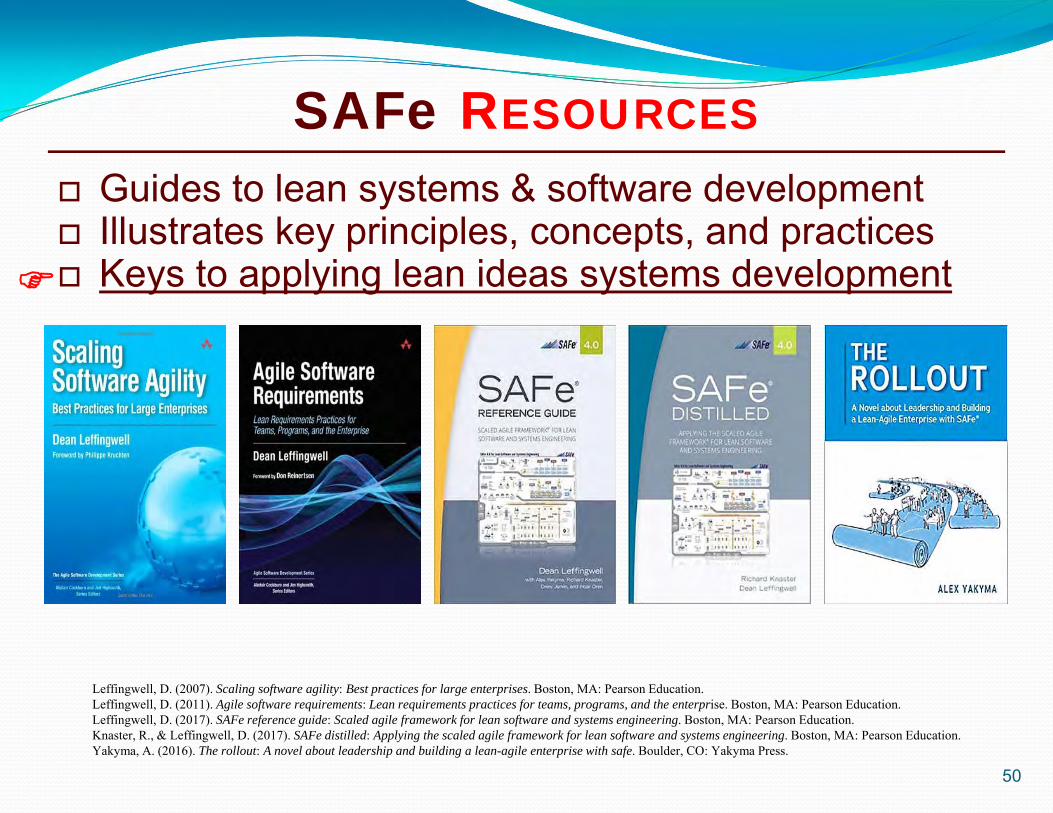
SAFe RESOURCES Guides to lean systems & software development Illustrates key principles, concepts, and practices Keys to applying lean ideas systems development
50
Leffingwell, D. (2007). Scaling software agility: Best practices for large enterprises. Boston, MA: Pearson Education.Leffingwell, D. (2011). Agile software requirements: Lean requirements practices for teams, programs, and the enterprise. Boston, MA: Pearson Education.Leffingwell, D. (2017). SAFe reference guide: Scaled agile framework for lean software and systems engineering. Boston, MA: Pearson Education.Knaster, R., & Leffingwell, D. (2017). SAFe distilled: Applying the scaled agile framework for lean software and systems engineering. Boston, MA: Pearson Education.Yakyma, A. (2016). The rollout: A novel about leadership and building a lean-agile enterprise with safe. Boulder, CO: Yakyma Press.
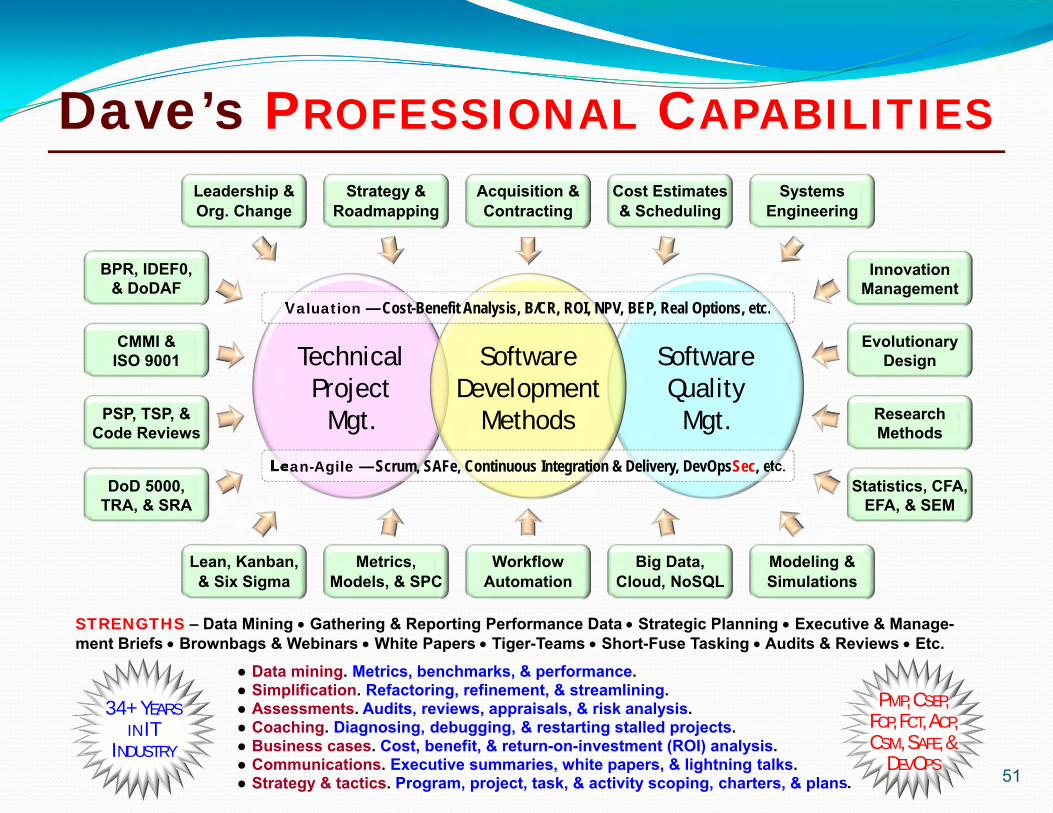
Dave’s PROFESSIONAL CAPABILITIES
51
SoftwareQuality
Mgt.
TechnicalProject
Mgt.
SoftwareDevelopment
Methods
Leadership &Org. Change
SystemsEngineering
Cost Estimates& Scheduling
Acquisition &Contracting
Strategy &Roadmapping
Lean, Kanban,& Six Sigma
Modeling &Simulations
Big Data,Cloud, NoSQL
WorkflowAutomation
Metrics,Models, & SPC
BPR, IDEF0,& DoDAF
DoD 5000,TRA, & SRA
PSP, TSP, &Code Reviews
CMMI &ISO 9001
InnovationManagement
Statistics, CFA,EFA, & SEM
ResearchMethods
EvolutionaryDesign
Valuation — Cost-Benefit Analysis, B/CR, ROI, NPV, BEP, Real Options, etc.
Lean-Agile — Scrum, SAFe, Continuous Integration & Delivery, DevOpsSec, etc.
STRENGTHS – Data Mining Gathering & Reporting Performance Data Strategic Planning Executive & Manage-ment Briefs Brownbags & Webinars White Papers Tiger-Teams Short-Fuse Tasking Audits & Reviews Etc.
● Data mining. Metrics, benchmarks, & performance.● Simplification. Refactoring, refinement, & streamlining.● Assessments. Audits, reviews, appraisals, & risk analysis.● Coaching. Diagnosing, debugging, & restarting stalled projects.● Business cases. Cost, benefit, & return-on-investment (ROI) analysis.● Communications. Executive summaries, white papers, & lightning talks.● Strategy & tactics. Program, project, task, & activity scoping, charters, & plans.
PMP, CSEP,FCP, FCT, ACP,CSM, SAFE, &
DEVOPS
34+ YEARSIN IT
INDUSTRY
Backup Slides
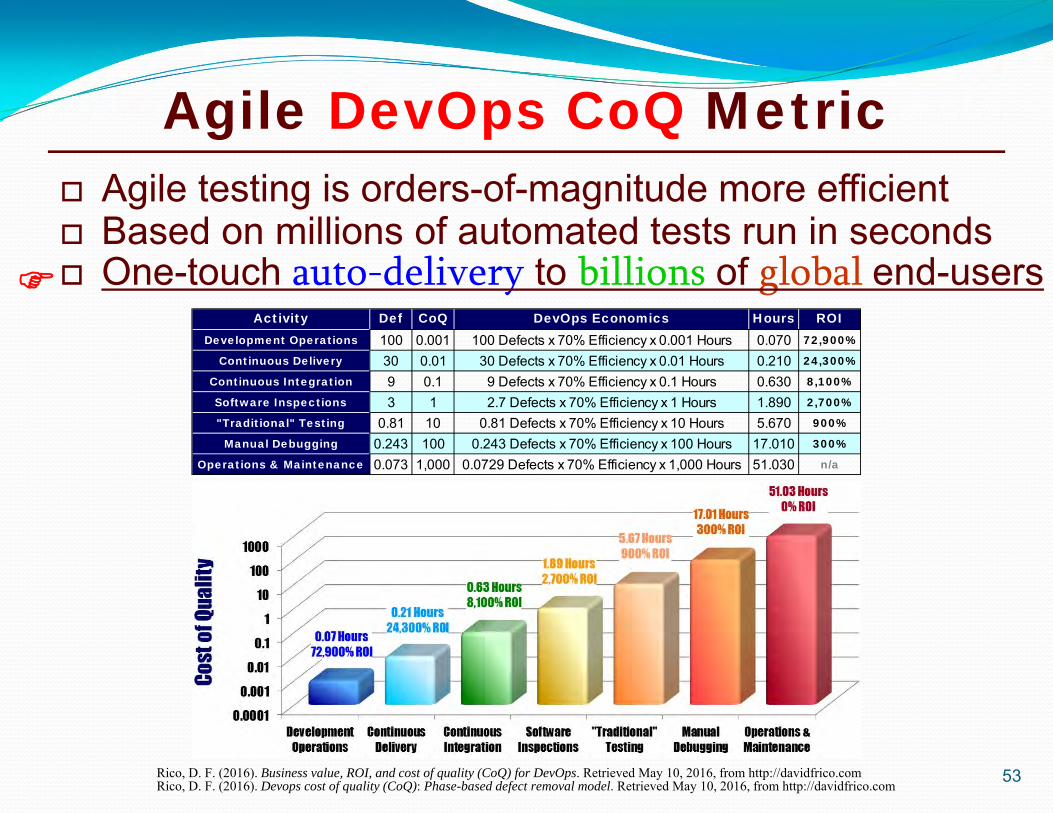
Activity Def CoQ DevOps Economics Hours ROIDevelopment Operations 100 0.001 100 Defects x 70% Efficiency x 0.001 Hours 0.070 72,900%
Continuous Delivery 30 0.01 30 Defects x 70% Efficiency x 0.01 Hours 0.210 24,300%
Continuous Integration 9 0.1 9 Defects x 70% Efficiency x 0.1 Hours 0.630 8,100%
Software Inspections 3 1 2.7 Defects x 70% Efficiency x 1 Hours 1.890 2,700%
"Traditional" Testing 0.81 10 0.81 Defects x 70% Efficiency x 10 Hours 5.670 900%
Manual Debugging 0.243 100 0.243 Defects x 70% Efficiency x 100 Hours 17.010 300%
Operations & Maintenance 0.073 1,000 0.0729 Defects x 70% Efficiency x 1,000 Hours 51.030 n/a
53
Agile testing is orders-of-magnitude more efficient Based on millions of automated tests run in seconds One-touch auto-delivery to billions of global end-users
Rico, D. F. (2016). Business value, ROI, and cost of quality (CoQ) for DevOps. Retrieved May 10, 2016, from http://davidfrico.comRico, D. F. (2016). Devops cost of quality (CoQ): Phase-based defect removal model. Retrieved May 10, 2016, from http://davidfrico.com
Agile DevOps CoQ Metric
54
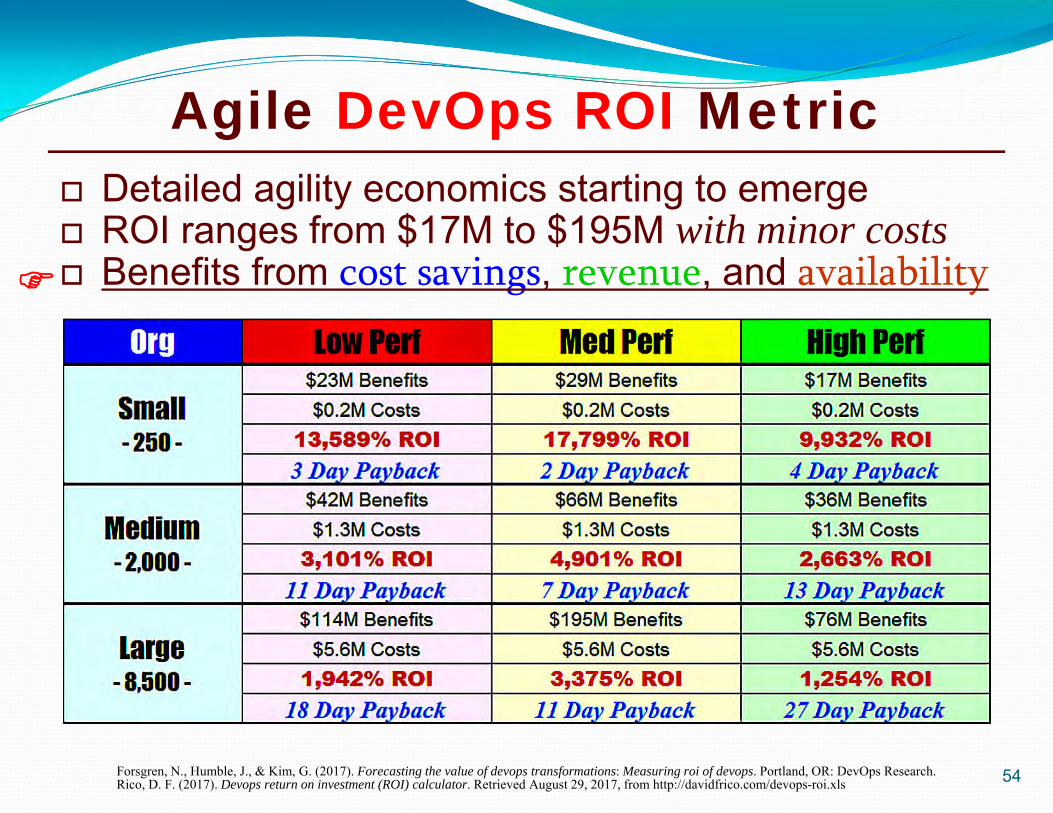
Detailed agility economics starting to emerge ROI ranges from $17M to $195M with minor costs Benefits from cost savings, revenue, and availability
Forsgren, N., Humble, J., & Kim, G. (2017). Forecasting the value of devops transformations: Measuring roi of devops. Portland, OR: DevOps Research.Rico, D. F. (2017). Devops return on investment (ROI) calculator. Retrieved August 29, 2017, from http://davidfrico.com/devops-roi.xls
Agile DevOps ROI Metric
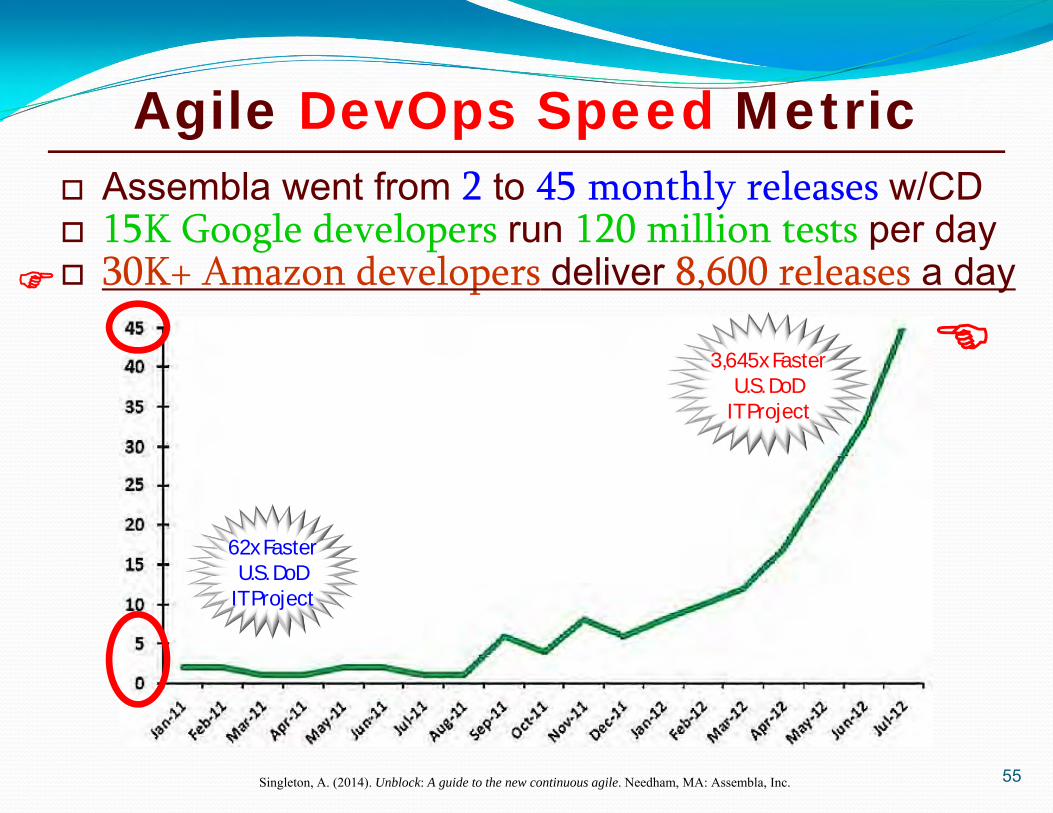
Assembla went from 2 to 45 monthly releases w/CD 15K Google developers run 120 million tests per day 30K+ Amazon developers deliver 8,600 releases a day
55Singleton, A. (2014). Unblock: A guide to the new continuous agile. Needham, MA: Assembla, Inc.
62x FasterU.S. DoD
IT Project
3,645x FasterU.S. DoD
IT Project
Agile DevOps Speed Metric
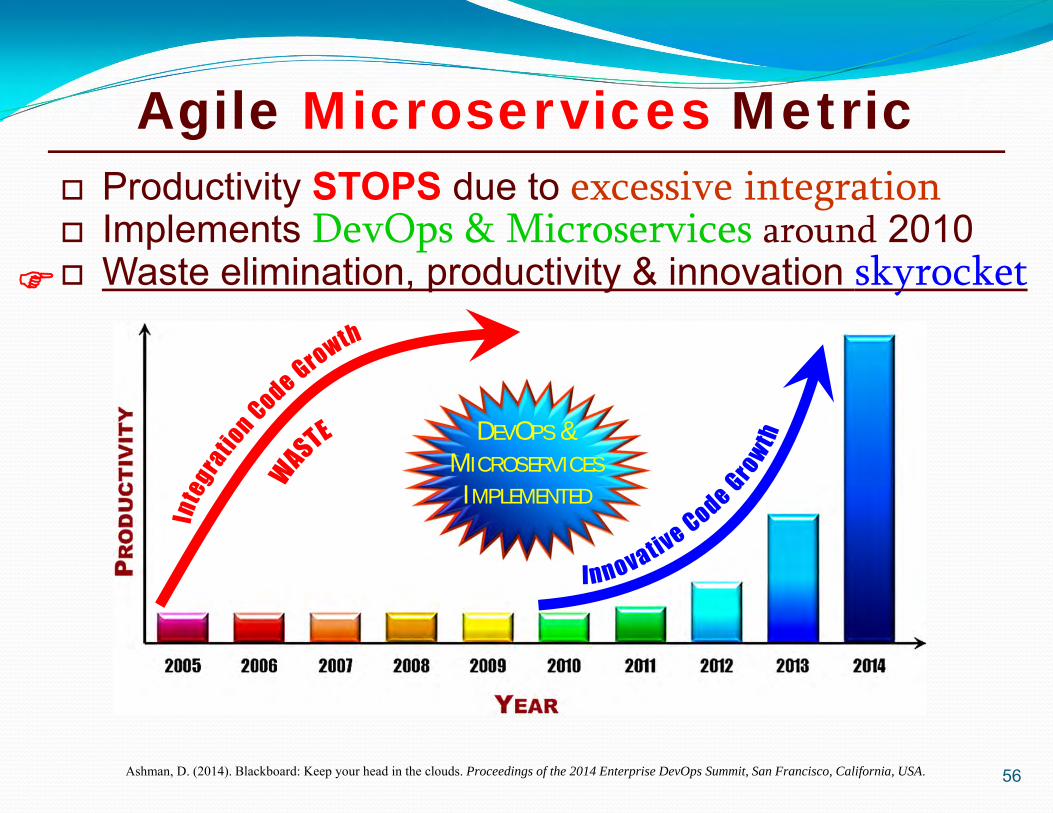
56Ashman, D. (2014). Blackboard: Keep your head in the clouds. Proceedings of the 2014 Enterprise DevOps Summit, San Francisco, California, USA.
Productivity STOPS due to excessive integration Implements DevOps & Microservices around 2010 Waste elimination, productivity & innovation skyrocket
DEVOPS &MICROSERVICES
IMPLEMENTED
Agile Microservices Metric
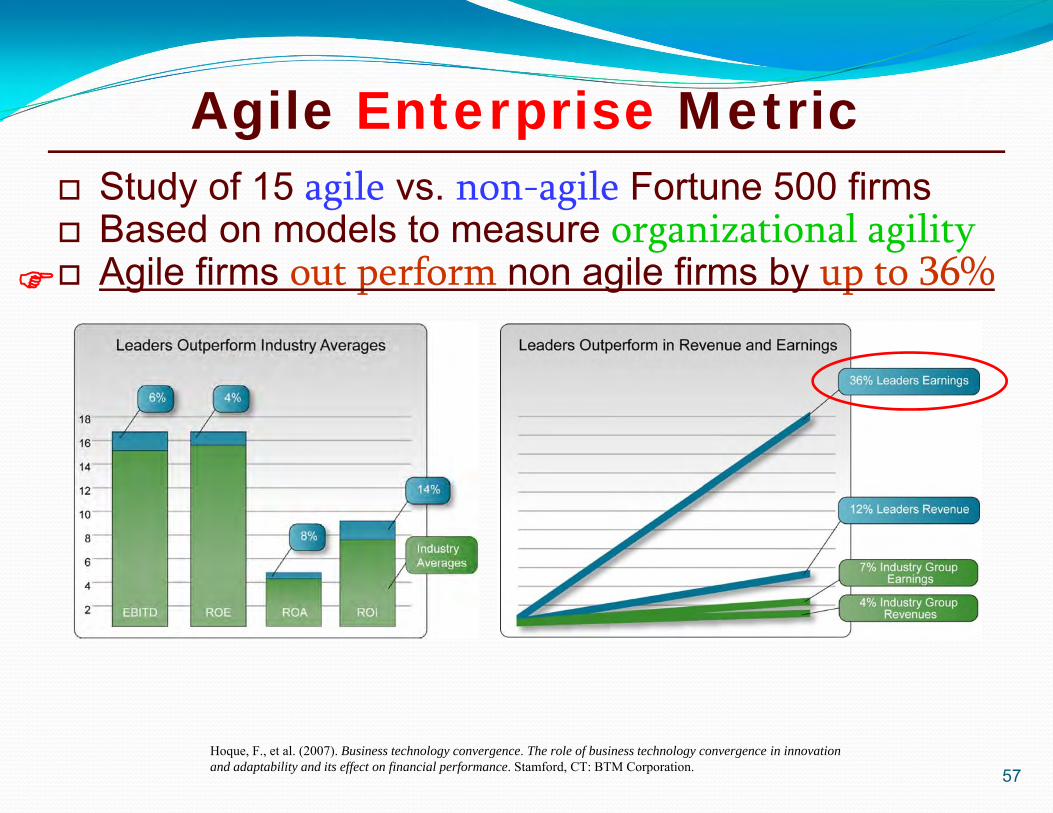
Hoque, F., et al. (2007). Business technology convergence. The role of business technology convergence in innovation and adaptability and its effect on financial performance. Stamford, CT: BTM Corporation. 57
Study of 15 agile vs. non-agile Fortune 500 firms Based on models to measure organizational agility Agile firms out perform non agile firms by up to 36%
Agile Enterprise Metric
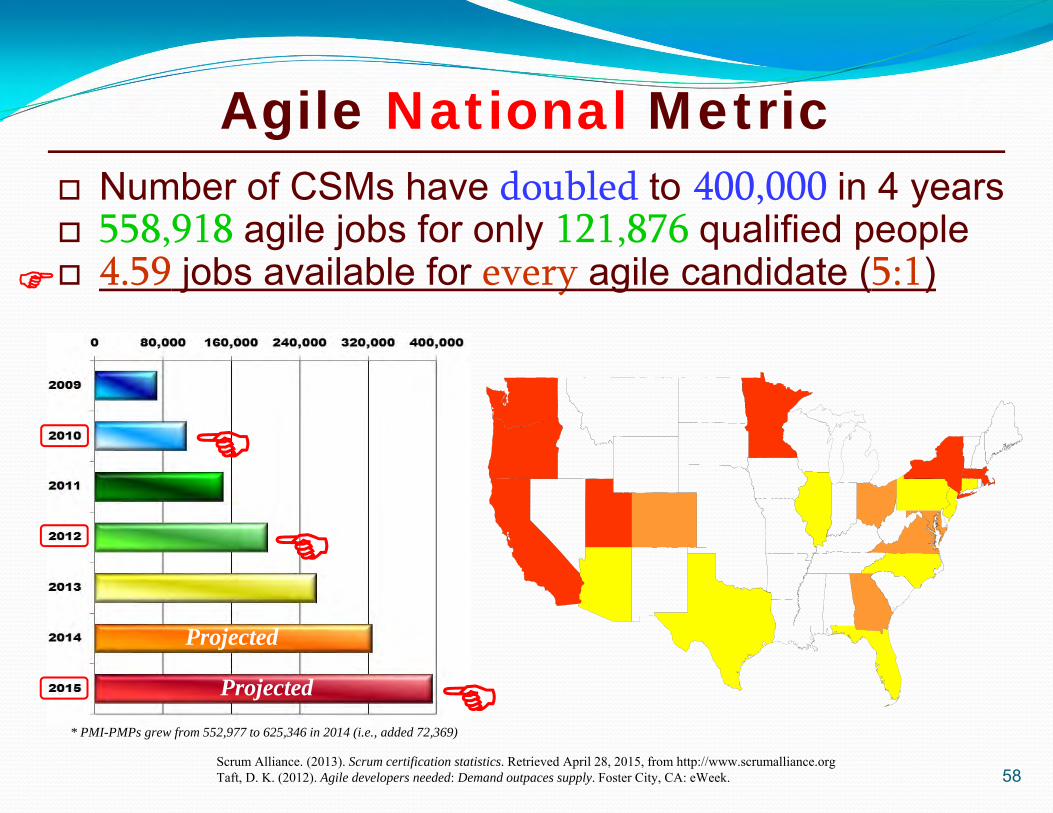
Scrum Alliance. (2013). Scrum certification statistics. Retrieved April 28, 2015, from http://www.scrumalliance.orgTaft, D. K. (2012). Agile developers needed: Demand outpaces supply. Foster City, CA: eWeek. 58
Number of CSMs have doubled to 400,000 in 4 years 558,918 agile jobs for only 121,876 qualified people 4.59 jobs available for every agile candidate (5:1)
Projected
Projected
* PMI-PMPs grew from 552,977 to 625,346 in 2014 (i.e., added 72,369)
Agile National Metric
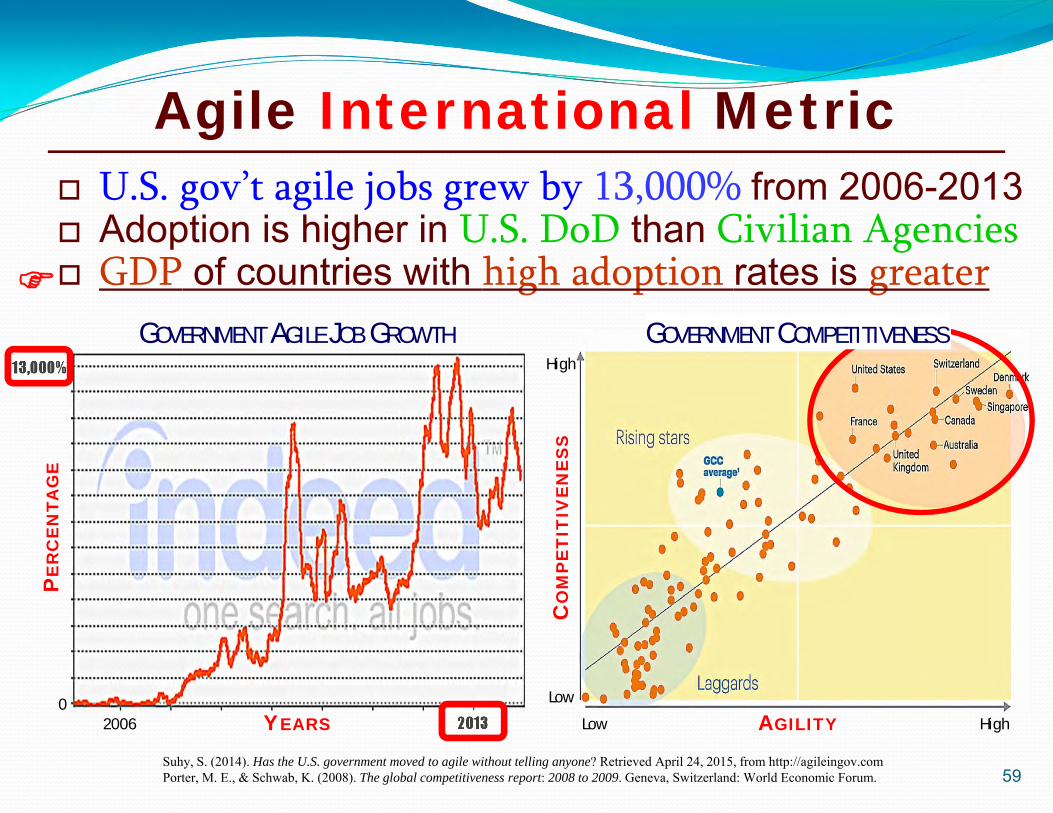
Suhy, S. (2014). Has the U.S. government moved to agile without telling anyone? Retrieved April 24, 2015, from http://agileingov.comPorter, M. E., & Schwab, K. (2008). The global competitiveness report: 2008 to 2009. Geneva, Switzerland: World Economic Forum. 59
U.S. gov’t agile jobs grew by 13,000% from 2006-2013 Adoption is higher in U.S. DoD than Civilian Agencies GDP of countries with high adoption rates is greater
High
Low
Low HighAGILITY
CO
MP
ET
ITIV
EN
ES
S
GOVERNMENT AGILE JOB GROWTH
PE
RC
EN
TAG
E
13,000%
02006 2013YEARS
GOVERNMENT COMPETITIVENESS
Agile International Metric