Embed Size (px)
Citation preview

League of Women Voters OregonMay 16, 2014
OREGON VALUES and Tom Bowerman, PolicyInterative
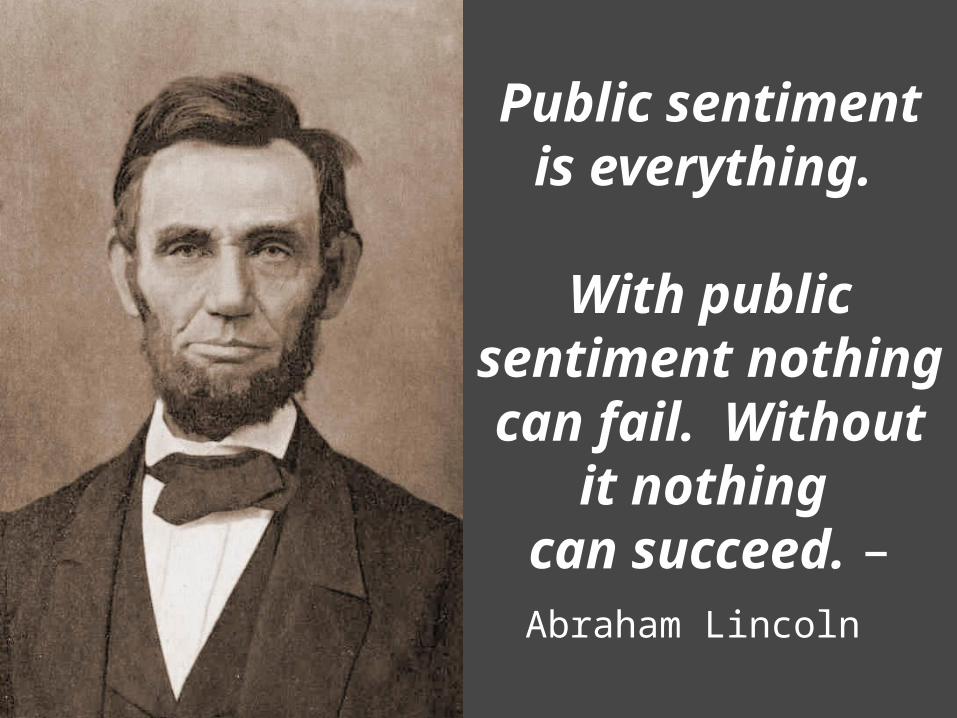
Public sentiment is everything.
With public
sentiment nothing can fail. Without it
nothing can succeed. – Abraham
Lincoln

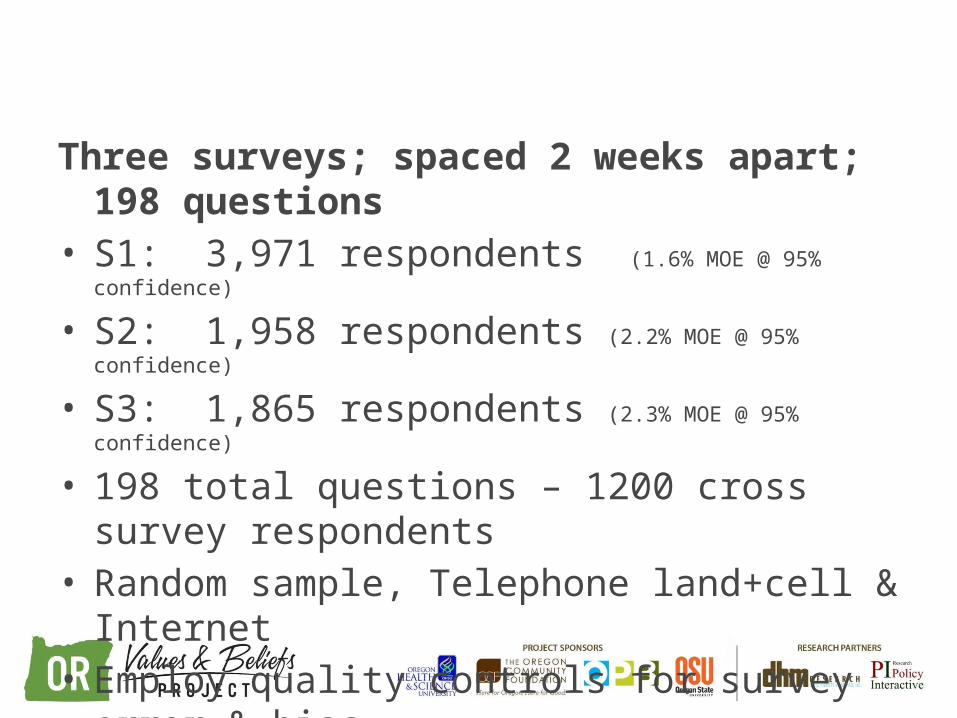
Three surveys; spaced 2 weeks apart; 198 questions• S1: 3,971 respondents (1.6% MOE @ 95% confidence)
• S2: 1,958 respondents (2.2% MOE @ 95% confidence)
• S3: 1,865 respondents (2.3% MOE @ 95% confidence)
• 198 total questions – 1200 cross survey respondents• Random sample, Telephone land+cell & Internet• Employ quality controls for survey error & bias• 5 regions: Eastern, Southern, Central, W.Valley, Metro

Survey Topic Modules Used in 2013 Oregon Project:
• Hopes and fears, likes and dislikes, what’s important – volunteered• Policy priorities• Worldviews & Culture Theory• Education• Healthcare• Social Services• Land use• Jobs & Economy• Environment• Energy• Philanthropy • Demographics

This presentation of findings, observations and conclusions reflects the judgment of this presenter
and not necessarily the views of the sponsoring organizations.
EDUCATION

PUBLIC SERVICE PRIORITIES w/$$ Oregonians rank K-12 education #1
among 20 public services
81% total “important” to support w/ taxes (58% “very important”)
#2: 79% Public Safety like fire & police
#3: 72% Clean air and clean water
#20: 43% Economic development through tax breaks and public subsidies
S1 – Q 6-27
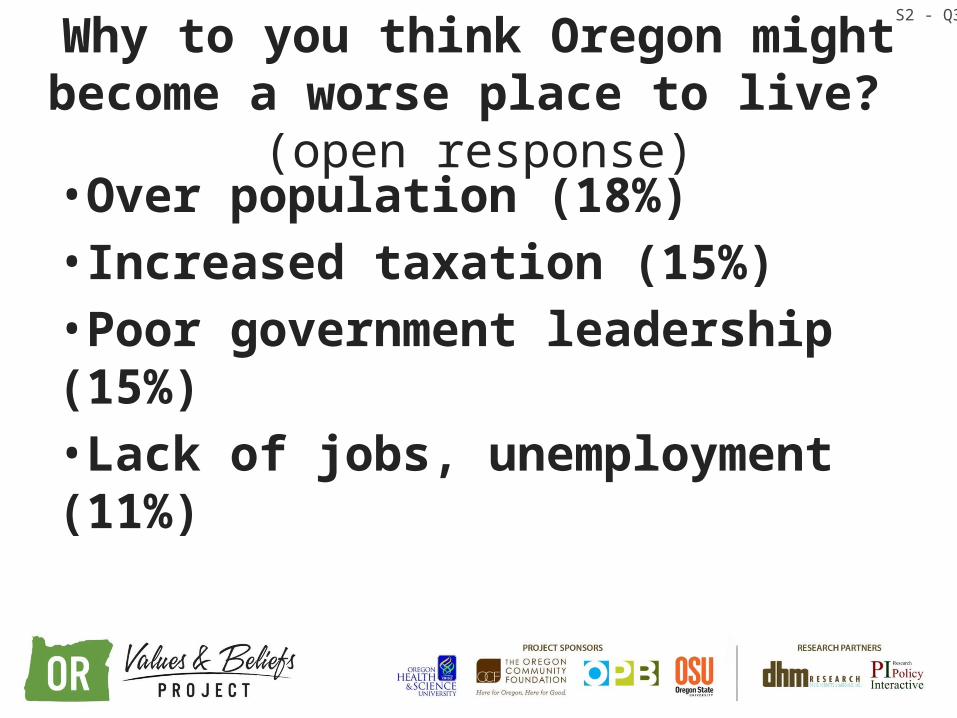
Why to you think Oregon might become a worse place to live? (open response)
•Over population (18%)•Increased taxation (15%)•Poor government leadership (15%)•Lack of jobs, unemployment (11%)
S2 - Q3
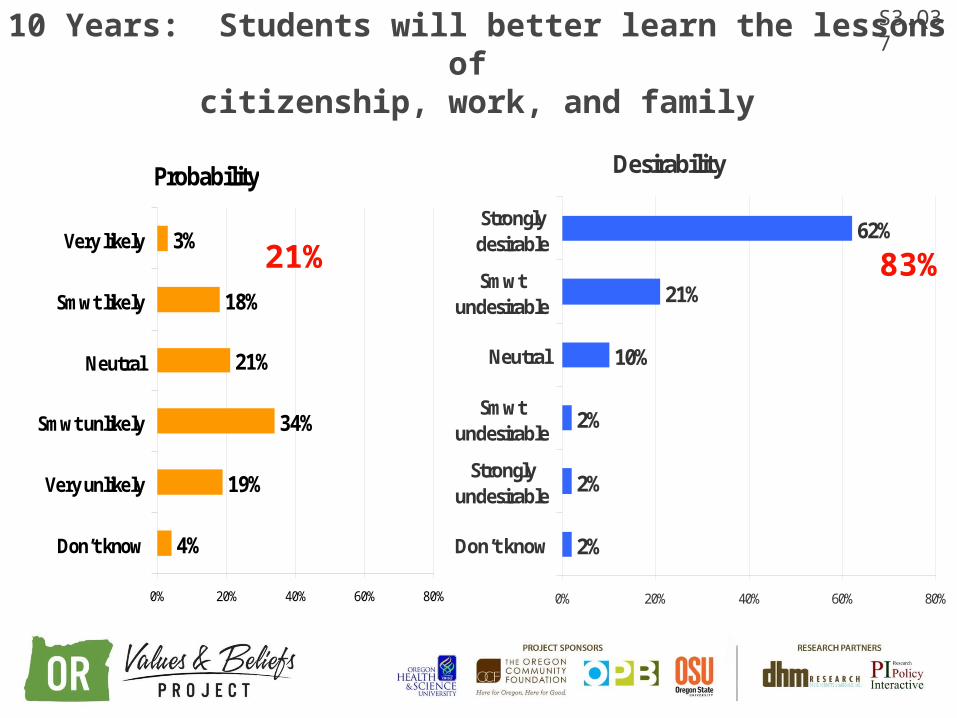
Probability
4%
19%
34%
21%
18%
3%
0% 20% 40% 60% 80%
Don’t know
Very unlikely
Smwt unlikely
Neutral
Smwt likely
Very likely
Desirability
2%
2%
2%
10%
21%
62%
0% 20% 40% 60% 80%
Don’t know
Stronglyundesirable
Smwtundesirable
Neutral
Smwtundesirable
Stronglydesirable
10 Years: Students will better learn the lessons of citizenship, work, and family
S3.Q37
21% 83%

S3.Q36
Probability
3%
18%
30%
23%
22%
4%
0% 20% 40% 60% 80%
Don’t know
Very unlikely
Smwt unlikely
Neutral
Smwt likely
Very likely
2%
2%
1%
6%
23%
65%
0% 20% 40% 60% 80%
Don’t know
Strongly undesirable
Smwt undesirable
Neutral
Smwt desirable
Very desirable
Desirability
10 Years: Schools will substantially improve student knowledge of money management and household finance
27%88%
Probability
3%
23%
33%
20%
15%
5%
0% 20% 40% 60% 80%
Don’tknow
Veryunlikely
Smwtunlikely
Neutral
Smwtlikely
Verylikely
2%
2%
1%
5%
14%
76%
0% 20% 40% 60% 80%
Don’t know
Strongly undesirable
Smwt undesirable
Neutral
Smwt desirable
Very desirable
Desirability
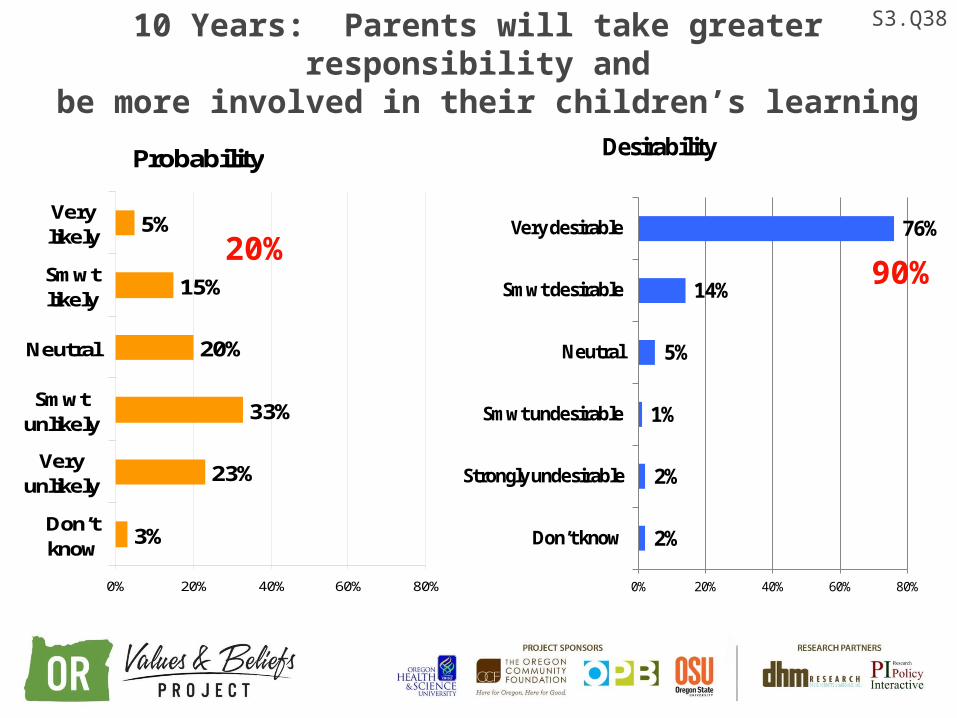
10 Years: Parents will take greater responsibility and be more involved in their children’s learning
S3.Q38
20%90%

Health & Health Care
How desirable or undesirable?
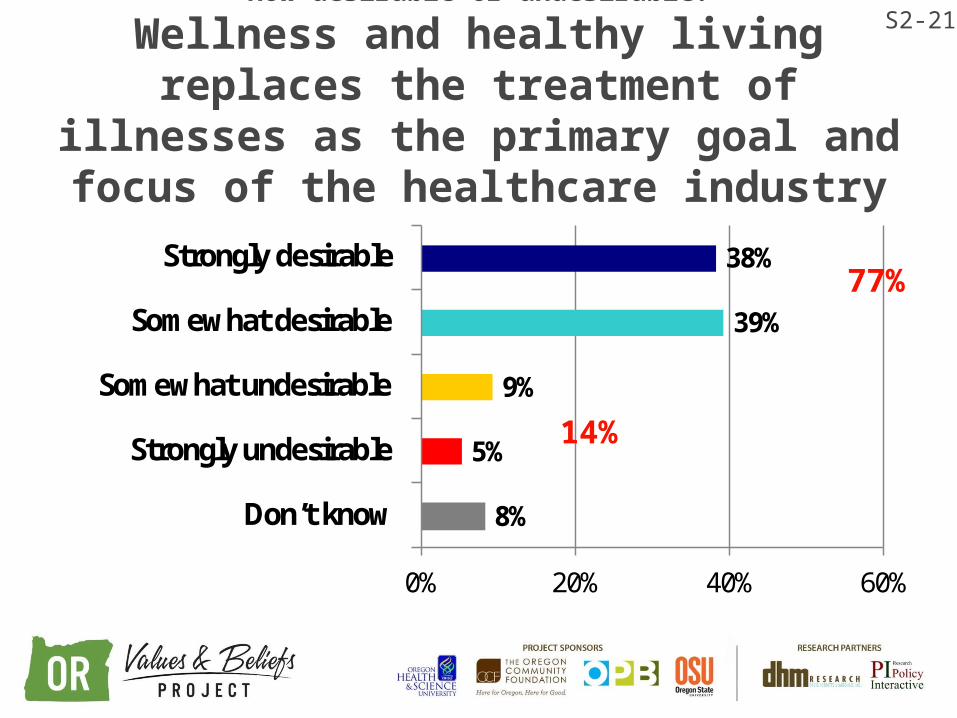
Wellness and healthy living replaces the treatment of illnesses as the primary goal and
focus of the healthcare industry
8%
5%
9%
39%
38%
0% 20% 40% 60%
Don’t know
Strongly undesirable
Somewhat undesirable
Somewhat desirable
Strongly desirable
S2-21
77%
14%
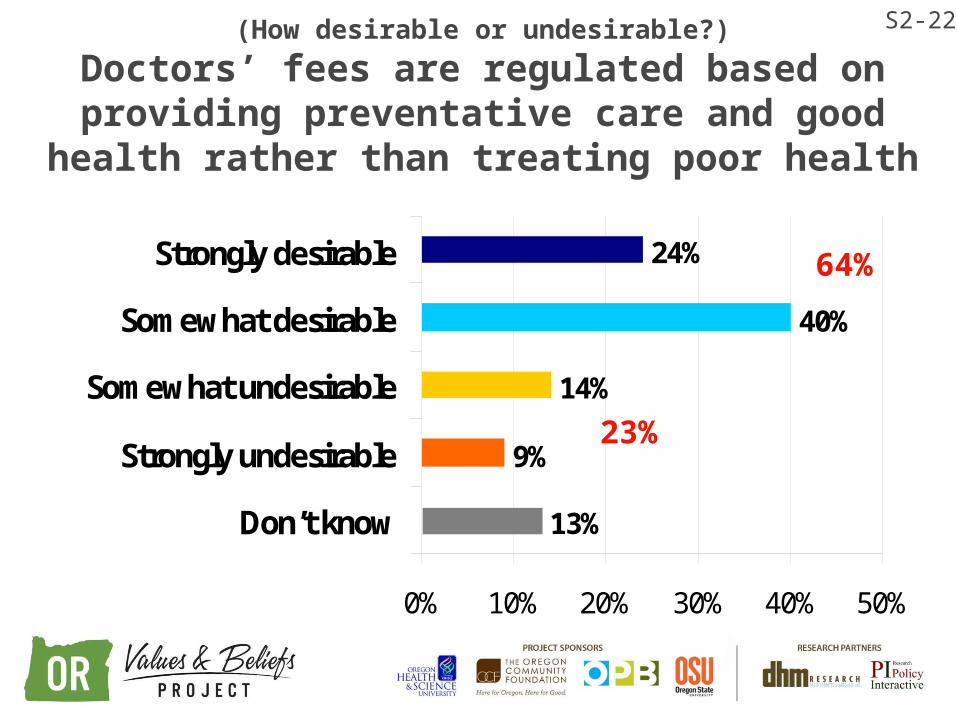
(How desirable or undesirable?)
Doctors’ fees are regulated based on providing preventative care and good health rather than treating
poor health
13%
9%
14%
40%
24%
0% 10% 20% 30% 40% 50%
Don’t know
Strongly undesirable
Somewhat undesirable
Somewhat desirable
Strongly desirable
S2-22
64%
23%
(How desirable or undesirable?)
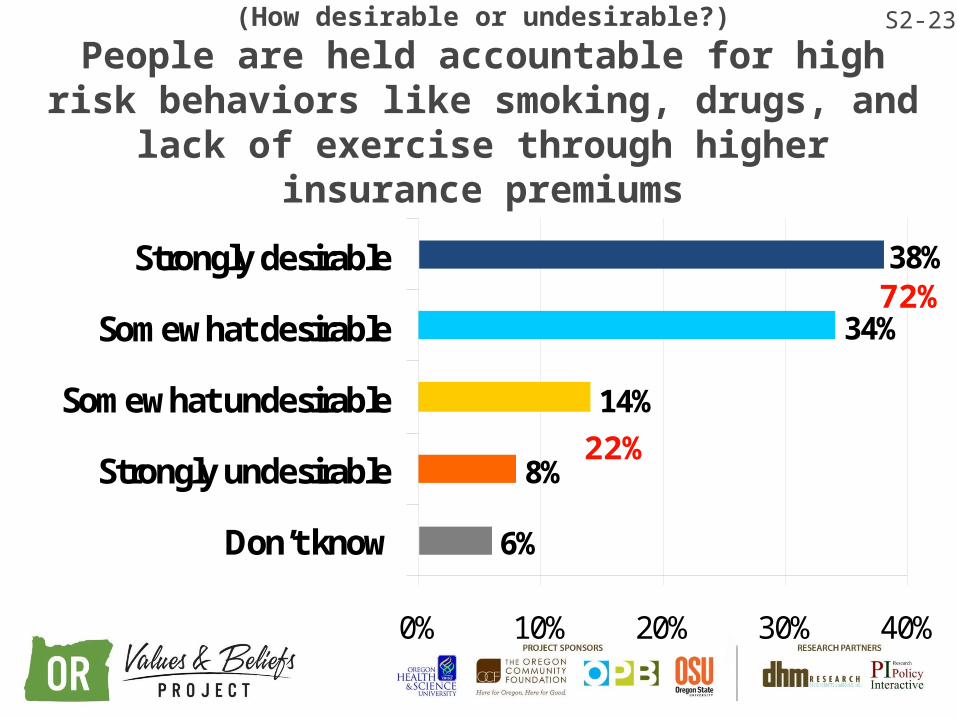
People are held accountable for high risk behaviors like smoking, drugs, and lack of exercise through higher
insurance premiums
6%
8%
14%
34%
38%
0% 10% 20% 30% 40%
Don’t know
Strongly undesirable
Somewhat undesirable
Somewhat desirable
Strongly desirable
S2-23
72%
22%

Oregon’s Tax System

Taxes are necessary to pay for the common good
4%
3%
7%
40%
46%
0% 10% 20% 30% 40% 50%
Don’t know
Disagree Strongly
Disagree Somewhat
Agree Somewhat
Agree Strongly
S2-10
86%
10%

There has been some discussion in Oregon recently about the level of public services and the cost to taxpayers. Which of the following
statements is closest to how you feel? (S2-5)
22%
44%
22%
28%
31%
30%
0% 10% 20% 30% 40% 50%
We don’t spend enough on publicservices and we should increase some
taxes
We spend about the right amount onpublic services and taxes should remain
the same
We spend too much on public servicesand taxes should be reduced
2002 2013
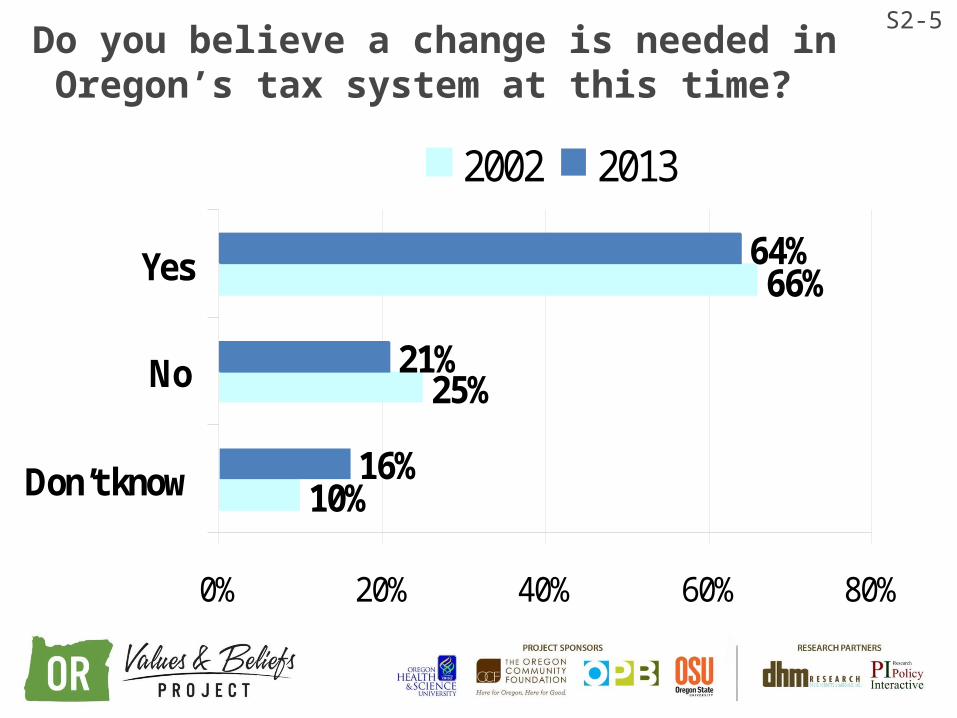
Do you believe a change is needed in Oregon’s tax system at this time?
10%
25%
66%
16%
21%
64%
0% 20% 40% 60% 80%
Don’t know
No
Yes
2002 2013
S2-5

Add picture
Oregonians care about their Environment

Response Category Total Metro W. Valley Central Eastern Southern
Beauty/scenery 21% 21% 22% 17% 15% 24%Weather/climate 19% 18% 22% 15% 12% 19%Friendly residents/people 13% 15% 11% 12% 10% 11%
Outdoors/outdoor activities 11% 11% 8% 19% 11% 11%
Forest/trees 11% 11% 12% 5% 4% 11%Proximity to coast/ocean 10% 12% 13% 4% 2% 6%Nature—general 10% 13% 8% 5% 4% 10%
Great place to live/ neighborliness/friendly town
10% 11% 10% 11% 13% 7%
Proximity to mountains 9% 11% 11% 6% 7% 5%Environment—general 6% 6% 7% 6% 3% 7%
Environmentally friendly/ promotes recycling
6% 7% 7% 4% 2% 3%
All other responses5% or less
6% or less7% or less
7% or less
11% or less
10% or less
None/Nothing 2% 2% 2% 1% 1% 2%Don’t know 2% 2% 1% 2% 5% 3%
S1-Q2 OpenWhat do you personally value about living in Oregon? (84% refer to environmental traits from ~ 3300 comments)
25

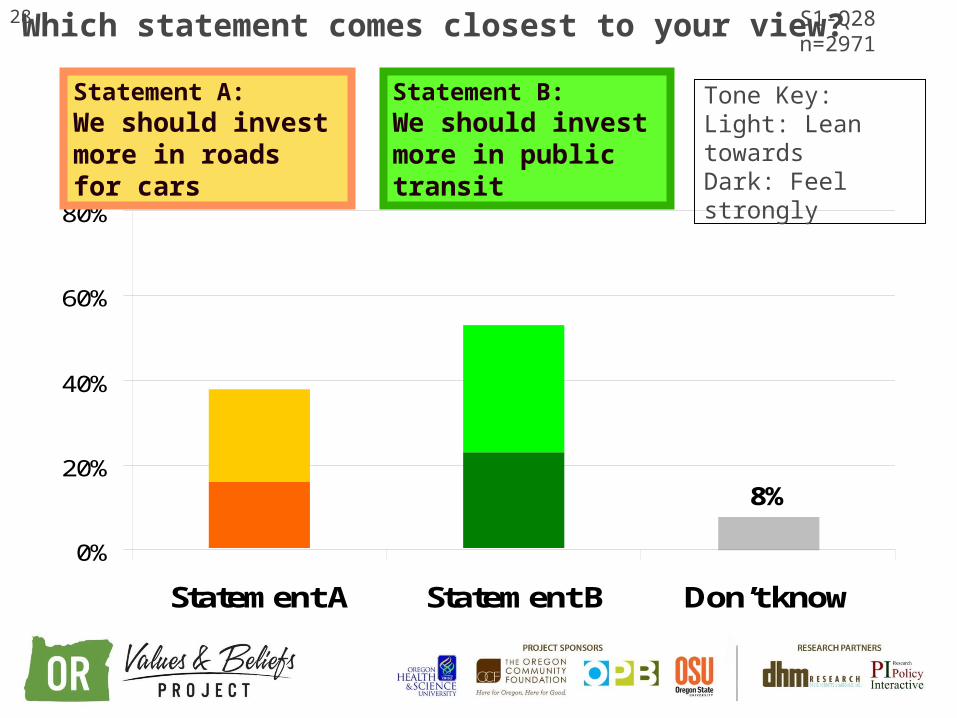
26 S1-Q28 n=2971
8%
0%
20%
40%
60%
80%
Statement A Statement B Don’t know
35%
57%
Statement A: Economic Growth should be given priority even if the environment suffers to some extent
Statement B: Protection of the environment should be given priority even at the risk of slowing economic growth
Which statement comes closest to your view?
Color Tone Key:Light: Lean towardsDark: Feel strongly

35%30%
36%
49%
38%
57%62%
53% 50%54%
8% 7% 6% 9% 9%
44% 42%
9%
0%
20%
40%
60%
80%
Total Metro W. Valley Central Eastern Southern
Statement A: Economic growth should be given priority even if the environment suffers to some extent
Statement B: Protection of the environment should be given priority evenat the risk of slowing economic growth
Which statement comes closest to your view? (statements always rotate)
S1-Q2727
S1-Q28 n=2971
8%
0%
20%
40%
60%
80%
Statement A Statement B Don’t know
38%
53%
Statement A: We should invest more in roads for cars
Statement B: We should invest more in public transit
Which statement comes closest to your view?
Tone Key:Light: Lean towardsDark: Feel strongly
28

29
38% 37% 39%45%
46%38%
53% 55% 53%48%
45%
53%
8% 8% 9%7% 9% 8%
0%
20%
40%
60%
80%
Total Metro W. Valley Central Eastern Southern
Statement A: We should invest more in roads for cars
Statement B: We should invest more in public transit
Which statement comes closest to your view? (statements always rotate)
S1-Q27

7%
0%
20%
40%
60%
80%
Statement A Statement B Don’t know
72%
21%
Statement A:
Climate change requires us to change our way of life such as driving less or living more simply
Statement B:
If climate change becomes a problem we can deal with it later
Which statement comes closest to your view? S1-Q32
31
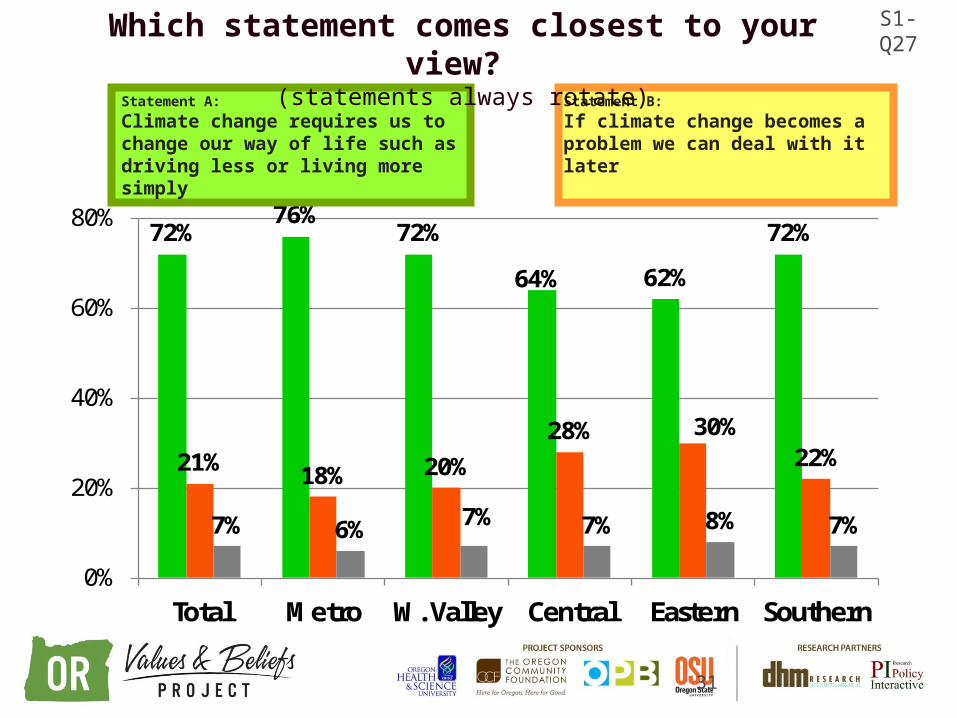
72%76%
72%
64% 62%
72%
21% 18% 20%28% 30%
22%
7% 6% 7% 7% 8% 7%
0%
20%
40%
60%
80%
Total Metro W. Valley Central Eastern Southern
Statement A:
Climate change requires us to change our way of life such as driving less or living more simply
Statement B:
If climate change becomes a problem we can deal with it later
Which statement comes closest to your view? (statements always rotate)
S1-Q27

Revisiting Common Assumptions about
Climate Change:
•Is it human caused?•Is it a hoax?•Will it be bad?•Will public policy fix it?
32
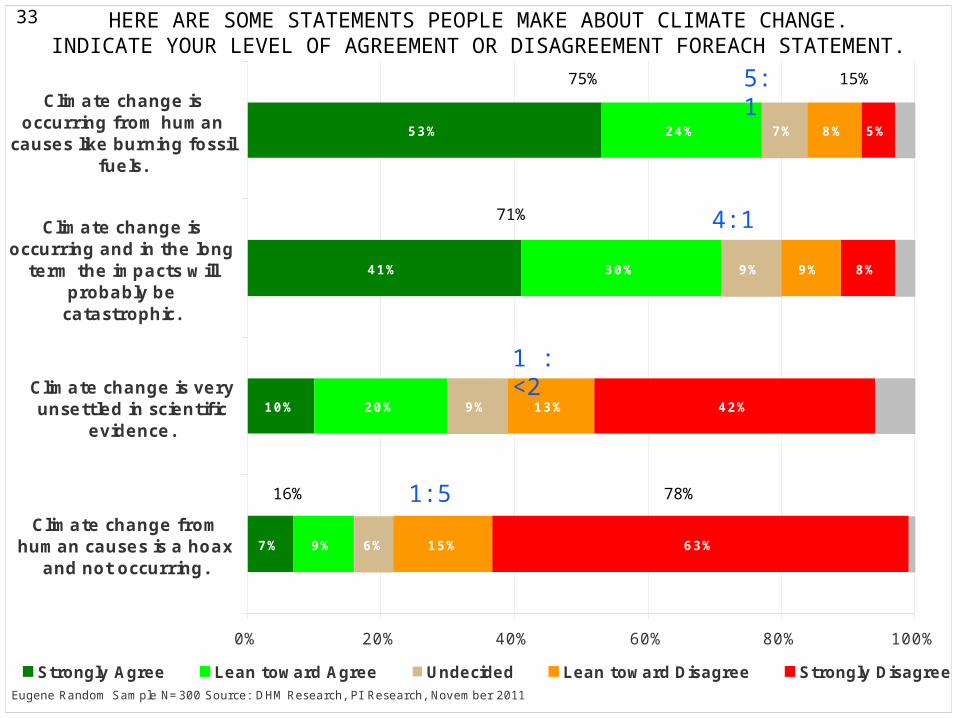
7%
10%
41%
53%
20%
30%
24%
9%
9%
7%
13%
9%
8%
63%
42%
8%
5%
9% 6% 15%
0% 20% 40% 60% 80% 100%
Climate change fromhuman causes is a hoax
and not occurring.
Climate change is veryunsettled in scientific
evidence.
Climate change isoccurring and in the long
term the impacts willprobably becatastrophic.
Climate change isoccurring from human
causes like burning fossilfuels.
Strongly Agree Lean toward Agree Undecided Lean toward Disagree Strongly Disagree Don’t knowEugene Random Sample N=300 Source: DHM Research, PI Research, November 2011
HERE ARE SOME STATEMENTS PEOPLE MAKE ABOUT CLIMATE CHANGE.INDICATE YOUR LEVEL OF AGREEMENT OR DISAGREEMENT FOREACH STATEMENT.
75% 15%
16% 78%
71%
33
5:1
4:1
1 : <2
1:5

Public Support & Confidence inPublic Policy
34

3%
12%
10%
19%
28%
29%
0% 20% 40%
Don’t know
Strongly undesirable
Somewhat undesirable
Neutral
Somewhat desirable
Strongly desirable
(How desirable or undesirable?)
There should be stronger government policies to reduce greenhouse gas emissions
S3-Q46
57%
22%
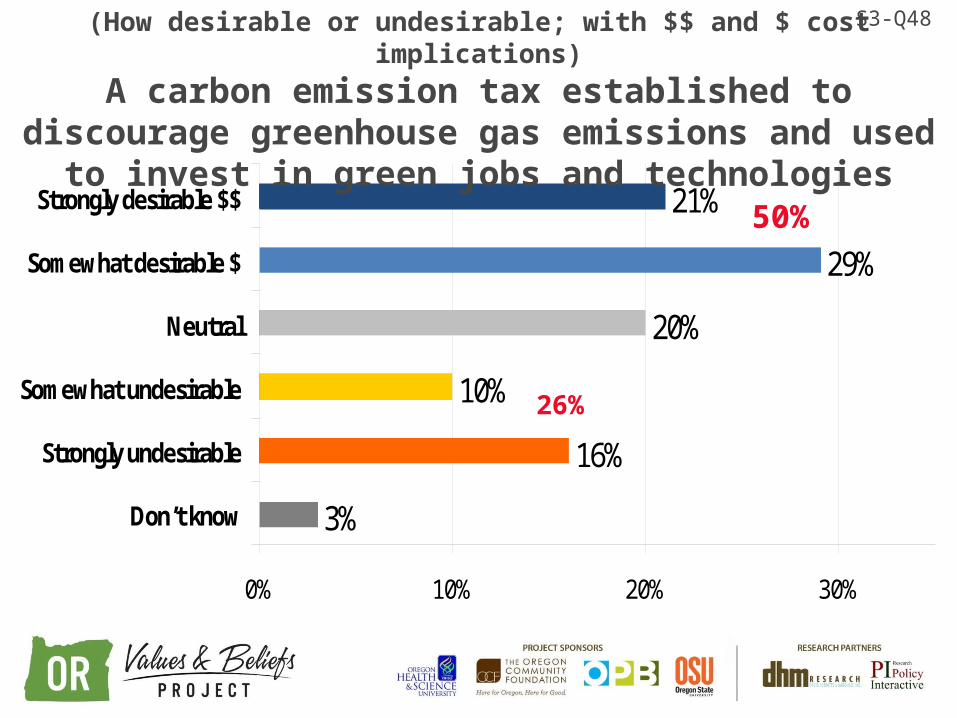
3%
16%
10%
20%
29%
21%
0% 10% 20% 30%
Don’t know
Strongly undesirable
Somewhat undesirable
Neutral
Somewhat desirable $
Strongly desirable $$
(How desirable or undesirable; with $$ and $ cost implications)A carbon emission tax established to discourage greenhouse gas
emissions and used to invest in green jobs and technologies
S3-Q48
50%
26%
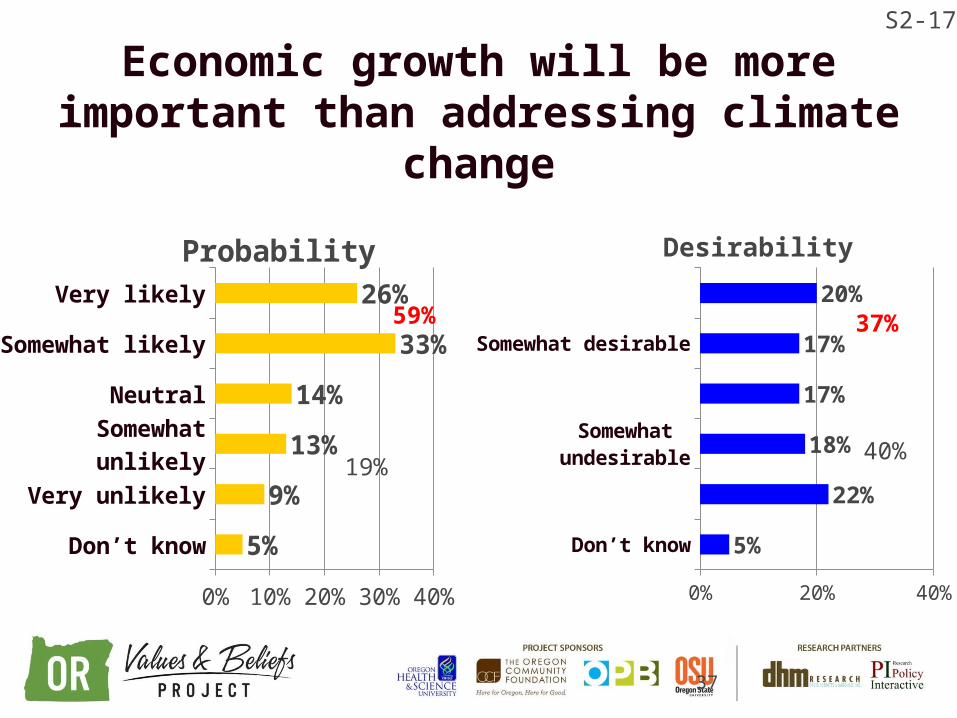
Economic growth will be more important than addressing climate change
Don’t know
Very unlikely
Somewhat unlikely
Neutral
Somewhat likely
Very likely
0% 10% 20% 30% 40%
5%
9%
13%
14%
33%
26%
Probability
Don’t know
Strongly undesirable
Somewhat undesirable
Neutral
Somewhat desirable
Strongly desirable
0% 20% 40%
5%
22%
18%
17%
17%
20%
Desirability
S2-17
59% 37%
19%40%
37

Probability
43%
28%
38%
42%
43%
42%
0% 20% 40% 60% 80% 100%
Southern
Eastern
Central
W. Valley
Metro
Total
Desirability
84%
80%
83%
84%
85%
84%
0% 20% 40% 60% 80% 100%
Southern
Eastern
Central
W. Valley
Metro
Total
Oregonians from diverse backgrounds will find common ground and work together to make progress addressing the
critical issues we face as a stateCombined Very/Somewhat Responses
S3-Q21

Public Confidence:Private Industry,
Science & Technology
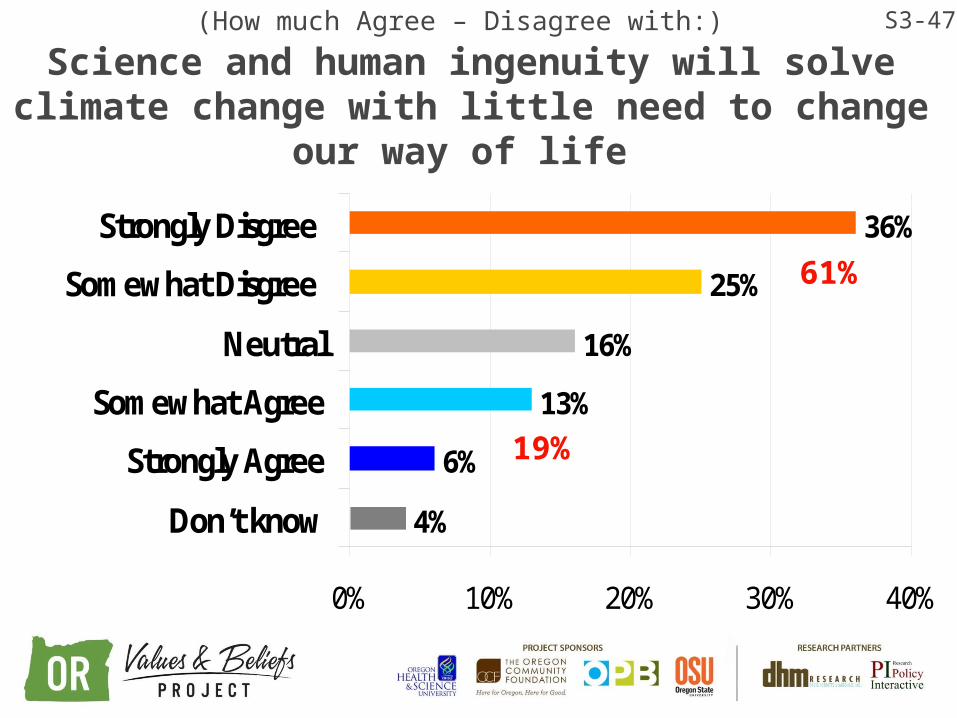
(How much Agree – Disagree with:) Science and human ingenuity will solve climate change with little need to change our way of life
4%
6%
13%
16%
25%
36%
0% 10% 20% 30% 40%
Don’t know
Strongly Agree
Somewhat Agree
Neutral
Somewhat Disgree
Strongly Disgree
S3-47
61%
19%

The role of individual behaviors in absence of policy action:
“When the people lead, the leaders will follow.” Gandhi

9%
17%
46%
11%
13%
35%
5%
18%
5%
24%
20%
8%
50%
28%
6%
0% 20% 40% 60% 80% 100%
An individual is incapable of solving
climate change, changing my own
behavior won't make a difference
Climate change impacts depend on a force
greater than humans.
Climatre chage requires us to entirely rethink
our behavior
Strongly Agree Lean toward Agree Undecided Lean toward Disagree Strongly Disagree Don’t know
Eugene Random Sample N=300 Source: DHM Research, PI Research, November 2011
HERE ARE SOME STATEMENTS PEOPLE MAKE ABOUT CLIMATE CHANGE.INDICATE YOUR LEVEL OF AGREEMENT OR DISAGREEMENT FOR EACH STATEMENT.
81%
48%
20% 74%
20%
14%6 : 1
1 : 4
1 : 2.5
Thinking at the Individual Level
Impact = Population x Affluence x Technology
IPAT
Consumption Behaviors
43
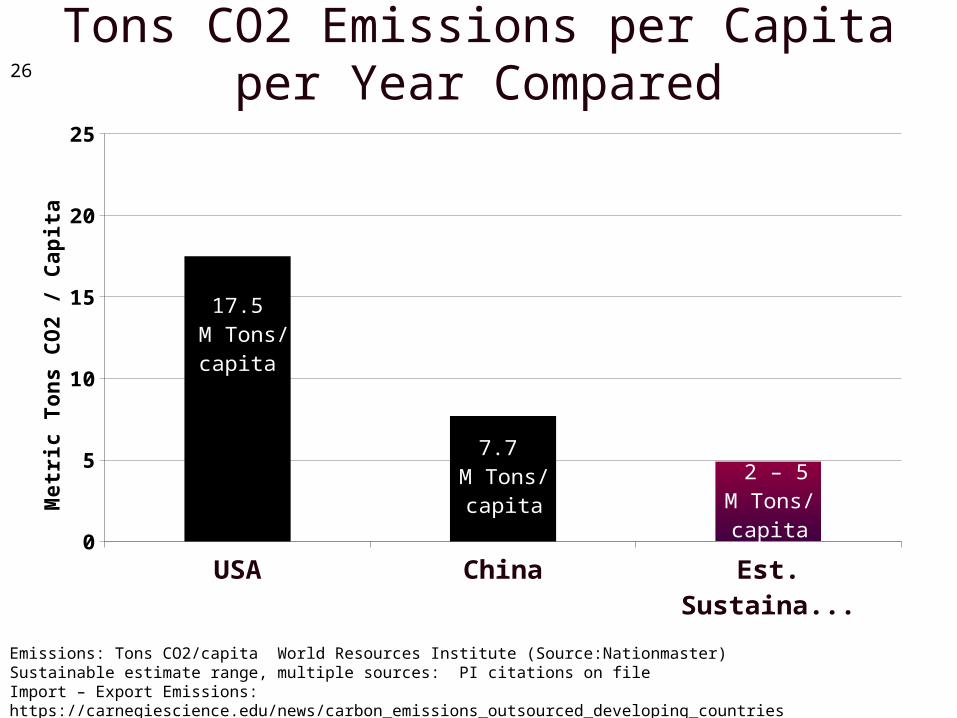
Tons CO2 Emissions per Capita per Year Compared
USA China Est. Sustainable Range
0
5
10
15
20
25
17.5 M Tons/
capita
7.7 M Tons/capita
2 – 5M Tons/capita
Me
tric
To
ns
CO
2 /
Ca
pit
a
Emissions: Tons CO2/capita World Resources Institute (Source:Nationmaster)Sustainable estimate range, multiple sources: PI citations on fileImport – Export Emissions: https://carnegiescience.edu/news/carbon_emissions_outsourced_developing_countries
26
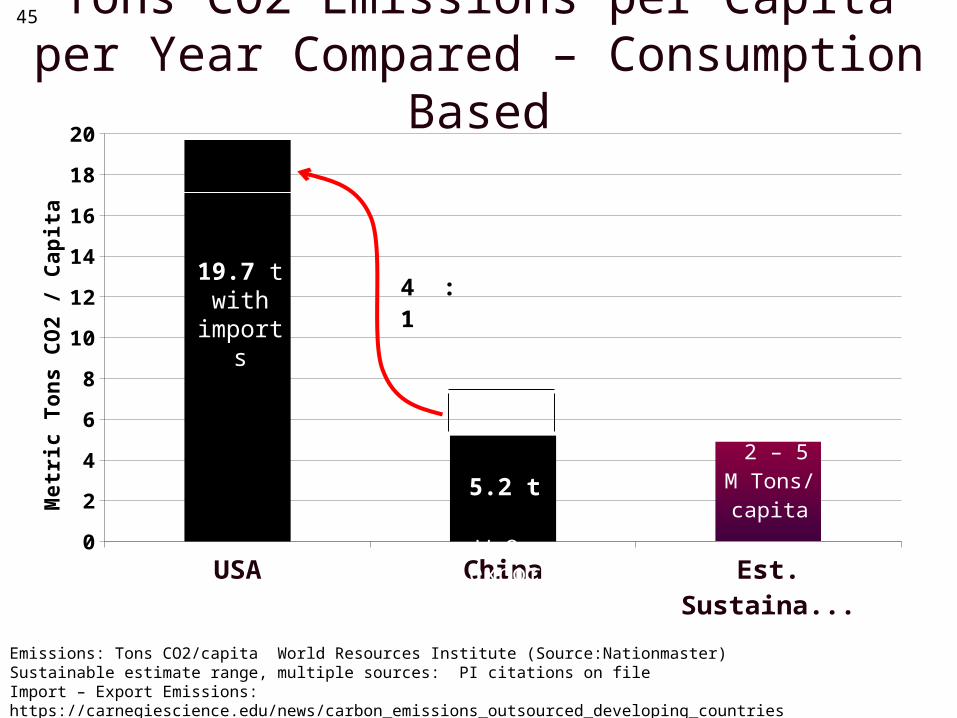
Tons CO2 Emissions per Capita per Year Compared – Consumption Based
USA China Est. Sustainable Range
0
2
4
6
8
10
12
14
16
18
20
2 – 5M Tons/capita
Me
tric
To
ns
CO
2 /
Ca
pit
a
4 : 1
Emissions: Tons CO2/capita World Resources Institute (Source:Nationmaster)Sustainable estimate range, multiple sources: PI citations on fileImport – Export Emissions: https://carnegiescience.edu/news/carbon_emissions_outsourced_developing_countries
19.7 t with
imports
5.2 t w.o
exports
45

Public Opinion about
Consumption Behaviors
46
47
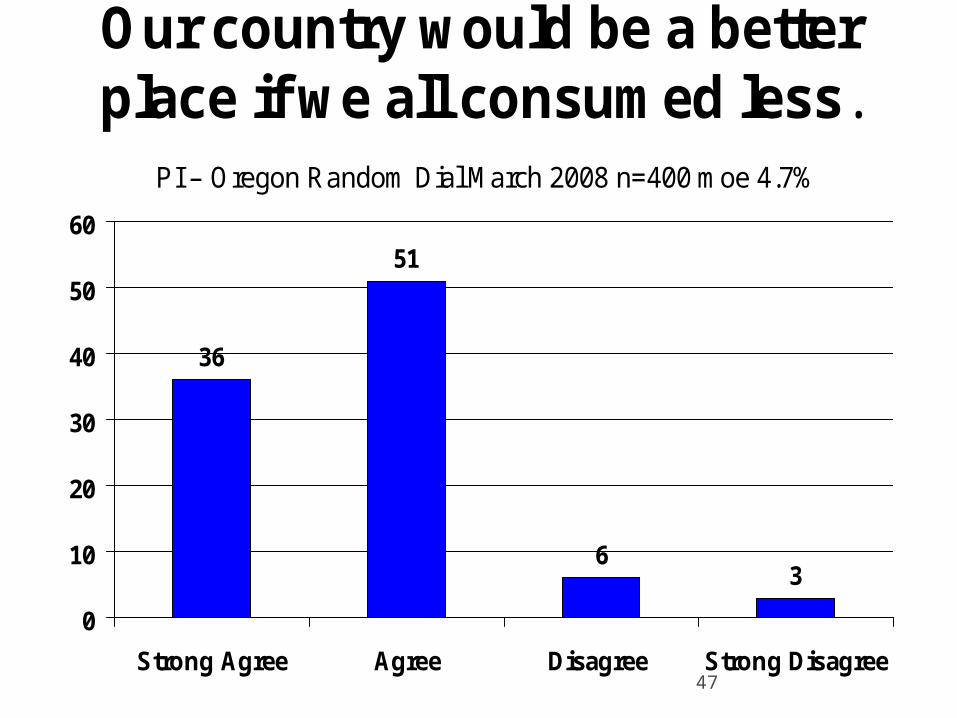
Our country would be a better place if we all consumed less.
PI – Oregon Random Dial March 2008 n=400 moe 4.7%
36
51
63
0
10
20
30
40
50
60
Strong Agree Agree Disagree Strong Disagree

Political Party Ideology ComparisonCompare - Global Warming : Consume less
PI November 2008 n=400 V4A/V1A (% Combined Agreement of Sector)
Global Warming Concern 'Our Country Better Consume Less'
0
10
20
30
40
50
60
70
80
90
34
64
7680
Republican n=128 Democrat n=228
48
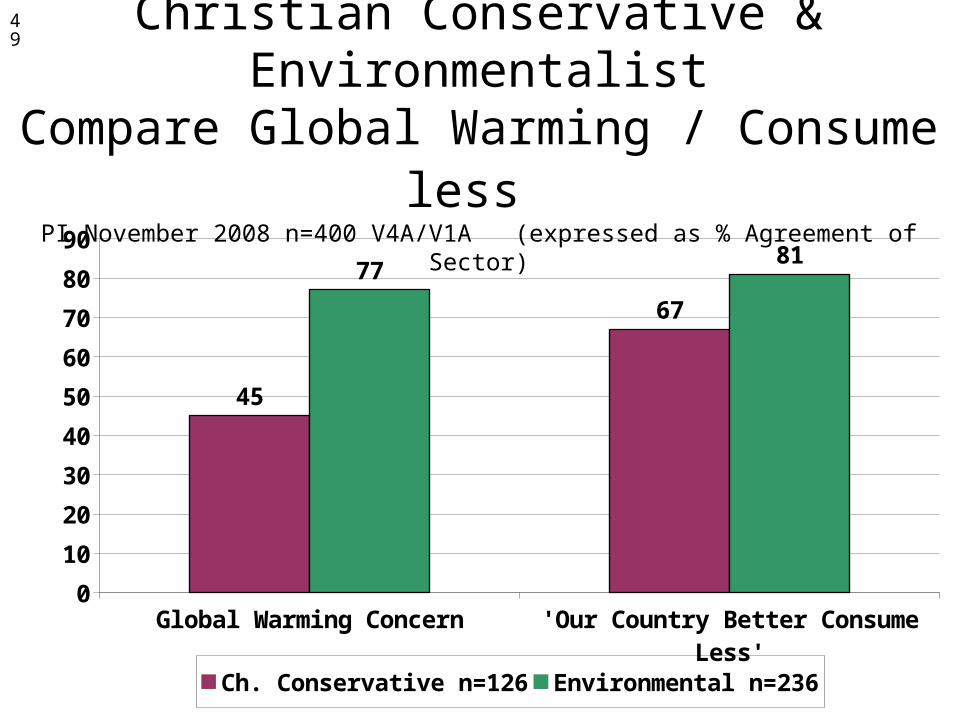
Cultural Ideology Comparison Christian Conservative & EnvironmentalistCompare Global Warming / Consume less
PI November 2008 n=400 V4A/V1A (expressed as % Agreement of Sector)
Global Warming Concern 'Our Country Better Consume Less'
0
10
20
30
40
50
60
70
80
90
45
67
7781
Ch. Conservative n=126 Environmental n=236
49
With roughly two-thirds of consumers saying they care, why is ethical
consumption so minimal and so rarely transformative?
- Dana O’Rourke, book review of Market for Virtue by David Vogle
50
51 Climate Change: What’s going on in our heads?

ATTITUDE A
BEHAVIOR B
X
52
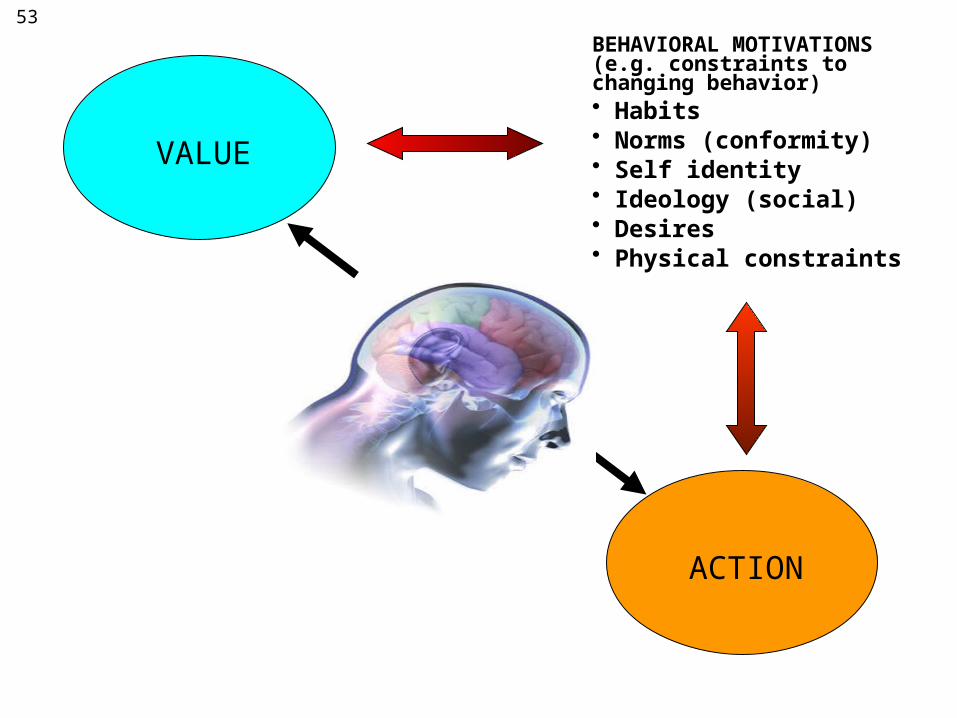
VALUE
ACTION
X
BEHAVIORAL MOTIVATIONS (e.g. constraints to changing behavior)• Habits• Norms (conformity)• Self identity• Ideology (social)• Desires• Physical constraints
53
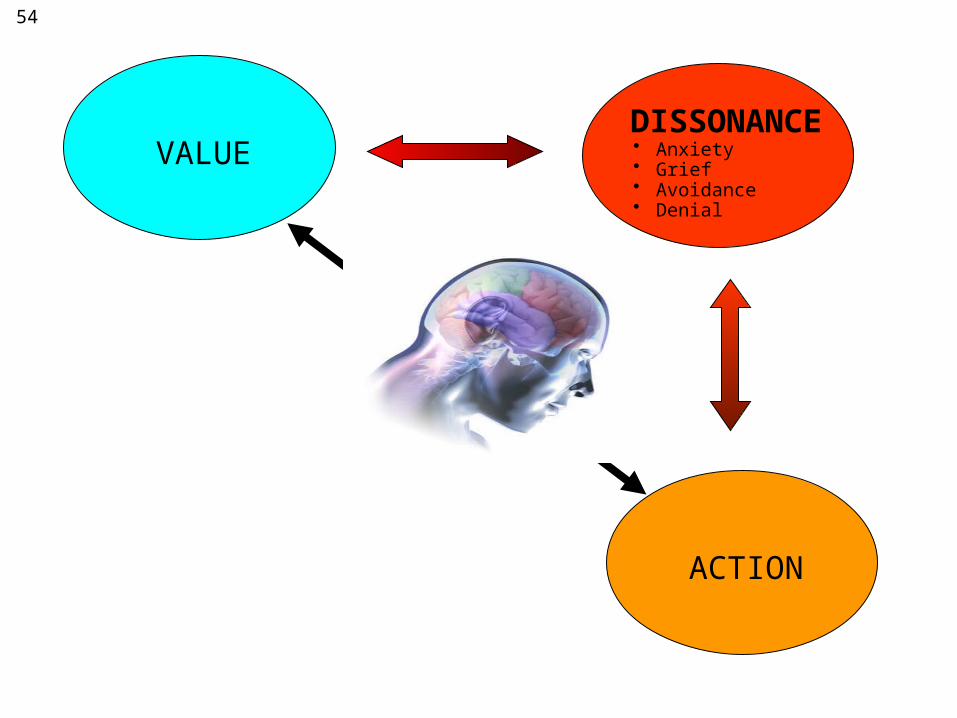
VALUEDISSONANCE• Anxiety• Grief• Avoidance• Denial
ACTION
X
54
55
55
“It is naive to ask consumers to voluntarily downscale, and give up their desires without offering
them alternative dreams.”Tim Jackson, Sustainable Development Commission, U.K.
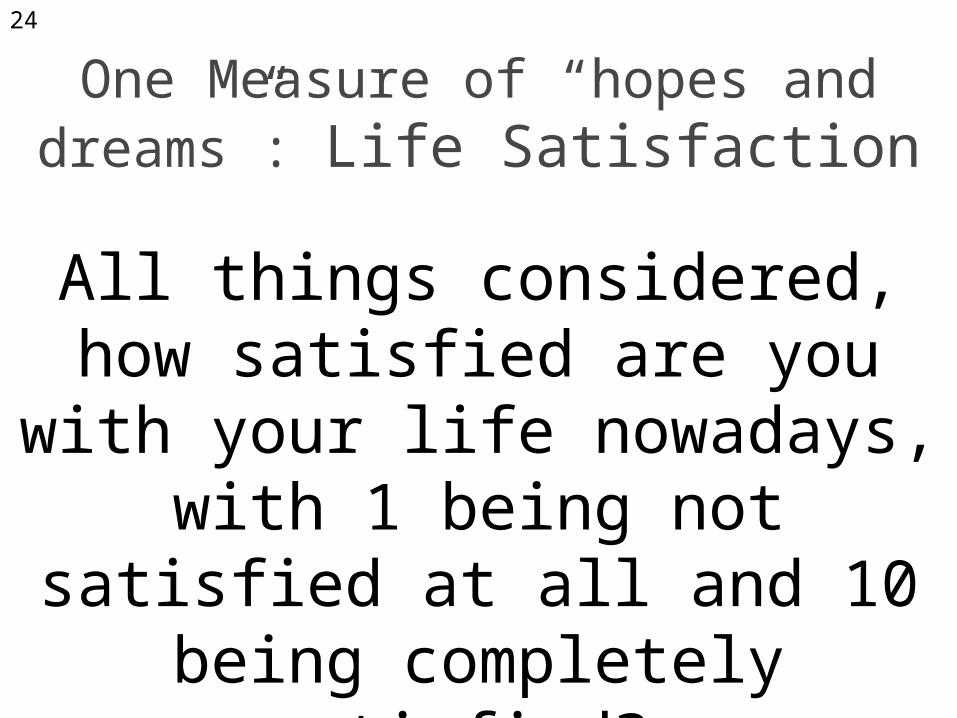
One Measure of “hopes and dreams”: Life Satisfaction
All things considered, how satisfied are you with your life nowadays, with 1 being not satisfied at all and 10 being
completely satisfied?
(annual Gallup World Survey and many others, normally on 1-10 scale)
24

Income/Emissions/Life Satisfaction Nation (normalized) & Oregon Compared
USA Oregon
$53,000$44,000
17.5(t)
9.7(t)
7.4 7.5
Income ($US) Emissions (ton/capita) Life Satisfaction Index
Income: Per Capita/Yr. World Bank 2013 estimate (Atlas Method) Emissions: Tons CO2/capita EPA 2013 estimateLife Satisfaction Index Gallup World Survey 2008 (Source: Happiness Foundation) PI 2008
2557
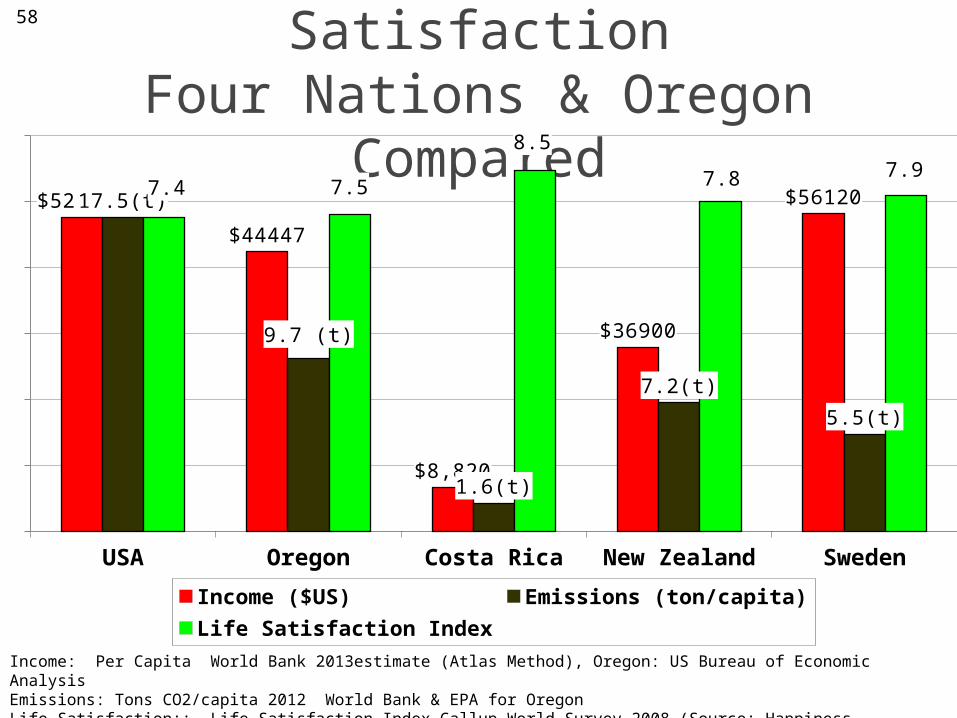
Income/Emissions/Life SatisfactionFour Nations & Oregon Compared
USA Oregon Costa Rica New Zealand Sweden
$52,610
$44447
$8,820
$36900
$5612017.5(t)
9.7 (t)
1.6(t)
7.2(t)
5.5(t)
7.4 7.5
8.5
7.8 7.9
Income ($US) Emissions (ton/capita) Life Satisfaction IndexIncome: Per Capita World Bank 2013estimate (Atlas Method), Oregon: US Bureau of Economic AnalysisEmissions: Tons CO2/capita 2012 World Bank & EPA for OregonLife Satisfaction:: Life Satisfaction Index Gallup World Survey 2008 (Source: Happiness Foundation); Oregon PI Dec 09
58

USA NOW
29
COSTA RICA NOW
True Sustainability (4 Mt/C) does not mean hair shirts and living in caves:

60
Hitting the reset button onNORMATIVE BEHAVIOR
Individual Actions Do Count
60

61
61
10,920
8,548
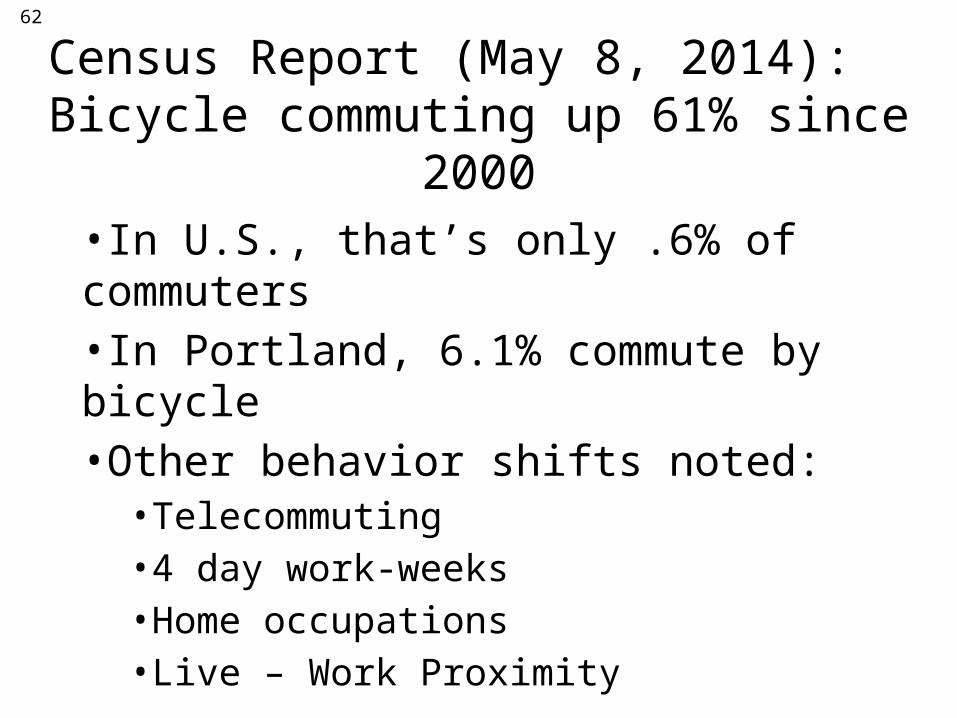
Census Report (May 8, 2014): Bicycle commuting up 61% since 2000
•In U.S., that’s only .6% of commuters•In Portland, 6.1% commute by bicycle•Other behavior shifts noted:
•Telecommuting•4 day work-weeks•Home occupations•Live – Work Proximity
62

VALUES
New Norms
ACTIONS
X
63
• Yield Critical Mass reinforces
• Policy Support reinforces
• Widespread adoption

64
CHANGING BEHAVIOR:
• TRANSFORMATIONAL THINKINGHolistic & Systemic: as a Way of LifeRethinking “Wealth”Practice World Citizenship
• UNDERSTAND MY OWN CONTRIBUTION“Oregon Carbon Calculator” (20 minute exercise)
• DOWNSHIFTING: Incremental but Steady • PROMOTE POLICY REINFORCEMENTS• CELEBRATE REAL LEADERSHIP
29
Further Information:
• PolicyInteractive:– policyinteractive.org
• Oregon Values Project:– oregonvaluesproject.org
65
66
Appendices:
1.Message Frame Testing
67

Eugene Message Frame StudyResults shown in order: Aggregated EWEB + City Employee (in bold font); EWEB
Residential Customer; City Employee. 5 Votes
summarized
Future Generations: We all have a responsibility to pass this place on to the next generation in at least as good a condition as we inherited it ourselves. Both our leaders and we our selves must do more to protect this planet for future generations.
872527345
Live by Example: Each and every one of us is a teacher by how we act. We need to set a good example for each other and our children by considerate and thoughtful behavior as it applies to care of the earth and equitable sharing of resources.
630401229
Oregon Pride: Oregon is a special place which has attracted people who care for the land and natural resources. We have long been a leader in green practices and we can leverage this reputation to set an example for other states. We need to continue to build on our leadership through smart environmental behavior.
412265147
Waste Not: Waste is a bad thing, and it is a by-product of thoughtless consumption. It is important to reduce the amount of waste we create by shifting behaviors to a more sustainable lifestyle and living more simply.
735480255
Do the Right Thing: I feel better about myself when I know I’m doing the right thing. Recycling, being careful to reuse things, and making purchases with thoughtfulness about consequences gives a sense of self-satisfaction.
616352264
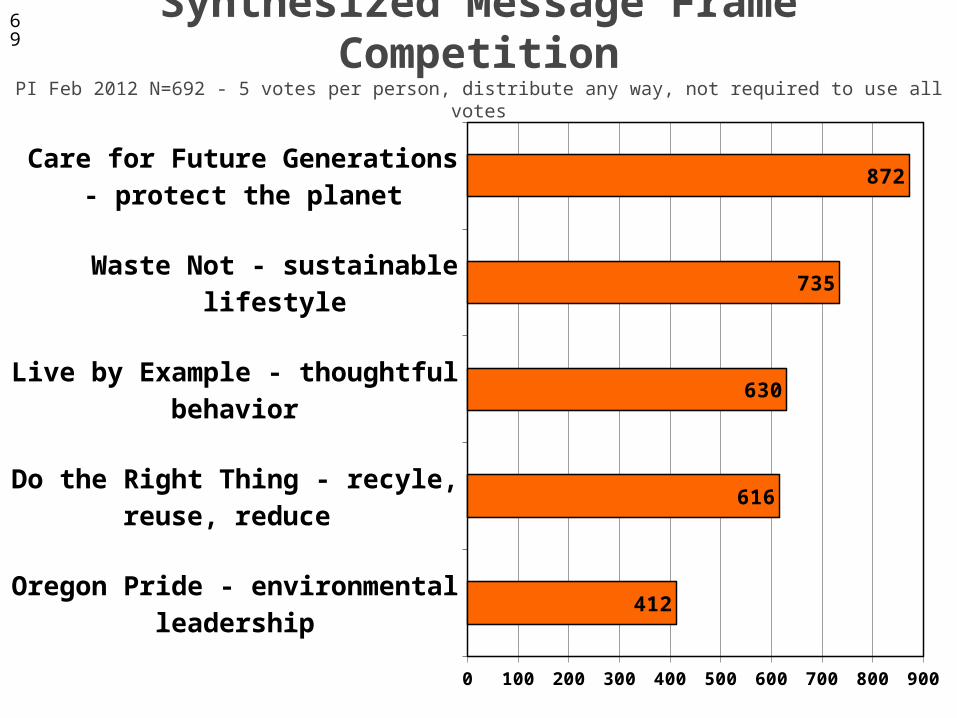
69
Synthesized Message Frame CompetitionPI Feb 2012 N=692 - 5 votes per person, distribute any way, not required to use all votes
Oregon Pride - environmental leadership
Do the Right Thing - recyle, reuse, reduce
Live by Example - thoughtful behav-ior
Waste Not - sustainable lifestyle
Care for Future Generations - pro-tect the planet
0 100 200 300 400 500 600 700 800 900
412
616
630
735
872


![Welcome [] as well as renowned coach Bill Bowerman and Olympian Steve Prefontaine, among many others. The Oregon Bach Festival is …](https://img.pdfslide.us/doc/110x75/5aa5d05d7f8b9a185d8dce60/welcome-as-well-as-renowned-coach-bill-bowerman-and-olympian-steve-prefontaine.jpg)