Embed Size (px)
Citation preview
LEAGUE LEADERS & TEAM STATISTICS THROUGH WEEK 6
UPDATED ON 10/20/15

WEEK 6 / THROUGH MONDAY, OCTOBER 19, 2015
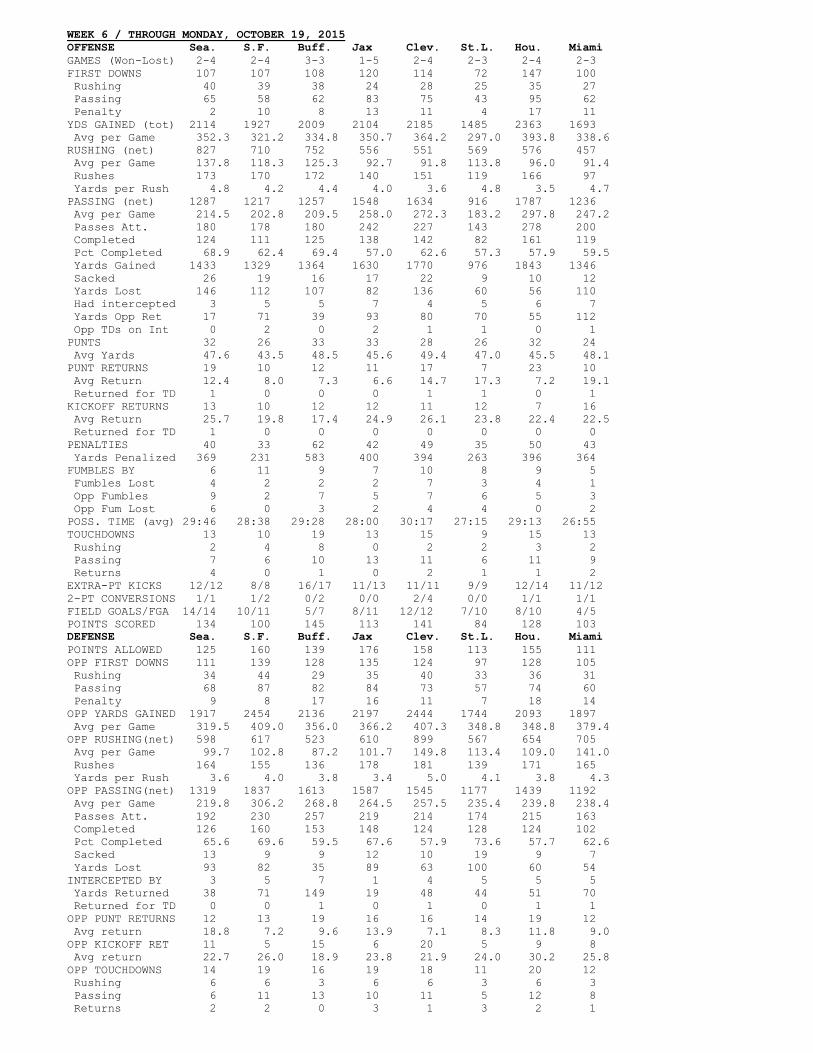
OFFENSE Sea. S.F. Buff. Jax Clev. St.L. Hou. Miami
GAMES (Won-Lost) 2-4 2-4 3-3 1-5 2-4 2-3 2-4 2-3
FIRST DOWNS 107 107 108 120 114 72 147 100
Rushing 40 39 38 24 28 25 35 27
Passing 65 58 62 83 75 43 95 62
Penalty 2 10 8 13 11 4 17 11
YDS GAINED (tot) 2114 1927 2009 2104 2185 1485 2363 1693
Avg per Game 352.3 321.2 334.8 350.7 364.2 297.0 393.8 338.6
RUSHING (net) 827 710 752 556 551 569 576 457
Avg per Game 137.8 118.3 125.3 92.7 91.8 113.8 96.0 91.4
Rushes 173 170 172 140 151 119 166 97
Yards per Rush 4.8 4.2 4.4 4.0 3.6 4.8 3.5 4.7
PASSING (net) 1287 1217 1257 1548 1634 916 1787 1236
Avg per Game 214.5 202.8 209.5 258.0 272.3 183.2 297.8 247.2
Passes Att. 180 178 180 242 227 143 278 200
Completed 124 111 125 138 142 82 161 119
Pct Completed 68.9 62.4 69.4 57.0 62.6 57.3 57.9 59.5
Yards Gained 1433 1329 1364 1630 1770 976 1843 1346
Sacked 26 19 16 17 22 9 10 12
Yards Lost 146 112 107 82 136 60 56 110
Had intercepted 3 5 5 7 4 5 6 7
Yards Opp Ret 17 71 39 93 80 70 55 112
Opp TDs on Int 0 2 0 2 1 1 0 1
PUNTS 32 26 33 33 28 26 32 24
Avg Yards 47.6 43.5 48.5 45.6 49.4 47.0 45.5 48.1
PUNT RETURNS 19 10 12 11 17 7 23 10
Avg Return 12.4 8.0 7.3 6.6 14.7 17.3 7.2 19.1
Returned for TD 1 0 0 0 1 1 0 1
KICKOFF RETURNS 13 10 12 12 11 12 7 16
Avg Return 25.7 19.8 17.4 24.9 26.1 23.8 22.4 22.5
Returned for TD 1 0 0 0 0 0 0 0
PENALTIES 40 33 62 42 49 35 50 43
Yards Penalized 369 231 583 400 394 263 396 364
FUMBLES BY 6 11 9 7 10 8 9 5
Fumbles Lost 4 2 2 2 7 3 4 1
Opp Fumbles 9 2 7 5 7 6 5 3
Opp Fum Lost 6 0 3 2 4 4 0 2
POSS. TIME (avg) 29:46 28:38 29:28 28:00 30:17 27:15 29:13 26:55
TOUCHDOWNS 13 10 19 13 15 9 15 13
Rushing 2 4 8 0 2 2 3 2
Passing 7 6 10 13 11 6 11 9
Returns 4 0 1 0 2 1 1 2
EXTRA-PT KICKS 12/12 8/8 16/17 11/13 11/11 9/9 12/14 11/12
2-PT CONVERSIONS 1/1 1/2 0/2 0/0 2/4 0/0 1/1 1/1
FIELD GOALS/FGA 14/14 10/11 5/7 8/11 12/12 7/10 8/10 4/5
POINTS SCORED 134 100 145 113 141 84 128 103
DEFENSE Sea. S.F. Buff. Jax Clev. St.L. Hou. Miami
POINTS ALLOWED 125 160 139 176 158 113 155 111
OPP FIRST DOWNS 111 139 128 135 124 97 128 105
Rushing 34 44 29 35 40 33 36 31
Passing 68 87 82 84 73 57 74 60
Penalty 9 8 17 16 11 7 18 14
OPP YARDS GAINED 1917 2454 2136 2197 2444 1744 2093 1897
Avg per Game 319.5 409.0 356.0 366.2 407.3 348.8 348.8 379.4
OPP RUSHING(net) 598 617 523 610 899 567 654 705
Avg per Game 99.7 102.8 87.2 101.7 149.8 113.4 109.0 141.0
Rushes 164 155 136 178 181 139 171 165
Yards per Rush 3.6 4.0 3.8 3.4 5.0 4.1 3.8 4.3
OPP PASSING(net) 1319 1837 1613 1587 1545 1177 1439 1192
Avg per Game 219.8 306.2 268.8 264.5 257.5 235.4 239.8 238.4
Passes Att. 192 230 257 219 214 174 215 163
Completed 126 160 153 148 124 128 124 102
Pct Completed 65.6 69.6 59.5 67.6 57.9 73.6 57.7 62.6
Sacked 13 9 9 12 10 19 9 7
Yards Lost 93 82 35 89 63 100 60 54
INTERCEPTED BY 3 5 7 1 4 5 5 5
Yards Returned 38 71 149 19 48 44 51 70
Returned for TD 0 0 1 0 1 0 1 1
OPP PUNT RETURNS 12 13 19 16 16 14 19 12
Avg return 18.8 7.2 9.6 13.9 7.1 8.3 11.8 9.0
OPP KICKOFF RET 11 5 15 6 20 5 9 8
Avg return 22.7 26.0 18.9 23.8 21.9 24.0 30.2 25.8
OPP TOUCHDOWNS 14 19 16 19 18 11 20 12
Rushing 6 6 3 6 6 3 6 3
Passing 6 11 13 10 11 5 12 8
Returns 2 2 0 3 1 3 2 1
WEEK 6 / THROUGH MONDAY, OCTOBER 19, 2015
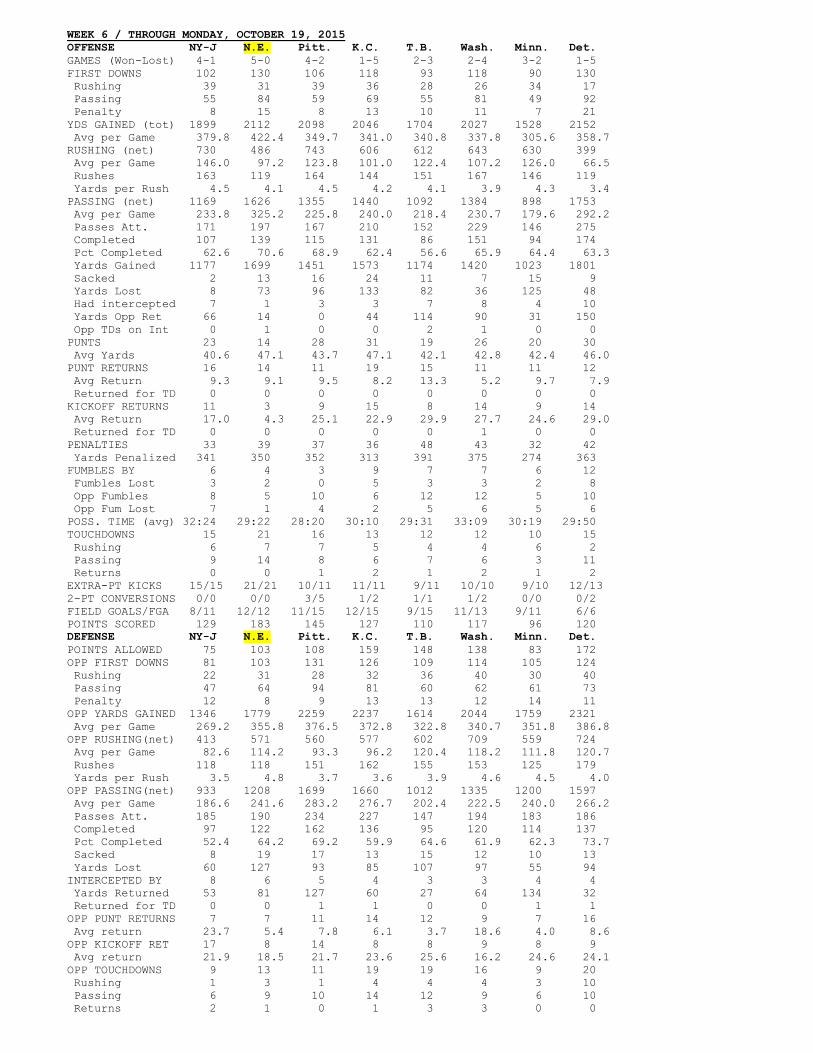
OFFENSE NY-J N.E. Pitt. K.C. T.B. Wash. Minn. Det.
GAMES (Won-Lost) 4-1 5-0 4-2 1-5 2-3 2-4 3-2 1-5
FIRST DOWNS 102 130 106 118 93 118 90 130
Rushing 39 31 39 36 28 26 34 17
Passing 55 84 59 69 55 81 49 92
Penalty 8 15 8 13 10 11 7 21
YDS GAINED (tot) 1899 2112 2098 2046 1704 2027 1528 2152
Avg per Game 379.8 422.4 349.7 341.0 340.8 337.8 305.6 358.7
RUSHING (net) 730 486 743 606 612 643 630 399
Avg per Game 146.0 97.2 123.8 101.0 122.4 107.2 126.0 66.5
Rushes 163 119 164 144 151 167 146 119
Yards per Rush 4.5 4.1 4.5 4.2 4.1 3.9 4.3 3.4
PASSING (net) 1169 1626 1355 1440 1092 1384 898 1753
Avg per Game 233.8 325.2 225.8 240.0 218.4 230.7 179.6 292.2
Passes Att. 171 197 167 210 152 229 146 275
Completed 107 139 115 131 86 151 94 174
Pct Completed 62.6 70.6 68.9 62.4 56.6 65.9 64.4 63.3
Yards Gained 1177 1699 1451 1573 1174 1420 1023 1801
Sacked 2 13 16 24 11 7 15 9
Yards Lost 8 73 96 133 82 36 125 48
Had intercepted 7 1 3 3 7 8 4 10
Yards Opp Ret 66 14 0 44 114 90 31 150
Opp TDs on Int 0 1 0 0 2 1 0 0
PUNTS 23 14 28 31 19 26 20 30
Avg Yards 40.6 47.1 43.7 47.1 42.1 42.8 42.4 46.0
PUNT RETURNS 16 14 11 19 15 11 11 12
Avg Return 9.3 9.1 9.5 8.2 13.3 5.2 9.7 7.9
Returned for TD 0 0 0 0 0 0 0 0
KICKOFF RETURNS 11 3 9 15 8 14 9 14
Avg Return 17.0 4.3 25.1 22.9 29.9 27.7 24.6 29.0
Returned for TD 0 0 0 0 0 1 0 0
PENALTIES 33 39 37 36 48 43 32 42
Yards Penalized 341 350 352 313 391 375 274 363
FUMBLES BY 6 4 3 9 7 7 6 12
Fumbles Lost 3 2 0 5 3 3 2 8
Opp Fumbles 8 5 10 6 12 12 5 10
Opp Fum Lost 7 1 4 2 5 6 5 6
POSS. TIME (avg) 32:24 29:22 28:20 30:10 29:31 33:09 30:19 29:50
TOUCHDOWNS 15 21 16 13 12 12 10 15
Rushing 6 7 7 5 4 4 6 2
Passing 9 14 8 6 7 6 3 11
Returns 0 0 1 2 1 2 1 2
EXTRA-PT KICKS 15/15 21/21 10/11 11/11 9/11 10/10 9/10 12/13
2-PT CONVERSIONS 0/0 0/0 3/5 1/2 1/1 1/2 0/0 0/2
FIELD GOALS/FGA 8/11 12/12 11/15 12/15 9/15 11/13 9/11 6/6
POINTS SCORED 129 183 145 127 110 117 96 120
DEFENSE NY-J N.E. Pitt. K.C. T.B. Wash. Minn. Det.
POINTS ALLOWED 75 103 108 159 148 138 83 172
OPP FIRST DOWNS 81 103 131 126 109 114 105 124
Rushing 22 31 28 32 36 40 30 40
Passing 47 64 94 81 60 62 61 73
Penalty 12 8 9 13 13 12 14 11
OPP YARDS GAINED 1346 1779 2259 2237 1614 2044 1759 2321
Avg per Game 269.2 355.8 376.5 372.8 322.8 340.7 351.8 386.8
OPP RUSHING(net) 413 571 560 577 602 709 559 724
Avg per Game 82.6 114.2 93.3 96.2 120.4 118.2 111.8 120.7
Rushes 118 118 151 162 155 153 125 179
Yards per Rush 3.5 4.8 3.7 3.6 3.9 4.6 4.5 4.0
OPP PASSING(net) 933 1208 1699 1660 1012 1335 1200 1597
Avg per Game 186.6 241.6 283.2 276.7 202.4 222.5 240.0 266.2
Passes Att. 185 190 234 227 147 194 183 186
Completed 97 122 162 136 95 120 114 137
Pct Completed 52.4 64.2 69.2 59.9 64.6 61.9 62.3 73.7
Sacked 8 19 17 13 15 12 10 13
Yards Lost 60 127 93 85 107 97 55 94
INTERCEPTED BY 8 6 5 4 3 3 4 4
Yards Returned 53 81 127 60 27 64 134 32
Returned for TD 0 0 1 1 0 0 1 1
OPP PUNT RETURNS 7 7 11 14 12 9 7 16
Avg return 23.7 5.4 7.8 6.1 3.7 18.6 4.0 8.6
OPP KICKOFF RET 17 8 14 8 8 9 8 9
Avg return 21.9 18.5 21.7 23.6 25.6 16.2 24.6 24.1
OPP TOUCHDOWNS 9 13 11 19 19 16 9 20
Rushing 1 3 1 4 4 4 3 10
Passing 6 9 10 14 12 9 6 10
Returns 2 1 0 1 3 3 0 0

WEEK 6 / THROUGH MONDAY, OCTOBER 19, 2015
OFFENSE N.O. Ind. Atl. Tenn. Oak. S.D. Dal. NY-G
GAMES (Won-Lost) 2-4 3-3 5-1 1-4 2-3 2-4 2-3 3-3
FIRST DOWNS 137 128 146 108 98 147 110 123
Rushing 36 33 46 28 17 28 26 30
Passing 88 77 88 68 66 105 65 77
Penalty 13 18 12 12 15 14 19 16
YDS GAINED (tot) 2322 2083 2444 1702 1694 2598 1741 2115
Avg per Game 387.0 347.2 407.3 340.4 338.8 433.0 348.2 352.5
RUSHING (net) 508 580 780 538 450 520 531 537
Avg per Game 84.7 96.7 130.0 107.6 90.0 86.7 106.2 89.5
Rushes 149 140 177 135 112 145 129 150
Yards per Rush 3.4 4.1 4.4 4.0 4.0 3.6 4.1 3.6
PASSING (net) 1814 1503 1664 1164 1244 2078 1210 1578
Avg per Game 302.3 250.5 277.3 232.8 248.8 346.3 242.0 263.0
Passes Att. 247 242 229 169 193 259 170 235
Completed 174 143 150 108 126 182 125 155
Pct Completed 70.4 59.1 65.5 63.9 65.3 70.3 73.5 66.0
Yards Gained 1926 1560 1751 1302 1313 2179 1290 1606
Sacked 16 11 14 20 9 17 11 7
Yards Lost 112 57 87 138 69 101 80 28
Had intercepted 4 7 4 5 4 5 4 4
Yards Opp Ret 80 154 59 125 112 192 56 46
Opp TDs on Int 0 0 0 2 1 3 0 1
PUNTS 24 27 24 24 21 24 23 30
Avg Yards 42.3 48.0 48.8 44.8 46.9 45.0 47.3 43.3
PUNT RETURNS 10 9 9 15 12 7 8 16
Avg Return 13.1 5.3 10.2 8.9 7.7 0.4 3.5 7.4
Returned for TD 1 0 0 0 0 0 0 0
KICKOFF RETURNS 11 13 8 7 10 14 10 11
Avg Return 21.6 24.7 20.1 21.3 23.2 22.2 21.6 22.0
Returned for TD 0 0 0 0 0 0 0 0
PENALTIES 43 49 40 39 44 42 39 48
Yards Penalized 400 417 375 319 311 339 288 388
FUMBLES BY 9 8 8 8 7 8 6 6
Fumbles Lost 6 5 4 6 5 6 4 2
Opp Fumbles 8 6 7 7 6 5 2 13
Opp Fum Lost 6 0 4 1 4 3 1 4
POSS. TIME (avg) 31:08 28:36 33:00 33:04 30:04 33:12 33:09 29:08
TOUCHDOWNS 16 16 23 14 12 15 11 14
Rushing 7 3 11 4 2 2 5 2
Passing 7 11 8 9 10 13 5 11
Returns 2 2 4 1 0 0 1 1
EXTRA-PT KICKS 11/12 13/14 19/19 13/13 11/11 13/14 11/11 12/13
2-PT CONVERSIONS 0/3 1/2 1/3 0/1 0/1 0/1 0/0 1/1
FIELD GOALS/FGA 9/13 5/7 8/10 5/5 8/10 11/13 8/8 13/13
POINTS SCORED 134 126 183 112 107 136 101 139
DEFENSE N.O. Ind. Atl. Tenn. Oak. S.D. Dal. NY-G
POINTS ALLOWED 164 147 143 129 124 161 131 136
OPP FIRST DOWNS 145 130 132 88 110 105 108 134
Rushing 43 32 34 36 22 32 30 32
Passing 79 85 88 46 74 60 63 89
Penalty 23 13 10 6 14 13 15 13
OPP YARDS GAINED 2458 2411 2217 1568 1912 2126 1747 2349
Avg per Game 409.7 401.8 369.5 313.6 382.4 354.3 349.4 391.5
OPP RUSHING(net) 829 676 473 648 416 795 476 558
Avg per Game 138.2 112.7 78.8 129.6 83.2 132.5 95.2 93.0
Rushes 173 171 133 139 117 148 121 153
Yards per Rush 4.8 4.0 3.6 4.7 3.6 5.4 3.9 3.6
OPP PASSING(net) 1629 1735 1744 920 1496 1331 1271 1791
Avg per Game 271.5 289.2 290.7 184.0 299.2 221.8 254.2 298.5
Passes Att. 199 225 246 125 206 176 177 255
Completed 131 145 165 75 135 109 120 171
Pct Completed 65.8 64.4 67.1 60.0 65.5 61.9 67.8 67.1
Sacked 12 8 7 15 10 11 11 8
Yards Lost 74 43 29 101 45 64 65 60
INTERCEPTED BY 2 6 6 6 5 4 2 8
Yards Returned 0 157 89 151 10 27 24 69
Returned for TD 0 2 1 1 0 0 0 0
OPP PUNT RETURNS 7 12 17 12 8 17 11 13
Avg return 10.0 3.4 10.4 18.1 6.6 11.0 9.9 6.0
OPP KICKOFF RET 7 3 8 7 7 16 3 19
Avg return 27.7 1.7 28.5 26.1 19.6 28.9 26.0 21.6
OPP TOUCHDOWNS 18 16 18 18 12 19 14 15
Rushing 7 5 10 6 3 6 6 4
Passing 11 11 7 9 8 10 7 9
Returns 0 0 1 3 1 3 1 2
WEEK 6 / THROUGH MONDAY, OCTOBER 19, 2015
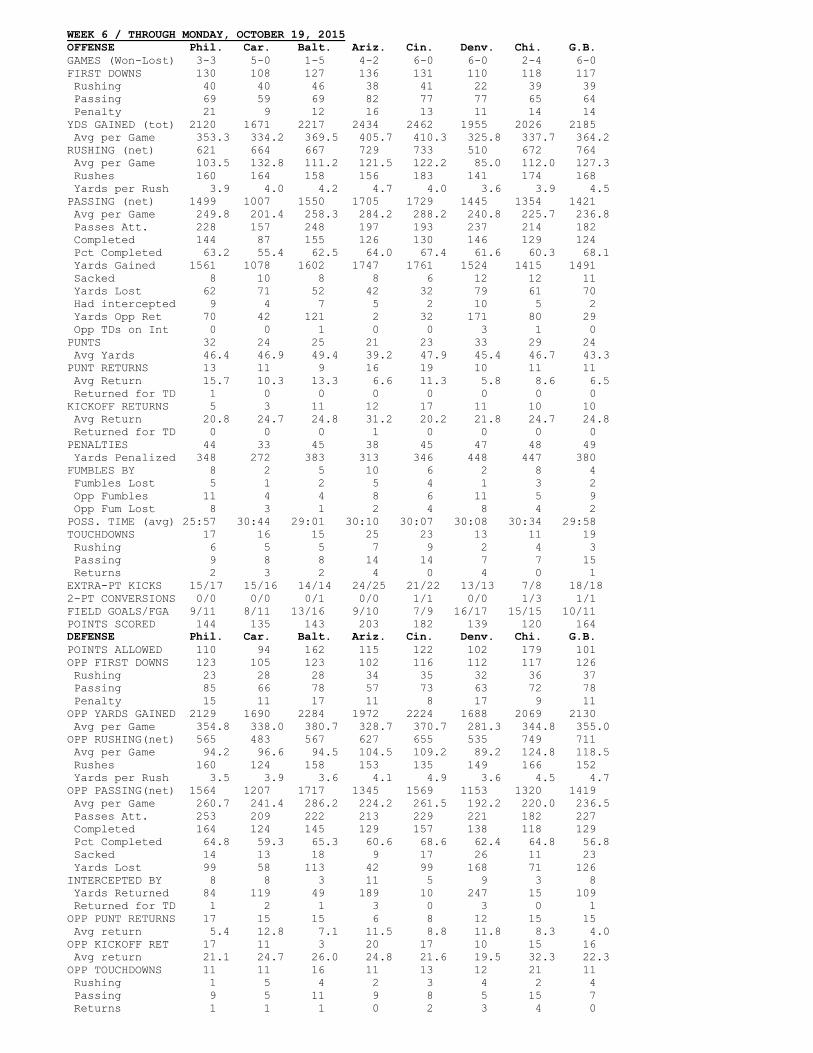
OFFENSE Phil. Car. Balt. Ariz. Cin. Denv. Chi. G.B.
GAMES (Won-Lost) 3-3 5-0 1-5 4-2 6-0 6-0 2-4 6-0
FIRST DOWNS 130 108 127 136 131 110 118 117
Rushing 40 40 46 38 41 22 39 39
Passing 69 59 69 82 77 77 65 64
Penalty 21 9 12 16 13 11 14 14
YDS GAINED (tot) 2120 1671 2217 2434 2462 1955 2026 2185
Avg per Game 353.3 334.2 369.5 405.7 410.3 325.8 337.7 364.2
RUSHING (net) 621 664 667 729 733 510 672 764
Avg per Game 103.5 132.8 111.2 121.5 122.2 85.0 112.0 127.3
Rushes 160 164 158 156 183 141 174 168
Yards per Rush 3.9 4.0 4.2 4.7 4.0 3.6 3.9 4.5
PASSING (net) 1499 1007 1550 1705 1729 1445 1354 1421
Avg per Game 249.8 201.4 258.3 284.2 288.2 240.8 225.7 236.8
Passes Att. 228 157 248 197 193 237 214 182
Completed 144 87 155 126 130 146 129 124
Pct Completed 63.2 55.4 62.5 64.0 67.4 61.6 60.3 68.1
Yards Gained 1561 1078 1602 1747 1761 1524 1415 1491
Sacked 8 10 8 8 6 12 12 11
Yards Lost 62 71 52 42 32 79 61 70
Had intercepted 9 4 7 5 2 10 5 2
Yards Opp Ret 70 42 121 2 32 171 80 29
Opp TDs on Int 0 0 1 0 0 3 1 0
PUNTS 32 24 25 21 23 33 29 24
Avg Yards 46.4 46.9 49.4 39.2 47.9 45.4 46.7 43.3
PUNT RETURNS 13 11 9 16 19 10 11 11
Avg Return 15.7 10.3 13.3 6.6 11.3 5.8 8.6 6.5
Returned for TD 1 0 0 0 0 0 0 0
KICKOFF RETURNS 5 3 11 12 17 11 10 10
Avg Return 20.8 24.7 24.8 31.2 20.2 21.8 24.7 24.8
Returned for TD 0 0 0 1 0 0 0 0
PENALTIES 44 33 45 38 45 47 48 49
Yards Penalized 348 272 383 313 346 448 447 380
FUMBLES BY 8 2 5 10 6 2 8 4
Fumbles Lost 5 1 2 5 4 1 3 2
Opp Fumbles 11 4 4 8 6 11 5 9
Opp Fum Lost 8 3 1 2 4 8 4 2
POSS. TIME (avg) 25:57 30:44 29:01 30:10 30:07 30:08 30:34 29:58
TOUCHDOWNS 17 16 15 25 23 13 11 19
Rushing 6 5 5 7 9 2 4 3
Passing 9 8 8 14 14 7 7 15
Returns 2 3 2 4 0 4 0 1
EXTRA-PT KICKS 15/17 15/16 14/14 24/25 21/22 13/13 7/8 18/18
2-PT CONVERSIONS 0/0 0/0 0/1 0/0 1/1 0/0 1/3 1/1
FIELD GOALS/FGA 9/11 8/11 13/16 9/10 7/9 16/17 15/15 10/11
POINTS SCORED 144 135 143 203 182 139 120 164
DEFENSE Phil. Car. Balt. Ariz. Cin. Denv. Chi. G.B.
POINTS ALLOWED 110 94 162 115 122 102 179 101
OPP FIRST DOWNS 123 105 123 102 116 112 117 126
Rushing 23 28 28 34 35 32 36 37
Passing 85 66 78 57 73 63 72 78
Penalty 15 11 17 11 8 17 9 11
OPP YARDS GAINED 2129 1690 2284 1972 2224 1688 2069 2130
Avg per Game 354.8 338.0 380.7 328.7 370.7 281.3 344.8 355.0
OPP RUSHING(net) 565 483 567 627 655 535 749 711
Avg per Game 94.2 96.6 94.5 104.5 109.2 89.2 124.8 118.5
Rushes 160 124 158 153 135 149 166 152
Yards per Rush 3.5 3.9 3.6 4.1 4.9 3.6 4.5 4.7
OPP PASSING(net) 1564 1207 1717 1345 1569 1153 1320 1419
Avg per Game 260.7 241.4 286.2 224.2 261.5 192.2 220.0 236.5
Passes Att. 253 209 222 213 229 221 182 227
Completed 164 124 145 129 157 138 118 129
Pct Completed 64.8 59.3 65.3 60.6 68.6 62.4 64.8 56.8
Sacked 14 13 18 9 17 26 11 23
Yards Lost 99 58 113 42 99 168 71 126
INTERCEPTED BY 8 8 3 11 5 9 3 8
Yards Returned 84 119 49 189 10 247 15 109
Returned for TD 1 2 1 3 0 3 0 1
OPP PUNT RETURNS 17 15 15 6 8 12 15 15
Avg return 5.4 12.8 7.1 11.5 8.8 11.8 8.3 4.0
OPP KICKOFF RET 17 11 3 20 17 10 15 16
Avg return 21.1 24.7 26.0 24.8 21.6 19.5 32.3 22.3
OPP TOUCHDOWNS 11 11 16 11 13 12 21 11
Rushing 1 5 4 2 3 4 2 4
Passing 9 5 11 9 8 5 15 7
Returns 1 1 1 0 2 3 4 0
WEEK 6 / THROUGH MONDAY, OCTOBER 19, 2015
OFFENSE NFL/Avg
GAMES (Won-Lost) ---
FIRST DOWNS 116.8
Rushing 33.0
Passing 71.3
Penalty 12.4
YDS GAINED (tot) 2038.0
Avg per Game 358.3
RUSHING (net) 614.1
Avg per Game 108.0
Rushes 150.1
Yards per Rush 4.1
PASSING (net) 1423.9
Avg per Game 250.4
Passes Att. 205.5
Completed 131.3
Pct Completed 63.9
Yards Gained 1503.6
Sacked 12.8
Yards Lost 79.7
Had intercepted 5.2
Yards Opp Ret 75.5
Opp TDs on Int 0.7
PUNTS 26.0
Avg Yards 45.7
PUNT RETURNS 12.6
Avg Return 9.5
Returned for TD 0.2
KICKOFF RETURNS 10.6
Avg Return 23.4
Returned for TD 0.1
PENALTIES 42.4
Yards Penalized 360.4
FUMBLES BY 7.0
Fumbles Lost 3.5
Opp Fumbles 7.0
Opp Fum Lost 3.5
POSS. TIME (avg) 30:00
TOUCHDOWNS 15.0
Rushing 4.4
Passing 9.2
Returns 1.5
EXTRA POINTS(tot) 95%
Kicks Made/2Pt 44%
FIELD GOALS/FGA 9/11
POINTS SCORED 132.6
DEFENSE NFL/Avg
POINTS ALLOWED 132.6
OPP FIRST DOWNS 116.8
Rushing 33.0
Passing 71.3
Penalty 12.4
OPP YARDS GAINED 2038.0
Avg per Game 358.3
OPP RUSHING(net) 614.1
Avg per Game 108.0
Rushes 150.1
Yards per Rush 4.1
OPP PASSING(net) 1423.9
Avg per Game 250.4
Passes Att. 205.5
Completed 131.3
Pct Completed 63.9
Sacked 12.8
Yards Lost 79.7
INTERCEPTED BY 5.2
Yards Returned 75.5
Returned for TD 0.7
OPP PUNT RETURNS 12.6
Avg return 9.5
OPP KICKOFF RET 10.6
Avg return 23.4
OPP TOUCHDOWNS 15.0
Rushing 4.4
Passing 9.2
Returns 1.5
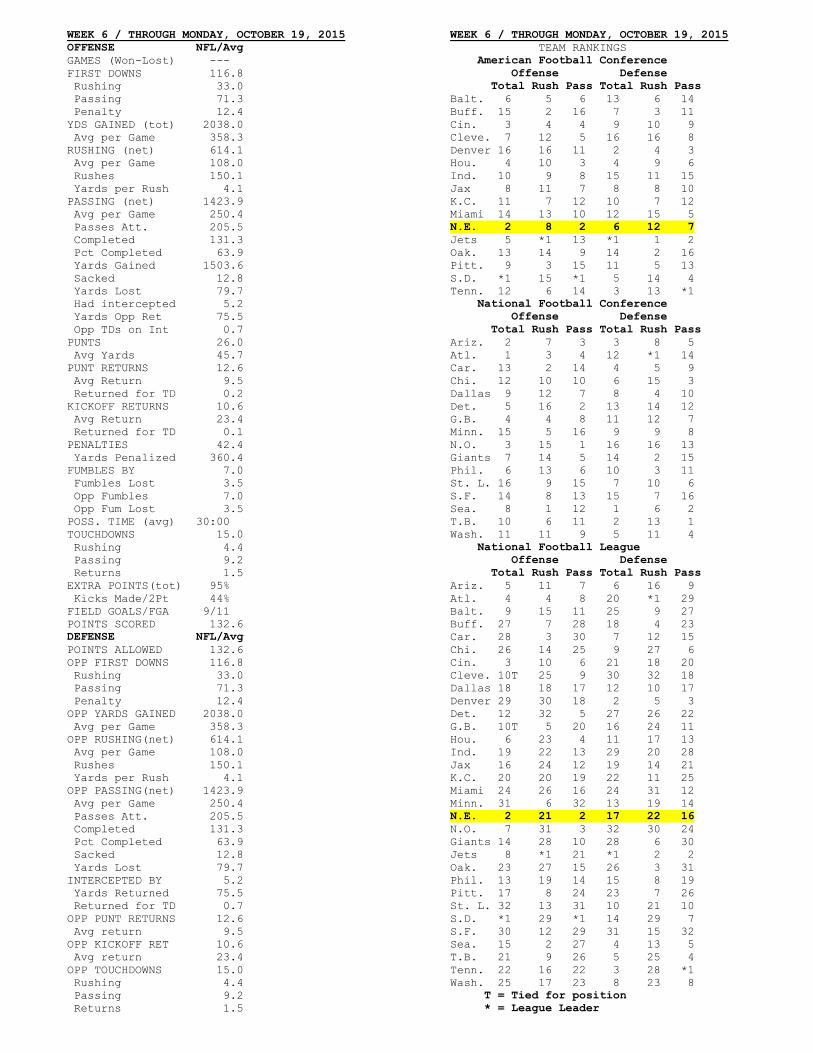
WEEK 6 / THROUGH MONDAY, OCTOBER 19, 2015
TEAM RANKINGS
American Football Conference
Offense Defense
Total Rush Pass Total Rush Pass
Balt. 6 5 6 13 6 14
Buff. 15 2 16 7 3 11
Cin. 3 4 4 9 10 9
Cleve. 7 12 5 16 16 8
Denver 16 16 11 2 4 3
Hou. 4 10 3 4 9 6
Ind. 10 9 8 15 11 15
Jax 8 11 7 8 8 10
K.C. 11 7 12 10 7 12
Miami 14 13 10 12 15 5
N.E. 2 8 2 6 12 7
Jets 5 *1 13 *1 1 2
Oak. 13 14 9 14 2 16
Pitt. 9 3 15 11 5 13
S.D. *1 15 *1 5 14 4
Tenn. 12 6 14 3 13 *1
National Football Conference
Offense Defense
Total Rush Pass Total Rush Pass
Ariz. 2 7 3 3 8 5
Atl. 1 3 4 12 *1 14
Car. 13 2 14 4 5 9
Chi. 12 10 10 6 15 3
Dallas 9 12 7 8 4 10
Det. 5 16 2 13 14 12
G.B. 4 4 8 11 12 7
Minn. 15 5 16 9 9 8
N.O. 3 15 1 16 16 13
Giants 7 14 5 14 2 15
Phil. 6 13 6 10 3 11
St. L. 16 9 15 7 10 6
S.F. 14 8 13 15 7 16
Sea. 8 1 12 1 6 2
T.B. 10 6 11 2 13 1
Wash. 11 11 9 5 11 4
National Football League
Offense Defense
Total Rush Pass Total Rush Pass
Ariz. 5 11 7 6 16 9
Atl. 4 4 8 20 *1 29
Balt. 9 15 11 25 9 27
Buff. 27 7 28 18 4 23
Car. 28 3 30 7 12 15
Chi. 26 14 25 9 27 6
Cin. 3 10 6 21 18 20
Cleve. 10T 25 9 30 32 18
Dallas 18 18 17 12 10 17
Denver 29 30 18 2 5 3
Det. 12 32 5 27 26 22
G.B. 10T 5 20 16 24 11
Hou. 6 23 4 11 17 13
Ind. 19 22 13 29 20 28
Jax 16 24 12 19 14 21
K.C. 20 20 19 22 11 25
Miami 24 26 16 24 31 12
Minn. 31 6 32 13 19 14
N.E. 2 21 2 17 22 16
N.O. 7 31 3 32 30 24
Giants 14 28 10 28 6 30
Jets 8 *1 21 *1 2 2
Oak. 23 27 15 26 3 31
Phil. 13 19 14 15 8 19
Pitt. 17 8 24 23 7 26
St. L. 32 13 31 10 21 10
S.D. *1 29 *1 14 29 7
S.F. 30 12 29 31 15 32
Sea. 15 2 27 4 13 5
T.B. 21 9 26 5 25 4
Tenn. 22 16 22 3 28 *1
Wash. 25 17 23 8 23 8
T = Tied for position
* = League Leader
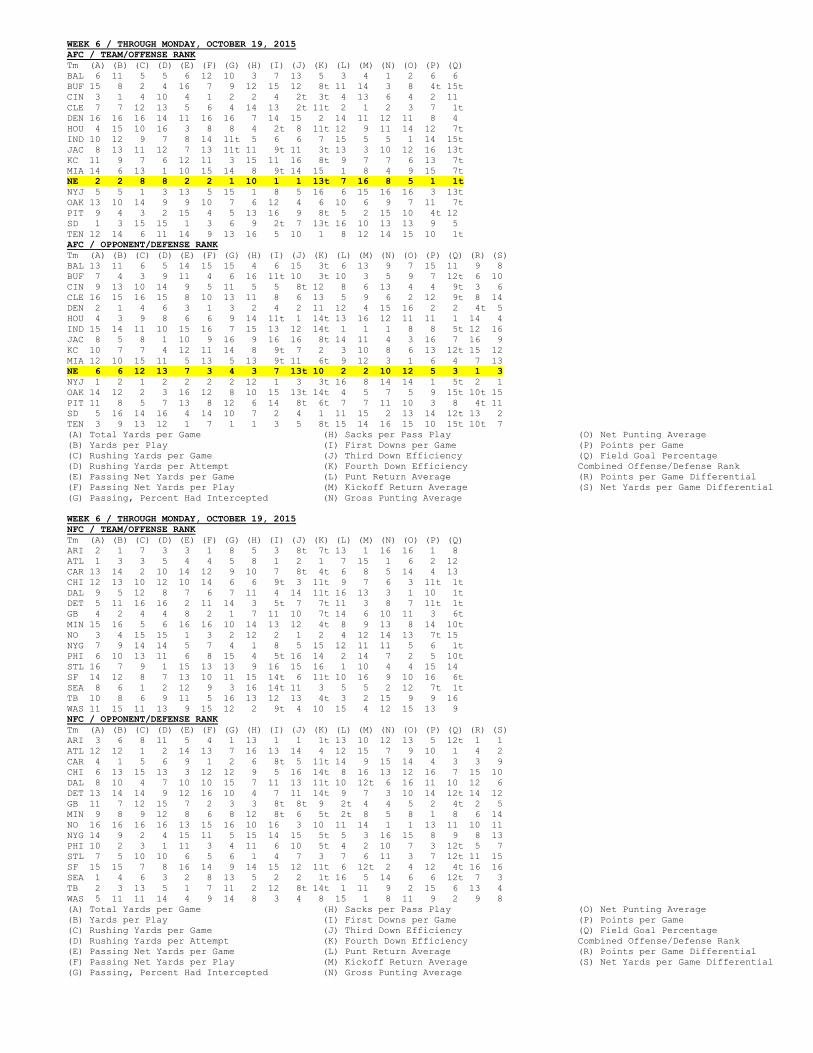
WEEK 6 / THROUGH MONDAY, OCTOBER 19, 2015
AFC / TEAM/OFFENSE RANK
Tm (A) (B) (C) (D) (E) (F) (G) (H) (I) (J) (K) (L) (M) (N) (O) (P) (Q)
BAL 6 11 5 5 6 12 10 3 7 13 5 3 4 1 2 6 6
BUF 15 8 2 4 16 7 9 12 15 12 8t 11 14 3 8 4t 15t
CIN 3 1 4 10 4 1 2 2 4 2t 3t 4 13 6 4 2 11
CLE 7 7 12 13 5 6 4 14 13 2t 11t 2 1 2 3 7 1t
DEN 16 16 16 14 11 16 16 7 14 15 2 14 11 12 11 8 4
HOU 4 15 10 16 3 8 8 4 2t 8 11t 12 9 11 14 12 7t
IND 10 12 9 7 8 14 11t 5 6 6 7 15 5 5 1 14 15t
JAC 8 13 11 12 7 13 11t 11 9t 11 3t 13 3 10 12 16 13t
KC 11 9 7 6 12 11 3 15 11 16 8t 9 7 7 6 13 7t
MIA 14 6 13 1 10 15 14 8 9t 14 15 1 8 4 9 15 7t
NE 2 2 8 8 2 2 1 10 1 1 13t 7 16 8 5 1 1t
NYJ 5 5 1 3 13 5 15 1 8 5 16 6 15 16 16 3 13t
OAK 13 10 14 9 9 10 7 6 12 4 6 10 6 9 7 11 7t
PIT 9 4 3 2 15 4 5 13 16 9 8t 5 2 15 10 4t 12
SD 1 3 15 15 1 3 6 9 2t 7 13t 16 10 13 13 9 5
TEN 12 14 6 11 14 9 13 16 5 10 1 8 12 14 15 10 1t
AFC / OPPONENT/DEFENSE RANK
Tm (A) (B) (C) (D) (E) (F) (G) (H) (I) (J) (K) (L) (M) (N) (O) (P) (Q) (R) (S)
BAL 13 11 6 5 14 15 15 4 6 15 3t 6 13 9 7 15 11 9 8
BUF 7 4 3 9 11 4 6 16 11t 10 3t 10 3 5 9 7 12t 6 10
CIN 9 13 10 14 9 5 11 5 5 8t 12 8 6 13 4 4 9t 3 6
CLE 16 15 16 15 8 10 13 11 8 6 13 5 9 6 2 12 9t 8 14
DEN 2 1 4 6 3 1 3 2 4 2 11 12 4 15 16 2 2 4t 5
HOU 4 3 9 8 6 6 9 14 11t 1 14t 13 16 12 11 11 1 14 4
IND 15 14 11 10 15 16 7 15 13 12 14t 1 1 1 8 8 5t 12 16
JAC 8 5 8 1 10 9 16 9 16 16 8t 14 11 4 3 16 7 16 9
KC 10 7 7 4 12 11 14 8 9t 7 2 3 10 8 6 13 12t 15 12
MIA 12 10 15 11 5 13 5 13 9t 11 6t 9 12 3 1 6 4 7 13
NE 6 6 12 13 7 3 4 3 7 13t 10 2 2 10 12 5 3 1 3
NYJ 1 2 1 2 2 2 2 12 1 3 3t 16 8 14 14 1 5t 2 1
OAK 14 12 2 3 16 12 8 10 15 13t 14t 4 5 7 5 9 15t 10t 15
PIT 11 8 5 7 13 8 12 6 14 8t 6t 7 7 11 10 3 8 4t 11
SD 5 16 14 16 4 14 10 7 2 4 1 11 15 2 13 14 12t 13 2
TEN 3 9 13 12 1 7 1 1 3 5 8t 15 14 16 15 10 15t 10t 7
(A) Total Yards per Game
(B) Yards per Play
(C) Rushing Yards per Game
(D) Rushing Yards per Attempt
(E) Passing Net Yards per Game
(F) Passing Net Yards per Play
(G) Passing, Percent Had Intercepted
(H) Sacks per Pass Play
(I) First Downs per Game
(J) Third Down Efficiency
(K) Fourth Down Efficiency
(L) Punt Return Average
(M) Kickoff Return Average
(N) Gross Punting Average
(O) Net Punting Average
(P) Points per Game
(Q) Field Goal Percentage
Combined Offense/Defense Rank
(R) Points per Game Differential
(S) Net Yards per Game Differential
WEEK 6 / THROUGH MONDAY, OCTOBER 19, 2015
NFC / TEAM/OFFENSE RANK
Tm (A) (B) (C) (D) (E) (F) (G) (H) (I) (J) (K) (L) (M) (N) (O) (P) (Q)
ARI 2 1 7 3 3 1 8 5 3 8t 7t 13 1 16 16 1 8
ATL 1 3 3 5 4 4 5 8 1 2 1 7 15 1 6 2 12
CAR 13 14 2 10 14 12 9 10 7 8t 4t 6 8 5 14 4 13
CHI 12 13 10 12 10 14 6 6 9t 3 11t 9 7 6 3 11t 1t
DAL 9 5 12 8 7 6 7 11 4 14 11t 16 13 3 1 10 1t
DET 5 11 16 16 2 11 14 3 5t 7 7t 11 3 8 7 11t 1t
GB 4 2 4 4 8 2 1 7 11 10 7t 14 6 10 11 3 6t
MIN 15 16 5 6 16 16 10 14 13 12 4t 8 9 13 8 14 10t
NO 3 4 15 15 1 3 2 12 2 1 2 4 12 14 13 7t 15
NYG 7 9 14 14 5 7 4 1 8 5 15 12 11 11 5 6 1t
PHI 6 10 13 11 6 8 15 4 5t 16 14 2 14 7 2 5 10t
STL 16 7 9 1 15 13 13 9 16 15 16 1 10 4 4 15 14
SF 14 12 8 7 13 10 11 15 14t 6 11t 10 16 9 10 16 6t
SEA 8 6 1 2 12 9 3 16 14t 11 3 5 5 2 12 7t 1t
TB 10 8 6 9 11 5 16 13 12 13 4t 3 2 15 9 9 16
WAS 11 15 11 13 9 15 12 2 9t 4 10 15 4 12 15 13 9
NFC / OPPONENT/DEFENSE RANK
Tm (A) (B) (C) (D) (E) (F) (G) (H) (I) (J) (K) (L) (M) (N) (O) (P) (Q) (R) (S)
ARI 3 6 8 11 5 4 1 13 1 1 1t 13 10 12 13 5 12t 1 1
ATL 12 12 1 2 14 13 7 16 13 14 4 12 15 7 9 10 1 4 2
CAR 4 1 5 6 9 1 2 6 8t 5 11t 14 9 15 14 4 3 3 9
CHI 6 13 15 13 3 12 12 9 5 16 14t 8 16 13 12 16 7 15 10
DAL 8 10 4 7 10 10 15 7 11 13 11t 10 12t 6 16 11 10 12 6
DET 13 14 14 9 12 16 10 4 7 11 14t 9 7 3 10 14 12t 14 12
GB 11 7 12 15 7 2 3 3 8t 8t 9 2t 4 4 5 2 4t 2 5
MIN 9 8 9 12 8 6 8 12 8t 6 5t 2t 8 5 8 1 8 6 14
NO 16 16 16 16 13 15 16 10 16 3 10 11 14 1 1 13 11 10 11
NYG 14 9 2 4 15 11 5 15 14 15 5t 5 3 16 15 8 9 8 13
PHI 10 2 3 1 11 3 4 11 6 10 5t 4 2 10 7 3 12t 5 7
STL 7 5 10 10 6 5 6 1 4 7 3 7 6 11 3 7 12t 11 15
SF 15 15 7 8 16 14 9 14 15 12 11t 6 12t 2 4 12 4t 16 16
SEA 1 4 6 3 2 8 13 5 2 2 1t 16 5 14 6 6 12t 7 3
TB 2 3 13 5 1 7 11 2 12 8t 14t 1 11 9 2 15 6 13 4
WAS 5 11 11 14 4 9 14 8 3 4 8 15 1 8 11 9 2 9 8
(A) Total Yards per Game
(B) Yards per Play
(C) Rushing Yards per Game
(D) Rushing Yards per Attempt
(E) Passing Net Yards per Game
(F) Passing Net Yards per Play
(G) Passing, Percent Had Intercepted
(H) Sacks per Pass Play
(I) First Downs per Game
(J) Third Down Efficiency
(K) Fourth Down Efficiency
(L) Punt Return Average
(M) Kickoff Return Average
(N) Gross Punting Average
(O) Net Punting Average
(P) Points per Game
(Q) Field Goal Percentage
Combined Offense/Defense Rank
(R) Points per Game Differential
(S) Net Yards per Game Differential
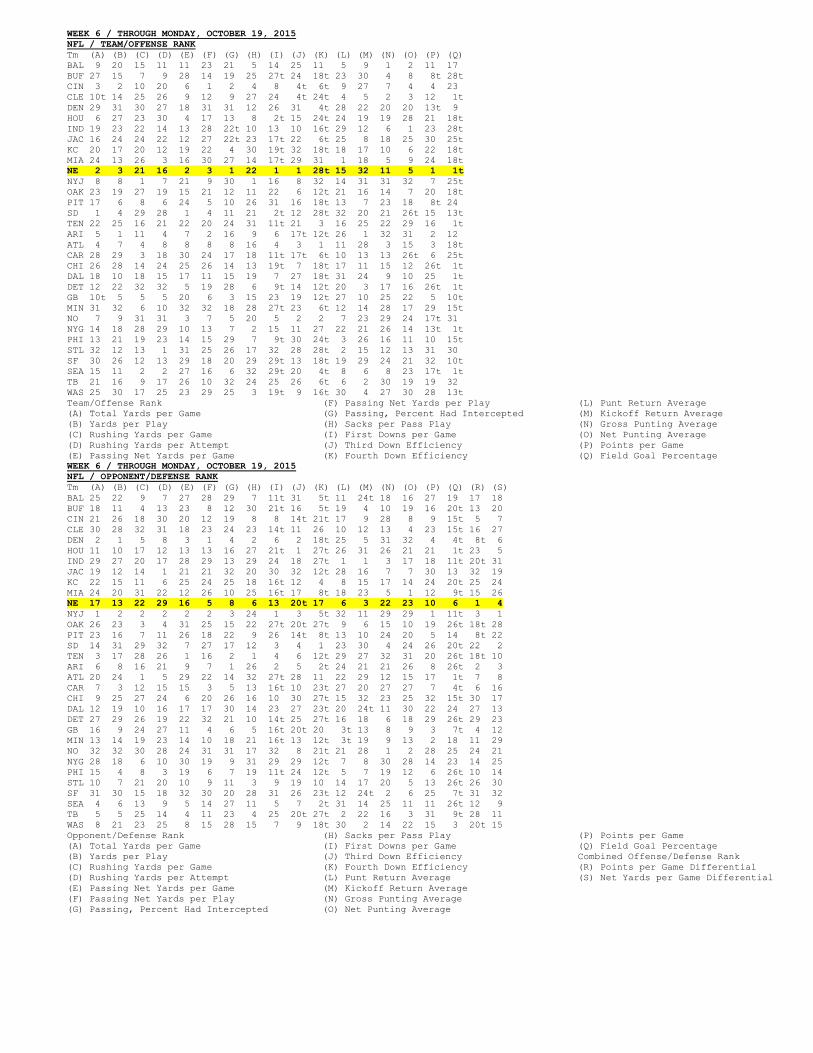
WEEK 6 / THROUGH MONDAY, OCTOBER 19, 2015
NFL / TEAM/OFFENSE RANK
Tm (A) (B) (C) (D) (E) (F) (G) (H) (I) (J) (K) (L) (M) (N) (O) (P) (Q)
BAL 9 20 15 11 11 23 21 5 14 25 11 5 9 1 2 11 17
BUF 27 15 7 9 28 14 19 25 27t 24 18t 23 30 4 8 8t 28t
CIN 3 2 10 20 6 1 2 4 8 4t 6t 9 27 7 4 4 23
CLE 10t 14 25 26 9 12 9 27 24 4t 24t 4 5 2 3 12 1t
DEN 29 31 30 27 18 31 31 12 26 31 4t 28 22 20 20 13t 9
HOU 6 27 23 30 4 17 13 8 2t 15 24t 24 19 19 28 21 18t
IND 19 23 22 14 13 28 22t 10 13 10 16t 29 12 6 1 23 28t
JAC 16 24 24 22 12 27 22t 23 17t 22 6t 25 8 18 25 30 25t
KC 20 17 20 12 19 22 4 30 19t 32 18t 18 17 10 6 22 18t
MIA 24 13 26 3 16 30 27 14 17t 29 31 1 18 5 9 24 18t
NE 2 3 21 16 2 3 1 22 1 1 28t 15 32 11 5 1 1t
NYJ 8 8 1 7 21 9 30 1 16 8 32 14 31 31 32 7 25t
OAK 23 19 27 19 15 21 12 11 22 6 12t 21 16 14 7 20 18t
PIT 17 6 8 6 24 5 10 26 31 16 18t 13 7 23 18 8t 24
SD 1 4 29 28 1 4 11 21 2t 12 28t 32 20 21 26t 15 13t
TEN 22 25 16 21 22 20 24 31 11t 21 3 16 25 22 29 16 1t
ARI 5 1 11 4 7 2 16 9 6 17t 12t 26 1 32 31 2 12
ATL 4 7 4 8 8 8 8 16 4 3 1 11 28 3 15 3 18t
CAR 28 29 3 18 30 24 17 18 11t 17t 6t 10 13 13 26t 6 25t
CHI 26 28 14 24 25 26 14 13 19t 7 18t 17 11 15 12 26t 1t
DAL 18 10 18 15 17 11 15 19 7 27 18t 31 24 9 10 25 1t
DET 12 22 32 32 5 19 28 6 9t 14 12t 20 3 17 16 26t 1t
GB 10t 5 5 5 20 6 3 15 23 19 12t 27 10 25 22 5 10t
MIN 31 32 6 10 32 32 18 28 27t 23 6t 12 14 28 17 29 15t
NO 7 9 31 31 3 7 5 20 5 2 2 7 23 29 24 17t 31
NYG 14 18 28 29 10 13 7 2 15 11 27 22 21 26 14 13t 1t
PHI 13 21 19 23 14 15 29 7 9t 30 24t 3 26 16 11 10 15t
STL 32 12 13 1 31 25 26 17 32 28 28t 2 15 12 13 31 30
SF 30 26 12 13 29 18 20 29 29t 13 18t 19 29 24 21 32 10t
SEA 15 11 2 2 27 16 6 32 29t 20 4t 8 6 8 23 17t 1t
TB 21 16 9 17 26 10 32 24 25 26 6t 6 2 30 19 19 32
WAS 25 30 17 25 23 29 25 3 19t 9 16t 30 4 27 30 28 13t
Team/Offense Rank
(A) Total Yards per Game
(B) Yards per Play
(C) Rushing Yards per Game
(D) Rushing Yards per Attempt
(E) Passing Net Yards per Game
(F) Passing Net Yards per Play
(G) Passing, Percent Had Intercepted
(H) Sacks per Pass Play
(I) First Downs per Game
(J) Third Down Efficiency
(K) Fourth Down Efficiency
(L) Punt Return Average
(M) Kickoff Return Average
(N) Gross Punting Average
(O) Net Punting Average
(P) Points per Game
(Q) Field Goal Percentage
WEEK 6 / THROUGH MONDAY, OCTOBER 19, 2015
NFL / OPPONENT/DEFENSE RANK
Tm (A) (B) (C) (D) (E) (F) (G) (H) (I) (J) (K) (L) (M) (N) (O) (P) (Q) (R) (S)
BAL 25 22 9 7 27 28 29 7 11t 31 5t 11 24t 18 16 27 19 17 18
BUF 18 11 4 13 23 8 12 30 21t 16 5t 19 4 10 19 16 20t 13 20
CIN 21 26 18 30 20 12 19 8 8 14t 21t 17 9 28 8 9 15t 5 7
CLE 30 28 32 31 18 23 24 23 14t 11 26 10 12 13 4 23 15t 16 27
DEN 2 1 5 8 3 1 4 2 6 2 18t 25 5 31 32 4 4t 8t 6
HOU 11 10 17 12 13 13 16 27 21t 1 27t 26 31 26 21 21 1t 23 5
IND 29 27 20 17 28 29 13 29 24 18 27t 1 1 3 17 18 11t 20t 31
JAC 19 12 14 1 21 21 32 20 30 32 12t 28 16 7 7 30 13 32 19
KC 22 15 11 6 25 24 25 18 16t 12 4 8 15 17 14 24 20t 25 24
MIA 24 20 31 22 12 26 10 25 16t 17 8t 18 23 5 1 12 9t 15 26
NE 17 13 22 29 16 5 8 6 13 20t 17 6 3 22 23 10 6 1 4
NYJ 1 2 2 2 2 2 3 24 1 3 5t 32 11 29 29 1 11t 3 1
OAK 26 23 3 4 31 25 15 22 27t 20t 27t 9 6 15 10 19 26t 18t 28
PIT 23 16 7 11 26 18 22 9 26 14t 8t 13 10 24 20 5 14 8t 22
SD 14 31 29 32 7 27 17 12 3 4 1 23 30 4 24 26 20t 22 2
TEN 3 17 28 26 1 16 2 1 4 6 12t 29 27 32 31 20 26t 18t 10
ARI 6 8 16 21 9 7 1 26 2 5 2t 24 21 21 26 8 26t 2 3
ATL 20 24 1 5 29 22 14 32 27t 28 11 22 29 12 15 17 1t 7 8
CAR 7 3 12 15 15 3 5 13 16t 10 23t 27 20 27 27 7 4t 6 16
CHI 9 25 27 24 6 20 26 16 10 30 27t 15 32 23 25 32 15t 30 17
DAL 12 19 10 16 17 17 30 14 23 27 23t 20 24t 11 30 22 24 27 13
DET 27 29 26 19 22 32 21 10 14t 25 27t 16 18 6 18 29 26t 29 23
GB 16 9 24 27 11 4 6 5 16t 20t 20 3t 13 8 9 3 7t 4 12
MIN 13 14 19 23 14 10 18 21 16t 13 12t 3t 19 9 13 2 18 11 29
NO 32 32 30 28 24 31 31 17 32 8 21t 21 28 1 2 28 25 24 21
NYG 28 18 6 10 30 19 9 31 29 29 12t 7 8 30 28 14 23 14 25
PHI 15 4 8 3 19 6 7 19 11t 24 12t 5 7 19 12 6 26t 10 14
STL 10 7 21 20 10 9 11 3 9 19 10 14 17 20 5 13 26t 26 30
SF 31 30 15 18 32 30 20 28 31 26 23t 12 24t 2 6 25 7t 31 32
SEA 4 6 13 9 5 14 27 11 5 7 2t 31 14 25 11 11 26t 12 9
TB 5 5 25 14 4 11 23 4 25 20t 27t 2 22 16 3 31 9t 28 11
WAS 8 21 23 25 8 15 28 15 7 9 18t 30 2 14 22 15 3 20t 15
Opponent/Defense Rank
(A) Total Yards per Game
(B) Yards per Play
(C) Rushing Yards per Game
(D) Rushing Yards per Attempt
(E) Passing Net Yards per Game
(F) Passing Net Yards per Play
(G) Passing, Percent Had Intercepted
(H) Sacks per Pass Play
(I) First Downs per Game
(J) Third Down Efficiency
(K) Fourth Down Efficiency
(L) Punt Return Average
(M) Kickoff Return Average
(N) Gross Punting Average
(O) Net Punting Average
(P) Points per Game
(Q) Field Goal Percentage
Combined Offense/Defense Rank
(R) Points per Game Differential
(S) Net Yards per Game Differential
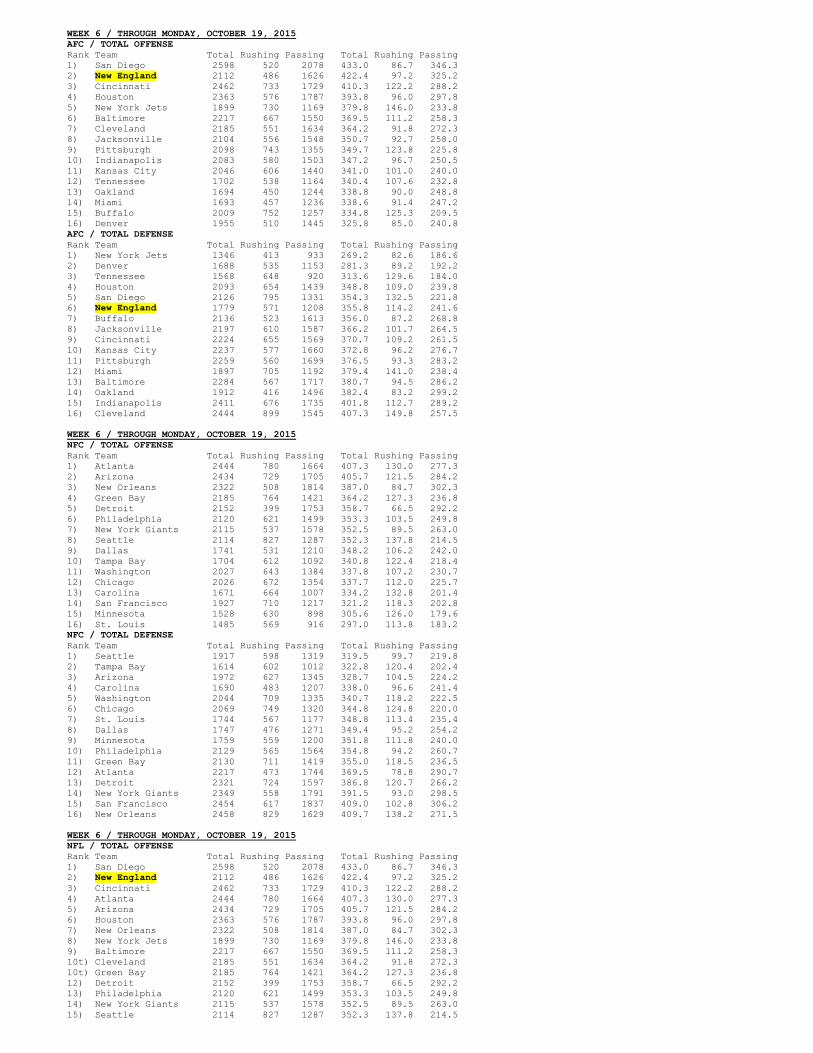
WEEK 6 / THROUGH MONDAY, OCTOBER 19, 2015
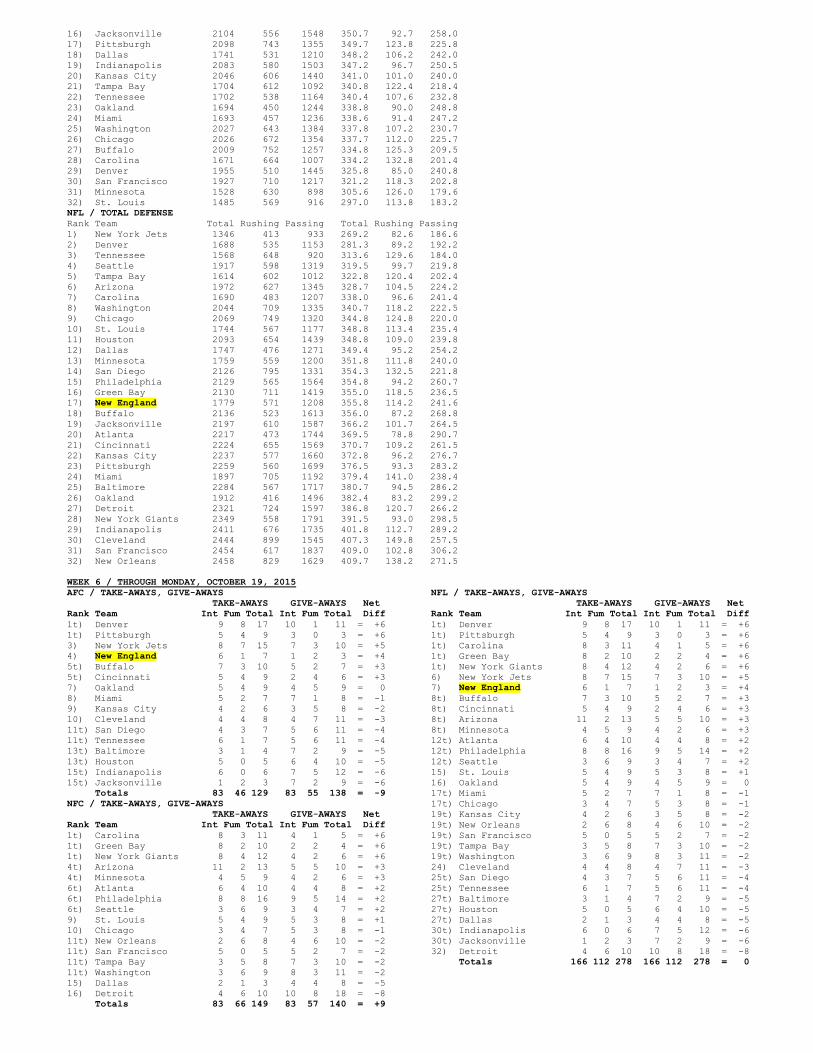
AFC / TOTAL OFFENSE
Rank Team Total Rushing Passing Total Rushing Passing
1) San Diego 2598 520 2078 433.0 86.7 346.3
2) New England 2112 486 1626 422.4 97.2 325.2
3) Cincinnati 2462 733 1729 410.3 122.2 288.2
4) Houston 2363 576 1787 393.8 96.0 297.8
5) New York Jets 1899 730 1169 379.8 146.0 233.8
6) Baltimore 2217 667 1550 369.5 111.2 258.3
7) Cleveland 2185 551 1634 364.2 91.8 272.3
8) Jacksonville 2104 556 1548 350.7 92.7 258.0
9) Pittsburgh 2098 743 1355 349.7 123.8 225.8
10) Indianapolis 2083 580 1503 347.2 96.7 250.5
11) Kansas City 2046 606 1440 341.0 101.0 240.0
12) Tennessee 1702 538 1164 340.4 107.6 232.8
13) Oakland 1694 450 1244 338.8 90.0 248.8
14) Miami 1693 457 1236 338.6 91.4 247.2
15) Buffalo 2009 752 1257 334.8 125.3 209.5
16) Denver 1955 510 1445 325.8 85.0 240.8
AFC / TOTAL DEFENSE
Rank Team Total Rushing Passing Total Rushing Passing
1) New York Jets 1346 413 933 269.2 82.6 186.6
2) Denver 1688 535 1153 281.3 89.2 192.2
3) Tennessee 1568 648 920 313.6 129.6 184.0
4) Houston 2093 654 1439 348.8 109.0 239.8
5) San Diego 2126 795 1331 354.3 132.5 221.8
6) New England 1779 571 1208 355.8 114.2 241.6
7) Buffalo 2136 523 1613 356.0 87.2 268.8
8) Jacksonville 2197 610 1587 366.2 101.7 264.5
9) Cincinnati 2224 655 1569 370.7 109.2 261.5
10) Kansas City 2237 577 1660 372.8 96.2 276.7
11) Pittsburgh 2259 560 1699 376.5 93.3 283.2
12) Miami 1897 705 1192 379.4 141.0 238.4
13) Baltimore 2284 567 1717 380.7 94.5 286.2
14) Oakland 1912 416 1496 382.4 83.2 299.2
15) Indianapolis 2411 676 1735 401.8 112.7 289.2
16) Cleveland 2444 899 1545 407.3 149.8 257.5
WEEK 6 / THROUGH MONDAY, OCTOBER 19, 2015
NFC / TOTAL OFFENSE
Rank Team Total Rushing Passing Total Rushing Passing
1) Atlanta 2444 780 1664 407.3 130.0 277.3
2) Arizona 2434 729 1705 405.7 121.5 284.2
3) New Orleans 2322 508 1814 387.0 84.7 302.3
4) Green Bay 2185 764 1421 364.2 127.3 236.8
5) Detroit 2152 399 1753 358.7 66.5 292.2
6) Philadelphia 2120 621 1499 353.3 103.5 249.8
7) New York Giants 2115 537 1578 352.5 89.5 263.0
8) Seattle 2114 827 1287 352.3 137.8 214.5
9) Dallas 1741 531 1210 348.2 106.2 242.0
10) Tampa Bay 1704 612 1092 340.8 122.4 218.4
11) Washington 2027 643 1384 337.8 107.2 230.7
12) Chicago 2026 672 1354 337.7 112.0 225.7
13) Carolina 1671 664 1007 334.2 132.8 201.4
14) San Francisco 1927 710 1217 321.2 118.3 202.8
15) Minnesota 1528 630 898 305.6 126.0 179.6
16) St. Louis 1485 569 916 297.0 113.8 183.2
NFC / TOTAL DEFENSE
Rank Team Total Rushing Passing Total Rushing Passing
1) Seattle 1917 598 1319 319.5 99.7 219.8
2) Tampa Bay 1614 602 1012 322.8 120.4 202.4
3) Arizona 1972 627 1345 328.7 104.5 224.2
4) Carolina 1690 483 1207 338.0 96.6 241.4
5) Washington 2044 709 1335 340.7 118.2 222.5
6) Chicago 2069 749 1320 344.8 124.8 220.0
7) St. Louis 1744 567 1177 348.8 113.4 235.4
8) Dallas 1747 476 1271 349.4 95.2 254.2
9) Minnesota 1759 559 1200 351.8 111.8 240.0
10) Philadelphia 2129 565 1564 354.8 94.2 260.7
11) Green Bay 2130 711 1419 355.0 118.5 236.5
12) Atlanta 2217 473 1744 369.5 78.8 290.7
13) Detroit 2321 724 1597 386.8 120.7 266.2
14) New York Giants 2349 558 1791 391.5 93.0 298.5
15) San Francisco 2454 617 1837 409.0 102.8 306.2
16) New Orleans 2458 829 1629 409.7 138.2 271.5
WEEK 6 / THROUGH MONDAY, OCTOBER 19, 2015
NFL / TOTAL OFFENSE
Rank Team Total Rushing Passing Total Rushing Passing
1) San Diego 2598 520 2078 433.0 86.7 346.3
2) New England 2112 486 1626 422.4 97.2 325.2
3) Cincinnati 2462 733 1729 410.3 122.2 288.2
4) Atlanta 2444 780 1664 407.3 130.0 277.3
5) Arizona 2434 729 1705 405.7 121.5 284.2
6) Houston 2363 576 1787 393.8 96.0 297.8
7) New Orleans 2322 508 1814 387.0 84.7 302.3
8) New York Jets 1899 730 1169 379.8 146.0 233.8
9) Baltimore 2217 667 1550 369.5 111.2 258.3
10t) Cleveland 2185 551 1634 364.2 91.8 272.3
10t) Green Bay 2185 764 1421 364.2 127.3 236.8
12) Detroit 2152 399 1753 358.7 66.5 292.2
13) Philadelphia 2120 621 1499 353.3 103.5 249.8
14) New York Giants 2115 537 1578 352.5 89.5 263.0
15) Seattle 2114 827 1287 352.3 137.8 214.5
16) Jacksonville 2104 556 1548 350.7 92.7 258.0
17) Pittsburgh 2098 743 1355 349.7 123.8 225.8
18) Dallas 1741 531 1210 348.2 106.2 242.0
19) Indianapolis 2083 580 1503 347.2 96.7 250.5
20) Kansas City 2046 606 1440 341.0 101.0 240.0
21) Tampa Bay 1704 612 1092 340.8 122.4 218.4
22) Tennessee 1702 538 1164 340.4 107.6 232.8
23) Oakland 1694 450 1244 338.8 90.0 248.8
24) Miami 1693 457 1236 338.6 91.4 247.2
25) Washington 2027 643 1384 337.8 107.2 230.7
26) Chicago 2026 672 1354 337.7 112.0 225.7
27) Buffalo 2009 752 1257 334.8 125.3 209.5
28) Carolina 1671 664 1007 334.2 132.8 201.4
29) Denver 1955 510 1445 325.8 85.0 240.8
30) San Francisco 1927 710 1217 321.2 118.3 202.8
31) Minnesota 1528 630 898 305.6 126.0 179.6
32) St. Louis 1485 569 916 297.0 113.8 183.2
NFL / TOTAL DEFENSE
Rank Team Total Rushing Passing Total Rushing Passing
1) New York Jets 1346 413 933 269.2 82.6 186.6
2) Denver 1688 535 1153 281.3 89.2 192.2
3) Tennessee 1568 648 920 313.6 129.6 184.0
4) Seattle 1917 598 1319 319.5 99.7 219.8
5) Tampa Bay 1614 602 1012 322.8 120.4 202.4
6) Arizona 1972 627 1345 328.7 104.5 224.2
7) Carolina 1690 483 1207 338.0 96.6 241.4
8) Washington 2044 709 1335 340.7 118.2 222.5
9) Chicago 2069 749 1320 344.8 124.8 220.0
10) St. Louis 1744 567 1177 348.8 113.4 235.4
11) Houston 2093 654 1439 348.8 109.0 239.8
12) Dallas 1747 476 1271 349.4 95.2 254.2
13) Minnesota 1759 559 1200 351.8 111.8 240.0
14) San Diego 2126 795 1331 354.3 132.5 221.8
15) Philadelphia 2129 565 1564 354.8 94.2 260.7
16) Green Bay 2130 711 1419 355.0 118.5 236.5
17) New England 1779 571 1208 355.8 114.2 241.6
18) Buffalo 2136 523 1613 356.0 87.2 268.8
19) Jacksonville 2197 610 1587 366.2 101.7 264.5
20) Atlanta 2217 473 1744 369.5 78.8 290.7
21) Cincinnati 2224 655 1569 370.7 109.2 261.5
22) Kansas City 2237 577 1660 372.8 96.2 276.7
23) Pittsburgh 2259 560 1699 376.5 93.3 283.2
24) Miami 1897 705 1192 379.4 141.0 238.4
25) Baltimore 2284 567 1717 380.7 94.5 286.2
26) Oakland 1912 416 1496 382.4 83.2 299.2
27) Detroit 2321 724 1597 386.8 120.7 266.2
28) New York Giants 2349 558 1791 391.5 93.0 298.5
29) Indianapolis 2411 676 1735 401.8 112.7 289.2
30) Cleveland 2444 899 1545 407.3 149.8 257.5
31) San Francisco 2454 617 1837 409.0 102.8 306.2
32) New Orleans 2458 829 1629 409.7 138.2 271.5
WEEK 6 / THROUGH MONDAY, OCTOBER 19, 2015
AFC / TAKE-AWAYS, GIVE-AWAYS
TAKE-AWAYS GIVE-AWAYS Net
Rank Team Int Fum Total Int Fum Total Diff
1t) Denver 9 8 17 10 1 11 = +6
1t) Pittsburgh 5 4 9 3 0 3 = +6
3) New York Jets 8 7 15 7 3 10 = +5
4) New England 6 1 7 1 2 3 = +4
5t) Buffalo 7 3 10 5 2 7 = +3
5t) Cincinnati 5 4 9 2 4 6 = +3
7) Oakland 5 4 9 4 5 9 = 0
8) Miami 5 2 7 7 1 8 = -1
9) Kansas City 4 2 6 3 5 8 = -2
10) Cleveland 4 4 8 4 7 11 = -3
11t) San Diego 4 3 7 5 6 11 = -4
11t) Tennessee 6 1 7 5 6 11 = -4
13t) Baltimore 3 1 4 7 2 9 = -5
13t) Houston 5 0 5 6 4 10 = -5
15t) Indianapolis 6 0 6 7 5 12 = -6
15t) Jacksonville 1 2 3 7 2 9 = -6
Totals 83 46 129 83 55 138 = -9
NFC / TAKE-AWAYS, GIVE-AWAYS
TAKE-AWAYS GIVE-AWAYS Net
Rank Team Int Fum Total Int Fum Total Diff
1t) Carolina 8 3 11 4 1 5 = +6
1t) Green Bay 8 2 10 2 2 4 = +6
1t) New York Giants 8 4 12 4 2 6 = +6
4t) Arizona 11 2 13 5 5 10 = +3
4t) Minnesota 4 5 9 4 2 6 = +3
6t) Atlanta 6 4 10 4 4 8 = +2
6t) Philadelphia 8 8 16 9 5 14 = +2
6t) Seattle 3 6 9 3 4 7 = +2
9) St. Louis 5 4 9 5 3 8 = +1
10) Chicago 3 4 7 5 3 8 = -1
11t) New Orleans 2 6 8 4 6 10 = -2
11t) San Francisco 5 0 5 5 2 7 = -2
11t) Tampa Bay 3 5 8 7 3 10 = -2
11t) Washington 3 6 9 8 3 11 = -2
15) Dallas 2 1 3 4 4 8 = -5
16) Detroit 4 6 10 10 8 18 = -8
Totals 83 66 149 83 57 140 = +9
NFL / TAKE-AWAYS, GIVE-AWAYS
TAKE-AWAYS GIVE-AWAYS Net
Rank Team Int Fum Total Int Fum Total Diff
1t) Denver 9 8 17 10 1 11 = +6
1t) Pittsburgh 5 4 9 3 0 3 = +6
1t) Carolina 8 3 11 4 1 5 = +6
1t) Green Bay 8 2 10 2 2 4 = +6
1t) New York Giants 8 4 12 4 2 6 = +6
6) New York Jets 8 7 15 7 3 10 = +5
7) New England 6 1 7 1 2 3 = +4
8t) Buffalo 7 3 10 5 2 7 = +3
8t) Cincinnati 5 4 9 2 4 6 = +3
8t) Arizona 11 2 13 5 5 10 = +3
8t) Minnesota 4 5 9 4 2 6 = +3
12t) Atlanta 6 4 10 4 4 8 = +2
12t) Philadelphia 8 8 16 9 5 14 = +2
12t) Seattle 3 6 9 3 4 7 = +2
15) St. Louis 5 4 9 5 3 8 = +1
16) Oakland 5 4 9 4 5 9 = 0
17t) Miami 5 2 7 7 1 8 = -1
17t) Chicago 3 4 7 5 3 8 = -1
19t) Kansas City 4 2 6 3 5 8 = -2
19t) New Orleans 2 6 8 4 6 10 = -2
19t) San Francisco 5 0 5 5 2 7 = -2
19t) Tampa Bay 3 5 8 7 3 10 = -2
19t) Washington 3 6 9 8 3 11 = -2
24) Cleveland 4 4 8 4 7 11 = -3
25t) San Diego 4 3 7 5 6 11 = -4
25t) Tennessee 6 1 7 5 6 11 = -4
27t) Baltimore 3 1 4 7 2 9 = -5
27t) Houston 5 0 5 6 4 10 = -5
27t) Dallas 2 1 3 4 4 8 = -5
30t) Indianapolis 6 0 6 7 5 12 = -6
30t) Jacksonville 1 2 3 7 2 9 = -6
32) Detroit 4 6 10 10 8 18 = -8
Totals 166 112 278 166 112 278 = 0
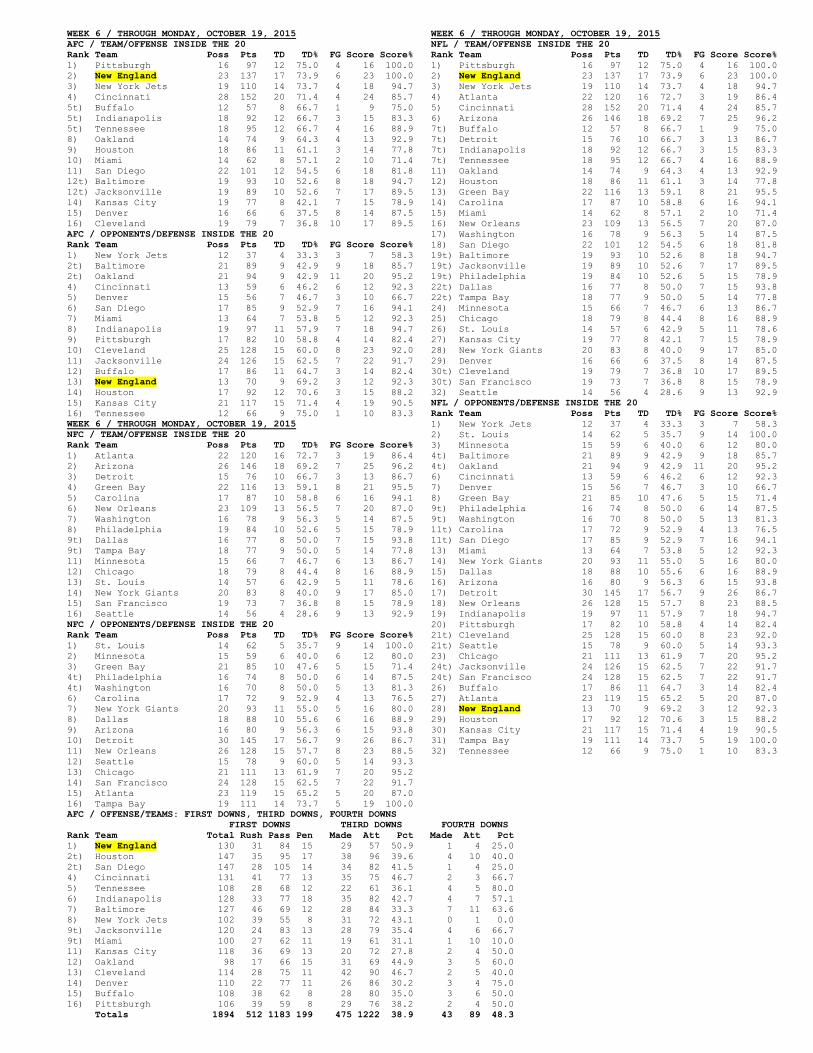
WEEK 6 / THROUGH MONDAY, OCTOBER 19, 2015
AFC / TEAM/OFFENSE INSIDE THE 20
Rank Team Poss Pts TD TD% FG Score Score%
1) Pittsburgh 16 97 12 75.0 4 16 100.0
2) New England 23 137 17 73.9 6 23 100.0
3) New York Jets 19 110 14 73.7 4 18 94.7
4) Cincinnati 28 152 20 71.4 4 24 85.7
5t) Buffalo 12 57 8 66.7 1 9 75.0
5t) Indianapolis 18 92 12 66.7 3 15 83.3
5t) Tennessee 18 95 12 66.7 4 16 88.9
8) Oakland 14 74 9 64.3 4 13 92.9
9) Houston 18 86 11 61.1 3 14 77.8
10) Miami 14 62 8 57.1 2 10 71.4
11) San Diego 22 101 12 54.5 6 18 81.8
12t) Baltimore 19 93 10 52.6 8 18 94.7
12t) Jacksonville 19 89 10 52.6 7 17 89.5
14) Kansas City 19 77 8 42.1 7 15 78.9
15) Denver 16 66 6 37.5 8 14 87.5
16) Cleveland 19 79 7 36.8 10 17 89.5
AFC / OPPONENTS/DEFENSE INSIDE THE 20
Rank Team Poss Pts TD TD% FG Score Score%
1) New York Jets 12 37 4 33.3 3 7 58.3
2t) Baltimore 21 89 9 42.9 9 18 85.7
2t) Oakland 21 94 9 42.9 11 20 95.2
4) Cincinnati 13 59 6 46.2 6 12 92.3
5) Denver 15 56 7 46.7 3 10 66.7
6) San Diego 17 85 9 52.9 7 16 94.1
7) Miami 13 64 7 53.8 5 12 92.3
8) Indianapolis 19 97 11 57.9 7 18 94.7
9) Pittsburgh 17 82 10 58.8 4 14 82.4
10) Cleveland 25 128 15 60.0 8 23 92.0
11) Jacksonville 24 126 15 62.5 7 22 91.7
12) Buffalo 17 86 11 64.7 3 14 82.4
13) New England 13 70 9 69.2 3 12 92.3
14) Houston 17 92 12 70.6 3 15 88.2
15) Kansas City 21 117 15 71.4 4 19 90.5
16) Tennessee 12 66 9 75.0 1 10 83.3
WEEK 6 / THROUGH MONDAY, OCTOBER 19, 2015
NFC / TEAM/OFFENSE INSIDE THE 20
Rank Team Poss Pts TD TD% FG Score Score%
1) Atlanta 22 120 16 72.7 3 19 86.4
2) Arizona 26 146 18 69.2 7 25 96.2
3) Detroit 15 76 10 66.7 3 13 86.7
4) Green Bay 22 116 13 59.1 8 21 95.5
5) Carolina 17 87 10 58.8 6 16 94.1
6) New Orleans 23 109 13 56.5 7 20 87.0
7) Washington 16 78 9 56.3 5 14 87.5
8) Philadelphia 19 84 10 52.6 5 15 78.9
9t) Dallas 16 77 8 50.0 7 15 93.8
9t) Tampa Bay 18 77 9 50.0 5 14 77.8
11) Minnesota 15 66 7 46.7 6 13 86.7
12) Chicago 18 79 8 44.4 8 16 88.9
13) St. Louis 14 57 6 42.9 5 11 78.6
14) New York Giants 20 83 8 40.0 9 17 85.0
15) San Francisco 19 73 7 36.8 8 15 78.9
16) Seattle 14 56 4 28.6 9 13 92.9
NFC / OPPONENTS/DEFENSE INSIDE THE 20
Rank Team Poss Pts TD TD% FG Score Score%
1) St. Louis 14 62 5 35.7 9 14 100.0
2) Minnesota 15 59 6 40.0 6 12 80.0
3) Green Bay 21 85 10 47.6 5 15 71.4
4t) Philadelphia 16 74 8 50.0 6 14 87.5
4t) Washington 16 70 8 50.0 5 13 81.3
6) Carolina 17 72 9 52.9 4 13 76.5
7) New York Giants 20 93 11 55.0 5 16 80.0
8) Dallas 18 88 10 55.6 6 16 88.9
9) Arizona 16 80 9 56.3 6 15 93.8
10) Detroit 30 145 17 56.7 9 26 86.7
11) New Orleans 26 128 15 57.7 8 23 88.5
12) Seattle 15 78 9 60.0 5 14 93.3
13) Chicago 21 111 13 61.9 7 20 95.2
14) San Francisco 24 128 15 62.5 7 22 91.7
15) Atlanta 23 119 15 65.2 5 20 87.0
16) Tampa Bay 19 111 14 73.7 5 19 100.0
WEEK 6 / THROUGH MONDAY, OCTOBER 19, 2015
NFL / TEAM/OFFENSE INSIDE THE 20
Rank Team Poss Pts TD TD% FG Score Score%
1) Pittsburgh 16 97 12 75.0 4 16 100.0
2) New England 23 137 17 73.9 6 23 100.0
3) New York Jets 19 110 14 73.7 4 18 94.7
4) Atlanta 22 120 16 72.7 3 19 86.4
5) Cincinnati 28 152 20 71.4 4 24 85.7
6) Arizona 26 146 18 69.2 7 25 96.2
7t) Buffalo 12 57 8 66.7 1 9 75.0
7t) Detroit 15 76 10 66.7 3 13 86.7
7t) Indianapolis 18 92 12 66.7 3 15 83.3
7t) Tennessee 18 95 12 66.7 4 16 88.9
11) Oakland 14 74 9 64.3 4 13 92.9
12) Houston 18 86 11 61.1 3 14 77.8
13) Green Bay 22 116 13 59.1 8 21 95.5
14) Carolina 17 87 10 58.8 6 16 94.1
15) Miami 14 62 8 57.1 2 10 71.4
16) New Orleans 23 109 13 56.5 7 20 87.0
17) Washington 16 78 9 56.3 5 14 87.5
18) San Diego 22 101 12 54.5 6 18 81.8
19t) Baltimore 19 93 10 52.6 8 18 94.7
19t) Jacksonville 19 89 10 52.6 7 17 89.5
19t) Philadelphia 19 84 10 52.6 5 15 78.9
22t) Dallas 16 77 8 50.0 7 15 93.8
22t) Tampa Bay 18 77 9 50.0 5 14 77.8
24) Minnesota 15 66 7 46.7 6 13 86.7
25) Chicago 18 79 8 44.4 8 16 88.9
26) St. Louis 14 57 6 42.9 5 11 78.6
27) Kansas City 19 77 8 42.1 7 15 78.9
28) New York Giants 20 83 8 40.0 9 17 85.0
29) Denver 16 66 6 37.5 8 14 87.5
30t) Cleveland 19 79 7 36.8 10 17 89.5
30t) San Francisco 19 73 7 36.8 8 15 78.9
32) Seattle 14 56 4 28.6 9 13 92.9
NFL / OPPONENTS/DEFENSE INSIDE THE 20
Rank Team Poss Pts TD TD% FG Score Score%
1) New York Jets 12 37 4 33.3 3 7 58.3
2) St. Louis 14 62 5 35.7 9 14 100.0
3) Minnesota 15 59 6 40.0 6 12 80.0
4t) Baltimore 21 89 9 42.9 9 18 85.7
4t) Oakland 21 94 9 42.9 11 20 95.2
6) Cincinnati 13 59 6 46.2 6 12 92.3
7) Denver 15 56 7 46.7 3 10 66.7
8) Green Bay 21 85 10 47.6 5 15 71.4
9t) Philadelphia 16 74 8 50.0 6 14 87.5
9t) Washington 16 70 8 50.0 5 13 81.3
11t) Carolina 17 72 9 52.9 4 13 76.5
11t) San Diego 17 85 9 52.9 7 16 94.1
13) Miami 13 64 7 53.8 5 12 92.3
14) New York Giants 20 93 11 55.0 5 16 80.0
15) Dallas 18 88 10 55.6 6 16 88.9
16) Arizona 16 80 9 56.3 6 15 93.8
17) Detroit 30 145 17 56.7 9 26 86.7
18) New Orleans 26 128 15 57.7 8 23 88.5
19) Indianapolis 19 97 11 57.9 7 18 94.7
20) Pittsburgh 17 82 10 58.8 4 14 82.4
21t) Cleveland 25 128 15 60.0 8 23 92.0
21t) Seattle 15 78 9 60.0 5 14 93.3
23) Chicago 21 111 13 61.9 7 20 95.2
24t) Jacksonville 24 126 15 62.5 7 22 91.7
24t) San Francisco 24 128 15 62.5 7 22 91.7
26) Buffalo 17 86 11 64.7 3 14 82.4
27) Atlanta 23 119 15 65.2 5 20 87.0
28) New England 13 70 9 69.2 3 12 92.3
29) Houston 17 92 12 70.6 3 15 88.2
30) Kansas City 21 117 15 71.4 4 19 90.5
31) Tampa Bay 19 111 14 73.7 5 19 100.0
32) Tennessee 12 66 9 75.0 1 10 83.3
AFC / OFFENSE/TEAMS: FIRST DOWNS, THIRD DOWNS, FOURTH DOWNS
FIRST DOWNS THIRD DOWNS FOURTH DOWNS
Rank Team Total Rush Pass Pen Made Att Pct Made Att Pct
1) New England 130 31 84 15 29 57 50.9 1 4 25.0
2t) Houston 147 35 95 17 38 96 39.6 4 10 40.0
2t) San Diego 147 28 105 14 34 82 41.5 1 4 25.0
4) Cincinnati 131 41 77 13 35 75 46.7 2 3 66.7
5) Tennessee 108 28 68 12 22 61 36.1 4 5 80.0
6) Indianapolis 128 33 77 18 35 82 42.7 4 7 57.1
7) Baltimore 127 46 69 12 28 84 33.3 7 11 63.6
8) New York Jets 102 39 55 8 31 72 43.1 0 1 0.0
9t) Jacksonville 120 24 83 13 28 79 35.4 4 6 66.7
9t) Miami 100 27 62 11 19 61 31.1 1 10 10.0
11) Kansas City 118 36 69 13 20 72 27.8 2 4 50.0
12) Oakland 98 17 66 15 31 69 44.9 3 5 60.0
13) Cleveland 114 28 75 11 42 90 46.7 2 5 40.0
14) Denver 110 22 77 11 26 86 30.2 3 4 75.0
15) Buffalo 108 38 62 8 28 80 35.0 3 6 50.0
16) Pittsburgh 106 39 59 8 29 76 38.2 2 4 50.0
Totals 1894 512 1183 199 475 1222 38.9 43 89 48.3
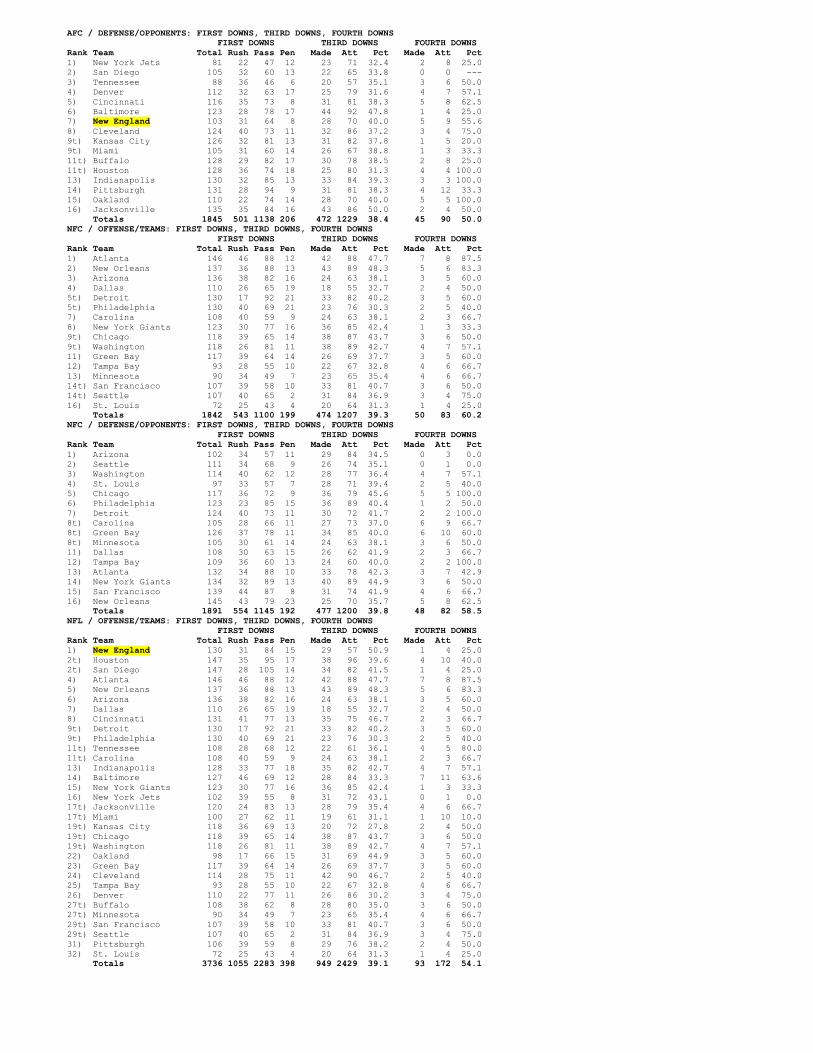
AFC / DEFENSE/OPPONENTS: FIRST DOWNS, THIRD DOWNS, FOURTH DOWNS
FIRST DOWNS THIRD DOWNS FOURTH DOWNS
Rank Team Total Rush Pass Pen Made Att Pct Made Att Pct
1) New York Jets 81 22 47 12 23 71 32.4 2 8 25.0
2) San Diego 105 32 60 13 22 65 33.8 0 0 ---
3) Tennessee 88 36 46 6 20 57 35.1 3 6 50.0
4) Denver 112 32 63 17 25 79 31.6 4 7 57.1
5) Cincinnati 116 35 73 8 31 81 38.3 5 8 62.5
6) Baltimore 123 28 78 17 44 92 47.8 1 4 25.0
7) New England 103 31 64 8 28 70 40.0 5 9 55.6
8) Cleveland 124 40 73 11 32 86 37.2 3 4 75.0
9t) Kansas City 126 32 81 13 31 82 37.8 1 5 20.0
9t) Miami 105 31 60 14 26 67 38.8 1 3 33.3
11t) Buffalo 128 29 82 17 30 78 38.5 2 8 25.0
11t) Houston 128 36 74 18 25 80 31.3 4 4 100.0
13) Indianapolis 130 32 85 13 33 84 39.3 3 3 100.0
14) Pittsburgh 131 28 94 9 31 81 38.3 4 12 33.3
15) Oakland 110 22 74 14 28 70 40.0 5 5 100.0
16) Jacksonville 135 35 84 16 43 86 50.0 2 4 50.0
Totals 1845 501 1138 206 472 1229 38.4 45 90 50.0
NFC / OFFENSE/TEAMS: FIRST DOWNS, THIRD DOWNS, FOURTH DOWNS
FIRST DOWNS THIRD DOWNS FOURTH DOWNS
Rank Team Total Rush Pass Pen Made Att Pct Made Att Pct
1) Atlanta 146 46 88 12 42 88 47.7 7 8 87.5
2) New Orleans 137 36 88 13 43 89 48.3 5 6 83.3
3) Arizona 136 38 82 16 24 63 38.1 3 5 60.0
4) Dallas 110 26 65 19 18 55 32.7 2 4 50.0
5t) Detroit 130 17 92 21 33 82 40.2 3 5 60.0
5t) Philadelphia 130 40 69 21 23 76 30.3 2 5 40.0
7) Carolina 108 40 59 9 24 63 38.1 2 3 66.7
8) New York Giants 123 30 77 16 36 85 42.4 1 3 33.3
9t) Chicago 118 39 65 14 38 87 43.7 3 6 50.0
9t) Washington 118 26 81 11 38 89 42.7 4 7 57.1
11) Green Bay 117 39 64 14 26 69 37.7 3 5 60.0
12) Tampa Bay 93 28 55 10 22 67 32.8 4 6 66.7
13) Minnesota 90 34 49 7 23 65 35.4 4 6 66.7
14t) San Francisco 107 39 58 10 33 81 40.7 3 6 50.0
14t) Seattle 107 40 65 2 31 84 36.9 3 4 75.0
16) St. Louis 72 25 43 4 20 64 31.3 1 4 25.0
Totals 1842 543 1100 199 474 1207 39.3 50 83 60.2
NFC / DEFENSE/OPPONENTS: FIRST DOWNS, THIRD DOWNS, FOURTH DOWNS
FIRST DOWNS THIRD DOWNS FOURTH DOWNS
Rank Team Total Rush Pass Pen Made Att Pct Made Att Pct
1) Arizona 102 34 57 11 29 84 34.5 0 3 0.0
2) Seattle 111 34 68 9 26 74 35.1 0 1 0.0
3) Washington 114 40 62 12 28 77 36.4 4 7 57.1
4) St. Louis 97 33 57 7 28 71 39.4 2 5 40.0
5) Chicago 117 36 72 9 36 79 45.6 5 5 100.0
6) Philadelphia 123 23 85 15 36 89 40.4 1 2 50.0
7) Detroit 124 40 73 11 30 72 41.7 2 2 100.0
8t) Carolina 105 28 66 11 27 73 37.0 6 9 66.7
8t) Green Bay 126 37 78 11 34 85 40.0 6 10 60.0
8t) Minnesota 105 30 61 14 24 63 38.1 3 6 50.0
11) Dallas 108 30 63 15 26 62 41.9 2 3 66.7
12) Tampa Bay 109 36 60 13 24 60 40.0 2 2 100.0
13) Atlanta 132 34 88 10 33 78 42.3 3 7 42.9
14) New York Giants 134 32 89 13 40 89 44.9 3 6 50.0
15) San Francisco 139 44 87 8 31 74 41.9 4 6 66.7
16) New Orleans 145 43 79 23 25 70 35.7 5 8 62.5
Totals 1891 554 1145 192 477 1200 39.8 48 82 58.5
NFL / OFFENSE/TEAMS: FIRST DOWNS, THIRD DOWNS, FOURTH DOWNS
FIRST DOWNS THIRD DOWNS FOURTH DOWNS
Rank Team Total Rush Pass Pen Made Att Pct Made Att Pct
1) New England 130 31 84 15 29 57 50.9 1 4 25.0
2t) Houston 147 35 95 17 38 96 39.6 4 10 40.0
2t) San Diego 147 28 105 14 34 82 41.5 1 4 25.0
4) Atlanta 146 46 88 12 42 88 47.7 7 8 87.5
5) New Orleans 137 36 88 13 43 89 48.3 5 6 83.3
6) Arizona 136 38 82 16 24 63 38.1 3 5 60.0
7) Dallas 110 26 65 19 18 55 32.7 2 4 50.0
8) Cincinnati 131 41 77 13 35 75 46.7 2 3 66.7
9t) Detroit 130 17 92 21 33 82 40.2 3 5 60.0
9t) Philadelphia 130 40 69 21 23 76 30.3 2 5 40.0
11t) Tennessee 108 28 68 12 22 61 36.1 4 5 80.0
11t) Carolina 108 40 59 9 24 63 38.1 2 3 66.7
13) Indianapolis 128 33 77 18 35 82 42.7 4 7 57.1
14) Baltimore 127 46 69 12 28 84 33.3 7 11 63.6
15) New York Giants 123 30 77 16 36 85 42.4 1 3 33.3
16) New York Jets 102 39 55 8 31 72 43.1 0 1 0.0
17t) Jacksonville 120 24 83 13 28 79 35.4 4 6 66.7
17t) Miami 100 27 62 11 19 61 31.1 1 10 10.0
19t) Kansas City 118 36 69 13 20 72 27.8 2 4 50.0
19t) Chicago 118 39 65 14 38 87 43.7 3 6 50.0
19t) Washington 118 26 81 11 38 89 42.7 4 7 57.1
22) Oakland 98 17 66 15 31 69 44.9 3 5 60.0
23) Green Bay 117 39 64 14 26 69 37.7 3 5 60.0
24) Cleveland 114 28 75 11 42 90 46.7 2 5 40.0
25) Tampa Bay 93 28 55 10 22 67 32.8 4 6 66.7
26) Denver 110 22 77 11 26 86 30.2 3 4 75.0
27t) Buffalo 108 38 62 8 28 80 35.0 3 6 50.0
27t) Minnesota 90 34 49 7 23 65 35.4 4 6 66.7
29t) San Francisco 107 39 58 10 33 81 40.7 3 6 50.0
29t) Seattle 107 40 65 2 31 84 36.9 3 4 75.0
31) Pittsburgh 106 39 59 8 29 76 38.2 2 4 50.0
32) St. Louis 72 25 43 4 20 64 31.3 1 4 25.0
Totals 3736 1055 2283 398 949 2429 39.1 93 172 54.1
NFL / DEFENSE/OPPONENTS: FIRST DOWNS, THIRD DOWNS, FOURTH DOWNS
FIRST DOWNS THIRD DOWNS FOURTH DOWNS
Rank Team Total Rush Pass Pen Made Att Pct Made Att Pct
1) New York Jets 81 22 47 12 23 71 32.4 2 8 25.0
2) Arizona 102 34 57 11 29 84 34.5 0 3 0.0
3) San Diego 105 32 60 13 22 65 33.8 0 0 ---
4) Tennessee 88 36 46 6 20 57 35.1 3 6 50.0
5) Seattle 111 34 68 9 26 74 35.1 0 1 0.0
6) Denver 112 32 63 17 25 79 31.6 4 7 57.1
7) Washington 114 40 62 12 28 77 36.4 4 7 57.1
8) Cincinnati 116 35 73 8 31 81 38.3 5 8 62.5
9) St. Louis 97 33 57 7 28 71 39.4 2 5 40.0
10) Chicago 117 36 72 9 36 79 45.6 5 5 100.0
11t) Baltimore 123 28 78 17 44 92 47.8 1 4 25.0
11t) Philadelphia 123 23 85 15 36 89 40.4 1 2 50.0
13) New England 103 31 64 8 28 70 40.0 5 9 55.6
14t) Cleveland 124 40 73 11 32 86 37.2 3 4 75.0
14t) Detroit 124 40 73 11 30 72 41.7 2 2 100.0
16t) Kansas City 126 32 81 13 31 82 37.8 1 5 20.0
16t) Miami 105 31 60 14 26 67 38.8 1 3 33.3
16t) Carolina 105 28 66 11 27 73 37.0 6 9 66.7
16t) Green Bay 126 37 78 11 34 85 40.0 6 10 60.0
16t) Minnesota 105 30 61 14 24 63 38.1 3 6 50.0
21t) Buffalo 128 29 82 17 30 78 38.5 2 8 25.0
21t) Houston 128 36 74 18 25 80 31.3 4 4 100.0
23) Dallas 108 30 63 15 26 62 41.9 2 3 66.7
24) Indianapolis 130 32 85 13 33 84 39.3 3 3 100.0
25) Tampa Bay 109 36 60 13 24 60 40.0 2 2 100.0
26) Pittsburgh 131 28 94 9 31 81 38.3 4 12 33.3
27t) Oakland 110 22 74 14 28 70 40.0 5 5 100.0
27t) Atlanta 132 34 88 10 33 78 42.3 3 7 42.9
29) New York Giants 134 32 89 13 40 89 44.9 3 6 50.0
30) Jacksonville 135 35 84 16 43 86 50.0 2 4 50.0
31) San Francisco 139 44 87 8 31 74 41.9 4 6 66.7
32) New Orleans 145 43 79 23 25 70 35.7 5 8 62.5
Totals 3736 1055 2283 398 949 2429 39.1 93 172 54.1
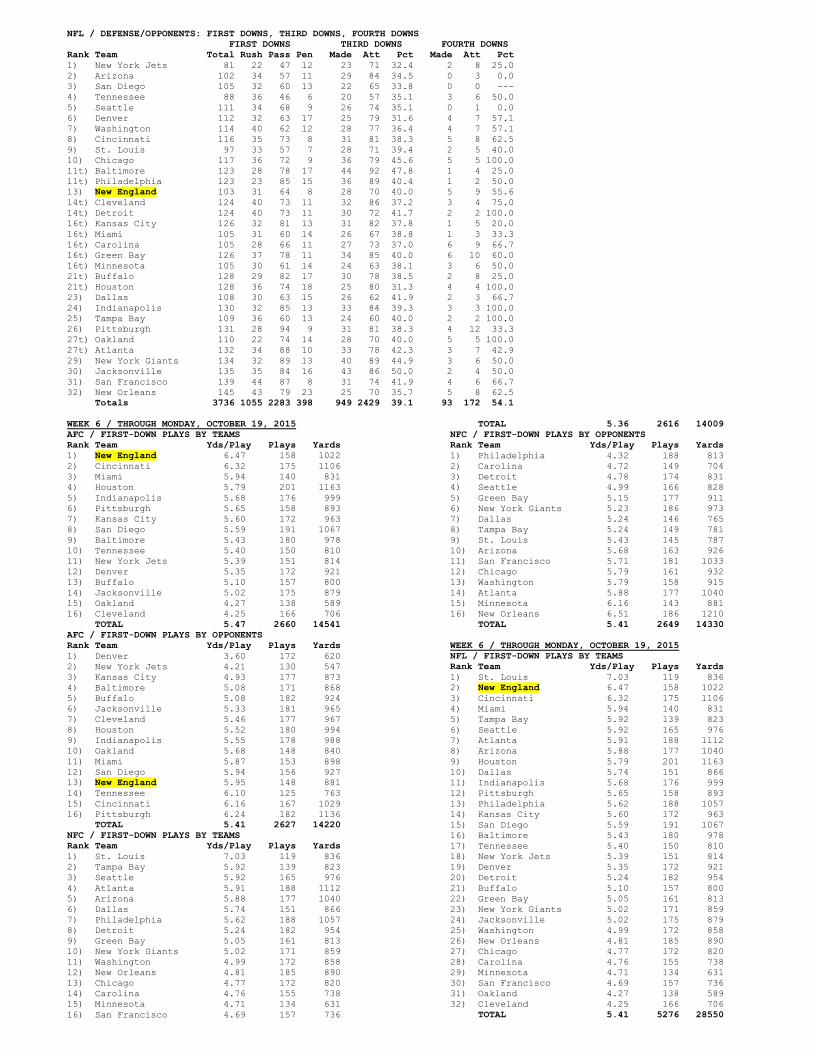
WEEK 6 / THROUGH MONDAY, OCTOBER 19, 2015
AFC / FIRST-DOWN PLAYS BY TEAMS
Rank Team Yds/Play Plays Yards
1) New England 6.47 158 1022
2) Cincinnati 6.32 175 1106
3) Miami 5.94 140 831
4) Houston 5.79 201 1163
5) Indianapolis 5.68 176 999
6) Pittsburgh 5.65 158 893
7) Kansas City 5.60 172 963
8) San Diego 5.59 191 1067
9) Baltimore 5.43 180 978
10) Tennessee 5.40 150 810
11) New York Jets 5.39 151 814
12) Denver 5.35 172 921
13) Buffalo 5.10 157 800
14) Jacksonville 5.02 175 879
15) Oakland 4.27 138 589
16) Cleveland 4.25 166 706
TOTAL 5.47 2660 14541
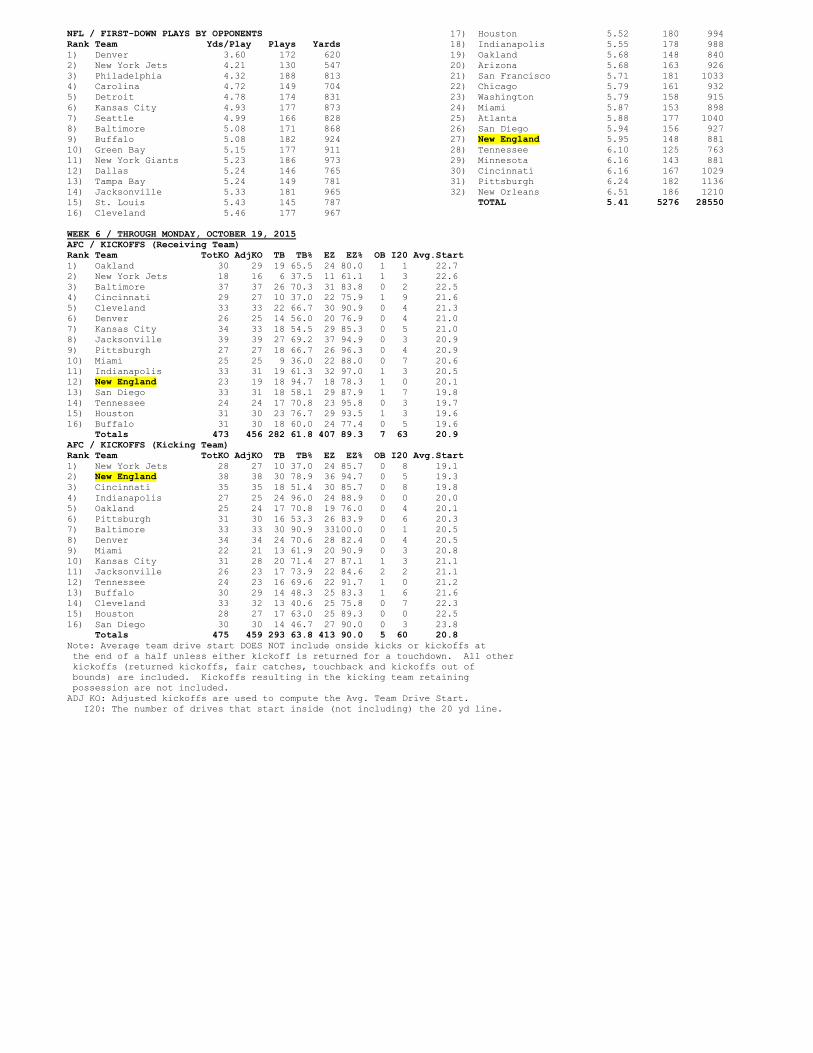
AFC / FIRST-DOWN PLAYS BY OPPONENTS
Rank Team Yds/Play Plays Yards
1) Denver 3.60 172 620
2) New York Jets 4.21 130 547
3) Kansas City 4.93 177 873
4) Baltimore 5.08 171 868
5) Buffalo 5.08 182 924
6) Jacksonville 5.33 181 965
7) Cleveland 5.46 177 967
8) Houston 5.52 180 994
9) Indianapolis 5.55 178 988
10) Oakland 5.68 148 840
11) Miami 5.87 153 898
12) San Diego 5.94 156 927
13) New England 5.95 148 881
14) Tennessee 6.10 125 763
15) Cincinnati 6.16 167 1029
16) Pittsburgh 6.24 182 1136
TOTAL 5.41 2627 14220
NFC / FIRST-DOWN PLAYS BY TEAMS
Rank Team Yds/Play Plays Yards
1) St. Louis 7.03 119 836
2) Tampa Bay 5.92 139 823
3) Seattle 5.92 165 976
4) Atlanta 5.91 188 1112
5) Arizona 5.88 177 1040
6) Dallas 5.74 151 866
7) Philadelphia 5.62 188 1057
8) Detroit 5.24 182 954
9) Green Bay 5.05 161 813
10) New York Giants 5.02 171 859
11) Washington 4.99 172 858
12) New Orleans 4.81 185 890
13) Chicago 4.77 172 820
14) Carolina 4.76 155 738
15) Minnesota 4.71 134 631
16) San Francisco 4.69 157 736
TOTAL 5.36 2616 14009
NFC / FIRST-DOWN PLAYS BY OPPONENTS
Rank Team Yds/Play Plays Yards
1) Philadelphia 4.32 188 813
2) Carolina 4.72 149 704
3) Detroit 4.78 174 831
4) Seattle 4.99 166 828
5) Green Bay 5.15 177 911
6) New York Giants 5.23 186 973
7) Dallas 5.24 146 765
8) Tampa Bay 5.24 149 781
9) St. Louis 5.43 145 787
10) Arizona 5.68 163 926
11) San Francisco 5.71 181 1033
12) Chicago 5.79 161 932
13) Washington 5.79 158 915
14) Atlanta 5.88 177 1040
15) Minnesota 6.16 143 881
16) New Orleans 6.51 186 1210
TOTAL 5.41 2649 14330
WEEK 6 / THROUGH MONDAY, OCTOBER 19, 2015
NFL / FIRST-DOWN PLAYS BY TEAMS
Rank Team Yds/Play Plays Yards
1) St. Louis 7.03 119 836
2) New England 6.47 158 1022
3) Cincinnati 6.32 175 1106
4) Miami 5.94 140 831
5) Tampa Bay 5.92 139 823
6) Seattle 5.92 165 976
7) Atlanta 5.91 188 1112
8) Arizona 5.88 177 1040
9) Houston 5.79 201 1163
10) Dallas 5.74 151 866
11) Indianapolis 5.68 176 999
12) Pittsburgh 5.65 158 893
13) Philadelphia 5.62 188 1057
14) Kansas City 5.60 172 963
15) San Diego 5.59 191 1067
16) Baltimore 5.43 180 978
17) Tennessee 5.40 150 810
18) New York Jets 5.39 151 814
19) Denver 5.35 172 921
20) Detroit 5.24 182 954
21) Buffalo 5.10 157 800
22) Green Bay 5.05 161 813
23) New York Giants 5.02 171 859
24) Jacksonville 5.02 175 879
25) Washington 4.99 172 858
26) New Orleans 4.81 185 890
27) Chicago 4.77 172 820
28) Carolina 4.76 155 738
29) Minnesota 4.71 134 631
30) San Francisco 4.69 157 736
31) Oakland 4.27 138 589
32) Cleveland 4.25 166 706
TOTAL 5.41 5276 28550
NFL / FIRST-DOWN PLAYS BY OPPONENTS
Rank Team Yds/Play Plays Yards
1) Denver 3.60 172 620
2) New York Jets 4.21 130 547
3) Philadelphia 4.32 188 813
4) Carolina 4.72 149 704
5) Detroit 4.78 174 831
6) Kansas City 4.93 177 873
7) Seattle 4.99 166 828
8) Baltimore 5.08 171 868
9) Buffalo 5.08 182 924
10) Green Bay 5.15 177 911
11) New York Giants 5.23 186 973
12) Dallas 5.24 146 765
13) Tampa Bay 5.24 149 781
14) Jacksonville 5.33 181 965
15) St. Louis 5.43 145 787
16) Cleveland 5.46 177 967
17) Houston 5.52 180 994
18) Indianapolis 5.55 178 988
19) Oakland 5.68 148 840
20) Arizona 5.68 163 926
21) San Francisco 5.71 181 1033
22) Chicago 5.79 161 932
23) Washington 5.79 158 915
24) Miami 5.87 153 898
25) Atlanta 5.88 177 1040
26) San Diego 5.94 156 927
27) New England 5.95 148 881
28) Tennessee 6.10 125 763
29) Minnesota 6.16 143 881
30) Cincinnati 6.16 167 1029
31) Pittsburgh 6.24 182 1136
32) New Orleans 6.51 186 1210
TOTAL 5.41 5276 28550
WEEK 6 / THROUGH MONDAY, OCTOBER 19, 2015
AFC / KICKOFFS (Receiving Team)
Rank Team TotKO AdjKO TB TB% EZ EZ% OB I20 Avg.Start
1) Oakland 30 29 19 65.5 24 80.0 1 1 22.7
2) New York Jets 18 16 6 37.5 11 61.1 1 3 22.6
3) Baltimore 37 37 26 70.3 31 83.8 0 2 22.5
4) Cincinnati 29 27 10 37.0 22 75.9 1 9 21.6
5) Cleveland 33 33 22 66.7 30 90.9 0 4 21.3
6) Denver 26 25 14 56.0 20 76.9 0 4 21.0
7) Kansas City 34 33 18 54.5 29 85.3 0 5 21.0
8) Jacksonville 39 39 27 69.2 37 94.9 0 3 20.9
9) Pittsburgh 27 27 18 66.7 26 96.3 0 4 20.9
10) Miami 25 25 9 36.0 22 88.0 0 7 20.6
11) Indianapolis 33 31 19 61.3 32 97.0 1 3 20.5
12) New England 23 19 18 94.7 18 78.3 1 0 20.1
13) San Diego 33 31 18 58.1 29 87.9 1 7 19.8
14) Tennessee 24 24 17 70.8 23 95.8 0 3 19.7
15) Houston 31 30 23 76.7 29 93.5 1 3 19.6
16) Buffalo 31 30 18 60.0 24 77.4 0 5 19.6
Totals 473 456 282 61.8 407 89.3 7 63 20.9
AFC / KICKOFFS (Kicking Team)
Rank Team TotKO AdjKO TB TB% EZ EZ% OB I20 Avg.Start
1) New York Jets 28 27 10 37.0 24 85.7 0 8 19.1
2) New England 38 38 30 78.9 36 94.7 0 5 19.3
3) Cincinnati 35 35 18 51.4 30 85.7 0 8 19.8
4) Indianapolis 27 25 24 96.0 24 88.9 0 0 20.0
5) Oakland 25 24 17 70.8 19 76.0 0 4 20.1
6) Pittsburgh 31 30 16 53.3 26 83.9 0 6 20.3
7) Baltimore 33 33 30 90.9 33100.0 0 1 20.5
8) Denver 34 34 24 70.6 28 82.4 0 4 20.5
9) Miami 22 21 13 61.9 20 90.9 0 3 20.8
10) Kansas City 31 28 20 71.4 27 87.1 1 3 21.1
11) Jacksonville 26 23 17 73.9 22 84.6 2 2 21.1
12) Tennessee 24 23 16 69.6 22 91.7 1 0 21.2
13) Buffalo 30 29 14 48.3 25 83.3 1 6 21.6
14) Cleveland 33 32 13 40.6 25 75.8 0 7 22.3
15) Houston 28 27 17 63.0 25 89.3 0 0 22.5
16) San Diego 30 30 14 46.7 27 90.0 0 3 23.8
Totals 475 459 293 63.8 413 90.0 5 60 20.8
Note: Average team drive start DOES NOT include onside kicks or kickoffs at
the end of a half unless either kickoff is returned for a touchdown. All other
kickoffs (returned kickoffs, fair catches, touchback and kickoffs out of
bounds) are included. Kickoffs resulting in the kicking team retaining
possession are not included.
ADJ KO: Adjusted kickoffs are used to compute the Avg. Team Drive Start.
I20: The number of drives that start inside (not including) the 20 yd line.
WEEK 6 / THROUGH MONDAY, OCTOBER 19, 2015
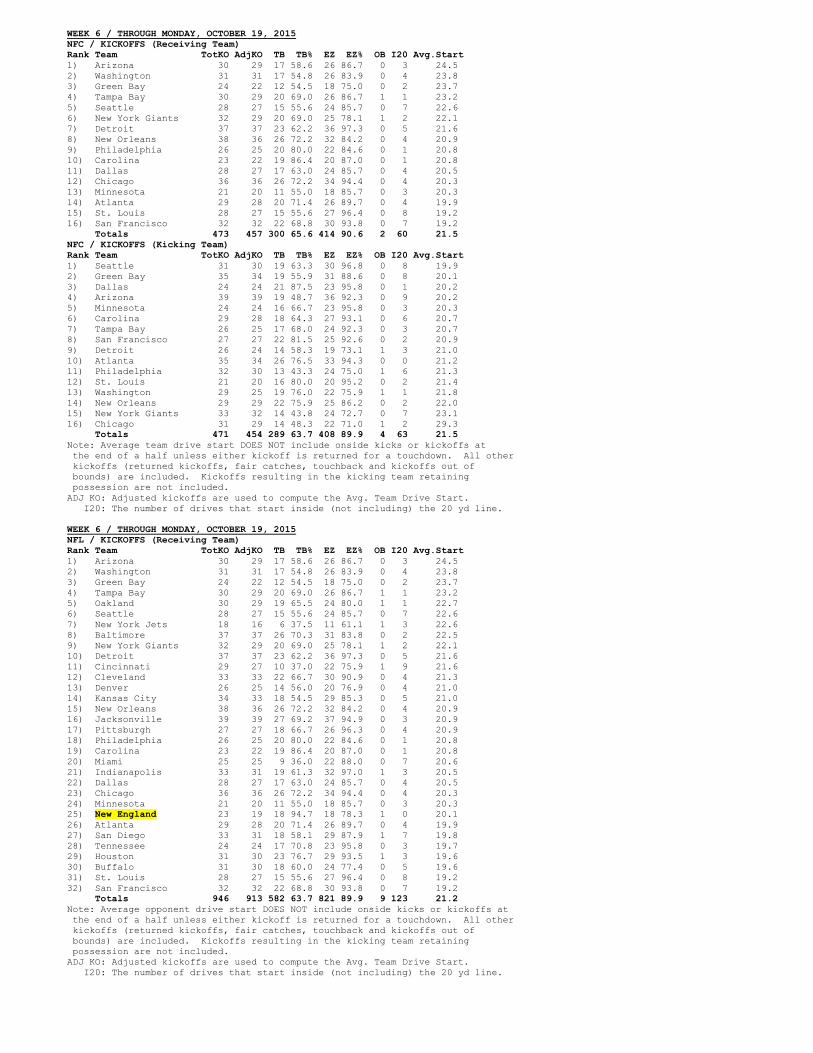
NFC / KICKOFFS (Receiving Team)
Rank Team TotKO AdjKO TB TB% EZ EZ% OB I20 Avg.Start
1) Arizona 30 29 17 58.6 26 86.7 0 3 24.5
2) Washington 31 31 17 54.8 26 83.9 0 4 23.8
3) Green Bay 24 22 12 54.5 18 75.0 0 2 23.7
4) Tampa Bay 30 29 20 69.0 26 86.7 1 1 23.2
5) Seattle 28 27 15 55.6 24 85.7 0 7 22.6
6) New York Giants 32 29 20 69.0 25 78.1 1 2 22.1
7) Detroit 37 37 23 62.2 36 97.3 0 5 21.6
8) New Orleans 38 36 26 72.2 32 84.2 0 4 20.9
9) Philadelphia 26 25 20 80.0 22 84.6 0 1 20.8
10) Carolina 23 22 19 86.4 20 87.0 0 1 20.8
11) Dallas 28 27 17 63.0 24 85.7 0 4 20.5
12) Chicago 36 36 26 72.2 34 94.4 0 4 20.3
13) Minnesota 21 20 11 55.0 18 85.7 0 3 20.3
14) Atlanta 29 28 20 71.4 26 89.7 0 4 19.9
15) St. Louis 28 27 15 55.6 27 96.4 0 8 19.2
16) San Francisco 32 32 22 68.8 30 93.8 0 7 19.2
Totals 473 457 300 65.6 414 90.6 2 60 21.5
NFC / KICKOFFS (Kicking Team)
Rank Team TotKO AdjKO TB TB% EZ EZ% OB I20 Avg.Start
1) Seattle 31 30 19 63.3 30 96.8 0 8 19.9
2) Green Bay 35 34 19 55.9 31 88.6 0 8 20.1
3) Dallas 24 24 21 87.5 23 95.8 0 1 20.2
4) Arizona 39 39 19 48.7 36 92.3 0 9 20.2
5) Minnesota 24 24 16 66.7 23 95.8 0 3 20.3
6) Carolina 29 28 18 64.3 27 93.1 0 6 20.7
7) Tampa Bay 26 25 17 68.0 24 92.3 0 3 20.7
8) San Francisco 27 27 22 81.5 25 92.6 0 2 20.9
9) Detroit 26 24 14 58.3 19 73.1 1 3 21.0
10) Atlanta 35 34 26 76.5 33 94.3 0 0 21.2
11) Philadelphia 32 30 13 43.3 24 75.0 1 6 21.3
12) St. Louis 21 20 16 80.0 20 95.2 0 2 21.4
13) Washington 29 25 19 76.0 22 75.9 1 1 21.8
14) New Orleans 29 29 22 75.9 25 86.2 0 2 22.0
15) New York Giants 33 32 14 43.8 24 72.7 0 7 23.1
16) Chicago 31 29 14 48.3 22 71.0 1 2 29.3
Totals 471 454 289 63.7 408 89.9 4 63 21.5
Note: Average team drive start DOES NOT include onside kicks or kickoffs at
the end of a half unless either kickoff is returned for a touchdown. All other
kickoffs (returned kickoffs, fair catches, touchback and kickoffs out of
bounds) are included. Kickoffs resulting in the kicking team retaining
possession are not included.
ADJ KO: Adjusted kickoffs are used to compute the Avg. Team Drive Start.
I20: The number of drives that start inside (not including) the 20 yd line.
WEEK 6 / THROUGH MONDAY, OCTOBER 19, 2015
NFL / KICKOFFS (Receiving Team)
Rank Team TotKO AdjKO TB TB% EZ EZ% OB I20 Avg.Start
1) Arizona 30 29 17 58.6 26 86.7 0 3 24.5
2) Washington 31 31 17 54.8 26 83.9 0 4 23.8
3) Green Bay 24 22 12 54.5 18 75.0 0 2 23.7
4) Tampa Bay 30 29 20 69.0 26 86.7 1 1 23.2
5) Oakland 30 29 19 65.5 24 80.0 1 1 22.7
6) Seattle 28 27 15 55.6 24 85.7 0 7 22.6
7) New York Jets 18 16 6 37.5 11 61.1 1 3 22.6
8) Baltimore 37 37 26 70.3 31 83.8 0 2 22.5
9) New York Giants 32 29 20 69.0 25 78.1 1 2 22.1
10) Detroit 37 37 23 62.2 36 97.3 0 5 21.6
11) Cincinnati 29 27 10 37.0 22 75.9 1 9 21.6
12) Cleveland 33 33 22 66.7 30 90.9 0 4 21.3
13) Denver 26 25 14 56.0 20 76.9 0 4 21.0
14) Kansas City 34 33 18 54.5 29 85.3 0 5 21.0
15) New Orleans 38 36 26 72.2 32 84.2 0 4 20.9
16) Jacksonville 39 39 27 69.2 37 94.9 0 3 20.9
17) Pittsburgh 27 27 18 66.7 26 96.3 0 4 20.9
18) Philadelphia 26 25 20 80.0 22 84.6 0 1 20.8
19) Carolina 23 22 19 86.4 20 87.0 0 1 20.8
20) Miami 25 25 9 36.0 22 88.0 0 7 20.6
21) Indianapolis 33 31 19 61.3 32 97.0 1 3 20.5
22) Dallas 28 27 17 63.0 24 85.7 0 4 20.5
23) Chicago 36 36 26 72.2 34 94.4 0 4 20.3
24) Minnesota 21 20 11 55.0 18 85.7 0 3 20.3
25) New England 23 19 18 94.7 18 78.3 1 0 20.1
26) Atlanta 29 28 20 71.4 26 89.7 0 4 19.9
27) San Diego 33 31 18 58.1 29 87.9 1 7 19.8
28) Tennessee 24 24 17 70.8 23 95.8 0 3 19.7
29) Houston 31 30 23 76.7 29 93.5 1 3 19.6
30) Buffalo 31 30 18 60.0 24 77.4 0 5 19.6
31) St. Louis 28 27 15 55.6 27 96.4 0 8 19.2
32) San Francisco 32 32 22 68.8 30 93.8 0 7 19.2
Totals 946 913 582 63.7 821 89.9 9 123 21.2
Note: Average opponent drive start DOES NOT include onside kicks or kickoffs at
the end of a half unless either kickoff is returned for a touchdown. All other
kickoffs (returned kickoffs, fair catches, touchback and kickoffs out of
bounds) are included. Kickoffs resulting in the kicking team retaining
possession are not included.
ADJ KO: Adjusted kickoffs are used to compute the Avg. Team Drive Start.
I20: The number of drives that start inside (not including) the 20 yd line.
WEEK 6 / THROUGH MONDAY, OCTOBER 19, 2015
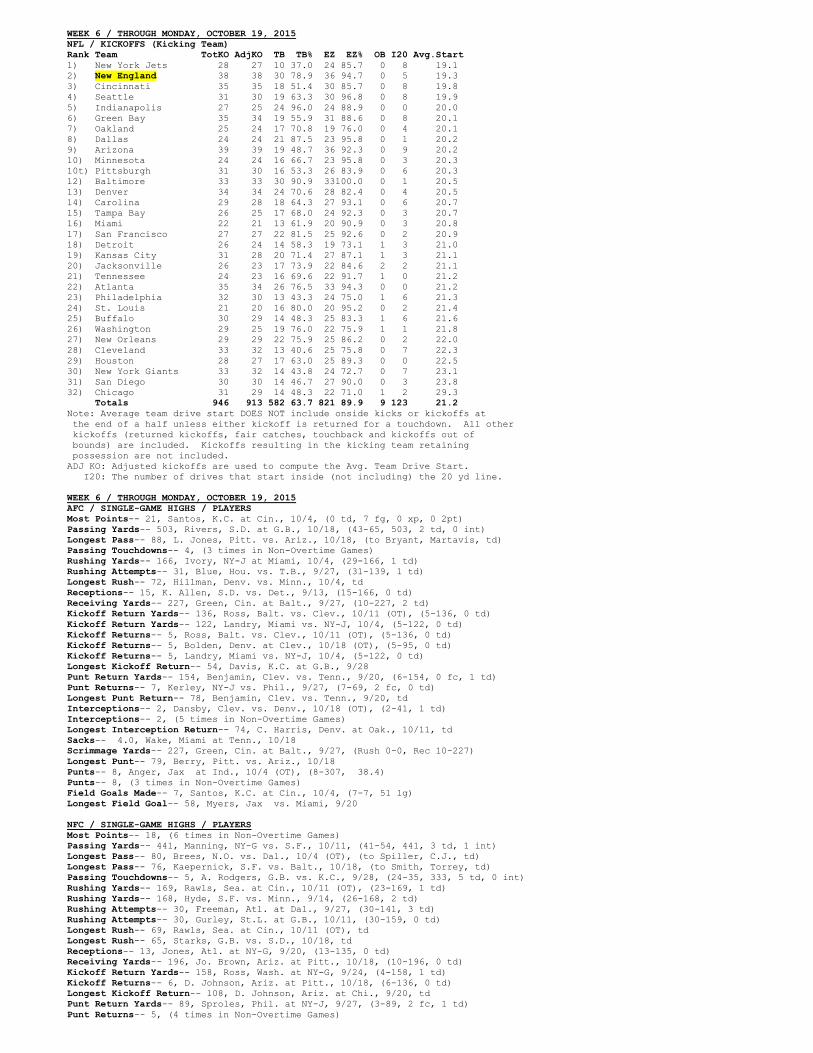
NFL / KICKOFFS (Kicking Team)
Rank Team TotKO AdjKO TB TB% EZ EZ% OB I20 Avg.Start
1) New York Jets 28 27 10 37.0 24 85.7 0 8 19.1
2) New England 38 38 30 78.9 36 94.7 0 5 19.3
3) Cincinnati 35 35 18 51.4 30 85.7 0 8 19.8
4) Seattle 31 30 19 63.3 30 96.8 0 8 19.9
5) Indianapolis 27 25 24 96.0 24 88.9 0 0 20.0
6) Green Bay 35 34 19 55.9 31 88.6 0 8 20.1
7) Oakland 25 24 17 70.8 19 76.0 0 4 20.1
8) Dallas 24 24 21 87.5 23 95.8 0 1 20.2
9) Arizona 39 39 19 48.7 36 92.3 0 9 20.2
10) Minnesota 24 24 16 66.7 23 95.8 0 3 20.3
10t) Pittsburgh 31 30 16 53.3 26 83.9 0 6 20.3
12) Baltimore 33 33 30 90.9 33100.0 0 1 20.5
13) Denver 34 34 24 70.6 28 82.4 0 4 20.5
14) Carolina 29 28 18 64.3 27 93.1 0 6 20.7
15) Tampa Bay 26 25 17 68.0 24 92.3 0 3 20.7
16) Miami 22 21 13 61.9 20 90.9 0 3 20.8
17) San Francisco 27 27 22 81.5 25 92.6 0 2 20.9
18) Detroit 26 24 14 58.3 19 73.1 1 3 21.0
19) Kansas City 31 28 20 71.4 27 87.1 1 3 21.1
20) Jacksonville 26 23 17 73.9 22 84.6 2 2 21.1
21) Tennessee 24 23 16 69.6 22 91.7 1 0 21.2
22) Atlanta 35 34 26 76.5 33 94.3 0 0 21.2
23) Philadelphia 32 30 13 43.3 24 75.0 1 6 21.3
24) St. Louis 21 20 16 80.0 20 95.2 0 2 21.4
25) Buffalo 30 29 14 48.3 25 83.3 1 6 21.6
26) Washington 29 25 19 76.0 22 75.9 1 1 21.8
27) New Orleans 29 29 22 75.9 25 86.2 0 2 22.0
28) Cleveland 33 32 13 40.6 25 75.8 0 7 22.3
29) Houston 28 27 17 63.0 25 89.3 0 0 22.5
30) New York Giants 33 32 14 43.8 24 72.7 0 7 23.1
31) San Diego 30 30 14 46.7 27 90.0 0 3 23.8
32) Chicago 31 29 14 48.3 22 71.0 1 2 29.3
Totals 946 913 582 63.7 821 89.9 9 123 21.2
Note: Average team drive start DOES NOT include onside kicks or kickoffs at
the end of a half unless either kickoff is returned for a touchdown. All other
kickoffs (returned kickoffs, fair catches, touchback and kickoffs out of
bounds) are included. Kickoffs resulting in the kicking team retaining
possession are not included.
ADJ KO: Adjusted kickoffs are used to compute the Avg. Team Drive Start.
I20: The number of drives that start inside (not including) the 20 yd line.
WEEK 6 / THROUGH MONDAY, OCTOBER 19, 2015
AFC / SINGLE-GAME HIGHS / PLAYERS
Most Points-- 21, Santos, K.C. at Cin., 10/4, (0 td, 7 fg, 0 xp, 0 2pt)
Passing Yards-- 503, Rivers, S.D. at G.B., 10/18, (43-65, 503, 2 td, 0 int)
Longest Pass-- 88, L. Jones, Pitt. vs. Ariz., 10/18, (to Bryant, Martavis, td)
Passing Touchdowns-- 4, (3 times in Non-Overtime Games)
Rushing Yards-- 166, Ivory, NY-J at Miami, 10/4, (29-166, 1 td)
Rushing Attempts-- 31, Blue, Hou. vs. T.B., 9/27, (31-139, 1 td)
Longest Rush-- 72, Hillman, Denv. vs. Minn., 10/4, td
Receptions-- 15, K. Allen, S.D. vs. Det., 9/13, (15-166, 0 td)
Receiving Yards-- 227, Green, Cin. at Balt., 9/27, (10-227, 2 td)
Kickoff Return Yards-- 136, Ross, Balt. vs. Clev., 10/11 (OT), (5-136, 0 td)
Kickoff Return Yards-- 122, Landry, Miami vs. NY-J, 10/4, (5-122, 0 td)
Kickoff Returns-- 5, Ross, Balt. vs. Clev., 10/11 (OT), (5-136, 0 td)
Kickoff Returns-- 5, Bolden, Denv. at Clev., 10/18 (OT), (5-95, 0 td)
Kickoff Returns-- 5, Landry, Miami vs. NY-J, 10/4, (5-122, 0 td)
Longest Kickoff Return-- 54, Davis, K.C. at G.B., 9/28
Punt Return Yards-- 154, Benjamin, Clev. vs. Tenn., 9/20, (6-154, 0 fc, 1 td)
Punt Returns-- 7, Kerley, NY-J vs. Phil., 9/27, (7-69, 2 fc, 0 td)
Longest Punt Return-- 78, Benjamin, Clev. vs. Tenn., 9/20, td
Interceptions-- 2, Dansby, Clev. vs. Denv., 10/18 (OT), (2-41, 1 td)
Interceptions-- 2, (5 times in Non-Overtime Games)
Longest Interception Return-- 74, C. Harris, Denv. at Oak., 10/11, td
Sacks-- 4.0, Wake, Miami at Tenn., 10/18
Scrimmage Yards-- 227, Green, Cin. at Balt., 9/27, (Rush 0-0, Rec 10-227)
Longest Punt-- 79, Berry, Pitt. vs. Ariz., 10/18
Punts-- 8, Anger, Jax at Ind., 10/4 (OT), (8-307, 38.4)
Punts-- 8, (3 times in Non-Overtime Games)
Field Goals Made-- 7, Santos, K.C. at Cin., 10/4, (7-7, 51 lg)
Longest Field Goal-- 58, Myers, Jax vs. Miami, 9/20
NFC / SINGLE-GAME HIGHS / PLAYERS
Most Points-- 18, (6 times in Non-Overtime Games)
Passing Yards-- 441, Manning, NY-G vs. S.F., 10/11, (41-54, 441, 3 td, 1 int)
Longest Pass-- 80, Brees, N.O. vs. Dal., 10/4 (OT), (to Spiller, C.J., td)
Longest Pass-- 76, Kaepernick, S.F. vs. Balt., 10/18, (to Smith, Torrey, td)
Passing Touchdowns-- 5, A. Rodgers, G.B. vs. K.C., 9/28, (24-35, 333, 5 td, 0 int)
Rushing Yards-- 169, Rawls, Sea. at Cin., 10/11 (OT), (23-169, 1 td)
Rushing Yards-- 168, Hyde, S.F. vs. Minn., 9/14, (26-168, 2 td)
Rushing Attempts-- 30, Freeman, Atl. at Dal., 9/27, (30-141, 3 td)
Rushing Attempts-- 30, Gurley, St.L. at G.B., 10/11, (30-159, 0 td)
Longest Rush-- 69, Rawls, Sea. at Cin., 10/11 (OT), td
Longest Rush-- 65, Starks, G.B. vs. S.D., 10/18, td
Receptions-- 13, Jones, Atl. at NY-G, 9/20, (13-135, 0 td)
Receiving Yards-- 196, Jo. Brown, Ariz. at Pitt., 10/18, (10-196, 0 td)
Kickoff Return Yards-- 158, Ross, Wash. at NY-G, 9/24, (4-158, 1 td)
Kickoff Returns-- 6, D. Johnson, Ariz. at Pitt., 10/18, (6-136, 0 td)
Longest Kickoff Return-- 108, D. Johnson, Ariz. at Chi., 9/20, td
Punt Return Yards-- 89, Sproles, Phil. at NY-J, 9/27, (3-89, 2 fc, 1 td)
Punt Returns-- 5, (4 times in Non-Overtime Games)
Longest Punt Return-- 89, Sproles, Phil. at NY-J, 9/27, td
Interceptions-- 2, Alford, Atl. vs. Wash., 10/11 (OT), (2-76, 1 td)
Interceptions-- 2, (4 times in Non-Overtime Games)
Longest Interception Return-- 91, Greenway, Minn. vs. S.D., 9/27, td
Sacks-- 3.0, (3 times in Non-Overtime Games)
Scrimmage Yards-- 197, Freeman, Atl. vs. Wash., 10/11 (OT), (Rush 27-153, Rec 7-44)
Scrimmage Yards-- 196, Jo. Brown, Ariz. at Pitt., 10/18, (Rush 0-0, Rec 10-196)
Longest Punt-- 73, Ryan, Sea. at St.L., 9/13 (OT)
Longest Punt-- 72, O'Donnell, Chi. at Sea., 9/27
Punts-- 10, O'Donnell, Chi. at Sea., 9/27, (10-477, 47.7)
Field Goals Made-- 5, Catanzaro, Ariz. vs. St.L., 10/4, (5-5, 42 lg)
Longest Field Goal-- 58, Brindza, T.B. at Hou., 9/27
WEEK 6 / THROUGH MONDAY, OCTOBER 19, 2015
NFL / SINGLE-GAME HIGHS / PLAYERS
Most Points-- 21, Santos, K.C. at Cin., 10/4, (0 td, 7 fg, 0 xp, 0 2pt)
Passing Yards-- 503, Rivers, S.D. at G.B., 10/18, (43-65, 503, 2 td, 0 int)
Longest Pass-- 88, L. Jones, Pitt. vs. Ariz., 10/18, (to Bryant, Martavis, td)
Passing Touchdowns-- 5, A. Rodgers, G.B. vs. K.C., 9/28, (24-35, 333, 5 td, 0 int)
Rushing Yards-- 169, Rawls, Sea. at Cin., 10/11 (OT), (23-169, 1 td)
Rushing Yards-- 168, Hyde, S.F. vs. Minn., 9/14, (26-168, 2 td)
Rushing Attempts-- 31, Blue, Hou. vs. T.B., 9/27, (31-139, 1 td)
Longest Rush-- 72, Hillman, Denv. vs. Minn., 10/4, td
Receptions-- 15, K. Allen, S.D. vs. Det., 9/13, (15-166, 0 td)
Receiving Yards-- 227, Green, Cin. at Balt., 9/27, (10-227, 2 td)
Kickoff Return Yards-- 158, Ross, Wash. at NY-G, 9/24, (4-158, 1 td)
Kickoff Returns-- 6, D. Johnson, Ariz. at Pitt., 10/18, (6-136, 0 td)
Longest Kickoff Return-- 108, D. Johnson, Ariz. at Chi., 9/20, td
Punt Return Yards-- 154, Benjamin, Clev. vs. Tenn., 9/20, (6-154, 0 fc, 1 td)
Punt Returns-- 7, Kerley, NY-J vs. Phil., 9/27, (7-69, 2 fc, 0 td)
Longest Punt Return-- 89, Sproles, Phil. at NY-J, 9/27, td
Interceptions-- 2, Alford, Atl. vs. Wash., 10/11 (OT), (2-76, 1 td)
Interceptions-- 2, Dansby, Clev. vs. Denv., 10/18 (OT), (2-41, 1 td)
Interceptions-- 2, (9 times in Non-Overtime Games)
Longest Interception Return-- 91, Greenway, Minn. vs. S.D., 9/27, td
Sacks-- 4.0, Wake, Miami at Tenn., 10/18
Scrimmage Yards-- 227, Green, Cin. at Balt., 9/27, (Rush 0-0, Rec 10-227)
Longest Punt-- 79, Berry, Pitt. vs. Ariz., 10/18
Punts-- 10, O'Donnell, Chi. at Sea., 9/27, (10-477, 47.7)
Field Goals Made-- 7, Santos, K.C. at Cin., 10/4, (7-7, 51 lg)
Longest Field Goal-- 58, Myers, Jax vs. Miami, 9/20
Longest Field Goal-- 58, Brindza, T.B. at Hou., 9/27
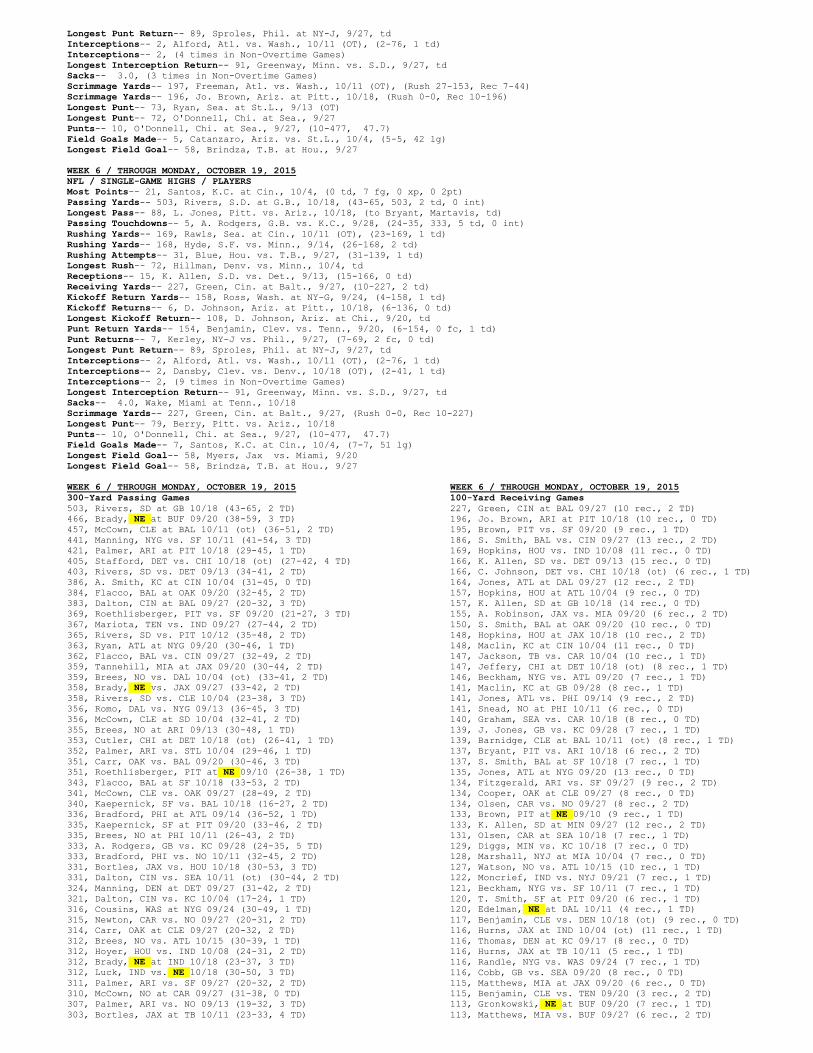
WEEK 6 / THROUGH MONDAY, OCTOBER 19, 2015
300-Yard Passing Games
503, Rivers, SD at GB 10/18 (43-65, 2 TD)
466, Brady, NE at BUF 09/20 (38-59, 3 TD)
457, McCown, CLE at BAL 10/11 (ot) (36-51, 2 TD)
441, Manning, NYG vs. SF 10/11 (41-54, 3 TD)
421, Palmer, ARI at PIT 10/18 (29-45, 1 TD)
405, Stafford, DET vs. CHI 10/18 (ot) (27-42, 4 TD)
403, Rivers, SD vs. DET 09/13 (34-41, 2 TD)
386, A. Smith, KC at CIN 10/04 (31-45, 0 TD)
384, Flacco, BAL at OAK 09/20 (32-45, 2 TD)
383, Dalton, CIN at BAL 09/27 (20-32, 3 TD)
369, Roethlisberger, PIT vs. SF 09/20 (21-27, 3 TD)
367, Mariota, TEN vs. IND 09/27 (27-44, 2 TD)
365, Rivers, SD vs. PIT 10/12 (35-48, 2 TD)
363, Ryan, ATL at NYG 09/20 (30-46, 1 TD)
362, Flacco, BAL vs. CIN 09/27 (32-49, 2 TD)
359, Tannehill, MIA at JAX 09/20 (30-44, 2 TD)
359, Brees, NO vs. DAL 10/04 (ot) (33-41, 2 TD)
358, Brady, NE vs. JAX 09/27 (33-42, 2 TD)
358, Rivers, SD vs. CLE 10/04 (23-38, 3 TD)
356, Romo, DAL vs. NYG 09/13 (36-45, 3 TD)
356, McCown, CLE at SD 10/04 (32-41, 2 TD)
355, Brees, NO at ARI 09/13 (30-48, 1 TD)
353, Cutler, CHI at DET 10/18 (ot) (26-41, 1 TD)
352, Palmer, ARI vs. STL 10/04 (29-46, 1 TD)
351, Carr, OAK vs. BAL 09/20 (30-46, 3 TD)
351, Roethlisberger, PIT at NE 09/10 (26-38, 1 TD)
343, Flacco, BAL at SF 10/18 (33-53, 2 TD)
341, McCown, CLE vs. OAK 09/27 (28-49, 2 TD)
340, Kaepernick, SF vs. BAL 10/18 (16-27, 2 TD)
336, Bradford, PHI at ATL 09/14 (36-52, 1 TD)
335, Kaepernick, SF at PIT 09/20 (33-46, 2 TD)
335, Brees, NO at PHI 10/11 (26-43, 2 TD)
333, A. Rodgers, GB vs. KC 09/28 (24-35, 5 TD)
333, Bradford, PHI vs. NO 10/11 (32-45, 2 TD)
331, Bortles, JAX vs. HOU 10/18 (30-53, 3 TD)
331, Dalton, CIN vs. SEA 10/11 (ot) (30-44, 2 TD)
324, Manning, DEN at DET 09/27 (31-42, 2 TD)
321, Dalton, CIN vs. KC 10/04 (17-24, 1 TD)
316, Cousins, WAS at NYG 09/24 (30-49, 1 TD)
315, Newton, CAR vs. NO 09/27 (20-31, 2 TD)
314, Carr, OAK at CLE 09/27 (20-32, 2 TD)
312, Brees, NO vs. ATL 10/15 (30-39, 1 TD)
312, Hoyer, HOU vs. IND 10/08 (24-31, 2 TD)
312, Brady, NE at IND 10/18 (23-37, 3 TD)
312, Luck, IND vs. NE 10/18 (30-50, 3 TD)
311, Palmer, ARI vs. SF 09/27 (20-32, 2 TD)
310, McCown, NO at CAR 09/27 (31-38, 0 TD)
307, Palmer, ARI vs. NO 09/13 (19-32, 3 TD)
303, Bortles, JAX at TB 10/11 (23-33, 4 TD)
WEEK 6 / THROUGH MONDAY, OCTOBER 19, 2015
100-Yard Receiving Games
227, Green, CIN at BAL 09/27 (10 rec., 2 TD)
196, Jo. Brown, ARI at PIT 10/18 (10 rec., 0 TD)
195, Brown, PIT vs. SF 09/20 (9 rec., 1 TD)
186, S. Smith, BAL vs. CIN 09/27 (13 rec., 2 TD)
169, Hopkins, HOU vs. IND 10/08 (11 rec., 0 TD)
166, K. Allen, SD vs. DET 09/13 (15 rec., 0 TD)
166, C. Johnson, DET vs. CHI 10/18 (ot) (6 rec., 1 TD)
164, Jones, ATL at DAL 09/27 (12 rec., 2 TD)
157, Hopkins, HOU at ATL 10/04 (9 rec., 0 TD)
157, K. Allen, SD at GB 10/18 (14 rec., 0 TD)
155, A. Robinson, JAX vs. MIA 09/20 (6 rec., 2 TD)
150, S. Smith, BAL at OAK 09/20 (10 rec., 0 TD)
148, Hopkins, HOU at JAX 10/18 (10 rec., 2 TD)
148, Maclin, KC at CIN 10/04 (11 rec., 0 TD)
147, Jackson, TB vs. CAR 10/04 (10 rec., 1 TD)
147, Jeffery, CHI at DET 10/18 (ot) (8 rec., 1 TD)
146, Beckham, NYG vs. ATL 09/20 (7 rec., 1 TD)
141, Maclin, KC at GB 09/28 (8 rec., 1 TD)
141, Jones, ATL vs. PHI 09/14 (9 rec., 2 TD)
141, Snead, NO at PHI 10/11 (6 rec., 0 TD)
140, Graham, SEA vs. CAR 10/18 (8 rec., 0 TD)
139, J. Jones, GB vs. KC 09/28 (7 rec., 1 TD)
139, Barnidge, CLE at BAL 10/11 (ot) (8 rec., 1 TD)
137, Bryant, PIT vs. ARI 10/18 (6 rec., 2 TD)
137, S. Smith, BAL at SF 10/18 (7 rec., 1 TD)
135, Jones, ATL at NYG 09/20 (13 rec., 0 TD)
134, Fitzgerald, ARI vs. SF 09/27 (9 rec., 2 TD)
134, Cooper, OAK at CLE 09/27 (8 rec., 0 TD)
134, Olsen, CAR vs. NO 09/27 (8 rec., 2 TD)
133, Brown, PIT at NE 09/10 (9 rec., 1 TD)
133, K. Allen, SD at MIN 09/27 (12 rec., 2 TD)
131, Olsen, CAR at SEA 10/18 (7 rec., 1 TD)
129, Diggs, MIN vs. KC 10/18 (7 rec., 0 TD)
128, Marshall, NYJ at MIA 10/04 (7 rec., 0 TD)
127, Watson, NO vs. ATL 10/15 (10 rec., 1 TD)
122, Moncrief, IND vs. NYJ 09/21 (7 rec., 1 TD)
121, Beckham, NYG vs. SF 10/11 (7 rec., 1 TD)
120, T. Smith, SF at PIT 09/20 (6 rec., 1 TD)
120, Edelman, NE at DAL 10/11 (4 rec., 1 TD)
117, Benjamin, CLE vs. DEN 10/18 (ot) (9 rec., 0 TD)
116, Hurns, JAX at IND 10/04 (ot) (11 rec., 1 TD)
116, Thomas, DEN at KC 09/17 (8 rec., 0 TD)
116, Hurns, JAX at TB 10/11 (5 rec., 1 TD)
116, Randle, NYG vs. WAS 09/24 (7 rec., 1 TD)
116, Cobb, GB vs. SEA 09/20 (8 rec., 0 TD)
115, Matthews, MIA at JAX 09/20 (6 rec., 0 TD)
115, Benjamin, CLE vs. TEN 09/20 (3 rec., 2 TD)
113, Gronkowski, NE at BUF 09/20 (7 rec., 1 TD)
113, Matthews, MIA vs. BUF 09/27 (6 rec., 2 TD)
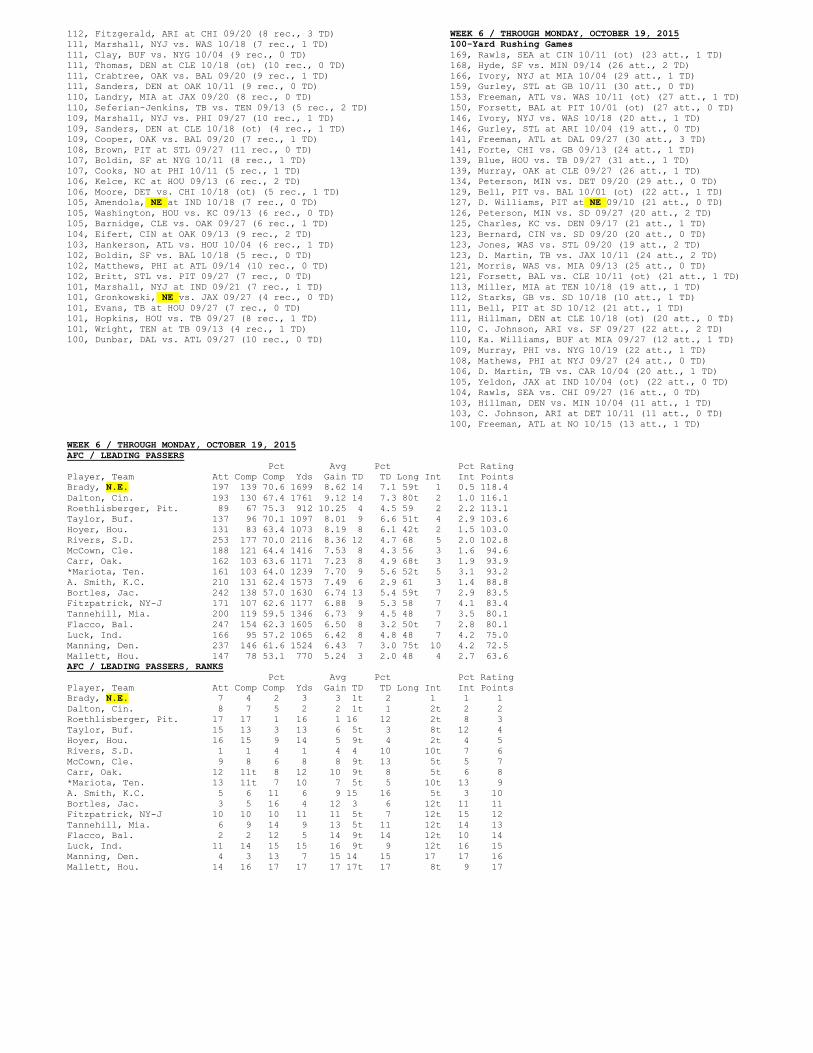
112, Fitzgerald, ARI at CHI 09/20 (8 rec., 3 TD)
111, Marshall, NYJ vs. WAS 10/18 (7 rec., 1 TD)
111, Clay, BUF vs. NYG 10/04 (9 rec., 0 TD)
111, Thomas, DEN at CLE 10/18 (ot) (10 rec., 0 TD)
111, Crabtree, OAK vs. BAL 09/20 (9 rec., 1 TD)
111, Sanders, DEN at OAK 10/11 (9 rec., 0 TD)
110, Landry, MIA at JAX 09/20 (8 rec., 0 TD)
110, Seferian-Jenkins, TB vs. TEN 09/13 (5 rec., 2 TD)
109, Marshall, NYJ vs. PHI 09/27 (10 rec., 1 TD)
109, Sanders, DEN at CLE 10/18 (ot) (4 rec., 1 TD)
109, Cooper, OAK vs. BAL 09/20 (7 rec., 1 TD)
108, Brown, PIT at STL 09/27 (11 rec., 0 TD)
107, Boldin, SF at NYG 10/11 (8 rec., 1 TD)
107, Cooks, NO at PHI 10/11 (5 rec., 1 TD)
106, Kelce, KC at HOU 09/13 (6 rec., 2 TD)
106, Moore, DET vs. CHI 10/18 (ot) (5 rec., 1 TD)
105, Amendola, NE at IND 10/18 (7 rec., 0 TD)
105, Washington, HOU vs. KC 09/13 (6 rec., 0 TD)
105, Barnidge, CLE vs. OAK 09/27 (6 rec., 1 TD)
104, Eifert, CIN at OAK 09/13 (9 rec., 2 TD)
103, Hankerson, ATL vs. HOU 10/04 (6 rec., 1 TD)
102, Boldin, SF vs. BAL 10/18 (5 rec., 0 TD)
102, Matthews, PHI at ATL 09/14 (10 rec., 0 TD)
102, Britt, STL vs. PIT 09/27 (7 rec., 0 TD)
101, Marshall, NYJ at IND 09/21 (7 rec., 1 TD)
101, Gronkowski, NE vs. JAX 09/27 (4 rec., 0 TD)
101, Evans, TB at HOU 09/27 (7 rec., 0 TD)
101, Hopkins, HOU vs. TB 09/27 (8 rec., 1 TD)
101, Wright, TEN at TB 09/13 (4 rec., 1 TD)
100, Dunbar, DAL vs. ATL 09/27 (10 rec., 0 TD)
WEEK 6 / THROUGH MONDAY, OCTOBER 19, 2015
100-Yard Rushing Games
169, Rawls, SEA at CIN 10/11 (ot) (23 att., 1 TD)
168, Hyde, SF vs. MIN 09/14 (26 att., 2 TD)
166, Ivory, NYJ at MIA 10/04 (29 att., 1 TD)
159, Gurley, STL at GB 10/11 (30 att., 0 TD)
153, Freeman, ATL vs. WAS 10/11 (ot) (27 att., 1 TD)
150, Forsett, BAL at PIT 10/01 (ot) (27 att., 0 TD)
146, Ivory, NYJ vs. WAS 10/18 (20 att., 1 TD)
146, Gurley, STL at ARI 10/04 (19 att., 0 TD)
141, Freeman, ATL at DAL 09/27 (30 att., 3 TD)
141, Forte, CHI vs. GB 09/13 (24 att., 1 TD)
139, Blue, HOU vs. TB 09/27 (31 att., 1 TD)
139, Murray, OAK at CLE 09/27 (26 att., 1 TD)
134, Peterson, MIN vs. DET 09/20 (29 att., 0 TD)
129, Bell, PIT vs. BAL 10/01 (ot) (22 att., 1 TD)
127, D. Williams, PIT at NE 09/10 (21 att., 0 TD)
126, Peterson, MIN vs. SD 09/27 (20 att., 2 TD)
125, Charles, KC vs. DEN 09/17 (21 att., 1 TD)
123, Bernard, CIN vs. SD 09/20 (20 att., 0 TD)
123, Jones, WAS vs. STL 09/20 (19 att., 2 TD)
123, D. Martin, TB vs. JAX 10/11 (24 att., 2 TD)
121, Morris, WAS vs. MIA 09/13 (25 att., 0 TD)
121, Forsett, BAL vs. CLE 10/11 (ot) (21 att., 1 TD)
113, Miller, MIA at TEN 10/18 (19 att., 1 TD)
112, Starks, GB vs. SD 10/18 (10 att., 1 TD)
111, Bell, PIT at SD 10/12 (21 att., 1 TD)
111, Hillman, DEN at CLE 10/18 (ot) (20 att., 0 TD)
110, C. Johnson, ARI vs. SF 09/27 (22 att., 2 TD)
110, Ka. Williams, BUF at MIA 09/27 (12 att., 1 TD)
109, Murray, PHI vs. NYG 10/19 (22 att., 1 TD)
108, Mathews, PHI at NYJ 09/27 (24 att., 0 TD)
106, D. Martin, TB vs. CAR 10/04 (20 att., 1 TD)
105, Yeldon, JAX at IND 10/04 (ot) (22 att., 0 TD)
104, Rawls, SEA vs. CHI 09/27 (16 att., 0 TD)
103, Hillman, DEN vs. MIN 10/04 (11 att., 1 TD)
103, C. Johnson, ARI at DET 10/11 (11 att., 0 TD)
100, Freeman, ATL at NO 10/15 (13 att., 1 TD)
WEEK 6 / THROUGH MONDAY, OCTOBER 19, 2015
AFC / LEADING PASSERS
Pct Avg Pct Pct Rating
Player, Team Att Comp Comp Yds Gain TD TD Long Int Int Points
Brady, N.E. 197 139 70.6 1699 8.62 14 7.1 59t 1 0.5 118.4
Dalton, Cin. 193 130 67.4 1761 9.12 14 7.3 80t 2 1.0 116.1
Roethlisberger, Pit. 89 67 75.3 912 10.25 4 4.5 59 2 2.2 113.1
Taylor, Buf. 137 96 70.1 1097 8.01 9 6.6 51t 4 2.9 103.6
Hoyer, Hou. 131 83 63.4 1073 8.19 8 6.1 42t 2 1.5 103.0
Rivers, S.D. 253 177 70.0 2116 8.36 12 4.7 68 5 2.0 102.8
McCown, Cle. 188 121 64.4 1416 7.53 8 4.3 56 3 1.6 94.6
Carr, Oak. 162 103 63.6 1171 7.23 8 4.9 68t 3 1.9 93.9
*Mariota, Ten. 161 103 64.0 1239 7.70 9 5.6 52t 5 3.1 93.2
A. Smith, K.C. 210 131 62.4 1573 7.49 6 2.9 61 3 1.4 88.8
Bortles, Jac. 242 138 57.0 1630 6.74 13 5.4 59t 7 2.9 83.5
Fitzpatrick, NY-J 171 107 62.6 1177 6.88 9 5.3 58 7 4.1 83.4
Tannehill, Mia. 200 119 59.5 1346 6.73 9 4.5 48 7 3.5 80.1
Flacco, Bal. 247 154 62.3 1605 6.50 8 3.2 50t 7 2.8 80.1
Luck, Ind. 166 95 57.2 1065 6.42 8 4.8 48 7 4.2 75.0
Manning, Den. 237 146 61.6 1524 6.43 7 3.0 75t 10 4.2 72.5
Mallett, Hou. 147 78 53.1 770 5.24 3 2.0 48 4 2.7 63.6
AFC / LEADING PASSERS, RANKS
Pct Avg Pct Pct Rating
Player, Team Att Comp Comp Yds Gain TD TD Long Int Int Points
Brady, N.E. 7 4 2 3 3 1t 2 1 1 1
Dalton, Cin. 8 7 5 2 2 1t 1 2t 2 2
Roethlisberger, Pit. 17 17 1 16 1 16 12 2t 8 3
Taylor, Buf. 15 13 3 13 6 5t 3 8t 12 4
Hoyer, Hou. 16 15 9 14 5 9t 4 2t 4 5
Rivers, S.D. 1 1 4 1 4 4 10 10t 7 6
McCown, Cle. 9 8 6 8 8 9t 13 5t 5 7
Carr, Oak. 12 11t 8 12 10 9t 8 5t 6 8
*Mariota, Ten. 13 11t 7 10 7 5t 5 10t 13 9
A. Smith, K.C. 5 6 11 6 9 15 16 5t 3 10
Bortles, Jac. 3 5 16 4 12 3 6 12t 11 11
Fitzpatrick, NY-J 10 10 10 11 11 5t 7 12t 15 12
Tannehill, Mia. 6 9 14 9 13 5t 11 12t 14 13
Flacco, Bal. 2 2 12 5 14 9t 14 12t 10 14
Luck, Ind. 11 14 15 15 16 9t 9 12t 16 15
Manning, Den. 4 3 13 7 15 14 15 17 17 16
Mallett, Hou. 14 16 17 17 17 17t 17 8t 9 17
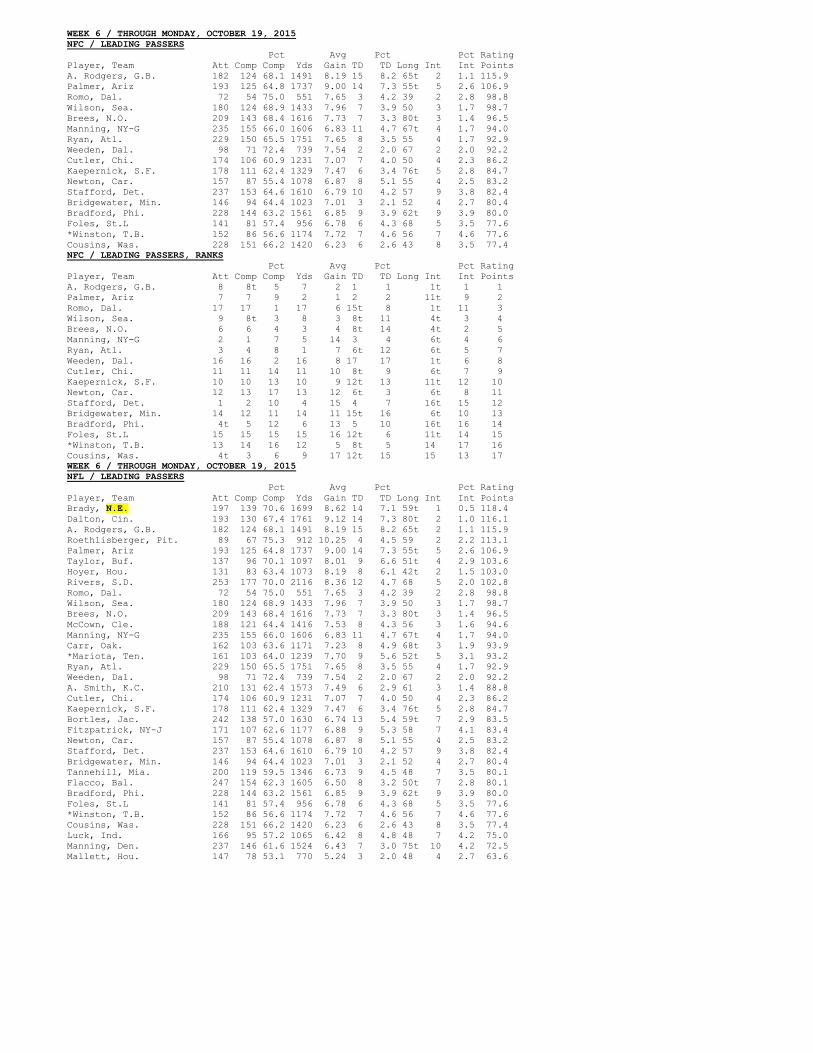
WEEK 6 / THROUGH MONDAY, OCTOBER 19, 2015
NFC / LEADING PASSERS
Pct Avg Pct Pct Rating
Player, Team Att Comp Comp Yds Gain TD TD Long Int Int Points
A. Rodgers, G.B. 182 124 68.1 1491 8.19 15 8.2 65t 2 1.1 115.9
Palmer, Ariz 193 125 64.8 1737 9.00 14 7.3 55t 5 2.6 106.9
Romo, Dal. 72 54 75.0 551 7.65 3 4.2 39 2 2.8 98.8
Wilson, Sea. 180 124 68.9 1433 7.96 7 3.9 50 3 1.7 98.7
Brees, N.O. 209 143 68.4 1616 7.73 7 3.3 80t 3 1.4 96.5
Manning, NY-G 235 155 66.0 1606 6.83 11 4.7 67t 4 1.7 94.0
Ryan, Atl. 229 150 65.5 1751 7.65 8 3.5 55 4 1.7 92.9
Weeden, Dal. 98 71 72.4 739 7.54 2 2.0 67 2 2.0 92.2
Cutler, Chi. 174 106 60.9 1231 7.07 7 4.0 50 4 2.3 86.2
Kaepernick, S.F. 178 111 62.4 1329 7.47 6 3.4 76t 5 2.8 84.7
Newton, Car. 157 87 55.4 1078 6.87 8 5.1 55 4 2.5 83.2
Stafford, Det. 237 153 64.6 1610 6.79 10 4.2 57 9 3.8 82.4
Bridgewater, Min. 146 94 64.4 1023 7.01 3 2.1 52 4 2.7 80.4
Bradford, Phi. 228 144 63.2 1561 6.85 9 3.9 62t 9 3.9 80.0
Foles, St.L 141 81 57.4 956 6.78 6 4.3 68 5 3.5 77.6
*Winston, T.B. 152 86 56.6 1174 7.72 7 4.6 56 7 4.6 77.6
Cousins, Was. 228 151 66.2 1420 6.23 6 2.6 43 8 3.5 77.4
NFC / LEADING PASSERS, RANKS
Pct Avg Pct Pct Rating
Player, Team Att Comp Comp Yds Gain TD TD Long Int Int Points
A. Rodgers, G.B. 8 8t 5 7 2 1 1 1t 1 1
Palmer, Ariz 7 7 9 2 1 2 2 11t 9 2
Romo, Dal. 17 17 1 17 6 15t 8 1t 11 3
Wilson, Sea. 9 8t 3 8 3 8t 11 4t 3 4
Brees, N.O. 6 6 4 3 4 8t 14 4t 2 5
Manning, NY-G 2 1 7 5 14 3 4 6t 4 6
Ryan, Atl. 3 4 8 1 7 6t 12 6t 5 7
Weeden, Dal. 16 16 2 16 8 17 17 1t 6 8
Cutler, Chi. 11 11 14 11 10 8t 9 6t 7 9
Kaepernick, S.F. 10 10 13 10 9 12t 13 11t 12 10
Newton, Car. 12 13 17 13 12 6t 3 6t 8 11
Stafford, Det. 1 2 10 4 15 4 7 16t 15 12
Bridgewater, Min. 14 12 11 14 11 15t 16 6t 10 13
Bradford, Phi. 4t 5 12 6 13 5 10 16t 16 14
Foles, St.L 15 15 15 15 16 12t 6 11t 14 15
*Winston, T.B. 13 14 16 12 5 8t 5 14 17 16
Cousins, Was. 4t 3 6 9 17 12t 15 15 13 17
WEEK 6 / THROUGH MONDAY, OCTOBER 19, 2015
NFL / LEADING PASSERS
Pct Avg Pct Pct Rating
Player, Team Att Comp Comp Yds Gain TD TD Long Int Int Points
Brady, N.E. 197 139 70.6 1699 8.62 14 7.1 59t 1 0.5 118.4
Dalton, Cin. 193 130 67.4 1761 9.12 14 7.3 80t 2 1.0 116.1
A. Rodgers, G.B. 182 124 68.1 1491 8.19 15 8.2 65t 2 1.1 115.9
Roethlisberger, Pit. 89 67 75.3 912 10.25 4 4.5 59 2 2.2 113.1
Palmer, Ariz 193 125 64.8 1737 9.00 14 7.3 55t 5 2.6 106.9
Taylor, Buf. 137 96 70.1 1097 8.01 9 6.6 51t 4 2.9 103.6
Hoyer, Hou. 131 83 63.4 1073 8.19 8 6.1 42t 2 1.5 103.0
Rivers, S.D. 253 177 70.0 2116 8.36 12 4.7 68 5 2.0 102.8
Romo, Dal. 72 54 75.0 551 7.65 3 4.2 39 2 2.8 98.8
Wilson, Sea. 180 124 68.9 1433 7.96 7 3.9 50 3 1.7 98.7
Brees, N.O. 209 143 68.4 1616 7.73 7 3.3 80t 3 1.4 96.5
McCown, Cle. 188 121 64.4 1416 7.53 8 4.3 56 3 1.6 94.6
Manning, NY-G 235 155 66.0 1606 6.83 11 4.7 67t 4 1.7 94.0
Carr, Oak. 162 103 63.6 1171 7.23 8 4.9 68t 3 1.9 93.9
*Mariota, Ten. 161 103 64.0 1239 7.70 9 5.6 52t 5 3.1 93.2
Ryan, Atl. 229 150 65.5 1751 7.65 8 3.5 55 4 1.7 92.9
Weeden, Dal. 98 71 72.4 739 7.54 2 2.0 67 2 2.0 92.2
A. Smith, K.C. 210 131 62.4 1573 7.49 6 2.9 61 3 1.4 88.8
Cutler, Chi. 174 106 60.9 1231 7.07 7 4.0 50 4 2.3 86.2
Kaepernick, S.F. 178 111 62.4 1329 7.47 6 3.4 76t 5 2.8 84.7
Bortles, Jac. 242 138 57.0 1630 6.74 13 5.4 59t 7 2.9 83.5
Fitzpatrick, NY-J 171 107 62.6 1177 6.88 9 5.3 58 7 4.1 83.4
Newton, Car. 157 87 55.4 1078 6.87 8 5.1 55 4 2.5 83.2
Stafford, Det. 237 153 64.6 1610 6.79 10 4.2 57 9 3.8 82.4
Bridgewater, Min. 146 94 64.4 1023 7.01 3 2.1 52 4 2.7 80.4
Tannehill, Mia. 200 119 59.5 1346 6.73 9 4.5 48 7 3.5 80.1
Flacco, Bal. 247 154 62.3 1605 6.50 8 3.2 50t 7 2.8 80.1
Bradford, Phi. 228 144 63.2 1561 6.85 9 3.9 62t 9 3.9 80.0
Foles, St.L 141 81 57.4 956 6.78 6 4.3 68 5 3.5 77.6
*Winston, T.B. 152 86 56.6 1174 7.72 7 4.6 56 7 4.6 77.6
Cousins, Was. 228 151 66.2 1420 6.23 6 2.6 43 8 3.5 77.4
Luck, Ind. 166 95 57.2 1065 6.42 8 4.8 48 7 4.2 75.0
Manning, Den. 237 146 61.6 1524 6.43 7 3.0 75t 10 4.2 72.5
Mallett, Hou. 147 78 53.1 770 5.24 3 2.0 48 4 2.7 63.6
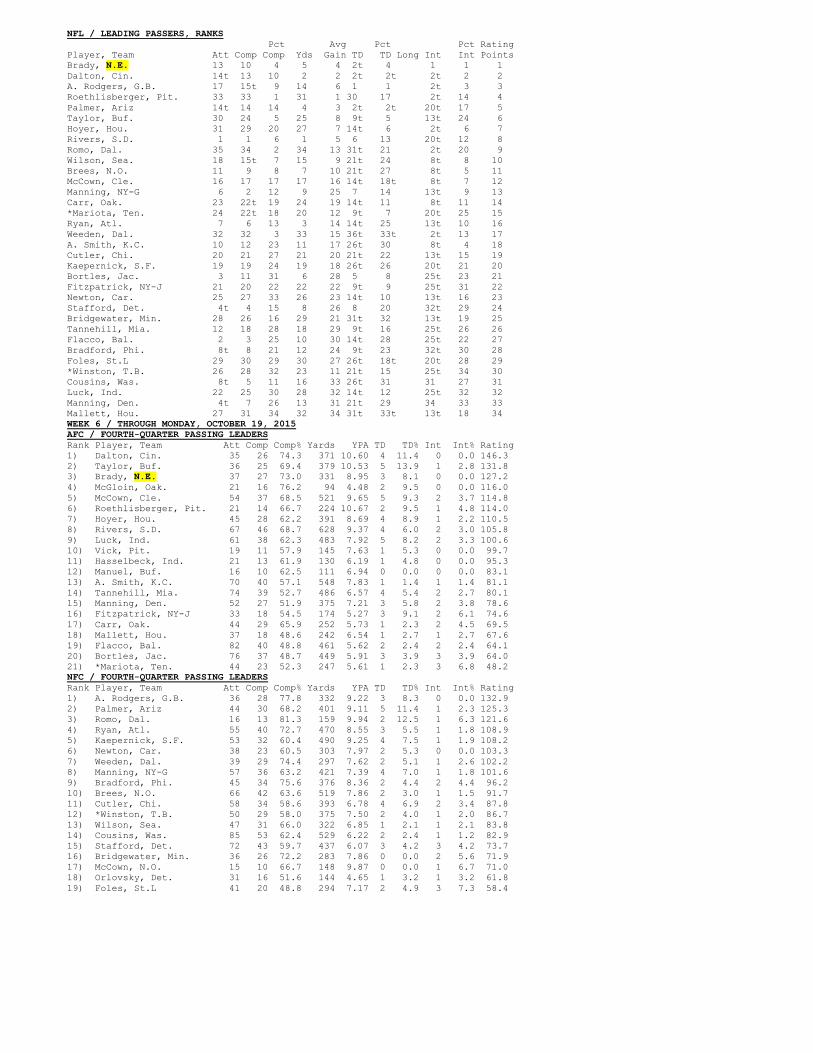
NFL / LEADING PASSERS, RANKS
Pct Avg Pct Pct Rating
Player, Team Att Comp Comp Yds Gain TD TD Long Int Int Points
Brady, N.E. 13 10 4 5 4 2t 4 1 1 1
Dalton, Cin. 14t 13 10 2 2 2t 2t 2t 2 2
A. Rodgers, G.B. 17 15t 9 14 6 1 1 2t 3 3
Roethlisberger, Pit. 33 33 1 31 1 30 17 2t 14 4
Palmer, Ariz 14t 14 14 4 3 2t 2t 20t 17 5
Taylor, Buf. 30 24 5 25 8 9t 5 13t 24 6
Hoyer, Hou. 31 29 20 27 7 14t 6 2t 6 7
Rivers, S.D. 1 1 6 1 5 6 13 20t 12 8
Romo, Dal. 35 34 2 34 13 31t 21 2t 20 9
Wilson, Sea. 18 15t 7 15 9 21t 24 8t 8 10
Brees, N.O. 11 9 8 7 10 21t 27 8t 5 11
McCown, Cle. 16 17 17 17 16 14t 18t 8t 7 12
Manning, NY-G 6 2 12 9 25 7 14 13t 9 13
Carr, Oak. 23 22t 19 24 19 14t 11 8t 11 14
*Mariota, Ten. 24 22t 18 20 12 9t 7 20t 25 15
Ryan, Atl. 7 6 13 3 14 14t 25 13t 10 16
Weeden, Dal. 32 32 3 33 15 36t 33t 2t 13 17
A. Smith, K.C. 10 12 23 11 17 26t 30 8t 4 18
Cutler, Chi. 20 21 27 21 20 21t 22 13t 15 19
Kaepernick, S.F. 19 19 24 19 18 26t 26 20t 21 20
Bortles, Jac. 3 11 31 6 28 5 8 25t 23 21
Fitzpatrick, NY-J 21 20 22 22 22 9t 9 25t 31 22
Newton, Car. 25 27 33 26 23 14t 10 13t 16 23
Stafford, Det. 4t 4 15 8 26 8 20 32t 29 24
Bridgewater, Min. 28 26 16 29 21 31t 32 13t 19 25
Tannehill, Mia. 12 18 28 18 29 9t 16 25t 26 26
Flacco, Bal. 2 3 25 10 30 14t 28 25t 22 27
Bradford, Phi. 8t 8 21 12 24 9t 23 32t 30 28
Foles, St.L 29 30 29 30 27 26t 18t 20t 28 29
*Winston, T.B. 26 28 32 23 11 21t 15 25t 34 30
Cousins, Was. 8t 5 11 16 33 26t 31 31 27 31
Luck, Ind. 22 25 30 28 32 14t 12 25t 32 32
Manning, Den. 4t 7 26 13 31 21t 29 34 33 33
Mallett, Hou. 27 31 34 32 34 31t 33t 13t 18 34
WEEK 6 / THROUGH MONDAY, OCTOBER 19, 2015
AFC / FOURTH-QUARTER PASSING LEADERS
Rank Player, Team Att Comp Comp% Yards YPA TD TD% Int Int% Rating
1) Dalton, Cin. 35 26 74.3 371 10.60 4 11.4 0 0.0 146.3
2) Taylor, Buf. 36 25 69.4 379 10.53 5 13.9 1 2.8 131.8
3) Brady, N.E. 37 27 73.0 331 8.95 3 8.1 0 0.0 127.2
4) McGloin, Oak. 21 16 76.2 94 4.48 2 9.5 0 0.0 116.0
5) McCown, Cle. 54 37 68.5 521 9.65 5 9.3 2 3.7 114.8
6) Roethlisberger, Pit. 21 14 66.7 224 10.67 2 9.5 1 4.8 114.0
7) Hoyer, Hou. 45 28 62.2 391 8.69 4 8.9 1 2.2 110.5
8) Rivers, S.D. 67 46 68.7 628 9.37 4 6.0 2 3.0 105.8
9) Luck, Ind. 61 38 62.3 483 7.92 5 8.2 2 3.3 100.6
10) Vick, Pit. 19 11 57.9 145 7.63 1 5.3 0 0.0 99.7
11) Hasselbeck, Ind. 21 13 61.9 130 6.19 1 4.8 0 0.0 95.3
12) Manuel, Buf. 16 10 62.5 111 6.94 0 0.0 0 0.0 83.1
13) A. Smith, K.C. 70 40 57.1 548 7.83 1 1.4 1 1.4 81.1
14) Tannehill, Mia. 74 39 52.7 486 6.57 4 5.4 2 2.7 80.1
15) Manning, Den. 52 27 51.9 375 7.21 3 5.8 2 3.8 78.6
16) Fitzpatrick, NY-J 33 18 54.5 174 5.27 3 9.1 2 6.1 74.6
17) Carr, Oak. 44 29 65.9 252 5.73 1 2.3 2 4.5 69.5
18) Mallett, Hou. 37 18 48.6 242 6.54 1 2.7 1 2.7 67.6
19) Flacco, Bal. 82 40 48.8 461 5.62 2 2.4 2 2.4 64.1
20) Bortles, Jac. 76 37 48.7 449 5.91 3 3.9 3 3.9 64.0
21) *Mariota, Ten. 44 23 52.3 247 5.61 1 2.3 3 6.8 48.2
NFC / FOURTH-QUARTER PASSING LEADERS
Rank Player, Team Att Comp Comp% Yards YPA TD TD% Int Int% Rating
1) A. Rodgers, G.B. 36 28 77.8 332 9.22 3 8.3 0 0.0 132.9
2) Palmer, Ariz 44 30 68.2 401 9.11 5 11.4 1 2.3 125.3
3) Romo, Dal. 16 13 81.3 159 9.94 2 12.5 1 6.3 121.6
4) Ryan, Atl. 55 40 72.7 470 8.55 3 5.5 1 1.8 108.9
5) Kaepernick, S.F. 53 32 60.4 490 9.25 4 7.5 1 1.9 108.2
6) Newton, Car. 38 23 60.5 303 7.97 2 5.3 0 0.0 103.3
7) Weeden, Dal. 39 29 74.4 297 7.62 2 5.1 1 2.6 102.2
8) Manning, NY-G 57 36 63.2 421 7.39 4 7.0 1 1.8 101.6
9) Bradford, Phi. 45 34 75.6 376 8.36 2 4.4 2 4.4 96.2
10) Brees, N.O. 66 42 63.6 519 7.86 2 3.0 1 1.5 91.7
11) Cutler, Chi. 58 34 58.6 393 6.78 4 6.9 2 3.4 87.8
12) *Winston, T.B. 50 29 58.0 375 7.50 2 4.0 1 2.0 86.7
13) Wilson, Sea. 47 31 66.0 322 6.85 1 2.1 1 2.1 83.8
14) Cousins, Was. 85 53 62.4 529 6.22 2 2.4 1 1.2 82.9
15) Stafford, Det. 72 43 59.7 437 6.07 3 4.2 3 4.2 73.7
16) Bridgewater, Min. 36 26 72.2 283 7.86 0 0.0 2 5.6 71.9
17) McCown, N.O. 15 10 66.7 148 9.87 0 0.0 1 6.7 71.0
18) Orlovsky, Det. 31 16 51.6 144 4.65 1 3.2 1 3.2 61.8
19) Foles, St.L 41 20 48.8 294 7.17 2 4.9 3 7.3 58.4
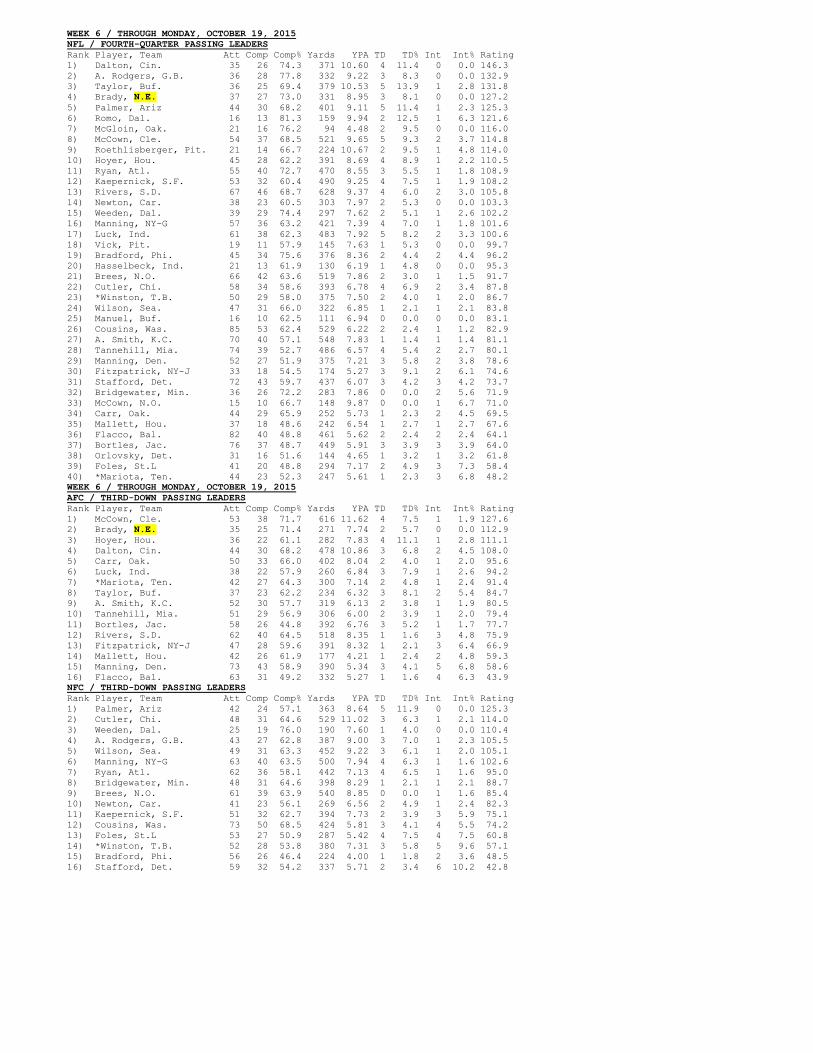
WEEK 6 / THROUGH MONDAY, OCTOBER 19, 2015
NFL / FOURTH-QUARTER PASSING LEADERS
Rank Player, Team Att Comp Comp% Yards YPA TD TD% Int Int% Rating
1) Dalton, Cin. 35 26 74.3 371 10.60 4 11.4 0 0.0 146.3
2) A. Rodgers, G.B. 36 28 77.8 332 9.22 3 8.3 0 0.0 132.9
3) Taylor, Buf. 36 25 69.4 379 10.53 5 13.9 1 2.8 131.8
4) Brady, N.E. 37 27 73.0 331 8.95 3 8.1 0 0.0 127.2
5) Palmer, Ariz 44 30 68.2 401 9.11 5 11.4 1 2.3 125.3
6) Romo, Dal. 16 13 81.3 159 9.94 2 12.5 1 6.3 121.6
7) McGloin, Oak. 21 16 76.2 94 4.48 2 9.5 0 0.0 116.0
8) McCown, Cle. 54 37 68.5 521 9.65 5 9.3 2 3.7 114.8
9) Roethlisberger, Pit. 21 14 66.7 224 10.67 2 9.5 1 4.8 114.0
10) Hoyer, Hou. 45 28 62.2 391 8.69 4 8.9 1 2.2 110.5
11) Ryan, Atl. 55 40 72.7 470 8.55 3 5.5 1 1.8 108.9
12) Kaepernick, S.F. 53 32 60.4 490 9.25 4 7.5 1 1.9 108.2
13) Rivers, S.D. 67 46 68.7 628 9.37 4 6.0 2 3.0 105.8
14) Newton, Car. 38 23 60.5 303 7.97 2 5.3 0 0.0 103.3
15) Weeden, Dal. 39 29 74.4 297 7.62 2 5.1 1 2.6 102.2
16) Manning, NY-G 57 36 63.2 421 7.39 4 7.0 1 1.8 101.6
17) Luck, Ind. 61 38 62.3 483 7.92 5 8.2 2 3.3 100.6
18) Vick, Pit. 19 11 57.9 145 7.63 1 5.3 0 0.0 99.7
19) Bradford, Phi. 45 34 75.6 376 8.36 2 4.4 2 4.4 96.2
20) Hasselbeck, Ind. 21 13 61.9 130 6.19 1 4.8 0 0.0 95.3
21) Brees, N.O. 66 42 63.6 519 7.86 2 3.0 1 1.5 91.7
22) Cutler, Chi. 58 34 58.6 393 6.78 4 6.9 2 3.4 87.8
23) *Winston, T.B. 50 29 58.0 375 7.50 2 4.0 1 2.0 86.7
24) Wilson, Sea. 47 31 66.0 322 6.85 1 2.1 1 2.1 83.8
25) Manuel, Buf. 16 10 62.5 111 6.94 0 0.0 0 0.0 83.1
26) Cousins, Was. 85 53 62.4 529 6.22 2 2.4 1 1.2 82.9
27) A. Smith, K.C. 70 40 57.1 548 7.83 1 1.4 1 1.4 81.1
28) Tannehill, Mia. 74 39 52.7 486 6.57 4 5.4 2 2.7 80.1
29) Manning, Den. 52 27 51.9 375 7.21 3 5.8 2 3.8 78.6
30) Fitzpatrick, NY-J 33 18 54.5 174 5.27 3 9.1 2 6.1 74.6
31) Stafford, Det. 72 43 59.7 437 6.07 3 4.2 3 4.2 73.7
32) Bridgewater, Min. 36 26 72.2 283 7.86 0 0.0 2 5.6 71.9
33) McCown, N.O. 15 10 66.7 148 9.87 0 0.0 1 6.7 71.0
34) Carr, Oak. 44 29 65.9 252 5.73 1 2.3 2 4.5 69.5
35) Mallett, Hou. 37 18 48.6 242 6.54 1 2.7 1 2.7 67.6
36) Flacco, Bal. 82 40 48.8 461 5.62 2 2.4 2 2.4 64.1
37) Bortles, Jac. 76 37 48.7 449 5.91 3 3.9 3 3.9 64.0
38) Orlovsky, Det. 31 16 51.6 144 4.65 1 3.2 1 3.2 61.8
39) Foles, St.L 41 20 48.8 294 7.17 2 4.9 3 7.3 58.4
40) *Mariota, Ten. 44 23 52.3 247 5.61 1 2.3 3 6.8 48.2
WEEK 6 / THROUGH MONDAY, OCTOBER 19, 2015
AFC / THIRD-DOWN PASSING LEADERS
Rank Player, Team Att Comp Comp% Yards YPA TD TD% Int Int% Rating
1) McCown, Cle. 53 38 71.7 616 11.62 4 7.5 1 1.9 127.6
2) Brady, N.E. 35 25 71.4 271 7.74 2 5.7 0 0.0 112.9
3) Hoyer, Hou. 36 22 61.1 282 7.83 4 11.1 1 2.8 111.1
4) Dalton, Cin. 44 30 68.2 478 10.86 3 6.8 2 4.5 108.0
5) Carr, Oak. 50 33 66.0 402 8.04 2 4.0 1 2.0 95.6
6) Luck, Ind. 38 22 57.9 260 6.84 3 7.9 1 2.6 94.2
7) *Mariota, Ten. 42 27 64.3 300 7.14 2 4.8 1 2.4 91.4
8) Taylor, Buf. 37 23 62.2 234 6.32 3 8.1 2 5.4 84.7
9) A. Smith, K.C. 52 30 57.7 319 6.13 2 3.8 1 1.9 80.5
10) Tannehill, Mia. 51 29 56.9 306 6.00 2 3.9 1 2.0 79.4
11) Bortles, Jac. 58 26 44.8 392 6.76 3 5.2 1 1.7 77.7
12) Rivers, S.D. 62 40 64.5 518 8.35 1 1.6 3 4.8 75.9
13) Fitzpatrick, NY-J 47 28 59.6 391 8.32 1 2.1 3 6.4 66.9
14) Mallett, Hou. 42 26 61.9 177 4.21 1 2.4 2 4.8 59.3
15) Manning, Den. 73 43 58.9 390 5.34 3 4.1 5 6.8 58.6
16) Flacco, Bal. 63 31 49.2 332 5.27 1 1.6 4 6.3 43.9
NFC / THIRD-DOWN PASSING LEADERS
Rank Player, Team Att Comp Comp% Yards YPA TD TD% Int Int% Rating
1) Palmer, Ariz 42 24 57.1 363 8.64 5 11.9 0 0.0 125.3
2) Cutler, Chi. 48 31 64.6 529 11.02 3 6.3 1 2.1 114.0
3) Weeden, Dal. 25 19 76.0 190 7.60 1 4.0 0 0.0 110.4
4) A. Rodgers, G.B. 43 27 62.8 387 9.00 3 7.0 1 2.3 105.5
5) Wilson, Sea. 49 31 63.3 452 9.22 3 6.1 1 2.0 105.1
6) Manning, NY-G 63 40 63.5 500 7.94 4 6.3 1 1.6 102.6
7) Ryan, Atl. 62 36 58.1 442 7.13 4 6.5 1 1.6 95.0
8) Bridgewater, Min. 48 31 64.6 398 8.29 1 2.1 1 2.1 88.7
9) Brees, N.O. 61 39 63.9 540 8.85 0 0.0 1 1.6 85.4
10) Newton, Car. 41 23 56.1 269 6.56 2 4.9 1 2.4 82.3
11) Kaepernick, S.F. 51 32 62.7 394 7.73 2 3.9 3 5.9 75.1
12) Cousins, Was. 73 50 68.5 424 5.81 3 4.1 4 5.5 74.2
13) Foles, St.L 53 27 50.9 287 5.42 4 7.5 4 7.5 60.8
14) *Winston, T.B. 52 28 53.8 380 7.31 3 5.8 5 9.6 57.1
15) Bradford, Phi. 56 26 46.4 224 4.00 1 1.8 2 3.6 48.5
16) Stafford, Det. 59 32 54.2 337 5.71 2 3.4 6 10.2 42.8
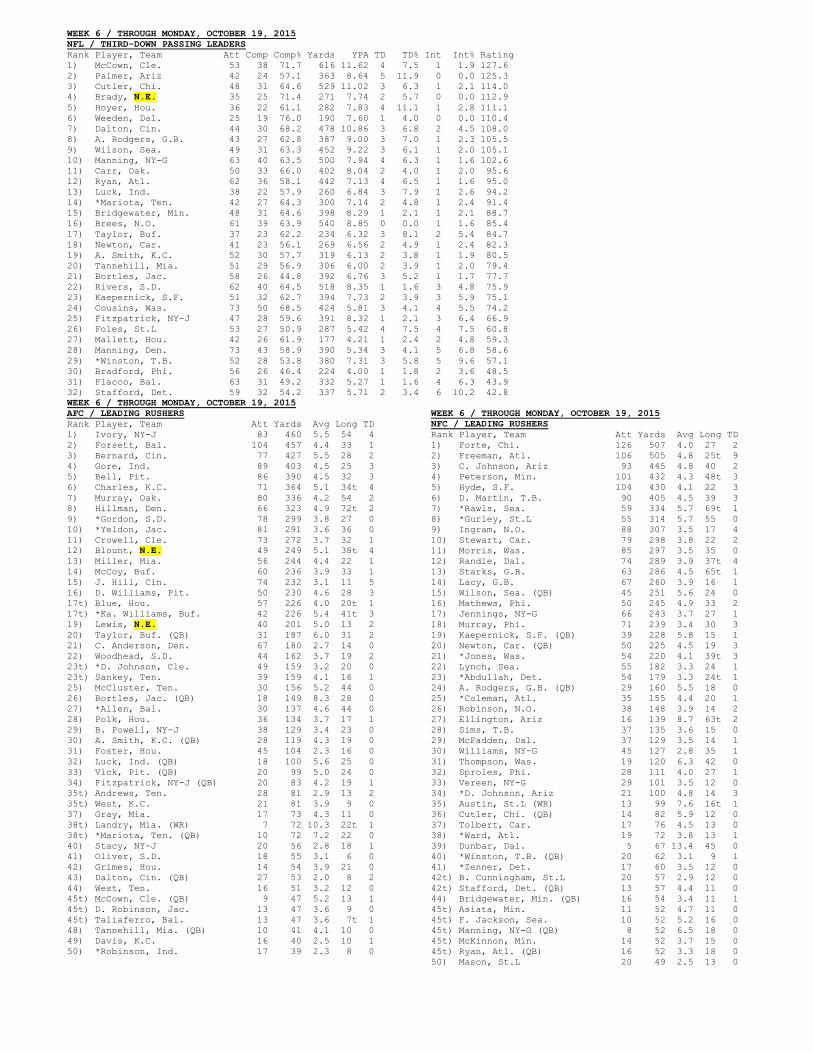
WEEK 6 / THROUGH MONDAY, OCTOBER 19, 2015
NFL / THIRD-DOWN PASSING LEADERS
Rank Player, Team Att Comp Comp% Yards YPA TD TD% Int Int% Rating
1) McCown, Cle. 53 38 71.7 616 11.62 4 7.5 1 1.9 127.6
2) Palmer, Ariz 42 24 57.1 363 8.64 5 11.9 0 0.0 125.3
3) Cutler, Chi. 48 31 64.6 529 11.02 3 6.3 1 2.1 114.0
4) Brady, N.E. 35 25 71.4 271 7.74 2 5.7 0 0.0 112.9
5) Hoyer, Hou. 36 22 61.1 282 7.83 4 11.1 1 2.8 111.1
6) Weeden, Dal. 25 19 76.0 190 7.60 1 4.0 0 0.0 110.4
7) Dalton, Cin. 44 30 68.2 478 10.86 3 6.8 2 4.5 108.0
8) A. Rodgers, G.B. 43 27 62.8 387 9.00 3 7.0 1 2.3 105.5
9) Wilson, Sea. 49 31 63.3 452 9.22 3 6.1 1 2.0 105.1
10) Manning, NY-G 63 40 63.5 500 7.94 4 6.3 1 1.6 102.6
11) Carr, Oak. 50 33 66.0 402 8.04 2 4.0 1 2.0 95.6
12) Ryan, Atl. 62 36 58.1 442 7.13 4 6.5 1 1.6 95.0
13) Luck, Ind. 38 22 57.9 260 6.84 3 7.9 1 2.6 94.2
14) *Mariota, Ten. 42 27 64.3 300 7.14 2 4.8 1 2.4 91.4
15) Bridgewater, Min. 48 31 64.6 398 8.29 1 2.1 1 2.1 88.7
16) Brees, N.O. 61 39 63.9 540 8.85 0 0.0 1 1.6 85.4
17) Taylor, Buf. 37 23 62.2 234 6.32 3 8.1 2 5.4 84.7
18) Newton, Car. 41 23 56.1 269 6.56 2 4.9 1 2.4 82.3
19) A. Smith, K.C. 52 30 57.7 319 6.13 2 3.8 1 1.9 80.5
20) Tannehill, Mia. 51 29 56.9 306 6.00 2 3.9 1 2.0 79.4
21) Bortles, Jac. 58 26 44.8 392 6.76 3 5.2 1 1.7 77.7
22) Rivers, S.D. 62 40 64.5 518 8.35 1 1.6 3 4.8 75.9
23) Kaepernick, S.F. 51 32 62.7 394 7.73 2 3.9 3 5.9 75.1
24) Cousins, Was. 73 50 68.5 424 5.81 3 4.1 4 5.5 74.2
25) Fitzpatrick, NY-J 47 28 59.6 391 8.32 1 2.1 3 6.4 66.9
26) Foles, St.L 53 27 50.9 287 5.42 4 7.5 4 7.5 60.8
27) Mallett, Hou. 42 26 61.9 177 4.21 1 2.4 2 4.8 59.3
28) Manning, Den. 73 43 58.9 390 5.34 3 4.1 5 6.8 58.6
29) *Winston, T.B. 52 28 53.8 380 7.31 3 5.8 5 9.6 57.1
30) Bradford, Phi. 56 26 46.4 224 4.00 1 1.8 2 3.6 48.5
31) Flacco, Bal. 63 31 49.2 332 5.27 1 1.6 4 6.3 43.9
32) Stafford, Det. 59 32 54.2 337 5.71 2 3.4 6 10.2 42.8
WEEK 6 / THROUGH MONDAY, OCTOBER 19, 2015
AFC / LEADING RUSHERS
Rank Player, Team Att Yards Avg Long TD
1) Ivory, NY-J 83 460 5.5 54 4
2) Forsett, Bal. 104 457 4.4 33 1
3) Bernard, Cin. 77 427 5.5 28 2
4) Gore, Ind. 89 403 4.5 25 3
5) Bell, Pit. 86 390 4.5 32 3
6) Charles, K.C. 71 364 5.1 34t 4
7) Murray, Oak. 80 336 4.2 54 2
8) Hillman, Den. 66 323 4.9 72t 2
9) *Gordon, S.D. 78 299 3.8 27 0
10) *Yeldon, Jac. 81 291 3.6 36 0
11) Crowell, Cle. 73 272 3.7 32 1
12) Blount, N.E. 49 249 5.1 38t 4
13) Miller, Mia. 56 244 4.4 22 1
14) McCoy, Buf. 60 236 3.9 33 1
15) J. Hill, Cin. 74 232 3.1 11 5
16) D. Williams, Pit. 50 230 4.6 28 3
17t) Blue, Hou. 57 226 4.0 20t 1
17t) *Ka. Williams, Buf. 42 226 5.4 41t 3
19) Lewis, N.E. 40 201 5.0 13 2
20) Taylor, Buf. (QB) 31 187 6.0 31 2
21) C. Anderson, Den. 67 180 2.7 14 0
22) Woodhead, S.D. 44 162 3.7 19 2
23t) *D. Johnson, Cle. 49 159 3.2 20 0
23t) Sankey, Ten. 39 159 4.1 16 1
25) McCluster, Ten. 30 156 5.2 44 0
26) Bortles, Jac. (QB) 18 149 8.3 28 0
27) *Allen, Bal. 30 137 4.6 44 0
28) Polk, Hou. 36 134 3.7 17 1
29) B. Powell, NY-J 38 129 3.4 23 0
30) A. Smith, K.C. (QB) 28 119 4.3 19 0
31) Foster, Hou. 45 104 2.3 16 0
32) Luck, Ind. (QB) 18 100 5.6 25 0
33) Vick, Pit. (QB) 20 99 5.0 24 0
34) Fitzpatrick, NY-J (QB) 20 83 4.2 19 1
35t) Andrews, Ten. 28 81 2.9 13 2
35t) West, K.C. 21 81 3.9 9 0
37) Gray, Mia. 17 73 4.3 11 0
38t) Landry, Mia. (WR) 7 72 10.3 22t 1
38t) *Mariota, Ten. (QB) 10 72 7.2 22 0
40) Stacy, NY-J 20 56 2.8 18 1
41) Oliver, S.D. 18 55 3.1 6 0
42) Grimes, Hou. 14 54 3.9 21 0
43) Dalton, Cin. (QB) 27 53 2.0 8 2
44) West, Ten. 16 51 3.2 12 0
45t) McCown, Cle. (QB) 9 47 5.2 13 1
45t) D. Robinson, Jac. 13 47 3.6 9 0
45t) Taliaferro, Bal. 13 47 3.6 7t 1
48) Tannehill, Mia. (QB) 10 41 4.1 10 0
49) Davis, K.C. 16 40 2.5 10 1
50) *Robinson, Ind. 17 39 2.3 8 0
WEEK 6 / THROUGH MONDAY, OCTOBER 19, 2015
NFC / LEADING RUSHERS
Rank Player, Team Att Yards Avg Long TD
1) Forte, Chi. 126 507 4.0 27 2
2) Freeman, Atl. 106 505 4.8 25t 9
3) C. Johnson, Ariz 93 445 4.8 40 2
4) Peterson, Min. 101 432 4.3 48t 3
5) Hyde, S.F. 104 430 4.1 22 3
6) D. Martin, T.B. 90 405 4.5 39 3
7) *Rawls, Sea. 59 334 5.7 69t 1
8) *Gurley, St.L 55 314 5.7 55 0
9) Ingram, N.O. 88 307 3.5 17 4
10) Stewart, Car. 79 298 3.8 22 2
11) Morris, Was. 85 297 3.5 35 0
12) Randle, Dal. 74 289 3.9 37t 4
13) Starks, G.B. 63 286 4.5 65t 1
14) Lacy, G.B. 67 260 3.9 16 1
15) Wilson, Sea. (QB) 45 251 5.6 24 0
16) Mathews, Phi. 50 245 4.9 33 2
17) Jennings, NY-G 66 243 3.7 27 1
18) Murray, Phi. 71 239 3.4 30 3
19) Kaepernick, S.F. (QB) 39 228 5.8 15 1
20) Newton, Car. (QB) 50 225 4.5 19 3
21) *Jones, Was. 54 220 4.1 39t 3
22) Lynch, Sea. 55 182 3.3 24 1
23) *Abdullah, Det. 54 179 3.3 24t 1
24) A. Rodgers, G.B. (QB) 29 160 5.5 18 0
25) *Coleman, Atl. 35 155 4.4 20 1
26) Robinson, N.O. 38 148 3.9 14 2
27) Ellington, Ariz 16 139 8.7 63t 2
28) Sims, T.B. 37 135 3.6 15 0
29) McFadden, Dal. 37 129 3.5 14 1
30) Williams, NY-G 45 127 2.8 35 1
31) Thompson, Was. 19 120 6.3 42 0
32) Sproles, Phi. 28 111 4.0 27 1
33) Vereen, NY-G 29 101 3.5 12 0
34) *D. Johnson, Ariz 21 100 4.8 14 3
35) Austin, St.L (WR) 13 99 7.6 16t 1
36) Cutler, Chi. (QB) 14 82 5.9 12 0
37) Tolbert, Car. 17 76 4.5 13 0
38) *Ward, Atl. 19 72 3.8 13 1
39) Dunbar, Dal. 5 67 13.4 45 0
40) *Winston, T.B. (QB) 20 62 3.1 9 1
41) *Zenner, Det. 17 60 3.5 12 0
42t) B. Cunningham, St.L 20 57 2.9 12 0
42t) Stafford, Det. (QB) 13 57 4.4 11 0
44) Bridgewater, Min. (QB) 16 54 3.4 11 1
45t) Asiata, Min. 11 52 4.7 11 0
45t) F. Jackson, Sea. 10 52 5.2 16 0
45t) Manning, NY-G (QB) 8 52 6.5 18 0
45t) McKinnon, Min. 14 52 3.7 15 0
45t) Ryan, Atl. (QB) 16 52 3.3 18 0
50) Mason, St.L 20 49 2.5 13 0
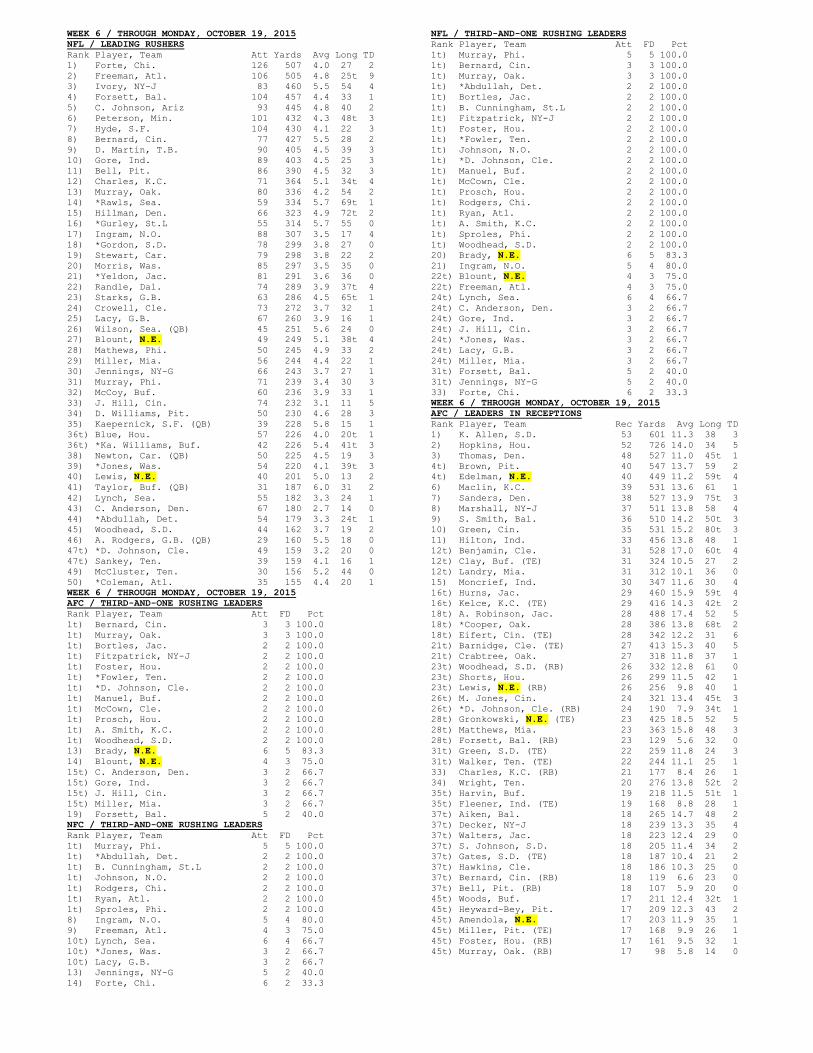
WEEK 6 / THROUGH MONDAY, OCTOBER 19, 2015
NFL / LEADING RUSHERS
Rank Player, Team Att Yards Avg Long TD
1) Forte, Chi. 126 507 4.0 27 2
2) Freeman, Atl. 106 505 4.8 25t 9
3) Ivory, NY-J 83 460 5.5 54 4
4) Forsett, Bal. 104 457 4.4 33 1
5) C. Johnson, Ariz 93 445 4.8 40 2
6) Peterson, Min. 101 432 4.3 48t 3
7) Hyde, S.F. 104 430 4.1 22 3
8) Bernard, Cin. 77 427 5.5 28 2
9) D. Martin, T.B. 90 405 4.5 39 3
10) Gore, Ind. 89 403 4.5 25 3
11) Bell, Pit. 86 390 4.5 32 3
12) Charles, K.C. 71 364 5.1 34t 4
13) Murray, Oak. 80 336 4.2 54 2
14) *Rawls, Sea. 59 334 5.7 69t 1
15) Hillman, Den. 66 323 4.9 72t 2
16) *Gurley, St.L 55 314 5.7 55 0
17) Ingram, N.O. 88 307 3.5 17 4
18) *Gordon, S.D. 78 299 3.8 27 0
19) Stewart, Car. 79 298 3.8 22 2
20) Morris, Was. 85 297 3.5 35 0
21) *Yeldon, Jac. 81 291 3.6 36 0
22) Randle, Dal. 74 289 3.9 37t 4
23) Starks, G.B. 63 286 4.5 65t 1
24) Crowell, Cle. 73 272 3.7 32 1
25) Lacy, G.B. 67 260 3.9 16 1
26) Wilson, Sea. (QB) 45 251 5.6 24 0
27) Blount, N.E. 49 249 5.1 38t 4
28) Mathews, Phi. 50 245 4.9 33 2
29) Miller, Mia. 56 244 4.4 22 1
30) Jennings, NY-G 66 243 3.7 27 1
31) Murray, Phi. 71 239 3.4 30 3
32) McCoy, Buf. 60 236 3.9 33 1
33) J. Hill, Cin. 74 232 3.1 11 5
34) D. Williams, Pit. 50 230 4.6 28 3
35) Kaepernick, S.F. (QB) 39 228 5.8 15 1
36t) Blue, Hou. 57 226 4.0 20t 1
36t) *Ka. Williams, Buf. 42 226 5.4 41t 3
38) Newton, Car. (QB) 50 225 4.5 19 3
39) *Jones, Was. 54 220 4.1 39t 3
40) Lewis, N.E. 40 201 5.0 13 2
41) Taylor, Buf. (QB) 31 187 6.0 31 2
42) Lynch, Sea. 55 182 3.3 24 1
43) C. Anderson, Den. 67 180 2.7 14 0
44) *Abdullah, Det. 54 179 3.3 24t 1
45) Woodhead, S.D. 44 162 3.7 19 2
46) A. Rodgers, G.B. (QB) 29 160 5.5 18 0
47t) *D. Johnson, Cle. 49 159 3.2 20 0
47t) Sankey, Ten. 39 159 4.1 16 1
49) McCluster, Ten. 30 156 5.2 44 0
50) *Coleman, Atl. 35 155 4.4 20 1
WEEK 6 / THROUGH MONDAY, OCTOBER 19, 2015
AFC / THIRD-AND-ONE RUSHING LEADERS
Rank Player, Team Att FD Pct
1t) Bernard, Cin. 3 3 100.0
1t) Murray, Oak. 3 3 100.0
1t) Bortles, Jac. 2 2 100.0
1t) Fitzpatrick, NY-J 2 2 100.0
1t) Foster, Hou. 2 2 100.0
1t) *Fowler, Ten. 2 2 100.0
1t) *D. Johnson, Cle. 2 2 100.0
1t) Manuel, Buf. 2 2 100.0
1t) McCown, Cle. 2 2 100.0
1t) Prosch, Hou. 2 2 100.0
1t) A. Smith, K.C. 2 2 100.0
1t) Woodhead, S.D. 2 2 100.0
13) Brady, N.E. 6 5 83.3
14) Blount, N.E. 4 3 75.0
15t) C. Anderson, Den. 3 2 66.7
15t) Gore, Ind. 3 2 66.7
15t) J. Hill, Cin. 3 2 66.7
15t) Miller, Mia. 3 2 66.7
19) Forsett, Bal. 5 2 40.0
NFC / THIRD-AND-ONE RUSHING LEADERS
Rank Player, Team Att FD Pct
1t) Murray, Phi. 5 5 100.0
1t) *Abdullah, Det. 2 2 100.0
1t) B. Cunningham, St.L 2 2 100.0
1t) Johnson, N.O. 2 2 100.0
1t) Rodgers, Chi. 2 2 100.0
1t) Ryan, Atl. 2 2 100.0
1t) Sproles, Phi. 2 2 100.0
8) Ingram, N.O. 5 4 80.0
9) Freeman, Atl. 4 3 75.0
10t) Lynch, Sea. 6 4 66.7
10t) *Jones, Was. 3 2 66.7
10t) Lacy, G.B. 3 2 66.7
13) Jennings, NY-G 5 2 40.0
14) Forte, Chi. 6 2 33.3
NFL / THIRD-AND-ONE RUSHING LEADERS
Rank Player, Team Att FD Pct
1t) Murray, Phi. 5 5 100.0
1t) Bernard, Cin. 3 3 100.0
1t) Murray, Oak. 3 3 100.0
1t) *Abdullah, Det. 2 2 100.0
1t) Bortles, Jac. 2 2 100.0
1t) B. Cunningham, St.L 2 2 100.0
1t) Fitzpatrick, NY-J 2 2 100.0
1t) Foster, Hou. 2 2 100.0
1t) *Fowler, Ten. 2 2 100.0
1t) Johnson, N.O. 2 2 100.0
1t) *D. Johnson, Cle. 2 2 100.0
1t) Manuel, Buf. 2 2 100.0
1t) McCown, Cle. 2 2 100.0
1t) Prosch, Hou. 2 2 100.0
1t) Rodgers, Chi. 2 2 100.0
1t) Ryan, Atl. 2 2 100.0
1t) A. Smith, K.C. 2 2 100.0
1t) Sproles, Phi. 2 2 100.0
1t) Woodhead, S.D. 2 2 100.0
20) Brady, N.E. 6 5 83.3
21) Ingram, N.O. 5 4 80.0
22t) Blount, N.E. 4 3 75.0
22t) Freeman, Atl. 4 3 75.0
24t) Lynch, Sea. 6 4 66.7
24t) C. Anderson, Den. 3 2 66.7
24t) Gore, Ind. 3 2 66.7
24t) J. Hill, Cin. 3 2 66.7
24t) *Jones, Was. 3 2 66.7
24t) Lacy, G.B. 3 2 66.7
24t) Miller, Mia. 3 2 66.7
31t) Forsett, Bal. 5 2 40.0
31t) Jennings, NY-G 5 2 40.0
33) Forte, Chi. 6 2 33.3
WEEK 6 / THROUGH MONDAY, OCTOBER 19, 2015
AFC / LEADERS IN RECEPTIONS
Rank Player, Team Rec Yards Avg Long TD
1) K. Allen, S.D. 53 601 11.3 38 3
2) Hopkins, Hou. 52 726 14.0 34 5
3) Thomas, Den. 48 527 11.0 45t 1
4t) Brown, Pit. 40 547 13.7 59 2
4t) Edelman, N.E. 40 449 11.2 59t 4
6) Maclin, K.C. 39 531 13.6 61 1
7) Sanders, Den. 38 527 13.9 75t 3
8) Marshall, NY-J 37 511 13.8 58 4
9) S. Smith, Bal. 36 510 14.2 50t 3
10) Green, Cin. 35 531 15.2 80t 3
11) Hilton, Ind. 33 456 13.8 48 1
12t) Benjamin, Cle. 31 528 17.0 60t 4
12t) Clay, Buf. (TE) 31 324 10.5 27 2
12t) Landry, Mia. 31 312 10.1 36 0
15) Moncrief, Ind. 30 347 11.6 30 4
16t) Hurns, Jac. 29 460 15.9 59t 4
16t) Kelce, K.C. (TE) 29 416 14.3 42t 2
18t) A. Robinson, Jac. 28 488 17.4 52 5
18t) *Cooper, Oak. 28 386 13.8 68t 2
18t) Eifert, Cin. (TE) 28 342 12.2 31 6
21t) Barnidge, Cle. (TE) 27 413 15.3 40 5
21t) Crabtree, Oak. 27 318 11.8 37 1
23t) Woodhead, S.D. (RB) 26 332 12.8 61 0
23t) Shorts, Hou. 26 299 11.5 42 1
23t) Lewis, N.E. (RB) 26 256 9.8 40 1
26t) M. Jones, Cin. 24 321 13.4 45t 3
26t) *D. Johnson, Cle. (RB) 24 190 7.9 34t 1
28t) Gronkowski, N.E. (TE) 23 425 18.5 52 5
28t) Matthews, Mia. 23 363 15.8 48 3
28t) Forsett, Bal. (RB) 23 129 5.6 32 0
31t) Green, S.D. (TE) 22 259 11.8 24 3
31t) Walker, Ten. (TE) 22 244 11.1 25 1
33) Charles, K.C. (RB) 21 177 8.4 26 1
34) Wright, Ten. 20 276 13.8 52t 2
35t) Harvin, Buf. 19 218 11.5 51t 1
35t) Fleener, Ind. (TE) 19 168 8.8 28 1
37t) Aiken, Bal. 18 265 14.7 48 2
37t) Decker, NY-J 18 239 13.3 35 4
37t) Walters, Jac. 18 223 12.4 29 0
37t) S. Johnson, S.D. 18 205 11.4 34 2
37t) Gates, S.D. (TE) 18 187 10.4 21 2
37t) Hawkins, Cle. 18 186 10.3 25 0
37t) Bernard, Cin. (RB) 18 119 6.6 23 0
37t) Bell, Pit. (RB) 18 107 5.9 20 0
45t) Woods, Buf. 17 211 12.4 32t 1
45t) Heyward-Bey, Pit. 17 209 12.3 43 2
45t) Amendola, N.E. 17 203 11.9 35 1
45t) Miller, Pit. (TE) 17 168 9.9 26 1
45t) Foster, Hou. (RB) 17 161 9.5 32 1
45t) Murray, Oak. (RB) 17 98 5.8 14 0
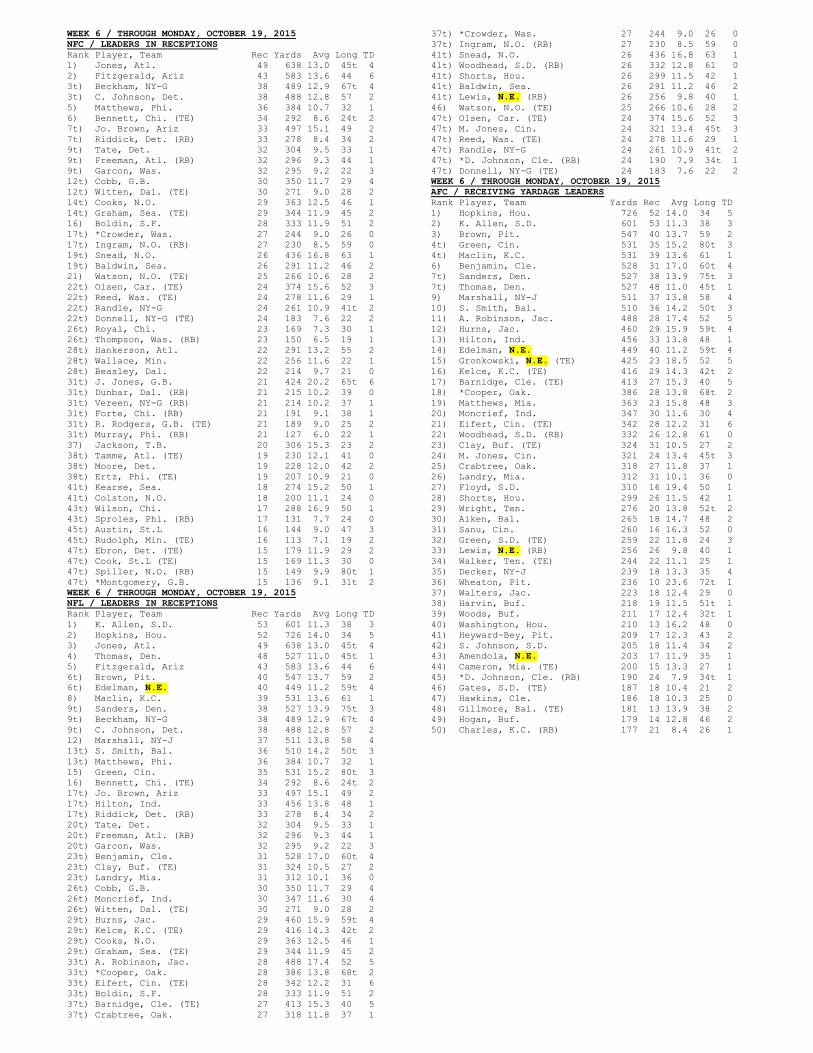
WEEK 6 / THROUGH MONDAY, OCTOBER 19, 2015
NFC / LEADERS IN RECEPTIONS
Rank Player, Team Rec Yards Avg Long TD
1) Jones, Atl. 49 638 13.0 45t 4
2) Fitzgerald, Ariz 43 583 13.6 44 6
3t) Beckham, NY-G 38 489 12.9 67t 4
3t) C. Johnson, Det. 38 488 12.8 57 2
5) Matthews, Phi. 36 384 10.7 32 1
6) Bennett, Chi. (TE) 34 292 8.6 24t 2
7t) Jo. Brown, Ariz 33 497 15.1 49 2
7t) Riddick, Det. (RB) 33 278 8.4 34 2
9t) Tate, Det. 32 304 9.5 33 1
9t) Freeman, Atl. (RB) 32 296 9.3 44 1
9t) Garcon, Was. 32 295 9.2 22 3
12t) Cobb, G.B. 30 350 11.7 29 4
12t) Witten, Dal. (TE) 30 271 9.0 28 2
14t) Cooks, N.O. 29 363 12.5 46 1
14t) Graham, Sea. (TE) 29 344 11.9 45 2
16) Boldin, S.F. 28 333 11.9 51 2
17t) *Crowder, Was. 27 244 9.0 26 0
17t) Ingram, N.O. (RB) 27 230 8.5 59 0
19t) Snead, N.O. 26 436 16.8 63 1
19t) Baldwin, Sea. 26 291 11.2 46 2
21) Watson, N.O. (TE) 25 266 10.6 28 2
22t) Olsen, Car. (TE) 24 374 15.6 52 3
22t) Reed, Was. (TE) 24 278 11.6 29 1
22t) Randle, NY-G 24 261 10.9 41t 2
22t) Donnell, NY-G (TE) 24 183 7.6 22 2
26t) Royal, Chi. 23 169 7.3 30 1
26t) Thompson, Was. (RB) 23 150 6.5 19 1
28t) Hankerson, Atl. 22 291 13.2 55 2
28t) Wallace, Min. 22 256 11.6 22 1
28t) Beasley, Dal. 22 214 9.7 21 0
31t) J. Jones, G.B. 21 424 20.2 65t 6
31t) Dunbar, Dal. (RB) 21 215 10.2 39 0
31t) Vereen, NY-G (RB) 21 214 10.2 37 1
31t) Forte, Chi. (RB) 21 191 9.1 38 1
31t) R. Rodgers, G.B. (TE) 21 189 9.0 25 2
31t) Murray, Phi. (RB) 21 127 6.0 22 1
37) Jackson, T.B. 20 306 15.3 23 2
38t) Tamme, Atl. (TE) 19 230 12.1 41 0
38t) Moore, Det. 19 228 12.0 42 2
38t) Ertz, Phi. (TE) 19 207 10.9 21 0
41t) Kearse, Sea. 18 274 15.2 50 1
41t) Colston, N.O. 18 200 11.1 24 0
43t) Wilson, Chi. 17 288 16.9 50 1
43t) Sproles, Phi. (RB) 17 131 7.7 24 0
45t) Austin, St.L 16 144 9.0 47 3
45t) Rudolph, Min. (TE) 16 113 7.1 19 2
47t) Ebron, Det. (TE) 15 179 11.9 29 2
47t) Cook, St.L (TE) 15 169 11.3 30 0
47t) Spiller, N.O. (RB) 15 149 9.9 80t 1
47t) *Montgomery, G.B. 15 136 9.1 31t 2
WEEK 6 / THROUGH MONDAY, OCTOBER 19, 2015
NFL / LEADERS IN RECEPTIONS
Rank Player, Team Rec Yards Avg Long TD
1) K. Allen, S.D. 53 601 11.3 38 3
2) Hopkins, Hou. 52 726 14.0 34 5
3) Jones, Atl. 49 638 13.0 45t 4
4) Thomas, Den. 48 527 11.0 45t 1
5) Fitzgerald, Ariz 43 583 13.6 44 6
6t) Brown, Pit. 40 547 13.7 59 2
6t) Edelman, N.E. 40 449 11.2 59t 4
8) Maclin, K.C. 39 531 13.6 61 1
9t) Sanders, Den. 38 527 13.9 75t 3
9t) Beckham, NY-G 38 489 12.9 67t 4
9t) C. Johnson, Det. 38 488 12.8 57 2
12) Marshall, NY-J 37 511 13.8 58 4
13t) S. Smith, Bal. 36 510 14.2 50t 3
13t) Matthews, Phi. 36 384 10.7 32 1
15) Green, Cin. 35 531 15.2 80t 3
16) Bennett, Chi. (TE) 34 292 8.6 24t 2
17t) Jo. Brown, Ariz 33 497 15.1 49 2
17t) Hilton, Ind. 33 456 13.8 48 1
17t) Riddick, Det. (RB) 33 278 8.4 34 2
20t) Tate, Det. 32 304 9.5 33 1
20t) Freeman, Atl. (RB) 32 296 9.3 44 1
20t) Garcon, Was. 32 295 9.2 22 3
23t) Benjamin, Cle. 31 528 17.0 60t 4
23t) Clay, Buf. (TE) 31 324 10.5 27 2
23t) Landry, Mia. 31 312 10.1 36 0
26t) Cobb, G.B. 30 350 11.7 29 4
26t) Moncrief, Ind. 30 347 11.6 30 4
26t) Witten, Dal. (TE) 30 271 9.0 28 2
29t) Hurns, Jac. 29 460 15.9 59t 4
29t) Kelce, K.C. (TE) 29 416 14.3 42t 2
29t) Cooks, N.O. 29 363 12.5 46 1
29t) Graham, Sea. (TE) 29 344 11.9 45 2
33t) A. Robinson, Jac. 28 488 17.4 52 5
33t) *Cooper, Oak. 28 386 13.8 68t 2
33t) Eifert, Cin. (TE) 28 342 12.2 31 6
33t) Boldin, S.F. 28 333 11.9 51 2
37t) Barnidge, Cle. (TE) 27 413 15.3 40 5
37t) Crabtree, Oak. 27 318 11.8 37 1
37t) *Crowder, Was. 27 244 9.0 26 0
37t) Ingram, N.O. (RB) 27 230 8.5 59 0
41t) Snead, N.O. 26 436 16.8 63 1
41t) Woodhead, S.D. (RB) 26 332 12.8 61 0
41t) Shorts, Hou. 26 299 11.5 42 1
41t) Baldwin, Sea. 26 291 11.2 46 2
41t) Lewis, N.E. (RB) 26 256 9.8 40 1
46) Watson, N.O. (TE) 25 266 10.6 28 2
47t) Olsen, Car. (TE) 24 374 15.6 52 3
47t) M. Jones, Cin. 24 321 13.4 45t 3
47t) Reed, Was. (TE) 24 278 11.6 29 1
47t) Randle, NY-G 24 261 10.9 41t 2
47t) *D. Johnson, Cle. (RB) 24 190 7.9 34t 1
47t) Donnell, NY-G (TE) 24 183 7.6 22 2
WEEK 6 / THROUGH MONDAY, OCTOBER 19, 2015
AFC / RECEIVING YARDAGE LEADERS
Rank Player, Team Yards Rec Avg Long TD
1) Hopkins, Hou. 726 52 14.0 34 5
2) K. Allen, S.D. 601 53 11.3 38 3
3) Brown, Pit. 547 40 13.7 59 2
4t) Green, Cin. 531 35 15.2 80t 3
4t) Maclin, K.C. 531 39 13.6 61 1
6) Benjamin, Cle. 528 31 17.0 60t 4
7t) Sanders, Den. 527 38 13.9 75t 3
7t) Thomas, Den. 527 48 11.0 45t 1
9) Marshall, NY-J 511 37 13.8 58 4
10) S. Smith, Bal. 510 36 14.2 50t 3
11) A. Robinson, Jac. 488 28 17.4 52 5
12) Hurns, Jac. 460 29 15.9 59t 4
13) Hilton, Ind. 456 33 13.8 48 1
14) Edelman, N.E. 449 40 11.2 59t 4
15) Gronkowski, N.E. (TE) 425 23 18.5 52 5
16) Kelce, K.C. (TE) 416 29 14.3 42t 2
17) Barnidge, Cle. (TE) 413 27 15.3 40 5
18) *Cooper, Oak. 386 28 13.8 68t 2
19) Matthews, Mia. 363 23 15.8 48 3
20) Moncrief, Ind. 347 30 11.6 30 4
21) Eifert, Cin. (TE) 342 28 12.2 31 6
22) Woodhead, S.D. (RB) 332 26 12.8 61 0
23) Clay, Buf. (TE) 324 31 10.5 27 2
24) M. Jones, Cin. 321 24 13.4 45t 3
25) Crabtree, Oak. 318 27 11.8 37 1
26) Landry, Mia. 312 31 10.1 36 0
27) Floyd, S.D. 310 16 19.4 50 1
28) Shorts, Hou. 299 26 11.5 42 1
29) Wright, Ten. 276 20 13.8 52t 2
30) Aiken, Bal. 265 18 14.7 48 2
31) Sanu, Cin. 260 16 16.3 52 0
32) Green, S.D. (TE) 259 22 11.8 24 3
33) Lewis, N.E. (RB) 256 26 9.8 40 1
34) Walker, Ten. (TE) 244 22 11.1 25 1
35) Decker, NY-J 239 18 13.3 35 4
36) Wheaton, Pit. 236 10 23.6 72t 1
37) Walters, Jac. 223 18 12.4 29 0
38) Harvin, Buf. 218 19 11.5 51t 1
39) Woods, Buf. 211 17 12.4 32t 1
40) Washington, Hou. 210 13 16.2 48 0
41) Heyward-Bey, Pit. 209 17 12.3 43 2
42) S. Johnson, S.D. 205 18 11.4 34 2
43) Amendola, N.E. 203 17 11.9 35 1
44) Cameron, Mia. (TE) 200 15 13.3 27 1
45) *D. Johnson, Cle. (RB) 190 24 7.9 34t 1
46) Gates, S.D. (TE) 187 18 10.4 21 2
47) Hawkins, Cle. 186 18 10.3 25 0
48) Gillmore, Bal. (TE) 181 13 13.9 38 2
49) Hogan, Buf. 179 14 12.8 46 2
50) Charles, K.C. (RB) 177 21 8.4 26 1
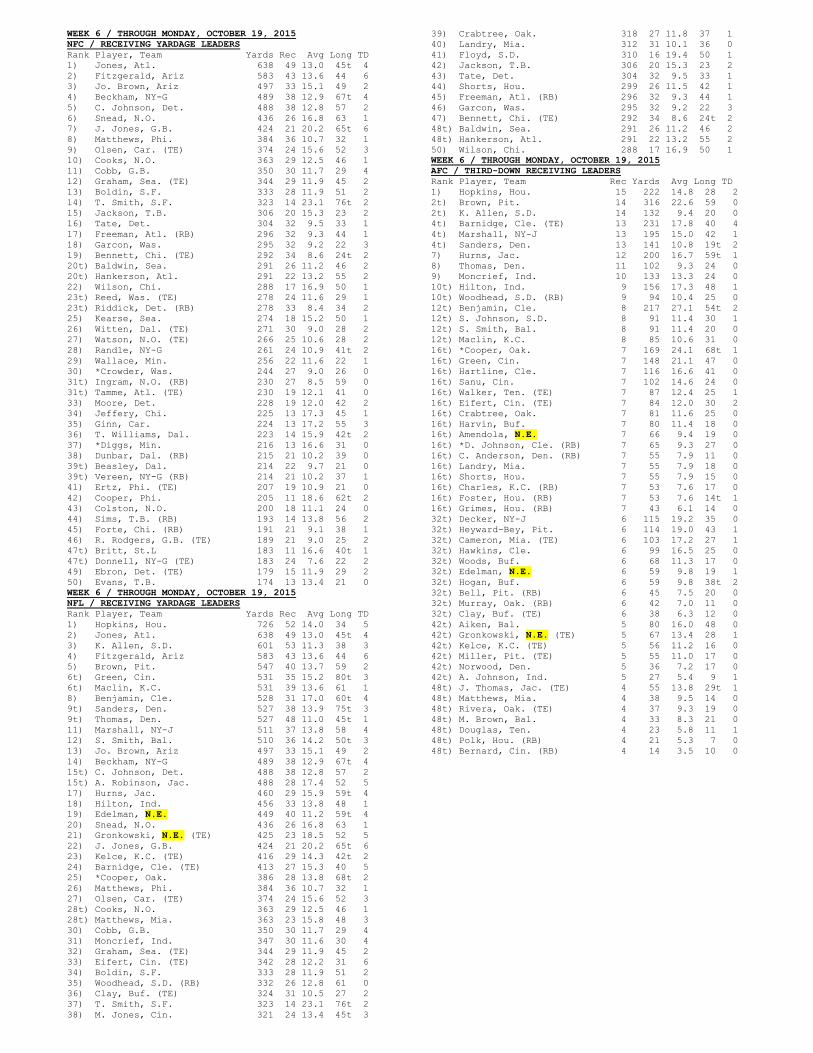
WEEK 6 / THROUGH MONDAY, OCTOBER 19, 2015
NFC / RECEIVING YARDAGE LEADERS
Rank Player, Team Yards Rec Avg Long TD
1) Jones, Atl. 638 49 13.0 45t 4
2) Fitzgerald, Ariz 583 43 13.6 44 6
3) Jo. Brown, Ariz 497 33 15.1 49 2
4) Beckham, NY-G 489 38 12.9 67t 4
5) C. Johnson, Det. 488 38 12.8 57 2
6) Snead, N.O. 436 26 16.8 63 1
7) J. Jones, G.B. 424 21 20.2 65t 6
8) Matthews, Phi. 384 36 10.7 32 1
9) Olsen, Car. (TE) 374 24 15.6 52 3
10) Cooks, N.O. 363 29 12.5 46 1
11) Cobb, G.B. 350 30 11.7 29 4
12) Graham, Sea. (TE) 344 29 11.9 45 2
13) Boldin, S.F. 333 28 11.9 51 2
14) T. Smith, S.F. 323 14 23.1 76t 2
15) Jackson, T.B. 306 20 15.3 23 2
16) Tate, Det. 304 32 9.5 33 1
17) Freeman, Atl. (RB) 296 32 9.3 44 1
18) Garcon, Was. 295 32 9.2 22 3
19) Bennett, Chi. (TE) 292 34 8.6 24t 2
20t) Baldwin, Sea. 291 26 11.2 46 2
20t) Hankerson, Atl. 291 22 13.2 55 2
22) Wilson, Chi. 288 17 16.9 50 1
23t) Reed, Was. (TE) 278 24 11.6 29 1
23t) Riddick, Det. (RB) 278 33 8.4 34 2
25) Kearse, Sea. 274 18 15.2 50 1
26) Witten, Dal. (TE) 271 30 9.0 28 2
27) Watson, N.O. (TE) 266 25 10.6 28 2
28) Randle, NY-G 261 24 10.9 41t 2
29) Wallace, Min. 256 22 11.6 22 1
30) *Crowder, Was. 244 27 9.0 26 0
31t) Ingram, N.O. (RB) 230 27 8.5 59 0
31t) Tamme, Atl. (TE) 230 19 12.1 41 0
33) Moore, Det. 228 19 12.0 42 2
34) Jeffery, Chi. 225 13 17.3 45 1
35) Ginn, Car. 224 13 17.2 55 3
36) T. Williams, Dal. 223 14 15.9 42t 2
37) *Diggs, Min. 216 13 16.6 31 0
38) Dunbar, Dal. (RB) 215 21 10.2 39 0
39t) Beasley, Dal. 214 22 9.7 21 0
39t) Vereen, NY-G (RB) 214 21 10.2 37 1
41) Ertz, Phi. (TE) 207 19 10.9 21 0
42) Cooper, Phi. 205 11 18.6 62t 2
43) Colston, N.O. 200 18 11.1 24 0
44) Sims, T.B. (RB) 193 14 13.8 56 2
45) Forte, Chi. (RB) 191 21 9.1 38 1
46) R. Rodgers, G.B. (TE) 189 21 9.0 25 2
47t) Britt, St.L 183 11 16.6 40t 1
47t) Donnell, NY-G (TE) 183 24 7.6 22 2
49) Ebron, Det. (TE) 179 15 11.9 29 2
50) Evans, T.B. 174 13 13.4 21 0
WEEK 6 / THROUGH MONDAY, OCTOBER 19, 2015
NFL / RECEIVING YARDAGE LEADERS
Rank Player, Team Yards Rec Avg Long TD
1) Hopkins, Hou. 726 52 14.0 34 5
2) Jones, Atl. 638 49 13.0 45t 4
3) K. Allen, S.D. 601 53 11.3 38 3
4) Fitzgerald, Ariz 583 43 13.6 44 6
5) Brown, Pit. 547 40 13.7 59 2
6t) Green, Cin. 531 35 15.2 80t 3
6t) Maclin, K.C. 531 39 13.6 61 1
8) Benjamin, Cle. 528 31 17.0 60t 4
9t) Sanders, Den. 527 38 13.9 75t 3
9t) Thomas, Den. 527 48 11.0 45t 1
11) Marshall, NY-J 511 37 13.8 58 4
12) S. Smith, Bal. 510 36 14.2 50t 3
13) Jo. Brown, Ariz 497 33 15.1 49 2
14) Beckham, NY-G 489 38 12.9 67t 4
15t) C. Johnson, Det. 488 38 12.8 57 2
15t) A. Robinson, Jac. 488 28 17.4 52 5
17) Hurns, Jac. 460 29 15.9 59t 4
18) Hilton, Ind. 456 33 13.8 48 1
19) Edelman, N.E. 449 40 11.2 59t 4
20) Snead, N.O. 436 26 16.8 63 1
21) Gronkowski, N.E. (TE) 425 23 18.5 52 5
22) J. Jones, G.B. 424 21 20.2 65t 6
23) Kelce, K.C. (TE) 416 29 14.3 42t 2
24) Barnidge, Cle. (TE) 413 27 15.3 40 5
25) *Cooper, Oak. 386 28 13.8 68t 2
26) Matthews, Phi. 384 36 10.7 32 1
27) Olsen, Car. (TE) 374 24 15.6 52 3
28t) Cooks, N.O. 363 29 12.5 46 1
28t) Matthews, Mia. 363 23 15.8 48 3
30) Cobb, G.B. 350 30 11.7 29 4
31) Moncrief, Ind. 347 30 11.6 30 4
32) Graham, Sea. (TE) 344 29 11.9 45 2
33) Eifert, Cin. (TE) 342 28 12.2 31 6
34) Boldin, S.F. 333 28 11.9 51 2
35) Woodhead, S.D. (RB) 332 26 12.8 61 0
36) Clay, Buf. (TE) 324 31 10.5 27 2
37) T. Smith, S.F. 323 14 23.1 76t 2
38) M. Jones, Cin. 321 24 13.4 45t 3
39) Crabtree, Oak. 318 27 11.8 37 1
40) Landry, Mia. 312 31 10.1 36 0
41) Floyd, S.D. 310 16 19.4 50 1
42) Jackson, T.B. 306 20 15.3 23 2
43) Tate, Det. 304 32 9.5 33 1
44) Shorts, Hou. 299 26 11.5 42 1
45) Freeman, Atl. (RB) 296 32 9.3 44 1
46) Garcon, Was. 295 32 9.2 22 3
47) Bennett, Chi. (TE) 292 34 8.6 24t 2
48t) Baldwin, Sea. 291 26 11.2 46 2
48t) Hankerson, Atl. 291 22 13.2 55 2
50) Wilson, Chi. 288 17 16.9 50 1
WEEK 6 / THROUGH MONDAY, OCTOBER 19, 2015
AFC / THIRD-DOWN RECEIVING LEADERS
Rank Player, Team Rec Yards Avg Long TD
1) Hopkins, Hou. 15 222 14.8 28 2
2t) Brown, Pit. 14 316 22.6 59 0
2t) K. Allen, S.D. 14 132 9.4 20 0
4t) Barnidge, Cle. (TE) 13 231 17.8 40 4
4t) Marshall, NY-J 13 195 15.0 42 1
4t) Sanders, Den. 13 141 10.8 19t 2
7) Hurns, Jac. 12 200 16.7 59t 1
8) Thomas, Den. 11 102 9.3 24 0
9) Moncrief, Ind. 10 133 13.3 24 0
10t) Hilton, Ind. 9 156 17.3 48 1
10t) Woodhead, S.D. (RB) 9 94 10.4 25 0
12t) Benjamin, Cle. 8 217 27.1 54t 2
12t) S. Johnson, S.D. 8 91 11.4 30 1
12t) S. Smith, Bal. 8 91 11.4 20 0
12t) Maclin, K.C. 8 85 10.6 31 0
16t) *Cooper, Oak. 7 169 24.1 68t 1
16t) Green, Cin. 7 148 21.1 47 0
16t) Hartline, Cle. 7 116 16.6 41 0
16t) Sanu, Cin. 7 102 14.6 24 0
16t) Walker, Ten. (TE) 7 87 12.4 25 1
16t) Eifert, Cin. (TE) 7 84 12.0 30 2
16t) Crabtree, Oak. 7 81 11.6 25 0
16t) Harvin, Buf. 7 80 11.4 18 0
16t) Amendola, N.E. 7 66 9.4 19 0
16t) *D. Johnson, Cle. (RB) 7 65 9.3 27 0
16t) C. Anderson, Den. (RB) 7 55 7.9 11 0
16t) Landry, Mia. 7 55 7.9 18 0
16t) Shorts, Hou. 7 55 7.9 15 0
16t) Charles, K.C. (RB) 7 53 7.6 17 0
16t) Foster, Hou. (RB) 7 53 7.6 14t 1
16t) Grimes, Hou. (RB) 7 43 6.1 14 0
32t) Decker, NY-J 6 115 19.2 35 0
32t) Heyward-Bey, Pit. 6 114 19.0 43 1
32t) Cameron, Mia. (TE) 6 103 17.2 27 1
32t) Hawkins, Cle. 6 99 16.5 25 0
32t) Woods, Buf. 6 68 11.3 17 0
32t) Edelman, N.E. 6 59 9.8 19 1
32t) Hogan, Buf. 6 59 9.8 38t 2
32t) Bell, Pit. (RB) 6 45 7.5 20 0
32t) Murray, Oak. (RB) 6 42 7.0 11 0
32t) Clay, Buf. (TE) 6 38 6.3 12 0
42t) Aiken, Bal. 5 80 16.0 48 0
42t) Gronkowski, N.E. (TE) 5 67 13.4 28 1
42t) Kelce, K.C. (TE) 5 56 11.2 16 0
42t) Miller, Pit. (TE) 5 55 11.0 17 0
42t) Norwood, Den. 5 36 7.2 17 0
42t) A. Johnson, Ind. 5 27 5.4 9 1
48t) J. Thomas, Jac. (TE) 4 55 13.8 29t 1
48t) Matthews, Mia. 4 38 9.5 14 0
48t) Rivera, Oak. (TE) 4 37 9.3 19 0
48t) M. Brown, Bal. 4 33 8.3 21 0
48t) Douglas, Ten. 4 23 5.8 11 1
48t) Polk, Hou. (RB) 4 21 5.3 7 0
48t) Bernard, Cin. (RB) 4 14 3.5 10 0
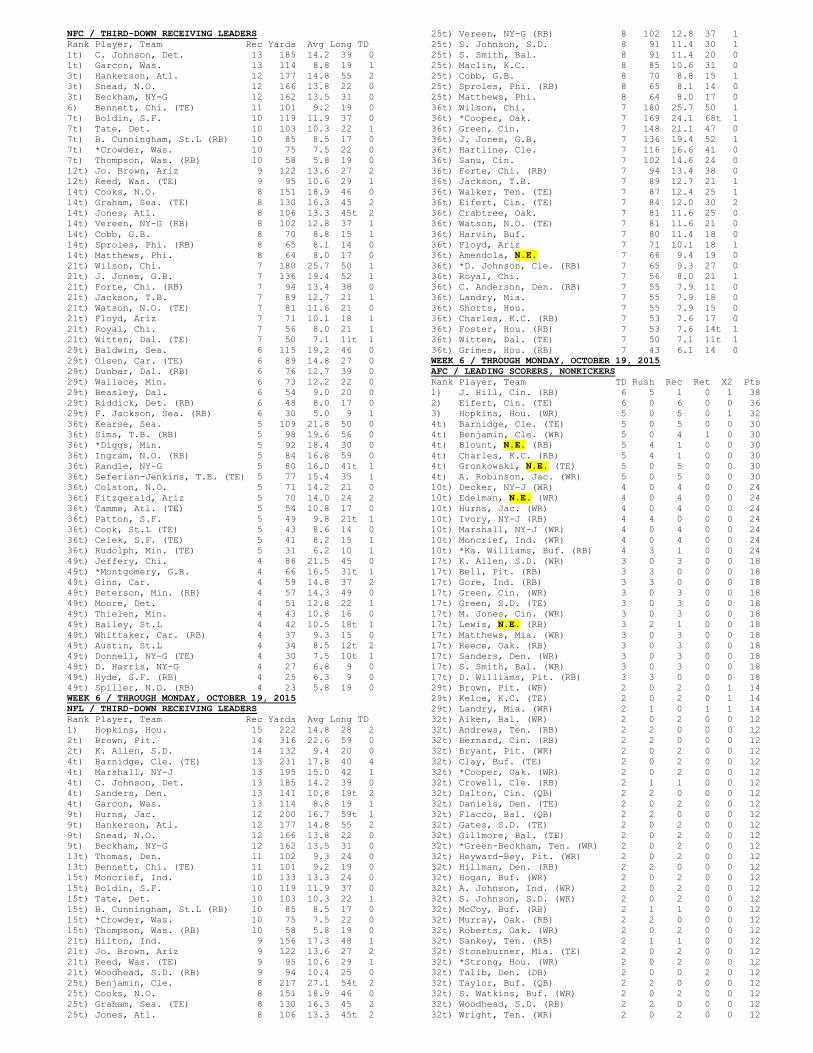
NFC / THIRD-DOWN RECEIVING LEADERS
Rank Player, Team Rec Yards Avg Long TD
1t) C. Johnson, Det. 13 185 14.2 39 0
1t) Garcon, Was. 13 114 8.8 19 1
3t) Hankerson, Atl. 12 177 14.8 55 2
3t) Snead, N.O. 12 166 13.8 22 0
3t) Beckham, NY-G 12 162 13.5 31 0
6) Bennett, Chi. (TE) 11 101 9.2 19 0
7t) Boldin, S.F. 10 119 11.9 37 0
7t) Tate, Det. 10 103 10.3 22 1
7t) B. Cunningham, St.L (RB) 10 85 8.5 17 0
7t) *Crowder, Was. 10 75 7.5 22 0
7t) Thompson, Was. (RB) 10 58 5.8 19 0
12t) Jo. Brown, Ariz 9 122 13.6 27 2
12t) Reed, Was. (TE) 9 95 10.6 29 1
14t) Cooks, N.O. 8 151 18.9 46 0
14t) Graham, Sea. (TE) 8 130 16.3 45 2
14t) Jones, Atl. 8 106 13.3 45t 2
14t) Vereen, NY-G (RB) 8 102 12.8 37 1
14t) Cobb, G.B. 8 70 8.8 15 1
14t) Sproles, Phi. (RB) 8 65 8.1 14 0
14t) Matthews, Phi. 8 64 8.0 17 0
21t) Wilson, Chi. 7 180 25.7 50 1
21t) J. Jones, G.B. 7 136 19.4 52 1
21t) Forte, Chi. (RB) 7 94 13.4 38 0
21t) Jackson, T.B. 7 89 12.7 21 1
21t) Watson, N.O. (TE) 7 81 11.6 21 0
21t) Floyd, Ariz 7 71 10.1 18 1
21t) Royal, Chi. 7 56 8.0 21 1
21t) Witten, Dal. (TE) 7 50 7.1 11t 1
29t) Baldwin, Sea. 6 115 19.2 46 0
29t) Olsen, Car. (TE) 6 89 14.8 27 0
29t) Dunbar, Dal. (RB) 6 76 12.7 39 0
29t) Wallace, Min. 6 73 12.2 22 0
29t) Beasley, Dal. 6 54 9.0 20 0
29t) Riddick, Det. (RB) 6 48 8.0 17 0
29t) F. Jackson, Sea. (RB) 6 30 5.0 9 1
36t) Kearse, Sea. 5 109 21.8 50 0
36t) Sims, T.B. (RB) 5 98 19.6 56 0
36t) *Diggs, Min. 5 92 18.4 30 0
36t) Ingram, N.O. (RB) 5 84 16.8 59 0
36t) Randle, NY-G 5 80 16.0 41t 1
36t) Seferian-Jenkins, T.B. (TE) 5 77 15.4 35 1
36t) Colston, N.O. 5 71 14.2 21 0
36t) Fitzgerald, Ariz 5 70 14.0 24 2
36t) Tamme, Atl. (TE) 5 54 10.8 17 0
36t) Patton, S.F. 5 49 9.8 21t 1
36t) Cook, St.L (TE) 5 43 8.6 14 0
36t) Celek, S.F. (TE) 5 41 8.2 15 1
36t) Rudolph, Min. (TE) 5 31 6.2 10 1
49t) Jeffery, Chi. 4 86 21.5 45 0
49t) *Montgomery, G.B. 4 66 16.5 31t 1
49t) Ginn, Car. 4 59 14.8 37 2
49t) Peterson, Min. (RB) 4 57 14.3 49 0
49t) Moore, Det. 4 51 12.8 22 1
49t) Thielen, Min. 4 43 10.8 16 0
49t) Bailey, St.L 4 42 10.5 18t 1
49t) Whittaker, Car. (RB) 4 37 9.3 15 0
49t) Austin, St.L 4 34 8.5 12t 2
49t) Donnell, NY-G (TE) 4 30 7.5 10t 1
49t) D. Harris, NY-G 4 27 6.8 9 0
49t) Hyde, S.F. (RB) 4 25 6.3 9 0
49t) Spiller, N.O. (RB) 4 23 5.8 19 0
WEEK 6 / THROUGH MONDAY, OCTOBER 19, 2015
NFL / THIRD-DOWN RECEIVING LEADERS
Rank Player, Team Rec Yards Avg Long TD
1) Hopkins, Hou. 15 222 14.8 28 2
2t) Brown, Pit. 14 316 22.6 59 0
2t) K. Allen, S.D. 14 132 9.4 20 0
4t) Barnidge, Cle. (TE) 13 231 17.8 40 4
4t) Marshall, NY-J 13 195 15.0 42 1
4t) C. Johnson, Det. 13 185 14.2 39 0
4t) Sanders, Den. 13 141 10.8 19t 2
4t) Garcon, Was. 13 114 8.8 19 1
9t) Hurns, Jac. 12 200 16.7 59t 1
9t) Hankerson, Atl. 12 177 14.8 55 2
9t) Snead, N.O. 12 166 13.8 22 0
9t) Beckham, NY-G 12 162 13.5 31 0
13t) Thomas, Den. 11 102 9.3 24 0
13t) Bennett, Chi. (TE) 11 101 9.2 19 0
15t) Moncrief, Ind. 10 133 13.3 24 0
15t) Boldin, S.F. 10 119 11.9 37 0
15t) Tate, Det. 10 103 10.3 22 1
15t) B. Cunningham, St.L (RB) 10 85 8.5 17 0
15t) *Crowder, Was. 10 75 7.5 22 0
15t) Thompson, Was. (RB) 10 58 5.8 19 0
21t) Hilton, Ind. 9 156 17.3 48 1
21t) Jo. Brown, Ariz 9 122 13.6 27 2
21t) Reed, Was. (TE) 9 95 10.6 29 1
21t) Woodhead, S.D. (RB) 9 94 10.4 25 0
25t) Benjamin, Cle. 8 217 27.1 54t 2
25t) Cooks, N.O. 8 151 18.9 46 0
25t) Graham, Sea. (TE) 8 130 16.3 45 2
25t) Jones, Atl. 8 106 13.3 45t 2
25t) Vereen, NY-G (RB) 8 102 12.8 37 1
25t) S. Johnson, S.D. 8 91 11.4 30 1
25t) S. Smith, Bal. 8 91 11.4 20 0
25t) Maclin, K.C. 8 85 10.6 31 0
25t) Cobb, G.B. 8 70 8.8 15 1
25t) Sproles, Phi. (RB) 8 65 8.1 14 0
25t) Matthews, Phi. 8 64 8.0 17 0
36t) Wilson, Chi. 7 180 25.7 50 1
36t) *Cooper, Oak. 7 169 24.1 68t 1
36t) Green, Cin. 7 148 21.1 47 0
36t) J. Jones, G.B. 7 136 19.4 52 1
36t) Hartline, Cle. 7 116 16.6 41 0
36t) Sanu, Cin. 7 102 14.6 24 0
36t) Forte, Chi. (RB) 7 94 13.4 38 0
36t) Jackson, T.B. 7 89 12.7 21 1
36t) Walker, Ten. (TE) 7 87 12.4 25 1
36t) Eifert, Cin. (TE) 7 84 12.0 30 2
36t) Crabtree, Oak. 7 81 11.6 25 0
36t) Watson, N.O. (TE) 7 81 11.6 21 0
36t) Harvin, Buf. 7 80 11.4 18 0
36t) Floyd, Ariz 7 71 10.1 18 1
36t) Amendola, N.E. 7 66 9.4 19 0
36t) *D. Johnson, Cle. (RB) 7 65 9.3 27 0
36t) Royal, Chi. 7 56 8.0 21 1
36t) C. Anderson, Den. (RB) 7 55 7.9 11 0
36t) Landry, Mia. 7 55 7.9 18 0
36t) Shorts, Hou. 7 55 7.9 15 0
36t) Charles, K.C. (RB) 7 53 7.6 17 0
36t) Foster, Hou. (RB) 7 53 7.6 14t 1
36t) Witten, Dal. (TE) 7 50 7.1 11t 1
36t) Grimes, Hou. (RB) 7 43 6.1 14 0
WEEK 6 / THROUGH MONDAY, OCTOBER 19, 2015
AFC / LEADING SCORERS, NONKICKERS
Rank Player, Team TD Rush Rec Ret X2 Pts
1) J. Hill, Cin. (RB) 6 5 1 0 1 38
2) Eifert, Cin. (TE) 6 0 6 0 0 36
3) Hopkins, Hou. (WR) 5 0 5 0 1 32
4t) Barnidge, Cle. (TE) 5 0 5 0 0 30
4t) Benjamin, Cle. (WR) 5 0 4 1 0 30
4t) Blount, N.E. (RB) 5 4 1 0 0 30
4t) Charles, K.C. (RB) 5 4 1 0 0 30
4t) Gronkowski, N.E. (TE) 5 0 5 0 0 30
4t) A. Robinson, Jac. (WR) 5 0 5 0 0 30
10t) Decker, NY-J (WR) 4 0 4 0 0 24
10t) Edelman, N.E. (WR) 4 0 4 0 0 24
10t) Hurns, Jac. (WR) 4 0 4 0 0 24
10t) Ivory, NY-J (RB) 4 4 0 0 0 24
10t) Marshall, NY-J (WR) 4 0 4 0 0 24
10t) Moncrief, Ind. (WR) 4 0 4 0 0 24
10t) *Ka. Williams, Buf. (RB) 4 3 1 0 0 24
17t) K. Allen, S.D. (WR) 3 0 3 0 0 18
17t) Bell, Pit. (RB) 3 3 0 0 0 18
17t) Gore, Ind. (RB) 3 3 0 0 0 18
17t) Green, Cin. (WR) 3 0 3 0 0 18
17t) Green, S.D. (TE) 3 0 3 0 0 18
17t) M. Jones, Cin. (WR) 3 0 3 0 0 18
17t) Lewis, N.E. (RB) 3 2 1 0 0 18
17t) Matthews, Mia. (WR) 3 0 3 0 0 18
17t) Reece, Oak. (RB) 3 0 3 0 0 18
17t) Sanders, Den. (WR) 3 0 3 0 0 18
17t) S. Smith, Bal. (WR) 3 0 3 0 0 18
17t) D. Williams, Pit. (RB) 3 3 0 0 0 18
29t) Brown, Pit. (WR) 2 0 2 0 1 14
29t) Kelce, K.C. (TE) 2 0 2 0 1 14
29t) Landry, Mia. (WR) 2 1 0 1 1 14
32t) Aiken, Bal. (WR) 2 0 2 0 0 12
32t) Andrews, Ten. (RB) 2 2 0 0 0 12
32t) Bernard, Cin. (RB) 2 2 0 0 0 12
32t) Bryant, Pit. (WR) 2 0 2 0 0 12
32t) Clay, Buf. (TE) 2 0 2 0 0 12
32t) *Cooper, Oak. (WR) 2 0 2 0 0 12
32t) Crowell, Cle. (RB) 2 1 1 0 0 12
32t) Dalton, Cin. (QB) 2 2 0 0 0 12
32t) Daniels, Den. (TE) 2 0 2 0 0 12
32t) Flacco, Bal. (QB) 2 2 0 0 0 12
32t) Gates, S.D. (TE) 2 0 2 0 0 12
32t) Gillmore, Bal. (TE) 2 0 2 0 0 12
32t) *Green-Beckham, Ten. (WR) 2 0 2 0 0 12
32t) Heyward-Bey, Pit. (WR) 2 0 2 0 0 12
32t) Hillman, Den. (RB) 2 2 0 0 0 12
32t) Hogan, Buf. (WR) 2 0 2 0 0 12
32t) A. Johnson, Ind. (WR) 2 0 2 0 0 12
32t) S. Johnson, S.D. (WR) 2 0 2 0 0 12
32t) McCoy, Buf. (RB) 2 1 1 0 0 12
32t) Murray, Oak. (RB) 2 2 0 0 0 12
32t) Roberts, Oak. (WR) 2 0 2 0 0 12
32t) Sankey, Ten. (RB) 2 1 1 0 0 12
32t) Stoneburner, Mia. (TE) 2 0 2 0 0 12
32t) *Strong, Hou. (WR) 2 0 2 0 0 12
32t) Talib, Den. (DB) 2 0 0 2 0 12
32t) Taylor, Buf. (QB) 2 2 0 0 0 12
32t) S. Watkins, Buf. (WR) 2 0 2 0 0 12
32t) Woodhead, S.D. (RB) 2 2 0 0 0 12
32t) Wright, Ten. (WR) 2 0 2 0 0 12
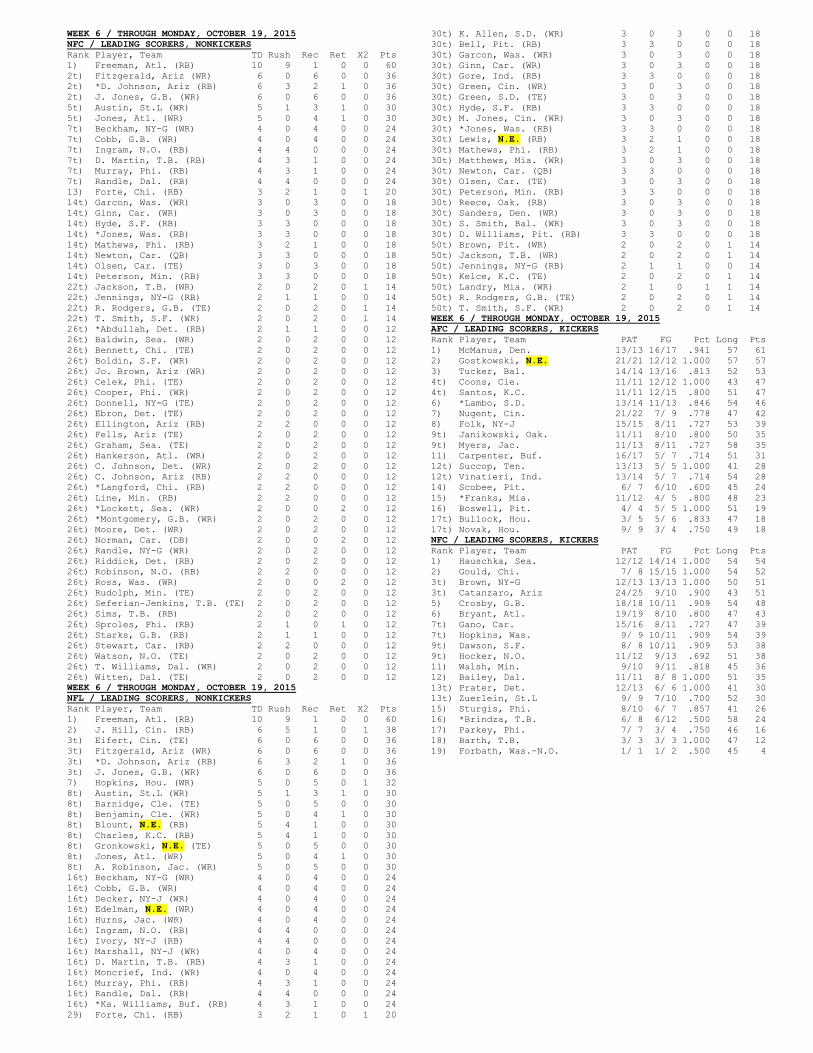
WEEK 6 / THROUGH MONDAY, OCTOBER 19, 2015
NFC / LEADING SCORERS, NONKICKERS
Rank Player, Team TD Rush Rec Ret X2 Pts
1) Freeman, Atl. (RB) 10 9 1 0 0 60
2t) Fitzgerald, Ariz (WR) 6 0 6 0 0 36
2t) *D. Johnson, Ariz (RB) 6 3 2 1 0 36
2t) J. Jones, G.B. (WR) 6 0 6 0 0 36
5t) Austin, St.L (WR) 5 1 3 1 0 30
5t) Jones, Atl. (WR) 5 0 4 1 0 30
7t) Beckham, NY-G (WR) 4 0 4 0 0 24
7t) Cobb, G.B. (WR) 4 0 4 0 0 24
7t) Ingram, N.O. (RB) 4 4 0 0 0 24
7t) D. Martin, T.B. (RB) 4 3 1 0 0 24
7t) Murray, Phi. (RB) 4 3 1 0 0 24
7t) Randle, Dal. (RB) 4 4 0 0 0 24
13) Forte, Chi. (RB) 3 2 1 0 1 20
14t) Garcon, Was. (WR) 3 0 3 0 0 18
14t) Ginn, Car. (WR) 3 0 3 0 0 18
14t) Hyde, S.F. (RB) 3 3 0 0 0 18
14t) *Jones, Was. (RB) 3 3 0 0 0 18
14t) Mathews, Phi. (RB) 3 2 1 0 0 18
14t) Newton, Car. (QB) 3 3 0 0 0 18
14t) Olsen, Car. (TE) 3 0 3 0 0 18
14t) Peterson, Min. (RB) 3 3 0 0 0 18
22t) Jackson, T.B. (WR) 2 0 2 0 1 14
22t) Jennings, NY-G (RB) 2 1 1 0 0 14
22t) R. Rodgers, G.B. (TE) 2 0 2 0 1 14
22t) T. Smith, S.F. (WR) 2 0 2 0 1 14
26t) *Abdullah, Det. (RB) 2 1 1 0 0 12
26t) Baldwin, Sea. (WR) 2 0 2 0 0 12
26t) Bennett, Chi. (TE) 2 0 2 0 0 12
26t) Boldin, S.F. (WR) 2 0 2 0 0 12
26t) Jo. Brown, Ariz (WR) 2 0 2 0 0 12
26t) Celek, Phi. (TE) 2 0 2 0 0 12
26t) Cooper, Phi. (WR) 2 0 2 0 0 12
26t) Donnell, NY-G (TE) 2 0 2 0 0 12
26t) Ebron, Det. (TE) 2 0 2 0 0 12
26t) Ellington, Ariz (RB) 2 2 0 0 0 12
26t) Fells, Ariz (TE) 2 0 2 0 0 12
26t) Graham, Sea. (TE) 2 0 2 0 0 12
26t) Hankerson, Atl. (WR) 2 0 2 0 0 12
26t) C. Johnson, Det. (WR) 2 0 2 0 0 12
26t) C. Johnson, Ariz (RB) 2 2 0 0 0 12
26t) *Langford, Chi. (RB) 2 2 0 0 0 12
26t) Line, Min. (RB) 2 2 0 0 0 12
26t) *Lockett, Sea. (WR) 2 0 0 2 0 12
26t) *Montgomery, G.B. (WR) 2 0 2 0 0 12
26t) Moore, Det. (WR) 2 0 2 0 0 12
26t) Norman, Car. (DB) 2 0 0 2 0 12
26t) Randle, NY-G (WR) 2 0 2 0 0 12
26t) Riddick, Det. (RB) 2 0 2 0 0 12
26t) Robinson, N.O. (RB) 2 2 0 0 0 12
26t) Ross, Was. (WR) 2 0 0 2 0 12
26t) Rudolph, Min. (TE) 2 0 2 0 0 12
26t) Seferian-Jenkins, T.B. (TE) 2 0 2 0 0 12
26t) Sims, T.B. (RB) 2 0 2 0 0 12
26t) Sproles, Phi. (RB) 2 1 0 1 0 12
26t) Starks, G.B. (RB) 2 1 1 0 0 12
26t) Stewart, Car. (RB) 2 2 0 0 0 12
26t) Watson, N.O. (TE) 2 0 2 0 0 12
26t) T. Williams, Dal. (WR) 2 0 2 0 0 12
26t) Witten, Dal. (TE) 2 0 2 0 0 12
WEEK 6 / THROUGH MONDAY, OCTOBER 19, 2015
NFL / LEADING SCORERS, NONKICKERS
Rank Player, Team TD Rush Rec Ret X2 Pts
1) Freeman, Atl. (RB) 10 9 1 0 0 60
2) J. Hill, Cin. (RB) 6 5 1 0 1 38
3t) Eifert, Cin. (TE) 6 0 6 0 0 36
3t) Fitzgerald, Ariz (WR) 6 0 6 0 0 36
3t) *D. Johnson, Ariz (RB) 6 3 2 1 0 36
3t) J. Jones, G.B. (WR) 6 0 6 0 0 36
7) Hopkins, Hou. (WR) 5 0 5 0 1 32
8t) Austin, St.L (WR) 5 1 3 1 0 30
8t) Barnidge, Cle. (TE) 5 0 5 0 0 30
8t) Benjamin, Cle. (WR) 5 0 4 1 0 30
8t) Blount, N.E. (RB) 5 4 1 0 0 30
8t) Charles, K.C. (RB) 5 4 1 0 0 30
8t) Gronkowski, N.E. (TE) 5 0 5 0 0 30
8t) Jones, Atl. (WR) 5 0 4 1 0 30
8t) A. Robinson, Jac. (WR) 5 0 5 0 0 30
16t) Beckham, NY-G (WR) 4 0 4 0 0 24
16t) Cobb, G.B. (WR) 4 0 4 0 0 24
16t) Decker, NY-J (WR) 4 0 4 0 0 24
16t) Edelman, N.E. (WR) 4 0 4 0 0 24
16t) Hurns, Jac. (WR) 4 0 4 0 0 24
16t) Ingram, N.O. (RB) 4 4 0 0 0 24
16t) Ivory, NY-J (RB) 4 4 0 0 0 24
16t) Marshall, NY-J (WR) 4 0 4 0 0 24
16t) D. Martin, T.B. (RB) 4 3 1 0 0 24
16t) Moncrief, Ind. (WR) 4 0 4 0 0 24
16t) Murray, Phi. (RB) 4 3 1 0 0 24
16t) Randle, Dal. (RB) 4 4 0 0 0 24
16t) *Ka. Williams, Buf. (RB) 4 3 1 0 0 24
29) Forte, Chi. (RB) 3 2 1 0 1 20
30t) K. Allen, S.D. (WR) 3 0 3 0 0 18
30t) Bell, Pit. (RB) 3 3 0 0 0 18
30t) Garcon, Was. (WR) 3 0 3 0 0 18
30t) Ginn, Car. (WR) 3 0 3 0 0 18
30t) Gore, Ind. (RB) 3 3 0 0 0 18
30t) Green, Cin. (WR) 3 0 3 0 0 18
30t) Green, S.D. (TE) 3 0 3 0 0 18
30t) Hyde, S.F. (RB) 3 3 0 0 0 18
30t) M. Jones, Cin. (WR) 3 0 3 0 0 18
30t) *Jones, Was. (RB) 3 3 0 0 0 18
30t) Lewis, N.E. (RB) 3 2 1 0 0 18
30t) Mathews, Phi. (RB) 3 2 1 0 0 18
30t) Matthews, Mia. (WR) 3 0 3 0 0 18
30t) Newton, Car. (QB) 3 3 0 0 0 18
30t) Olsen, Car. (TE) 3 0 3 0 0 18
30t) Peterson, Min. (RB) 3 3 0 0 0 18
30t) Reece, Oak. (RB) 3 0 3 0 0 18
30t) Sanders, Den. (WR) 3 0 3 0 0 18
30t) S. Smith, Bal. (WR) 3 0 3 0 0 18
30t) D. Williams, Pit. (RB) 3 3 0 0 0 18
50t) Brown, Pit. (WR) 2 0 2 0 1 14
50t) Jackson, T.B. (WR) 2 0 2 0 1 14
50t) Jennings, NY-G (RB) 2 1 1 0 0 14
50t) Kelce, K.C. (TE) 2 0 2 0 1 14
50t) Landry, Mia. (WR) 2 1 0 1 1 14
50t) R. Rodgers, G.B. (TE) 2 0 2 0 1 14
50t) T. Smith, S.F. (WR) 2 0 2 0 1 14
WEEK 6 / THROUGH MONDAY, OCTOBER 19, 2015
AFC / LEADING SCORERS, KICKERS
Rank Player, Team PAT FG Pct Long Pts
1) McManus, Den. 13/13 16/17 .941 57 61
2) Gostkowski, N.E. 21/21 12/12 1.000 57 57
3) Tucker, Bal. 14/14 13/16 .813 52 53
4t) Coons, Cle. 11/11 12/12 1.000 43 47
4t) Santos, K.C. 11/11 12/15 .800 51 47
6) *Lambo, S.D. 13/14 11/13 .846 54 46
7) Nugent, Cin. 21/22 7/ 9 .778 47 42
8) Folk, NY-J 15/15 8/11 .727 53 39
9t) Janikowski, Oak. 11/11 8/10 .800 50 35
9t) Myers, Jac. 11/13 8/11 .727 58 35
11) Carpenter, Buf. 16/17 5/ 7 .714 51 31
12t) Succop, Ten. 13/13 5/ 5 1.000 41 28
12t) Vinatieri, Ind. 13/14 5/ 7 .714 54 28
14) Scobee, Pit. 6/ 7 6/10 .600 45 24
15) *Franks, Mia. 11/12 4/ 5 .800 48 23
16) Boswell, Pit. 4/ 4 5/ 5 1.000 51 19
17t) Bullock, Hou. 3/ 5 5/ 6 .833 47 18
17t) Novak, Hou. 9/ 9 3/ 4 .750 49 18
NFC / LEADING SCORERS, KICKERS
Rank Player, Team PAT FG Pct Long Pts
1) Hauschka, Sea. 12/12 14/14 1.000 54 54
2) Gould, Chi. 7/ 8 15/15 1.000 54 52
3t) Brown, NY-G 12/13 13/13 1.000 50 51
3t) Catanzaro, Ariz 24/25 9/10 .900 43 51
5) Crosby, G.B. 18/18 10/11 .909 54 48
6) Bryant, Atl. 19/19 8/10 .800 47 43
7t) Gano, Car. 15/16 8/11 .727 47 39
7t) Hopkins, Was. 9/ 9 10/11 .909 54 39
9t) Dawson, S.F. 8/ 8 10/11 .909 53 38
9t) Hocker, N.O. 11/12 9/13 .692 51 38
11) Walsh, Min. 9/10 9/11 .818 45 36
12) Bailey, Dal. 11/11 8/ 8 1.000 51 35
13t) Prater, Det. 12/13 6/ 6 1.000 41 30
13t) Zuerlein, St.L 9/ 9 7/10 .700 52 30
15) Sturgis, Phi. 8/10 6/ 7 .857 41 26
16) *Brindza, T.B. 6/ 8 6/12 .500 58 24
17) Parkey, Phi. 7/ 7 3/ 4 .750 46 16
18) Barth, T.B. 3/ 3 3/ 3 1.000 47 12
19) Forbath, Was.-N.O. 1/ 1 1/ 2 .500 45 4
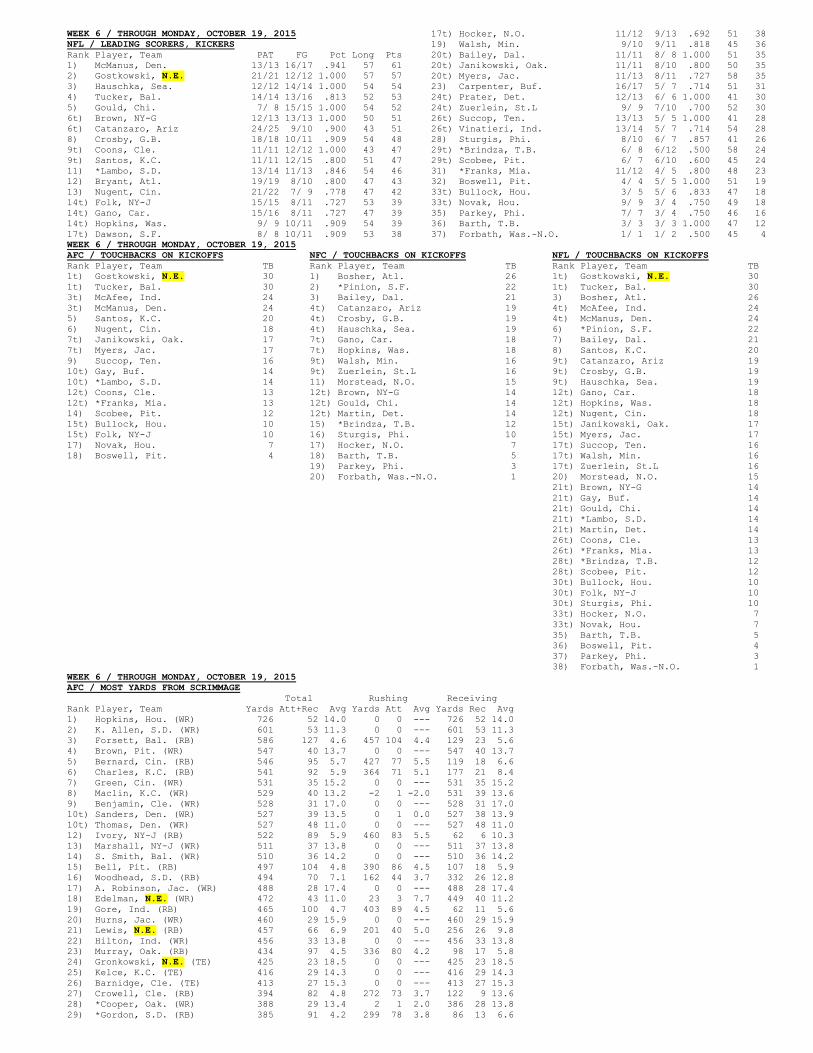
WEEK 6 / THROUGH MONDAY, OCTOBER 19, 2015
NFL / LEADING SCORERS, KICKERS
Rank Player, Team PAT FG Pct Long Pts
1) McManus, Den. 13/13 16/17 .941 57 61
2) Gostkowski, N.E. 21/21 12/12 1.000 57 57
3) Hauschka, Sea. 12/12 14/14 1.000 54 54
4) Tucker, Bal. 14/14 13/16 .813 52 53
5) Gould, Chi. 7/ 8 15/15 1.000 54 52
6t) Brown, NY-G 12/13 13/13 1.000 50 51
6t) Catanzaro, Ariz 24/25 9/10 .900 43 51
8) Crosby, G.B. 18/18 10/11 .909 54 48
9t) Coons, Cle. 11/11 12/12 1.000 43 47
9t) Santos, K.C. 11/11 12/15 .800 51 47
11) *Lambo, S.D. 13/14 11/13 .846 54 46
12) Bryant, Atl. 19/19 8/10 .800 47 43
13) Nugent, Cin. 21/22 7/ 9 .778 47 42
14t) Folk, NY-J 15/15 8/11 .727 53 39
14t) Gano, Car. 15/16 8/11 .727 47 39
14t) Hopkins, Was. 9/ 9 10/11 .909 54 39
17t) Dawson, S.F. 8/ 8 10/11 .909 53 38
17t) Hocker, N.O. 11/12 9/13 .692 51 38
19) Walsh, Min. 9/10 9/11 .818 45 36
20t) Bailey, Dal. 11/11 8/ 8 1.000 51 35
20t) Janikowski, Oak. 11/11 8/10 .800 50 35
20t) Myers, Jac. 11/13 8/11 .727 58 35
23) Carpenter, Buf. 16/17 5/ 7 .714 51 31
24t) Prater, Det. 12/13 6/ 6 1.000 41 30
24t) Zuerlein, St.L 9/ 9 7/10 .700 52 30
26t) Succop, Ten. 13/13 5/ 5 1.000 41 28
26t) Vinatieri, Ind. 13/14 5/ 7 .714 54 28
28) Sturgis, Phi. 8/10 6/ 7 .857 41 26
29t) *Brindza, T.B. 6/ 8 6/12 .500 58 24
29t) Scobee, Pit. 6/ 7 6/10 .600 45 24
31) *Franks, Mia. 11/12 4/ 5 .800 48 23
32) Boswell, Pit. 4/ 4 5/ 5 1.000 51 19
33t) Bullock, Hou. 3/ 5 5/ 6 .833 47 18
33t) Novak, Hou. 9/ 9 3/ 4 .750 49 18
35) Parkey, Phi. 7/ 7 3/ 4 .750 46 16
36) Barth, T.B. 3/ 3 3/ 3 1.000 47 12
37) Forbath, Was.-N.O. 1/ 1 1/ 2 .500 45 4
WEEK 6 / THROUGH MONDAY, OCTOBER 19, 2015
AFC / TOUCHBACKS ON KICKOFFS
Rank Player, Team TB
1t) Gostkowski, N.E. 30
1t) Tucker, Bal. 30
3t) McAfee, Ind. 24
3t) McManus, Den. 24
5) Santos, K.C. 20
6) Nugent, Cin. 18
7t) Janikowski, Oak. 17
7t) Myers, Jac. 17
9) Succop, Ten. 16
10t) Gay, Buf. 14
10t) *Lambo, S.D. 14
12t) Coons, Cle. 13
12t) *Franks, Mia. 13
14) Scobee, Pit. 12
15t) Bullock, Hou. 10
15t) Folk, NY-J 10
17) Novak, Hou. 7
18) Boswell, Pit. 4
NFC / TOUCHBACKS ON KICKOFFS
Rank Player, Team TB
1) Bosher, Atl. 26
2) *Pinion, S.F. 22
3) Bailey, Dal. 21
4t) Catanzaro, Ariz 19
4t) Crosby, G.B. 19
4t) Hauschka, Sea. 19
7t) Gano, Car. 18
7t) Hopkins, Was. 18
9t) Walsh, Min. 16
9t) Zuerlein, St.L 16
11) Morstead, N.O. 15
12t) Brown, NY-G 14
12t) Gould, Chi. 14
12t) Martin, Det. 14
15) *Brindza, T.B. 12
16) Sturgis, Phi. 10
17) Hocker, N.O. 7
18) Barth, T.B. 5
19) Parkey, Phi. 3
20) Forbath, Was.-N.O. 1
NFL / TOUCHBACKS ON KICKOFFS
Rank Player, Team TB
1t) Gostkowski, N.E. 30
1t) Tucker, Bal. 30
3) Bosher, Atl. 26
4t) McAfee, Ind. 24
4t) McManus, Den. 24
6) *Pinion, S.F. 22
7) Bailey, Dal. 21
8) Santos, K.C. 20
9t) Catanzaro, Ariz 19
9t) Crosby, G.B. 19
9t) Hauschka, Sea. 19
12t) Gano, Car. 18
12t) Hopkins, Was. 18
12t) Nugent, Cin. 18
15t) Janikowski, Oak. 17
15t) Myers, Jac. 17
17t) Succop, Ten. 16
17t) Walsh, Min. 16
17t) Zuerlein, St.L 16
20) Morstead, N.O. 15
21t) Brown, NY-G 14
21t) Gay, Buf. 14
21t) Gould, Chi. 14
21t) *Lambo, S.D. 14
21t) Martin, Det. 14
26t) Coons, Cle. 13
26t) *Franks, Mia. 13
28t) *Brindza, T.B. 12
28t) Scobee, Pit. 12
30t) Bullock, Hou. 10
30t) Folk, NY-J 10
30t) Sturgis, Phi. 10
33t) Hocker, N.O. 7
33t) Novak, Hou. 7
35) Barth, T.B. 5
36) Boswell, Pit. 4
37) Parkey, Phi. 3
38) Forbath, Was.-N.O. 1
WEEK 6 / THROUGH MONDAY, OCTOBER 19, 2015
AFC / MOST YARDS FROM SCRIMMAGE
Total Rushing Receiving
Rank Player, Team Yards Att+Rec Avg Yards Att Avg Yards Rec Avg
1) Hopkins, Hou. (WR) 726 52 14.0 0 0 --- 726 52 14.0
2) K. Allen, S.D. (WR) 601 53 11.3 0 0 --- 601 53 11.3
3) Forsett, Bal. (RB) 586 127 4.6 457 104 4.4 129 23 5.6
4) Brown, Pit. (WR) 547 40 13.7 0 0 --- 547 40 13.7
5) Bernard, Cin. (RB) 546 95 5.7 427 77 5.5 119 18 6.6
6) Charles, K.C. (RB) 541 92 5.9 364 71 5.1 177 21 8.4
7) Green, Cin. (WR) 531 35 15.2 0 0 --- 531 35 15.2
8) Maclin, K.C. (WR) 529 40 13.2 -2 1 -2.0 531 39 13.6
9) Benjamin, Cle. (WR) 528 31 17.0 0 0 --- 528 31 17.0
10t) Sanders, Den. (WR) 527 39 13.5 0 1 0.0 527 38 13.9
10t) Thomas, Den. (WR) 527 48 11.0 0 0 --- 527 48 11.0
12) Ivory, NY-J (RB) 522 89 5.9 460 83 5.5 62 6 10.3
13) Marshall, NY-J (WR) 511 37 13.8 0 0 --- 511 37 13.8
14) S. Smith, Bal. (WR) 510 36 14.2 0 0 --- 510 36 14.2
15) Bell, Pit. (RB) 497 104 4.8 390 86 4.5 107 18 5.9
16) Woodhead, S.D. (RB) 494 70 7.1 162 44 3.7 332 26 12.8
17) A. Robinson, Jac. (WR) 488 28 17.4 0 0 --- 488 28 17.4
18) Edelman, N.E. (WR) 472 43 11.0 23 3 7.7 449 40 11.2
19) Gore, Ind. (RB) 465 100 4.7 403 89 4.5 62 11 5.6
20) Hurns, Jac. (WR) 460 29 15.9 0 0 --- 460 29 15.9
21) Lewis, N.E. (RB) 457 66 6.9 201 40 5.0 256 26 9.8
22) Hilton, Ind. (WR) 456 33 13.8 0 0 --- 456 33 13.8
23) Murray, Oak. (RB) 434 97 4.5 336 80 4.2 98 17 5.8
24) Gronkowski, N.E. (TE) 425 23 18.5 0 0 --- 425 23 18.5
25) Kelce, K.C. (TE) 416 29 14.3 0 0 --- 416 29 14.3
26) Barnidge, Cle. (TE) 413 27 15.3 0 0 --- 413 27 15.3
27) Crowell, Cle. (RB) 394 82 4.8 272 73 3.7 122 9 13.6
28) *Cooper, Oak. (WR) 388 29 13.4 2 1 2.0 386 28 13.8
29) *Gordon, S.D. (RB) 385 91 4.2 299 78 3.8 86 13 6.6
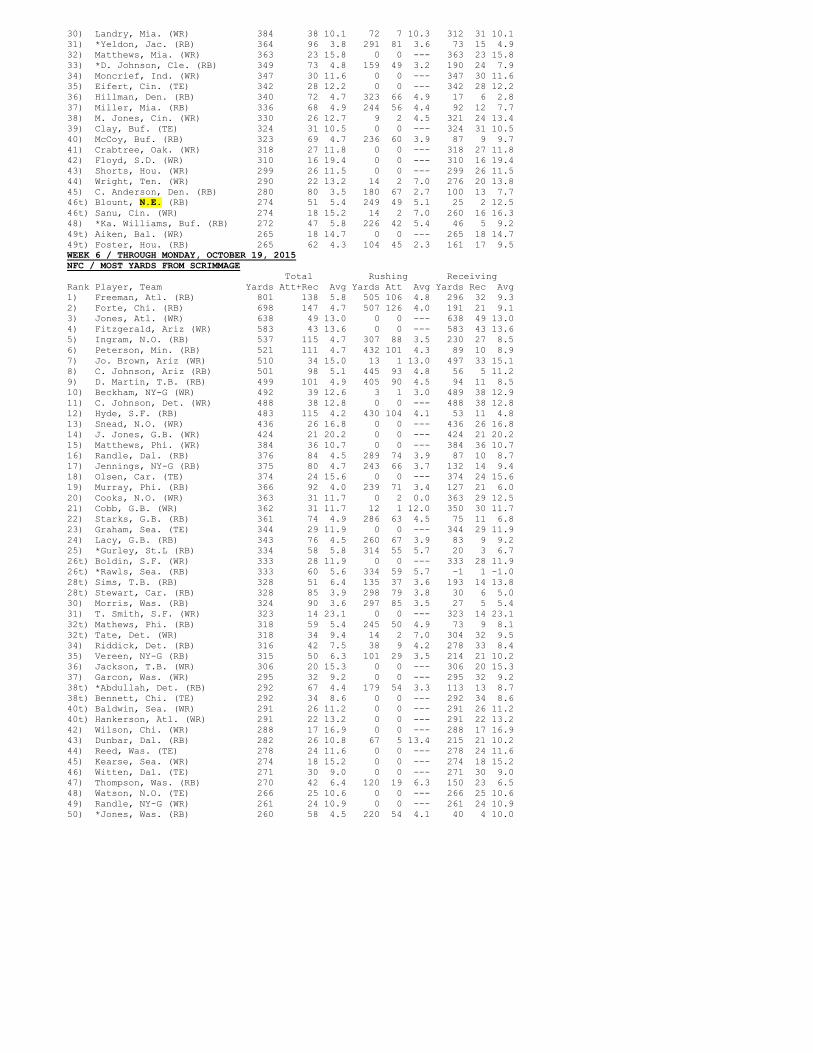
30) Landry, Mia. (WR) 384 38 10.1 72 7 10.3 312 31 10.1
31) *Yeldon, Jac. (RB) 364 96 3.8 291 81 3.6 73 15 4.9
32) Matthews, Mia. (WR) 363 23 15.8 0 0 --- 363 23 15.8
33) *D. Johnson, Cle. (RB) 349 73 4.8 159 49 3.2 190 24 7.9
34) Moncrief, Ind. (WR) 347 30 11.6 0 0 --- 347 30 11.6
35) Eifert, Cin. (TE) 342 28 12.2 0 0 --- 342 28 12.2
36) Hillman, Den. (RB) 340 72 4.7 323 66 4.9 17 6 2.8
37) Miller, Mia. (RB) 336 68 4.9 244 56 4.4 92 12 7.7
38) M. Jones, Cin. (WR) 330 26 12.7 9 2 4.5 321 24 13.4
39) Clay, Buf. (TE) 324 31 10.5 0 0 --- 324 31 10.5
40) McCoy, Buf. (RB) 323 69 4.7 236 60 3.9 87 9 9.7
41) Crabtree, Oak. (WR) 318 27 11.8 0 0 --- 318 27 11.8
42) Floyd, S.D. (WR) 310 16 19.4 0 0 --- 310 16 19.4
43) Shorts, Hou. (WR) 299 26 11.5 0 0 --- 299 26 11.5
44) Wright, Ten. (WR) 290 22 13.2 14 2 7.0 276 20 13.8
45) C. Anderson, Den. (RB) 280 80 3.5 180 67 2.7 100 13 7.7
46t) Blount, N.E. (RB) 274 51 5.4 249 49 5.1 25 2 12.5
46t) Sanu, Cin. (WR) 274 18 15.2 14 2 7.0 260 16 16.3
48) *Ka. Williams, Buf. (RB) 272 47 5.8 226 42 5.4 46 5 9.2
49t) Aiken, Bal. (WR) 265 18 14.7 0 0 --- 265 18 14.7
49t) Foster, Hou. (RB) 265 62 4.3 104 45 2.3 161 17 9.5
WEEK 6 / THROUGH MONDAY, OCTOBER 19, 2015
NFC / MOST YARDS FROM SCRIMMAGE
Total Rushing Receiving
Rank Player, Team Yards Att+Rec Avg Yards Att Avg Yards Rec Avg
1) Freeman, Atl. (RB) 801 138 5.8 505 106 4.8 296 32 9.3
2) Forte, Chi. (RB) 698 147 4.7 507 126 4.0 191 21 9.1
3) Jones, Atl. (WR) 638 49 13.0 0 0 --- 638 49 13.0
4) Fitzgerald, Ariz (WR) 583 43 13.6 0 0 --- 583 43 13.6
5) Ingram, N.O. (RB) 537 115 4.7 307 88 3.5 230 27 8.5
6) Peterson, Min. (RB) 521 111 4.7 432 101 4.3 89 10 8.9
7) Jo. Brown, Ariz (WR) 510 34 15.0 13 1 13.0 497 33 15.1
8) C. Johnson, Ariz (RB) 501 98 5.1 445 93 4.8 56 5 11.2
9) D. Martin, T.B. (RB) 499 101 4.9 405 90 4.5 94 11 8.5
10) Beckham, NY-G (WR) 492 39 12.6 3 1 3.0 489 38 12.9
11) C. Johnson, Det. (WR) 488 38 12.8 0 0 --- 488 38 12.8
12) Hyde, S.F. (RB) 483 115 4.2 430 104 4.1 53 11 4.8
13) Snead, N.O. (WR) 436 26 16.8 0 0 --- 436 26 16.8
14) J. Jones, G.B. (WR) 424 21 20.2 0 0 --- 424 21 20.2
15) Matthews, Phi. (WR) 384 36 10.7 0 0 --- 384 36 10.7
16) Randle, Dal. (RB) 376 84 4.5 289 74 3.9 87 10 8.7
17) Jennings, NY-G (RB) 375 80 4.7 243 66 3.7 132 14 9.4
18) Olsen, Car. (TE) 374 24 15.6 0 0 --- 374 24 15.6
19) Murray, Phi. (RB) 366 92 4.0 239 71 3.4 127 21 6.0
20) Cooks, N.O. (WR) 363 31 11.7 0 2 0.0 363 29 12.5
21) Cobb, G.B. (WR) 362 31 11.7 12 1 12.0 350 30 11.7
22) Starks, G.B. (RB) 361 74 4.9 286 63 4.5 75 11 6.8
23) Graham, Sea. (TE) 344 29 11.9 0 0 --- 344 29 11.9
24) Lacy, G.B. (RB) 343 76 4.5 260 67 3.9 83 9 9.2
25) *Gurley, St.L (RB) 334 58 5.8 314 55 5.7 20 3 6.7
26t) Boldin, S.F. (WR) 333 28 11.9 0 0 --- 333 28 11.9
26t) *Rawls, Sea. (RB) 333 60 5.6 334 59 5.7 -1 1 -1.0
28t) Sims, T.B. (RB) 328 51 6.4 135 37 3.6 193 14 13.8
28t) Stewart, Car. (RB) 328 85 3.9 298 79 3.8 30 6 5.0
30) Morris, Was. (RB) 324 90 3.6 297 85 3.5 27 5 5.4
31) T. Smith, S.F. (WR) 323 14 23.1 0 0 --- 323 14 23.1
32t) Mathews, Phi. (RB) 318 59 5.4 245 50 4.9 73 9 8.1
32t) Tate, Det. (WR) 318 34 9.4 14 2 7.0 304 32 9.5
34) Riddick, Det. (RB) 316 42 7.5 38 9 4.2 278 33 8.4
35) Vereen, NY-G (RB) 315 50 6.3 101 29 3.5 214 21 10.2
36) Jackson, T.B. (WR) 306 20 15.3 0 0 --- 306 20 15.3
37) Garcon, Was. (WR) 295 32 9.2 0 0 --- 295 32 9.2
38t) *Abdullah, Det. (RB) 292 67 4.4 179 54 3.3 113 13 8.7
38t) Bennett, Chi. (TE) 292 34 8.6 0 0 --- 292 34 8.6
40t) Baldwin, Sea. (WR) 291 26 11.2 0 0 --- 291 26 11.2
40t) Hankerson, Atl. (WR) 291 22 13.2 0 0 --- 291 22 13.2
42) Wilson, Chi. (WR) 288 17 16.9 0 0 --- 288 17 16.9
43) Dunbar, Dal. (RB) 282 26 10.8 67 5 13.4 215 21 10.2
44) Reed, Was. (TE) 278 24 11.6 0 0 --- 278 24 11.6
45) Kearse, Sea. (WR) 274 18 15.2 0 0 --- 274 18 15.2
46) Witten, Dal. (TE) 271 30 9.0 0 0 --- 271 30 9.0
47) Thompson, Was. (RB) 270 42 6.4 120 19 6.3 150 23 6.5
48) Watson, N.O. (TE) 266 25 10.6 0 0 --- 266 25 10.6
49) Randle, NY-G (WR) 261 24 10.9 0 0 --- 261 24 10.9
50) *Jones, Was. (RB) 260 58 4.5 220 54 4.1 40 4 10.0
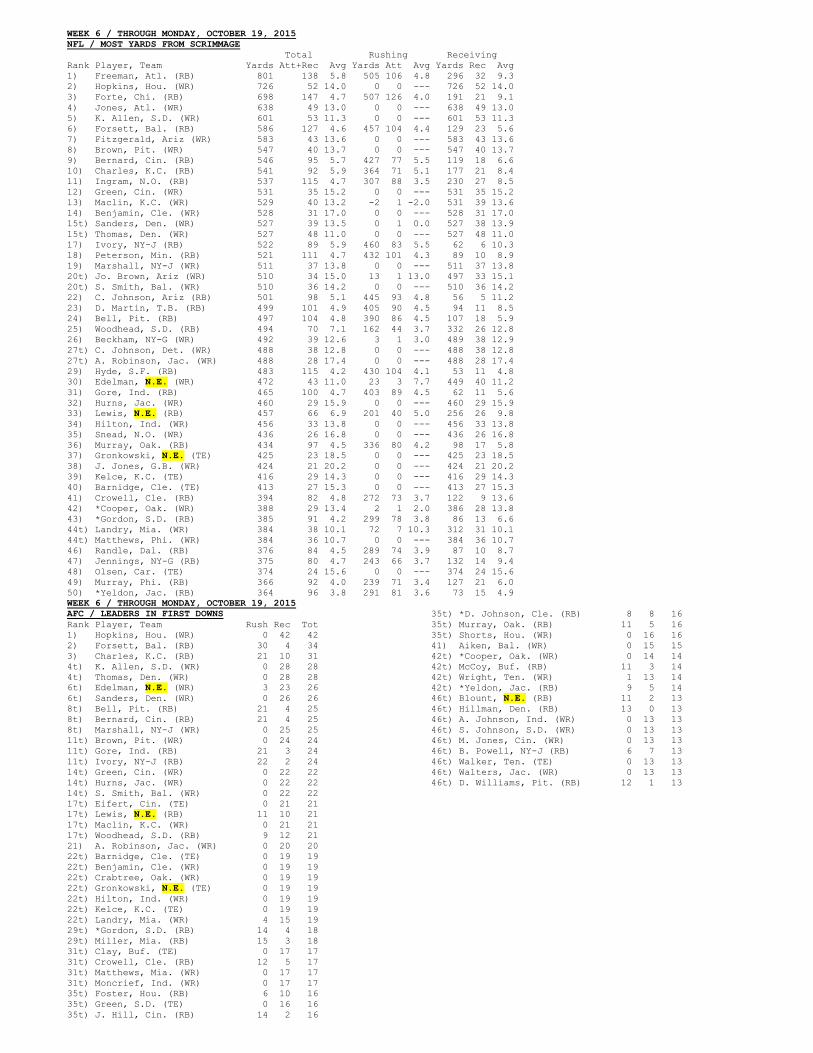
WEEK 6 / THROUGH MONDAY, OCTOBER 19, 2015
NFL / MOST YARDS FROM SCRIMMAGE
Total Rushing Receiving
Rank Player, Team Yards Att+Rec Avg Yards Att Avg Yards Rec Avg
1) Freeman, Atl. (RB) 801 138 5.8 505 106 4.8 296 32 9.3
2) Hopkins, Hou. (WR) 726 52 14.0 0 0 --- 726 52 14.0
3) Forte, Chi. (RB) 698 147 4.7 507 126 4.0 191 21 9.1
4) Jones, Atl. (WR) 638 49 13.0 0 0 --- 638 49 13.0
5) K. Allen, S.D. (WR) 601 53 11.3 0 0 --- 601 53 11.3
6) Forsett, Bal. (RB) 586 127 4.6 457 104 4.4 129 23 5.6
7) Fitzgerald, Ariz (WR) 583 43 13.6 0 0 --- 583 43 13.6
8) Brown, Pit. (WR) 547 40 13.7 0 0 --- 547 40 13.7
9) Bernard, Cin. (RB) 546 95 5.7 427 77 5.5 119 18 6.6
10) Charles, K.C. (RB) 541 92 5.9 364 71 5.1 177 21 8.4
11) Ingram, N.O. (RB) 537 115 4.7 307 88 3.5 230 27 8.5
12) Green, Cin. (WR) 531 35 15.2 0 0 --- 531 35 15.2
13) Maclin, K.C. (WR) 529 40 13.2 -2 1 -2.0 531 39 13.6
14) Benjamin, Cle. (WR) 528 31 17.0 0 0 --- 528 31 17.0
15t) Sanders, Den. (WR) 527 39 13.5 0 1 0.0 527 38 13.9
15t) Thomas, Den. (WR) 527 48 11.0 0 0 --- 527 48 11.0
17) Ivory, NY-J (RB) 522 89 5.9 460 83 5.5 62 6 10.3
18) Peterson, Min. (RB) 521 111 4.7 432 101 4.3 89 10 8.9
19) Marshall, NY-J (WR) 511 37 13.8 0 0 --- 511 37 13.8
20t) Jo. Brown, Ariz (WR) 510 34 15.0 13 1 13.0 497 33 15.1
20t) S. Smith, Bal. (WR) 510 36 14.2 0 0 --- 510 36 14.2
22) C. Johnson, Ariz (RB) 501 98 5.1 445 93 4.8 56 5 11.2
23) D. Martin, T.B. (RB) 499 101 4.9 405 90 4.5 94 11 8.5
24) Bell, Pit. (RB) 497 104 4.8 390 86 4.5 107 18 5.9
25) Woodhead, S.D. (RB) 494 70 7.1 162 44 3.7 332 26 12.8
26) Beckham, NY-G (WR) 492 39 12.6 3 1 3.0 489 38 12.9
27t) C. Johnson, Det. (WR) 488 38 12.8 0 0 --- 488 38 12.8
27t) A. Robinson, Jac. (WR) 488 28 17.4 0 0 --- 488 28 17.4
29) Hyde, S.F. (RB) 483 115 4.2 430 104 4.1 53 11 4.8
30) Edelman, N.E. (WR) 472 43 11.0 23 3 7.7 449 40 11.2
31) Gore, Ind. (RB) 465 100 4.7 403 89 4.5 62 11 5.6
32) Hurns, Jac. (WR) 460 29 15.9 0 0 --- 460 29 15.9
33) Lewis, N.E. (RB) 457 66 6.9 201 40 5.0 256 26 9.8
34) Hilton, Ind. (WR) 456 33 13.8 0 0 --- 456 33 13.8
35) Snead, N.O. (WR) 436 26 16.8 0 0 --- 436 26 16.8
36) Murray, Oak. (RB) 434 97 4.5 336 80 4.2 98 17 5.8
37) Gronkowski, N.E. (TE) 425 23 18.5 0 0 --- 425 23 18.5
38) J. Jones, G.B. (WR) 424 21 20.2 0 0 --- 424 21 20.2
39) Kelce, K.C. (TE) 416 29 14.3 0 0 --- 416 29 14.3
40) Barnidge, Cle. (TE) 413 27 15.3 0 0 --- 413 27 15.3
41) Crowell, Cle. (RB) 394 82 4.8 272 73 3.7 122 9 13.6
42) *Cooper, Oak. (WR) 388 29 13.4 2 1 2.0 386 28 13.8
43) *Gordon, S.D. (RB) 385 91 4.2 299 78 3.8 86 13 6.6
44t) Landry, Mia. (WR) 384 38 10.1 72 7 10.3 312 31 10.1
44t) Matthews, Phi. (WR) 384 36 10.7 0 0 --- 384 36 10.7
46) Randle, Dal. (RB) 376 84 4.5 289 74 3.9 87 10 8.7
47) Jennings, NY-G (RB) 375 80 4.7 243 66 3.7 132 14 9.4
48) Olsen, Car. (TE) 374 24 15.6 0 0 --- 374 24 15.6
49) Murray, Phi. (RB) 366 92 4.0 239 71 3.4 127 21 6.0
50) *Yeldon, Jac. (RB) 364 96 3.8 291 81 3.6 73 15 4.9
WEEK 6 / THROUGH MONDAY, OCTOBER 19, 2015
AFC / LEADERS IN FIRST DOWNS
Rank Player, Team Rush Rec Tot
1) Hopkins, Hou. (WR) 0 42 42
2) Forsett, Bal. (RB) 30 4 34
3) Charles, K.C. (RB) 21 10 31
4t) K. Allen, S.D. (WR) 0 28 28
4t) Thomas, Den. (WR) 0 28 28
6t) Edelman, N.E. (WR) 3 23 26
6t) Sanders, Den. (WR) 0 26 26
8t) Bell, Pit. (RB) 21 4 25
8t) Bernard, Cin. (RB) 21 4 25
8t) Marshall, NY-J (WR) 0 25 25
11t) Brown, Pit. (WR) 0 24 24
11t) Gore, Ind. (RB) 21 3 24
11t) Ivory, NY-J (RB) 22 2 24
14t) Green, Cin. (WR) 0 22 22
14t) Hurns, Jac. (WR) 0 22 22
14t) S. Smith, Bal. (WR) 0 22 22
17t) Eifert, Cin. (TE) 0 21 21
17t) Lewis, N.E. (RB) 11 10 21
17t) Maclin, K.C. (WR) 0 21 21
17t) Woodhead, S.D. (RB) 9 12 21
21) A. Robinson, Jac. (WR) 0 20 20
22t) Barnidge, Cle. (TE) 0 19 19
22t) Benjamin, Cle. (WR) 0 19 19
22t) Crabtree, Oak. (WR) 0 19 19
22t) Gronkowski, N.E. (TE) 0 19 19
22t) Hilton, Ind. (WR) 0 19 19
22t) Kelce, K.C. (TE) 0 19 19
22t) Landry, Mia. (WR) 4 15 19
29t) *Gordon, S.D. (RB) 14 4 18
29t) Miller, Mia. (RB) 15 3 18
31t) Clay, Buf. (TE) 0 17 17
31t) Crowell, Cle. (RB) 12 5 17
31t) Matthews, Mia. (WR) 0 17 17
31t) Moncrief, Ind. (WR) 0 17 17
35t) Foster, Hou. (RB) 6 10 16
35t) Green, S.D. (TE) 0 16 16
35t) J. Hill, Cin. (RB) 14 2 16
35t) *D. Johnson, Cle. (RB) 8 8 16
35t) Murray, Oak. (RB) 11 5 16
35t) Shorts, Hou. (WR) 0 16 16
41) Aiken, Bal. (WR) 0 15 15
42t) *Cooper, Oak. (WR) 0 14 14
42t) McCoy, Buf. (RB) 11 3 14
42t) Wright, Ten. (WR) 1 13 14
42t) *Yeldon, Jac. (RB) 9 5 14
46t) Blount, N.E. (RB) 11 2 13
46t) Hillman, Den. (RB) 13 0 13
46t) A. Johnson, Ind. (WR) 0 13 13
46t) S. Johnson, S.D. (WR) 0 13 13
46t) M. Jones, Cin. (WR) 0 13 13
46t) B. Powell, NY-J (RB) 6 7 13
46t) Walker, Ten. (TE) 0 13 13
46t) Walters, Jac. (WR) 0 13 13
46t) D. Williams, Pit. (RB) 12 1 13
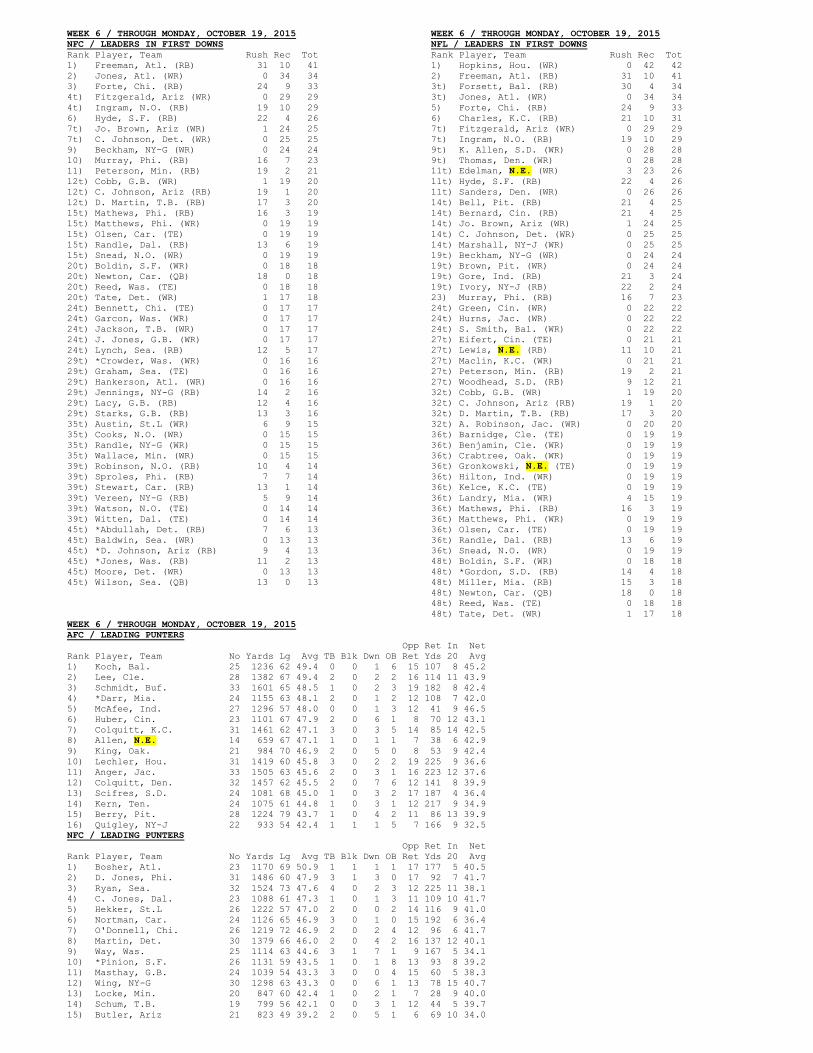
WEEK 6 / THROUGH MONDAY, OCTOBER 19, 2015
NFC / LEADERS IN FIRST DOWNS
Rank Player, Team Rush Rec Tot
1) Freeman, Atl. (RB) 31 10 41
2) Jones, Atl. (WR) 0 34 34
3) Forte, Chi. (RB) 24 9 33
4t) Fitzgerald, Ariz (WR) 0 29 29
4t) Ingram, N.O. (RB) 19 10 29
6) Hyde, S.F. (RB) 22 4 26
7t) Jo. Brown, Ariz (WR) 1 24 25
7t) C. Johnson, Det. (WR) 0 25 25
9) Beckham, NY-G (WR) 0 24 24
10) Murray, Phi. (RB) 16 7 23
11) Peterson, Min. (RB) 19 2 21
12t) Cobb, G.B. (WR) 1 19 20
12t) C. Johnson, Ariz (RB) 19 1 20
12t) D. Martin, T.B. (RB) 17 3 20
15t) Mathews, Phi. (RB) 16 3 19
15t) Matthews, Phi. (WR) 0 19 19
15t) Olsen, Car. (TE) 0 19 19
15t) Randle, Dal. (RB) 13 6 19
15t) Snead, N.O. (WR) 0 19 19
20t) Boldin, S.F. (WR) 0 18 18
20t) Newton, Car. (QB) 18 0 18
20t) Reed, Was. (TE) 0 18 18
20t) Tate, Det. (WR) 1 17 18
24t) Bennett, Chi. (TE) 0 17 17
24t) Garcon, Was. (WR) 0 17 17
24t) Jackson, T.B. (WR) 0 17 17
24t) J. Jones, G.B. (WR) 0 17 17
24t) Lynch, Sea. (RB) 12 5 17
29t) *Crowder, Was. (WR) 0 16 16
29t) Graham, Sea. (TE) 0 16 16
29t) Hankerson, Atl. (WR) 0 16 16
29t) Jennings, NY-G (RB) 14 2 16
29t) Lacy, G.B. (RB) 12 4 16
29t) Starks, G.B. (RB) 13 3 16
35t) Austin, St.L (WR) 6 9 15
35t) Cooks, N.O. (WR) 0 15 15
35t) Randle, NY-G (WR) 0 15 15
35t) Wallace, Min. (WR) 0 15 15
39t) Robinson, N.O. (RB) 10 4 14
39t) Sproles, Phi. (RB) 7 7 14
39t) Stewart, Car. (RB) 13 1 14
39t) Vereen, NY-G (RB) 5 9 14
39t) Watson, N.O. (TE) 0 14 14
39t) Witten, Dal. (TE) 0 14 14
45t) *Abdullah, Det. (RB) 7 6 13
45t) Baldwin, Sea. (WR) 0 13 13
45t) *D. Johnson, Ariz (RB) 9 4 13
45t) *Jones, Was. (RB) 11 2 13
45t) Moore, Det. (WR) 0 13 13
45t) Wilson, Sea. (QB) 13 0 13
WEEK 6 / THROUGH MONDAY, OCTOBER 19, 2015
NFL / LEADERS IN FIRST DOWNS
Rank Player, Team Rush Rec Tot
1) Hopkins, Hou. (WR) 0 42 42
2) Freeman, Atl. (RB) 31 10 41
3t) Forsett, Bal. (RB) 30 4 34
3t) Jones, Atl. (WR) 0 34 34
5) Forte, Chi. (RB) 24 9 33
6) Charles, K.C. (RB) 21 10 31
7t) Fitzgerald, Ariz (WR) 0 29 29
7t) Ingram, N.O. (RB) 19 10 29
9t) K. Allen, S.D. (WR) 0 28 28
9t) Thomas, Den. (WR) 0 28 28
11t) Edelman, N.E. (WR) 3 23 26
11t) Hyde, S.F. (RB) 22 4 26
11t) Sanders, Den. (WR) 0 26 26
14t) Bell, Pit. (RB) 21 4 25
14t) Bernard, Cin. (RB) 21 4 25
14t) Jo. Brown, Ariz (WR) 1 24 25
14t) C. Johnson, Det. (WR) 0 25 25
14t) Marshall, NY-J (WR) 0 25 25
19t) Beckham, NY-G (WR) 0 24 24
19t) Brown, Pit. (WR) 0 24 24
19t) Gore, Ind. (RB) 21 3 24
19t) Ivory, NY-J (RB) 22 2 24
23) Murray, Phi. (RB) 16 7 23
24t) Green, Cin. (WR) 0 22 22
24t) Hurns, Jac. (WR) 0 22 22
24t) S. Smith, Bal. (WR) 0 22 22
27t) Eifert, Cin. (TE) 0 21 21
27t) Lewis, N.E. (RB) 11 10 21
27t) Maclin, K.C. (WR) 0 21 21
27t) Peterson, Min. (RB) 19 2 21
27t) Woodhead, S.D. (RB) 9 12 21
32t) Cobb, G.B. (WR) 1 19 20
32t) C. Johnson, Ariz (RB) 19 1 20
32t) D. Martin, T.B. (RB) 17 3 20
32t) A. Robinson, Jac. (WR) 0 20 20
36t) Barnidge, Cle. (TE) 0 19 19
36t) Benjamin, Cle. (WR) 0 19 19
36t) Crabtree, Oak. (WR) 0 19 19
36t) Gronkowski, N.E. (TE) 0 19 19
36t) Hilton, Ind. (WR) 0 19 19
36t) Kelce, K.C. (TE) 0 19 19
36t) Landry, Mia. (WR) 4 15 19
36t) Mathews, Phi. (RB) 16 3 19
36t) Matthews, Phi. (WR) 0 19 19
36t) Olsen, Car. (TE) 0 19 19
36t) Randle, Dal. (RB) 13 6 19
36t) Snead, N.O. (WR) 0 19 19
48t) Boldin, S.F. (WR) 0 18 18
48t) *Gordon, S.D. (RB) 14 4 18
48t) Miller, Mia. (RB) 15 3 18
48t) Newton, Car. (QB) 18 0 18
48t) Reed, Was. (TE) 0 18 18
48t) Tate, Det. (WR) 1 17 18
WEEK 6 / THROUGH MONDAY, OCTOBER 19, 2015
AFC / LEADING PUNTERS
Opp Ret In Net
Rank Player, Team No Yards Lg Avg TB Blk Dwn OB Ret Yds 20 Avg
1) Koch, Bal. 25 1236 62 49.4 0 0 1 6 15 107 8 45.2
2) Lee, Cle. 28 1382 67 49.4 2 0 2 2 16 114 11 43.9
3) Schmidt, Buf. 33 1601 65 48.5 1 0 2 3 19 182 8 42.4
4) *Darr, Mia. 24 1155 63 48.1 2 0 1 2 12 108 7 42.0
5) McAfee, Ind. 27 1296 57 48.0 0 0 1 3 12 41 9 46.5
6) Huber, Cin. 23 1101 67 47.9 2 0 6 1 8 70 12 43.1
7) Colquitt, K.C. 31 1461 62 47.1 3 0 3 5 14 85 14 42.5
8) Allen, N.E. 14 659 67 47.1 1 0 1 1 7 38 6 42.9
9) King, Oak. 21 984 70 46.9 2 0 5 0 8 53 9 42.4
10) Lechler, Hou. 31 1419 60 45.8 3 0 2 2 19 225 9 36.6
11) Anger, Jac. 33 1505 63 45.6 2 0 3 1 16 223 12 37.6
12) Colquitt, Den. 32 1457 62 45.5 2 0 7 6 12 141 8 39.9
13) Scifres, S.D. 24 1081 68 45.0 1 0 3 2 17 187 4 36.4
14) Kern, Ten. 24 1075 61 44.8 1 0 3 1 12 217 9 34.9
15) Berry, Pit. 28 1224 79 43.7 1 0 4 2 11 86 13 39.9
16) Quigley, NY-J 22 933 54 42.4 1 1 1 5 7 166 9 32.5
NFC / LEADING PUNTERS
Opp Ret In Net
Rank Player, Team No Yards Lg Avg TB Blk Dwn OB Ret Yds 20 Avg
1) Bosher, Atl. 23 1170 69 50.9 1 1 1 1 17 177 5 40.5
2) D. Jones, Phi. 31 1486 60 47.9 3 1 3 0 17 92 7 41.7
3) Ryan, Sea. 32 1524 73 47.6 4 0 2 3 12 225 11 38.1
4) C. Jones, Dal. 23 1088 61 47.3 1 0 1 3 11 109 10 41.7
5) Hekker, St.L 26 1222 57 47.0 2 0 0 2 14 116 9 41.0
6) Nortman, Car. 24 1126 65 46.9 3 0 1 0 15 192 6 36.4
7) O'Donnell, Chi. 26 1219 72 46.9 2 0 2 4 12 96 6 41.7
8) Martin, Det. 30 1379 66 46.0 2 0 4 2 16 137 12 40.1
9) Way, Was. 25 1114 63 44.6 3 1 7 1 9 167 5 34.1
10) *Pinion, S.F. 26 1131 59 43.5 1 0 1 8 13 93 8 39.2
11) Masthay, G.B. 24 1039 54 43.3 3 0 0 4 15 60 5 38.3
12) Wing, NY-G 30 1298 63 43.3 0 0 6 1 13 78 15 40.7
13) Locke, Min. 20 847 60 42.4 1 0 2 1 7 28 9 40.0
14) Schum, T.B. 19 799 56 42.1 0 0 3 1 12 44 5 39.7
15) Butler, Ariz 21 823 49 39.2 2 0 5 1 6 69 10 34.0
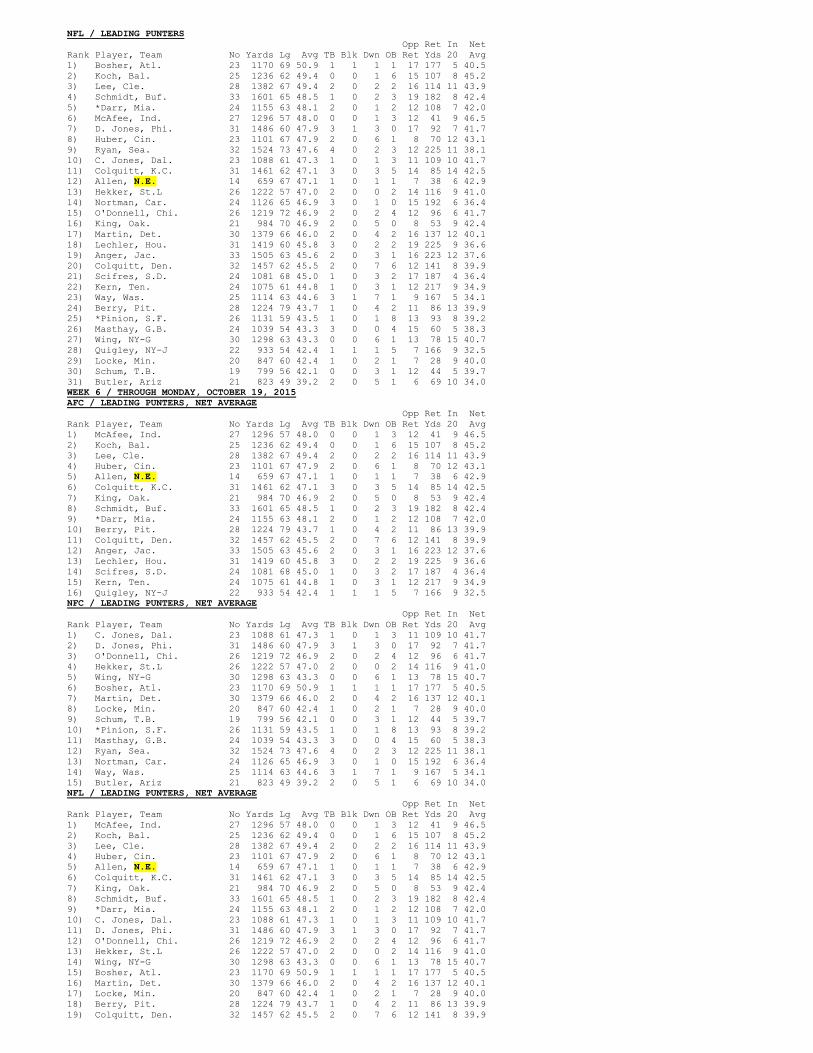
NFL / LEADING PUNTERS
Opp Ret In Net
Rank Player, Team No Yards Lg Avg TB Blk Dwn OB Ret Yds 20 Avg
1) Bosher, Atl. 23 1170 69 50.9 1 1 1 1 17 177 5 40.5
2) Koch, Bal. 25 1236 62 49.4 0 0 1 6 15 107 8 45.2
3) Lee, Cle. 28 1382 67 49.4 2 0 2 2 16 114 11 43.9
4) Schmidt, Buf. 33 1601 65 48.5 1 0 2 3 19 182 8 42.4
5) *Darr, Mia. 24 1155 63 48.1 2 0 1 2 12 108 7 42.0
6) McAfee, Ind. 27 1296 57 48.0 0 0 1 3 12 41 9 46.5
7) D. Jones, Phi. 31 1486 60 47.9 3 1 3 0 17 92 7 41.7
8) Huber, Cin. 23 1101 67 47.9 2 0 6 1 8 70 12 43.1
9) Ryan, Sea. 32 1524 73 47.6 4 0 2 3 12 225 11 38.1
10) C. Jones, Dal. 23 1088 61 47.3 1 0 1 3 11 109 10 41.7
11) Colquitt, K.C. 31 1461 62 47.1 3 0 3 5 14 85 14 42.5
12) Allen, N.E. 14 659 67 47.1 1 0 1 1 7 38 6 42.9
13) Hekker, St.L 26 1222 57 47.0 2 0 0 2 14 116 9 41.0
14) Nortman, Car. 24 1126 65 46.9 3 0 1 0 15 192 6 36.4
15) O'Donnell, Chi. 26 1219 72 46.9 2 0 2 4 12 96 6 41.7
16) King, Oak. 21 984 70 46.9 2 0 5 0 8 53 9 42.4
17) Martin, Det. 30 1379 66 46.0 2 0 4 2 16 137 12 40.1
18) Lechler, Hou. 31 1419 60 45.8 3 0 2 2 19 225 9 36.6
19) Anger, Jac. 33 1505 63 45.6 2 0 3 1 16 223 12 37.6
20) Colquitt, Den. 32 1457 62 45.5 2 0 7 6 12 141 8 39.9
21) Scifres, S.D. 24 1081 68 45.0 1 0 3 2 17 187 4 36.4
22) Kern, Ten. 24 1075 61 44.8 1 0 3 1 12 217 9 34.9
23) Way, Was. 25 1114 63 44.6 3 1 7 1 9 167 5 34.1
24) Berry, Pit. 28 1224 79 43.7 1 0 4 2 11 86 13 39.9
25) *Pinion, S.F. 26 1131 59 43.5 1 0 1 8 13 93 8 39.2
26) Masthay, G.B. 24 1039 54 43.3 3 0 0 4 15 60 5 38.3
27) Wing, NY-G 30 1298 63 43.3 0 0 6 1 13 78 15 40.7
28) Quigley, NY-J 22 933 54 42.4 1 1 1 5 7 166 9 32.5
29) Locke, Min. 20 847 60 42.4 1 0 2 1 7 28 9 40.0
30) Schum, T.B. 19 799 56 42.1 0 0 3 1 12 44 5 39.7
31) Butler, Ariz 21 823 49 39.2 2 0 5 1 6 69 10 34.0
WEEK 6 / THROUGH MONDAY, OCTOBER 19, 2015
AFC / LEADING PUNTERS, NET AVERAGE
Opp Ret In Net
Rank Player, Team No Yards Lg Avg TB Blk Dwn OB Ret Yds 20 Avg
1) McAfee, Ind. 27 1296 57 48.0 0 0 1 3 12 41 9 46.5
2) Koch, Bal. 25 1236 62 49.4 0 0 1 6 15 107 8 45.2
3) Lee, Cle. 28 1382 67 49.4 2 0 2 2 16 114 11 43.9
4) Huber, Cin. 23 1101 67 47.9 2 0 6 1 8 70 12 43.1
5) Allen, N.E. 14 659 67 47.1 1 0 1 1 7 38 6 42.9
6) Colquitt, K.C. 31 1461 62 47.1 3 0 3 5 14 85 14 42.5
7) King, Oak. 21 984 70 46.9 2 0 5 0 8 53 9 42.4
8) Schmidt, Buf. 33 1601 65 48.5 1 0 2 3 19 182 8 42.4
9) *Darr, Mia. 24 1155 63 48.1 2 0 1 2 12 108 7 42.0
10) Berry, Pit. 28 1224 79 43.7 1 0 4 2 11 86 13 39.9
11) Colquitt, Den. 32 1457 62 45.5 2 0 7 6 12 141 8 39.9
12) Anger, Jac. 33 1505 63 45.6 2 0 3 1 16 223 12 37.6
13) Lechler, Hou. 31 1419 60 45.8 3 0 2 2 19 225 9 36.6
14) Scifres, S.D. 24 1081 68 45.0 1 0 3 2 17 187 4 36.4
15) Kern, Ten. 24 1075 61 44.8 1 0 3 1 12 217 9 34.9
16) Quigley, NY-J 22 933 54 42.4 1 1 1 5 7 166 9 32.5
NFC / LEADING PUNTERS, NET AVERAGE
Opp Ret In Net
Rank Player, Team No Yards Lg Avg TB Blk Dwn OB Ret Yds 20 Avg
1) C. Jones, Dal. 23 1088 61 47.3 1 0 1 3 11 109 10 41.7
2) D. Jones, Phi. 31 1486 60 47.9 3 1 3 0 17 92 7 41.7
3) O'Donnell, Chi. 26 1219 72 46.9 2 0 2 4 12 96 6 41.7
4) Hekker, St.L 26 1222 57 47.0 2 0 0 2 14 116 9 41.0
5) Wing, NY-G 30 1298 63 43.3 0 0 6 1 13 78 15 40.7
6) Bosher, Atl. 23 1170 69 50.9 1 1 1 1 17 177 5 40.5
7) Martin, Det. 30 1379 66 46.0 2 0 4 2 16 137 12 40.1
8) Locke, Min. 20 847 60 42.4 1 0 2 1 7 28 9 40.0
9) Schum, T.B. 19 799 56 42.1 0 0 3 1 12 44 5 39.7
10) *Pinion, S.F. 26 1131 59 43.5 1 0 1 8 13 93 8 39.2
11) Masthay, G.B. 24 1039 54 43.3 3 0 0 4 15 60 5 38.3
12) Ryan, Sea. 32 1524 73 47.6 4 0 2 3 12 225 11 38.1
13) Nortman, Car. 24 1126 65 46.9 3 0 1 0 15 192 6 36.4
14) Way, Was. 25 1114 63 44.6 3 1 7 1 9 167 5 34.1
15) Butler, Ariz 21 823 49 39.2 2 0 5 1 6 69 10 34.0
NFL / LEADING PUNTERS, NET AVERAGE
Opp Ret In Net
Rank Player, Team No Yards Lg Avg TB Blk Dwn OB Ret Yds 20 Avg
1) McAfee, Ind. 27 1296 57 48.0 0 0 1 3 12 41 9 46.5
2) Koch, Bal. 25 1236 62 49.4 0 0 1 6 15 107 8 45.2
3) Lee, Cle. 28 1382 67 49.4 2 0 2 2 16 114 11 43.9
4) Huber, Cin. 23 1101 67 47.9 2 0 6 1 8 70 12 43.1
5) Allen, N.E. 14 659 67 47.1 1 0 1 1 7 38 6 42.9
6) Colquitt, K.C. 31 1461 62 47.1 3 0 3 5 14 85 14 42.5
7) King, Oak. 21 984 70 46.9 2 0 5 0 8 53 9 42.4
8) Schmidt, Buf. 33 1601 65 48.5 1 0 2 3 19 182 8 42.4
9) *Darr, Mia. 24 1155 63 48.1 2 0 1 2 12 108 7 42.0
10) C. Jones, Dal. 23 1088 61 47.3 1 0 1 3 11 109 10 41.7
11) D. Jones, Phi. 31 1486 60 47.9 3 1 3 0 17 92 7 41.7
12) O'Donnell, Chi. 26 1219 72 46.9 2 0 2 4 12 96 6 41.7
13) Hekker, St.L 26 1222 57 47.0 2 0 0 2 14 116 9 41.0
14) Wing, NY-G 30 1298 63 43.3 0 0 6 1 13 78 15 40.7
15) Bosher, Atl. 23 1170 69 50.9 1 1 1 1 17 177 5 40.5
16) Martin, Det. 30 1379 66 46.0 2 0 4 2 16 137 12 40.1
17) Locke, Min. 20 847 60 42.4 1 0 2 1 7 28 9 40.0
18) Berry, Pit. 28 1224 79 43.7 1 0 4 2 11 86 13 39.9
19) Colquitt, Den. 32 1457 62 45.5 2 0 7 6 12 141 8 39.9
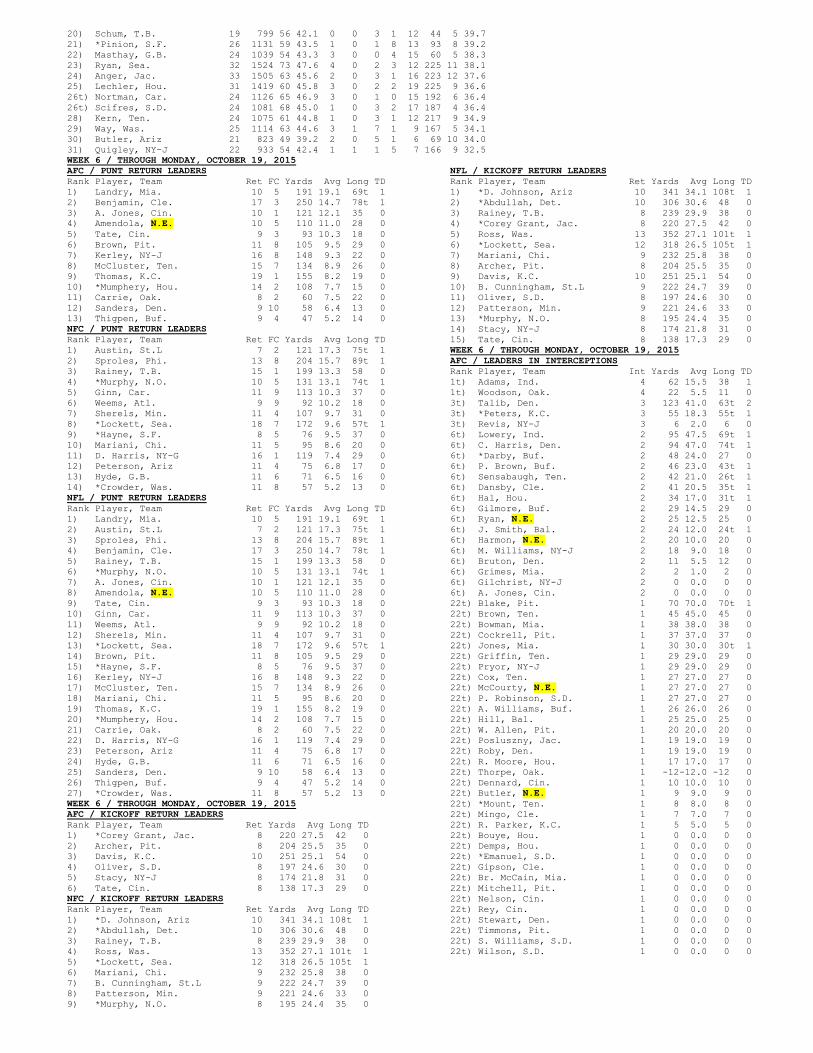
20) Schum, T.B. 19 799 56 42.1 0 0 3 1 12 44 5 39.7
21) *Pinion, S.F. 26 1131 59 43.5 1 0 1 8 13 93 8 39.2
22) Masthay, G.B. 24 1039 54 43.3 3 0 0 4 15 60 5 38.3
23) Ryan, Sea. 32 1524 73 47.6 4 0 2 3 12 225 11 38.1
24) Anger, Jac. 33 1505 63 45.6 2 0 3 1 16 223 12 37.6
25) Lechler, Hou. 31 1419 60 45.8 3 0 2 2 19 225 9 36.6
26t) Nortman, Car. 24 1126 65 46.9 3 0 1 0 15 192 6 36.4
26t) Scifres, S.D. 24 1081 68 45.0 1 0 3 2 17 187 4 36.4
28) Kern, Ten. 24 1075 61 44.8 1 0 3 1 12 217 9 34.9
29) Way, Was. 25 1114 63 44.6 3 1 7 1 9 167 5 34.1
30) Butler, Ariz 21 823 49 39.2 2 0 5 1 6 69 10 34.0
31) Quigley, NY-J 22 933 54 42.4 1 1 1 5 7 166 9 32.5
WEEK 6 / THROUGH MONDAY, OCTOBER 19, 2015
AFC / PUNT RETURN LEADERS
Rank Player, Team Ret FC Yards Avg Long TD
1) Landry, Mia. 10 5 191 19.1 69t 1
2) Benjamin, Cle. 17 3 250 14.7 78t 1
3) A. Jones, Cin. 10 1 121 12.1 35 0
4) Amendola, N.E. 10 5 110 11.0 28 0
5) Tate, Cin. 9 3 93 10.3 18 0
6) Brown, Pit. 11 8 105 9.5 29 0
7) Kerley, NY-J 16 8 148 9.3 22 0
8) McCluster, Ten. 15 7 134 8.9 26 0
9) Thomas, K.C. 19 1 155 8.2 19 0
10) *Mumphery, Hou. 14 2 108 7.7 15 0
11) Carrie, Oak. 8 2 60 7.5 22 0
12) Sanders, Den. 9 10 58 6.4 13 0
13) Thigpen, Buf. 9 4 47 5.2 14 0
NFC / PUNT RETURN LEADERS
Rank Player, Team Ret FC Yards Avg Long TD
1) Austin, St.L 7 2 121 17.3 75t 1
2) Sproles, Phi. 13 8 204 15.7 89t 1
3) Rainey, T.B. 15 1 199 13.3 58 0
4) *Murphy, N.O. 10 5 131 13.1 74t 1
5) Ginn, Car. 11 9 113 10.3 37 0
6) Weems, Atl. 9 9 92 10.2 18 0
7) Sherels, Min. 11 4 107 9.7 31 0
8) *Lockett, Sea. 18 7 172 9.6 57t 1
9) *Hayne, S.F. 8 5 76 9.5 37 0
10) Mariani, Chi. 11 5 95 8.6 20 0
11) D. Harris, NY-G 16 1 119 7.4 29 0
12) Peterson, Ariz 11 4 75 6.8 17 0
13) Hyde, G.B. 11 6 71 6.5 16 0
14) *Crowder, Was. 11 8 57 5.2 13 0
NFL / PUNT RETURN LEADERS
Rank Player, Team Ret FC Yards Avg Long TD
1) Landry, Mia. 10 5 191 19.1 69t 1
2) Austin, St.L 7 2 121 17.3 75t 1
3) Sproles, Phi. 13 8 204 15.7 89t 1
4) Benjamin, Cle. 17 3 250 14.7 78t 1
5) Rainey, T.B. 15 1 199 13.3 58 0
6) *Murphy, N.O. 10 5 131 13.1 74t 1
7) A. Jones, Cin. 10 1 121 12.1 35 0
8) Amendola, N.E. 10 5 110 11.0 28 0
9) Tate, Cin. 9 3 93 10.3 18 0
10) Ginn, Car. 11 9 113 10.3 37 0
11) Weems, Atl. 9 9 92 10.2 18 0
12) Sherels, Min. 11 4 107 9.7 31 0
13) *Lockett, Sea. 18 7 172 9.6 57t 1
14) Brown, Pit. 11 8 105 9.5 29 0
15) *Hayne, S.F. 8 5 76 9.5 37 0
16) Kerley, NY-J 16 8 148 9.3 22 0
17) McCluster, Ten. 15 7 134 8.9 26 0
18) Mariani, Chi. 11 5 95 8.6 20 0
19) Thomas, K.C. 19 1 155 8.2 19 0
20) *Mumphery, Hou. 14 2 108 7.7 15 0
21) Carrie, Oak. 8 2 60 7.5 22 0
22) D. Harris, NY-G 16 1 119 7.4 29 0
23) Peterson, Ariz 11 4 75 6.8 17 0
24) Hyde, G.B. 11 6 71 6.5 16 0
25) Sanders, Den. 9 10 58 6.4 13 0
26) Thigpen, Buf. 9 4 47 5.2 14 0
27) *Crowder, Was. 11 8 57 5.2 13 0
WEEK 6 / THROUGH MONDAY, OCTOBER 19, 2015
AFC / KICKOFF RETURN LEADERS
Rank Player, Team Ret Yards Avg Long TD
1) *Corey Grant, Jac. 8 220 27.5 42 0
2) Archer, Pit. 8 204 25.5 35 0
3) Davis, K.C. 10 251 25.1 54 0
4) Oliver, S.D. 8 197 24.6 30 0
5) Stacy, NY-J 8 174 21.8 31 0
6) Tate, Cin. 8 138 17.3 29 0
NFC / KICKOFF RETURN LEADERS
Rank Player, Team Ret Yards Avg Long TD
1) *D. Johnson, Ariz 10 341 34.1 108t 1
2) *Abdullah, Det. 10 306 30.6 48 0
3) Rainey, T.B. 8 239 29.9 38 0
4) Ross, Was. 13 352 27.1 101t 1
5) *Lockett, Sea. 12 318 26.5 105t 1
6) Mariani, Chi. 9 232 25.8 38 0
7) B. Cunningham, St.L 9 222 24.7 39 0
8) Patterson, Min. 9 221 24.6 33 0
9) *Murphy, N.O. 8 195 24.4 35 0
NFL / KICKOFF RETURN LEADERS
Rank Player, Team Ret Yards Avg Long TD
1) *D. Johnson, Ariz 10 341 34.1 108t 1
2) *Abdullah, Det. 10 306 30.6 48 0
3) Rainey, T.B. 8 239 29.9 38 0
4) *Corey Grant, Jac. 8 220 27.5 42 0
5) Ross, Was. 13 352 27.1 101t 1
6) *Lockett, Sea. 12 318 26.5 105t 1
7) Mariani, Chi. 9 232 25.8 38 0
8) Archer, Pit. 8 204 25.5 35 0
9) Davis, K.C. 10 251 25.1 54 0
10) B. Cunningham, St.L 9 222 24.7 39 0
11) Oliver, S.D. 8 197 24.6 30 0
12) Patterson, Min. 9 221 24.6 33 0
13) *Murphy, N.O. 8 195 24.4 35 0
14) Stacy, NY-J 8 174 21.8 31 0
15) Tate, Cin. 8 138 17.3 29 0
WEEK 6 / THROUGH MONDAY, OCTOBER 19, 2015
AFC / LEADERS IN INTERCEPTIONS
Rank Player, Team Int Yards Avg Long TD
1t) Adams, Ind. 4 62 15.5 38 1
1t) Woodson, Oak. 4 22 5.5 11 0
3t) Talib, Den. 3 123 41.0 63t 2
3t) *Peters, K.C. 3 55 18.3 55t 1
3t) Revis, NY-J 3 6 2.0 6 0
6t) Lowery, Ind. 2 95 47.5 69t 1
6t) C. Harris, Den. 2 94 47.0 74t 1
6t) *Darby, Buf. 2 48 24.0 27 0
6t) P. Brown, Buf. 2 46 23.0 43t 1
6t) Sensabaugh, Ten. 2 42 21.0 26t 1
6t) Dansby, Cle. 2 41 20.5 35t 1
6t) Hal, Hou. 2 34 17.0 31t 1
6t) Gilmore, Buf. 2 29 14.5 29 0
6t) Ryan, N.E. 2 25 12.5 25 0
6t) J. Smith, Bal. 2 24 12.0 24t 1
6t) Harmon, N.E. 2 20 10.0 20 0
6t) M. Williams, NY-J 2 18 9.0 18 0
6t) Bruton, Den. 2 11 5.5 12 0
6t) Grimes, Mia. 2 2 1.0 2 0
6t) Gilchrist, NY-J 2 0 0.0 0 0
6t) A. Jones, Cin. 2 0 0.0 0 0
22t) Blake, Pit. 1 70 70.0 70t 1
22t) Brown, Ten. 1 45 45.0 45 0
22t) Bowman, Mia. 1 38 38.0 38 0
22t) Cockrell, Pit. 1 37 37.0 37 0
22t) Jones, Mia. 1 30 30.0 30t 1
22t) Griffin, Ten. 1 29 29.0 29 0
22t) Pryor, NY-J 1 29 29.0 29 0
22t) Cox, Ten. 1 27 27.0 27 0
22t) McCourty, N.E. 1 27 27.0 27 0
22t) P. Robinson, S.D. 1 27 27.0 27 0
22t) A. Williams, Buf. 1 26 26.0 26 0
22t) Hill, Bal. 1 25 25.0 25 0
22t) W. Allen, Pit. 1 20 20.0 20 0
22t) Posluszny, Jac. 1 19 19.0 19 0
22t) Roby, Den. 1 19 19.0 19 0
22t) R. Moore, Hou. 1 17 17.0 17 0
22t) Thorpe, Oak. 1 -12-12.0 -12 0
22t) Dennard, Cin. 1 10 10.0 10 0
22t) Butler, N.E. 1 9 9.0 9 0
22t) *Mount, Ten. 1 8 8.0 8 0
22t) Mingo, Cle. 1 7 7.0 7 0
22t) R. Parker, K.C. 1 5 5.0 5 0
22t) Bouye, Hou. 1 0 0.0 0 0
22t) Demps, Hou. 1 0 0.0 0 0
22t) *Emanuel, S.D. 1 0 0.0 0 0
22t) Gipson, Cle. 1 0 0.0 0 0
22t) Br. McCain, Mia. 1 0 0.0 0 0
22t) Mitchell, Pit. 1 0 0.0 0 0
22t) Nelson, Cin. 1 0 0.0 0 0
22t) Rey, Cin. 1 0 0.0 0 0
22t) Stewart, Den. 1 0 0.0 0 0
22t) Timmons, Pit. 1 0 0.0 0 0
22t) S. Williams, S.D. 1 0 0.0 0 0
22t) Wilson, S.D. 1 0 0.0 0 0
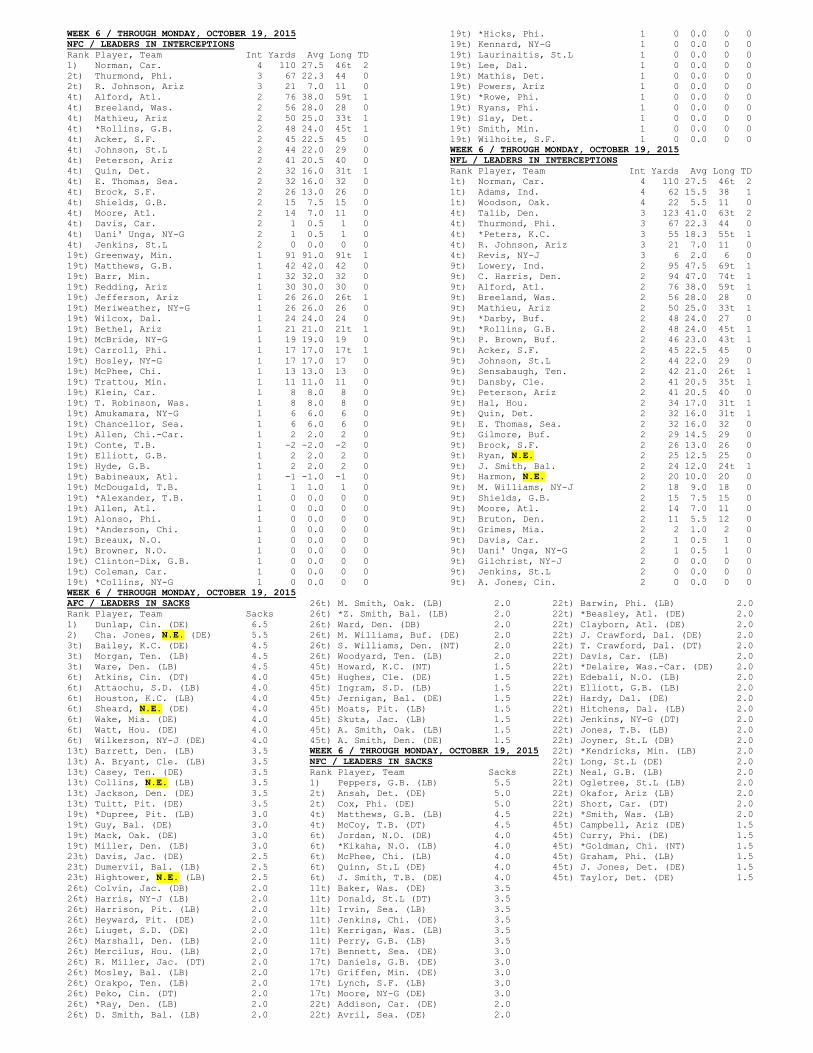
WEEK 6 / THROUGH MONDAY, OCTOBER 19, 2015
NFC / LEADERS IN INTERCEPTIONS
Rank Player, Team Int Yards Avg Long TD
1) Norman, Car. 4 110 27.5 46t 2
2t) Thurmond, Phi. 3 67 22.3 44 0
2t) R. Johnson, Ariz 3 21 7.0 11 0
4t) Alford, Atl. 2 76 38.0 59t 1
4t) Breeland, Was. 2 56 28.0 28 0
4t) Mathieu, Ariz 2 50 25.0 33t 1
4t) *Rollins, G.B. 2 48 24.0 45t 1
4t) Acker, S.F. 2 45 22.5 45 0
4t) Johnson, St.L 2 44 22.0 29 0
4t) Peterson, Ariz 2 41 20.5 40 0
4t) Quin, Det. 2 32 16.0 31t 1
4t) E. Thomas, Sea. 2 32 16.0 32 0
4t) Brock, S.F. 2 26 13.0 26 0
4t) Shields, G.B. 2 15 7.5 15 0
4t) Moore, Atl. 2 14 7.0 11 0
4t) Davis, Car. 2 1 0.5 1 0
4t) Uani' Unga, NY-G 2 1 0.5 1 0
4t) Jenkins, St.L 2 0 0.0 0 0
19t) Greenway, Min. 1 91 91.0 91t 1
19t) Matthews, G.B. 1 42 42.0 42 0
19t) Barr, Min. 1 32 32.0 32 0
19t) Redding, Ariz 1 30 30.0 30 0
19t) Jefferson, Ariz 1 26 26.0 26t 1
19t) Meriweather, NY-G 1 26 26.0 26 0
19t) Wilcox, Dal. 1 24 24.0 24 0
19t) Bethel, Ariz 1 21 21.0 21t 1
19t) McBride, NY-G 1 19 19.0 19 0
19t) Carroll, Phi. 1 17 17.0 17t 1
19t) Hosley, NY-G 1 17 17.0 17 0
19t) McPhee, Chi. 1 13 13.0 13 0
19t) Trattou, Min. 1 11 11.0 11 0
19t) Klein, Car. 1 8 8.0 8 0
19t) T. Robinson, Was. 1 8 8.0 8 0
19t) Amukamara, NY-G 1 6 6.0 6 0
19t) Chancellor, Sea. 1 6 6.0 6 0
19t) Allen, Chi.-Car. 1 2 2.0 2 0
19t) Conte, T.B. 1 -2 -2.0 -2 0
19t) Elliott, G.B. 1 2 2.0 2 0
19t) Hyde, G.B. 1 2 2.0 2 0
19t) Babineaux, Atl. 1 -1 -1.0 -1 0
19t) McDougald, T.B. 1 1 1.0 1 0
19t) *Alexander, T.B. 1 0 0.0 0 0
19t) Allen, Atl. 1 0 0.0 0 0
19t) Alonso, Phi. 1 0 0.0 0 0
19t) *Anderson, Chi. 1 0 0.0 0 0
19t) Breaux, N.O. 1 0 0.0 0 0
19t) Browner, N.O. 1 0 0.0 0 0
19t) Clinton-Dix, G.B. 1 0 0.0 0 0
19t) Coleman, Car. 1 0 0.0 0 0
19t) *Collins, NY-G 1 0 0.0 0 0
19t) *Hicks, Phi. 1 0 0.0 0 0
19t) Kennard, NY-G 1 0 0.0 0 0
19t) Laurinaitis, St.L 1 0 0.0 0 0
19t) Lee, Dal. 1 0 0.0 0 0
19t) Mathis, Det. 1 0 0.0 0 0
19t) Powers, Ariz 1 0 0.0 0 0
19t) *Rowe, Phi. 1 0 0.0 0 0
19t) Ryans, Phi. 1 0 0.0 0 0
19t) Slay, Det. 1 0 0.0 0 0
19t) Smith, Min. 1 0 0.0 0 0
19t) Wilhoite, S.F. 1 0 0.0 0 0
WEEK 6 / THROUGH MONDAY, OCTOBER 19, 2015
NFL / LEADERS IN INTERCEPTIONS
Rank Player, Team Int Yards Avg Long TD
1t) Norman, Car. 4 110 27.5 46t 2
1t) Adams, Ind. 4 62 15.5 38 1
1t) Woodson, Oak. 4 22 5.5 11 0
4t) Talib, Den. 3 123 41.0 63t 2
4t) Thurmond, Phi. 3 67 22.3 44 0
4t) *Peters, K.C. 3 55 18.3 55t 1
4t) R. Johnson, Ariz 3 21 7.0 11 0
4t) Revis, NY-J 3 6 2.0 6 0
9t) Lowery, Ind. 2 95 47.5 69t 1
9t) C. Harris, Den. 2 94 47.0 74t 1
9t) Alford, Atl. 2 76 38.0 59t 1
9t) Breeland, Was. 2 56 28.0 28 0
9t) Mathieu, Ariz 2 50 25.0 33t 1
9t) *Darby, Buf. 2 48 24.0 27 0
9t) *Rollins, G.B. 2 48 24.0 45t 1
9t) P. Brown, Buf. 2 46 23.0 43t 1
9t) Acker, S.F. 2 45 22.5 45 0
9t) Johnson, St.L 2 44 22.0 29 0
9t) Sensabaugh, Ten. 2 42 21.0 26t 1
9t) Dansby, Cle. 2 41 20.5 35t 1
9t) Peterson, Ariz 2 41 20.5 40 0
9t) Hal, Hou. 2 34 17.0 31t 1
9t) Quin, Det. 2 32 16.0 31t 1
9t) E. Thomas, Sea. 2 32 16.0 32 0
9t) Gilmore, Buf. 2 29 14.5 29 0
9t) Brock, S.F. 2 26 13.0 26 0
9t) Ryan, N.E. 2 25 12.5 25 0
9t) J. Smith, Bal. 2 24 12.0 24t 1
9t) Harmon, N.E. 2 20 10.0 20 0
9t) M. Williams, NY-J 2 18 9.0 18 0
9t) Shields, G.B. 2 15 7.5 15 0
9t) Moore, Atl. 2 14 7.0 11 0
9t) Bruton, Den. 2 11 5.5 12 0
9t) Grimes, Mia. 2 2 1.0 2 0
9t) Davis, Car. 2 1 0.5 1 0
9t) Uani' Unga, NY-G 2 1 0.5 1 0
9t) Gilchrist, NY-J 2 0 0.0 0 0
9t) Jenkins, St.L 2 0 0.0 0 0
9t) A. Jones, Cin. 2 0 0.0 0 0
WEEK 6 / THROUGH MONDAY, OCTOBER 19, 2015
AFC / LEADERS IN SACKS
Rank Player, Team Sacks
1) Dunlap, Cin. (DE) 6.5
2) Cha. Jones, N.E. (DE) 5.5
3t) Bailey, K.C. (DE) 4.5
3t) Morgan, Ten. (LB) 4.5
3t) Ware, Den. (LB) 4.5
6t) Atkins, Cin. (DT) 4.0
6t) Attaochu, S.D. (LB) 4.0
6t) Houston, K.C. (LB) 4.0
6t) Sheard, N.E. (DE) 4.0
6t) Wake, Mia. (DE) 4.0
6t) Watt, Hou. (DE) 4.0
6t) Wilkerson, NY-J (DE) 4.0
13t) Barrett, Den. (LB) 3.5
13t) A. Bryant, Cle. (LB) 3.5
13t) Casey, Ten. (DE) 3.5
13t) Collins, N.E. (LB) 3.5
13t) Jackson, Den. (DE) 3.5
13t) Tuitt, Pit. (DE) 3.5
19t) *Dupree, Pit. (LB) 3.0
19t) Guy, Bal. (DE) 3.0
19t) Mack, Oak. (DE) 3.0
19t) Miller, Den. (LB) 3.0
23t) Davis, Jac. (DE) 2.5
23t) Dumervil, Bal. (LB) 2.5
23t) Hightower, N.E. (LB) 2.5
26t) Colvin, Jac. (DB) 2.0
26t) Harris, NY-J (LB) 2.0
26t) Harrison, Pit. (LB) 2.0
26t) Heyward, Pit. (DE) 2.0
26t) Liuget, S.D. (DE) 2.0
26t) Marshall, Den. (LB) 2.0
26t) Mercilus, Hou. (LB) 2.0
26t) R. Miller, Jac. (DT) 2.0
26t) Mosley, Bal. (LB) 2.0
26t) Orakpo, Ten. (LB) 2.0
26t) Peko, Cin. (DT) 2.0
26t) *Ray, Den. (LB) 2.0
26t) D. Smith, Bal. (LB) 2.0
26t) M. Smith, Oak. (LB) 2.0
26t) *Z. Smith, Bal. (LB) 2.0
26t) Ward, Den. (DB) 2.0
26t) M. Williams, Buf. (DE) 2.0
26t) S. Williams, Den. (NT) 2.0
26t) Woodyard, Ten. (LB) 2.0
45t) Howard, K.C. (NT) 1.5
45t) Hughes, Cle. (DE) 1.5
45t) Ingram, S.D. (LB) 1.5
45t) Jernigan, Bal. (DE) 1.5
45t) Moats, Pit. (LB) 1.5
45t) Skuta, Jac. (LB) 1.5
45t) A. Smith, Oak. (LB) 1.5
45t) A. Smith, Den. (DE) 1.5
WEEK 6 / THROUGH MONDAY, OCTOBER 19, 2015
NFC / LEADERS IN SACKS
Rank Player, Team Sacks
1) Peppers, G.B. (LB) 5.5
2t) Ansah, Det. (DE) 5.0
2t) Cox, Phi. (DE) 5.0
4t) Matthews, G.B. (LB) 4.5
4t) McCoy, T.B. (DT) 4.5
6t) Jordan, N.O. (DE) 4.0
6t) *Kikaha, N.O. (LB) 4.0
6t) McPhee, Chi. (LB) 4.0
6t) Quinn, St.L (DE) 4.0
6t) J. Smith, T.B. (DE) 4.0
11t) Baker, Was. (DE) 3.5
11t) Donald, St.L (DT) 3.5
11t) Irvin, Sea. (LB) 3.5
11t) Jenkins, Chi. (DE) 3.5
11t) Kerrigan, Was. (LB) 3.5
11t) Perry, G.B. (LB) 3.5
17t) Bennett, Sea. (DE) 3.0
17t) Daniels, G.B. (DE) 3.0
17t) Griffen, Min. (DE) 3.0
17t) Lynch, S.F. (LB) 3.0
17t) Moore, NY-G (DE) 3.0
22t) Addison, Car. (DE) 2.0
22t) Avril, Sea. (DE) 2.0
22t) Barwin, Phi. (LB) 2.0
22t) *Beasley, Atl. (DE) 2.0
22t) Clayborn, Atl. (DE) 2.0
22t) J. Crawford, Dal. (DE) 2.0
22t) T. Crawford, Dal. (DT) 2.0
22t) Davis, Car. (LB) 2.0
22t) *Delaire, Was.-Car. (DE) 2.0
22t) Edebali, N.O. (LB) 2.0
22t) Elliott, G.B. (LB) 2.0
22t) Hardy, Dal. (DE) 2.0
22t) Hitchens, Dal. (LB) 2.0
22t) Jenkins, NY-G (DT) 2.0
22t) Jones, T.B. (LB) 2.0
22t) Joyner, St.L (DB) 2.0
22t) *Kendricks, Min. (LB) 2.0
22t) Long, St.L (DE) 2.0
22t) Neal, G.B. (LB) 2.0
22t) Ogletree, St.L (LB) 2.0
22t) Okafor, Ariz (LB) 2.0
22t) Short, Car. (DT) 2.0
22t) *Smith, Was. (LB) 2.0
45t) Campbell, Ariz (DE) 1.5
45t) Curry, Phi. (DE) 1.5
45t) *Goldman, Chi. (NT) 1.5
45t) Graham, Phi. (LB) 1.5
45t) J. Jones, Det. (DE) 1.5
45t) Taylor, Det. (DE) 1.5
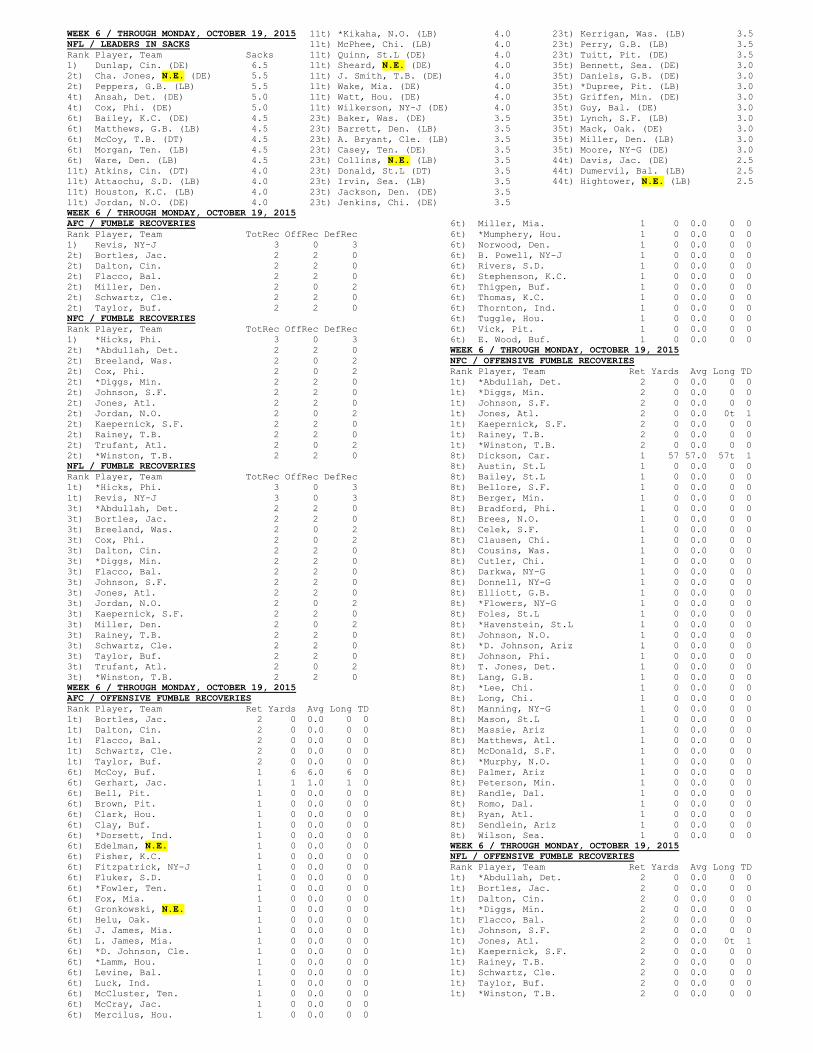
WEEK 6 / THROUGH MONDAY, OCTOBER 19, 2015
NFL / LEADERS IN SACKS
Rank Player, Team Sacks
1) Dunlap, Cin. (DE) 6.5
2t) Cha. Jones, N.E. (DE) 5.5
2t) Peppers, G.B. (LB) 5.5
4t) Ansah, Det. (DE) 5.0
4t) Cox, Phi. (DE) 5.0
6t) Bailey, K.C. (DE) 4.5
6t) Matthews, G.B. (LB) 4.5
6t) McCoy, T.B. (DT) 4.5
6t) Morgan, Ten. (LB) 4.5
6t) Ware, Den. (LB) 4.5
11t) Atkins, Cin. (DT) 4.0
11t) Attaochu, S.D. (LB) 4.0
11t) Houston, K.C. (LB) 4.0
11t) Jordan, N.O. (DE) 4.0
11t) *Kikaha, N.O. (LB) 4.0
11t) McPhee, Chi. (LB) 4.0
11t) Quinn, St.L (DE) 4.0
11t) Sheard, N.E. (DE) 4.0
11t) J. Smith, T.B. (DE) 4.0
11t) Wake, Mia. (DE) 4.0
11t) Watt, Hou. (DE) 4.0
11t) Wilkerson, NY-J (DE) 4.0
23t) Baker, Was. (DE) 3.5
23t) Barrett, Den. (LB) 3.5
23t) A. Bryant, Cle. (LB) 3.5
23t) Casey, Ten. (DE) 3.5
23t) Collins, N.E. (LB) 3.5
23t) Donald, St.L (DT) 3.5
23t) Irvin, Sea. (LB) 3.5
23t) Jackson, Den. (DE) 3.5
23t) Jenkins, Chi. (DE) 3.5
23t) Kerrigan, Was. (LB) 3.5
23t) Perry, G.B. (LB) 3.5
23t) Tuitt, Pit. (DE) 3.5
35t) Bennett, Sea. (DE) 3.0
35t) Daniels, G.B. (DE) 3.0
35t) *Dupree, Pit. (LB) 3.0
35t) Griffen, Min. (DE) 3.0
35t) Guy, Bal. (DE) 3.0
35t) Lynch, S.F. (LB) 3.0
35t) Mack, Oak. (DE) 3.0
35t) Miller, Den. (LB) 3.0
35t) Moore, NY-G (DE) 3.0
44t) Davis, Jac. (DE) 2.5
44t) Dumervil, Bal. (LB) 2.5
44t) Hightower, N.E. (LB) 2.5
WEEK 6 / THROUGH MONDAY, OCTOBER 19, 2015
AFC / FUMBLE RECOVERIES
Rank Player, Team TotRec OffRec DefRec
1) Revis, NY-J 3 0 3
2t) Bortles, Jac. 2 2 0
2t) Dalton, Cin. 2 2 0
2t) Flacco, Bal. 2 2 0
2t) Miller, Den. 2 0 2
2t) Schwartz, Cle. 2 2 0
2t) Taylor, Buf. 2 2 0
NFC / FUMBLE RECOVERIES
Rank Player, Team TotRec OffRec DefRec
1) *Hicks, Phi. 3 0 3
2t) *Abdullah, Det. 2 2 0
2t) Breeland, Was. 2 0 2
2t) Cox, Phi. 2 0 2
2t) *Diggs, Min. 2 2 0
2t) Johnson, S.F. 2 2 0
2t) Jones, Atl. 2 2 0
2t) Jordan, N.O. 2 0 2
2t) Kaepernick, S.F. 2 2 0
2t) Rainey, T.B. 2 2 0
2t) Trufant, Atl. 2 0 2
2t) *Winston, T.B. 2 2 0
NFL / FUMBLE RECOVERIES
Rank Player, Team TotRec OffRec DefRec
1t) *Hicks, Phi. 3 0 3
1t) Revis, NY-J 3 0 3
3t) *Abdullah, Det. 2 2 0
3t) Bortles, Jac. 2 2 0
3t) Breeland, Was. 2 0 2
3t) Cox, Phi. 2 0 2
3t) Dalton, Cin. 2 2 0
3t) *Diggs, Min. 2 2 0
3t) Flacco, Bal. 2 2 0
3t) Johnson, S.F. 2 2 0
3t) Jones, Atl. 2 2 0
3t) Jordan, N.O. 2 0 2
3t) Kaepernick, S.F. 2 2 0
3t) Miller, Den. 2 0 2
3t) Rainey, T.B. 2 2 0
3t) Schwartz, Cle. 2 2 0
3t) Taylor, Buf. 2 2 0
3t) Trufant, Atl. 2 0 2
3t) *Winston, T.B. 2 2 0
WEEK 6 / THROUGH MONDAY, OCTOBER 19, 2015
AFC / OFFENSIVE FUMBLE RECOVERIES
Rank Player, Team Ret Yards Avg Long TD
1t) Bortles, Jac. 2 0 0.0 0 0
1t) Dalton, Cin. 2 0 0.0 0 0
1t) Flacco, Bal. 2 0 0.0 0 0
1t) Schwartz, Cle. 2 0 0.0 0 0
1t) Taylor, Buf. 2 0 0.0 0 0
6t) McCoy, Buf. 1 6 6.0 6 0
6t) Gerhart, Jac. 1 1 1.0 1 0
6t) Bell, Pit. 1 0 0.0 0 0
6t) Brown, Pit. 1 0 0.0 0 0
6t) Clark, Hou. 1 0 0.0 0 0
6t) Clay, Buf. 1 0 0.0 0 0
6t) *Dorsett, Ind. 1 0 0.0 0 0
6t) Edelman, N.E. 1 0 0.0 0 0
6t) Fisher, K.C. 1 0 0.0 0 0
6t) Fitzpatrick, NY-J 1 0 0.0 0 0
6t) Fluker, S.D. 1 0 0.0 0 0
6t) *Fowler, Ten. 1 0 0.0 0 0
6t) Fox, Mia. 1 0 0.0 0 0
6t) Gronkowski, N.E. 1 0 0.0 0 0
6t) Helu, Oak. 1 0 0.0 0 0
6t) J. James, Mia. 1 0 0.0 0 0
6t) L. James, Mia. 1 0 0.0 0 0
6t) *D. Johnson, Cle. 1 0 0.0 0 0
6t) *Lamm, Hou. 1 0 0.0 0 0
6t) Levine, Bal. 1 0 0.0 0 0
6t) Luck, Ind. 1 0 0.0 0 0
6t) McCluster, Ten. 1 0 0.0 0 0
6t) McCray, Jac. 1 0 0.0 0 0
6t) Mercilus, Hou. 1 0 0.0 0 0
6t) Miller, Mia. 1 0 0.0 0 0
6t) *Mumphery, Hou. 1 0 0.0 0 0
6t) Norwood, Den. 1 0 0.0 0 0
6t) B. Powell, NY-J 1 0 0.0 0 0
6t) Rivers, S.D. 1 0 0.0 0 0
6t) Stephenson, K.C. 1 0 0.0 0 0
6t) Thigpen, Buf. 1 0 0.0 0 0
6t) Thomas, K.C. 1 0 0.0 0 0
6t) Thornton, Ind. 1 0 0.0 0 0
6t) Tuggle, Hou. 1 0 0.0 0 0
6t) Vick, Pit. 1 0 0.0 0 0
6t) E. Wood, Buf. 1 0 0.0 0 0
WEEK 6 / THROUGH MONDAY, OCTOBER 19, 2015
NFC / OFFENSIVE FUMBLE RECOVERIES
Rank Player, Team Ret Yards Avg Long TD
1t) *Abdullah, Det. 2 0 0.0 0 0
1t) *Diggs, Min. 2 0 0.0 0 0
1t) Johnson, S.F. 2 0 0.0 0 0
1t) Jones, Atl. 2 0 0.0 0t 1
1t) Kaepernick, S.F. 2 0 0.0 0 0
1t) Rainey, T.B. 2 0 0.0 0 0
1t) *Winston, T.B. 2 0 0.0 0 0
8t) Dickson, Car. 1 57 57.0 57t 1
8t) Austin, St.L 1 0 0.0 0 0
8t) Bailey, St.L 1 0 0.0 0 0
8t) Bellore, S.F. 1 0 0.0 0 0
8t) Berger, Min. 1 0 0.0 0 0
8t) Bradford, Phi. 1 0 0.0 0 0
8t) Brees, N.O. 1 0 0.0 0 0
8t) Celek, S.F. 1 0 0.0 0 0
8t) Clausen, Chi. 1 0 0.0 0 0
8t) Cousins, Was. 1 0 0.0 0 0
8t) Cutler, Chi. 1 0 0.0 0 0
8t) Darkwa, NY-G 1 0 0.0 0 0
8t) Donnell, NY-G 1 0 0.0 0 0
8t) Elliott, G.B. 1 0 0.0 0 0
8t) *Flowers, NY-G 1 0 0.0 0 0
8t) Foles, St.L 1 0 0.0 0 0
8t) *Havenstein, St.L 1 0 0.0 0 0
8t) Johnson, N.O. 1 0 0.0 0 0
8t) *D. Johnson, Ariz 1 0 0.0 0 0
8t) Johnson, Phi. 1 0 0.0 0 0
8t) T. Jones, Det. 1 0 0.0 0 0
8t) Lang, G.B. 1 0 0.0 0 0
8t) *Lee, Chi. 1 0 0.0 0 0
8t) Long, Chi. 1 0 0.0 0 0
8t) Manning, NY-G 1 0 0.0 0 0
8t) Mason, St.L 1 0 0.0 0 0
8t) Massie, Ariz 1 0 0.0 0 0
8t) Matthews, Atl. 1 0 0.0 0 0
8t) McDonald, S.F. 1 0 0.0 0 0
8t) *Murphy, N.O. 1 0 0.0 0 0
8t) Palmer, Ariz 1 0 0.0 0 0
8t) Peterson, Min. 1 0 0.0 0 0
8t) Randle, Dal. 1 0 0.0 0 0
8t) Romo, Dal. 1 0 0.0 0 0
8t) Ryan, Atl. 1 0 0.0 0 0
8t) Sendlein, Ariz 1 0 0.0 0 0
8t) Wilson, Sea. 1 0 0.0 0 0
WEEK 6 / THROUGH MONDAY, OCTOBER 19, 2015
NFL / OFFENSIVE FUMBLE RECOVERIES
Rank Player, Team Ret Yards Avg Long TD
1t) *Abdullah, Det. 2 0 0.0 0 0
1t) Bortles, Jac. 2 0 0.0 0 0
1t) Dalton, Cin. 2 0 0.0 0 0
1t) *Diggs, Min. 2 0 0.0 0 0
1t) Flacco, Bal. 2 0 0.0 0 0
1t) Johnson, S.F. 2 0 0.0 0 0
1t) Jones, Atl. 2 0 0.0 0t 1
1t) Kaepernick, S.F. 2 0 0.0 0 0
1t) Rainey, T.B. 2 0 0.0 0 0
1t) Schwartz, Cle. 2 0 0.0 0 0
1t) Taylor, Buf. 2 0 0.0 0 0
1t) *Winston, T.B. 2 0 0.0 0 0
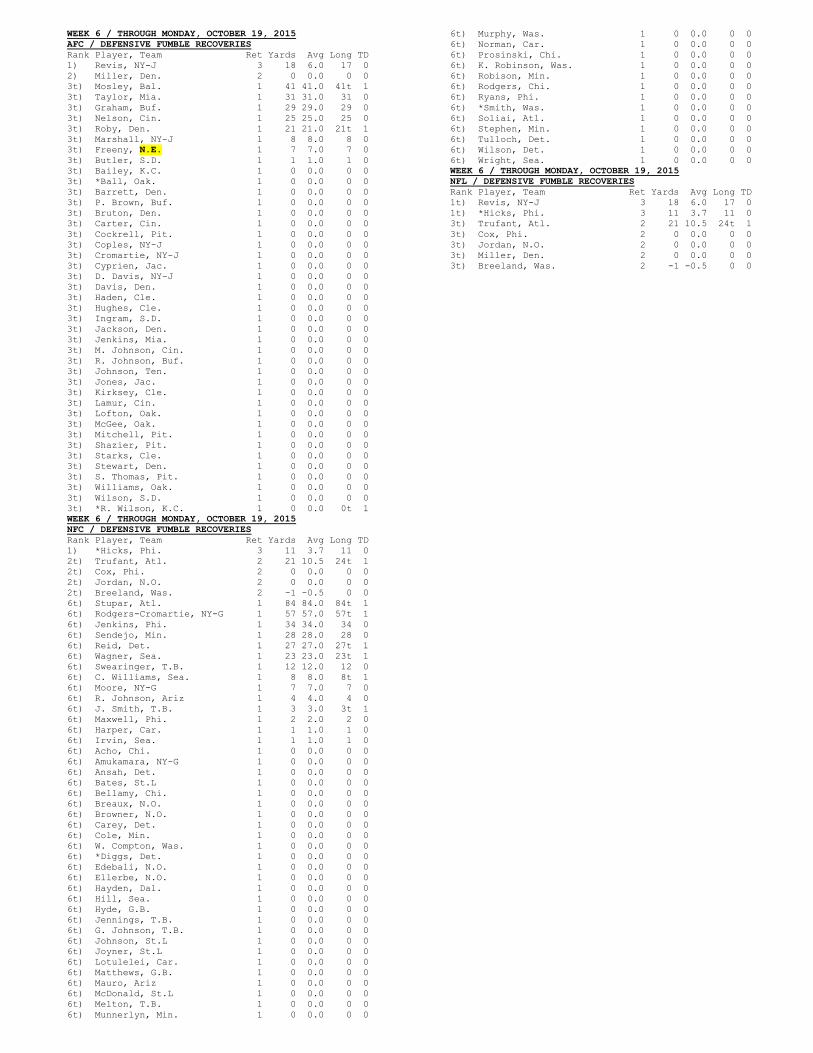
WEEK 6 / THROUGH MONDAY, OCTOBER 19, 2015
AFC / DEFENSIVE FUMBLE RECOVERIES
Rank Player, Team Ret Yards Avg Long TD
1) Revis, NY-J 3 18 6.0 17 0
2) Miller, Den. 2 0 0.0 0 0
3t) Mosley, Bal. 1 41 41.0 41t 1
3t) Taylor, Mia. 1 31 31.0 31 0
3t) Graham, Buf. 1 29 29.0 29 0
3t) Nelson, Cin. 1 25 25.0 25 0
3t) Roby, Den. 1 21 21.0 21t 1
3t) Marshall, NY-J 1 8 8.0 8 0
3t) Freeny, N.E. 1 7 7.0 7 0
3t) Butler, S.D. 1 1 1.0 1 0
3t) Bailey, K.C. 1 0 0.0 0 0
3t) *Ball, Oak. 1 0 0.0 0 0
3t) Barrett, Den. 1 0 0.0 0 0
3t) P. Brown, Buf. 1 0 0.0 0 0
3t) Bruton, Den. 1 0 0.0 0 0
3t) Carter, Cin. 1 0 0.0 0 0
3t) Cockrell, Pit. 1 0 0.0 0 0
3t) Coples, NY-J 1 0 0.0 0 0
3t) Cromartie, NY-J 1 0 0.0 0 0
3t) Cyprien, Jac. 1 0 0.0 0 0
3t) D. Davis, NY-J 1 0 0.0 0 0
3t) Davis, Den. 1 0 0.0 0 0
3t) Haden, Cle. 1 0 0.0 0 0
3t) Hughes, Cle. 1 0 0.0 0 0
3t) Ingram, S.D. 1 0 0.0 0 0
3t) Jackson, Den. 1 0 0.0 0 0
3t) Jenkins, Mia. 1 0 0.0 0 0
3t) M. Johnson, Cin. 1 0 0.0 0 0
3t) R. Johnson, Buf. 1 0 0.0 0 0
3t) Johnson, Ten. 1 0 0.0 0 0
3t) Jones, Jac. 1 0 0.0 0 0
3t) Kirksey, Cle. 1 0 0.0 0 0
3t) Lamur, Cin. 1 0 0.0 0 0
3t) Lofton, Oak. 1 0 0.0 0 0
3t) McGee, Oak. 1 0 0.0 0 0
3t) Mitchell, Pit. 1 0 0.0 0 0
3t) Shazier, Pit. 1 0 0.0 0 0
3t) Starks, Cle. 1 0 0.0 0 0
3t) Stewart, Den. 1 0 0.0 0 0
3t) S. Thomas, Pit. 1 0 0.0 0 0
3t) Williams, Oak. 1 0 0.0 0 0
3t) Wilson, S.D. 1 0 0.0 0 0
3t) *R. Wilson, K.C. 1 0 0.0 0t 1
WEEK 6 / THROUGH MONDAY, OCTOBER 19, 2015
NFC / DEFENSIVE FUMBLE RECOVERIES
Rank Player, Team Ret Yards Avg Long TD
1) *Hicks, Phi. 3 11 3.7 11 0
2t) Trufant, Atl. 2 21 10.5 24t 1
2t) Cox, Phi. 2 0 0.0 0 0
2t) Jordan, N.O. 2 0 0.0 0 0
2t) Breeland, Was. 2 -1 -0.5 0 0
6t) Stupar, Atl. 1 84 84.0 84t 1
6t) Rodgers-Cromartie, NY-G 1 57 57.0 57t 1
6t) Jenkins, Phi. 1 34 34.0 34 0
6t) Sendejo, Min. 1 28 28.0 28 0
6t) Reid, Det. 1 27 27.0 27t 1
6t) Wagner, Sea. 1 23 23.0 23t 1
6t) Swearinger, T.B. 1 12 12.0 12 0
6t) C. Williams, Sea. 1 8 8.0 8t 1
6t) Moore, NY-G 1 7 7.0 7 0
6t) R. Johnson, Ariz 1 4 4.0 4 0
6t) J. Smith, T.B. 1 3 3.0 3t 1
6t) Maxwell, Phi. 1 2 2.0 2 0
6t) Harper, Car. 1 1 1.0 1 0
6t) Irvin, Sea. 1 1 1.0 1 0
6t) Acho, Chi. 1 0 0.0 0 0
6t) Amukamara, NY-G 1 0 0.0 0 0
6t) Ansah, Det. 1 0 0.0 0 0
6t) Bates, St.L 1 0 0.0 0 0
6t) Bellamy, Chi. 1 0 0.0 0 0
6t) Breaux, N.O. 1 0 0.0 0 0
6t) Browner, N.O. 1 0 0.0 0 0
6t) Carey, Det. 1 0 0.0 0 0
6t) Cole, Min. 1 0 0.0 0 0
6t) W. Compton, Was. 1 0 0.0 0 0
6t) *Diggs, Det. 1 0 0.0 0 0
6t) Edebali, N.O. 1 0 0.0 0 0
6t) Ellerbe, N.O. 1 0 0.0 0 0
6t) Hayden, Dal. 1 0 0.0 0 0
6t) Hill, Sea. 1 0 0.0 0 0
6t) Hyde, G.B. 1 0 0.0 0 0
6t) Jennings, T.B. 1 0 0.0 0 0
6t) G. Johnson, T.B. 1 0 0.0 0 0
6t) Johnson, St.L 1 0 0.0 0 0
6t) Joyner, St.L 1 0 0.0 0 0
6t) Lotulelei, Car. 1 0 0.0 0 0
6t) Matthews, G.B. 1 0 0.0 0 0
6t) Mauro, Ariz 1 0 0.0 0 0
6t) McDonald, St.L 1 0 0.0 0 0
6t) Melton, T.B. 1 0 0.0 0 0
6t) Munnerlyn, Min. 1 0 0.0 0 0
6t) Murphy, Was. 1 0 0.0 0 0
6t) Norman, Car. 1 0 0.0 0 0
6t) Prosinski, Chi. 1 0 0.0 0 0
6t) K. Robinson, Was. 1 0 0.0 0 0
6t) Robison, Min. 1 0 0.0 0 0
6t) Rodgers, Chi. 1 0 0.0 0 0
6t) Ryans, Phi. 1 0 0.0 0 0
6t) *Smith, Was. 1 0 0.0 0 0
6t) Soliai, Atl. 1 0 0.0 0 0
6t) Stephen, Min. 1 0 0.0 0 0
6t) Tulloch, Det. 1 0 0.0 0 0
6t) Wilson, Det. 1 0 0.0 0 0
6t) Wright, Sea. 1 0 0.0 0 0
WEEK 6 / THROUGH MONDAY, OCTOBER 19, 2015
NFL / DEFENSIVE FUMBLE RECOVERIES
Rank Player, Team Ret Yards Avg Long TD
1t) Revis, NY-J 3 18 6.0 17 0
1t) *Hicks, Phi. 3 11 3.7 11 0
3t) Trufant, Atl. 2 21 10.5 24t 1
3t) Cox, Phi. 2 0 0.0 0 0
3t) Jordan, N.O. 2 0 0.0 0 0
3t) Miller, Den. 2 0 0.0 0 0
3t) Breeland, Was. 2 -1 -0.5 0 0
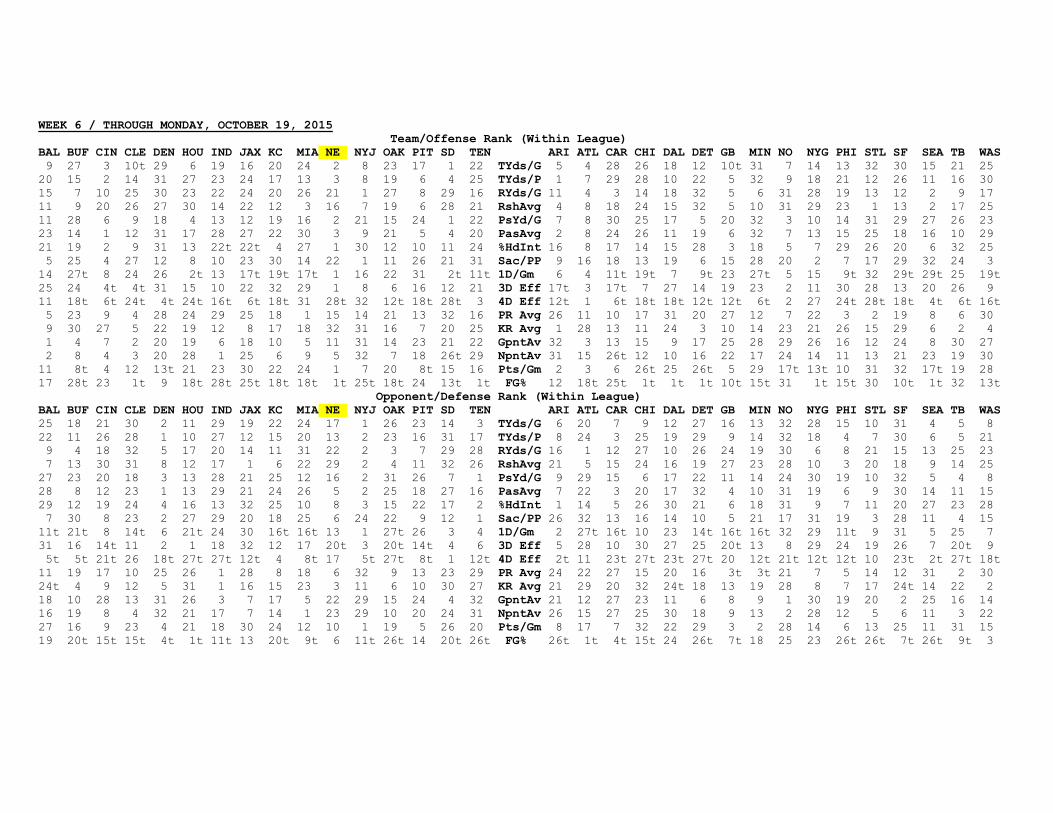
WEEK 6 / THROUGH MONDAY, OCTOBER 19, 2015
Team/Offense Rank (Within League)
BAL BUF CIN CLE DEN HOU IND JAX KC MIA NE NYJ OAK PIT SD TEN ARI ATL CAR CHI DAL DET GB MIN NO NYG PHI STL SF SEA TB WAS
9 27 3 10t 29 6 19 16 20 24 2 8 23 17 1 22 TYds/G 5 4 28 26 18 12 10t 31 7 14 13 32 30 15 21 25
20 15 2 14 31 27 23 24 17 13 3 8 19 6 4 25 TYds/P 1 7 29 28 10 22 5 32 9 18 21 12 26 11 16 30
15 7 10 25 30 23 22 24 20 26 21 1 27 8 29 16 RYds/G 11 4 3 14 18 32 5 6 31 28 19 13 12 2 9 17
11 9 20 26 27 30 14 22 12 3 16 7 19 6 28 21 RshAvg 4 8 18 24 15 32 5 10 31 29 23 1 13 2 17 25
11 28 6 9 18 4 13 12 19 16 2 21 15 24 1 22 PsYd/G 7 8 30 25 17 5 20 32 3 10 14 31 29 27 26 23
23 14 1 12 31 17 28 27 22 30 3 9 21 5 4 20 PasAvg 2 8 24 26 11 19 6 32 7 13 15 25 18 16 10 29
21 19 2 9 31 13 22t 22t 4 27 1 30 12 10 11 24 %HdInt 16 8 17 14 15 28 3 18 5 7 29 26 20 6 32 25
5 25 4 27 12 8 10 23 30 14 22 1 11 26 21 31 Sac/PP 9 16 18 13 19 6 15 28 20 2 7 17 29 32 24 3
14 27t 8 24 26 2t 13 17t 19t 17t 1 16 22 31 2t 11t 1D/Gm 6 4 11t 19t 7 9t 23 27t 5 15 9t 32 29t 29t 25 19t
25 24 4t 4t 31 15 10 22 32 29 1 8 6 16 12 21 3D Eff 17t 3 17t 7 27 14 19 23 2 11 30 28 13 20 26 9
11 18t 6t 24t 4t 24t 16t 6t 18t 31 28t 32 12t 18t 28t 3 4D Eff 12t 1 6t 18t 18t 12t 12t 6t 2 27 24t 28t 18t 4t 6t 16t
5 23 9 4 28 24 29 25 18 1 15 14 21 13 32 16 PR Avg 26 11 10 17 31 20 27 12 7 22 3 2 19 8 6 30
9 30 27 5 22 19 12 8 17 18 32 31 16 7 20 25 KR Avg 1 28 13 11 24 3 10 14 23 21 26 15 29 6 2 4
1 4 7 2 20 19 6 18 10 5 11 31 14 23 21 22 GpntAv 32 3 13 15 9 17 25 28 29 26 16 12 24 8 30 27
2 8 4 3 20 28 1 25 6 9 5 32 7 18 26t 29 NpntAv 31 15 26t 12 10 16 22 17 24 14 11 13 21 23 19 30
11 8t 4 12 13t 21 23 30 22 24 1 7 20 8t 15 16 Pts/Gm 2 3 6 26t 25 26t 5 29 17t 13t 10 31 32 17t 19 28
17 28t 23 1t 9 18t 28t 25t 18t 18t 1t 25t 18t 24 13t 1t FG% 12 18t 25t 1t 1t 1t 10t 15t 31 1t 15t 30 10t 1t 32 13t
Opponent/Defense Rank (Within League)
BAL BUF CIN CLE DEN HOU IND JAX KC MIA NE NYJ OAK PIT SD TEN ARI ATL CAR CHI DAL DET GB MIN NO NYG PHI STL SF SEA TB WAS
25 18 21 30 2 11 29 19 22 24 17 1 26 23 14 3 TYds/G 6 20 7 9 12 27 16 13 32 28 15 10 31 4 5 8
22 11 26 28 1 10 27 12 15 20 13 2 23 16 31 17 TYds/P 8 24 3 25 19 29 9 14 32 18 4 7 30 6 5 21
9 4 18 32 5 17 20 14 11 31 22 2 3 7 29 28 RYds/G 16 1 12 27 10 26 24 19 30 6 8 21 15 13 25 23
7 13 30 31 8 12 17 1 6 22 29 2 4 11 32 26 RshAvg 21 5 15 24 16 19 27 23 28 10 3 20 18 9 14 25
27 23 20 18 3 13 28 21 25 12 16 2 31 26 7 1 PsYd/G 9 29 15 6 17 22 11 14 24 30 19 10 32 5 4 8
28 8 12 23 1 13 29 21 24 26 5 2 25 18 27 16 PasAvg 7 22 3 20 17 32 4 10 31 19 6 9 30 14 11 15
29 12 19 24 4 16 13 32 25 10 8 3 15 22 17 2 %HdInt 1 14 5 26 30 21 6 18 31 9 7 11 20 27 23 28
7 30 8 23 2 27 29 20 18 25 6 24 22 9 12 1 Sac/PP 26 32 13 16 14 10 5 21 17 31 19 3 28 11 4 15
11t 21t 8 14t 6 21t 24 30 16t 16t 13 1 27t 26 3 4 1D/Gm 2 27t 16t 10 23 14t 16t 16t 32 29 11t 9 31 5 25 7
31 16 14t 11 2 1 18 32 12 17 20t 3 20t 14t 4 6 3D Eff 5 28 10 30 27 25 20t 13 8 29 24 19 26 7 20t 9
5t 5t 21t 26 18t 27t 27t 12t 4 8t 17 5t 27t 8t 1 12t 4D Eff 2t 11 23t 27t 23t 27t 20 12t 21t 12t 12t 10 23t 2t 27t 18t
11 19 17 10 25 26 1 28 8 18 6 32 9 13 23 29 PR Avg 24 22 27 15 20 16 3t 3t 21 7 5 14 12 31 2 30
24t 4 9 12 5 31 1 16 15 23 3 11 6 10 30 27 KR Avg 21 29 20 32 24t 18 13 19 28 8 7 17 24t 14 22 2
18 10 28 13 31 26 3 7 17 5 22 29 15 24 4 32 GpntAv 21 12 27 23 11 6 8 9 1 30 19 20 2 25 16 14
16 19 8 4 32 21 17 7 14 1 23 29 10 20 24 31 NpntAv 26 15 27 25 30 18 9 13 2 28 12 5 6 11 3 22
27 16 9 23 4 21 18 30 24 12 10 1 19 5 26 20 Pts/Gm 8 17 7 32 22 29 3 2 28 14 6 13 25 11 31 15
19 20t 15t 15t 4t 1t 11t 13 20t 9t 6 11t 26t 14 20t 26t FG% 26t 1t 4t 15t 24 26t 7t 18 25 23 26t 26t 7t 26t 9t 3
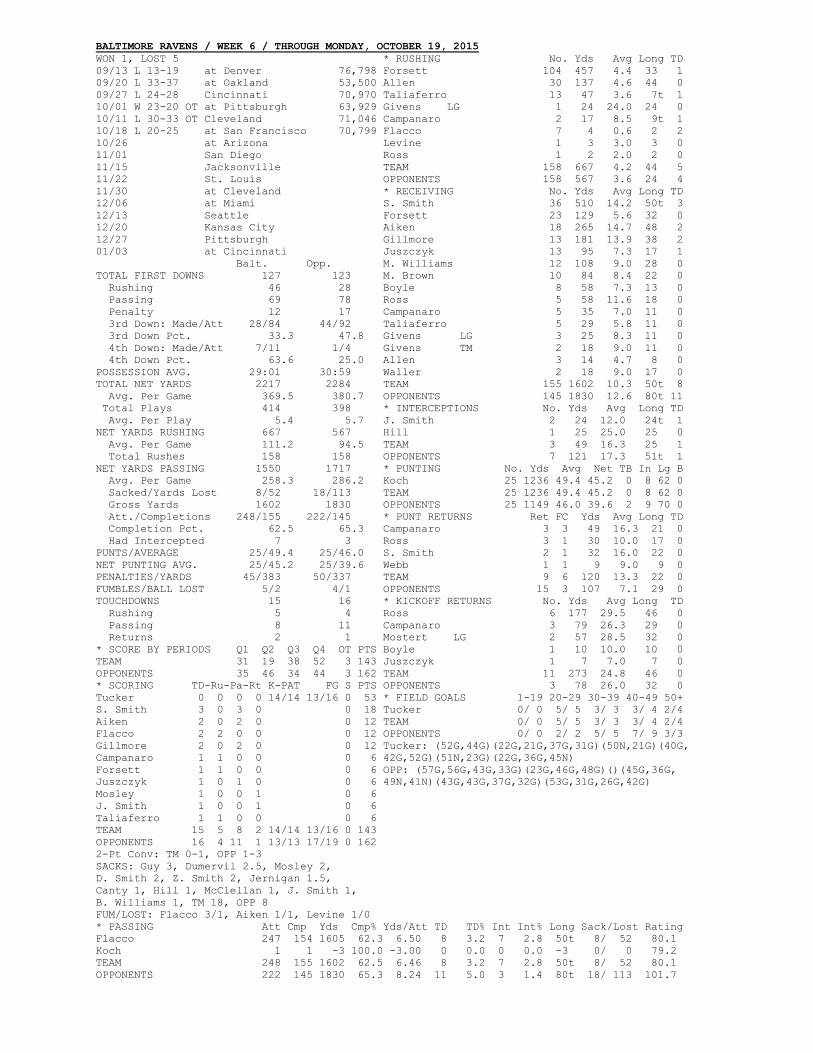
BALTIMORE RAVENS / WEEK 6 / THROUGH MONDAY, OCTOBER 19, 2015
WON 1, LOST 5 * RUSHING No. Yds Avg Long TD
09/13 L 13-19 at Denver 76,798 Forsett 104 457 4.4 33 1
09/20 L 33-37 at Oakland 53,500 Allen 30 137 4.6 44 0
09/27 L 24-28 Cincinnati 70,970 Taliaferro 13 47 3.6 7t 1
10/01 W 23-20 OT at Pittsburgh 63,929 Givens LG 1 24 24.0 24 0
10/11 L 30-33 OT Cleveland 71,046 Campanaro 2 17 8.5 9t 1
10/18 L 20-25 at San Francisco 70,799 Flacco 7 4 0.6 2 2
10/26 at Arizona Levine 1 3 3.0 3 0
11/01 San Diego Ross 1 2 2.0 2 0
11/15 Jacksonville TEAM 158 667 4.2 44 5
11/22 St. Louis OPPONENTS 158 567 3.6 24 4
11/30 at Cleveland * RECEIVING No. Yds Avg Long TD
12/06 at Miami S. Smith 36 510 14.2 50t 3
12/13 Seattle Forsett 23 129 5.6 32 0
12/20 Kansas City Aiken 18 265 14.7 48 2
12/27 Pittsburgh Gillmore 13 181 13.9 38 2
01/03 at Cincinnati Juszczyk 13 95 7.3 17 1
Balt. Opp. M. Williams 12 108 9.0 28 0
TOTAL FIRST DOWNS 127 123 M. Brown 10 84 8.4 22 0
Rushing 46 28 Boyle 8 58 7.3 13 0
Passing 69 78 Ross 5 58 11.6 18 0
Penalty 12 17 Campanaro 5 35 7.0 11 0
3rd Down: Made/Att 28/84 44/92 Taliaferro 5 29 5.8 11 0
3rd Down Pct. 33.3 47.8 Givens LG 3 25 8.3 11 0
4th Down: Made/Att 7/11 1/4 Givens TM 2 18 9.0 11 0
4th Down Pct. 63.6 25.0 Allen 3 14 4.7 8 0
POSSESSION AVG. 29:01 30:59 Waller 2 18 9.0 17 0
TOTAL NET YARDS 2217 2284 TEAM 155 1602 10.3 50t 8
Avg. Per Game 369.5 380.7 OPPONENTS 145 1830 12.6 80t 11
Total Plays 414 398 * INTERCEPTIONS No. Yds Avg Long TD
Avg. Per Play 5.4 5.7 J. Smith 2 24 12.0 24t 1
NET YARDS RUSHING 667 567 Hill 1 25 25.0 25 0
Avg. Per Game 111.2 94.5 TEAM 3 49 16.3 25 1
Total Rushes 158 158 OPPONENTS 7 121 17.3 51t 1
NET YARDS PASSING 1550 1717 * PUNTING No. Yds Avg Net TB In Lg B
Avg. Per Game 258.3 286.2 Koch 25 1236 49.4 45.2 0 8 62 0
Sacked/Yards Lost 8/52 18/113 TEAM 25 1236 49.4 45.2 0 8 62 0
Gross Yards 1602 1830 OPPONENTS 25 1149 46.0 39.6 2 9 70 0
Att./Completions 248/155 222/145 * PUNT RETURNS Ret FC Yds Avg Long TD
Completion Pct. 62.5 65.3 Campanaro 3 3 49 16.3 21 0
Had Intercepted 7 3 Ross 3 1 30 10.0 17 0
PUNTS/AVERAGE 25/49.4 25/46.0 S. Smith 2 1 32 16.0 22 0
NET PUNTING AVG. 25/45.2 25/39.6 Webb 1 1 9 9.0 9 0
PENALTIES/YARDS 45/383 50/337 TEAM 9 6 120 13.3 22 0
FUMBLES/BALL LOST 5/2 4/1 OPPONENTS 15 3 107 7.1 29 0
TOUCHDOWNS 15 16 * KICKOFF RETURNS No. Yds Avg Long TD
Rushing 5 4 Ross 6 177 29.5 46 0
Passing 8 11 Campanaro 3 79 26.3 29 0
Returns 2 1 Mostert LG 2 57 28.5 32 0
* SCORE BY PERIODS Q1 Q2 Q3 Q4 OT PTS Boyle 1 10 10.0 10 0
TEAM 31 19 38 52 3 143 Juszczyk 1 7 7.0 7 0
OPPONENTS 35 46 34 44 3 162 TEAM 11 273 24.8 46 0
* SCORING TD-Ru-Pa-Rt K-PAT FG S PTS OPPONENTS 3 78 26.0 32 0
Tucker 0 0 0 0 14/14 13/16 0 53 * FIELD GOALS 1-19 20-29 30-39 40-49 50+
S. Smith 3 0 3 0 0 18 Tucker 0/ 0 5/ 5 3/ 3 3/ 4 2/4
Aiken 2 0 2 0 0 12 TEAM 0/ 0 5/ 5 3/ 3 3/ 4 2/4
Flacco 2 2 0 0 0 12 OPPONENTS 0/ 0 2/ 2 5/ 5 7/ 9 3/3
Gillmore 2 0 2 0 0 12 Tucker: (52G,44G)(22G,21G,37G,31G)(50N,21G)(40G,
Campanaro 1 1 0 0 0 6 42G,52G)(51N,23G)(22G,36G,45N)
Forsett 1 1 0 0 0 6 OPP: (57G,56G,43G,33G)(23G,46G,48G)()(45G,36G,
Juszczyk 1 0 1 0 0 6 49N,41N)(43G,43G,37G,32G)(53G,31G,26G,42G)
Mosley 1 0 0 1 0 6
J. Smith 1 0 0 1 0 6
Taliaferro 1 1 0 0 0 6
TEAM 15 5 8 2 14/14 13/16 0 143
OPPONENTS 16 4 11 1 13/13 17/19 0 162
2-Pt Conv: TM 0-1, OPP 1-3
SACKS: Guy 3, Dumervil 2.5, Mosley 2,
D. Smith 2, Z. Smith 2, Jernigan 1.5,
Canty 1, Hill 1, McClellan 1, J. Smith 1,
B. Williams 1, TM 18, OPP 8
FUM/LOST: Flacco 3/1, Aiken 1/1, Levine 1/0
* PASSING Att Cmp Yds Cmp% Yds/Att TD TD% Int Int% Long Sack/Lost Rating
Flacco 247 154 1605 62.3 6.50 8 3.2 7 2.8 50t 8/ 52 80.1
Koch 1 1 -3 100.0 -3.00 0 0.0 0 0.0 -3 0/ 0 79.2
TEAM 248 155 1602 62.5 6.46 8 3.2 7 2.8 50t 8/ 52 80.1
OPPONENTS 222 145 1830 65.3 8.24 11 5.0 3 1.4 80t 18/ 113 101.7
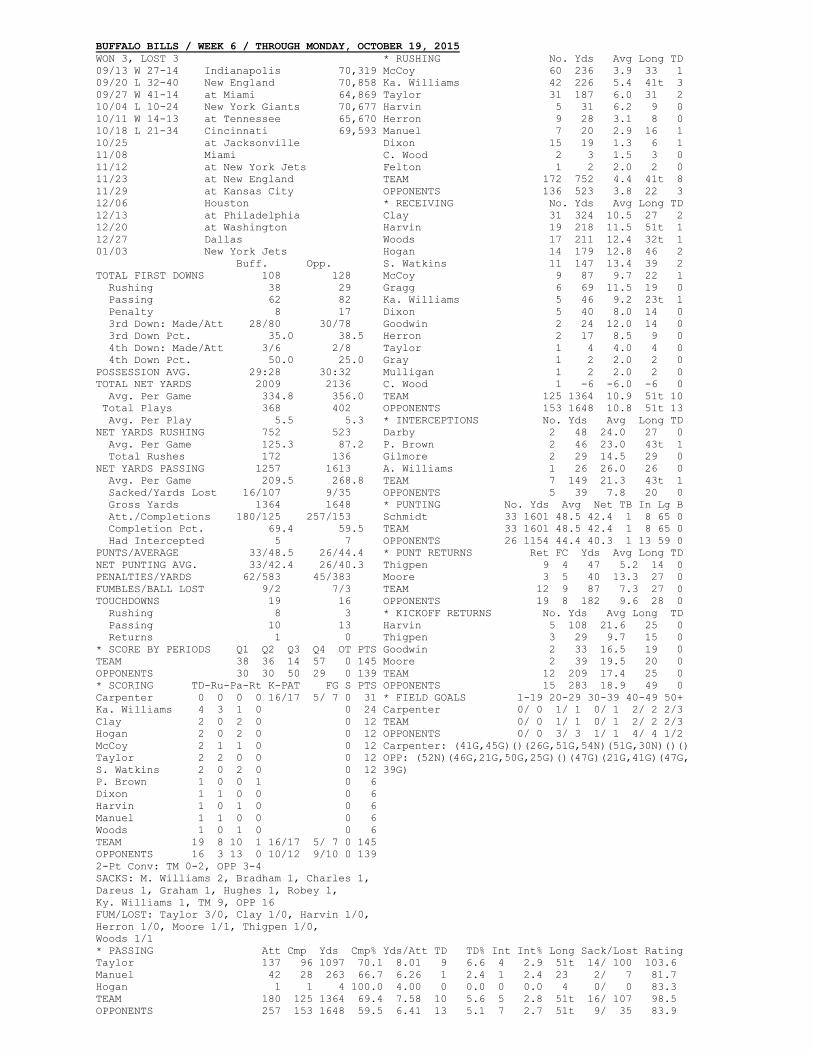
BUFFALO BILLS / WEEK 6 / THROUGH MONDAY, OCTOBER 19, 2015
WON 3, LOST 3 * RUSHING No. Yds Avg Long TD
09/13 W 27-14 Indianapolis 70,319 McCoy 60 236 3.9 33 1
09/20 L 32-40 New England 70,858 Ka. Williams 42 226 5.4 41t 3
09/27 W 41-14 at Miami 64,869 Taylor 31 187 6.0 31 2
10/04 L 10-24 New York Giants 70,677 Harvin 5 31 6.2 9 0
10/11 W 14-13 at Tennessee 65,670 Herron 9 28 3.1 8 0
10/18 L 21-34 Cincinnati 69,593 Manuel 7 20 2.9 16 1
10/25 at Jacksonville Dixon 15 19 1.3 6 1
11/08 Miami C. Wood 2 3 1.5 3 0
11/12 at New York Jets Felton 1 2 2.0 2 0
11/23 at New England TEAM 172 752 4.4 41t 8
11/29 at Kansas City OPPONENTS 136 523 3.8 22 3
12/06 Houston * RECEIVING No. Yds Avg Long TD
12/13 at Philadelphia Clay 31 324 10.5 27 2
12/20 at Washington Harvin 19 218 11.5 51t 1
12/27 Dallas Woods 17 211 12.4 32t 1
01/03 New York Jets Hogan 14 179 12.8 46 2
Buff. Opp. S. Watkins 11 147 13.4 39 2
TOTAL FIRST DOWNS 108 128 McCoy 9 87 9.7 22 1
Rushing 38 29 Gragg 6 69 11.5 19 0
Passing 62 82 Ka. Williams 5 46 9.2 23t 1
Penalty 8 17 Dixon 5 40 8.0 14 0
3rd Down: Made/Att 28/80 30/78 Goodwin 2 24 12.0 14 0
3rd Down Pct. 35.0 38.5 Herron 2 17 8.5 9 0
4th Down: Made/Att 3/6 2/8 Taylor 1 4 4.0 4 0
4th Down Pct. 50.0 25.0 Gray 1 2 2.0 2 0
POSSESSION AVG. 29:28 30:32 Mulligan 1 2 2.0 2 0
TOTAL NET YARDS 2009 2136 C. Wood 1 -6 -6.0 -6 0
Avg. Per Game 334.8 356.0 TEAM 125 1364 10.9 51t 10
Total Plays 368 402 OPPONENTS 153 1648 10.8 51t 13
Avg. Per Play 5.5 5.3 * INTERCEPTIONS No. Yds Avg Long TD
NET YARDS RUSHING 752 523 Darby 2 48 24.0 27 0
Avg. Per Game 125.3 87.2 P. Brown 2 46 23.0 43t 1
Total Rushes 172 136 Gilmore 2 29 14.5 29 0
NET YARDS PASSING 1257 1613 A. Williams 1 26 26.0 26 0
Avg. Per Game 209.5 268.8 TEAM 7 149 21.3 43t 1
Sacked/Yards Lost 16/107 9/35 OPPONENTS 5 39 7.8 20 0
Gross Yards 1364 1648 * PUNTING No. Yds Avg Net TB In Lg B
Att./Completions 180/125 257/153 Schmidt 33 1601 48.5 42.4 1 8 65 0
Completion Pct. 69.4 59.5 TEAM 33 1601 48.5 42.4 1 8 65 0
Had Intercepted 5 7 OPPONENTS 26 1154 44.4 40.3 1 13 59 0
PUNTS/AVERAGE 33/48.5 26/44.4 * PUNT RETURNS Ret FC Yds Avg Long TD
NET PUNTING AVG. 33/42.4 26/40.3 Thigpen 9 4 47 5.2 14 0
PENALTIES/YARDS 62/583 45/383 Moore 3 5 40 13.3 27 0
FUMBLES/BALL LOST 9/2 7/3 TEAM 12 9 87 7.3 27 0
TOUCHDOWNS 19 16 OPPONENTS 19 8 182 9.6 28 0
Rushing 8 3 * KICKOFF RETURNS No. Yds Avg Long TD
Passing 10 13 Harvin 5 108 21.6 25 0
Returns 1 0 Thigpen 3 29 9.7 15 0
* SCORE BY PERIODS Q1 Q2 Q3 Q4 OT PTS Goodwin 2 33 16.5 19 0
TEAM 38 36 14 57 0 145 Moore 2 39 19.5 20 0
OPPONENTS 30 30 50 29 0 139 TEAM 12 209 17.4 25 0
* SCORING TD-Ru-Pa-Rt K-PAT FG S PTS OPPONENTS 15 283 18.9 49 0
Carpenter 0 0 0 0 16/17 5/ 7 0 31 * FIELD GOALS 1-19 20-29 30-39 40-49 50+
Ka. Williams 4 3 1 0 0 24 Carpenter 0/ 0 1/ 1 0/ 1 2/ 2 2/3
Clay 2 0 2 0 0 12 TEAM 0/ 0 1/ 1 0/ 1 2/ 2 2/3
Hogan 2 0 2 0 0 12 OPPONENTS 0/ 0 3/ 3 1/ 1 4/ 4 1/2
McCoy 2 1 1 0 0 12 Carpenter: (41G,45G)()(26G,51G,54N)(51G,30N)()()
Taylor 2 2 0 0 0 12 OPP: (52N)(46G,21G,50G,25G)()(47G)(21G,41G)(47G,
S. Watkins 2 0 2 0 0 12 39G)
P. Brown 1 0 0 1 0 6
Dixon 1 1 0 0 0 6
Harvin 1 0 1 0 0 6
Manuel 1 1 0 0 0 6
Woods 1 0 1 0 0 6
TEAM 19 8 10 1 16/17 5/ 7 0 145
OPPONENTS 16 3 13 0 10/12 9/10 0 139
2-Pt Conv: TM 0-2, OPP 3-4
SACKS: M. Williams 2, Bradham 1, Charles 1,
Dareus 1, Graham 1, Hughes 1, Robey 1,
Ky. Williams 1, TM 9, OPP 16
FUM/LOST: Taylor 3/0, Clay 1/0, Harvin 1/0,
Herron 1/0, Moore 1/1, Thigpen 1/0,
Woods 1/1
* PASSING Att Cmp Yds Cmp% Yds/Att TD TD% Int Int% Long Sack/Lost Rating
Taylor 137 96 1097 70.1 8.01 9 6.6 4 2.9 51t 14/ 100 103.6
Manuel 42 28 263 66.7 6.26 1 2.4 1 2.4 23 2/ 7 81.7
Hogan 1 1 4 100.0 4.00 0 0.0 0 0.0 4 0/ 0 83.3
TEAM 180 125 1364 69.4 7.58 10 5.6 5 2.8 51t 16/ 107 98.5
OPPONENTS 257 153 1648 59.5 6.41 13 5.1 7 2.7 51t 9/ 35 83.9
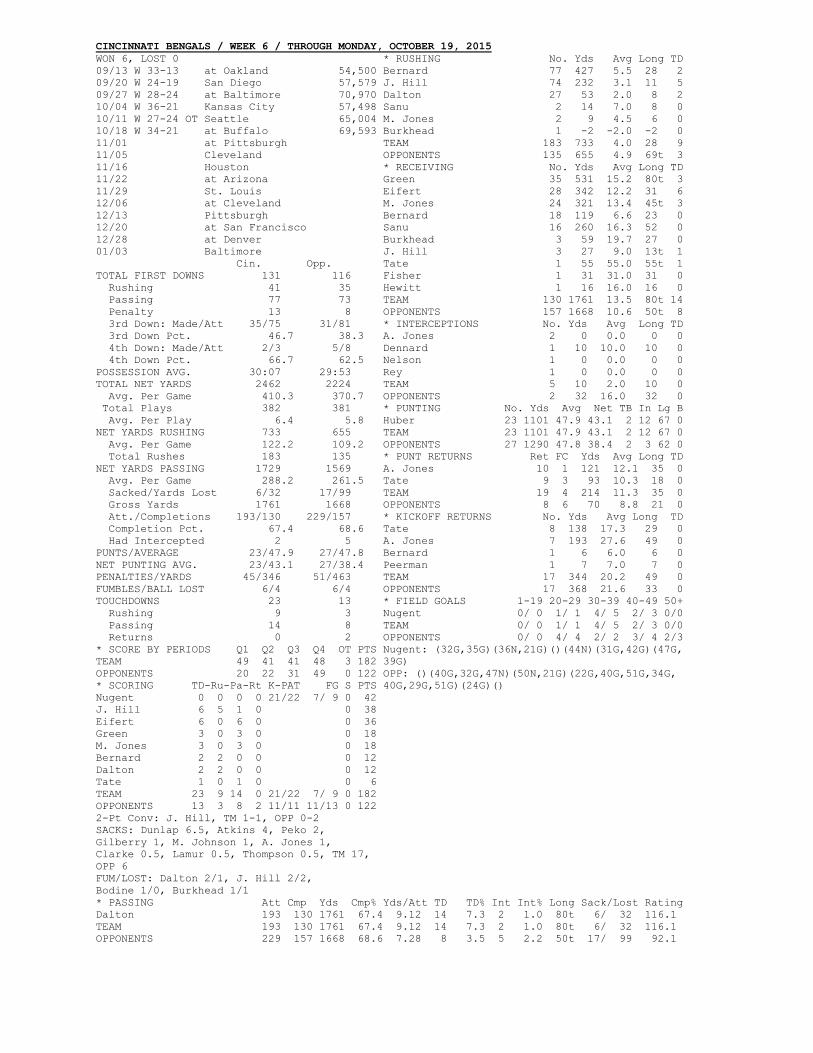
CINCINNATI BENGALS / WEEK 6 / THROUGH MONDAY, OCTOBER 19, 2015
WON 6, LOST 0 * RUSHING No. Yds Avg Long TD
09/13 W 33-13 at Oakland 54,500 Bernard 77 427 5.5 28 2
09/20 W 24-19 San Diego 57,579 J. Hill 74 232 3.1 11 5
09/27 W 28-24 at Baltimore 70,970 Dalton 27 53 2.0 8 2
10/04 W 36-21 Kansas City 57,498 Sanu 2 14 7.0 8 0
10/11 W 27-24 OT Seattle 65,004 M. Jones 2 9 4.5 6 0
10/18 W 34-21 at Buffalo 69,593 Burkhead 1 -2 -2.0 -2 0
11/01 at Pittsburgh TEAM 183 733 4.0 28 9
11/05 Cleveland OPPONENTS 135 655 4.9 69t 3
11/16 Houston * RECEIVING No. Yds Avg Long TD
11/22 at Arizona Green 35 531 15.2 80t 3
11/29 St. Louis Eifert 28 342 12.2 31 6
12/06 at Cleveland M. Jones 24 321 13.4 45t 3
12/13 Pittsburgh Bernard 18 119 6.6 23 0
12/20 at San Francisco Sanu 16 260 16.3 52 0
12/28 at Denver Burkhead 3 59 19.7 27 0
01/03 Baltimore J. Hill 3 27 9.0 13t 1
Cin. Opp. Tate 1 55 55.0 55t 1
TOTAL FIRST DOWNS 131 116 Fisher 1 31 31.0 31 0
Rushing 41 35 Hewitt 1 16 16.0 16 0
Passing 77 73 TEAM 130 1761 13.5 80t 14
Penalty 13 8 OPPONENTS 157 1668 10.6 50t 8
3rd Down: Made/Att 35/75 31/81 * INTERCEPTIONS No. Yds Avg Long TD
3rd Down Pct. 46.7 38.3 A. Jones 2 0 0.0 0 0
4th Down: Made/Att 2/3 5/8 Dennard 1 10 10.0 10 0
4th Down Pct. 66.7 62.5 Nelson 1 0 0.0 0 0
POSSESSION AVG. 30:07 29:53 Rey 1 0 0.0 0 0
TOTAL NET YARDS 2462 2224 TEAM 5 10 2.0 10 0
Avg. Per Game 410.3 370.7 OPPONENTS 2 32 16.0 32 0
Total Plays 382 381 * PUNTING No. Yds Avg Net TB In Lg B
Avg. Per Play 6.4 5.8 Huber 23 1101 47.9 43.1 2 12 67 0
NET YARDS RUSHING 733 655 TEAM 23 1101 47.9 43.1 2 12 67 0
Avg. Per Game 122.2 109.2 OPPONENTS 27 1290 47.8 38.4 2 3 62 0
Total Rushes 183 135 * PUNT RETURNS Ret FC Yds Avg Long TD
NET YARDS PASSING 1729 1569 A. Jones 10 1 121 12.1 35 0
Avg. Per Game 288.2 261.5 Tate 9 3 93 10.3 18 0
Sacked/Yards Lost 6/32 17/99 TEAM 19 4 214 11.3 35 0
Gross Yards 1761 1668 OPPONENTS 8 6 70 8.8 21 0
Att./Completions 193/130 229/157 * KICKOFF RETURNS No. Yds Avg Long TD
Completion Pct. 67.4 68.6 Tate 8 138 17.3 29 0
Had Intercepted 2 5 A. Jones 7 193 27.6 49 0
PUNTS/AVERAGE 23/47.9 27/47.8 Bernard 1 6 6.0 6 0
NET PUNTING AVG. 23/43.1 27/38.4 Peerman 1 7 7.0 7 0
PENALTIES/YARDS 45/346 51/463 TEAM 17 344 20.2 49 0
FUMBLES/BALL LOST 6/4 6/4 OPPONENTS 17 368 21.6 33 0
TOUCHDOWNS 23 13 * FIELD GOALS 1-19 20-29 30-39 40-49 50+
Rushing 9 3 Nugent 0/ 0 1/ 1 4/ 5 2/ 3 0/0
Passing 14 8 TEAM 0/ 0 1/ 1 4/ 5 2/ 3 0/0
Returns 0 2 OPPONENTS 0/ 0 4/ 4 2/ 2 3/ 4 2/3
* SCORE BY PERIODS Q1 Q2 Q3 Q4 OT PTS Nugent: (32G,35G)(36N,21G)()(44N)(31G,42G)(47G,
TEAM 49 41 41 48 3 182 39G)
OPPONENTS 20 22 31 49 0 122 OPP: ()(40G,32G,47N)(50N,21G)(22G,40G,51G,34G,
* SCORING TD-Ru-Pa-Rt K-PAT FG S PTS 40G,29G,51G)(24G)()
Nugent 0 0 0 0 21/22 7/ 9 0 42
J. Hill 6 5 1 0 0 38
Eifert 6 0 6 0 0 36
Green 3 0 3 0 0 18
M. Jones 3 0 3 0 0 18
Bernard 2 2 0 0 0 12
Dalton 2 2 0 0 0 12
Tate 1 0 1 0 0 6
TEAM 23 9 14 0 21/22 7/ 9 0 182
OPPONENTS 13 3 8 2 11/11 11/13 0 122
2-Pt Conv: J. Hill, TM 1-1, OPP 0-2
SACKS: Dunlap 6.5, Atkins 4, Peko 2,
Gilberry 1, M. Johnson 1, A. Jones 1,
Clarke 0.5, Lamur 0.5, Thompson 0.5, TM 17,
OPP 6
FUM/LOST: Dalton 2/1, J. Hill 2/2,
Bodine 1/0, Burkhead 1/1
* PASSING Att Cmp Yds Cmp% Yds/Att TD TD% Int Int% Long Sack/Lost Rating
Dalton 193 130 1761 67.4 9.12 14 7.3 2 1.0 80t 6/ 32 116.1
TEAM 193 130 1761 67.4 9.12 14 7.3 2 1.0 80t 6/ 32 116.1
OPPONENTS 229 157 1668 68.6 7.28 8 3.5 5 2.2 50t 17/ 99 92.1
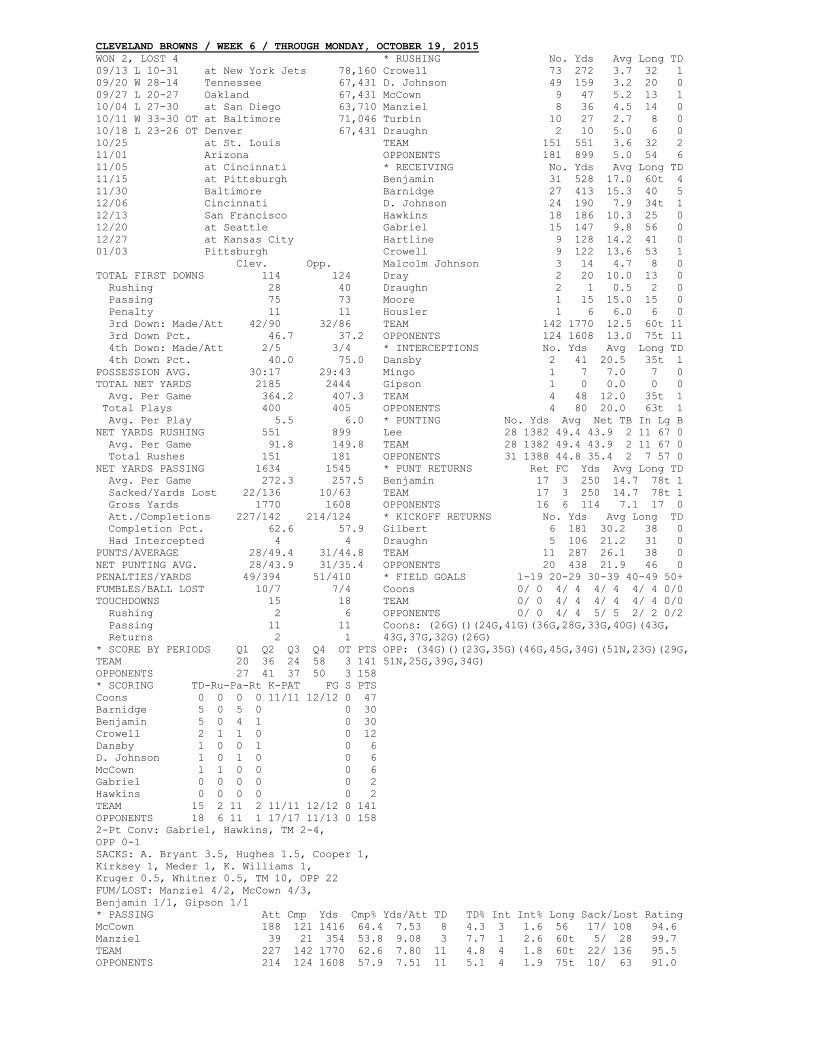
CLEVELAND BROWNS / WEEK 6 / THROUGH MONDAY, OCTOBER 19, 2015
WON 2, LOST 4 * RUSHING No. Yds Avg Long TD
09/13 L 10-31 at New York Jets 78,160 Crowell 73 272 3.7 32 1
09/20 W 28-14 Tennessee 67,431 D. Johnson 49 159 3.2 20 0
09/27 L 20-27 Oakland 67,431 McCown 9 47 5.2 13 1
10/04 L 27-30 at San Diego 63,710 Manziel 8 36 4.5 14 0
10/11 W 33-30 OT at Baltimore 71,046 Turbin 10 27 2.7 8 0
10/18 L 23-26 OT Denver 67,431 Draughn 2 10 5.0 6 0
10/25 at St. Louis TEAM 151 551 3.6 32 2
11/01 Arizona OPPONENTS 181 899 5.0 54 6
11/05 at Cincinnati * RECEIVING No. Yds Avg Long TD
11/15 at Pittsburgh Benjamin 31 528 17.0 60t 4
11/30 Baltimore Barnidge 27 413 15.3 40 5
12/06 Cincinnati D. Johnson 24 190 7.9 34t 1
12/13 San Francisco Hawkins 18 186 10.3 25 0
12/20 at Seattle Gabriel 15 147 9.8 56 0
12/27 at Kansas City Hartline 9 128 14.2 41 0
01/03 Pittsburgh Crowell 9 122 13.6 53 1
Clev. Opp. Malcolm Johnson 3 14 4.7 8 0
TOTAL FIRST DOWNS 114 124 Dray 2 20 10.0 13 0
Rushing 28 40 Draughn 2 1 0.5 2 0
Passing 75 73 Moore 1 15 15.0 15 0
Penalty 11 11 Housler 1 6 6.0 6 0
3rd Down: Made/Att 42/90 32/86 TEAM 142 1770 12.5 60t 11
3rd Down Pct. 46.7 37.2 OPPONENTS 124 1608 13.0 75t 11
4th Down: Made/Att 2/5 3/4 * INTERCEPTIONS No. Yds Avg Long TD
4th Down Pct. 40.0 75.0 Dansby 2 41 20.5 35t 1
POSSESSION AVG. 30:17 29:43 Mingo 1 7 7.0 7 0
TOTAL NET YARDS 2185 2444 Gipson 1 0 0.0 0 0
Avg. Per Game 364.2 407.3 TEAM 4 48 12.0 35t 1
Total Plays 400 405 OPPONENTS 4 80 20.0 63t 1
Avg. Per Play 5.5 6.0 * PUNTING No. Yds Avg Net TB In Lg B
NET YARDS RUSHING 551 899 Lee 28 1382 49.4 43.9 2 11 67 0
Avg. Per Game 91.8 149.8 TEAM 28 1382 49.4 43.9 2 11 67 0
Total Rushes 151 181 OPPONENTS 31 1388 44.8 35.4 2 7 57 0
NET YARDS PASSING 1634 1545 * PUNT RETURNS Ret FC Yds Avg Long TD
Avg. Per Game 272.3 257.5 Benjamin 17 3 250 14.7 78t 1
Sacked/Yards Lost 22/136 10/63 TEAM 17 3 250 14.7 78t 1
Gross Yards 1770 1608 OPPONENTS 16 6 114 7.1 17 0
Att./Completions 227/142 214/124 * KICKOFF RETURNS No. Yds Avg Long TD
Completion Pct. 62.6 57.9 Gilbert 6 181 30.2 38 0
Had Intercepted 4 4 Draughn 5 106 21.2 31 0
PUNTS/AVERAGE 28/49.4 31/44.8 TEAM 11 287 26.1 38 0
NET PUNTING AVG. 28/43.9 31/35.4 OPPONENTS 20 438 21.9 46 0
PENALTIES/YARDS 49/394 51/410 * FIELD GOALS 1-19 20-29 30-39 40-49 50+
FUMBLES/BALL LOST 10/7 7/4 Coons 0/ 0 4/ 4 4/ 4 4/ 4 0/0
TOUCHDOWNS 15 18 TEAM 0/ 0 4/ 4 4/ 4 4/ 4 0/0
Rushing 2 6 OPPONENTS 0/ 0 4/ 4 5/ 5 2/ 2 0/2
Passing 11 11 Coons: (26G)()(24G,41G)(36G,28G,33G,40G)(43G,
Returns 2 1 43G,37G,32G)(26G)
* SCORE BY PERIODS Q1 Q2 Q3 Q4 OT PTS OPP: (34G)()(23G,35G)(46G,45G,34G)(51N,23G)(29G,
TEAM 20 36 24 58 3 141 51N,25G,39G,34G)
OPPONENTS 27 41 37 50 3 158
* SCORING TD-Ru-Pa-Rt K-PAT FG S PTS
Coons 0 0 0 0 11/11 12/12 0 47
Barnidge 5 0 5 0 0 30
Benjamin 5 0 4 1 0 30
Crowell 2 1 1 0 0 12
Dansby 1 0 0 1 0 6
D. Johnson 1 0 1 0 0 6
McCown 1 1 0 0 0 6
Gabriel 0 0 0 0 0 2
Hawkins 0 0 0 0 0 2
TEAM 15 2 11 2 11/11 12/12 0 141
OPPONENTS 18 6 11 1 17/17 11/13 0 158
2-Pt Conv: Gabriel, Hawkins, TM 2-4,
OPP 0-1
SACKS: A. Bryant 3.5, Hughes 1.5, Cooper 1,
Kirksey 1, Meder 1, K. Williams 1,
Kruger 0.5, Whitner 0.5, TM 10, OPP 22
FUM/LOST: Manziel 4/2, McCown 4/3,
Benjamin 1/1, Gipson 1/1
* PASSING Att Cmp Yds Cmp% Yds/Att TD TD% Int Int% Long Sack/Lost Rating
McCown 188 121 1416 64.4 7.53 8 4.3 3 1.6 56 17/ 108 94.6
Manziel 39 21 354 53.8 9.08 3 7.7 1 2.6 60t 5/ 28 99.7
TEAM 227 142 1770 62.6 7.80 11 4.8 4 1.8 60t 22/ 136 95.5
OPPONENTS 214 124 1608 57.9 7.51 11 5.1 4 1.9 75t 10/ 63 91.0
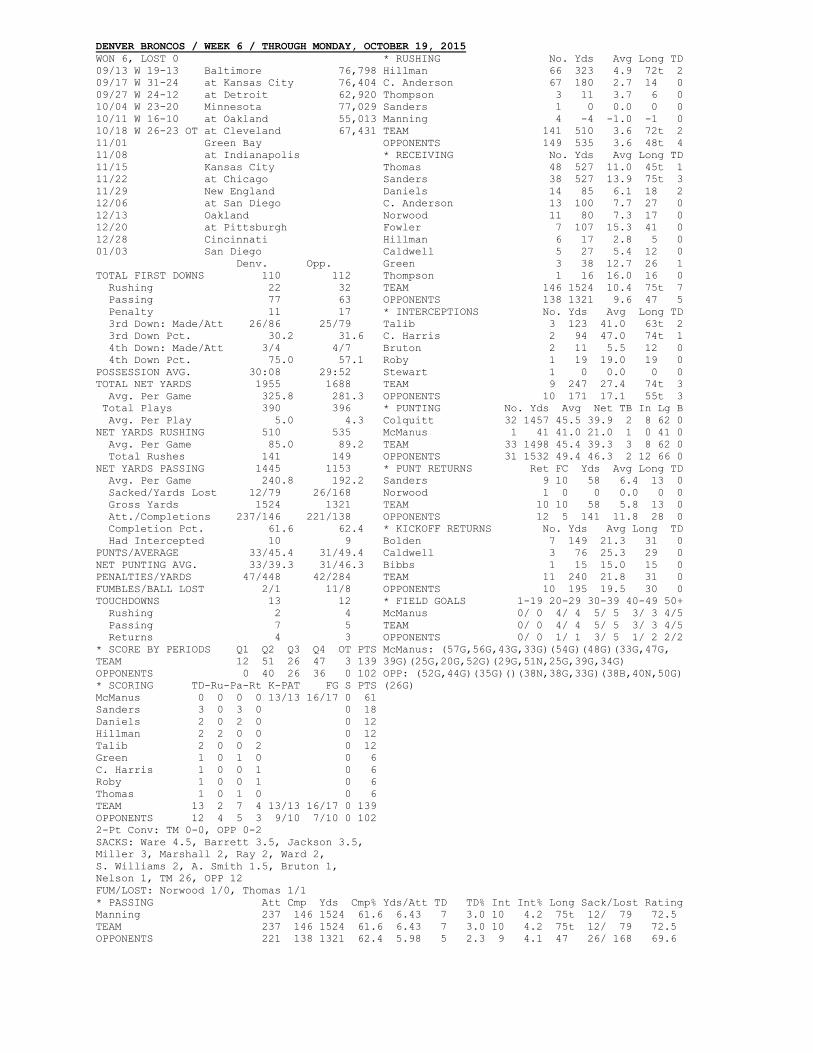
DENVER BRONCOS / WEEK 6 / THROUGH MONDAY, OCTOBER 19, 2015
WON 6, LOST 0 * RUSHING No. Yds Avg Long TD
09/13 W 19-13 Baltimore 76,798 Hillman 66 323 4.9 72t 2
09/17 W 31-24 at Kansas City 76,404 C. Anderson 67 180 2.7 14 0
09/27 W 24-12 at Detroit 62,920 Thompson 3 11 3.7 6 0
10/04 W 23-20 Minnesota 77,029 Sanders 1 0 0.0 0 0
10/11 W 16-10 at Oakland 55,013 Manning 4 -4 -1.0 -1 0
10/18 W 26-23 OT at Cleveland 67,431 TEAM 141 510 3.6 72t 2
11/01 Green Bay OPPONENTS 149 535 3.6 48t 4
11/08 at Indianapolis * RECEIVING No. Yds Avg Long TD
11/15 Kansas City Thomas 48 527 11.0 45t 1
11/22 at Chicago Sanders 38 527 13.9 75t 3
11/29 New England Daniels 14 85 6.1 18 2
12/06 at San Diego C. Anderson 13 100 7.7 27 0
12/13 Oakland Norwood 11 80 7.3 17 0
12/20 at Pittsburgh Fowler 7 107 15.3 41 0
12/28 Cincinnati Hillman 6 17 2.8 5 0
01/03 San Diego Caldwell 5 27 5.4 12 0
Denv. Opp. Green 3 38 12.7 26 1
TOTAL FIRST DOWNS 110 112 Thompson 1 16 16.0 16 0
Rushing 22 32 TEAM 146 1524 10.4 75t 7
Passing 77 63 OPPONENTS 138 1321 9.6 47 5
Penalty 11 17 * INTERCEPTIONS No. Yds Avg Long TD
3rd Down: Made/Att 26/86 25/79 Talib 3 123 41.0 63t 2
3rd Down Pct. 30.2 31.6 C. Harris 2 94 47.0 74t 1
4th Down: Made/Att 3/4 4/7 Bruton 2 11 5.5 12 0
4th Down Pct. 75.0 57.1 Roby 1 19 19.0 19 0
POSSESSION AVG. 30:08 29:52 Stewart 1 0 0.0 0 0
TOTAL NET YARDS 1955 1688 TEAM 9 247 27.4 74t 3
Avg. Per Game 325.8 281.3 OPPONENTS 10 171 17.1 55t 3
Total Plays 390 396 * PUNTING No. Yds Avg Net TB In Lg B
Avg. Per Play 5.0 4.3 Colquitt 32 1457 45.5 39.9 2 8 62 0
NET YARDS RUSHING 510 535 McManus 1 41 41.0 21.0 1 0 41 0
Avg. Per Game 85.0 89.2 TEAM 33 1498 45.4 39.3 3 8 62 0
Total Rushes 141 149 OPPONENTS 31 1532 49.4 46.3 2 12 66 0
NET YARDS PASSING 1445 1153 * PUNT RETURNS Ret FC Yds Avg Long TD
Avg. Per Game 240.8 192.2 Sanders 9 10 58 6.4 13 0
Sacked/Yards Lost 12/79 26/168 Norwood 1 0 0 0.0 0 0
Gross Yards 1524 1321 TEAM 10 10 58 5.8 13 0
Att./Completions 237/146 221/138 OPPONENTS 12 5 141 11.8 28 0
Completion Pct. 61.6 62.4 * KICKOFF RETURNS No. Yds Avg Long TD
Had Intercepted 10 9 Bolden 7 149 21.3 31 0
PUNTS/AVERAGE 33/45.4 31/49.4 Caldwell 3 76 25.3 29 0
NET PUNTING AVG. 33/39.3 31/46.3 Bibbs 1 15 15.0 15 0
PENALTIES/YARDS 47/448 42/284 TEAM 11 240 21.8 31 0
FUMBLES/BALL LOST 2/1 11/8 OPPONENTS 10 195 19.5 30 0
TOUCHDOWNS 13 12 * FIELD GOALS 1-19 20-29 30-39 40-49 50+
Rushing 2 4 McManus 0/ 0 4/ 4 5/ 5 3/ 3 4/5
Passing 7 5 TEAM 0/ 0 4/ 4 5/ 5 3/ 3 4/5
Returns 4 3 OPPONENTS 0/ 0 1/ 1 3/ 5 1/ 2 2/2
* SCORE BY PERIODS Q1 Q2 Q3 Q4 OT PTS McManus: (57G,56G,43G,33G)(54G)(48G)(33G,47G,
TEAM 12 51 26 47 3 139 39G)(25G,20G,52G)(29G,51N,25G,39G,34G)
OPPONENTS 0 40 26 36 0 102 OPP: (52G,44G)(35G)()(38N,38G,33G)(38B,40N,50G)
* SCORING TD-Ru-Pa-Rt K-PAT FG S PTS (26G)
McManus 0 0 0 0 13/13 16/17 0 61
Sanders 3 0 3 0 0 18
Daniels 2 0 2 0 0 12
Hillman 2 2 0 0 0 12
Talib 2 0 0 2 0 12
Green 1 0 1 0 0 6
C. Harris 1 0 0 1 0 6
Roby 1 0 0 1 0 6
Thomas 1 0 1 0 0 6
TEAM 13 2 7 4 13/13 16/17 0 139
OPPONENTS 12 4 5 3 9/10 7/10 0 102
2-Pt Conv: TM 0-0, OPP 0-2
SACKS: Ware 4.5, Barrett 3.5, Jackson 3.5,
Miller 3, Marshall 2, Ray 2, Ward 2,
S. Williams 2, A. Smith 1.5, Bruton 1,
Nelson 1, TM 26, OPP 12
FUM/LOST: Norwood 1/0, Thomas 1/1
* PASSING Att Cmp Yds Cmp% Yds/Att TD TD% Int Int% Long Sack/Lost Rating
Manning 237 146 1524 61.6 6.43 7 3.0 10 4.2 75t 12/ 79 72.5
TEAM 237 146 1524 61.6 6.43 7 3.0 10 4.2 75t 12/ 79 72.5
OPPONENTS 221 138 1321 62.4 5.98 5 2.3 9 4.1 47 26/ 168 69.6
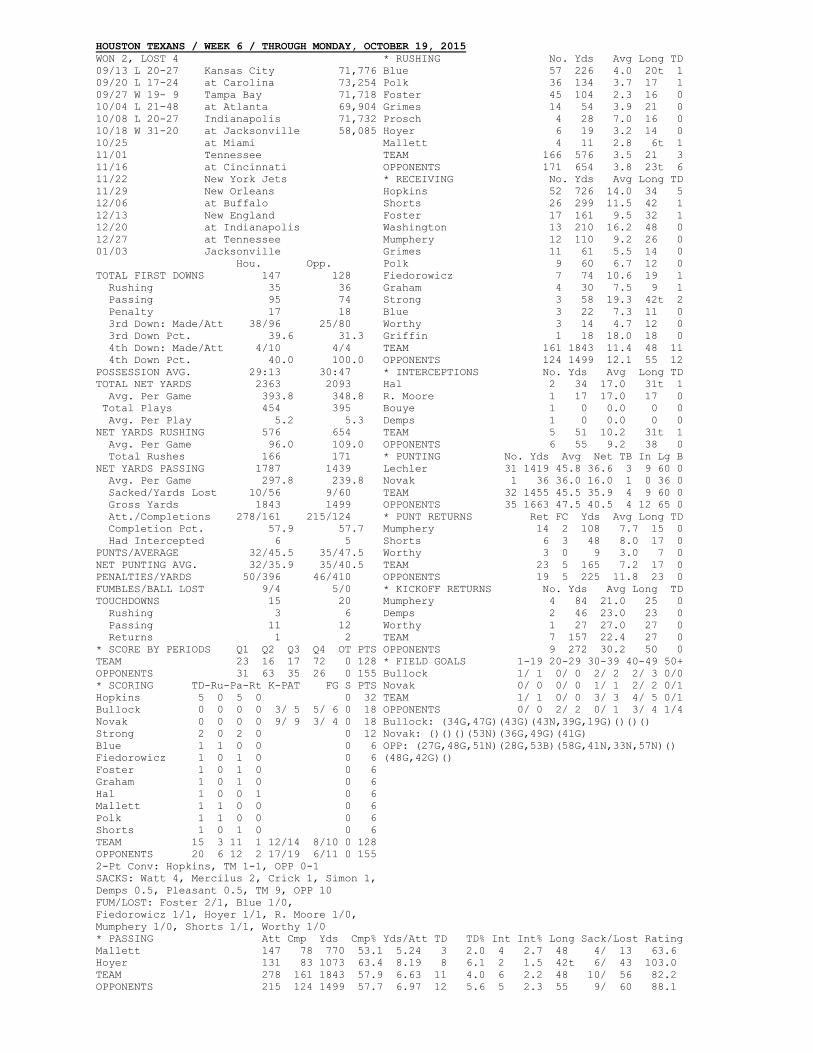
HOUSTON TEXANS / WEEK 6 / THROUGH MONDAY, OCTOBER 19, 2015
WON 2, LOST 4 * RUSHING No. Yds Avg Long TD
09/13 L 20-27 Kansas City 71,776 Blue 57 226 4.0 20t 1
09/20 L 17-24 at Carolina 73,254 Polk 36 134 3.7 17 1
09/27 W 19- 9 Tampa Bay 71,718 Foster 45 104 2.3 16 0
10/04 L 21-48 at Atlanta 69,904 Grimes 14 54 3.9 21 0
10/08 L 20-27 Indianapolis 71,732 Prosch 4 28 7.0 16 0
10/18 W 31-20 at Jacksonville 58,085 Hoyer 6 19 3.2 14 0
10/25 at Miami Mallett 4 11 2.8 6t 1
11/01 Tennessee TEAM 166 576 3.5 21 3
11/16 at Cincinnati OPPONENTS 171 654 3.8 23t 6
11/22 New York Jets * RECEIVING No. Yds Avg Long TD
11/29 New Orleans Hopkins 52 726 14.0 34 5
12/06 at Buffalo Shorts 26 299 11.5 42 1
12/13 New England Foster 17 161 9.5 32 1
12/20 at Indianapolis Washington 13 210 16.2 48 0
12/27 at Tennessee Mumphery 12 110 9.2 26 0
01/03 Jacksonville Grimes 11 61 5.5 14 0
Hou. Opp. Polk 9 60 6.7 12 0
TOTAL FIRST DOWNS 147 128 Fiedorowicz 7 74 10.6 19 1
Rushing 35 36 Graham 4 30 7.5 9 1
Passing 95 74 Strong 3 58 19.3 42t 2
Penalty 17 18 Blue 3 22 7.3 11 0
3rd Down: Made/Att 38/96 25/80 Worthy 3 14 4.7 12 0
3rd Down Pct. 39.6 31.3 Griffin 1 18 18.0 18 0
4th Down: Made/Att 4/10 4/4 TEAM 161 1843 11.4 48 11
4th Down Pct. 40.0 100.0 OPPONENTS 124 1499 12.1 55 12
POSSESSION AVG. 29:13 30:47 * INTERCEPTIONS No. Yds Avg Long TD
TOTAL NET YARDS 2363 2093 Hal 2 34 17.0 31t 1
Avg. Per Game 393.8 348.8 R. Moore 1 17 17.0 17 0
Total Plays 454 395 Bouye 1 0 0.0 0 0
Avg. Per Play 5.2 5.3 Demps 1 0 0.0 0 0
NET YARDS RUSHING 576 654 TEAM 5 51 10.2 31t 1
Avg. Per Game 96.0 109.0 OPPONENTS 6 55 9.2 38 0
Total Rushes 166 171 * PUNTING No. Yds Avg Net TB In Lg B
NET YARDS PASSING 1787 1439 Lechler 31 1419 45.8 36.6 3 9 60 0
Avg. Per Game 297.8 239.8 Novak 1 36 36.0 16.0 1 0 36 0
Sacked/Yards Lost 10/56 9/60 TEAM 32 1455 45.5 35.9 4 9 60 0
Gross Yards 1843 1499 OPPONENTS 35 1663 47.5 40.5 4 12 65 0
Att./Completions 278/161 215/124 * PUNT RETURNS Ret FC Yds Avg Long TD
Completion Pct. 57.9 57.7 Mumphery 14 2 108 7.7 15 0
Had Intercepted 6 5 Shorts 6 3 48 8.0 17 0
PUNTS/AVERAGE 32/45.5 35/47.5 Worthy 3 0 9 3.0 7 0
NET PUNTING AVG. 32/35.9 35/40.5 TEAM 23 5 165 7.2 17 0
PENALTIES/YARDS 50/396 46/410 OPPONENTS 19 5 225 11.8 23 0
FUMBLES/BALL LOST 9/4 5/0 * KICKOFF RETURNS No. Yds Avg Long TD
TOUCHDOWNS 15 20 Mumphery 4 84 21.0 25 0
Rushing 3 6 Demps 2 46 23.0 23 0
Passing 11 12 Worthy 1 27 27.0 27 0
Returns 1 2 TEAM 7 157 22.4 27 0
* SCORE BY PERIODS Q1 Q2 Q3 Q4 OT PTS OPPONENTS 9 272 30.2 50 0
TEAM 23 16 17 72 0 128 * FIELD GOALS 1-19 20-29 30-39 40-49 50+
OPPONENTS 31 63 35 26 0 155 Bullock 1/ 1 0/ 0 2/ 2 2/ 3 0/0
* SCORING TD-Ru-Pa-Rt K-PAT FG S PTS Novak 0/ 0 0/ 0 1/ 1 2/ 2 0/1
Hopkins 5 0 5 0 0 32 TEAM 1/ 1 0/ 0 3/ 3 4/ 5 0/1
Bullock 0 0 0 0 3/ 5 5/ 6 0 18 OPPONENTS 0/ 0 2/ 2 0/ 1 3/ 4 1/4
Novak 0 0 0 0 9/ 9 3/ 4 0 18 Bullock: (34G,47G)(43G)(43N,39G,19G)()()()
Strong 2 0 2 0 0 12 Novak: ()()()(53N)(36G,49G)(41G)
Blue 1 1 0 0 0 6 OPP: (27G,48G,51N)(28G,53B)(58G,41N,33N,57N)()
Fiedorowicz 1 0 1 0 0 6 (48G,42G)()
Foster 1 0 1 0 0 6
Graham 1 0 1 0 0 6
Hal 1 0 0 1 0 6
Mallett 1 1 0 0 0 6
Polk 1 1 0 0 0 6
Shorts 1 0 1 0 0 6
TEAM 15 3 11 1 12/14 8/10 0 128
OPPONENTS 20 6 12 2 17/19 6/11 0 155
2-Pt Conv: Hopkins, TM 1-1, OPP 0-1
SACKS: Watt 4, Mercilus 2, Crick 1, Simon 1,
Demps 0.5, Pleasant 0.5, TM 9, OPP 10
FUM/LOST: Foster 2/1, Blue 1/0,
Fiedorowicz 1/1, Hoyer 1/1, R. Moore 1/0,
Mumphery 1/0, Shorts 1/1, Worthy 1/0
* PASSING Att Cmp Yds Cmp% Yds/Att TD TD% Int Int% Long Sack/Lost Rating
Mallett 147 78 770 53.1 5.24 3 2.0 4 2.7 48 4/ 13 63.6
Hoyer 131 83 1073 63.4 8.19 8 6.1 2 1.5 42t 6/ 43 103.0
TEAM 278 161 1843 57.9 6.63 11 4.0 6 2.2 48 10/ 56 82.2
OPPONENTS 215 124 1499 57.7 6.97 12 5.6 5 2.3 55 9/ 60 88.1
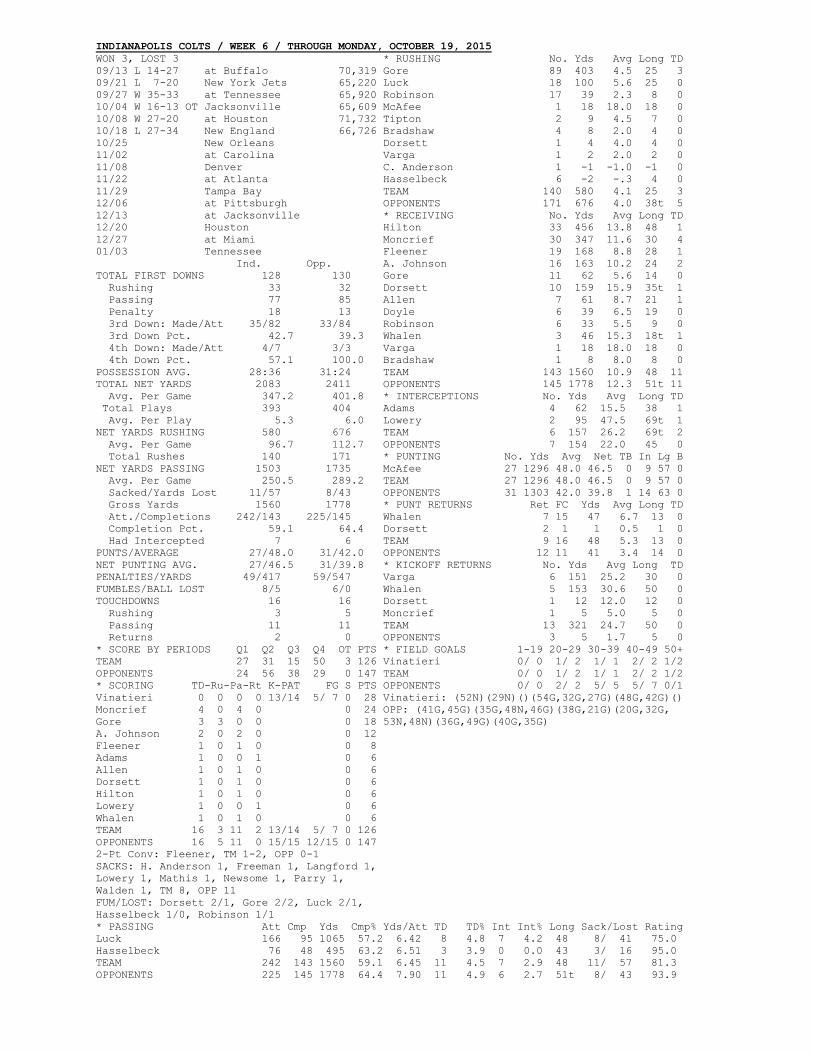
INDIANAPOLIS COLTS / WEEK 6 / THROUGH MONDAY, OCTOBER 19, 2015
WON 3, LOST 3 * RUSHING No. Yds Avg Long TD
09/13 L 14-27 at Buffalo 70,319 Gore 89 403 4.5 25 3
09/21 L 7-20 New York Jets 65,220 Luck 18 100 5.6 25 0
09/27 W 35-33 at Tennessee 65,920 Robinson 17 39 2.3 8 0
10/04 W 16-13 OT Jacksonville 65,609 McAfee 1 18 18.0 18 0
10/08 W 27-20 at Houston 71,732 Tipton 2 9 4.5 7 0
10/18 L 27-34 New England 66,726 Bradshaw 4 8 2.0 4 0
10/25 New Orleans Dorsett 1 4 4.0 4 0
11/02 at Carolina Varga 1 2 2.0 2 0
11/08 Denver C. Anderson 1 -1 -1.0 -1 0
11/22 at Atlanta Hasselbeck 6 -2 -.3 4 0
11/29 Tampa Bay TEAM 140 580 4.1 25 3
12/06 at Pittsburgh OPPONENTS 171 676 4.0 38t 5
12/13 at Jacksonville * RECEIVING No. Yds Avg Long TD
12/20 Houston Hilton 33 456 13.8 48 1
12/27 at Miami Moncrief 30 347 11.6 30 4
01/03 Tennessee Fleener 19 168 8.8 28 1
Ind. Opp. A. Johnson 16 163 10.2 24 2
TOTAL FIRST DOWNS 128 130 Gore 11 62 5.6 14 0
Rushing 33 32 Dorsett 10 159 15.9 35t 1
Passing 77 85 Allen 7 61 8.7 21 1
Penalty 18 13 Doyle 6 39 6.5 19 0
3rd Down: Made/Att 35/82 33/84 Robinson 6 33 5.5 9 0
3rd Down Pct. 42.7 39.3 Whalen 3 46 15.3 18t 1
4th Down: Made/Att 4/7 3/3 Varga 1 18 18.0 18 0
4th Down Pct. 57.1 100.0 Bradshaw 1 8 8.0 8 0
POSSESSION AVG. 28:36 31:24 TEAM 143 1560 10.9 48 11
TOTAL NET YARDS 2083 2411 OPPONENTS 145 1778 12.3 51t 11
Avg. Per Game 347.2 401.8 * INTERCEPTIONS No. Yds Avg Long TD
Total Plays 393 404 Adams 4 62 15.5 38 1
Avg. Per Play 5.3 6.0 Lowery 2 95 47.5 69t 1
NET YARDS RUSHING 580 676 TEAM 6 157 26.2 69t 2
Avg. Per Game 96.7 112.7 OPPONENTS 7 154 22.0 45 0
Total Rushes 140 171 * PUNTING No. Yds Avg Net TB In Lg B
NET YARDS PASSING 1503 1735 McAfee 27 1296 48.0 46.5 0 9 57 0
Avg. Per Game 250.5 289.2 TEAM 27 1296 48.0 46.5 0 9 57 0
Sacked/Yards Lost 11/57 8/43 OPPONENTS 31 1303 42.0 39.8 1 14 63 0
Gross Yards 1560 1778 * PUNT RETURNS Ret FC Yds Avg Long TD
Att./Completions 242/143 225/145 Whalen 7 15 47 6.7 13 0
Completion Pct. 59.1 64.4 Dorsett 2 1 1 0.5 1 0
Had Intercepted 7 6 TEAM 9 16 48 5.3 13 0
PUNTS/AVERAGE 27/48.0 31/42.0 OPPONENTS 12 11 41 3.4 14 0
NET PUNTING AVG. 27/46.5 31/39.8 * KICKOFF RETURNS No. Yds Avg Long TD
PENALTIES/YARDS 49/417 59/547 Varga 6 151 25.2 30 0
FUMBLES/BALL LOST 8/5 6/0 Whalen 5 153 30.6 50 0
TOUCHDOWNS 16 16 Dorsett 1 12 12.0 12 0
Rushing 3 5 Moncrief 1 5 5.0 5 0
Passing 11 11 TEAM 13 321 24.7 50 0
Returns 2 0 OPPONENTS 3 5 1.7 5 0
* SCORE BY PERIODS Q1 Q2 Q3 Q4 OT PTS * FIELD GOALS 1-19 20-29 30-39 40-49 50+
TEAM 27 31 15 50 3 126 Vinatieri 0/ 0 1/ 2 1/ 1 2/ 2 1/2
OPPONENTS 24 56 38 29 0 147 TEAM 0/ 0 1/ 2 1/ 1 2/ 2 1/2
* SCORING TD-Ru-Pa-Rt K-PAT FG S PTS OPPONENTS 0/ 0 2/ 2 5/ 5 5/ 7 0/1
Vinatieri 0 0 0 0 13/14 5/ 7 0 28 Vinatieri: (52N)(29N)()(54G,32G,27G)(48G,42G)()
Moncrief 4 0 4 0 0 24 OPP: (41G,45G)(35G,48N,46G)(38G,21G)(20G,32G,
Gore 3 3 0 0 0 18 53N,48N)(36G,49G)(40G,35G)
A. Johnson 2 0 2 0 0 12
Fleener 1 0 1 0 0 8
Adams 1 0 0 1 0 6
Allen 1 0 1 0 0 6
Dorsett 1 0 1 0 0 6
Hilton 1 0 1 0 0 6
Lowery 1 0 0 1 0 6
Whalen 1 0 1 0 0 6
TEAM 16 3 11 2 13/14 5/ 7 0 126
OPPONENTS 16 5 11 0 15/15 12/15 0 147
2-Pt Conv: Fleener, TM 1-2, OPP 0-1
SACKS: H. Anderson 1, Freeman 1, Langford 1,
Lowery 1, Mathis 1, Newsome 1, Parry 1,
Walden 1, TM 8, OPP 11
FUM/LOST: Dorsett 2/1, Gore 2/2, Luck 2/1,
Hasselbeck 1/0, Robinson 1/1
* PASSING Att Cmp Yds Cmp% Yds/Att TD TD% Int Int% Long Sack/Lost Rating
Luck 166 95 1065 57.2 6.42 8 4.8 7 4.2 48 8/ 41 75.0
Hasselbeck 76 48 495 63.2 6.51 3 3.9 0 0.0 43 3/ 16 95.0
TEAM 242 143 1560 59.1 6.45 11 4.5 7 2.9 48 11/ 57 81.3
OPPONENTS 225 145 1778 64.4 7.90 11 4.9 6 2.7 51t 8/ 43 93.9
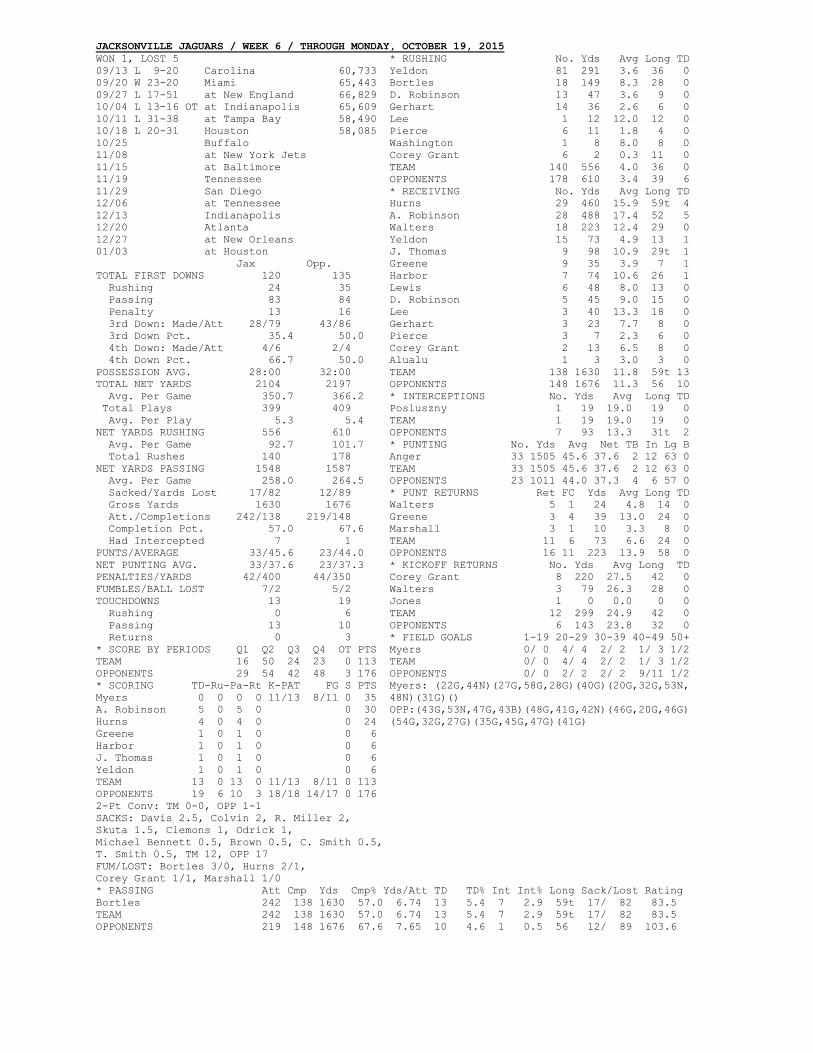
JACKSONVILLE JAGUARS / WEEK 6 / THROUGH MONDAY, OCTOBER 19, 2015
WON 1, LOST 5 * RUSHING No. Yds Avg Long TD
09/13 L 9-20 Carolina 60,733 Yeldon 81 291 3.6 36 0
09/20 W 23-20 Miami 65,443 Bortles 18 149 8.3 28 0
09/27 L 17-51 at New England 66,829 D. Robinson 13 47 3.6 9 0
10/04 L 13-16 OT at Indianapolis 65,609 Gerhart 14 36 2.6 6 0
10/11 L 31-38 at Tampa Bay 58,490 Lee 1 12 12.0 12 0
10/18 L 20-31 Houston 58,085 Pierce 6 11 1.8 4 0
10/25 Buffalo Washington 1 8 8.0 8 0
11/08 at New York Jets Corey Grant 6 2 0.3 11 0
11/15 at Baltimore TEAM 140 556 4.0 36 0
11/19 Tennessee OPPONENTS 178 610 3.4 39 6
11/29 San Diego * RECEIVING No. Yds Avg Long TD
12/06 at Tennessee Hurns 29 460 15.9 59t 4
12/13 Indianapolis A. Robinson 28 488 17.4 52 5
12/20 Atlanta Walters 18 223 12.4 29 0
12/27 at New Orleans Yeldon 15 73 4.9 13 1
01/03 at Houston J. Thomas 9 98 10.9 29t 1
Jax Opp. Greene 9 35 3.9 7 1
TOTAL FIRST DOWNS 120 135 Harbor 7 74 10.6 26 1
Rushing 24 35 Lewis 6 48 8.0 13 0
Passing 83 84 D. Robinson 5 45 9.0 15 0
Penalty 13 16 Lee 3 40 13.3 18 0
3rd Down: Made/Att 28/79 43/86 Gerhart 3 23 7.7 8 0
3rd Down Pct. 35.4 50.0 Pierce 3 7 2.3 6 0
4th Down: Made/Att 4/6 2/4 Corey Grant 2 13 6.5 8 0
4th Down Pct. 66.7 50.0 Alualu 1 3 3.0 3 0
POSSESSION AVG. 28:00 32:00 TEAM 138 1630 11.8 59t 13
TOTAL NET YARDS 2104 2197 OPPONENTS 148 1676 11.3 56 10
Avg. Per Game 350.7 366.2 * INTERCEPTIONS No. Yds Avg Long TD
Total Plays 399 409 Posluszny 1 19 19.0 19 0
Avg. Per Play 5.3 5.4 TEAM 1 19 19.0 19 0
NET YARDS RUSHING 556 610 OPPONENTS 7 93 13.3 31t 2
Avg. Per Game 92.7 101.7 * PUNTING No. Yds Avg Net TB In Lg B
Total Rushes 140 178 Anger 33 1505 45.6 37.6 2 12 63 0
NET YARDS PASSING 1548 1587 TEAM 33 1505 45.6 37.6 2 12 63 0
Avg. Per Game 258.0 264.5 OPPONENTS 23 1011 44.0 37.3 4 6 57 0
Sacked/Yards Lost 17/82 12/89 * PUNT RETURNS Ret FC Yds Avg Long TD
Gross Yards 1630 1676 Walters 5 1 24 4.8 14 0
Att./Completions 242/138 219/148 Greene 3 4 39 13.0 24 0
Completion Pct. 57.0 67.6 Marshall 3 1 10 3.3 8 0
Had Intercepted 7 1 TEAM 11 6 73 6.6 24 0
PUNTS/AVERAGE 33/45.6 23/44.0 OPPONENTS 16 11 223 13.9 58 0
NET PUNTING AVG. 33/37.6 23/37.3 * KICKOFF RETURNS No. Yds Avg Long TD
PENALTIES/YARDS 42/400 44/350 Corey Grant 8 220 27.5 42 0
FUMBLES/BALL LOST 7/2 5/2 Walters 3 79 26.3 28 0
TOUCHDOWNS 13 19 Jones 1 0 0.0 0 0
Rushing 0 6 TEAM 12 299 24.9 42 0
Passing 13 10 OPPONENTS 6 143 23.8 32 0
Returns 0 3 * FIELD GOALS 1-19 20-29 30-39 40-49 50+
* SCORE BY PERIODS Q1 Q2 Q3 Q4 OT PTS Myers 0/ 0 4/ 4 2/ 2 1/ 3 1/2
TEAM 16 50 24 23 0 113 TEAM 0/ 0 4/ 4 2/ 2 1/ 3 1/2
OPPONENTS 29 54 42 48 3 176 OPPONENTS 0/ 0 2/ 2 2/ 2 9/11 1/2
* SCORING TD-Ru-Pa-Rt K-PAT FG S PTS Myers: (22G,44N)(27G,58G,28G)(40G)(20G,32G,53N,
Myers 0 0 0 0 11/13 8/11 0 35 48N)(31G)()
A. Robinson 5 0 5 0 0 30 OPP:(43G,53N,47G,43B)(48G,41G,42N)(46G,20G,46G)
Hurns 4 0 4 0 0 24 (54G,32G,27G)(35G,45G,47G)(41G)
Greene 1 0 1 0 0 6
Harbor 1 0 1 0 0 6
J. Thomas 1 0 1 0 0 6
Yeldon 1 0 1 0 0 6
TEAM 13 0 13 0 11/13 8/11 0 113
OPPONENTS 19 6 10 3 18/18 14/17 0 176
2-Pt Conv: TM 0-0, OPP 1-1
SACKS: Davis 2.5, Colvin 2, R. Miller 2,
Skuta 1.5, Clemons 1, Odrick 1,
Michael Bennett 0.5, Brown 0.5, C. Smith 0.5,
T. Smith 0.5, TM 12, OPP 17
FUM/LOST: Bortles 3/0, Hurns 2/1,
Corey Grant 1/1, Marshall 1/0
* PASSING Att Cmp Yds Cmp% Yds/Att TD TD% Int Int% Long Sack/Lost Rating
Bortles 242 138 1630 57.0 6.74 13 5.4 7 2.9 59t 17/ 82 83.5
TEAM 242 138 1630 57.0 6.74 13 5.4 7 2.9 59t 17/ 82 83.5
OPPONENTS 219 148 1676 67.6 7.65 10 4.6 1 0.5 56 12/ 89 103.6
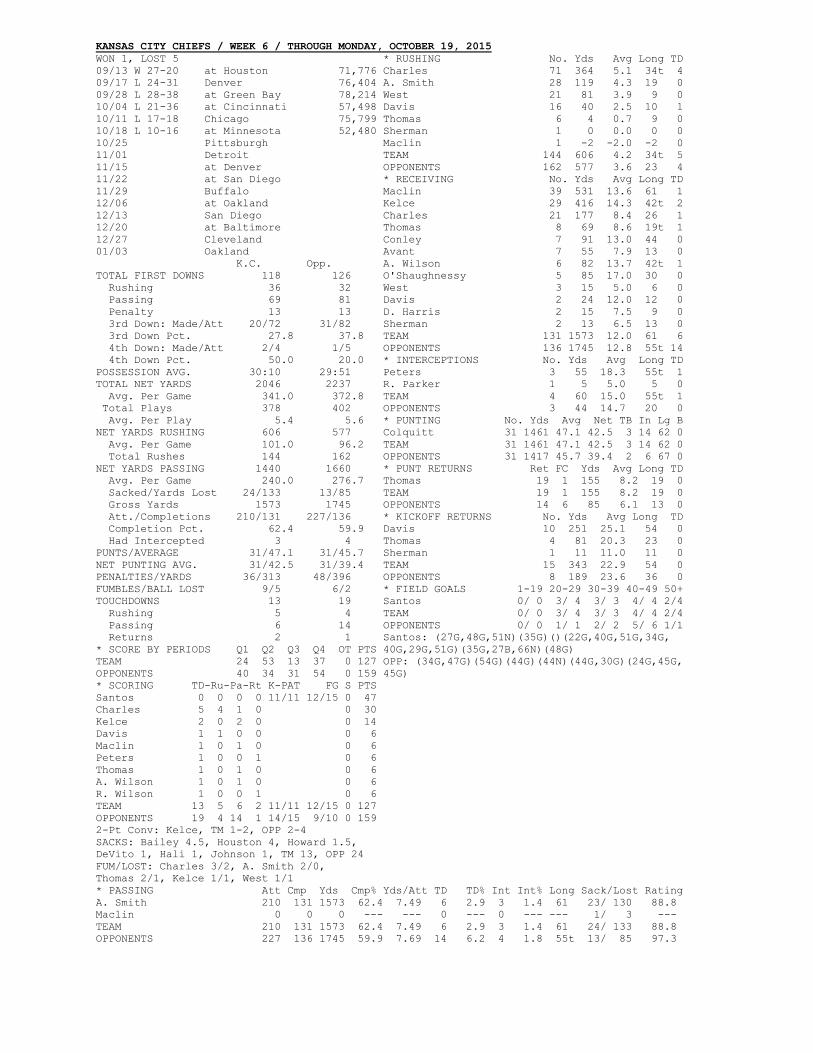
KANSAS CITY CHIEFS / WEEK 6 / THROUGH MONDAY, OCTOBER 19, 2015
WON 1, LOST 5 * RUSHING No. Yds Avg Long TD
09/13 W 27-20 at Houston 71,776 Charles 71 364 5.1 34t 4
09/17 L 24-31 Denver 76,404 A. Smith 28 119 4.3 19 0
09/28 L 28-38 at Green Bay 78,214 West 21 81 3.9 9 0
10/04 L 21-36 at Cincinnati 57,498 Davis 16 40 2.5 10 1
10/11 L 17-18 Chicago 75,799 Thomas 6 4 0.7 9 0
10/18 L 10-16 at Minnesota 52,480 Sherman 1 0 0.0 0 0
10/25 Pittsburgh Maclin 1 -2 -2.0 -2 0
11/01 Detroit TEAM 144 606 4.2 34t 5
11/15 at Denver OPPONENTS 162 577 3.6 23 4
11/22 at San Diego * RECEIVING No. Yds Avg Long TD
11/29 Buffalo Maclin 39 531 13.6 61 1
12/06 at Oakland Kelce 29 416 14.3 42t 2
12/13 San Diego Charles 21 177 8.4 26 1
12/20 at Baltimore Thomas 8 69 8.6 19t 1
12/27 Cleveland Conley 7 91 13.0 44 0
01/03 Oakland Avant 7 55 7.9 13 0
K.C. Opp. A. Wilson 6 82 13.7 42t 1
TOTAL FIRST DOWNS 118 126 O'Shaughnessy 5 85 17.0 30 0
Rushing 36 32 West 3 15 5.0 6 0
Passing 69 81 Davis 2 24 12.0 12 0
Penalty 13 13 D. Harris 2 15 7.5 9 0
3rd Down: Made/Att 20/72 31/82 Sherman 2 13 6.5 13 0
3rd Down Pct. 27.8 37.8 TEAM 131 1573 12.0 61 6
4th Down: Made/Att 2/4 1/5 OPPONENTS 136 1745 12.8 55t 14
4th Down Pct. 50.0 20.0 * INTERCEPTIONS No. Yds Avg Long TD
POSSESSION AVG. 30:10 29:51 Peters 3 55 18.3 55t 1
TOTAL NET YARDS 2046 2237 R. Parker 1 5 5.0 5 0
Avg. Per Game 341.0 372.8 TEAM 4 60 15.0 55t 1
Total Plays 378 402 OPPONENTS 3 44 14.7 20 0
Avg. Per Play 5.4 5.6 * PUNTING No. Yds Avg Net TB In Lg B
NET YARDS RUSHING 606 577 Colquitt 31 1461 47.1 42.5 3 14 62 0
Avg. Per Game 101.0 96.2 TEAM 31 1461 47.1 42.5 3 14 62 0
Total Rushes 144 162 OPPONENTS 31 1417 45.7 39.4 2 6 67 0
NET YARDS PASSING 1440 1660 * PUNT RETURNS Ret FC Yds Avg Long TD
Avg. Per Game 240.0 276.7 Thomas 19 1 155 8.2 19 0
Sacked/Yards Lost 24/133 13/85 TEAM 19 1 155 8.2 19 0
Gross Yards 1573 1745 OPPONENTS 14 6 85 6.1 13 0
Att./Completions 210/131 227/136 * KICKOFF RETURNS No. Yds Avg Long TD
Completion Pct. 62.4 59.9 Davis 10 251 25.1 54 0
Had Intercepted 3 4 Thomas 4 81 20.3 23 0
PUNTS/AVERAGE 31/47.1 31/45.7 Sherman 1 11 11.0 11 0
NET PUNTING AVG. 31/42.5 31/39.4 TEAM 15 343 22.9 54 0
PENALTIES/YARDS 36/313 48/396 OPPONENTS 8 189 23.6 36 0
FUMBLES/BALL LOST 9/5 6/2 * FIELD GOALS 1-19 20-29 30-39 40-49 50+
TOUCHDOWNS 13 19 Santos 0/ 0 3/ 4 3/ 3 4/ 4 2/4
Rushing 5 4 TEAM 0/ 0 3/ 4 3/ 3 4/ 4 2/4
Passing 6 14 OPPONENTS 0/ 0 1/ 1 2/ 2 5/ 6 1/1
Returns 2 1 Santos: (27G,48G,51N)(35G)()(22G,40G,51G,34G,
* SCORE BY PERIODS Q1 Q2 Q3 Q4 OT PTS 40G,29G,51G)(35G,27B,66N)(48G)
TEAM 24 53 13 37 0 127 OPP: (34G,47G)(54G)(44G)(44N)(44G,30G)(24G,45G,
OPPONENTS 40 34 31 54 0 159 45G)
* SCORING TD-Ru-Pa-Rt K-PAT FG S PTS
Santos 0 0 0 0 11/11 12/15 0 47
Charles 5 4 1 0 0 30
Kelce 2 0 2 0 0 14
Davis 1 1 0 0 0 6
Maclin 1 0 1 0 0 6
Peters 1 0 0 1 0 6
Thomas 1 0 1 0 0 6
A. Wilson 1 0 1 0 0 6
R. Wilson 1 0 0 1 0 6
TEAM 13 5 6 2 11/11 12/15 0 127
OPPONENTS 19 4 14 1 14/15 9/10 0 159
2-Pt Conv: Kelce, TM 1-2, OPP 2-4
SACKS: Bailey 4.5, Houston 4, Howard 1.5,
DeVito 1, Hali 1, Johnson 1, TM 13, OPP 24
FUM/LOST: Charles 3/2, A. Smith 2/0,
Thomas 2/1, Kelce 1/1, West 1/1
* PASSING Att Cmp Yds Cmp% Yds/Att TD TD% Int Int% Long Sack/Lost Rating
A. Smith 210 131 1573 62.4 7.49 6 2.9 3 1.4 61 23/ 130 88.8
Maclin 0 0 0 --- --- 0 --- 0 --- --- 1/ 3 ---
TEAM 210 131 1573 62.4 7.49 6 2.9 3 1.4 61 24/ 133 88.8
OPPONENTS 227 136 1745 59.9 7.69 14 6.2 4 1.8 55t 13/ 85 97.3
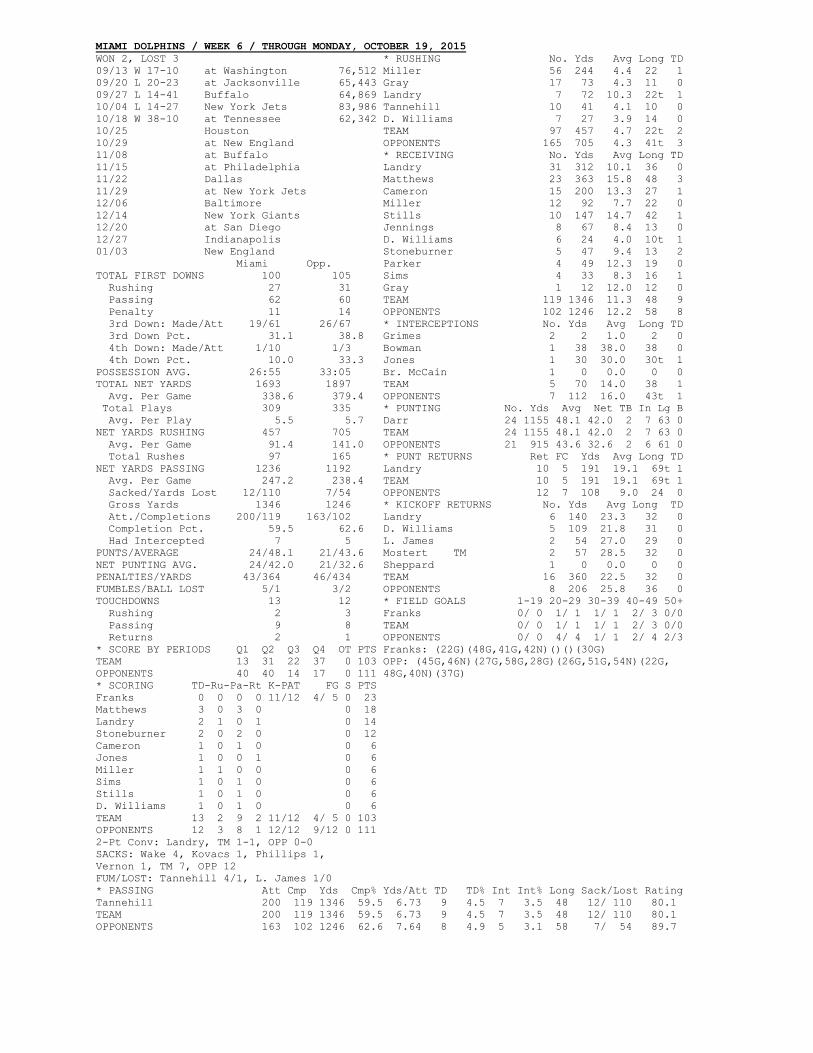
MIAMI DOLPHINS / WEEK 6 / THROUGH MONDAY, OCTOBER 19, 2015
WON 2, LOST 3 * RUSHING No. Yds Avg Long TD
09/13 W 17-10 at Washington 76,512 Miller 56 244 4.4 22 1
09/20 L 20-23 at Jacksonville 65,443 Gray 17 73 4.3 11 0
09/27 L 14-41 Buffalo 64,869 Landry 7 72 10.3 22t 1
10/04 L 14-27 New York Jets 83,986 Tannehill 10 41 4.1 10 0
10/18 W 38-10 at Tennessee 62,342 D. Williams 7 27 3.9 14 0
10/25 Houston TEAM 97 457 4.7 22t 2
10/29 at New England OPPONENTS 165 705 4.3 41t 3
11/08 at Buffalo * RECEIVING No. Yds Avg Long TD
11/15 at Philadelphia Landry 31 312 10.1 36 0
11/22 Dallas Matthews 23 363 15.8 48 3
11/29 at New York Jets Cameron 15 200 13.3 27 1
12/06 Baltimore Miller 12 92 7.7 22 0
12/14 New York Giants Stills 10 147 14.7 42 1
12/20 at San Diego Jennings 8 67 8.4 13 0
12/27 Indianapolis D. Williams 6 24 4.0 10t 1
01/03 New England Stoneburner 5 47 9.4 13 2
Miami Opp. Parker 4 49 12.3 19 0
TOTAL FIRST DOWNS 100 105 Sims 4 33 8.3 16 1
Rushing 27 31 Gray 1 12 12.0 12 0
Passing 62 60 TEAM 119 1346 11.3 48 9
Penalty 11 14 OPPONENTS 102 1246 12.2 58 8
3rd Down: Made/Att 19/61 26/67 * INTERCEPTIONS No. Yds Avg Long TD
3rd Down Pct. 31.1 38.8 Grimes 2 2 1.0 2 0
4th Down: Made/Att 1/10 1/3 Bowman 1 38 38.0 38 0
4th Down Pct. 10.0 33.3 Jones 1 30 30.0 30t 1
POSSESSION AVG. 26:55 33:05 Br. McCain 1 0 0.0 0 0
TOTAL NET YARDS 1693 1897 TEAM 5 70 14.0 38 1
Avg. Per Game 338.6 379.4 OPPONENTS 7 112 16.0 43t 1
Total Plays 309 335 * PUNTING No. Yds Avg Net TB In Lg B
Avg. Per Play 5.5 5.7 Darr 24 1155 48.1 42.0 2 7 63 0
NET YARDS RUSHING 457 705 TEAM 24 1155 48.1 42.0 2 7 63 0
Avg. Per Game 91.4 141.0 OPPONENTS 21 915 43.6 32.6 2 6 61 0
Total Rushes 97 165 * PUNT RETURNS Ret FC Yds Avg Long TD
NET YARDS PASSING 1236 1192 Landry 10 5 191 19.1 69t 1
Avg. Per Game 247.2 238.4 TEAM 10 5 191 19.1 69t 1
Sacked/Yards Lost 12/110 7/54 OPPONENTS 12 7 108 9.0 24 0
Gross Yards 1346 1246 * KICKOFF RETURNS No. Yds Avg Long TD
Att./Completions 200/119 163/102 Landry 6 140 23.3 32 0
Completion Pct. 59.5 62.6 D. Williams 5 109 21.8 31 0
Had Intercepted 7 5 L. James 2 54 27.0 29 0
PUNTS/AVERAGE 24/48.1 21/43.6 Mostert TM 2 57 28.5 32 0
NET PUNTING AVG. 24/42.0 21/32.6 Sheppard 1 0 0.0 0 0
PENALTIES/YARDS 43/364 46/434 TEAM 16 360 22.5 32 0
FUMBLES/BALL LOST 5/1 3/2 OPPONENTS 8 206 25.8 36 0
TOUCHDOWNS 13 12 * FIELD GOALS 1-19 20-29 30-39 40-49 50+
Rushing 2 3 Franks 0/ 0 1/ 1 1/ 1 2/ 3 0/0
Passing 9 8 TEAM 0/ 0 1/ 1 1/ 1 2/ 3 0/0
Returns 2 1 OPPONENTS 0/ 0 4/ 4 1/ 1 2/ 4 2/3
* SCORE BY PERIODS Q1 Q2 Q3 Q4 OT PTS Franks: (22G)(48G,41G,42N)()()(30G)
TEAM 13 31 22 37 0 103 OPP: (45G,46N)(27G,58G,28G)(26G,51G,54N)(22G,
OPPONENTS 40 40 14 17 0 111 48G,40N)(37G)
* SCORING TD-Ru-Pa-Rt K-PAT FG S PTS
Franks 0 0 0 0 11/12 4/ 5 0 23
Matthews 3 0 3 0 0 18
Landry 2 1 0 1 0 14
Stoneburner 2 0 2 0 0 12
Cameron 1 0 1 0 0 6
Jones 1 0 0 1 0 6
Miller 1 1 0 0 0 6
Sims 1 0 1 0 0 6
Stills 1 0 1 0 0 6
D. Williams 1 0 1 0 0 6
TEAM 13 2 9 2 11/12 4/ 5 0 103
OPPONENTS 12 3 8 1 12/12 9/12 0 111
2-Pt Conv: Landry, TM 1-1, OPP 0-0
SACKS: Wake 4, Kovacs 1, Phillips 1,
Vernon 1, TM 7, OPP 12
FUM/LOST: Tannehill 4/1, L. James 1/0
* PASSING Att Cmp Yds Cmp% Yds/Att TD TD% Int Int% Long Sack/Lost Rating
Tannehill 200 119 1346 59.5 6.73 9 4.5 7 3.5 48 12/ 110 80.1
TEAM 200 119 1346 59.5 6.73 9 4.5 7 3.5 48 12/ 110 80.1
OPPONENTS 163 102 1246 62.6 7.64 8 4.9 5 3.1 58 7/ 54 89.7
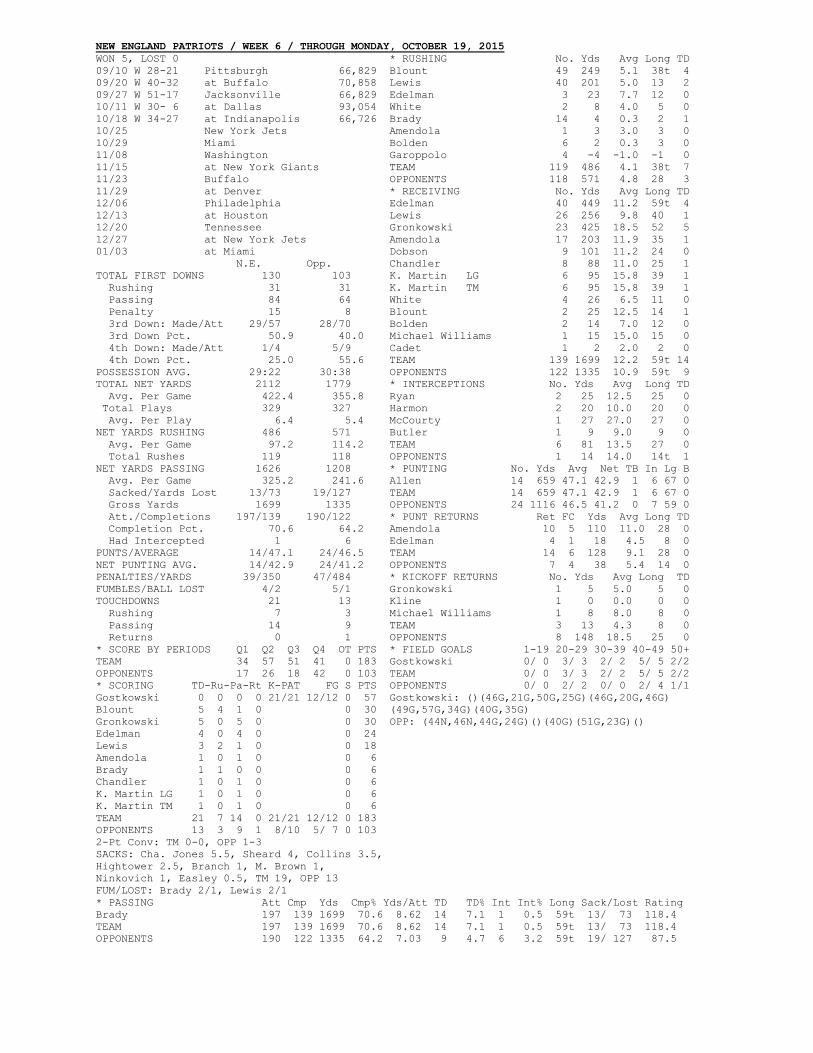
NEW ENGLAND PATRIOTS / WEEK 6 / THROUGH MONDAY, OCTOBER 19, 2015
WON 5, LOST 0 * RUSHING No. Yds Avg Long TD
09/10 W 28-21 Pittsburgh 66,829 Blount 49 249 5.1 38t 4
09/20 W 40-32 at Buffalo 70,858 Lewis 40 201 5.0 13 2
09/27 W 51-17 Jacksonville 66,829 Edelman 3 23 7.7 12 0
10/11 W 30- 6 at Dallas 93,054 White 2 8 4.0 5 0
10/18 W 34-27 at Indianapolis 66,726 Brady 14 4 0.3 2 1
10/25 New York Jets Amendola 1 3 3.0 3 0
10/29 Miami Bolden 6 2 0.3 3 0
11/08 Washington Garoppolo 4 -4 -1.0 -1 0
11/15 at New York Giants TEAM 119 486 4.1 38t 7
11/23 Buffalo OPPONENTS 118 571 4.8 28 3
11/29 at Denver * RECEIVING No. Yds Avg Long TD
12/06 Philadelphia Edelman 40 449 11.2 59t 4
12/13 at Houston Lewis 26 256 9.8 40 1
12/20 Tennessee Gronkowski 23 425 18.5 52 5
12/27 at New York Jets Amendola 17 203 11.9 35 1
01/03 at Miami Dobson 9 101 11.2 24 0
N.E. Opp. Chandler 8 88 11.0 25 1
TOTAL FIRST DOWNS 130 103 K. Martin LG 6 95 15.8 39 1
Rushing 31 31 K. Martin TM 6 95 15.8 39 1
Passing 84 64 White 4 26 6.5 11 0
Penalty 15 8 Blount 2 25 12.5 14 1
3rd Down: Made/Att 29/57 28/70 Bolden 2 14 7.0 12 0
3rd Down Pct. 50.9 40.0 Michael Williams 1 15 15.0 15 0
4th Down: Made/Att 1/4 5/9 Cadet 1 2 2.0 2 0
4th Down Pct. 25.0 55.6 TEAM 139 1699 12.2 59t 14
POSSESSION AVG. 29:22 30:38 OPPONENTS 122 1335 10.9 59t 9
TOTAL NET YARDS 2112 1779 * INTERCEPTIONS No. Yds Avg Long TD
Avg. Per Game 422.4 355.8 Ryan 2 25 12.5 25 0
Total Plays 329 327 Harmon 2 20 10.0 20 0
Avg. Per Play 6.4 5.4 McCourty 1 27 27.0 27 0
NET YARDS RUSHING 486 571 Butler 1 9 9.0 9 0
Avg. Per Game 97.2 114.2 TEAM 6 81 13.5 27 0
Total Rushes 119 118 OPPONENTS 1 14 14.0 14t 1
NET YARDS PASSING 1626 1208 * PUNTING No. Yds Avg Net TB In Lg B
Avg. Per Game 325.2 241.6 Allen 14 659 47.1 42.9 1 6 67 0
Sacked/Yards Lost 13/73 19/127 TEAM 14 659 47.1 42.9 1 6 67 0
Gross Yards 1699 1335 OPPONENTS 24 1116 46.5 41.2 0 7 59 0
Att./Completions 197/139 190/122 * PUNT RETURNS Ret FC Yds Avg Long TD
Completion Pct. 70.6 64.2 Amendola 10 5 110 11.0 28 0
Had Intercepted 1 6 Edelman 4 1 18 4.5 8 0
PUNTS/AVERAGE 14/47.1 24/46.5 TEAM 14 6 128 9.1 28 0
NET PUNTING AVG. 14/42.9 24/41.2 OPPONENTS 7 4 38 5.4 14 0
PENALTIES/YARDS 39/350 47/484 * KICKOFF RETURNS No. Yds Avg Long TD
FUMBLES/BALL LOST 4/2 5/1 Gronkowski 1 5 5.0 5 0
TOUCHDOWNS 21 13 Kline 1 0 0.0 0 0
Rushing 7 3 Michael Williams 1 8 8.0 8 0
Passing 14 9 TEAM 3 13 4.3 8 0
Returns 0 1 OPPONENTS 8 148 18.5 25 0
* SCORE BY PERIODS Q1 Q2 Q3 Q4 OT PTS * FIELD GOALS 1-19 20-29 30-39 40-49 50+
TEAM 34 57 51 41 0 183 Gostkowski 0/ 0 3/ 3 2/ 2 5/ 5 2/2
OPPONENTS 17 26 18 42 0 103 TEAM 0/ 0 3/ 3 2/ 2 5/ 5 2/2
* SCORING TD-Ru-Pa-Rt K-PAT FG S PTS OPPONENTS 0/ 0 2/ 2 0/ 0 2/ 4 1/1
Gostkowski 0 0 0 0 21/21 12/12 0 57 Gostkowski: ()(46G,21G,50G,25G)(46G,20G,46G)
Blount 5 4 1 0 0 30 (49G,57G,34G)(40G,35G)
Gronkowski 5 0 5 0 0 30 OPP: (44N,46N,44G,24G)()(40G)(51G,23G)()
Edelman 4 0 4 0 0 24
Lewis 3 2 1 0 0 18
Amendola 1 0 1 0 0 6
Brady 1 1 0 0 0 6
Chandler 1 0 1 0 0 6
K. Martin LG 1 0 1 0 0 6
K. Martin TM 1 0 1 0 0 6
TEAM 21 7 14 0 21/21 12/12 0 183
OPPONENTS 13 3 9 1 8/10 5/ 7 0 103
2-Pt Conv: TM 0-0, OPP 1-3
SACKS: Cha. Jones 5.5, Sheard 4, Collins 3.5,
Hightower 2.5, Branch 1, M. Brown 1,
Ninkovich 1, Easley 0.5, TM 19, OPP 13
FUM/LOST: Brady 2/1, Lewis 2/1
* PASSING Att Cmp Yds Cmp% Yds/Att TD TD% Int Int% Long Sack/Lost Rating
Brady 197 139 1699 70.6 8.62 14 7.1 1 0.5 59t 13/ 73 118.4
TEAM 197 139 1699 70.6 8.62 14 7.1 1 0.5 59t 13/ 73 118.4
OPPONENTS 190 122 1335 64.2 7.03 9 4.7 6 3.2 59t 19/ 127 87.5
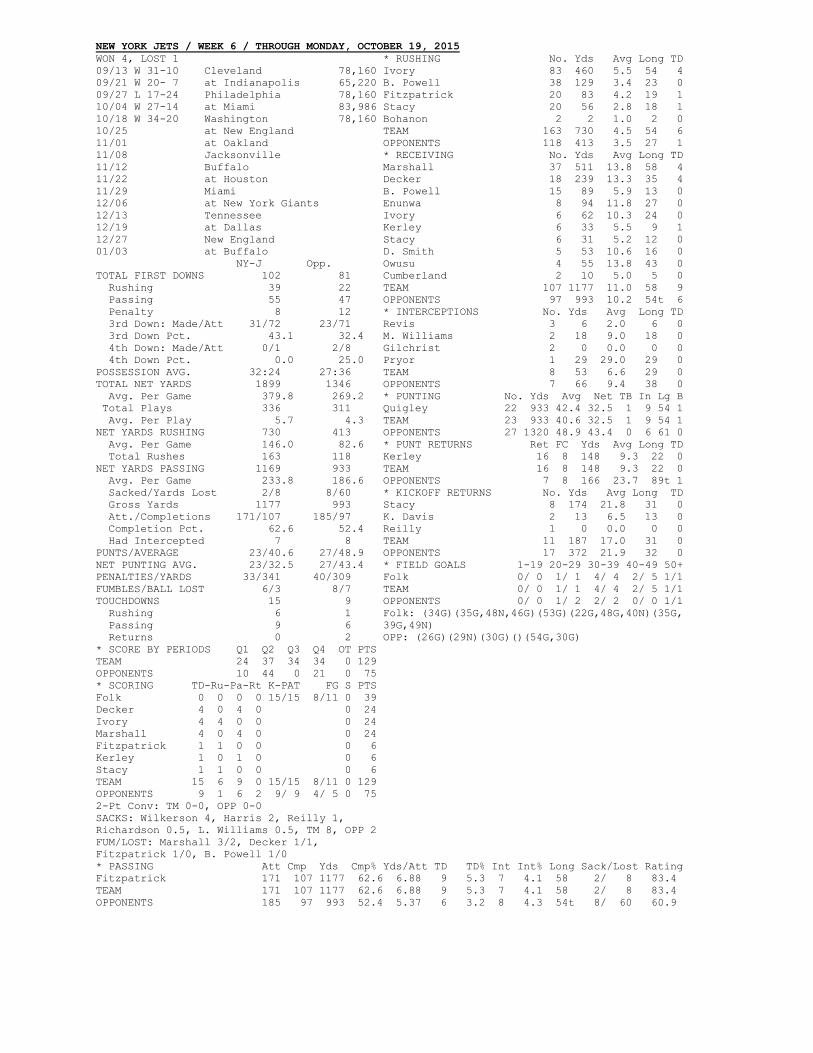
NEW YORK JETS / WEEK 6 / THROUGH MONDAY, OCTOBER 19, 2015
WON 4, LOST 1 * RUSHING No. Yds Avg Long TD
09/13 W 31-10 Cleveland 78,160 Ivory 83 460 5.5 54 4
09/21 W 20- 7 at Indianapolis 65,220 B. Powell 38 129 3.4 23 0
09/27 L 17-24 Philadelphia 78,160 Fitzpatrick 20 83 4.2 19 1
10/04 W 27-14 at Miami 83,986 Stacy 20 56 2.8 18 1
10/18 W 34-20 Washington 78,160 Bohanon 2 2 1.0 2 0
10/25 at New England TEAM 163 730 4.5 54 6
11/01 at Oakland OPPONENTS 118 413 3.5 27 1
11/08 Jacksonville * RECEIVING No. Yds Avg Long TD
11/12 Buffalo Marshall 37 511 13.8 58 4
11/22 at Houston Decker 18 239 13.3 35 4
11/29 Miami B. Powell 15 89 5.9 13 0
12/06 at New York Giants Enunwa 8 94 11.8 27 0
12/13 Tennessee Ivory 6 62 10.3 24 0
12/19 at Dallas Kerley 6 33 5.5 9 1
12/27 New England Stacy 6 31 5.2 12 0
01/03 at Buffalo D. Smith 5 53 10.6 16 0
NY-J Opp. Owusu 4 55 13.8 43 0
TOTAL FIRST DOWNS 102 81 Cumberland 2 10 5.0 5 0
Rushing 39 22 TEAM 107 1177 11.0 58 9
Passing 55 47 OPPONENTS 97 993 10.2 54t 6
Penalty 8 12 * INTERCEPTIONS No. Yds Avg Long TD
3rd Down: Made/Att 31/72 23/71 Revis 3 6 2.0 6 0
3rd Down Pct. 43.1 32.4 M. Williams 2 18 9.0 18 0
4th Down: Made/Att 0/1 2/8 Gilchrist 2 0 0.0 0 0
4th Down Pct. 0.0 25.0 Pryor 1 29 29.0 29 0
POSSESSION AVG. 32:24 27:36 TEAM 8 53 6.6 29 0
TOTAL NET YARDS 1899 1346 OPPONENTS 7 66 9.4 38 0
Avg. Per Game 379.8 269.2 * PUNTING No. Yds Avg Net TB In Lg B
Total Plays 336 311 Quigley 22 933 42.4 32.5 1 9 54 1
Avg. Per Play 5.7 4.3 TEAM 23 933 40.6 32.5 1 9 54 1
NET YARDS RUSHING 730 413 OPPONENTS 27 1320 48.9 43.4 0 6 61 0
Avg. Per Game 146.0 82.6 * PUNT RETURNS Ret FC Yds Avg Long TD
Total Rushes 163 118 Kerley 16 8 148 9.3 22 0
NET YARDS PASSING 1169 933 TEAM 16 8 148 9.3 22 0
Avg. Per Game 233.8 186.6 OPPONENTS 7 8 166 23.7 89t 1
Sacked/Yards Lost 2/8 8/60 * KICKOFF RETURNS No. Yds Avg Long TD
Gross Yards 1177 993 Stacy 8 174 21.8 31 0
Att./Completions 171/107 185/97 K. Davis 2 13 6.5 13 0
Completion Pct. 62.6 52.4 Reilly 1 0 0.0 0 0
Had Intercepted 7 8 TEAM 11 187 17.0 31 0
PUNTS/AVERAGE 23/40.6 27/48.9 OPPONENTS 17 372 21.9 32 0
NET PUNTING AVG. 23/32.5 27/43.4 * FIELD GOALS 1-19 20-29 30-39 40-49 50+
PENALTIES/YARDS 33/341 40/309 Folk 0/ 0 1/ 1 4/ 4 2/ 5 1/1
FUMBLES/BALL LOST 6/3 8/7 TEAM 0/ 0 1/ 1 4/ 4 2/ 5 1/1
TOUCHDOWNS 15 9 OPPONENTS 0/ 0 1/ 2 2/ 2 0/ 0 1/1
Rushing 6 1 Folk: (34G)(35G,48N,46G)(53G)(22G,48G,40N)(35G,
Passing 9 6 39G,49N)
Returns 0 2 OPP: (26G)(29N)(30G)()(54G,30G)
* SCORE BY PERIODS Q1 Q2 Q3 Q4 OT PTS
TEAM 24 37 34 34 0 129
OPPONENTS 10 44 0 21 0 75
* SCORING TD-Ru-Pa-Rt K-PAT FG S PTS
Folk 0 0 0 0 15/15 8/11 0 39
Decker 4 0 4 0 0 24
Ivory 4 4 0 0 0 24
Marshall 4 0 4 0 0 24
Fitzpatrick 1 1 0 0 0 6
Kerley 1 0 1 0 0 6
Stacy 1 1 0 0 0 6
TEAM 15 6 9 0 15/15 8/11 0 129
OPPONENTS 9 1 6 2 9/ 9 4/ 5 0 75
2-Pt Conv: TM 0-0, OPP 0-0
SACKS: Wilkerson 4, Harris 2, Reilly 1,
Richardson 0.5, L. Williams 0.5, TM 8, OPP 2
FUM/LOST: Marshall 3/2, Decker 1/1,
Fitzpatrick 1/0, B. Powell 1/0
* PASSING Att Cmp Yds Cmp% Yds/Att TD TD% Int Int% Long Sack/Lost Rating
Fitzpatrick 171 107 1177 62.6 6.88 9 5.3 7 4.1 58 2/ 8 83.4
TEAM 171 107 1177 62.6 6.88 9 5.3 7 4.1 58 2/ 8 83.4
OPPONENTS 185 97 993 52.4 5.37 6 3.2 8 4.3 54t 8/ 60 60.9
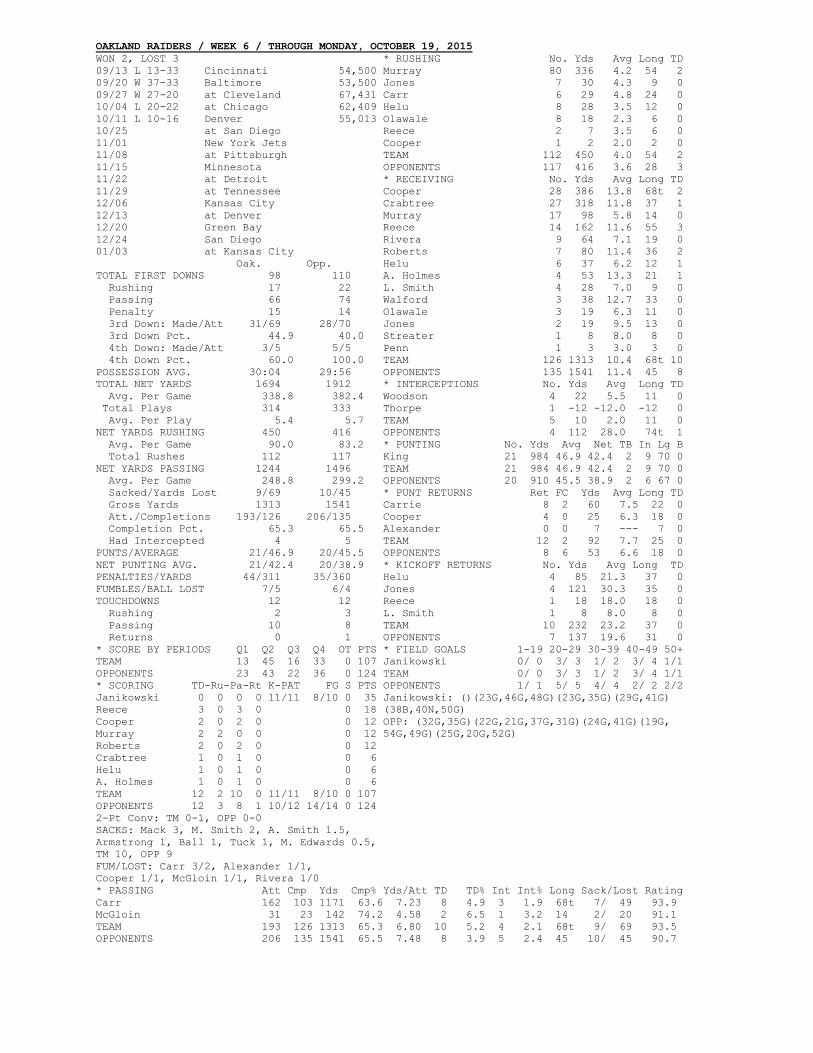
OAKLAND RAIDERS / WEEK 6 / THROUGH MONDAY, OCTOBER 19, 2015
WON 2, LOST 3 * RUSHING No. Yds Avg Long TD
09/13 L 13-33 Cincinnati 54,500 Murray 80 336 4.2 54 2
09/20 W 37-33 Baltimore 53,500 Jones 7 30 4.3 9 0
09/27 W 27-20 at Cleveland 67,431 Carr 6 29 4.8 24 0
10/04 L 20-22 at Chicago 62,409 Helu 8 28 3.5 12 0
10/11 L 10-16 Denver 55,013 Olawale 8 18 2.3 6 0
10/25 at San Diego Reece 2 7 3.5 6 0
11/01 New York Jets Cooper 1 2 2.0 2 0
11/08 at Pittsburgh TEAM 112 450 4.0 54 2
11/15 Minnesota OPPONENTS 117 416 3.6 28 3
11/22 at Detroit * RECEIVING No. Yds Avg Long TD
11/29 at Tennessee Cooper 28 386 13.8 68t 2
12/06 Kansas City Crabtree 27 318 11.8 37 1
12/13 at Denver Murray 17 98 5.8 14 0
12/20 Green Bay Reece 14 162 11.6 55 3
12/24 San Diego Rivera 9 64 7.1 19 0
01/03 at Kansas City Roberts 7 80 11.4 36 2
Oak. Opp. Helu 6 37 6.2 12 1
TOTAL FIRST DOWNS 98 110 A. Holmes 4 53 13.3 21 1
Rushing 17 22 L. Smith 4 28 7.0 9 0
Passing 66 74 Walford 3 38 12.7 33 0
Penalty 15 14 Olawale 3 19 6.3 11 0
3rd Down: Made/Att 31/69 28/70 Jones 2 19 9.5 13 0
3rd Down Pct. 44.9 40.0 Streater 1 8 8.0 8 0
4th Down: Made/Att 3/5 5/5 Penn 1 3 3.0 3 0
4th Down Pct. 60.0 100.0 TEAM 126 1313 10.4 68t 10
POSSESSION AVG. 30:04 29:56 OPPONENTS 135 1541 11.4 45 8
TOTAL NET YARDS 1694 1912 * INTERCEPTIONS No. Yds Avg Long TD
Avg. Per Game 338.8 382.4 Woodson 4 22 5.5 11 0
Total Plays 314 333 Thorpe 1 -12 -12.0 -12 0
Avg. Per Play 5.4 5.7 TEAM 5 10 2.0 11 0
NET YARDS RUSHING 450 416 OPPONENTS 4 112 28.0 74t 1
Avg. Per Game 90.0 83.2 * PUNTING No. Yds Avg Net TB In Lg B
Total Rushes 112 117 King 21 984 46.9 42.4 2 9 70 0
NET YARDS PASSING 1244 1496 TEAM 21 984 46.9 42.4 2 9 70 0
Avg. Per Game 248.8 299.2 OPPONENTS 20 910 45.5 38.9 2 6 67 0
Sacked/Yards Lost 9/69 10/45 * PUNT RETURNS Ret FC Yds Avg Long TD
Gross Yards 1313 1541 Carrie 8 2 60 7.5 22 0
Att./Completions 193/126 206/135 Cooper 4 0 25 6.3 18 0
Completion Pct. 65.3 65.5 Alexander 0 0 7 --- 7 0
Had Intercepted 4 5 TEAM 12 2 92 7.7 25 0
PUNTS/AVERAGE 21/46.9 20/45.5 OPPONENTS 8 6 53 6.6 18 0
NET PUNTING AVG. 21/42.4 20/38.9 * KICKOFF RETURNS No. Yds Avg Long TD
PENALTIES/YARDS 44/311 35/360 Helu 4 85 21.3 37 0
FUMBLES/BALL LOST 7/5 6/4 Jones 4 121 30.3 35 0
TOUCHDOWNS 12 12 Reece 1 18 18.0 18 0
Rushing 2 3 L. Smith 1 8 8.0 8 0
Passing 10 8 TEAM 10 232 23.2 37 0
Returns 0 1 OPPONENTS 7 137 19.6 31 0
* SCORE BY PERIODS Q1 Q2 Q3 Q4 OT PTS * FIELD GOALS 1-19 20-29 30-39 40-49 50+
TEAM 13 45 16 33 0 107 Janikowski 0/ 0 3/ 3 1/ 2 3/ 4 1/1
OPPONENTS 23 43 22 36 0 124 TEAM 0/ 0 3/ 3 1/ 2 3/ 4 1/1
* SCORING TD-Ru-Pa-Rt K-PAT FG S PTS OPPONENTS 1/ 1 5/ 5 4/ 4 2/ 2 2/2
Janikowski 0 0 0 0 11/11 8/10 0 35 Janikowski: ()(23G,46G,48G)(23G,35G)(29G,41G)
Reece 3 0 3 0 0 18 (38B,40N,50G)
Cooper 2 0 2 0 0 12 OPP: (32G,35G)(22G,21G,37G,31G)(24G,41G)(19G,
Murray 2 2 0 0 0 12 54G,49G)(25G,20G,52G)
Roberts 2 0 2 0 0 12
Crabtree 1 0 1 0 0 6
Helu 1 0 1 0 0 6
A. Holmes 1 0 1 0 0 6
TEAM 12 2 10 0 11/11 8/10 0 107
OPPONENTS 12 3 8 1 10/12 14/14 0 124
2-Pt Conv: TM 0-1, OPP 0-0
SACKS: Mack 3, M. Smith 2, A. Smith 1.5,
Armstrong 1, Ball 1, Tuck 1, M. Edwards 0.5,
TM 10, OPP 9
FUM/LOST: Carr 3/2, Alexander 1/1,
Cooper 1/1, McGloin 1/1, Rivera 1/0
* PASSING Att Cmp Yds Cmp% Yds/Att TD TD% Int Int% Long Sack/Lost Rating
Carr 162 103 1171 63.6 7.23 8 4.9 3 1.9 68t 7/ 49 93.9
McGloin 31 23 142 74.2 4.58 2 6.5 1 3.2 14 2/ 20 91.1
TEAM 193 126 1313 65.3 6.80 10 5.2 4 2.1 68t 9/ 69 93.5
OPPONENTS 206 135 1541 65.5 7.48 8 3.9 5 2.4 45 10/ 45 90.7
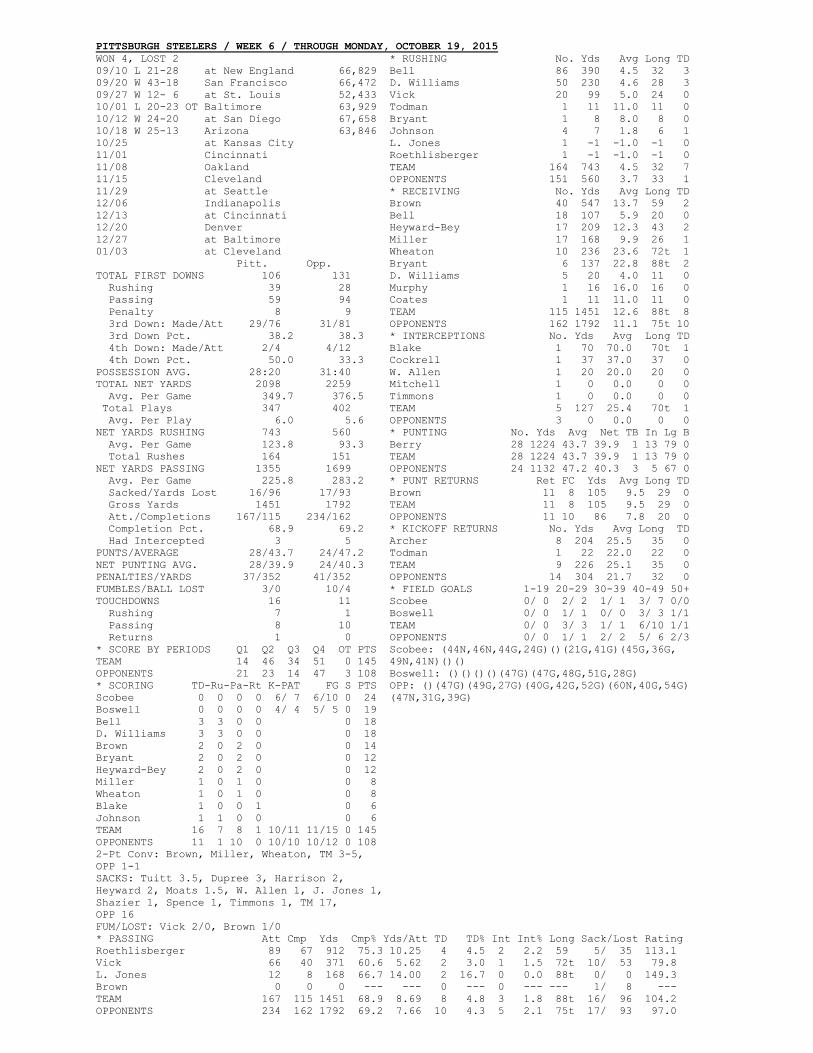
PITTSBURGH STEELERS / WEEK 6 / THROUGH MONDAY, OCTOBER 19, 2015
WON 4, LOST 2 * RUSHING No. Yds Avg Long TD
09/10 L 21-28 at New England 66,829 Bell 86 390 4.5 32 3
09/20 W 43-18 San Francisco 66,472 D. Williams 50 230 4.6 28 3
09/27 W 12- 6 at St. Louis 52,433 Vick 20 99 5.0 24 0
10/01 L 20-23 OT Baltimore 63,929 Todman 1 11 11.0 11 0
10/12 W 24-20 at San Diego 67,658 Bryant 1 8 8.0 8 0
10/18 W 25-13 Arizona 63,846 Johnson 4 7 1.8 6 1
10/25 at Kansas City L. Jones 1 -1 -1.0 -1 0
11/01 Cincinnati Roethlisberger 1 -1 -1.0 -1 0
11/08 Oakland TEAM 164 743 4.5 32 7
11/15 Cleveland OPPONENTS 151 560 3.7 33 1
11/29 at Seattle * RECEIVING No. Yds Avg Long TD
12/06 Indianapolis Brown 40 547 13.7 59 2
12/13 at Cincinnati Bell 18 107 5.9 20 0
12/20 Denver Heyward-Bey 17 209 12.3 43 2
12/27 at Baltimore Miller 17 168 9.9 26 1
01/03 at Cleveland Wheaton 10 236 23.6 72t 1
Pitt. Opp. Bryant 6 137 22.8 88t 2
TOTAL FIRST DOWNS 106 131 D. Williams 5 20 4.0 11 0
Rushing 39 28 Murphy 1 16 16.0 16 0
Passing 59 94 Coates 1 11 11.0 11 0
Penalty 8 9 TEAM 115 1451 12.6 88t 8
3rd Down: Made/Att 29/76 31/81 OPPONENTS 162 1792 11.1 75t 10
3rd Down Pct. 38.2 38.3 * INTERCEPTIONS No. Yds Avg Long TD
4th Down: Made/Att 2/4 4/12 Blake 1 70 70.0 70t 1
4th Down Pct. 50.0 33.3 Cockrell 1 37 37.0 37 0
POSSESSION AVG. 28:20 31:40 W. Allen 1 20 20.0 20 0
TOTAL NET YARDS 2098 2259 Mitchell 1 0 0.0 0 0
Avg. Per Game 349.7 376.5 Timmons 1 0 0.0 0 0
Total Plays 347 402 TEAM 5 127 25.4 70t 1
Avg. Per Play 6.0 5.6 OPPONENTS 3 0 0.0 0 0
NET YARDS RUSHING 743 560 * PUNTING No. Yds Avg Net TB In Lg B
Avg. Per Game 123.8 93.3 Berry 28 1224 43.7 39.9 1 13 79 0
Total Rushes 164 151 TEAM 28 1224 43.7 39.9 1 13 79 0
NET YARDS PASSING 1355 1699 OPPONENTS 24 1132 47.2 40.3 3 5 67 0
Avg. Per Game 225.8 283.2 * PUNT RETURNS Ret FC Yds Avg Long TD
Sacked/Yards Lost 16/96 17/93 Brown 11 8 105 9.5 29 0
Gross Yards 1451 1792 TEAM 11 8 105 9.5 29 0
Att./Completions 167/115 234/162 OPPONENTS 11 10 86 7.8 20 0
Completion Pct. 68.9 69.2 * KICKOFF RETURNS No. Yds Avg Long TD
Had Intercepted 3 5 Archer 8 204 25.5 35 0
PUNTS/AVERAGE 28/43.7 24/47.2 Todman 1 22 22.0 22 0
NET PUNTING AVG. 28/39.9 24/40.3 TEAM 9 226 25.1 35 0
PENALTIES/YARDS 37/352 41/352 OPPONENTS 14 304 21.7 32 0
FUMBLES/BALL LOST 3/0 10/4 * FIELD GOALS 1-19 20-29 30-39 40-49 50+
TOUCHDOWNS 16 11 Scobee 0/ 0 2/ 2 1/ 1 3/ 7 0/0
Rushing 7 1 Boswell 0/ 0 1/ 1 0/ 0 3/ 3 1/1
Passing 8 10 TEAM 0/ 0 3/ 3 1/ 1 6/10 1/1
Returns 1 0 OPPONENTS 0/ 0 1/ 1 2/ 2 5/ 6 2/3
* SCORE BY PERIODS Q1 Q2 Q3 Q4 OT PTS Scobee: (44N,46N,44G,24G)()(21G,41G)(45G,36G,
TEAM 14 46 34 51 0 145 49N,41N)()()
OPPONENTS 21 23 14 47 3 108 Boswell: ()()()()(47G)(47G,48G,51G,28G)
* SCORING TD-Ru-Pa-Rt K-PAT FG S PTS OPP: ()(47G)(49G,27G)(40G,42G,52G)(60N,40G,54G)
Scobee 0 0 0 0 6/ 7 6/10 0 24 (47N,31G,39G)
Boswell 0 0 0 0 4/ 4 5/ 5 0 19
Bell 3 3 0 0 0 18
D. Williams 3 3 0 0 0 18
Brown 2 0 2 0 0 14
Bryant 2 0 2 0 0 12
Heyward-Bey 2 0 2 0 0 12
Miller 1 0 1 0 0 8
Wheaton 1 0 1 0 0 8
Blake 1 0 0 1 0 6
Johnson 1 1 0 0 0 6
TEAM 16 7 8 1 10/11 11/15 0 145
OPPONENTS 11 1 10 0 10/10 10/12 0 108
2-Pt Conv: Brown, Miller, Wheaton, TM 3-5,
OPP 1-1
SACKS: Tuitt 3.5, Dupree 3, Harrison 2,
Heyward 2, Moats 1.5, W. Allen 1, J. Jones 1,
Shazier 1, Spence 1, Timmons 1, TM 17,
OPP 16
FUM/LOST: Vick 2/0, Brown 1/0
* PASSING Att Cmp Yds Cmp% Yds/Att TD TD% Int Int% Long Sack/Lost Rating
Roethlisberger 89 67 912 75.3 10.25 4 4.5 2 2.2 59 5/ 35 113.1
Vick 66 40 371 60.6 5.62 2 3.0 1 1.5 72t 10/ 53 79.8
L. Jones 12 8 168 66.7 14.00 2 16.7 0 0.0 88t 0/ 0 149.3
Brown 0 0 0 --- --- 0 --- 0 --- --- 1/ 8 ---
TEAM 167 115 1451 68.9 8.69 8 4.8 3 1.8 88t 16/ 96 104.2
OPPONENTS 234 162 1792 69.2 7.66 10 4.3 5 2.1 75t 17/ 93 97.0
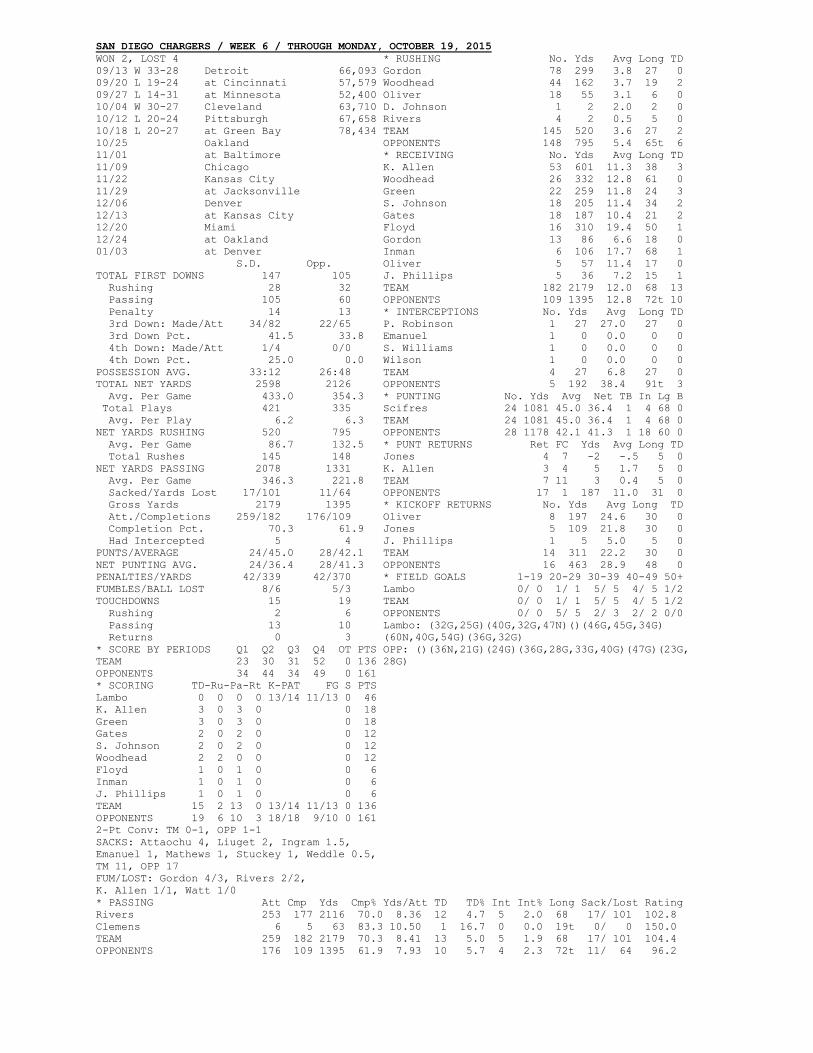
SAN DIEGO CHARGERS / WEEK 6 / THROUGH MONDAY, OCTOBER 19, 2015
WON 2, LOST 4 * RUSHING No. Yds Avg Long TD
09/13 W 33-28 Detroit 66,093 Gordon 78 299 3.8 27 0
09/20 L 19-24 at Cincinnati 57,579 Woodhead 44 162 3.7 19 2
09/27 L 14-31 at Minnesota 52,400 Oliver 18 55 3.1 6 0
10/04 W 30-27 Cleveland 63,710 D. Johnson 1 2 2.0 2 0
10/12 L 20-24 Pittsburgh 67,658 Rivers 4 2 0.5 5 0
10/18 L 20-27 at Green Bay 78,434 TEAM 145 520 3.6 27 2
10/25 Oakland OPPONENTS 148 795 5.4 65t 6
11/01 at Baltimore * RECEIVING No. Yds Avg Long TD
11/09 Chicago K. Allen 53 601 11.3 38 3
11/22 Kansas City Woodhead 26 332 12.8 61 0
11/29 at Jacksonville Green 22 259 11.8 24 3
12/06 Denver S. Johnson 18 205 11.4 34 2
12/13 at Kansas City Gates 18 187 10.4 21 2
12/20 Miami Floyd 16 310 19.4 50 1
12/24 at Oakland Gordon 13 86 6.6 18 0
01/03 at Denver Inman 6 106 17.7 68 1
S.D. Opp. Oliver 5 57 11.4 17 0
TOTAL FIRST DOWNS 147 105 J. Phillips 5 36 7.2 15 1
Rushing 28 32 TEAM 182 2179 12.0 68 13
Passing 105 60 OPPONENTS 109 1395 12.8 72t 10
Penalty 14 13 * INTERCEPTIONS No. Yds Avg Long TD
3rd Down: Made/Att 34/82 22/65 P. Robinson 1 27 27.0 27 0
3rd Down Pct. 41.5 33.8 Emanuel 1 0 0.0 0 0
4th Down: Made/Att 1/4 0/0 S. Williams 1 0 0.0 0 0
4th Down Pct. 25.0 0.0 Wilson 1 0 0.0 0 0
POSSESSION AVG. 33:12 26:48 TEAM 4 27 6.8 27 0
TOTAL NET YARDS 2598 2126 OPPONENTS 5 192 38.4 91t 3
Avg. Per Game 433.0 354.3 * PUNTING No. Yds Avg Net TB In Lg B
Total Plays 421 335 Scifres 24 1081 45.0 36.4 1 4 68 0
Avg. Per Play 6.2 6.3 TEAM 24 1081 45.0 36.4 1 4 68 0
NET YARDS RUSHING 520 795 OPPONENTS 28 1178 42.1 41.3 1 18 60 0
Avg. Per Game 86.7 132.5 * PUNT RETURNS Ret FC Yds Avg Long TD
Total Rushes 145 148 Jones 4 7 -2 -.5 5 0
NET YARDS PASSING 2078 1331 K. Allen 3 4 5 1.7 5 0
Avg. Per Game 346.3 221.8 TEAM 7 11 3 0.4 5 0
Sacked/Yards Lost 17/101 11/64 OPPONENTS 17 1 187 11.0 31 0
Gross Yards 2179 1395 * KICKOFF RETURNS No. Yds Avg Long TD
Att./Completions 259/182 176/109 Oliver 8 197 24.6 30 0
Completion Pct. 70.3 61.9 Jones 5 109 21.8 30 0
Had Intercepted 5 4 J. Phillips 1 5 5.0 5 0
PUNTS/AVERAGE 24/45.0 28/42.1 TEAM 14 311 22.2 30 0
NET PUNTING AVG. 24/36.4 28/41.3 OPPONENTS 16 463 28.9 48 0
PENALTIES/YARDS 42/339 42/370 * FIELD GOALS 1-19 20-29 30-39 40-49 50+
FUMBLES/BALL LOST 8/6 5/3 Lambo 0/ 0 1/ 1 5/ 5 4/ 5 1/2
TOUCHDOWNS 15 19 TEAM 0/ 0 1/ 1 5/ 5 4/ 5 1/2
Rushing 2 6 OPPONENTS 0/ 0 5/ 5 2/ 3 2/ 2 0/0
Passing 13 10 Lambo: (32G,25G)(40G,32G,47N)()(46G,45G,34G)
Returns 0 3 (60N,40G,54G)(36G,32G)
* SCORE BY PERIODS Q1 Q2 Q3 Q4 OT PTS OPP: ()(36N,21G)(24G)(36G,28G,33G,40G)(47G)(23G,
TEAM 23 30 31 52 0 136 28G)
OPPONENTS 34 44 34 49 0 161
* SCORING TD-Ru-Pa-Rt K-PAT FG S PTS
Lambo 0 0 0 0 13/14 11/13 0 46
K. Allen 3 0 3 0 0 18
Green 3 0 3 0 0 18
Gates 2 0 2 0 0 12
S. Johnson 2 0 2 0 0 12
Woodhead 2 2 0 0 0 12
Floyd 1 0 1 0 0 6
Inman 1 0 1 0 0 6
J. Phillips 1 0 1 0 0 6
TEAM 15 2 13 0 13/14 11/13 0 136
OPPONENTS 19 6 10 3 18/18 9/10 0 161
2-Pt Conv: TM 0-1, OPP 1-1
SACKS: Attaochu 4, Liuget 2, Ingram 1.5,
Emanuel 1, Mathews 1, Stuckey 1, Weddle 0.5,
TM 11, OPP 17
FUM/LOST: Gordon 4/3, Rivers 2/2,
K. Allen 1/1, Watt 1/0
* PASSING Att Cmp Yds Cmp% Yds/Att TD TD% Int Int% Long Sack/Lost Rating
Rivers 253 177 2116 70.0 8.36 12 4.7 5 2.0 68 17/ 101 102.8
Clemens 6 5 63 83.3 10.50 1 16.7 0 0.0 19t 0/ 0 150.0
TEAM 259 182 2179 70.3 8.41 13 5.0 5 1.9 68 17/ 101 104.4
OPPONENTS 176 109 1395 61.9 7.93 10 5.7 4 2.3 72t 11/ 64 96.2
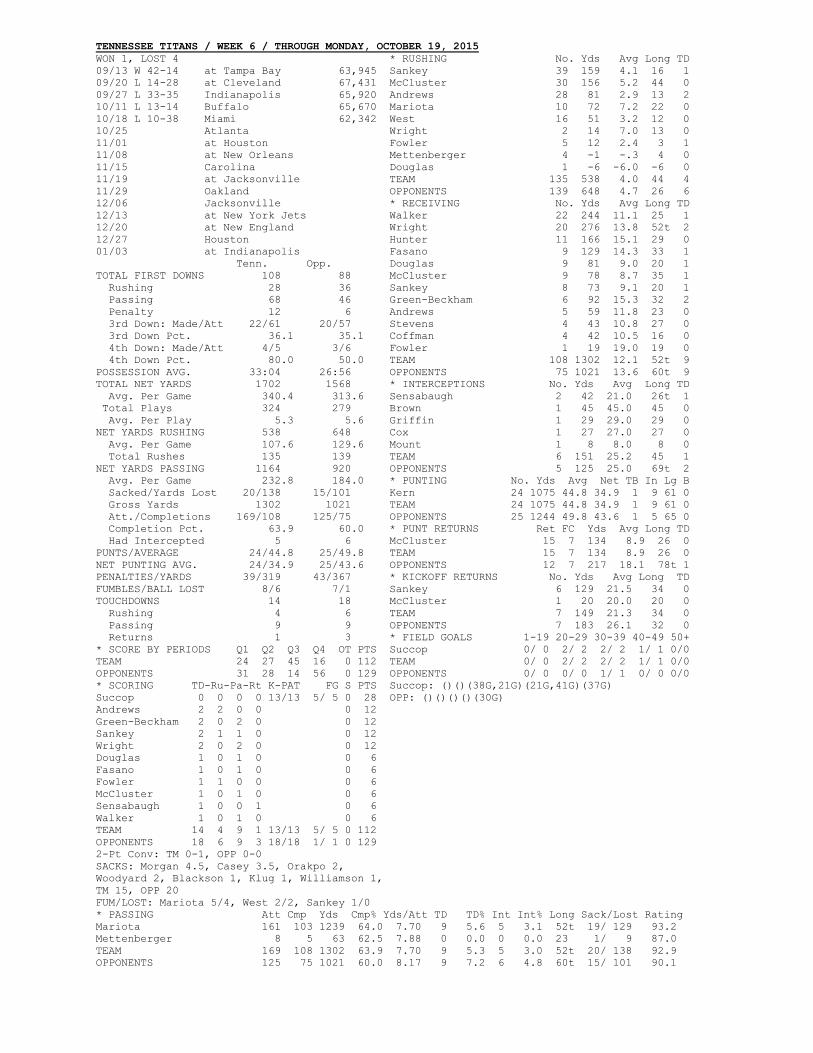
TENNESSEE TITANS / WEEK 6 / THROUGH MONDAY, OCTOBER 19, 2015
WON 1, LOST 4 * RUSHING No. Yds Avg Long TD
09/13 W 42-14 at Tampa Bay 63,945 Sankey 39 159 4.1 16 1
09/20 L 14-28 at Cleveland 67,431 McCluster 30 156 5.2 44 0
09/27 L 33-35 Indianapolis 65,920 Andrews 28 81 2.9 13 2
10/11 L 13-14 Buffalo 65,670 Mariota 10 72 7.2 22 0
10/18 L 10-38 Miami 62,342 West 16 51 3.2 12 0
10/25 Atlanta Wright 2 14 7.0 13 0
11/01 at Houston Fowler 5 12 2.4 3 1
11/08 at New Orleans Mettenberger 4 -1 -.3 4 0
11/15 Carolina Douglas 1 -6 -6.0 -6 0
11/19 at Jacksonville TEAM 135 538 4.0 44 4
11/29 Oakland OPPONENTS 139 648 4.7 26 6
12/06 Jacksonville * RECEIVING No. Yds Avg Long TD
12/13 at New York Jets Walker 22 244 11.1 25 1
12/20 at New England Wright 20 276 13.8 52t 2
12/27 Houston Hunter 11 166 15.1 29 0
01/03 at Indianapolis Fasano 9 129 14.3 33 1
Tenn. Opp. Douglas 9 81 9.0 20 1
TOTAL FIRST DOWNS 108 88 McCluster 9 78 8.7 35 1
Rushing 28 36 Sankey 8 73 9.1 20 1
Passing 68 46 Green-Beckham 6 92 15.3 32 2
Penalty 12 6 Andrews 5 59 11.8 23 0
3rd Down: Made/Att 22/61 20/57 Stevens 4 43 10.8 27 0
3rd Down Pct. 36.1 35.1 Coffman 4 42 10.5 16 0
4th Down: Made/Att 4/5 3/6 Fowler 1 19 19.0 19 0
4th Down Pct. 80.0 50.0 TEAM 108 1302 12.1 52t 9
POSSESSION AVG. 33:04 26:56 OPPONENTS 75 1021 13.6 60t 9
TOTAL NET YARDS 1702 1568 * INTERCEPTIONS No. Yds Avg Long TD
Avg. Per Game 340.4 313.6 Sensabaugh 2 42 21.0 26t 1
Total Plays 324 279 Brown 1 45 45.0 45 0
Avg. Per Play 5.3 5.6 Griffin 1 29 29.0 29 0
NET YARDS RUSHING 538 648 Cox 1 27 27.0 27 0
Avg. Per Game 107.6 129.6 Mount 1 8 8.0 8 0
Total Rushes 135 139 TEAM 6 151 25.2 45 1
NET YARDS PASSING 1164 920 OPPONENTS 5 125 25.0 69t 2
Avg. Per Game 232.8 184.0 * PUNTING No. Yds Avg Net TB In Lg B
Sacked/Yards Lost 20/138 15/101 Kern 24 1075 44.8 34.9 1 9 61 0
Gross Yards 1302 1021 TEAM 24 1075 44.8 34.9 1 9 61 0
Att./Completions 169/108 125/75 OPPONENTS 25 1244 49.8 43.6 1 5 65 0
Completion Pct. 63.9 60.0 * PUNT RETURNS Ret FC Yds Avg Long TD
Had Intercepted 5 6 McCluster 15 7 134 8.9 26 0
PUNTS/AVERAGE 24/44.8 25/49.8 TEAM 15 7 134 8.9 26 0
NET PUNTING AVG. 24/34.9 25/43.6 OPPONENTS 12 7 217 18.1 78t 1
PENALTIES/YARDS 39/319 43/367 * KICKOFF RETURNS No. Yds Avg Long TD
FUMBLES/BALL LOST 8/6 7/1 Sankey 6 129 21.5 34 0
TOUCHDOWNS 14 18 McCluster 1 20 20.0 20 0
Rushing 4 6 TEAM 7 149 21.3 34 0
Passing 9 9 OPPONENTS 7 183 26.1 32 0
Returns 1 3 * FIELD GOALS 1-19 20-29 30-39 40-49 50+
* SCORE BY PERIODS Q1 Q2 Q3 Q4 OT PTS Succop 0/ 0 2/ 2 2/ 2 1/ 1 0/0
TEAM 24 27 45 16 0 112 TEAM 0/ 0 2/ 2 2/ 2 1/ 1 0/0
OPPONENTS 31 28 14 56 0 129 OPPONENTS 0/ 0 0/ 0 1/ 1 0/ 0 0/0
* SCORING TD-Ru-Pa-Rt K-PAT FG S PTS Succop: ()()(38G,21G)(21G,41G)(37G)
Succop 0 0 0 0 13/13 5/ 5 0 28 OPP: ()()()()(30G)
Andrews 2 2 0 0 0 12
Green-Beckham 2 0 2 0 0 12
Sankey 2 1 1 0 0 12
Wright 2 0 2 0 0 12
Douglas 1 0 1 0 0 6
Fasano 1 0 1 0 0 6
Fowler 1 1 0 0 0 6
McCluster 1 0 1 0 0 6
Sensabaugh 1 0 0 1 0 6
Walker 1 0 1 0 0 6
TEAM 14 4 9 1 13/13 5/ 5 0 112
OPPONENTS 18 6 9 3 18/18 1/ 1 0 129
2-Pt Conv: TM 0-1, OPP 0-0
SACKS: Morgan 4.5, Casey 3.5, Orakpo 2,
Woodyard 2, Blackson 1, Klug 1, Williamson 1,
TM 15, OPP 20
FUM/LOST: Mariota 5/4, West 2/2, Sankey 1/0
* PASSING Att Cmp Yds Cmp% Yds/Att TD TD% Int Int% Long Sack/Lost Rating
Mariota 161 103 1239 64.0 7.70 9 5.6 5 3.1 52t 19/ 129 93.2
Mettenberger 8 5 63 62.5 7.88 0 0.0 0 0.0 23 1/ 9 87.0
TEAM 169 108 1302 63.9 7.70 9 5.3 5 3.0 52t 20/ 138 92.9
OPPONENTS 125 75 1021 60.0 8.17 9 7.2 6 4.8 60t 15/ 101 90.1
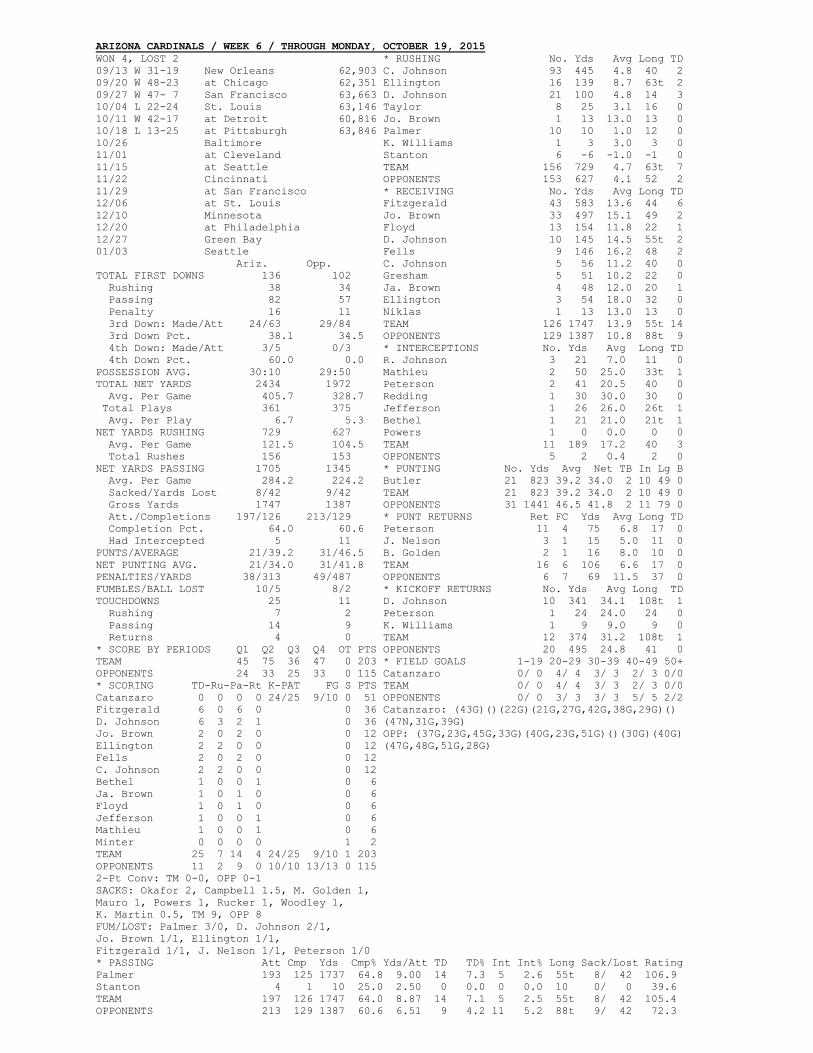
ARIZONA CARDINALS / WEEK 6 / THROUGH MONDAY, OCTOBER 19, 2015
WON 4, LOST 2 * RUSHING No. Yds Avg Long TD
09/13 W 31-19 New Orleans 62,903 C. Johnson 93 445 4.8 40 2
09/20 W 48-23 at Chicago 62,351 Ellington 16 139 8.7 63t 2
09/27 W 47- 7 San Francisco 63,663 D. Johnson 21 100 4.8 14 3
10/04 L 22-24 St. Louis 63,146 Taylor 8 25 3.1 16 0
10/11 W 42-17 at Detroit 60,816 Jo. Brown 1 13 13.0 13 0
10/18 L 13-25 at Pittsburgh 63,846 Palmer 10 10 1.0 12 0
10/26 Baltimore K. Williams 1 3 3.0 3 0
11/01 at Cleveland Stanton 6 -6 -1.0 -1 0
11/15 at Seattle TEAM 156 729 4.7 63t 7
11/22 Cincinnati OPPONENTS 153 627 4.1 52 2
11/29 at San Francisco * RECEIVING No. Yds Avg Long TD
12/06 at St. Louis Fitzgerald 43 583 13.6 44 6
12/10 Minnesota Jo. Brown 33 497 15.1 49 2
12/20 at Philadelphia Floyd 13 154 11.8 22 1
12/27 Green Bay D. Johnson 10 145 14.5 55t 2
01/03 Seattle Fells 9 146 16.2 48 2
Ariz. Opp. C. Johnson 5 56 11.2 40 0
TOTAL FIRST DOWNS 136 102 Gresham 5 51 10.2 22 0
Rushing 38 34 Ja. Brown 4 48 12.0 20 1
Passing 82 57 Ellington 3 54 18.0 32 0
Penalty 16 11 Niklas 1 13 13.0 13 0
3rd Down: Made/Att 24/63 29/84 TEAM 126 1747 13.9 55t 14
3rd Down Pct. 38.1 34.5 OPPONENTS 129 1387 10.8 88t 9
4th Down: Made/Att 3/5 0/3 * INTERCEPTIONS No. Yds Avg Long TD
4th Down Pct. 60.0 0.0 R. Johnson 3 21 7.0 11 0
POSSESSION AVG. 30:10 29:50 Mathieu 2 50 25.0 33t 1
TOTAL NET YARDS 2434 1972 Peterson 2 41 20.5 40 0
Avg. Per Game 405.7 328.7 Redding 1 30 30.0 30 0
Total Plays 361 375 Jefferson 1 26 26.0 26t 1
Avg. Per Play 6.7 5.3 Bethel 1 21 21.0 21t 1
NET YARDS RUSHING 729 627 Powers 1 0 0.0 0 0
Avg. Per Game 121.5 104.5 TEAM 11 189 17.2 40 3
Total Rushes 156 153 OPPONENTS 5 2 0.4 2 0
NET YARDS PASSING 1705 1345 * PUNTING No. Yds Avg Net TB In Lg B
Avg. Per Game 284.2 224.2 Butler 21 823 39.2 34.0 2 10 49 0
Sacked/Yards Lost 8/42 9/42 TEAM 21 823 39.2 34.0 2 10 49 0
Gross Yards 1747 1387 OPPONENTS 31 1441 46.5 41.8 2 11 79 0
Att./Completions 197/126 213/129 * PUNT RETURNS Ret FC Yds Avg Long TD
Completion Pct. 64.0 60.6 Peterson 11 4 75 6.8 17 0
Had Intercepted 5 11 J. Nelson 3 1 15 5.0 11 0
PUNTS/AVERAGE 21/39.2 31/46.5 B. Golden 2 1 16 8.0 10 0
NET PUNTING AVG. 21/34.0 31/41.8 TEAM 16 6 106 6.6 17 0
PENALTIES/YARDS 38/313 49/487 OPPONENTS 6 7 69 11.5 37 0
FUMBLES/BALL LOST 10/5 8/2 * KICKOFF RETURNS No. Yds Avg Long TD
TOUCHDOWNS 25 11 D. Johnson 10 341 34.1 108t 1
Rushing 7 2 Peterson 1 24 24.0 24 0
Passing 14 9 K. Williams 1 9 9.0 9 0
Returns 4 0 TEAM 12 374 31.2 108t 1
* SCORE BY PERIODS Q1 Q2 Q3 Q4 OT PTS OPPONENTS 20 495 24.8 41 0
TEAM 45 75 36 47 0 203 * FIELD GOALS 1-19 20-29 30-39 40-49 50+
OPPONENTS 24 33 25 33 0 115 Catanzaro 0/ 0 4/ 4 3/ 3 2/ 3 0/0
* SCORING TD-Ru-Pa-Rt K-PAT FG S PTS TEAM 0/ 0 4/ 4 3/ 3 2/ 3 0/0
Catanzaro 0 0 0 0 24/25 9/10 0 51 OPPONENTS 0/ 0 3/ 3 3/ 3 5/ 5 2/2
Fitzgerald 6 0 6 0 0 36 Catanzaro: (43G)()(22G)(21G,27G,42G,38G,29G)()
D. Johnson 6 3 2 1 0 36 (47N,31G,39G)
Jo. Brown 2 0 2 0 0 12 OPP: (37G,23G,45G,33G)(40G,23G,51G)()(30G)(40G)
Ellington 2 2 0 0 0 12 (47G,48G,51G,28G)
Fells 2 0 2 0 0 12
C. Johnson 2 2 0 0 0 12
Bethel 1 0 0 1 0 6
Ja. Brown 1 0 1 0 0 6
Floyd 1 0 1 0 0 6
Jefferson 1 0 0 1 0 6
Mathieu 1 0 0 1 0 6
Minter 0 0 0 0 1 2
TEAM 25 7 14 4 24/25 9/10 1 203
OPPONENTS 11 2 9 0 10/10 13/13 0 115
2-Pt Conv: TM 0-0, OPP 0-1
SACKS: Okafor 2, Campbell 1.5, M. Golden 1,
Mauro 1, Powers 1, Rucker 1, Woodley 1,
K. Martin 0.5, TM 9, OPP 8
FUM/LOST: Palmer 3/0, D. Johnson 2/1,
Jo. Brown 1/1, Ellington 1/1,
Fitzgerald 1/1, J. Nelson 1/1, Peterson 1/0
* PASSING Att Cmp Yds Cmp% Yds/Att TD TD% Int Int% Long Sack/Lost Rating
Palmer 193 125 1737 64.8 9.00 14 7.3 5 2.6 55t 8/ 42 106.9
Stanton 4 1 10 25.0 2.50 0 0.0 0 0.0 10 0/ 0 39.6
TEAM 197 126 1747 64.0 8.87 14 7.1 5 2.5 55t 8/ 42 105.4
OPPONENTS 213 129 1387 60.6 6.51 9 4.2 11 5.2 88t 9/ 42 72.3
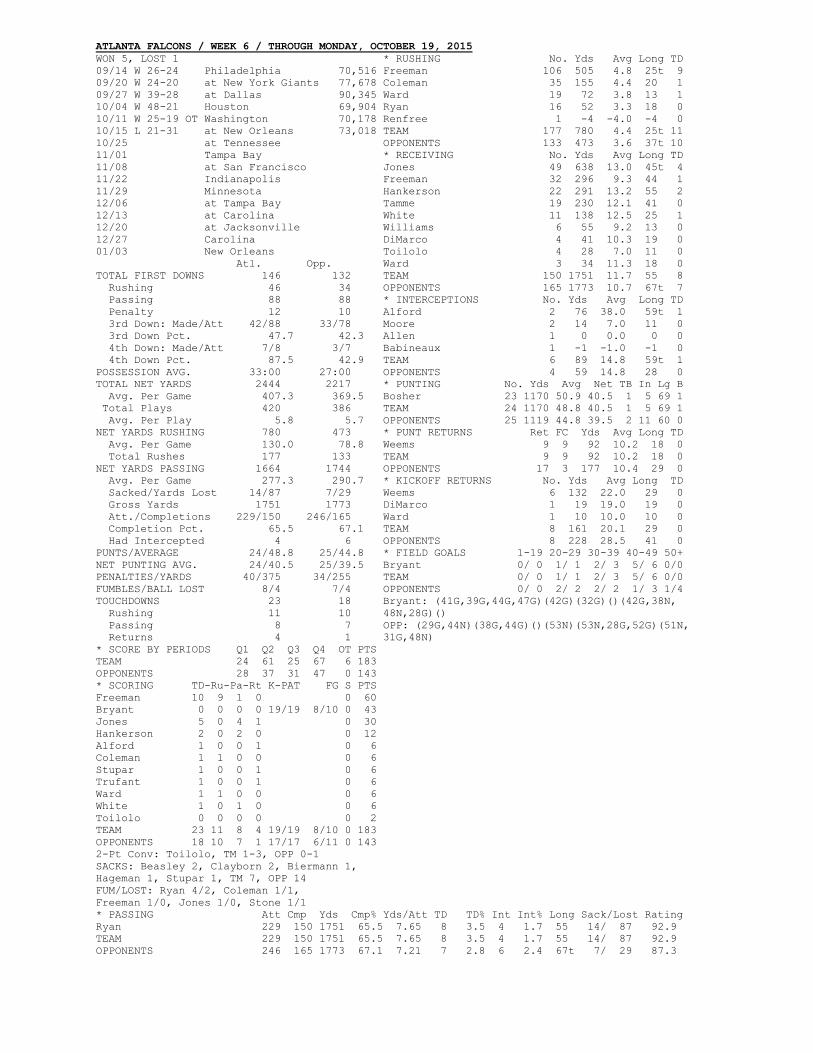
ATLANTA FALCONS / WEEK 6 / THROUGH MONDAY, OCTOBER 19, 2015
WON 5, LOST 1 * RUSHING No. Yds Avg Long TD
09/14 W 26-24 Philadelphia 70,516 Freeman 106 505 4.8 25t 9
09/20 W 24-20 at New York Giants 77,678 Coleman 35 155 4.4 20 1
09/27 W 39-28 at Dallas 90,345 Ward 19 72 3.8 13 1
10/04 W 48-21 Houston 69,904 Ryan 16 52 3.3 18 0
10/11 W 25-19 OT Washington 70,178 Renfree 1 -4 -4.0 -4 0
10/15 L 21-31 at New Orleans 73,018 TEAM 177 780 4.4 25t 11
10/25 at Tennessee OPPONENTS 133 473 3.6 37t 10
11/01 Tampa Bay * RECEIVING No. Yds Avg Long TD
11/08 at San Francisco Jones 49 638 13.0 45t 4
11/22 Indianapolis Freeman 32 296 9.3 44 1
11/29 Minnesota Hankerson 22 291 13.2 55 2
12/06 at Tampa Bay Tamme 19 230 12.1 41 0
12/13 at Carolina White 11 138 12.5 25 1
12/20 at Jacksonville Williams 6 55 9.2 13 0
12/27 Carolina DiMarco 4 41 10.3 19 0
01/03 New Orleans Toilolo 4 28 7.0 11 0
Atl. Opp. Ward 3 34 11.3 18 0
TOTAL FIRST DOWNS 146 132 TEAM 150 1751 11.7 55 8
Rushing 46 34 OPPONENTS 165 1773 10.7 67t 7
Passing 88 88 * INTERCEPTIONS No. Yds Avg Long TD
Penalty 12 10 Alford 2 76 38.0 59t 1
3rd Down: Made/Att 42/88 33/78 Moore 2 14 7.0 11 0
3rd Down Pct. 47.7 42.3 Allen 1 0 0.0 0 0
4th Down: Made/Att 7/8 3/7 Babineaux 1 -1 -1.0 -1 0
4th Down Pct. 87.5 42.9 TEAM 6 89 14.8 59t 1
POSSESSION AVG. 33:00 27:00 OPPONENTS 4 59 14.8 28 0
TOTAL NET YARDS 2444 2217 * PUNTING No. Yds Avg Net TB In Lg B
Avg. Per Game 407.3 369.5 Bosher 23 1170 50.9 40.5 1 5 69 1
Total Plays 420 386 TEAM 24 1170 48.8 40.5 1 5 69 1
Avg. Per Play 5.8 5.7 OPPONENTS 25 1119 44.8 39.5 2 11 60 0
NET YARDS RUSHING 780 473 * PUNT RETURNS Ret FC Yds Avg Long TD
Avg. Per Game 130.0 78.8 Weems 9 9 92 10.2 18 0
Total Rushes 177 133 TEAM 9 9 92 10.2 18 0
NET YARDS PASSING 1664 1744 OPPONENTS 17 3 177 10.4 29 0
Avg. Per Game 277.3 290.7 * KICKOFF RETURNS No. Yds Avg Long TD
Sacked/Yards Lost 14/87 7/29 Weems 6 132 22.0 29 0
Gross Yards 1751 1773 DiMarco 1 19 19.0 19 0
Att./Completions 229/150 246/165 Ward 1 10 10.0 10 0
Completion Pct. 65.5 67.1 TEAM 8 161 20.1 29 0
Had Intercepted 4 6 OPPONENTS 8 228 28.5 41 0
PUNTS/AVERAGE 24/48.8 25/44.8 * FIELD GOALS 1-19 20-29 30-39 40-49 50+
NET PUNTING AVG. 24/40.5 25/39.5 Bryant 0/ 0 1/ 1 2/ 3 5/ 6 0/0
PENALTIES/YARDS 40/375 34/255 TEAM 0/ 0 1/ 1 2/ 3 5/ 6 0/0
FUMBLES/BALL LOST 8/4 7/4 OPPONENTS 0/ 0 2/ 2 2/ 2 1/ 3 1/4
TOUCHDOWNS 23 18 Bryant: (41G,39G,44G,47G)(42G)(32G)()(42G,38N,
Rushing 11 10 48N,28G)()
Passing 8 7 OPP: (29G,44N)(38G,44G)()(53N)(53N,28G,52G)(51N,
Returns 4 1 31G,48N)
* SCORE BY PERIODS Q1 Q2 Q3 Q4 OT PTS
TEAM 24 61 25 67 6 183
OPPONENTS 28 37 31 47 0 143
* SCORING TD-Ru-Pa-Rt K-PAT FG S PTS
Freeman 10 9 1 0 0 60
Bryant 0 0 0 0 19/19 8/10 0 43
Jones 5 0 4 1 0 30
Hankerson 2 0 2 0 0 12
Alford 1 0 0 1 0 6
Coleman 1 1 0 0 0 6
Stupar 1 0 0 1 0 6
Trufant 1 0 0 1 0 6
Ward 1 1 0 0 0 6
White 1 0 1 0 0 6
Toilolo 0 0 0 0 0 2
TEAM 23 11 8 4 19/19 8/10 0 183
OPPONENTS 18 10 7 1 17/17 6/11 0 143
2-Pt Conv: Toilolo, TM 1-3, OPP 0-1
SACKS: Beasley 2, Clayborn 2, Biermann 1,
Hageman 1, Stupar 1, TM 7, OPP 14
FUM/LOST: Ryan 4/2, Coleman 1/1,
Freeman 1/0, Jones 1/0, Stone 1/1
* PASSING Att Cmp Yds Cmp% Yds/Att TD TD% Int Int% Long Sack/Lost Rating
Ryan 229 150 1751 65.5 7.65 8 3.5 4 1.7 55 14/ 87 92.9
TEAM 229 150 1751 65.5 7.65 8 3.5 4 1.7 55 14/ 87 92.9
OPPONENTS 246 165 1773 67.1 7.21 7 2.8 6 2.4 67t 7/ 29 87.3
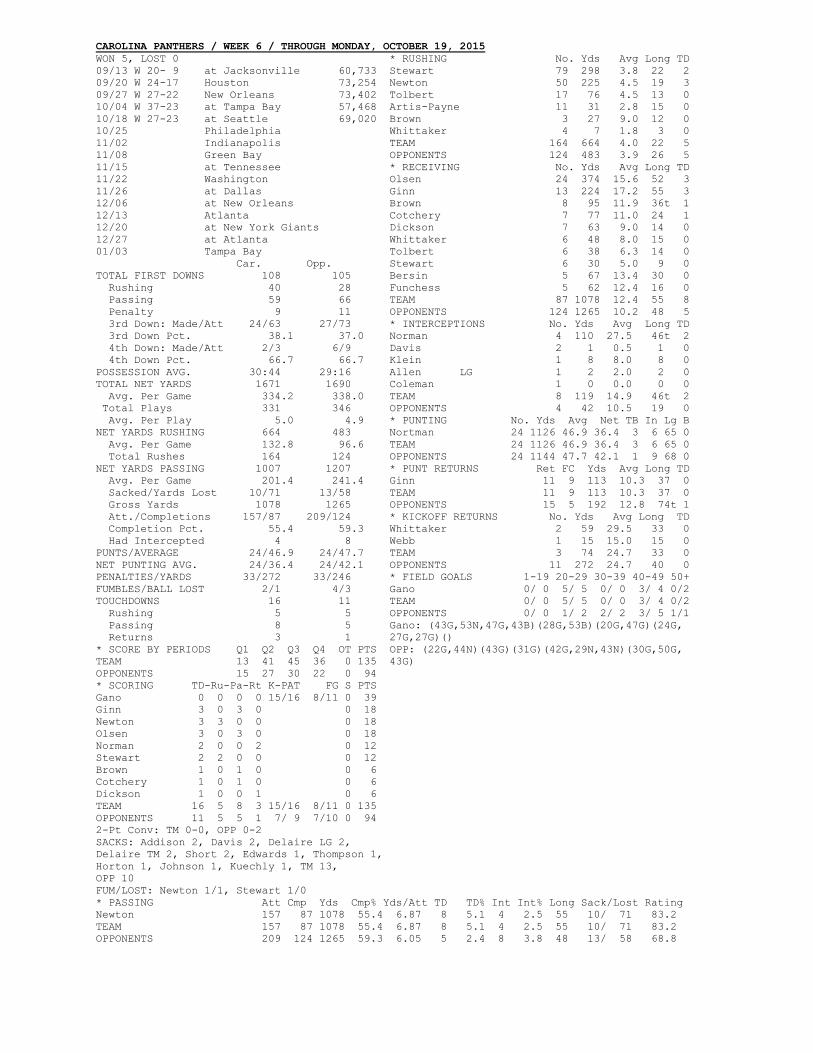
CAROLINA PANTHERS / WEEK 6 / THROUGH MONDAY, OCTOBER 19, 2015
WON 5, LOST 0 * RUSHING No. Yds Avg Long TD
09/13 W 20- 9 at Jacksonville 60,733 Stewart 79 298 3.8 22 2
09/20 W 24-17 Houston 73,254 Newton 50 225 4.5 19 3
09/27 W 27-22 New Orleans 73,402 Tolbert 17 76 4.5 13 0
10/04 W 37-23 at Tampa Bay 57,468 Artis-Payne 11 31 2.8 15 0
10/18 W 27-23 at Seattle 69,020 Brown 3 27 9.0 12 0
10/25 Philadelphia Whittaker 4 7 1.8 3 0
11/02 Indianapolis TEAM 164 664 4.0 22 5
11/08 Green Bay OPPONENTS 124 483 3.9 26 5
11/15 at Tennessee * RECEIVING No. Yds Avg Long TD
11/22 Washington Olsen 24 374 15.6 52 3
11/26 at Dallas Ginn 13 224 17.2 55 3
12/06 at New Orleans Brown 8 95 11.9 36t 1
12/13 Atlanta Cotchery 7 77 11.0 24 1
12/20 at New York Giants Dickson 7 63 9.0 14 0
12/27 at Atlanta Whittaker 6 48 8.0 15 0
01/03 Tampa Bay Tolbert 6 38 6.3 14 0
Car. Opp. Stewart 6 30 5.0 9 0
TOTAL FIRST DOWNS 108 105 Bersin 5 67 13.4 30 0
Rushing 40 28 Funchess 5 62 12.4 16 0
Passing 59 66 TEAM 87 1078 12.4 55 8
Penalty 9 11 OPPONENTS 124 1265 10.2 48 5
3rd Down: Made/Att 24/63 27/73 * INTERCEPTIONS No. Yds Avg Long TD
3rd Down Pct. 38.1 37.0 Norman 4 110 27.5 46t 2
4th Down: Made/Att 2/3 6/9 Davis 2 1 0.5 1 0
4th Down Pct. 66.7 66.7 Klein 1 8 8.0 8 0
POSSESSION AVG. 30:44 29:16 Allen LG 1 2 2.0 2 0
TOTAL NET YARDS 1671 1690 Coleman 1 0 0.0 0 0
Avg. Per Game 334.2 338.0 TEAM 8 119 14.9 46t 2
Total Plays 331 346 OPPONENTS 4 42 10.5 19 0
Avg. Per Play 5.0 4.9 * PUNTING No. Yds Avg Net TB In Lg B
NET YARDS RUSHING 664 483 Nortman 24 1126 46.9 36.4 3 6 65 0
Avg. Per Game 132.8 96.6 TEAM 24 1126 46.9 36.4 3 6 65 0
Total Rushes 164 124 OPPONENTS 24 1144 47.7 42.1 1 9 68 0
NET YARDS PASSING 1007 1207 * PUNT RETURNS Ret FC Yds Avg Long TD
Avg. Per Game 201.4 241.4 Ginn 11 9 113 10.3 37 0
Sacked/Yards Lost 10/71 13/58 TEAM 11 9 113 10.3 37 0
Gross Yards 1078 1265 OPPONENTS 15 5 192 12.8 74t 1
Att./Completions 157/87 209/124 * KICKOFF RETURNS No. Yds Avg Long TD
Completion Pct. 55.4 59.3 Whittaker 2 59 29.5 33 0
Had Intercepted 4 8 Webb 1 15 15.0 15 0
PUNTS/AVERAGE 24/46.9 24/47.7 TEAM 3 74 24.7 33 0
NET PUNTING AVG. 24/36.4 24/42.1 OPPONENTS 11 272 24.7 40 0
PENALTIES/YARDS 33/272 33/246 * FIELD GOALS 1-19 20-29 30-39 40-49 50+
FUMBLES/BALL LOST 2/1 4/3 Gano 0/ 0 5/ 5 0/ 0 3/ 4 0/2
TOUCHDOWNS 16 11 TEAM 0/ 0 5/ 5 0/ 0 3/ 4 0/2
Rushing 5 5 OPPONENTS 0/ 0 1/ 2 2/ 2 3/ 5 1/1
Passing 8 5 Gano: (43G,53N,47G,43B)(28G,53B)(20G,47G)(24G,
Returns 3 1 27G,27G)()
* SCORE BY PERIODS Q1 Q2 Q3 Q4 OT PTS OPP: (22G,44N)(43G)(31G)(42G,29N,43N)(30G,50G,
TEAM 13 41 45 36 0 135 43G)
OPPONENTS 15 27 30 22 0 94
* SCORING TD-Ru-Pa-Rt K-PAT FG S PTS
Gano 0 0 0 0 15/16 8/11 0 39
Ginn 3 0 3 0 0 18
Newton 3 3 0 0 0 18
Olsen 3 0 3 0 0 18
Norman 2 0 0 2 0 12
Stewart 2 2 0 0 0 12
Brown 1 0 1 0 0 6
Cotchery 1 0 1 0 0 6
Dickson 1 0 0 1 0 6
TEAM 16 5 8 3 15/16 8/11 0 135
OPPONENTS 11 5 5 1 7/ 9 7/10 0 94
2-Pt Conv: TM 0-0, OPP 0-2
SACKS: Addison 2, Davis 2, Delaire LG 2,
Delaire TM 2, Short 2, Edwards 1, Thompson 1,
Horton 1, Johnson 1, Kuechly 1, TM 13,
OPP 10
FUM/LOST: Newton 1/1, Stewart 1/0
* PASSING Att Cmp Yds Cmp% Yds/Att TD TD% Int Int% Long Sack/Lost Rating
Newton 157 87 1078 55.4 6.87 8 5.1 4 2.5 55 10/ 71 83.2
TEAM 157 87 1078 55.4 6.87 8 5.1 4 2.5 55 10/ 71 83.2
OPPONENTS 209 124 1265 59.3 6.05 5 2.4 8 3.8 48 13/ 58 68.8
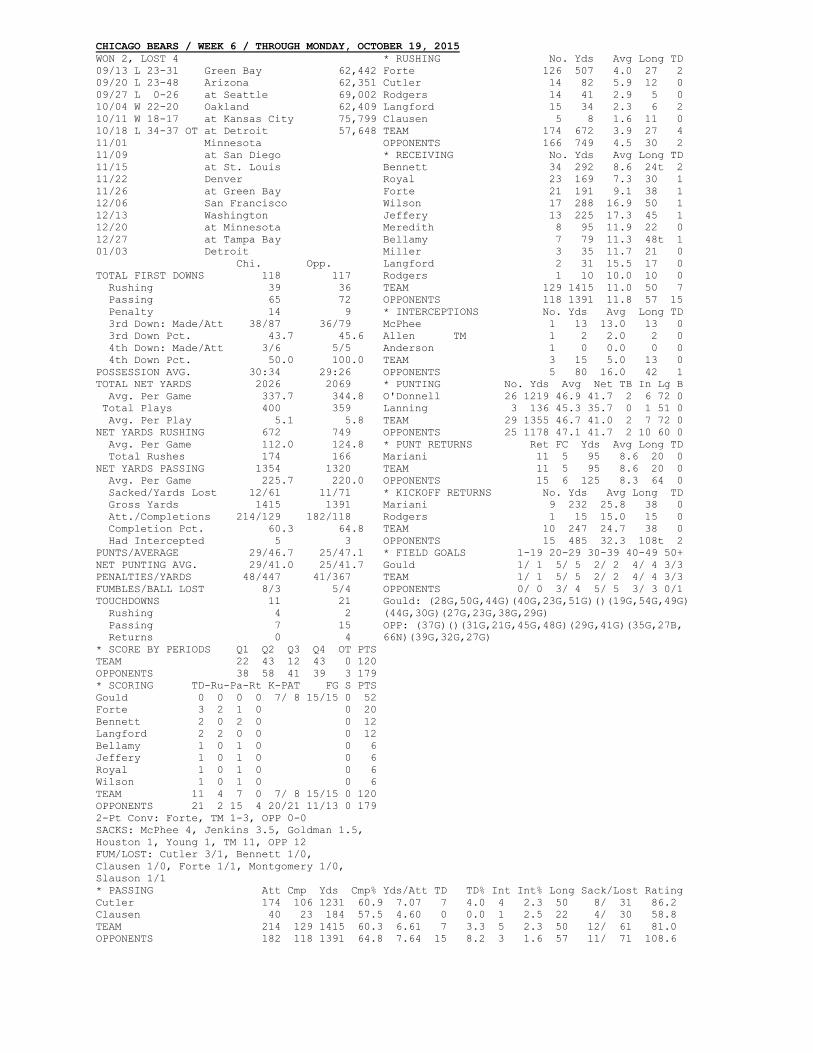
CHICAGO BEARS / WEEK 6 / THROUGH MONDAY, OCTOBER 19, 2015
WON 2, LOST 4 * RUSHING No. Yds Avg Long TD
09/13 L 23-31 Green Bay 62,442 Forte 126 507 4.0 27 2
09/20 L 23-48 Arizona 62,351 Cutler 14 82 5.9 12 0
09/27 L 0-26 at Seattle 69,002 Rodgers 14 41 2.9 5 0
10/04 W 22-20 Oakland 62,409 Langford 15 34 2.3 6 2
10/11 W 18-17 at Kansas City 75,799 Clausen 5 8 1.6 11 0
10/18 L 34-37 OT at Detroit 57,648 TEAM 174 672 3.9 27 4
11/01 Minnesota OPPONENTS 166 749 4.5 30 2
11/09 at San Diego * RECEIVING No. Yds Avg Long TD
11/15 at St. Louis Bennett 34 292 8.6 24t 2
11/22 Denver Royal 23 169 7.3 30 1
11/26 at Green Bay Forte 21 191 9.1 38 1
12/06 San Francisco Wilson 17 288 16.9 50 1
12/13 Washington Jeffery 13 225 17.3 45 1
12/20 at Minnesota Meredith 8 95 11.9 22 0
12/27 at Tampa Bay Bellamy 7 79 11.3 48t 1
01/03 Detroit Miller 3 35 11.7 21 0
Chi. Opp. Langford 2 31 15.5 17 0
TOTAL FIRST DOWNS 118 117 Rodgers 1 10 10.0 10 0
Rushing 39 36 TEAM 129 1415 11.0 50 7
Passing 65 72 OPPONENTS 118 1391 11.8 57 15
Penalty 14 9 * INTERCEPTIONS No. Yds Avg Long TD
3rd Down: Made/Att 38/87 36/79 McPhee 1 13 13.0 13 0
3rd Down Pct. 43.7 45.6 Allen TM 1 2 2.0 2 0
4th Down: Made/Att 3/6 5/5 Anderson 1 0 0.0 0 0
4th Down Pct. 50.0 100.0 TEAM 3 15 5.0 13 0
POSSESSION AVG. 30:34 29:26 OPPONENTS 5 80 16.0 42 1
TOTAL NET YARDS 2026 2069 * PUNTING No. Yds Avg Net TB In Lg B
Avg. Per Game 337.7 344.8 O'Donnell 26 1219 46.9 41.7 2 6 72 0
Total Plays 400 359 Lanning 3 136 45.3 35.7 0 1 51 0
Avg. Per Play 5.1 5.8 TEAM 29 1355 46.7 41.0 2 7 72 0
NET YARDS RUSHING 672 749 OPPONENTS 25 1178 47.1 41.7 2 10 60 0
Avg. Per Game 112.0 124.8 * PUNT RETURNS Ret FC Yds Avg Long TD
Total Rushes 174 166 Mariani 11 5 95 8.6 20 0
NET YARDS PASSING 1354 1320 TEAM 11 5 95 8.6 20 0
Avg. Per Game 225.7 220.0 OPPONENTS 15 6 125 8.3 64 0
Sacked/Yards Lost 12/61 11/71 * KICKOFF RETURNS No. Yds Avg Long TD
Gross Yards 1415 1391 Mariani 9 232 25.8 38 0
Att./Completions 214/129 182/118 Rodgers 1 15 15.0 15 0
Completion Pct. 60.3 64.8 TEAM 10 247 24.7 38 0
Had Intercepted 5 3 OPPONENTS 15 485 32.3 108t 2
PUNTS/AVERAGE 29/46.7 25/47.1 * FIELD GOALS 1-19 20-29 30-39 40-49 50+
NET PUNTING AVG. 29/41.0 25/41.7 Gould 1/ 1 5/ 5 2/ 2 4/ 4 3/3
PENALTIES/YARDS 48/447 41/367 TEAM 1/ 1 5/ 5 2/ 2 4/ 4 3/3
FUMBLES/BALL LOST 8/3 5/4 OPPONENTS 0/ 0 3/ 4 5/ 5 3/ 3 0/1
TOUCHDOWNS 11 21 Gould: (28G,50G,44G)(40G,23G,51G)()(19G,54G,49G)
Rushing 4 2 (44G,30G)(27G,23G,38G,29G)
Passing 7 15 OPP: (37G)()(31G,21G,45G,48G)(29G,41G)(35G,27B,
Returns 0 4 66N)(39G,32G,27G)
* SCORE BY PERIODS Q1 Q2 Q3 Q4 OT PTS
TEAM 22 43 12 43 0 120
OPPONENTS 38 58 41 39 3 179
* SCORING TD-Ru-Pa-Rt K-PAT FG S PTS
Gould 0 0 0 0 7/ 8 15/15 0 52
Forte 3 2 1 0 0 20
Bennett 2 0 2 0 0 12
Langford 2 2 0 0 0 12
Bellamy 1 0 1 0 0 6
Jeffery 1 0 1 0 0 6
Royal 1 0 1 0 0 6
Wilson 1 0 1 0 0 6
TEAM 11 4 7 0 7/ 8 15/15 0 120
OPPONENTS 21 2 15 4 20/21 11/13 0 179
2-Pt Conv: Forte, TM 1-3, OPP 0-0
SACKS: McPhee 4, Jenkins 3.5, Goldman 1.5,
Houston 1, Young 1, TM 11, OPP 12
FUM/LOST: Cutler 3/1, Bennett 1/0,
Clausen 1/0, Forte 1/1, Montgomery 1/0,
Slauson 1/1
* PASSING Att Cmp Yds Cmp% Yds/Att TD TD% Int Int% Long Sack/Lost Rating
Cutler 174 106 1231 60.9 7.07 7 4.0 4 2.3 50 8/ 31 86.2
Clausen 40 23 184 57.5 4.60 0 0.0 1 2.5 22 4/ 30 58.8
TEAM 214 129 1415 60.3 6.61 7 3.3 5 2.3 50 12/ 61 81.0
OPPONENTS 182 118 1391 64.8 7.64 15 8.2 3 1.6 57 11/ 71 108.6
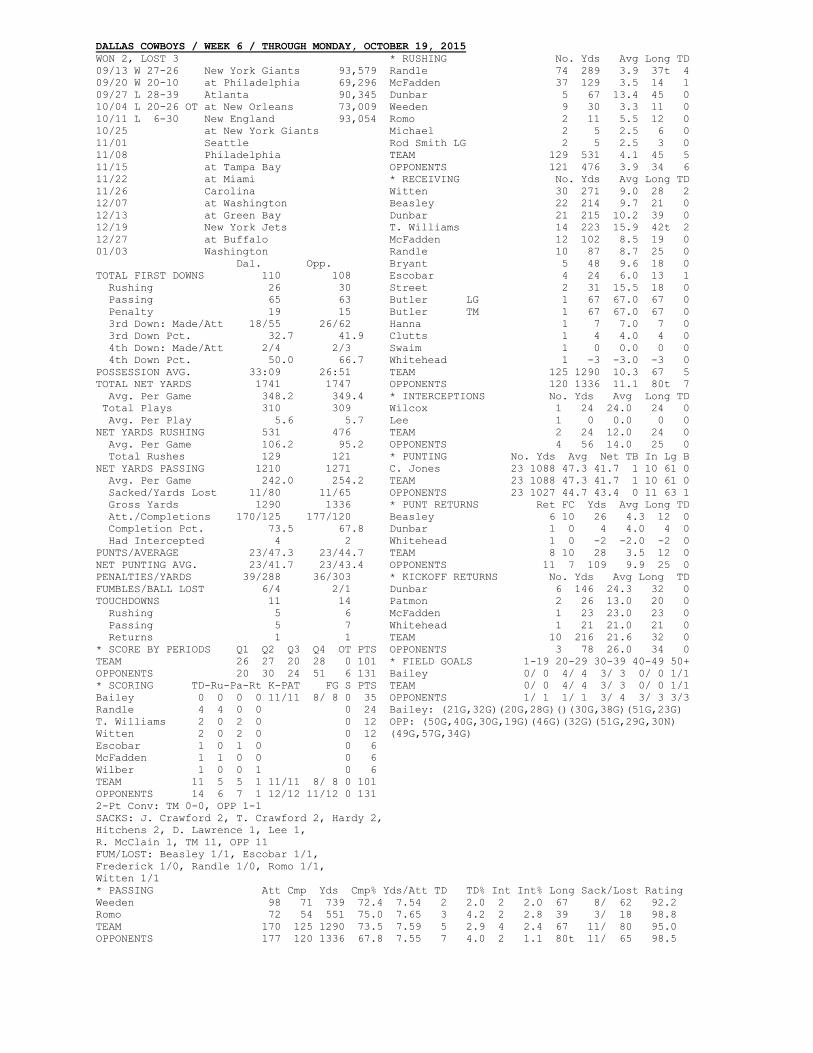
DALLAS COWBOYS / WEEK 6 / THROUGH MONDAY, OCTOBER 19, 2015
WON 2, LOST 3 * RUSHING No. Yds Avg Long TD
09/13 W 27-26 New York Giants 93,579 Randle 74 289 3.9 37t 4
09/20 W 20-10 at Philadelphia 69,296 McFadden 37 129 3.5 14 1
09/27 L 28-39 Atlanta 90,345 Dunbar 5 67 13.4 45 0
10/04 L 20-26 OT at New Orleans 73,009 Weeden 9 30 3.3 11 0
10/11 L 6-30 New England 93,054 Romo 2 11 5.5 12 0
10/25 at New York Giants Michael 2 5 2.5 6 0
11/01 Seattle Rod Smith LG 2 5 2.5 3 0
11/08 Philadelphia TEAM 129 531 4.1 45 5
11/15 at Tampa Bay OPPONENTS 121 476 3.9 34 6
11/22 at Miami * RECEIVING No. Yds Avg Long TD
11/26 Carolina Witten 30 271 9.0 28 2
12/07 at Washington Beasley 22 214 9.7 21 0
12/13 at Green Bay Dunbar 21 215 10.2 39 0
12/19 New York Jets T. Williams 14 223 15.9 42t 2
12/27 at Buffalo McFadden 12 102 8.5 19 0
01/03 Washington Randle 10 87 8.7 25 0
Dal. Opp. Bryant 5 48 9.6 18 0
TOTAL FIRST DOWNS 110 108 Escobar 4 24 6.0 13 1
Rushing 26 30 Street 2 31 15.5 18 0
Passing 65 63 Butler LG 1 67 67.0 67 0
Penalty 19 15 Butler TM 1 67 67.0 67 0
3rd Down: Made/Att 18/55 26/62 Hanna 1 7 7.0 7 0
3rd Down Pct. 32.7 41.9 Clutts 1 4 4.0 4 0
4th Down: Made/Att 2/4 2/3 Swaim 1 0 0.0 0 0
4th Down Pct. 50.0 66.7 Whitehead 1 -3 -3.0 -3 0
POSSESSION AVG. 33:09 26:51 TEAM 125 1290 10.3 67 5
TOTAL NET YARDS 1741 1747 OPPONENTS 120 1336 11.1 80t 7
Avg. Per Game 348.2 349.4 * INTERCEPTIONS No. Yds Avg Long TD
Total Plays 310 309 Wilcox 1 24 24.0 24 0
Avg. Per Play 5.6 5.7 Lee 1 0 0.0 0 0
NET YARDS RUSHING 531 476 TEAM 2 24 12.0 24 0
Avg. Per Game 106.2 95.2 OPPONENTS 4 56 14.0 25 0
Total Rushes 129 121 * PUNTING No. Yds Avg Net TB In Lg B
NET YARDS PASSING 1210 1271 C. Jones 23 1088 47.3 41.7 1 10 61 0
Avg. Per Game 242.0 254.2 TEAM 23 1088 47.3 41.7 1 10 61 0
Sacked/Yards Lost 11/80 11/65 OPPONENTS 23 1027 44.7 43.4 0 11 63 1
Gross Yards 1290 1336 * PUNT RETURNS Ret FC Yds Avg Long TD
Att./Completions 170/125 177/120 Beasley 6 10 26 4.3 12 0
Completion Pct. 73.5 67.8 Dunbar 1 0 4 4.0 4 0
Had Intercepted 4 2 Whitehead 1 0 -2 -2.0 -2 0
PUNTS/AVERAGE 23/47.3 23/44.7 TEAM 8 10 28 3.5 12 0
NET PUNTING AVG. 23/41.7 23/43.4 OPPONENTS 11 7 109 9.9 25 0
PENALTIES/YARDS 39/288 36/303 * KICKOFF RETURNS No. Yds Avg Long TD
FUMBLES/BALL LOST 6/4 2/1 Dunbar 6 146 24.3 32 0
TOUCHDOWNS 11 14 Patmon 2 26 13.0 20 0
Rushing 5 6 McFadden 1 23 23.0 23 0
Passing 5 7 Whitehead 1 21 21.0 21 0
Returns 1 1 TEAM 10 216 21.6 32 0
* SCORE BY PERIODS Q1 Q2 Q3 Q4 OT PTS OPPONENTS 3 78 26.0 34 0
TEAM 26 27 20 28 0 101 * FIELD GOALS 1-19 20-29 30-39 40-49 50+
OPPONENTS 20 30 24 51 6 131 Bailey 0/ 0 4/ 4 3/ 3 0/ 0 1/1
* SCORING TD-Ru-Pa-Rt K-PAT FG S PTS TEAM 0/ 0 4/ 4 3/ 3 0/ 0 1/1
Bailey 0 0 0 0 11/11 8/ 8 0 35 OPPONENTS 1/ 1 1/ 1 3/ 4 3/ 3 3/3
Randle 4 4 0 0 0 24 Bailey: (21G,32G)(20G,28G)()(30G,38G)(51G,23G)
T. Williams 2 0 2 0 0 12 OPP: (50G,40G,30G,19G)(46G)(32G)(51G,29G,30N)
Witten 2 0 2 0 0 12 (49G,57G,34G)
Escobar 1 0 1 0 0 6
McFadden 1 1 0 0 0 6
Wilber 1 0 0 1 0 6
TEAM 11 5 5 1 11/11 8/ 8 0 101
OPPONENTS 14 6 7 1 12/12 11/12 0 131
2-Pt Conv: TM 0-0, OPP 1-1
SACKS: J. Crawford 2, T. Crawford 2, Hardy 2,
Hitchens 2, D. Lawrence 1, Lee 1,
R. McClain 1, TM 11, OPP 11
FUM/LOST: Beasley 1/1, Escobar 1/1,
Frederick 1/0, Randle 1/0, Romo 1/1,
Witten 1/1
* PASSING Att Cmp Yds Cmp% Yds/Att TD TD% Int Int% Long Sack/Lost Rating
Weeden 98 71 739 72.4 7.54 2 2.0 2 2.0 67 8/ 62 92.2
Romo 72 54 551 75.0 7.65 3 4.2 2 2.8 39 3/ 18 98.8
TEAM 170 125 1290 73.5 7.59 5 2.9 4 2.4 67 11/ 80 95.0
OPPONENTS 177 120 1336 67.8 7.55 7 4.0 2 1.1 80t 11/ 65 98.5
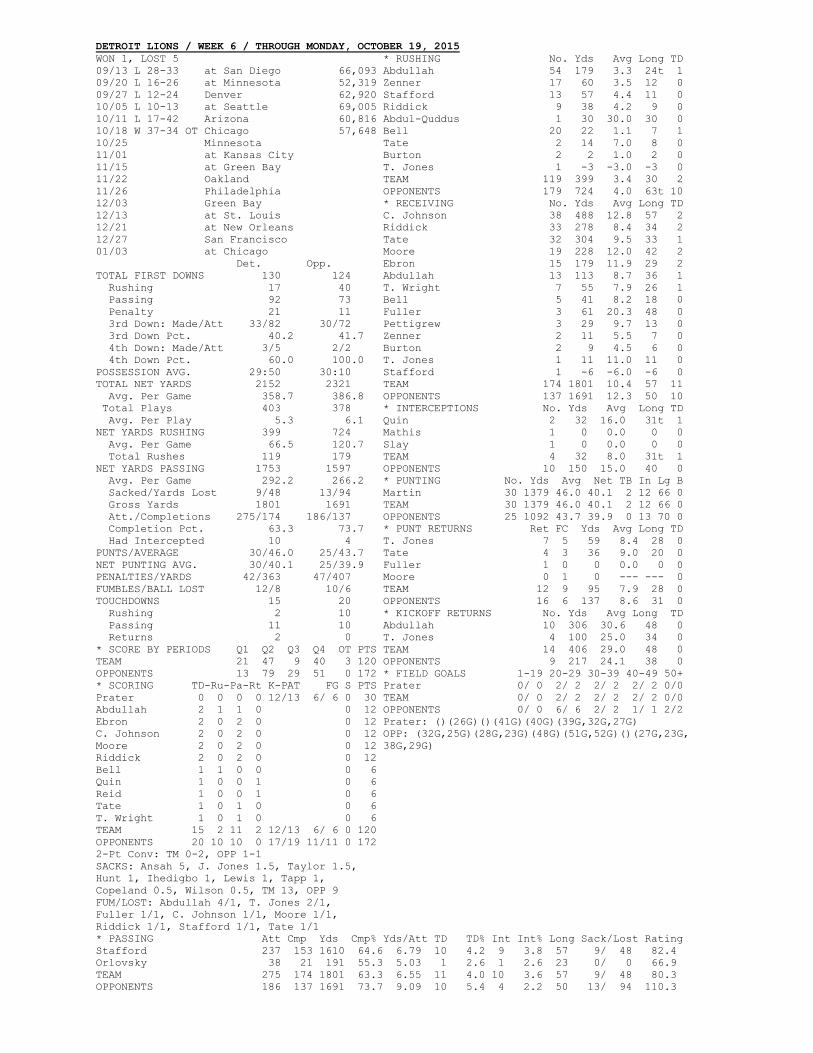
DETROIT LIONS / WEEK 6 / THROUGH MONDAY, OCTOBER 19, 2015
WON 1, LOST 5 * RUSHING No. Yds Avg Long TD
09/13 L 28-33 at San Diego 66,093 Abdullah 54 179 3.3 24t 1
09/20 L 16-26 at Minnesota 52,319 Zenner 17 60 3.5 12 0
09/27 L 12-24 Denver 62,920 Stafford 13 57 4.4 11 0
10/05 L 10-13 at Seattle 69,005 Riddick 9 38 4.2 9 0
10/11 L 17-42 Arizona 60,816 Abdul-Quddus 1 30 30.0 30 0
10/18 W 37-34 OT Chicago 57,648 Bell 20 22 1.1 7 1
10/25 Minnesota Tate 2 14 7.0 8 0
11/01 at Kansas City Burton 2 2 1.0 2 0
11/15 at Green Bay T. Jones 1 -3 -3.0 -3 0
11/22 Oakland TEAM 119 399 3.4 30 2
11/26 Philadelphia OPPONENTS 179 724 4.0 63t 10
12/03 Green Bay * RECEIVING No. Yds Avg Long TD
12/13 at St. Louis C. Johnson 38 488 12.8 57 2
12/21 at New Orleans Riddick 33 278 8.4 34 2
12/27 San Francisco Tate 32 304 9.5 33 1
01/03 at Chicago Moore 19 228 12.0 42 2
Det. Opp. Ebron 15 179 11.9 29 2
TOTAL FIRST DOWNS 130 124 Abdullah 13 113 8.7 36 1
Rushing 17 40 T. Wright 7 55 7.9 26 1
Passing 92 73 Bell 5 41 8.2 18 0
Penalty 21 11 Fuller 3 61 20.3 48 0
3rd Down: Made/Att 33/82 30/72 Pettigrew 3 29 9.7 13 0
3rd Down Pct. 40.2 41.7 Zenner 2 11 5.5 7 0
4th Down: Made/Att 3/5 2/2 Burton 2 9 4.5 6 0
4th Down Pct. 60.0 100.0 T. Jones 1 11 11.0 11 0
POSSESSION AVG. 29:50 30:10 Stafford 1 -6 -6.0 -6 0
TOTAL NET YARDS 2152 2321 TEAM 174 1801 10.4 57 11
Avg. Per Game 358.7 386.8 OPPONENTS 137 1691 12.3 50 10
Total Plays 403 378 * INTERCEPTIONS No. Yds Avg Long TD
Avg. Per Play 5.3 6.1 Quin 2 32 16.0 31t 1
NET YARDS RUSHING 399 724 Mathis 1 0 0.0 0 0
Avg. Per Game 66.5 120.7 Slay 1 0 0.0 0 0
Total Rushes 119 179 TEAM 4 32 8.0 31t 1
NET YARDS PASSING 1753 1597 OPPONENTS 10 150 15.0 40 0
Avg. Per Game 292.2 266.2 * PUNTING No. Yds Avg Net TB In Lg B
Sacked/Yards Lost 9/48 13/94 Martin 30 1379 46.0 40.1 2 12 66 0
Gross Yards 1801 1691 TEAM 30 1379 46.0 40.1 2 12 66 0
Att./Completions 275/174 186/137 OPPONENTS 25 1092 43.7 39.9 0 13 70 0
Completion Pct. 63.3 73.7 * PUNT RETURNS Ret FC Yds Avg Long TD
Had Intercepted 10 4 T. Jones 7 5 59 8.4 28 0
PUNTS/AVERAGE 30/46.0 25/43.7 Tate 4 3 36 9.0 20 0
NET PUNTING AVG. 30/40.1 25/39.9 Fuller 1 0 0 0.0 0 0
PENALTIES/YARDS 42/363 47/407 Moore 0 1 0 --- --- 0
FUMBLES/BALL LOST 12/8 10/6 TEAM 12 9 95 7.9 28 0
TOUCHDOWNS 15 20 OPPONENTS 16 6 137 8.6 31 0
Rushing 2 10 * KICKOFF RETURNS No. Yds Avg Long TD
Passing 11 10 Abdullah 10 306 30.6 48 0
Returns 2 0 T. Jones 4 100 25.0 34 0
* SCORE BY PERIODS Q1 Q2 Q3 Q4 OT PTS TEAM 14 406 29.0 48 0
TEAM 21 47 9 40 3 120 OPPONENTS 9 217 24.1 38 0
OPPONENTS 13 79 29 51 0 172 * FIELD GOALS 1-19 20-29 30-39 40-49 50+
* SCORING TD-Ru-Pa-Rt K-PAT FG S PTS Prater 0/ 0 2/ 2 2/ 2 2/ 2 0/0
Prater 0 0 0 0 12/13 6/ 6 0 30 TEAM 0/ 0 2/ 2 2/ 2 2/ 2 0/0
Abdullah 2 1 1 0 0 12 OPPONENTS 0/ 0 6/ 6 2/ 2 1/ 1 2/2
Ebron 2 0 2 0 0 12 Prater: ()(26G)()(41G)(40G)(39G,32G,27G)
C. Johnson 2 0 2 0 0 12 OPP: (32G,25G)(28G,23G)(48G)(51G,52G)()(27G,23G,
Moore 2 0 2 0 0 12 38G,29G)
Riddick 2 0 2 0 0 12
Bell 1 1 0 0 0 6
Quin 1 0 0 1 0 6
Reid 1 0 0 1 0 6
Tate 1 0 1 0 0 6
T. Wright 1 0 1 0 0 6
TEAM 15 2 11 2 12/13 6/ 6 0 120
OPPONENTS 20 10 10 0 17/19 11/11 0 172
2-Pt Conv: TM 0-2, OPP 1-1
SACKS: Ansah 5, J. Jones 1.5, Taylor 1.5,
Hunt 1, Ihedigbo 1, Lewis 1, Tapp 1,
Copeland 0.5, Wilson 0.5, TM 13, OPP 9
FUM/LOST: Abdullah 4/1, T. Jones 2/1,
Fuller 1/1, C. Johnson 1/1, Moore 1/1,
Riddick 1/1, Stafford 1/1, Tate 1/1
* PASSING Att Cmp Yds Cmp% Yds/Att TD TD% Int Int% Long Sack/Lost Rating
Stafford 237 153 1610 64.6 6.79 10 4.2 9 3.8 57 9/ 48 82.4
Orlovsky 38 21 191 55.3 5.03 1 2.6 1 2.6 23 0/ 0 66.9
TEAM 275 174 1801 63.3 6.55 11 4.0 10 3.6 57 9/ 48 80.3
OPPONENTS 186 137 1691 73.7 9.09 10 5.4 4 2.2 50 13/ 94 110.3
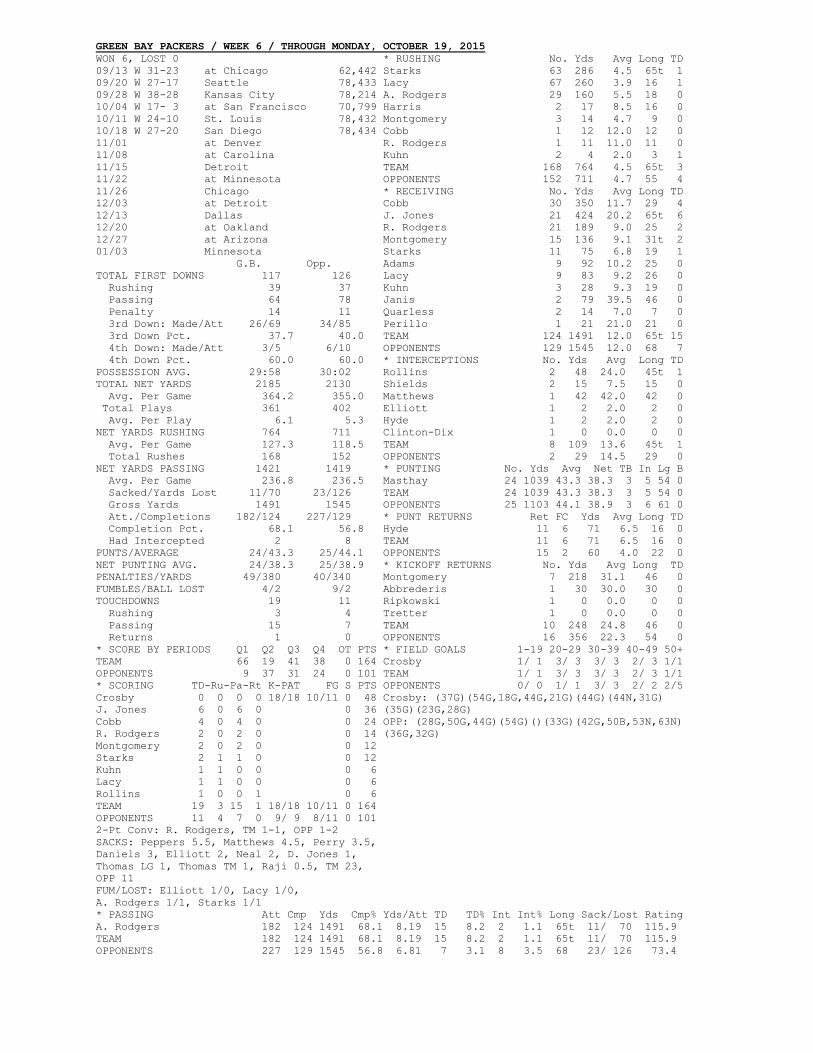
GREEN BAY PACKERS / WEEK 6 / THROUGH MONDAY, OCTOBER 19, 2015
WON 6, LOST 0 * RUSHING No. Yds Avg Long TD
09/13 W 31-23 at Chicago 62,442 Starks 63 286 4.5 65t 1
09/20 W 27-17 Seattle 78,433 Lacy 67 260 3.9 16 1
09/28 W 38-28 Kansas City 78,214 A. Rodgers 29 160 5.5 18 0
10/04 W 17- 3 at San Francisco 70,799 Harris 2 17 8.5 16 0
10/11 W 24-10 St. Louis 78,432 Montgomery 3 14 4.7 9 0
10/18 W 27-20 San Diego 78,434 Cobb 1 12 12.0 12 0
11/01 at Denver R. Rodgers 1 11 11.0 11 0
11/08 at Carolina Kuhn 2 4 2.0 3 1
11/15 Detroit TEAM 168 764 4.5 65t 3
11/22 at Minnesota OPPONENTS 152 711 4.7 55 4
11/26 Chicago * RECEIVING No. Yds Avg Long TD
12/03 at Detroit Cobb 30 350 11.7 29 4
12/13 Dallas J. Jones 21 424 20.2 65t 6
12/20 at Oakland R. Rodgers 21 189 9.0 25 2
12/27 at Arizona Montgomery 15 136 9.1 31t 2
01/03 Minnesota Starks 11 75 6.8 19 1
G.B. Opp. Adams 9 92 10.2 25 0
TOTAL FIRST DOWNS 117 126 Lacy 9 83 9.2 26 0
Rushing 39 37 Kuhn 3 28 9.3 19 0
Passing 64 78 Janis 2 79 39.5 46 0
Penalty 14 11 Quarless 2 14 7.0 7 0
3rd Down: Made/Att 26/69 34/85 Perillo 1 21 21.0 21 0
3rd Down Pct. 37.7 40.0 TEAM 124 1491 12.0 65t 15
4th Down: Made/Att 3/5 6/10 OPPONENTS 129 1545 12.0 68 7
4th Down Pct. 60.0 60.0 * INTERCEPTIONS No. Yds Avg Long TD
POSSESSION AVG. 29:58 30:02 Rollins 2 48 24.0 45t 1
TOTAL NET YARDS 2185 2130 Shields 2 15 7.5 15 0
Avg. Per Game 364.2 355.0 Matthews 1 42 42.0 42 0
Total Plays 361 402 Elliott 1 2 2.0 2 0
Avg. Per Play 6.1 5.3 Hyde 1 2 2.0 2 0
NET YARDS RUSHING 764 711 Clinton-Dix 1 0 0.0 0 0
Avg. Per Game 127.3 118.5 TEAM 8 109 13.6 45t 1
Total Rushes 168 152 OPPONENTS 2 29 14.5 29 0
NET YARDS PASSING 1421 1419 * PUNTING No. Yds Avg Net TB In Lg B
Avg. Per Game 236.8 236.5 Masthay 24 1039 43.3 38.3 3 5 54 0
Sacked/Yards Lost 11/70 23/126 TEAM 24 1039 43.3 38.3 3 5 54 0
Gross Yards 1491 1545 OPPONENTS 25 1103 44.1 38.9 3 6 61 0
Att./Completions 182/124 227/129 * PUNT RETURNS Ret FC Yds Avg Long TD
Completion Pct. 68.1 56.8 Hyde 11 6 71 6.5 16 0
Had Intercepted 2 8 TEAM 11 6 71 6.5 16 0
PUNTS/AVERAGE 24/43.3 25/44.1 OPPONENTS 15 2 60 4.0 22 0
NET PUNTING AVG. 24/38.3 25/38.9 * KICKOFF RETURNS No. Yds Avg Long TD
PENALTIES/YARDS 49/380 40/340 Montgomery 7 218 31.1 46 0
FUMBLES/BALL LOST 4/2 9/2 Abbrederis 1 30 30.0 30 0
TOUCHDOWNS 19 11 Ripkowski 1 0 0.0 0 0
Rushing 3 4 Tretter 1 0 0.0 0 0
Passing 15 7 TEAM 10 248 24.8 46 0
Returns 1 0 OPPONENTS 16 356 22.3 54 0
* SCORE BY PERIODS Q1 Q2 Q3 Q4 OT PTS * FIELD GOALS 1-19 20-29 30-39 40-49 50+
TEAM 66 19 41 38 0 164 Crosby 1/ 1 3/ 3 3/ 3 2/ 3 1/1
OPPONENTS 9 37 31 24 0 101 TEAM 1/ 1 3/ 3 3/ 3 2/ 3 1/1
* SCORING TD-Ru-Pa-Rt K-PAT FG S PTS OPPONENTS 0/ 0 1/ 1 3/ 3 2/ 2 2/5
Crosby 0 0 0 0 18/18 10/11 0 48 Crosby: (37G)(54G,18G,44G,21G)(44G)(44N,31G)
J. Jones 6 0 6 0 0 36 (35G)(23G,28G)
Cobb 4 0 4 0 0 24 OPP: (28G,50G,44G)(54G)()(33G)(42G,50B,53N,63N)
R. Rodgers 2 0 2 0 0 14 (36G,32G)
Montgomery 2 0 2 0 0 12
Starks 2 1 1 0 0 12
Kuhn 1 1 0 0 0 6
Lacy 1 1 0 0 0 6
Rollins 1 0 0 1 0 6
TEAM 19 3 15 1 18/18 10/11 0 164
OPPONENTS 11 4 7 0 9/ 9 8/11 0 101
2-Pt Conv: R. Rodgers, TM 1-1, OPP 1-2
SACKS: Peppers 5.5, Matthews 4.5, Perry 3.5,
Daniels 3, Elliott 2, Neal 2, D. Jones 1,
Thomas LG 1, Thomas TM 1, Raji 0.5, TM 23,
OPP 11
FUM/LOST: Elliott 1/0, Lacy 1/0,
A. Rodgers 1/1, Starks 1/1
* PASSING Att Cmp Yds Cmp% Yds/Att TD TD% Int Int% Long Sack/Lost Rating
A. Rodgers 182 124 1491 68.1 8.19 15 8.2 2 1.1 65t 11/ 70 115.9
TEAM 182 124 1491 68.1 8.19 15 8.2 2 1.1 65t 11/ 70 115.9
OPPONENTS 227 129 1545 56.8 6.81 7 3.1 8 3.5 68 23/ 126 73.4
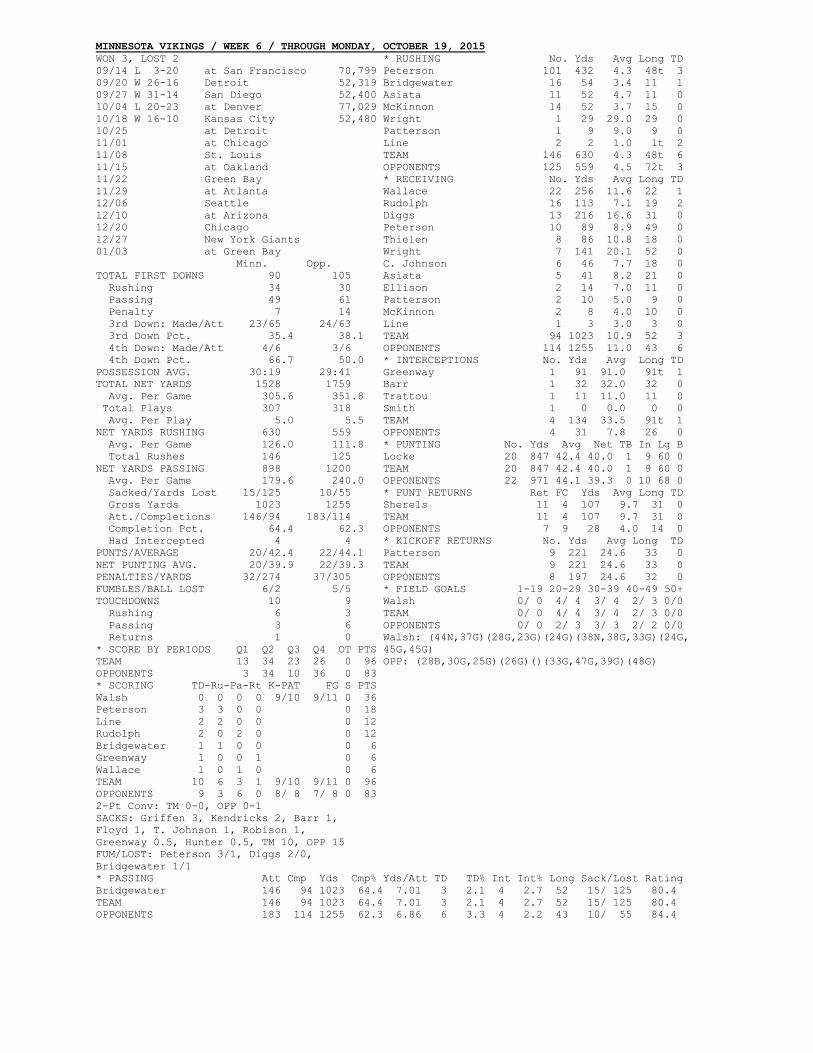
MINNESOTA VIKINGS / WEEK 6 / THROUGH MONDAY, OCTOBER 19, 2015
WON 3, LOST 2 * RUSHING No. Yds Avg Long TD
09/14 L 3-20 at San Francisco 70,799 Peterson 101 432 4.3 48t 3
09/20 W 26-16 Detroit 52,319 Bridgewater 16 54 3.4 11 1
09/27 W 31-14 San Diego 52,400 Asiata 11 52 4.7 11 0
10/04 L 20-23 at Denver 77,029 McKinnon 14 52 3.7 15 0
10/18 W 16-10 Kansas City 52,480 Wright 1 29 29.0 29 0
10/25 at Detroit Patterson 1 9 9.0 9 0
11/01 at Chicago Line 2 2 1.0 1t 2
11/08 St. Louis TEAM 146 630 4.3 48t 6
11/15 at Oakland OPPONENTS 125 559 4.5 72t 3
11/22 Green Bay * RECEIVING No. Yds Avg Long TD
11/29 at Atlanta Wallace 22 256 11.6 22 1
12/06 Seattle Rudolph 16 113 7.1 19 2
12/10 at Arizona Diggs 13 216 16.6 31 0
12/20 Chicago Peterson 10 89 8.9 49 0
12/27 New York Giants Thielen 8 86 10.8 18 0
01/03 at Green Bay Wright 7 141 20.1 52 0
Minn. Opp. C. Johnson 6 46 7.7 18 0
TOTAL FIRST DOWNS 90 105 Asiata 5 41 8.2 21 0
Rushing 34 30 Ellison 2 14 7.0 11 0
Passing 49 61 Patterson 2 10 5.0 9 0
Penalty 7 14 McKinnon 2 8 4.0 10 0
3rd Down: Made/Att 23/65 24/63 Line 1 3 3.0 3 0
3rd Down Pct. 35.4 38.1 TEAM 94 1023 10.9 52 3
4th Down: Made/Att 4/6 3/6 OPPONENTS 114 1255 11.0 43 6
4th Down Pct. 66.7 50.0 * INTERCEPTIONS No. Yds Avg Long TD
POSSESSION AVG. 30:19 29:41 Greenway 1 91 91.0 91t 1
TOTAL NET YARDS 1528 1759 Barr 1 32 32.0 32 0
Avg. Per Game 305.6 351.8 Trattou 1 11 11.0 11 0
Total Plays 307 318 Smith 1 0 0.0 0 0
Avg. Per Play 5.0 5.5 TEAM 4 134 33.5 91t 1
NET YARDS RUSHING 630 559 OPPONENTS 4 31 7.8 26 0
Avg. Per Game 126.0 111.8 * PUNTING No. Yds Avg Net TB In Lg B
Total Rushes 146 125 Locke 20 847 42.4 40.0 1 9 60 0
NET YARDS PASSING 898 1200 TEAM 20 847 42.4 40.0 1 9 60 0
Avg. Per Game 179.6 240.0 OPPONENTS 22 971 44.1 39.3 0 10 68 0
Sacked/Yards Lost 15/125 10/55 * PUNT RETURNS Ret FC Yds Avg Long TD
Gross Yards 1023 1255 Sherels 11 4 107 9.7 31 0
Att./Completions 146/94 183/114 TEAM 11 4 107 9.7 31 0
Completion Pct. 64.4 62.3 OPPONENTS 7 9 28 4.0 14 0
Had Intercepted 4 4 * KICKOFF RETURNS No. Yds Avg Long TD
PUNTS/AVERAGE 20/42.4 22/44.1 Patterson 9 221 24.6 33 0
NET PUNTING AVG. 20/39.9 22/39.3 TEAM 9 221 24.6 33 0
PENALTIES/YARDS 32/274 37/305 OPPONENTS 8 197 24.6 32 0
FUMBLES/BALL LOST 6/2 5/5 * FIELD GOALS 1-19 20-29 30-39 40-49 50+
TOUCHDOWNS 10 9 Walsh 0/ 0 4/ 4 3/ 4 2/ 3 0/0
Rushing 6 3 TEAM 0/ 0 4/ 4 3/ 4 2/ 3 0/0
Passing 3 6 OPPONENTS 0/ 0 2/ 3 3/ 3 2/ 2 0/0
Returns 1 0 Walsh: (44N,37G)(28G,23G)(24G)(38N,38G,33G)(24G,
* SCORE BY PERIODS Q1 Q2 Q3 Q4 OT PTS 45G,45G)
TEAM 13 34 23 26 0 96 OPP: (28B,30G,25G)(26G)()(33G,47G,39G)(48G)
OPPONENTS 3 34 10 36 0 83
* SCORING TD-Ru-Pa-Rt K-PAT FG S PTS
Walsh 0 0 0 0 9/10 9/11 0 36
Peterson 3 3 0 0 0 18
Line 2 2 0 0 0 12
Rudolph 2 0 2 0 0 12
Bridgewater 1 1 0 0 0 6
Greenway 1 0 0 1 0 6
Wallace 1 0 1 0 0 6
TEAM 10 6 3 1 9/10 9/11 0 96
OPPONENTS 9 3 6 0 8/ 8 7/ 8 0 83
2-Pt Conv: TM 0-0, OPP 0-1
SACKS: Griffen 3, Kendricks 2, Barr 1,
Floyd 1, T. Johnson 1, Robison 1,
Greenway 0.5, Hunter 0.5, TM 10, OPP 15
FUM/LOST: Peterson 3/1, Diggs 2/0,
Bridgewater 1/1
* PASSING Att Cmp Yds Cmp% Yds/Att TD TD% Int Int% Long Sack/Lost Rating
Bridgewater 146 94 1023 64.4 7.01 3 2.1 4 2.7 52 15/ 125 80.4
TEAM 146 94 1023 64.4 7.01 3 2.1 4 2.7 52 15/ 125 80.4
OPPONENTS 183 114 1255 62.3 6.86 6 3.3 4 2.2 43 10/ 55 84.4
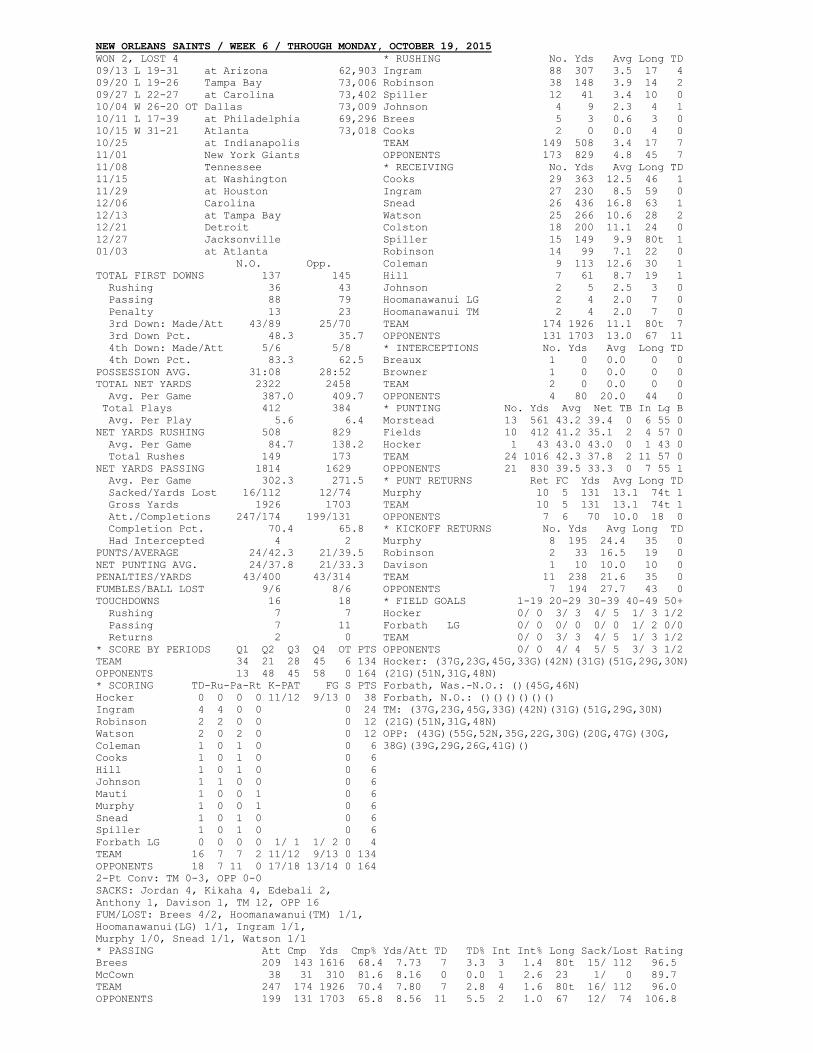
NEW ORLEANS SAINTS / WEEK 6 / THROUGH MONDAY, OCTOBER 19, 2015
WON 2, LOST 4 * RUSHING No. Yds Avg Long TD
09/13 L 19-31 at Arizona 62,903 Ingram 88 307 3.5 17 4
09/20 L 19-26 Tampa Bay 73,006 Robinson 38 148 3.9 14 2
09/27 L 22-27 at Carolina 73,402 Spiller 12 41 3.4 10 0
10/04 W 26-20 OT Dallas 73,009 Johnson 4 9 2.3 4 1
10/11 L 17-39 at Philadelphia 69,296 Brees 5 3 0.6 3 0
10/15 W 31-21 Atlanta 73,018 Cooks 2 0 0.0 4 0
10/25 at Indianapolis TEAM 149 508 3.4 17 7
11/01 New York Giants OPPONENTS 173 829 4.8 45 7
11/08 Tennessee * RECEIVING No. Yds Avg Long TD
11/15 at Washington Cooks 29 363 12.5 46 1
11/29 at Houston Ingram 27 230 8.5 59 0
12/06 Carolina Snead 26 436 16.8 63 1
12/13 at Tampa Bay Watson 25 266 10.6 28 2
12/21 Detroit Colston 18 200 11.1 24 0
12/27 Jacksonville Spiller 15 149 9.9 80t 1
01/03 at Atlanta Robinson 14 99 7.1 22 0
N.O. Opp. Coleman 9 113 12.6 30 1
TOTAL FIRST DOWNS 137 145 Hill 7 61 8.7 19 1
Rushing 36 43 Johnson 2 5 2.5 3 0
Passing 88 79 Hoomanawanui LG 2 4 2.0 7 0
Penalty 13 23 Hoomanawanui TM 2 4 2.0 7 0
3rd Down: Made/Att 43/89 25/70 TEAM 174 1926 11.1 80t 7
3rd Down Pct. 48.3 35.7 OPPONENTS 131 1703 13.0 67 11
4th Down: Made/Att 5/6 5/8 * INTERCEPTIONS No. Yds Avg Long TD
4th Down Pct. 83.3 62.5 Breaux 1 0 0.0 0 0
POSSESSION AVG. 31:08 28:52 Browner 1 0 0.0 0 0
TOTAL NET YARDS 2322 2458 TEAM 2 0 0.0 0 0
Avg. Per Game 387.0 409.7 OPPONENTS 4 80 20.0 44 0
Total Plays 412 384 * PUNTING No. Yds Avg Net TB In Lg B
Avg. Per Play 5.6 6.4 Morstead 13 561 43.2 39.4 0 6 55 0
NET YARDS RUSHING 508 829 Fields 10 412 41.2 35.1 2 4 57 0
Avg. Per Game 84.7 138.2 Hocker 1 43 43.0 43.0 0 1 43 0
Total Rushes 149 173 TEAM 24 1016 42.3 37.8 2 11 57 0
NET YARDS PASSING 1814 1629 OPPONENTS 21 830 39.5 33.3 0 7 55 1
Avg. Per Game 302.3 271.5 * PUNT RETURNS Ret FC Yds Avg Long TD
Sacked/Yards Lost 16/112 12/74 Murphy 10 5 131 13.1 74t 1
Gross Yards 1926 1703 TEAM 10 5 131 13.1 74t 1
Att./Completions 247/174 199/131 OPPONENTS 7 6 70 10.0 18 0
Completion Pct. 70.4 65.8 * KICKOFF RETURNS No. Yds Avg Long TD
Had Intercepted 4 2 Murphy 8 195 24.4 35 0
PUNTS/AVERAGE 24/42.3 21/39.5 Robinson 2 33 16.5 19 0
NET PUNTING AVG. 24/37.8 21/33.3 Davison 1 10 10.0 10 0
PENALTIES/YARDS 43/400 43/314 TEAM 11 238 21.6 35 0
FUMBLES/BALL LOST 9/6 8/6 OPPONENTS 7 194 27.7 43 0
TOUCHDOWNS 16 18 * FIELD GOALS 1-19 20-29 30-39 40-49 50+
Rushing 7 7 Hocker 0/ 0 3/ 3 4/ 5 1/ 3 1/2
Passing 7 11 Forbath LG 0/ 0 0/ 0 0/ 0 1/ 2 0/0
Returns 2 0 TEAM 0/ 0 3/ 3 4/ 5 1/ 3 1/2
* SCORE BY PERIODS Q1 Q2 Q3 Q4 OT PTS OPPONENTS 0/ 0 4/ 4 5/ 5 3/ 3 1/2
TEAM 34 21 28 45 6 134 Hocker: (37G,23G,45G,33G)(42N)(31G)(51G,29G,30N)
OPPONENTS 13 48 45 58 0 164 (21G)(51N,31G,48N)
* SCORING TD-Ru-Pa-Rt K-PAT FG S PTS Forbath, Was.-N.O.: ()(45G,46N)
Hocker 0 0 0 0 11/12 9/13 0 38 Forbath, N.O.: ()()()()()()
Ingram 4 4 0 0 0 24 TM: (37G,23G,45G,33G)(42N)(31G)(51G,29G,30N)
Robinson 2 2 0 0 0 12 (21G)(51N,31G,48N)
Watson 2 0 2 0 0 12 OPP: (43G)(55G,52N,35G,22G,30G)(20G,47G)(30G,
Coleman 1 0 1 0 0 6 38G)(39G,29G,26G,41G)()
Cooks 1 0 1 0 0 6
Hill 1 0 1 0 0 6
Johnson 1 1 0 0 0 6
Mauti 1 0 0 1 0 6
Murphy 1 0 0 1 0 6
Snead 1 0 1 0 0 6
Spiller 1 0 1 0 0 6
Forbath LG 0 0 0 0 1/ 1 1/ 2 0 4
TEAM 16 7 7 2 11/12 9/13 0 134
OPPONENTS 18 7 11 0 17/18 13/14 0 164
2-Pt Conv: TM 0-3, OPP 0-0
SACKS: Jordan 4, Kikaha 4, Edebali 2,
Anthony 1, Davison 1, TM 12, OPP 16
FUM/LOST: Brees 4/2, Hoomanawanui(TM) 1/1,
Hoomanawanui(LG) 1/1, Ingram 1/1,
Murphy 1/0, Snead 1/1, Watson 1/1
* PASSING Att Cmp Yds Cmp% Yds/Att TD TD% Int Int% Long Sack/Lost Rating
Brees 209 143 1616 68.4 7.73 7 3.3 3 1.4 80t 15/ 112 96.5
McCown 38 31 310 81.6 8.16 0 0.0 1 2.6 23 1/ 0 89.7
TEAM 247 174 1926 70.4 7.80 7 2.8 4 1.6 80t 16/ 112 96.0
OPPONENTS 199 131 1703 65.8 8.56 11 5.5 2 1.0 67 12/ 74 106.8
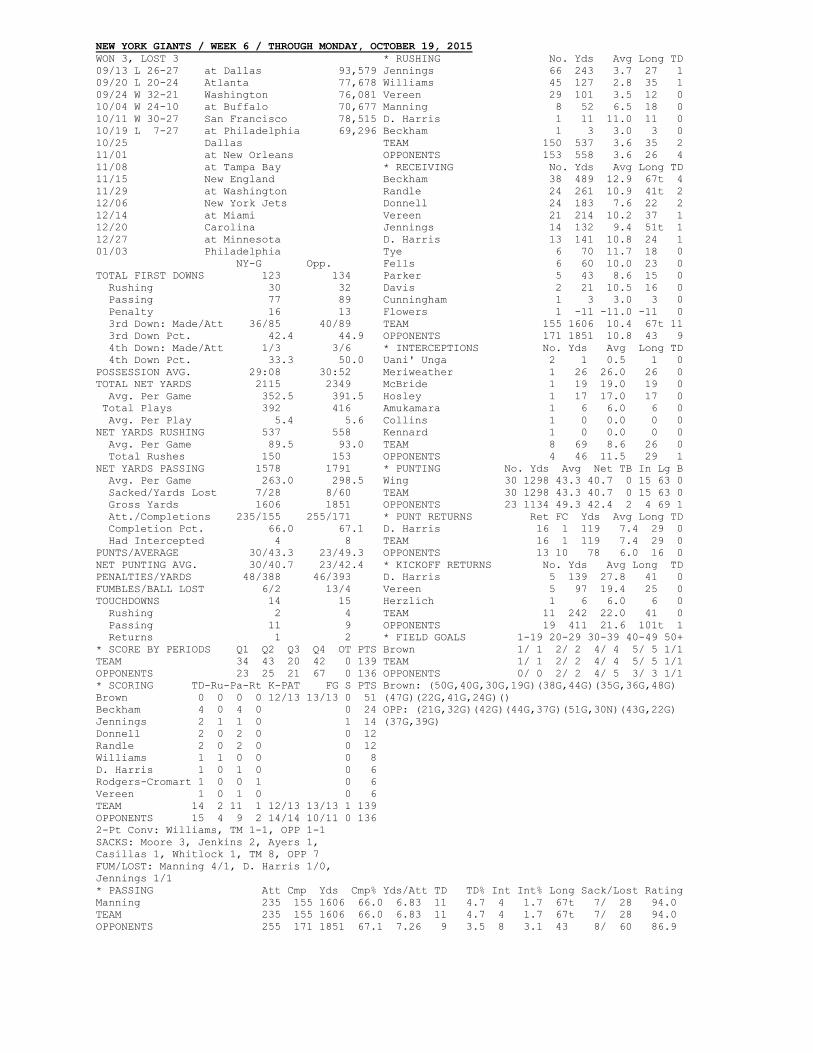
NEW YORK GIANTS / WEEK 6 / THROUGH MONDAY, OCTOBER 19, 2015
WON 3, LOST 3 * RUSHING No. Yds Avg Long TD
09/13 L 26-27 at Dallas 93,579 Jennings 66 243 3.7 27 1
09/20 L 20-24 Atlanta 77,678 Williams 45 127 2.8 35 1
09/24 W 32-21 Washington 76,081 Vereen 29 101 3.5 12 0
10/04 W 24-10 at Buffalo 70,677 Manning 8 52 6.5 18 0
10/11 W 30-27 San Francisco 78,515 D. Harris 1 11 11.0 11 0
10/19 L 7-27 at Philadelphia 69,296 Beckham 1 3 3.0 3 0
10/25 Dallas TEAM 150 537 3.6 35 2
11/01 at New Orleans OPPONENTS 153 558 3.6 26 4
11/08 at Tampa Bay * RECEIVING No. Yds Avg Long TD
11/15 New England Beckham 38 489 12.9 67t 4
11/29 at Washington Randle 24 261 10.9 41t 2
12/06 New York Jets Donnell 24 183 7.6 22 2
12/14 at Miami Vereen 21 214 10.2 37 1
12/20 Carolina Jennings 14 132 9.4 51t 1
12/27 at Minnesota D. Harris 13 141 10.8 24 1
01/03 Philadelphia Tye 6 70 11.7 18 0
NY-G Opp. Fells 6 60 10.0 23 0
TOTAL FIRST DOWNS 123 134 Parker 5 43 8.6 15 0
Rushing 30 32 Davis 2 21 10.5 16 0
Passing 77 89 Cunningham 1 3 3.0 3 0
Penalty 16 13 Flowers 1 -11 -11.0 -11 0
3rd Down: Made/Att 36/85 40/89 TEAM 155 1606 10.4 67t 11
3rd Down Pct. 42.4 44.9 OPPONENTS 171 1851 10.8 43 9
4th Down: Made/Att 1/3 3/6 * INTERCEPTIONS No. Yds Avg Long TD
4th Down Pct. 33.3 50.0 Uani' Unga 2 1 0.5 1 0
POSSESSION AVG. 29:08 30:52 Meriweather 1 26 26.0 26 0
TOTAL NET YARDS 2115 2349 McBride 1 19 19.0 19 0
Avg. Per Game 352.5 391.5 Hosley 1 17 17.0 17 0
Total Plays 392 416 Amukamara 1 6 6.0 6 0
Avg. Per Play 5.4 5.6 Collins 1 0 0.0 0 0
NET YARDS RUSHING 537 558 Kennard 1 0 0.0 0 0
Avg. Per Game 89.5 93.0 TEAM 8 69 8.6 26 0
Total Rushes 150 153 OPPONENTS 4 46 11.5 29 1
NET YARDS PASSING 1578 1791 * PUNTING No. Yds Avg Net TB In Lg B
Avg. Per Game 263.0 298.5 Wing 30 1298 43.3 40.7 0 15 63 0
Sacked/Yards Lost 7/28 8/60 TEAM 30 1298 43.3 40.7 0 15 63 0
Gross Yards 1606 1851 OPPONENTS 23 1134 49.3 42.4 2 4 69 1
Att./Completions 235/155 255/171 * PUNT RETURNS Ret FC Yds Avg Long TD
Completion Pct. 66.0 67.1 D. Harris 16 1 119 7.4 29 0
Had Intercepted 4 8 TEAM 16 1 119 7.4 29 0
PUNTS/AVERAGE 30/43.3 23/49.3 OPPONENTS 13 10 78 6.0 16 0
NET PUNTING AVG. 30/40.7 23/42.4 * KICKOFF RETURNS No. Yds Avg Long TD
PENALTIES/YARDS 48/388 46/393 D. Harris 5 139 27.8 41 0
FUMBLES/BALL LOST 6/2 13/4 Vereen 5 97 19.4 25 0
TOUCHDOWNS 14 15 Herzlich 1 6 6.0 6 0
Rushing 2 4 TEAM 11 242 22.0 41 0
Passing 11 9 OPPONENTS 19 411 21.6 101t 1
Returns 1 2 * FIELD GOALS 1-19 20-29 30-39 40-49 50+
* SCORE BY PERIODS Q1 Q2 Q3 Q4 OT PTS Brown 1/ 1 2/ 2 4/ 4 5/ 5 1/1
TEAM 34 43 20 42 0 139 TEAM 1/ 1 2/ 2 4/ 4 5/ 5 1/1
OPPONENTS 23 25 21 67 0 136 OPPONENTS 0/ 0 2/ 2 4/ 5 3/ 3 1/1
* SCORING TD-Ru-Pa-Rt K-PAT FG S PTS Brown: (50G,40G,30G,19G)(38G,44G)(35G,36G,48G)
Brown 0 0 0 0 12/13 13/13 0 51 (47G)(22G,41G,24G)()
Beckham 4 0 4 0 0 24 OPP: (21G,32G)(42G)(44G,37G)(51G,30N)(43G,22G)
Jennings 2 1 1 0 1 14 (37G,39G)
Donnell 2 0 2 0 0 12
Randle 2 0 2 0 0 12
Williams 1 1 0 0 0 8
D. Harris 1 0 1 0 0 6
Rodgers-Cromart 1 0 0 1 0 6
Vereen 1 0 1 0 0 6
TEAM 14 2 11 1 12/13 13/13 1 139
OPPONENTS 15 4 9 2 14/14 10/11 0 136
2-Pt Conv: Williams, TM 1-1, OPP 1-1
SACKS: Moore 3, Jenkins 2, Ayers 1,
Casillas 1, Whitlock 1, TM 8, OPP 7
FUM/LOST: Manning 4/1, D. Harris 1/0,
Jennings 1/1
* PASSING Att Cmp Yds Cmp% Yds/Att TD TD% Int Int% Long Sack/Lost Rating
Manning 235 155 1606 66.0 6.83 11 4.7 4 1.7 67t 7/ 28 94.0
TEAM 235 155 1606 66.0 6.83 11 4.7 4 1.7 67t 7/ 28 94.0
OPPONENTS 255 171 1851 67.1 7.26 9 3.5 8 3.1 43 8/ 60 86.9
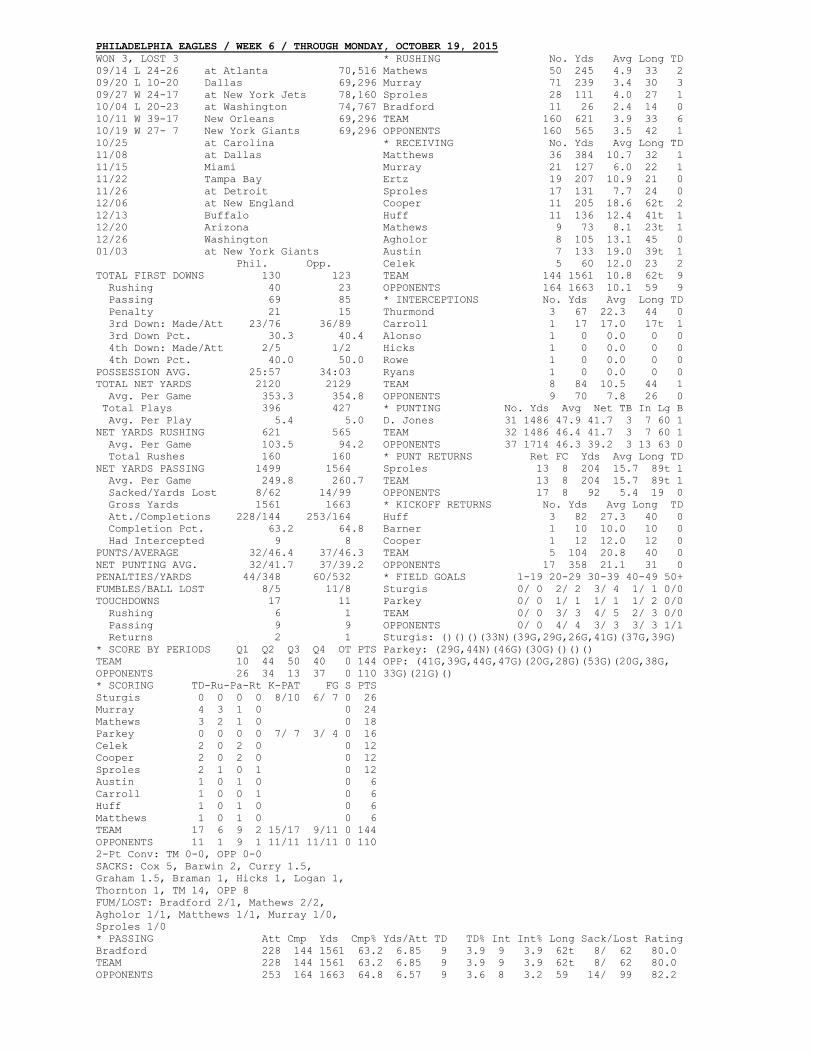
PHILADELPHIA EAGLES / WEEK 6 / THROUGH MONDAY, OCTOBER 19, 2015
WON 3, LOST 3 * RUSHING No. Yds Avg Long TD
09/14 L 24-26 at Atlanta 70,516 Mathews 50 245 4.9 33 2
09/20 L 10-20 Dallas 69,296 Murray 71 239 3.4 30 3
09/27 W 24-17 at New York Jets 78,160 Sproles 28 111 4.0 27 1
10/04 L 20-23 at Washington 74,767 Bradford 11 26 2.4 14 0
10/11 W 39-17 New Orleans 69,296 TEAM 160 621 3.9 33 6
10/19 W 27- 7 New York Giants 69,296 OPPONENTS 160 565 3.5 42 1
10/25 at Carolina * RECEIVING No. Yds Avg Long TD
11/08 at Dallas Matthews 36 384 10.7 32 1
11/15 Miami Murray 21 127 6.0 22 1
11/22 Tampa Bay Ertz 19 207 10.9 21 0
11/26 at Detroit Sproles 17 131 7.7 24 0
12/06 at New England Cooper 11 205 18.6 62t 2
12/13 Buffalo Huff 11 136 12.4 41t 1
12/20 Arizona Mathews 9 73 8.1 23t 1
12/26 Washington Agholor 8 105 13.1 45 0
01/03 at New York Giants Austin 7 133 19.0 39t 1
Phil. Opp. Celek 5 60 12.0 23 2
TOTAL FIRST DOWNS 130 123 TEAM 144 1561 10.8 62t 9
Rushing 40 23 OPPONENTS 164 1663 10.1 59 9
Passing 69 85 * INTERCEPTIONS No. Yds Avg Long TD
Penalty 21 15 Thurmond 3 67 22.3 44 0
3rd Down: Made/Att 23/76 36/89 Carroll 1 17 17.0 17t 1
3rd Down Pct. 30.3 40.4 Alonso 1 0 0.0 0 0
4th Down: Made/Att 2/5 1/2 Hicks 1 0 0.0 0 0
4th Down Pct. 40.0 50.0 Rowe 1 0 0.0 0 0
POSSESSION AVG. 25:57 34:03 Ryans 1 0 0.0 0 0
TOTAL NET YARDS 2120 2129 TEAM 8 84 10.5 44 1
Avg. Per Game 353.3 354.8 OPPONENTS 9 70 7.8 26 0
Total Plays 396 427 * PUNTING No. Yds Avg Net TB In Lg B
Avg. Per Play 5.4 5.0 D. Jones 31 1486 47.9 41.7 3 7 60 1
NET YARDS RUSHING 621 565 TEAM 32 1486 46.4 41.7 3 7 60 1
Avg. Per Game 103.5 94.2 OPPONENTS 37 1714 46.3 39.2 3 13 63 0
Total Rushes 160 160 * PUNT RETURNS Ret FC Yds Avg Long TD
NET YARDS PASSING 1499 1564 Sproles 13 8 204 15.7 89t 1
Avg. Per Game 249.8 260.7 TEAM 13 8 204 15.7 89t 1
Sacked/Yards Lost 8/62 14/99 OPPONENTS 17 8 92 5.4 19 0
Gross Yards 1561 1663 * KICKOFF RETURNS No. Yds Avg Long TD
Att./Completions 228/144 253/164 Huff 3 82 27.3 40 0
Completion Pct. 63.2 64.8 Barner 1 10 10.0 10 0
Had Intercepted 9 8 Cooper 1 12 12.0 12 0
PUNTS/AVERAGE 32/46.4 37/46.3 TEAM 5 104 20.8 40 0
NET PUNTING AVG. 32/41.7 37/39.2 OPPONENTS 17 358 21.1 31 0
PENALTIES/YARDS 44/348 60/532 * FIELD GOALS 1-19 20-29 30-39 40-49 50+
FUMBLES/BALL LOST 8/5 11/8 Sturgis 0/ 0 2/ 2 3/ 4 1/ 1 0/0
TOUCHDOWNS 17 11 Parkey 0/ 0 1/ 1 1/ 1 1/ 2 0/0
Rushing 6 1 TEAM 0/ 0 3/ 3 4/ 5 2/ 3 0/0
Passing 9 9 OPPONENTS 0/ 0 4/ 4 3/ 3 3/ 3 1/1
Returns 2 1 Sturgis: ()()()(33N)(39G,29G,26G,41G)(37G,39G)
* SCORE BY PERIODS Q1 Q2 Q3 Q4 OT PTS Parkey: (29G,44N)(46G)(30G)()()()
TEAM 10 44 50 40 0 144 OPP: (41G,39G,44G,47G)(20G,28G)(53G)(20G,38G,
OPPONENTS 26 34 13 37 0 110 33G)(21G)()
* SCORING TD-Ru-Pa-Rt K-PAT FG S PTS
Sturgis 0 0 0 0 8/10 6/ 7 0 26
Murray 4 3 1 0 0 24
Mathews 3 2 1 0 0 18
Parkey 0 0 0 0 7/ 7 3/ 4 0 16
Celek 2 0 2 0 0 12
Cooper 2 0 2 0 0 12
Sproles 2 1 0 1 0 12
Austin 1 0 1 0 0 6
Carroll 1 0 0 1 0 6
Huff 1 0 1 0 0 6
Matthews 1 0 1 0 0 6
TEAM 17 6 9 2 15/17 9/11 0 144
OPPONENTS 11 1 9 1 11/11 11/11 0 110
2-Pt Conv: TM 0-0, OPP 0-0
SACKS: Cox 5, Barwin 2, Curry 1.5,
Graham 1.5, Braman 1, Hicks 1, Logan 1,
Thornton 1, TM 14, OPP 8
FUM/LOST: Bradford 2/1, Mathews 2/2,
Agholor 1/1, Matthews 1/1, Murray 1/0,
Sproles 1/0
* PASSING Att Cmp Yds Cmp% Yds/Att TD TD% Int Int% Long Sack/Lost Rating
Bradford 228 144 1561 63.2 6.85 9 3.9 9 3.9 62t 8/ 62 80.0
TEAM 228 144 1561 63.2 6.85 9 3.9 9 3.9 62t 8/ 62 80.0
OPPONENTS 253 164 1663 64.8 6.57 9 3.6 8 3.2 59 14/ 99 82.2
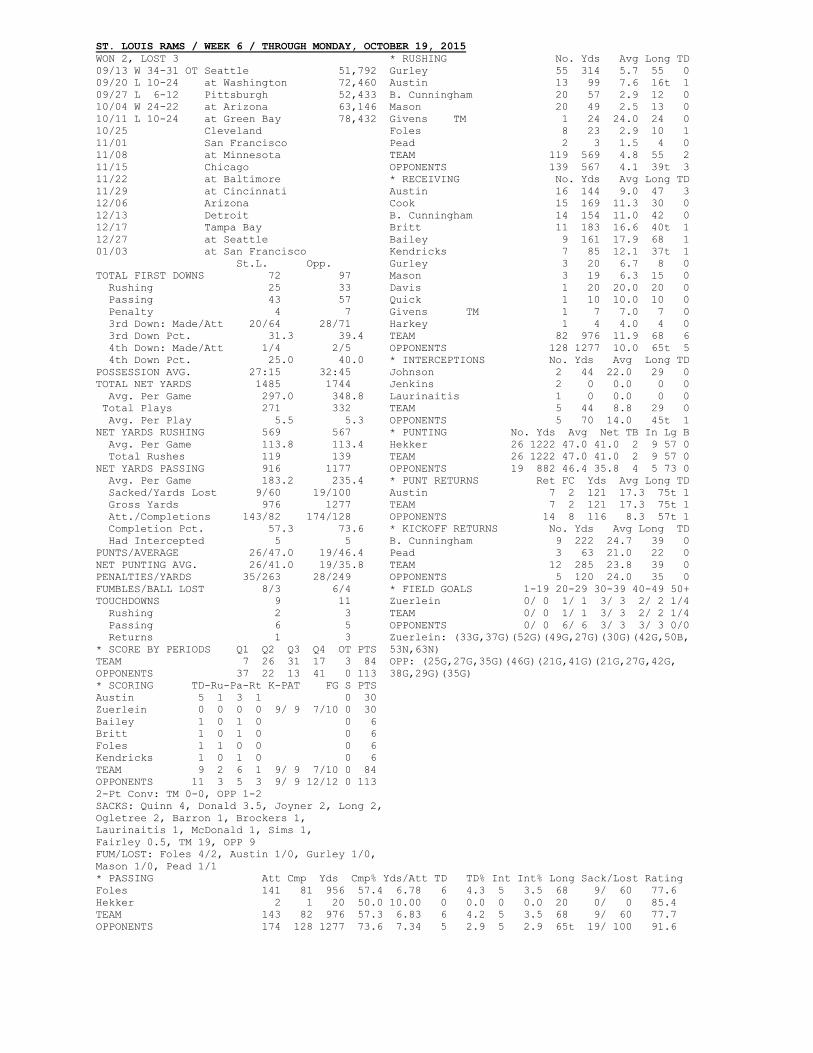
ST. LOUIS RAMS / WEEK 6 / THROUGH MONDAY, OCTOBER 19, 2015
WON 2, LOST 3 * RUSHING No. Yds Avg Long TD
09/13 W 34-31 OT Seattle 51,792 Gurley 55 314 5.7 55 0
09/20 L 10-24 at Washington 72,460 Austin 13 99 7.6 16t 1
09/27 L 6-12 Pittsburgh 52,433 B. Cunningham 20 57 2.9 12 0
10/04 W 24-22 at Arizona 63,146 Mason 20 49 2.5 13 0
10/11 L 10-24 at Green Bay 78,432 Givens TM 1 24 24.0 24 0
10/25 Cleveland Foles 8 23 2.9 10 1
11/01 San Francisco Pead 2 3 1.5 4 0
11/08 at Minnesota TEAM 119 569 4.8 55 2
11/15 Chicago OPPONENTS 139 567 4.1 39t 3
11/22 at Baltimore * RECEIVING No. Yds Avg Long TD
11/29 at Cincinnati Austin 16 144 9.0 47 3
12/06 Arizona Cook 15 169 11.3 30 0
12/13 Detroit B. Cunningham 14 154 11.0 42 0
12/17 Tampa Bay Britt 11 183 16.6 40t 1
12/27 at Seattle Bailey 9 161 17.9 68 1
01/03 at San Francisco Kendricks 7 85 12.1 37t 1
St.L. Opp. Gurley 3 20 6.7 8 0
TOTAL FIRST DOWNS 72 97 Mason 3 19 6.3 15 0
Rushing 25 33 Davis 1 20 20.0 20 0
Passing 43 57 Quick 1 10 10.0 10 0
Penalty 4 7 Givens TM 1 7 7.0 7 0
3rd Down: Made/Att 20/64 28/71 Harkey 1 4 4.0 4 0
3rd Down Pct. 31.3 39.4 TEAM 82 976 11.9 68 6
4th Down: Made/Att 1/4 2/5 OPPONENTS 128 1277 10.0 65t 5
4th Down Pct. 25.0 40.0 * INTERCEPTIONS No. Yds Avg Long TD
POSSESSION AVG. 27:15 32:45 Johnson 2 44 22.0 29 0
TOTAL NET YARDS 1485 1744 Jenkins 2 0 0.0 0 0
Avg. Per Game 297.0 348.8 Laurinaitis 1 0 0.0 0 0
Total Plays 271 332 TEAM 5 44 8.8 29 0
Avg. Per Play 5.5 5.3 OPPONENTS 5 70 14.0 45t 1
NET YARDS RUSHING 569 567 * PUNTING No. Yds Avg Net TB In Lg B
Avg. Per Game 113.8 113.4 Hekker 26 1222 47.0 41.0 2 9 57 0
Total Rushes 119 139 TEAM 26 1222 47.0 41.0 2 9 57 0
NET YARDS PASSING 916 1177 OPPONENTS 19 882 46.4 35.8 4 5 73 0
Avg. Per Game 183.2 235.4 * PUNT RETURNS Ret FC Yds Avg Long TD
Sacked/Yards Lost 9/60 19/100 Austin 7 2 121 17.3 75t 1
Gross Yards 976 1277 TEAM 7 2 121 17.3 75t 1
Att./Completions 143/82 174/128 OPPONENTS 14 8 116 8.3 57t 1
Completion Pct. 57.3 73.6 * KICKOFF RETURNS No. Yds Avg Long TD
Had Intercepted 5 5 B. Cunningham 9 222 24.7 39 0
PUNTS/AVERAGE 26/47.0 19/46.4 Pead 3 63 21.0 22 0
NET PUNTING AVG. 26/41.0 19/35.8 TEAM 12 285 23.8 39 0
PENALTIES/YARDS 35/263 28/249 OPPONENTS 5 120 24.0 35 0
FUMBLES/BALL LOST 8/3 6/4 * FIELD GOALS 1-19 20-29 30-39 40-49 50+
TOUCHDOWNS 9 11 Zuerlein 0/ 0 1/ 1 3/ 3 2/ 2 1/4
Rushing 2 3 TEAM 0/ 0 1/ 1 3/ 3 2/ 2 1/4
Passing 6 5 OPPONENTS 0/ 0 6/ 6 3/ 3 3/ 3 0/0
Returns 1 3 Zuerlein: (33G,37G)(52G)(49G,27G)(30G)(42G,50B,
* SCORE BY PERIODS Q1 Q2 Q3 Q4 OT PTS 53N,63N)
TEAM 7 26 31 17 3 84 OPP: (25G,27G,35G)(46G)(21G,41G)(21G,27G,42G,
OPPONENTS 37 22 13 41 0 113 38G,29G)(35G)
* SCORING TD-Ru-Pa-Rt K-PAT FG S PTS
Austin 5 1 3 1 0 30
Zuerlein 0 0 0 0 9/ 9 7/10 0 30
Bailey 1 0 1 0 0 6
Britt 1 0 1 0 0 6
Foles 1 1 0 0 0 6
Kendricks 1 0 1 0 0 6
TEAM 9 2 6 1 9/ 9 7/10 0 84
OPPONENTS 11 3 5 3 9/ 9 12/12 0 113
2-Pt Conv: TM 0-0, OPP 1-2
SACKS: Quinn 4, Donald 3.5, Joyner 2, Long 2,
Ogletree 2, Barron 1, Brockers 1,
Laurinaitis 1, McDonald 1, Sims 1,
Fairley 0.5, TM 19, OPP 9
FUM/LOST: Foles 4/2, Austin 1/0, Gurley 1/0,
Mason 1/0, Pead 1/1
* PASSING Att Cmp Yds Cmp% Yds/Att TD TD% Int Int% Long Sack/Lost Rating
Foles 141 81 956 57.4 6.78 6 4.3 5 3.5 68 9/ 60 77.6
Hekker 2 1 20 50.0 10.00 0 0.0 0 0.0 20 0/ 0 85.4
TEAM 143 82 976 57.3 6.83 6 4.2 5 3.5 68 9/ 60 77.7
OPPONENTS 174 128 1277 73.6 7.34 5 2.9 5 2.9 65t 19/ 100 91.6
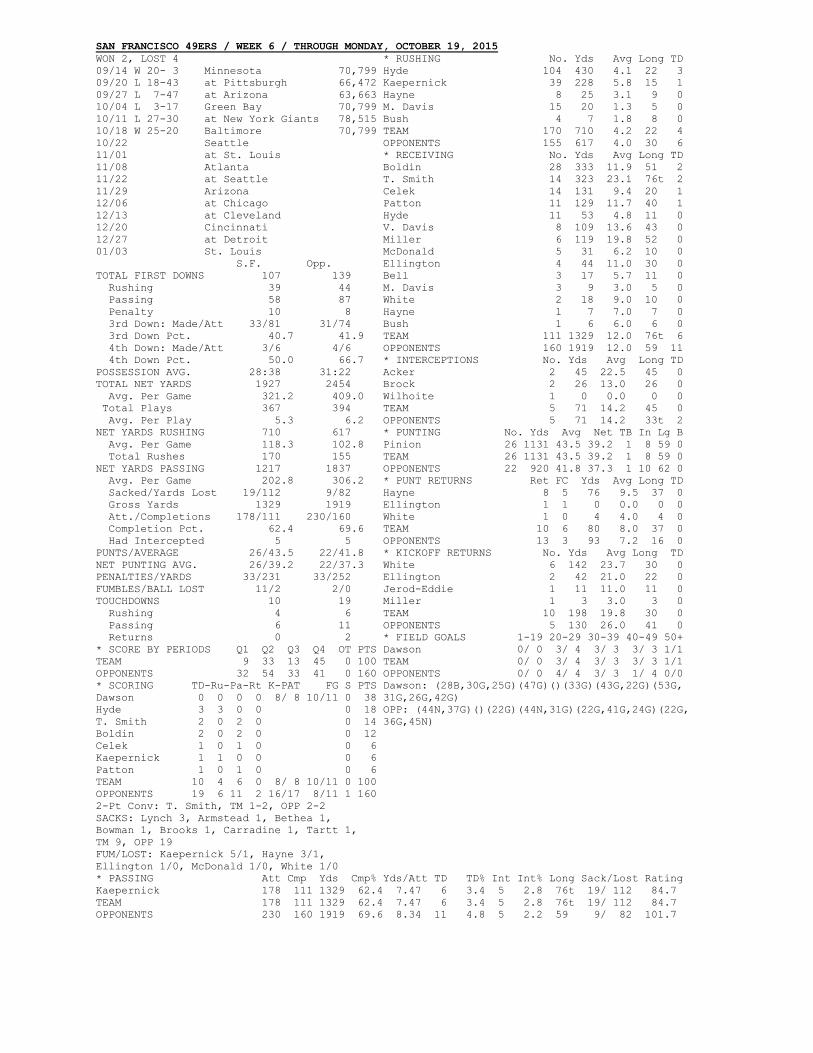
SAN FRANCISCO 49ERS / WEEK 6 / THROUGH MONDAY, OCTOBER 19, 2015
WON 2, LOST 4 * RUSHING No. Yds Avg Long TD
09/14 W 20- 3 Minnesota 70,799 Hyde 104 430 4.1 22 3
09/20 L 18-43 at Pittsburgh 66,472 Kaepernick 39 228 5.8 15 1
09/27 L 7-47 at Arizona 63,663 Hayne 8 25 3.1 9 0
10/04 L 3-17 Green Bay 70,799 M. Davis 15 20 1.3 5 0
10/11 L 27-30 at New York Giants 78,515 Bush 4 7 1.8 8 0
10/18 W 25-20 Baltimore 70,799 TEAM 170 710 4.2 22 4
10/22 Seattle OPPONENTS 155 617 4.0 30 6
11/01 at St. Louis * RECEIVING No. Yds Avg Long TD
11/08 Atlanta Boldin 28 333 11.9 51 2
11/22 at Seattle T. Smith 14 323 23.1 76t 2
11/29 Arizona Celek 14 131 9.4 20 1
12/06 at Chicago Patton 11 129 11.7 40 1
12/13 at Cleveland Hyde 11 53 4.8 11 0
12/20 Cincinnati V. Davis 8 109 13.6 43 0
12/27 at Detroit Miller 6 119 19.8 52 0
01/03 St. Louis McDonald 5 31 6.2 10 0
S.F. Opp. Ellington 4 44 11.0 30 0
TOTAL FIRST DOWNS 107 139 Bell 3 17 5.7 11 0
Rushing 39 44 M. Davis 3 9 3.0 5 0
Passing 58 87 White 2 18 9.0 10 0
Penalty 10 8 Hayne 1 7 7.0 7 0
3rd Down: Made/Att 33/81 31/74 Bush 1 6 6.0 6 0
3rd Down Pct. 40.7 41.9 TEAM 111 1329 12.0 76t 6
4th Down: Made/Att 3/6 4/6 OPPONENTS 160 1919 12.0 59 11
4th Down Pct. 50.0 66.7 * INTERCEPTIONS No. Yds Avg Long TD
POSSESSION AVG. 28:38 31:22 Acker 2 45 22.5 45 0
TOTAL NET YARDS 1927 2454 Brock 2 26 13.0 26 0
Avg. Per Game 321.2 409.0 Wilhoite 1 0 0.0 0 0
Total Plays 367 394 TEAM 5 71 14.2 45 0
Avg. Per Play 5.3 6.2 OPPONENTS 5 71 14.2 33t 2
NET YARDS RUSHING 710 617 * PUNTING No. Yds Avg Net TB In Lg B
Avg. Per Game 118.3 102.8 Pinion 26 1131 43.5 39.2 1 8 59 0
Total Rushes 170 155 TEAM 26 1131 43.5 39.2 1 8 59 0
NET YARDS PASSING 1217 1837 OPPONENTS 22 920 41.8 37.3 1 10 62 0
Avg. Per Game 202.8 306.2 * PUNT RETURNS Ret FC Yds Avg Long TD
Sacked/Yards Lost 19/112 9/82 Hayne 8 5 76 9.5 37 0
Gross Yards 1329 1919 Ellington 1 1 0 0.0 0 0
Att./Completions 178/111 230/160 White 1 0 4 4.0 4 0
Completion Pct. 62.4 69.6 TEAM 10 6 80 8.0 37 0
Had Intercepted 5 5 OPPONENTS 13 3 93 7.2 16 0
PUNTS/AVERAGE 26/43.5 22/41.8 * KICKOFF RETURNS No. Yds Avg Long TD
NET PUNTING AVG. 26/39.2 22/37.3 White 6 142 23.7 30 0
PENALTIES/YARDS 33/231 33/252 Ellington 2 42 21.0 22 0
FUMBLES/BALL LOST 11/2 2/0 Jerod-Eddie 1 11 11.0 11 0
TOUCHDOWNS 10 19 Miller 1 3 3.0 3 0
Rushing 4 6 TEAM 10 198 19.8 30 0
Passing 6 11 OPPONENTS 5 130 26.0 41 0
Returns 0 2 * FIELD GOALS 1-19 20-29 30-39 40-49 50+
* SCORE BY PERIODS Q1 Q2 Q3 Q4 OT PTS Dawson 0/ 0 3/ 4 3/ 3 3/ 3 1/1
TEAM 9 33 13 45 0 100 TEAM 0/ 0 3/ 4 3/ 3 3/ 3 1/1
OPPONENTS 32 54 33 41 0 160 OPPONENTS 0/ 0 4/ 4 3/ 3 1/ 4 0/0
* SCORING TD-Ru-Pa-Rt K-PAT FG S PTS Dawson: (28B,30G,25G)(47G)()(33G)(43G,22G)(53G,
Dawson 0 0 0 0 8/ 8 10/11 0 38 31G,26G,42G)
Hyde 3 3 0 0 0 18 OPP: (44N,37G)()(22G)(44N,31G)(22G,41G,24G)(22G,
T. Smith 2 0 2 0 0 14 36G,45N)
Boldin 2 0 2 0 0 12
Celek 1 0 1 0 0 6
Kaepernick 1 1 0 0 0 6
Patton 1 0 1 0 0 6
TEAM 10 4 6 0 8/ 8 10/11 0 100
OPPONENTS 19 6 11 2 16/17 8/11 1 160
2-Pt Conv: T. Smith, TM 1-2, OPP 2-2
SACKS: Lynch 3, Armstead 1, Bethea 1,
Bowman 1, Brooks 1, Carradine 1, Tartt 1,
TM 9, OPP 19
FUM/LOST: Kaepernick 5/1, Hayne 3/1,
Ellington 1/0, McDonald 1/0, White 1/0
* PASSING Att Cmp Yds Cmp% Yds/Att TD TD% Int Int% Long Sack/Lost Rating
Kaepernick 178 111 1329 62.4 7.47 6 3.4 5 2.8 76t 19/ 112 84.7
TEAM 178 111 1329 62.4 7.47 6 3.4 5 2.8 76t 19/ 112 84.7
OPPONENTS 230 160 1919 69.6 8.34 11 4.8 5 2.2 59 9/ 82 101.7
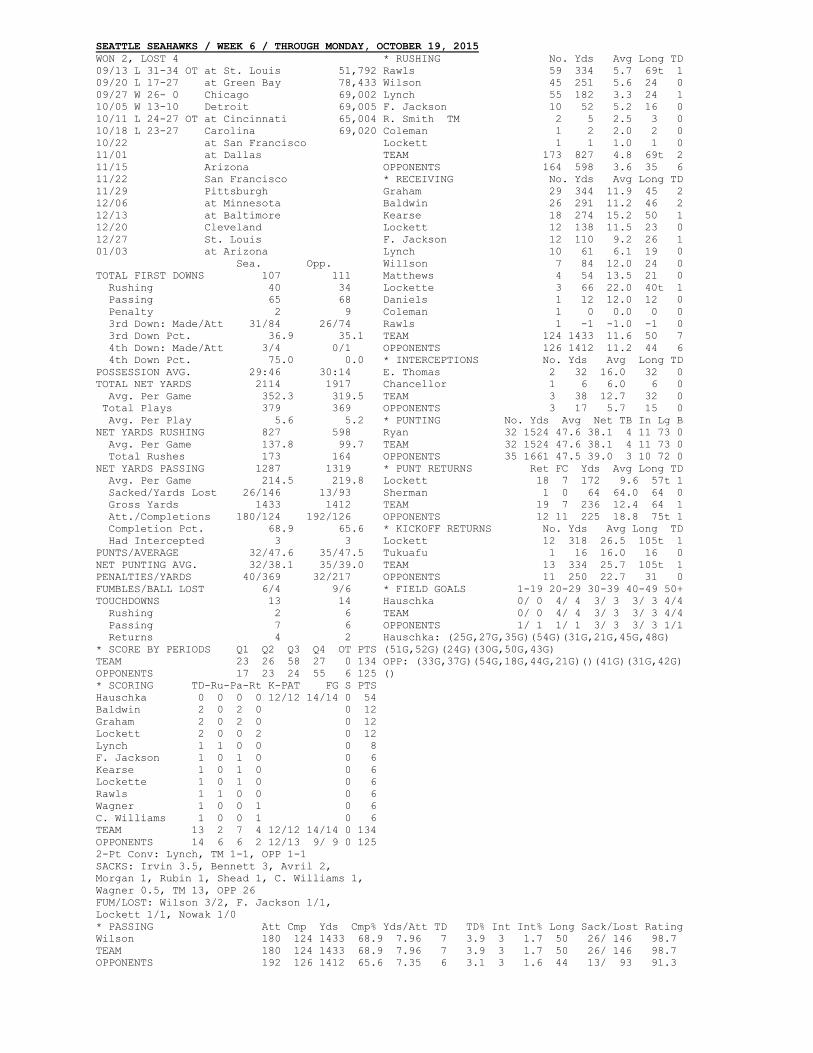
SEATTLE SEAHAWKS / WEEK 6 / THROUGH MONDAY, OCTOBER 19, 2015
WON 2, LOST 4 * RUSHING No. Yds Avg Long TD
09/13 L 31-34 OT at St. Louis 51,792 Rawls 59 334 5.7 69t 1
09/20 L 17-27 at Green Bay 78,433 Wilson 45 251 5.6 24 0
09/27 W 26- 0 Chicago 69,002 Lynch 55 182 3.3 24 1
10/05 W 13-10 Detroit 69,005 F. Jackson 10 52 5.2 16 0
10/11 L 24-27 OT at Cincinnati 65,004 R. Smith TM 2 5 2.5 3 0
10/18 L 23-27 Carolina 69,020 Coleman 1 2 2.0 2 0
10/22 at San Francisco Lockett 1 1 1.0 1 0
11/01 at Dallas TEAM 173 827 4.8 69t 2
11/15 Arizona OPPONENTS 164 598 3.6 35 6
11/22 San Francisco * RECEIVING No. Yds Avg Long TD
11/29 Pittsburgh Graham 29 344 11.9 45 2
12/06 at Minnesota Baldwin 26 291 11.2 46 2
12/13 at Baltimore Kearse 18 274 15.2 50 1
12/20 Cleveland Lockett 12 138 11.5 23 0
12/27 St. Louis F. Jackson 12 110 9.2 26 1
01/03 at Arizona Lynch 10 61 6.1 19 0
Sea. Opp. Willson 7 84 12.0 24 0
TOTAL FIRST DOWNS 107 111 Matthews 4 54 13.5 21 0
Rushing 40 34 Lockette 3 66 22.0 40t 1
Passing 65 68 Daniels 1 12 12.0 12 0
Penalty 2 9 Coleman 1 0 0.0 0 0
3rd Down: Made/Att 31/84 26/74 Rawls 1 -1 -1.0 -1 0
3rd Down Pct. 36.9 35.1 TEAM 124 1433 11.6 50 7
4th Down: Made/Att 3/4 0/1 OPPONENTS 126 1412 11.2 44 6
4th Down Pct. 75.0 0.0 * INTERCEPTIONS No. Yds Avg Long TD
POSSESSION AVG. 29:46 30:14 E. Thomas 2 32 16.0 32 0
TOTAL NET YARDS 2114 1917 Chancellor 1 6 6.0 6 0
Avg. Per Game 352.3 319.5 TEAM 3 38 12.7 32 0
Total Plays 379 369 OPPONENTS 3 17 5.7 15 0
Avg. Per Play 5.6 5.2 * PUNTING No. Yds Avg Net TB In Lg B
NET YARDS RUSHING 827 598 Ryan 32 1524 47.6 38.1 4 11 73 0
Avg. Per Game 137.8 99.7 TEAM 32 1524 47.6 38.1 4 11 73 0
Total Rushes 173 164 OPPONENTS 35 1661 47.5 39.0 3 10 72 0
NET YARDS PASSING 1287 1319 * PUNT RETURNS Ret FC Yds Avg Long TD
Avg. Per Game 214.5 219.8 Lockett 18 7 172 9.6 57t 1
Sacked/Yards Lost 26/146 13/93 Sherman 1 0 64 64.0 64 0
Gross Yards 1433 1412 TEAM 19 7 236 12.4 64 1
Att./Completions 180/124 192/126 OPPONENTS 12 11 225 18.8 75t 1
Completion Pct. 68.9 65.6 * KICKOFF RETURNS No. Yds Avg Long TD
Had Intercepted 3 3 Lockett 12 318 26.5 105t 1
PUNTS/AVERAGE 32/47.6 35/47.5 Tukuafu 1 16 16.0 16 0
NET PUNTING AVG. 32/38.1 35/39.0 TEAM 13 334 25.7 105t 1
PENALTIES/YARDS 40/369 32/217 OPPONENTS 11 250 22.7 31 0
FUMBLES/BALL LOST 6/4 9/6 * FIELD GOALS 1-19 20-29 30-39 40-49 50+
TOUCHDOWNS 13 14 Hauschka 0/ 0 4/ 4 3/ 3 3/ 3 4/4
Rushing 2 6 TEAM 0/ 0 4/ 4 3/ 3 3/ 3 4/4
Passing 7 6 OPPONENTS 1/ 1 1/ 1 3/ 3 3/ 3 1/1
Returns 4 2 Hauschka: (25G,27G,35G)(54G)(31G,21G,45G,48G)
* SCORE BY PERIODS Q1 Q2 Q3 Q4 OT PTS (51G,52G)(24G)(30G,50G,43G)
TEAM 23 26 58 27 0 134 OPP: (33G,37G)(54G,18G,44G,21G)()(41G)(31G,42G)
OPPONENTS 17 23 24 55 6 125 ()
* SCORING TD-Ru-Pa-Rt K-PAT FG S PTS
Hauschka 0 0 0 0 12/12 14/14 0 54
Baldwin 2 0 2 0 0 12
Graham 2 0 2 0 0 12
Lockett 2 0 0 2 0 12
Lynch 1 1 0 0 0 8
F. Jackson 1 0 1 0 0 6
Kearse 1 0 1 0 0 6
Lockette 1 0 1 0 0 6
Rawls 1 1 0 0 0 6
Wagner 1 0 0 1 0 6
C. Williams 1 0 0 1 0 6
TEAM 13 2 7 4 12/12 14/14 0 134
OPPONENTS 14 6 6 2 12/13 9/ 9 0 125
2-Pt Conv: Lynch, TM 1-1, OPP 1-1
SACKS: Irvin 3.5, Bennett 3, Avril 2,
Morgan 1, Rubin 1, Shead 1, C. Williams 1,
Wagner 0.5, TM 13, OPP 26
FUM/LOST: Wilson 3/2, F. Jackson 1/1,
Lockett 1/1, Nowak 1/0
* PASSING Att Cmp Yds Cmp% Yds/Att TD TD% Int Int% Long Sack/Lost Rating
Wilson 180 124 1433 68.9 7.96 7 3.9 3 1.7 50 26/ 146 98.7
TEAM 180 124 1433 68.9 7.96 7 3.9 3 1.7 50 26/ 146 98.7
OPPONENTS 192 126 1412 65.6 7.35 6 3.1 3 1.6 44 13/ 93 91.3

TAMPA BAY BUCCANEERS / WEEK 6 / THROUGH MONDAY, OCTOBER 19, 2015
WON 2, LOST 3 * RUSHING No. Yds Avg Long TD
09/13 L 14-42 Tennessee 63,945 D. Martin 90 405 4.5 39 3
09/20 W 26-19 at New Orleans 73,006 Sims 37 135 3.6 15 0
09/27 L 9-19 at Houston 71,718 Winston 20 62 3.1 9 1
10/04 L 23-37 Carolina 57,468 Rainey 3 10 3.3 7 0
10/11 W 38-31 Jacksonville 58,490 Lane 1 0 0.0 0 0
10/25 at Washington TEAM 151 612 4.1 39 4
11/01 at Atlanta OPPONENTS 155 602 3.9 21 4
11/08 New York Giants * RECEIVING No. Yds Avg Long TD
11/15 Dallas Jackson 20 306 15.3 23 2
11/22 at Philadelphia Sims 14 193 13.8 56 2
11/29 at Indianapolis Evans 13 174 13.4 21 0
12/06 Atlanta D. Martin 11 94 8.5 16 1
12/13 New Orleans Murphy 9 169 18.8 54 0
12/17 at St. Louis Seferian-Jenkins 7 139 19.9 41t 2
12/27 Chicago Myers 6 60 10.0 17 0
01/03 at Carolina Humphries 2 14 7.0 12 0
T.B. Opp. Rainey 2 12 6.0 8 0
TOTAL FIRST DOWNS 93 109 Brate LG 1 7 7.0 7 0
Rushing 28 36 Brate TM 1 7 7.0 7 0
Passing 55 60 Shepard 1 6 6.0 6 0
Penalty 10 13 TEAM 86 1174 13.7 56 7
3rd Down: Made/Att 22/67 24/60 OPPONENTS 95 1119 11.8 59 12
3rd Down Pct. 32.8 40.0 * INTERCEPTIONS No. Yds Avg Long TD
4th Down: Made/Att 4/6 2/2 McDougald 1 1 1.0 1 0
4th Down Pct. 66.7 100.0 Alexander 1 0 0.0 0 0
POSSESSION AVG. 29:31 30:29 Conte 1 -2 -2.0 -2 0
TOTAL NET YARDS 1704 1614 Verner 0 28 --- 28 0
Avg. Per Game 340.8 322.8 TEAM 3 27 9.0 26 0
Total Plays 314 317 OPPONENTS 7 114 16.3 46t 2
Avg. Per Play 5.4 5.1 * PUNTING No. Yds Avg Net TB In Lg B
NET YARDS RUSHING 612 602 Schum 19 799 42.1 39.7 0 5 56 0
Avg. Per Game 122.4 120.4 TEAM 19 799 42.1 39.7 0 5 56 0
Total Rushes 151 155 OPPONENTS 22 1005 45.7 34.8 2 8 63 0
NET YARDS PASSING 1092 1012 * PUNT RETURNS Ret FC Yds Avg Long TD
Avg. Per Game 218.4 202.4 Rainey 15 1 199 13.3 58 0
Sacked/Yards Lost 11/82 15/107 TEAM 15 1 199 13.3 58 0
Gross Yards 1174 1119 OPPONENTS 12 3 44 3.7 13 0
Att./Completions 152/86 147/95 * KICKOFF RETURNS No. Yds Avg Long TD
Completion Pct. 56.6 64.6 Rainey 8 239 29.9 38 0
Had Intercepted 7 3 TEAM 8 239 29.9 38 0
PUNTS/AVERAGE 19/42.1 22/45.7 OPPONENTS 8 205 25.6 42 0
NET PUNTING AVG. 19/39.7 22/34.8 * FIELD GOALS 1-19 20-29 30-39 40-49 50+
PENALTIES/YARDS 48/391 32/285 Brindza 0/ 0 1/ 2 2/ 3 1/ 3 2/4
FUMBLES/BALL LOST 7/3 12/5 Barth 0/ 0 0/ 0 1/ 1 2/ 2 0/0
TOUCHDOWNS 12 19 TEAM 0/ 0 1/ 2 3/ 4 3/ 5 2/4
Rushing 4 4 OPPONENTS 1/ 1 3/ 3 2/ 2 0/ 2 0/0
Passing 7 12 Brindza: ()(55G,52N,35G,22G,30G)(58G,41N,33N,
Returns 1 3 57N)(42G,29N,43N)()
* SCORE BY PERIODS Q1 Q2 Q3 Q4 OT PTS Barth: ()()()()(35G,45G,47G)
TEAM 9 47 31 23 0 110 OPP: ()(42N)(43N,39G,19G)(24G,27G,27G)(31G)
OPPONENTS 38 42 34 34 0 148
* SCORING TD-Ru-Pa-Rt K-PAT FG S PTS
Brindza 0 0 0 0 6/ 8 6/12 0 24
D. Martin 4 3 1 0 0 24
Jackson 2 0 2 0 0 14
Barth 0 0 0 0 3/ 3 3/ 3 0 12
Seferian-Jenkin 2 0 2 0 0 12
Sims 2 0 2 0 0 12
J. Smith 1 0 0 1 0 6
Winston 1 1 0 0 0 6
TEAM 12 4 7 1 9/11 9/15 0 110
OPPONENTS 19 4 12 3 16/18 6/ 8 0 148
2-Pt Conv: Jackson, TM 1-1, OPP 0-1
SACKS: McCoy 4.5, J. Smith 4, Jones 2,
Alexander 1, David 1, Lansanah 1, Melton 1,
Verner 0.5, TM 15, OPP 11
FUM/LOST: Winston 3/1, Rainey 2/0,
Hawley 1/1, D. Martin 1/1
* PASSING Att Cmp Yds Cmp% Yds/Att TD TD% Int Int% Long Sack/Lost Rating
Winston 152 86 1174 56.6 7.72 7 4.6 7 4.6 56 11/ 82 77.6
TEAM 152 86 1174 56.6 7.72 7 4.6 7 4.6 56 11/ 82 77.6
OPPONENTS 147 95 1119 64.6 7.61 12 8.2 3 2.0 59 15/ 107 106.4
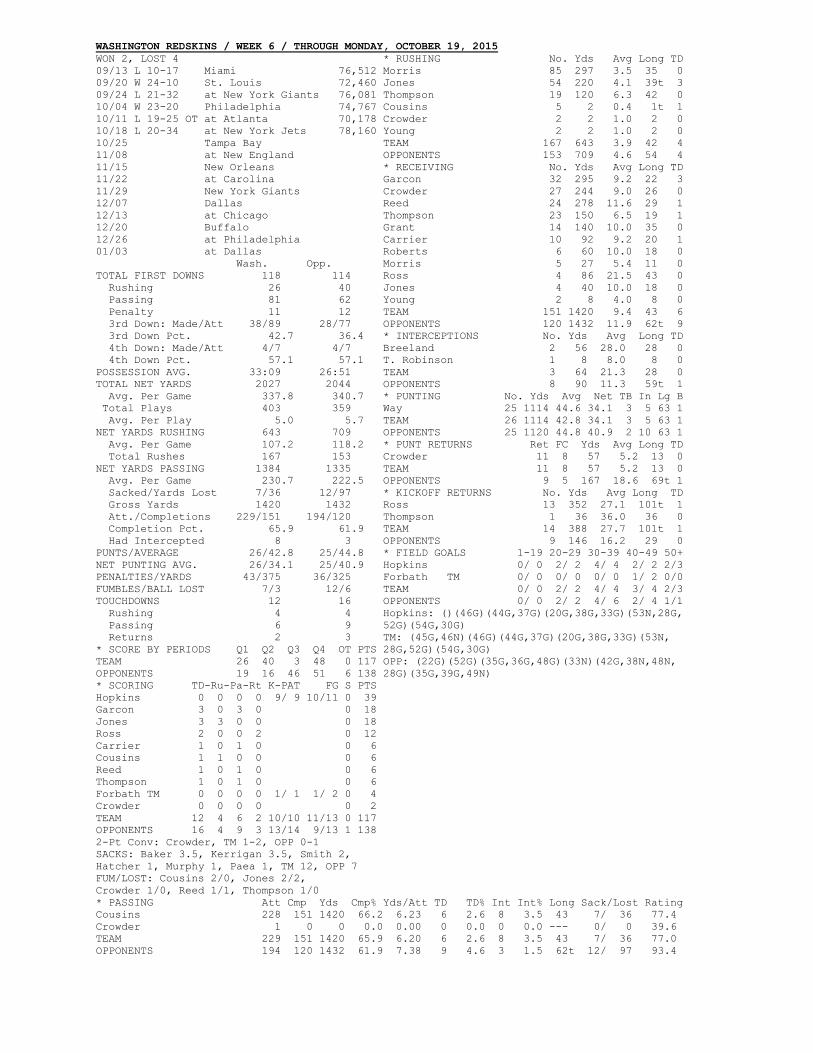
WASHINGTON REDSKINS / WEEK 6 / THROUGH MONDAY, OCTOBER 19, 2015
WON 2, LOST 4 * RUSHING No. Yds Avg Long TD
09/13 L 10-17 Miami 76,512 Morris 85 297 3.5 35 0
09/20 W 24-10 St. Louis 72,460 Jones 54 220 4.1 39t 3
09/24 L 21-32 at New York Giants 76,081 Thompson 19 120 6.3 42 0
10/04 W 23-20 Philadelphia 74,767 Cousins 5 2 0.4 1t 1
10/11 L 19-25 OT at Atlanta 70,178 Crowder 2 2 1.0 2 0
10/18 L 20-34 at New York Jets 78,160 Young 2 2 1.0 2 0
10/25 Tampa Bay TEAM 167 643 3.9 42 4
11/08 at New England OPPONENTS 153 709 4.6 54 4
11/15 New Orleans * RECEIVING No. Yds Avg Long TD
11/22 at Carolina Garcon 32 295 9.2 22 3
11/29 New York Giants Crowder 27 244 9.0 26 0
12/07 Dallas Reed 24 278 11.6 29 1
12/13 at Chicago Thompson 23 150 6.5 19 1
12/20 Buffalo Grant 14 140 10.0 35 0
12/26 at Philadelphia Carrier 10 92 9.2 20 1
01/03 at Dallas Roberts 6 60 10.0 18 0
Wash. Opp. Morris 5 27 5.4 11 0
TOTAL FIRST DOWNS 118 114 Ross 4 86 21.5 43 0
Rushing 26 40 Jones 4 40 10.0 18 0
Passing 81 62 Young 2 8 4.0 8 0
Penalty 11 12 TEAM 151 1420 9.4 43 6
3rd Down: Made/Att 38/89 28/77 OPPONENTS 120 1432 11.9 62t 9
3rd Down Pct. 42.7 36.4 * INTERCEPTIONS No. Yds Avg Long TD
4th Down: Made/Att 4/7 4/7 Breeland 2 56 28.0 28 0
4th Down Pct. 57.1 57.1 T. Robinson 1 8 8.0 8 0
POSSESSION AVG. 33:09 26:51 TEAM 3 64 21.3 28 0
TOTAL NET YARDS 2027 2044 OPPONENTS 8 90 11.3 59t 1
Avg. Per Game 337.8 340.7 * PUNTING No. Yds Avg Net TB In Lg B
Total Plays 403 359 Way 25 1114 44.6 34.1 3 5 63 1
Avg. Per Play 5.0 5.7 TEAM 26 1114 42.8 34.1 3 5 63 1
NET YARDS RUSHING 643 709 OPPONENTS 25 1120 44.8 40.9 2 10 63 1
Avg. Per Game 107.2 118.2 * PUNT RETURNS Ret FC Yds Avg Long TD
Total Rushes 167 153 Crowder 11 8 57 5.2 13 0
NET YARDS PASSING 1384 1335 TEAM 11 8 57 5.2 13 0
Avg. Per Game 230.7 222.5 OPPONENTS 9 5 167 18.6 69t 1
Sacked/Yards Lost 7/36 12/97 * KICKOFF RETURNS No. Yds Avg Long TD
Gross Yards 1420 1432 Ross 13 352 27.1 101t 1
Att./Completions 229/151 194/120 Thompson 1 36 36.0 36 0
Completion Pct. 65.9 61.9 TEAM 14 388 27.7 101t 1
Had Intercepted 8 3 OPPONENTS 9 146 16.2 29 0
PUNTS/AVERAGE 26/42.8 25/44.8 * FIELD GOALS 1-19 20-29 30-39 40-49 50+
NET PUNTING AVG. 26/34.1 25/40.9 Hopkins 0/ 0 2/ 2 4/ 4 2/ 2 2/3
PENALTIES/YARDS 43/375 36/325 Forbath TM 0/ 0 0/ 0 0/ 0 1/ 2 0/0
FUMBLES/BALL LOST 7/3 12/6 TEAM 0/ 0 2/ 2 4/ 4 3/ 4 2/3
TOUCHDOWNS 12 16 OPPONENTS 0/ 0 2/ 2 4/ 6 2/ 4 1/1
Rushing 4 4 Hopkins: ()(46G)(44G,37G)(20G,38G,33G)(53N,28G,
Passing 6 9 52G)(54G,30G)
Returns 2 3 TM: (45G,46N)(46G)(44G,37G)(20G,38G,33G)(53N,
* SCORE BY PERIODS Q1 Q2 Q3 Q4 OT PTS 28G,52G)(54G,30G)
TEAM 26 40 3 48 0 117 OPP: (22G)(52G)(35G,36G,48G)(33N)(42G,38N,48N,
OPPONENTS 19 16 46 51 6 138 28G)(35G,39G,49N)
* SCORING TD-Ru-Pa-Rt K-PAT FG S PTS
Hopkins 0 0 0 0 9/ 9 10/11 0 39
Garcon 3 0 3 0 0 18
Jones 3 3 0 0 0 18
Ross 2 0 0 2 0 12
Carrier 1 0 1 0 0 6
Cousins 1 1 0 0 0 6
Reed 1 0 1 0 0 6
Thompson 1 0 1 0 0 6
Forbath TM 0 0 0 0 1/ 1 1/ 2 0 4
Crowder 0 0 0 0 0 2
TEAM 12 4 6 2 10/10 11/13 0 117
OPPONENTS 16 4 9 3 13/14 9/13 1 138
2-Pt Conv: Crowder, TM 1-2, OPP 0-1
SACKS: Baker 3.5, Kerrigan 3.5, Smith 2,
Hatcher 1, Murphy 1, Paea 1, TM 12, OPP 7
FUM/LOST: Cousins 2/0, Jones 2/2,
Crowder 1/0, Reed 1/1, Thompson 1/0
* PASSING Att Cmp Yds Cmp% Yds/Att TD TD% Int Int% Long Sack/Lost Rating
Cousins 228 151 1420 66.2 6.23 6 2.6 8 3.5 43 7/ 36 77.4
Crowder 1 0 0 0.0 0.00 0 0.0 0 0.0 --- 0/ 0 39.6
TEAM 229 151 1420 65.9 6.20 6 2.6 8 3.5 43 7/ 36 77.0
OPPONENTS 194 120 1432 61.9 7.38 9 4.6 3 1.5 62t 12/ 97 93.4