Embed Size (px)
Citation preview

LEADING WITH CONFIDENCE
JOSEPH E. STIGLITZCOPENHAGEN
JUNE 2004

An Uncertain World
Short run prospects for the global economy
Challenges for the medium term
LEADING WITH CONFIDENCE IN AN UNCERTAIN WORLD

I. Global Prospects in the Short Run
Europe U.S. Asia

Europe: An Engine Stalled
Continues to look elsewhere for strength:
Exports, especially American recovery But American recovery is fragile And weak dollar means that even with
American recovery, European exports may be limited

Europe: GDP Growth Rates
EU member states exhibit very divergent growth rates – a potential problem !
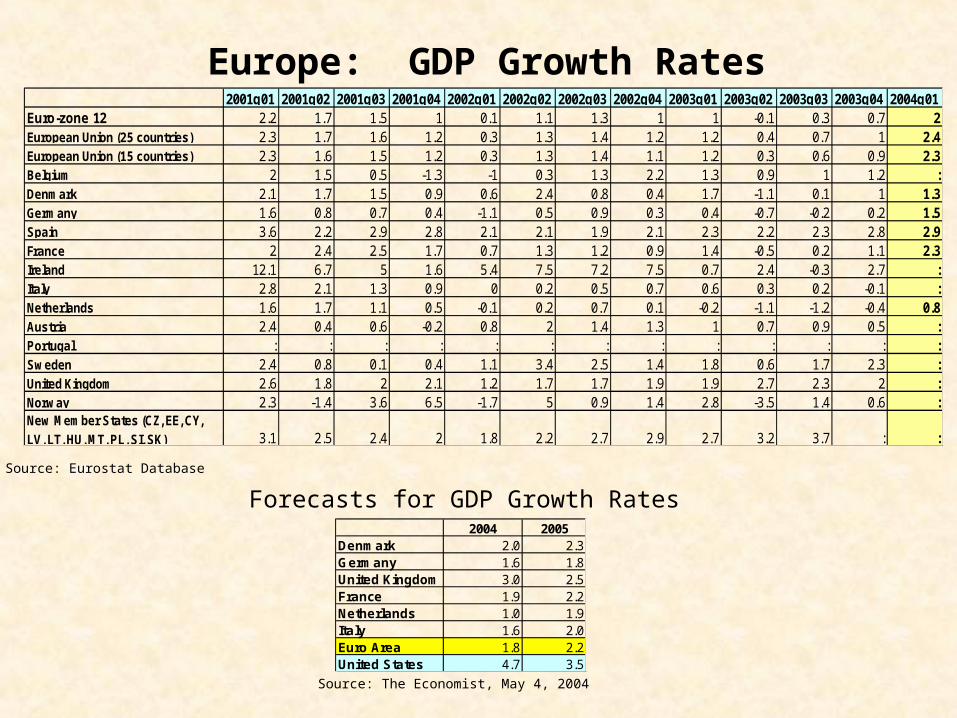
Europe: GDP Growth Rates
Source: Eurostat Database
2001q01 2001q02 2001q03 2001q04 2002q01 2002q02 2002q03 2002q04 2003q01 2003q02 2003q03 2003q04 2004q01Euro-zone 12 2.2 1.7 1.5 1 0.1 1.1 1.3 1 1 -0.1 0.3 0.7 2European Union (25 countries) 2.3 1.7 1.6 1.2 0.3 1.3 1.4 1.2 1.2 0.4 0.7 1 2.4European Union (15 countries) 2.3 1.6 1.5 1.2 0.3 1.3 1.4 1.1 1.2 0.3 0.6 0.9 2.3Belgium 2 1.5 0.5 -1.3 -1 0.3 1.3 2.2 1.3 0.9 1 1.2 :Denmark 2.1 1.7 1.5 0.9 0.6 2.4 0.8 0.4 1.7 -1.1 0.1 1 1.3Germany 1.6 0.8 0.7 0.4 -1.1 0.5 0.9 0.3 0.4 -0.7 -0.2 0.2 1.5Spain 3.6 2.2 2.9 2.8 2.1 2.1 1.9 2.1 2.3 2.2 2.3 2.8 2.9France 2 2.4 2.5 1.7 0.7 1.3 1.2 0.9 1.4 -0.5 0.2 1.1 2.3Ireland 12.1 6.7 5 1.6 5.4 7.5 7.2 7.5 0.7 2.4 -0.3 2.7 :Italy 2.8 2.1 1.3 0.9 0 0.2 0.5 0.7 0.6 0.3 0.2 -0.1 :Netherlands 1.6 1.7 1.1 0.5 -0.1 0.2 0.7 0.1 -0.2 -1.1 -1.2 -0.4 0.8Austria 2.4 0.4 0.6 -0.2 0.8 2 1.4 1.3 1 0.7 0.9 0.5 :Portugal : : : : : : : : : : : : :Sweden 2.4 0.8 0.1 0.4 1.1 3.4 2.5 1.4 1.8 0.6 1.7 2.3 :United Kingdom 2.6 1.8 2 2.1 1.2 1.7 1.7 1.9 1.9 2.7 2.3 2 :Norway 2.3 -1.4 3.6 6.5 -1.7 5 0.9 1.4 2.8 -3.5 1.4 0.6 :New Member States (CZ, EE, CY,
LV, LT, HU, MT, PL, SI, SK) 3.1 2.5 2.4 2 1.8 2.2 2.7 2.9 2.7 3.2 3.7 : :
2004 2005Denmark 2.0 2.3Germany 1.6 1.8United Kingdom 3.0 2.5France 1.9 2.2Netherlands 1.0 1.9Italy 1.6 2.0Euro Area 1.8 2.2United States 4.7 3.5
Forecasts for GDP Growth Rates
Source: The Economist, May 4, 2004

What is the Problem?
Alternative explanations:
Macro: stability and growth pact plus a European Central Bank focusing on inflation
Micro: structural rigidities
Both are important, but….

What is the Problem?
Europe did not suddenly become more rigid:
Suggesting that current problem is macroeconomic
Economic framework focused on problems of past, not challenges of today and future—growth and employment

America’s Precarious Recovery
Dismal performance for past three and a half years
Even with recent employment growth, a jobs deficit of over 5 million
First time since great depression that there has been net job loss over an administration

Continuing Sources Of Worry
Huge fiscal deficit
Structural, not cyclicalWill be hard to undo
Will inevitably lead to cutbacks in investments in education and technology- Investment that underlay the boom of the 90s- Investment that gave America a competitive edge
Compromise future standards of living

Further Worries
Trade deficit Richest country in world cannot live within
its means Uncertainty causing lack of confidence in
dollar Particularly worrisome because of the role
of dollar as ‘reserve currency’ Leading to global instability Upward pressure on global real interest
rates

Further Worries
Household Indebtedness Heavy reliance on monetary policy during
past three years- Did not lead to more investment- But to more household indebtedness
What happens when interest rates increase- Increase in bankruptcy rates- Forced cutbacks in consumption- Weakening of housing market

America’s Fraying Social Fabric: Increasing Inequality
After a brief period of stability, inequality began widening in the late '70s. The income share going to the richest five percent of families reached 17.9 percent in 1989, 21.0 percent in 2001 (www.inequality.org)
The richest one-half of 1 percent of American taxpayers now account for more than 11 percent of aggregate income (source: www.inequality.org)
In the 1920s, the richest five percent of American families received about 30 percent of the nation's personal income. That share had decreased to 15.6 percent by 1969, according to the Census Bureau

America’s Fraying Social Fabric: Increasing Inequality
The top 1 percent of households held 38 percent of the wealth. Bill Gates, America's richest individual, alone has more wealth than bottom 40% of the U.S. population combined, or 120 million people
Among the industrialized nations, the U.S. has the highest concentration of individual wealth--roughly 3 times that of Germany (sources: www.inequality.org)
Between, 1990 and 2001, CEO pay increased by 463%. During the same time, average worker’s pay increased by only 42%
Wage Inequality: 1973-2001
0.440.460.480.5
0.520.540.560.580.6
0.62

America’s Fraying Social Fabric: Increasing Poverty
Nearly one quarter of all workers – more than 28 million in all -- earn less than $8.78 an hour, the amount needed to lift a family of four above the poverty line with full-time work (about $18,200 a year). (Economic Policy Institute, The State of Working America 2002-03, p. 355)
In 2001, 16.3 percent of American children lived in poverty, higher than the 1973 rate of 14.4 percent. (U.S Census Bureau Current Population Survey)
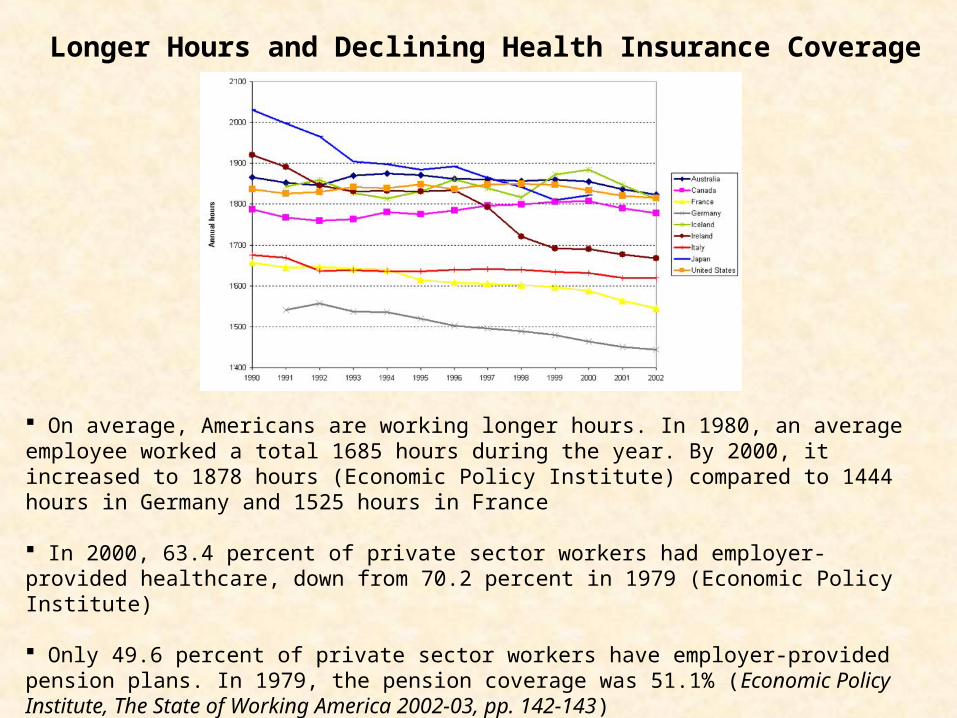
Longer Hours and Declining Health Insurance Coverage
On average, Americans are working longer hours. In 1980, an average employee worked a total 1685 hours during the year. By 2000, it increased to 1878 hours (Economic Policy Institute) compared to 1444 hours in Germany and 1525 hours in France
In 2000, 63.4 percent of private sector workers had employer-provided healthcare, down from 70.2 percent in 1979 (Economic Policy Institute)
Only 49.6 percent of private sector workers have employer-provided pension plans. In 1979, the pension coverage was 51.1% (Economic Policy Institute, The State of Working America 2002-03, pp. 142-143)

America’s Fraying Social Fabric: More People in Prison!
On June 30, 2003, 2,078,570 prisoners were held in Federal or State prisons or in local jails. There are an estimated 480 prison inmates per 100,000 U.S. residents -- up from 411 at yearend 1995 (source: Department of Justice)
In 2001, prison population (per 100,000 people) in Canada, Germany, Japan and the UK were 102, 96, 48 and 139 respectively. For the U.S., the number was 686 – the highest among the industrialized countries (World Prison Population List, 4th Edition)

Regardless Of Outcome Of Election…
American economy likely to slowdown in 2005:- Temporary stimuli encouraged investment in 2004, rather than 2005- Immediate impact of tax cuts wears off- Adverse effects of interest rate increase
Challenge to deal with trade and fiscal deficits- Without exacerbating slowdown

GDP Growth Rates - The United States, Q1:1980-Q1:2004
U.S. GDP Growth Rates (Percentage change based on chained 2000 dollars)
-10.0
-8.0
-6.0
-4.0
-2.0
0.0
2.0
4.0
6.0
8.0
10.0
12.0
1980
q1
1981
q1
1982
q1
1983
q1
1984
q1
1985
q1
1986
q1
1987
q1
1988
q1
1989
q1
1990
q1
1991
q1
1992
q1
1993
q1
1994
q1
1995
q1
1996
q1
1997
q1
1998
q1
1999
q1
2000
q1
2001
q1
2002
q1
2003
q1
2004
q1
Source: Bureau of Economic Analysis

Asia
Major source of global strength
Japan at last seems on road to recovery
Spurred on by exports to China

GDP Growth Rates – China, Japan, Russia and the United States, 1990-2002
GDP per Capita Growth Rates: China, Japan, Russia and the U.S. 1990-2002
-20
-15
-10
-5
0
5
10
15
1990 1991 1992 1993 1994 1995 1996 1997 1998 1999 2000 2001 2002
China
Japan
Russian Federation
United States
Source: World Development Indicator (WDI) database

China’s Remarkable Performance
Impressive growth
Having global effects on commodity prices- Will central banks be forced to raise interest rates, cutting short recovery?
Two key questions- Will it be sustained? Is china overheated?- Will it be forced to adjust exchange rate?
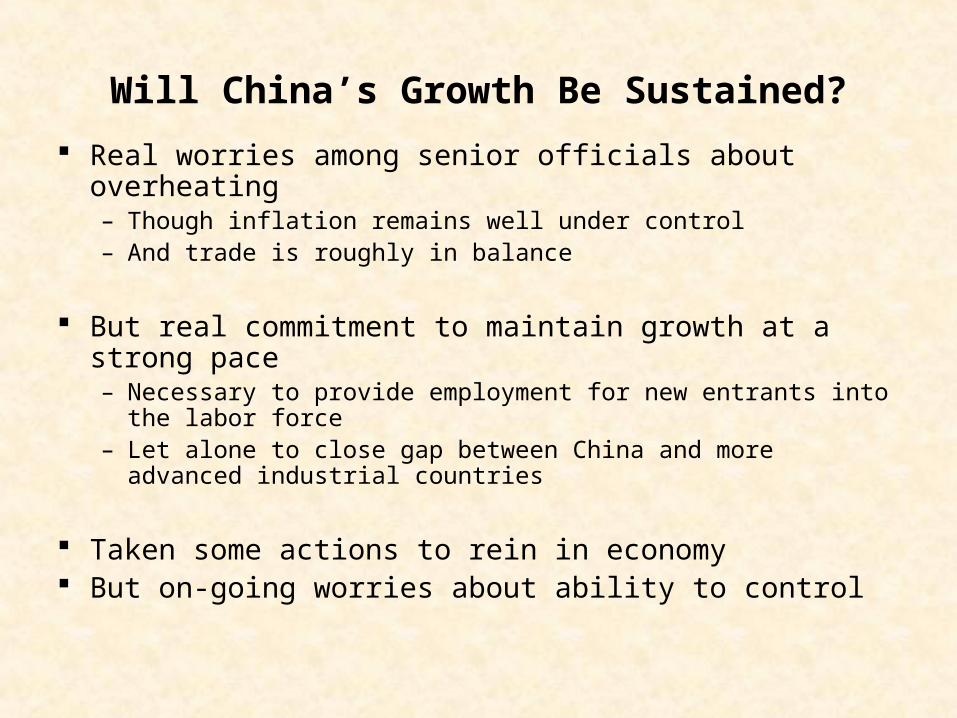
Will China’s Growth Be Sustained?
Real worries among senior officials about overheating– Though inflation remains well under control– And trade is roughly in balance
But real commitment to maintain growth at a strong pace– Necessary to provide employment for new entrants into the
labor force– Let alone to close gap between China and more advanced
industrial countries
Taken some actions to rein in economy But on-going worries about ability to control

Will China Appreciate?
Usual symptoms of under-valuation not present
Multilateral trade is roughly in balance
Bilateral trade deficit with U.S. More symptomatic of macro-economic problem in U.S. than wrong exchange rate in china– Irony: U.S. pressured China not to float in 1997/1998– Hard to take U.S. policy admonitions seriously– Japan thankful that U.S. attention shifted to China

Will China Appreciate?
China prefers alternative instruments to devaluation
Adjustments in V.A.T. Export rebates, other regulations
Best bet: greater flexibility in exchange rate
Recognizes risk of fixed exchange rate Problem of sterilizing capital inflows

Oil Prices Source of downside risk for global economy
High prices have preceded many of recent global economic downturns Source of business risk

Uncertainties Facing Global Oil Market
Huge Middle-East instability
Russia: On going problem with oligarchs Lack of investment in finding new sources
– Lack of security in property rights– Inevitable given problematic privatizations
Elsewhere (e.g. Venezuela) instability– Follows from ‘resource-curse’– With much of wealth going to few people

Prospects For Europe
Weakening U.S. Economy will not provide sufficient impetus
Progress in China and Asia not enough to counterbalance
Europe’s macro-economic framework lacks necessary stimulus
High oil prices represent additional source of risk
However, Europe’s labor productivity is on the rise!

Labor Productivity Growth Rates: Europe and the US
GDP per person employed1980-2001
GDP per hour worked
1980-2001
Germany 1.7 2.6
United Kingdom 1.8 2.0
France 1.4 2.0
Italy 1.3 1.6
Sweden 1.8 1.6
Finland 2.3 2.7
Ireland 3.2 4.0
United States 1.6 1.4Source: ILO, Key Indicators of the Labor Market, 2002
In 2002, EU productivity was about 87% of the US productivity-level and EU GDP per capita was 67% of that of the US. In Belgium, France Netherlands and Norway, GDP per hour worked is higher than that of the US
GDP per capita difference by lower ‘employment participation rate’ and by lower ‘hours worked by each worker’ in Europe (source: Performance 2001: Productivity, Employment, and Income in the World's Economies)
Productivity and GDP per capita gaps between EU and the US are shrinking!

II. Medium Term Issues: Rethinking Globalization
Outsourcing Broader issues: trade and
finance

Outsourcing
Two-edged sword- Source of increases in profitability- Challenge to maintaining full employment
When macro-economy well managed, full employment may still be maintained- After NAFTA, U.S. unemployment fell to 3.8%

But…Outsourcing is Still a Worry
Workers were told not to worry: just up-skill
But America and Europe have no monopoly on skill- India’s workers are highly educated- Result of long term investments- But receive fraction of wages
And even if full employment is maintained, downward pressure on wages may result in large changes in distribution of income

But There are Limits to Globalization..
Much of success requires local knowledge- Particularly important in finance, marketing
Local knowledge in a global economy - Key challenge will be how to combine global
knowledge, global institutions, with local knowledge

Broader Issues In Globalization: Trade And Finance
Trade: breakdown of talks in Cancun:
– America, Europe reneged on promise of “development round”
– Democracies in India, Brazil, South Africa, etc. make it impossible for them to sign another unfair trade agreement
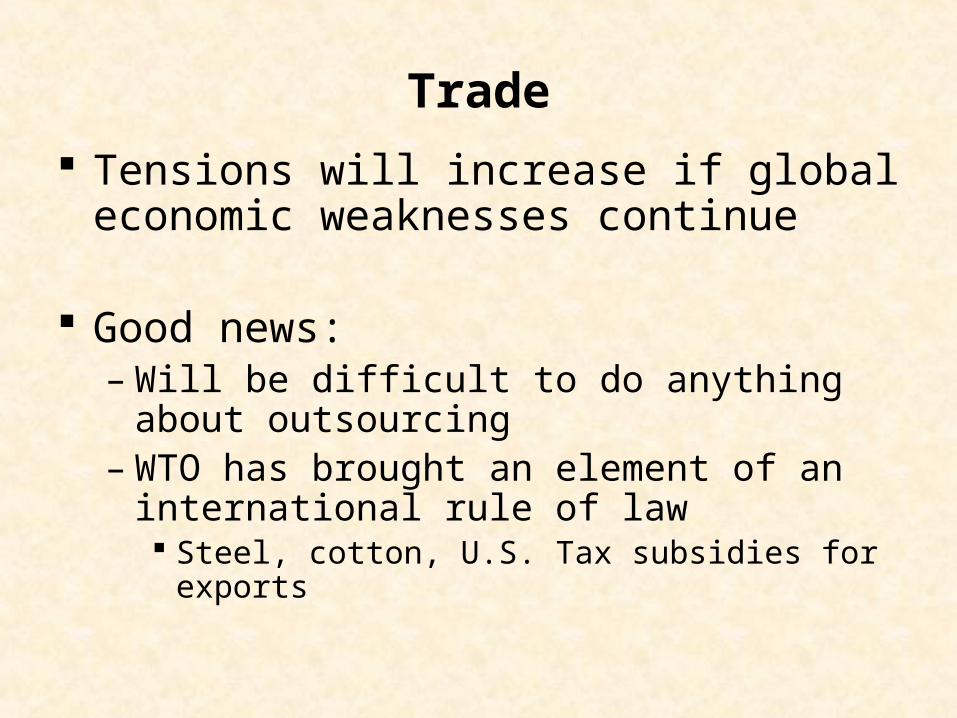
Trade
Tensions will increase if global economic weaknesses continue
Good news: – Will be difficult to do anything about
outsourcing– WTO has brought an element of an
international rule of law Steel, cotton, U.S. Tax subsidies for exports

Problems With Globalization: Finance
Instability continues– Particularly hard on developing countries
Exacerbated by huge U.S. Trade deficit
Failure to do anything about global reserve system– Dollar reserve currency contributes to
instability, inequities
Failure to do anything about fact that developing countries must continue to bear exchange rate and interest rate risks

Strategies for Success in an Uncertain Global Environment
Leading with confidence- Recognize uncertainty- Maintain options- Diversify risks- Maintain flexibility- Most importantly: information

Information
At the heart of the new economy Hyperbole about new economy But new economy was real At the basis of striking increase in U.S. Productivity
Gathering, processing, and utilizing information About global economy About markets About finance About technology About competitors
Speed matters!!!

Key Challenge
New technologies generate greater competition, greater need for information
And greater capacity to respond to challenges
Mastering new technologies is at center of ability to lead with confidence in a world with increasing uncertainty

Europe: Final Thoughts! EU ceilings on deficit spending (3% of GDP) and public debt (60% of GDP) severely limit the effectiveness of fiscal policies and member state’s abilities to deal with economic shocks
Problem compounded by ECB’s focus on inflation—when growth and employment are problems of today
Growth and stability pact increasingly being questioned- Differential treatment of large and small countries- But not clear what to replace it with
Reflects broader challenge: developing appropriate institutional structure
- Difficulties in agreeing on “constitution”- Challenge is greater (and more important) with EU expansion

Europe: Final Thoughts! On May 1, 2004 ten Central and Eastern European
countries joined the European Union – EU is now the largest economy in the world
Success of EU will largely depend on labor mobility and integration of labor markets
But large differences in wages poses strong challenge - Threat of either increasing unemployment and/or
lowering of wages in Germany and other neighboring countries
A deeper and more comprehensive integration will also require harmonization of tax policies, competition policies and standardization of products and services
Challenges before the Europe are immense