Embed Size (px)
Citation preview
Leading Insights Leading Insights into Solarinto Solar
Fong WanFong WanSenior Vice President, Senior Vice President, Energy Procurement Energy Procurement
Pacific Gas and Electric CompanyPacific Gas and Electric Company
CalSEIA CalSEIA -- SolarTech Summit SolarTech Summit
May 7, 2009May 7, 2009

1
AgendaAgenda
• California’s Clean Energy History
• Renewable Energy Requirements
• PG&E's Portfolio Approach
• Benefits and Challenges of Utility-scale vs. Distributed Solar
• Comparison of PV vs. Concentrating Solar Thermal
• PG&E’s New Photovoltaic Program
• CSI Progress Report
• Integration of Intermittent Renewables
• Enabling Technologies: SmartGrid
2
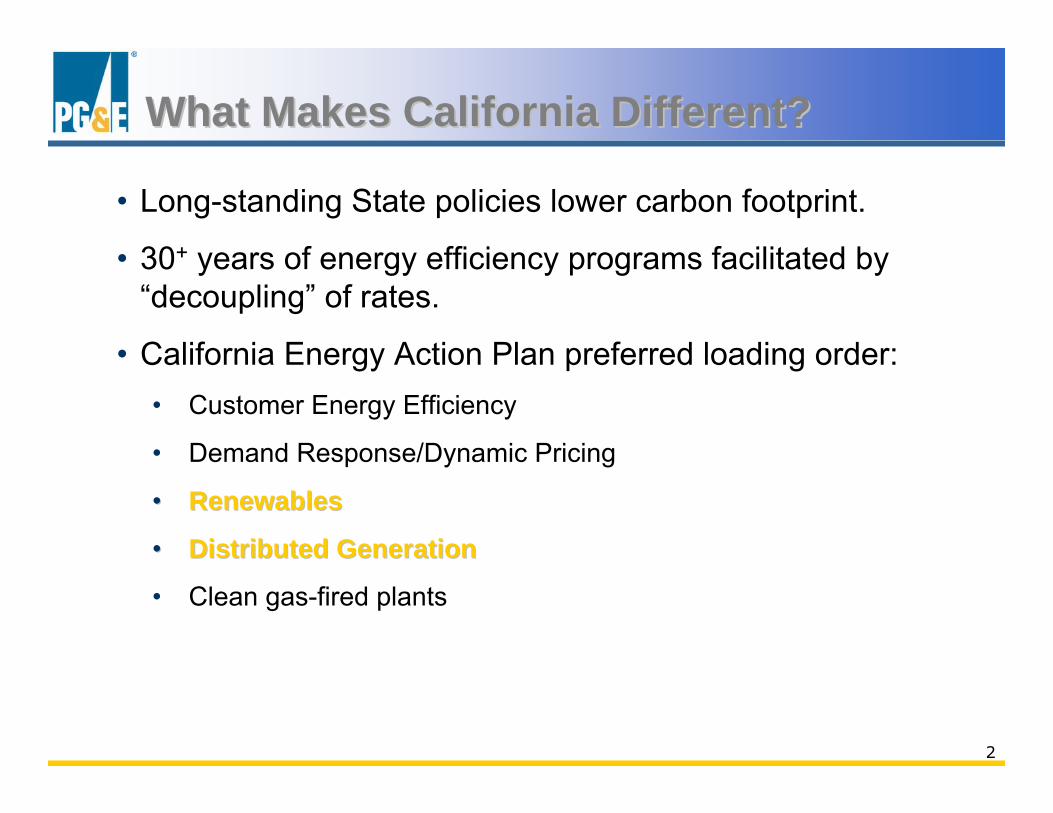
What Makes California Different? What Makes California Different?
• Long-standing State policies lower carbon footprint.
• 30+ years of energy efficiency programs facilitated by “decoupling” of rates.
• California Energy Action Plan preferred loading order:• Customer Energy Efficiency
• Demand Response/Dynamic Pricing
•• RenewablesRenewables
•• Distributed GenerationDistributed Generation
• Clean gas-fired plants

3
Over the past 30 years, California per capita energy use has remained relatively flat compared to the 50% increase in U.S. per capita energy use.
Source: California Energy Commission
History of Energy Efficiency Key to California SuccessHistory of Energy Efficiency Key to California Success
-
2,000
4,000
6,000
8,000
10,000
12,000
14,000
1960 1965 1970 1975 1980 1985 1990 1995 2000
kWh
US CA Western Europe
2005
4
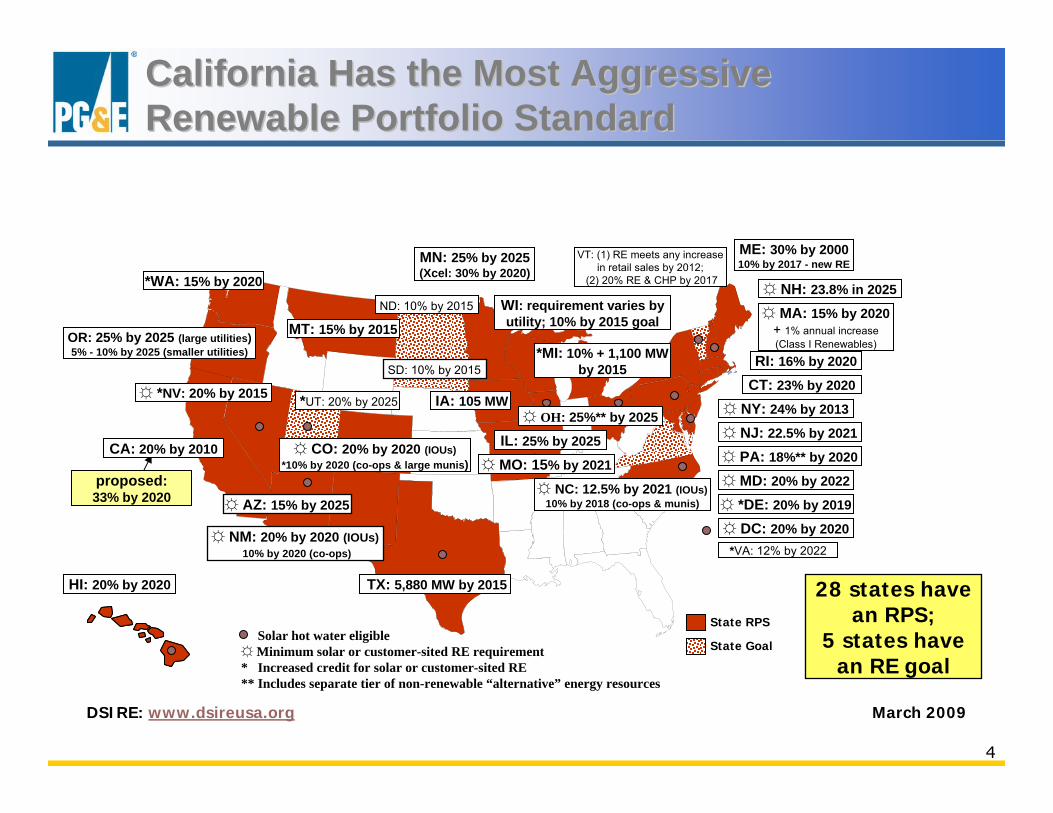
California Has the Most Aggressive California Has the Most Aggressive Renewable Portfolio StandardRenewable Portfolio Standard
State Goal
☼ PA: 18%** by 2020
☼ NJ: 22.5% by 2021
CT: 23% by 2020
WI: requirement varies by utility; 10% by 2015 goal
IA: 105 MW
MN: 25% by 2025(Xcel: 30% by 2020)
TX: 5,880 MW by 2015
☼ AZ: 15% by 2025
CA: 20% by 2010
☼ *NV: 20% by 2015
ME: 30% by 200010% by 2017 - new RE
State RPSSolar hot water eligible
☼ Minimum solar or customer-sited RE requirement* Increased credit for solar or customer-sited RE** Includes separate tier of non-renewable “alternative” energy resources
HI: 20% by 2020
RI: 16% by 2020
☼ CO: 20% by 2020 (IOUs)*10% by 2020 (co-ops & large munis)
☼ DC: 20% by 2020
DSIRE: www.dsireusa.org March 2009
☼ NY: 24% by 2013
MT: 15% by 2015
IL: 25% by 2025
VT: (1) RE meets any increase in retail sales by 2012;
(2) 20% RE & CHP by 2017
☼ MD: 20% by 2022
☼ NH: 23.8% in 2025
OR: 25% by 2025 (large utilities)5% - 10% by 2025 (smaller utilities)
*VA: 12% by 2022
☼ *DE: 20% by 2019
☼ NM: 20% by 2020 (IOUs)10% by 2020 (co-ops)
☼ NC: 12.5% by 2021 (IOUs)10% by 2018 (co-ops & munis)
ND: 10% by 2015
SD: 10% by 2015
*UT: 20% by 2025☼ OH: 25%** by 2025
*MI: 10% + 1,100 MW by 2015
☼ MA: 15% by 2020+ 1% annual increase(Class I Renewables)
☼ MO: 15% by 2021
*WA: 15% by 2020
28 states have an RPS;
5 states have an RE goal
proposed:33% by 2020

5
Advancing Renewable Energy TechnologiesAdvancing Renewable Energy Technologies
Biomass WindGeothermal
BioGas
Small Hydro
Wave PowerConcentrating Solar Thermal
Traditional
Emerging
Concentrating Photovoltaic

6
0
500
1000
1500
2000
2500
3000
3500
4000
2002 2003 2004 2005 2006 2007 2008 2009
Aggressive Contracting for RenewablesAggressive Contracting for Renewables
MW
3 3 3 6 2 8 11
23
412
4
254
2
9 10
30 30
1
5
5
# of contracts
Annual Cumulative Solar
Min % %MW MW MWh
Geothermal 493 13 23Wind 778 21 18Bioenergy 129 3 6Solar PV 777 21 13Solar Thermal 1230 33 22Solar/Biomass 107 3 5Space Solar 200 5 13

7
A Portfolio of Diverse CentralA Portfolio of Diverse Central--Station and Station and Dispersed UtilityDispersed Utility--Scale Solar TechnologiesScale Solar Technologies
500-MW Power Tower 550-MW Cd Te PV*
210-MW c-Si Tracking PV250-MW Dispersed PV(1-20 MW ea) (PPA)
Illustrative
553-MW Parabolic Trough
250-MW Dispersed PV(1-20 MW ea) (owned)
Illustrative
*after contract assignment

8
Distributed vs. Utility Scale SolarDistributed vs. Utility Scale Solar
Pros:• Speed to market• Not transmission dependent• Not dependent on water
Cons:• Higher deployment costs• Slower scale penetration
Utility Scale
Pros:• Economies of scale• Efficiencies• Compatible with emerging
storage technologies
Cons:• Transmission dependent• Land & water requirements• Not for all locations
Distributed
PG&E Takes a Diversified Portfolio ApproachPG&E Takes a Diversified Portfolio Approach

9
Why the Trend to Photovoltaics?Why the Trend to Photovoltaics?• Proven, commercially ready technology
• Costs are decreasing
• Many Northern California locations suitable for PV deployment
• Modular / rapid deployment capabilities
• Project size facilitates expedited interconnection
• Project size avoids transmission upgrades
• Dispersed implementation reduces environmental impacts
• More peak coincident than other renewables
• Utilities now eligible for ITC
10
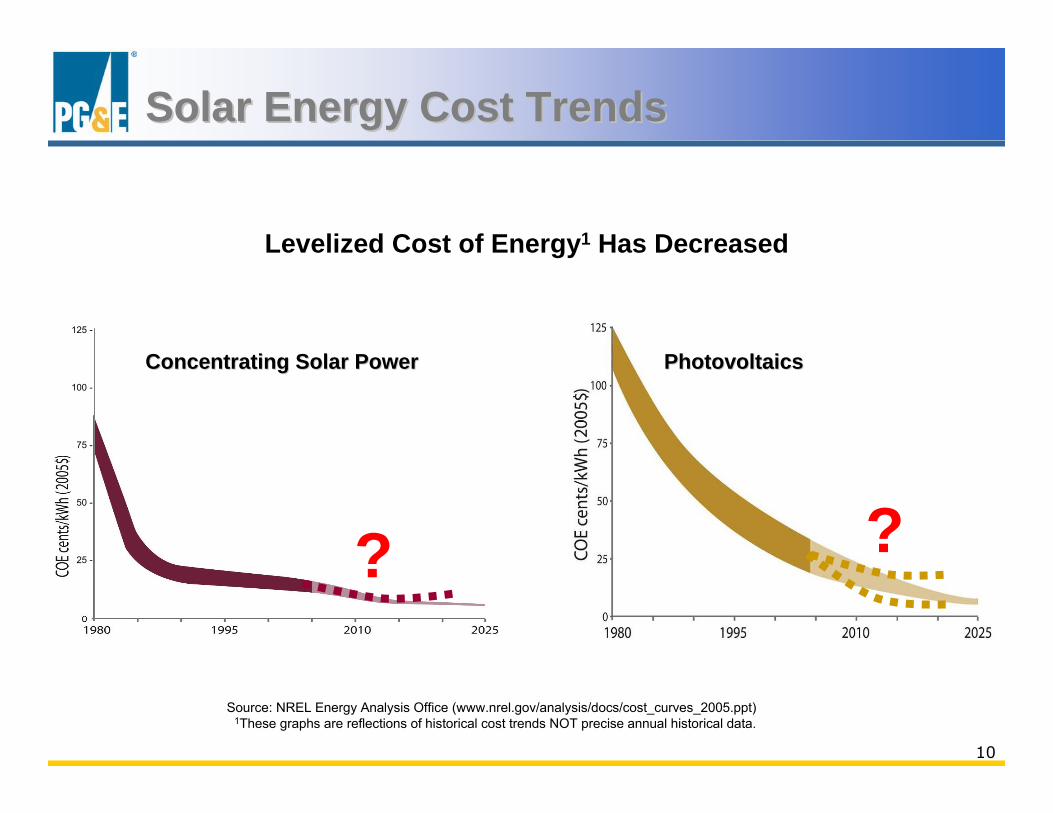
Levelized Cost of Energy1 Has Decreased
Solar Energy Cost TrendsSolar Energy Cost Trends
Source: NREL Energy Analysis Office (www.nrel.gov/analysis/docs/cost_curves_2005.ppt)1These graphs are reflections of historical cost trends NOT precise annual historical data.
??
125 -
100 -
75 -
50 -
25 -
Concentrating Solar PowerConcentrating Solar Power PhotovoltaicsPhotovoltaics
11
Why Utility Ownership?Why Utility Ownership?
• Credit-related cancellations or delays of independent contractors’ projects
• Balance sheet strength produces lower cost of money
• Utilities can utilize the PTC and ITC
• Reduces development risk
12
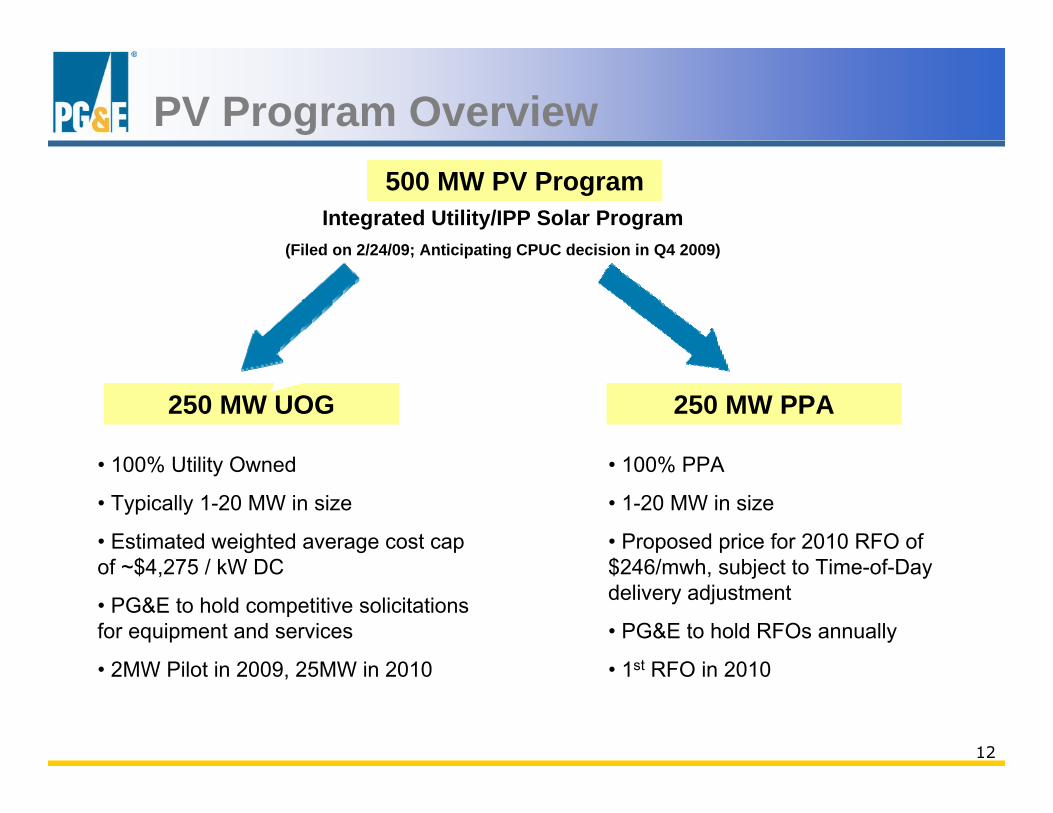
500 MW PV Program
250 MW UOG 250 MW PPA
• 100% Utility Owned
• Typically 1-20 MW in size
• Estimated weighted average cost cap of ~$4,275 / kW DC
• PG&E to hold competitive solicitations for equipment and services
• 2MW Pilot in 2009, 25MW in 2010
• 100% PPA
• 1-20 MW in size
• Proposed price for 2010 RFO of $246/mwh, subject to Time-of-Day delivery adjustment
• PG&E to hold RFOs annually
• 1st RFO in 2010
Integrated Utility/IPP Solar Program(Filed on 2/24/09; Anticipating CPUC decision in Q4 2009)
PV Program Overview

13
Annual PG&E Solar InterconnectionsAnnual PG&E Solar Interconnections• Over 30,000 PG&E customer solar installations ( = 300MW)• Approximately 50% of all grid tied in U.S.
0
50,000
100,000
150,000
200,000
250,000
300,000
1996 1997 1998 1999 2000 2001 2002 2003 2004 2005 2006 2007 2008
kW
0
5,000
10,000
15,000
20,000
25,000
30,000
Cus
tom
ers
Cumulative kW Cumulative Customers
2006: 4,345 2007: 6,574
2008: 6,534 2009 (through March): 2,721
14
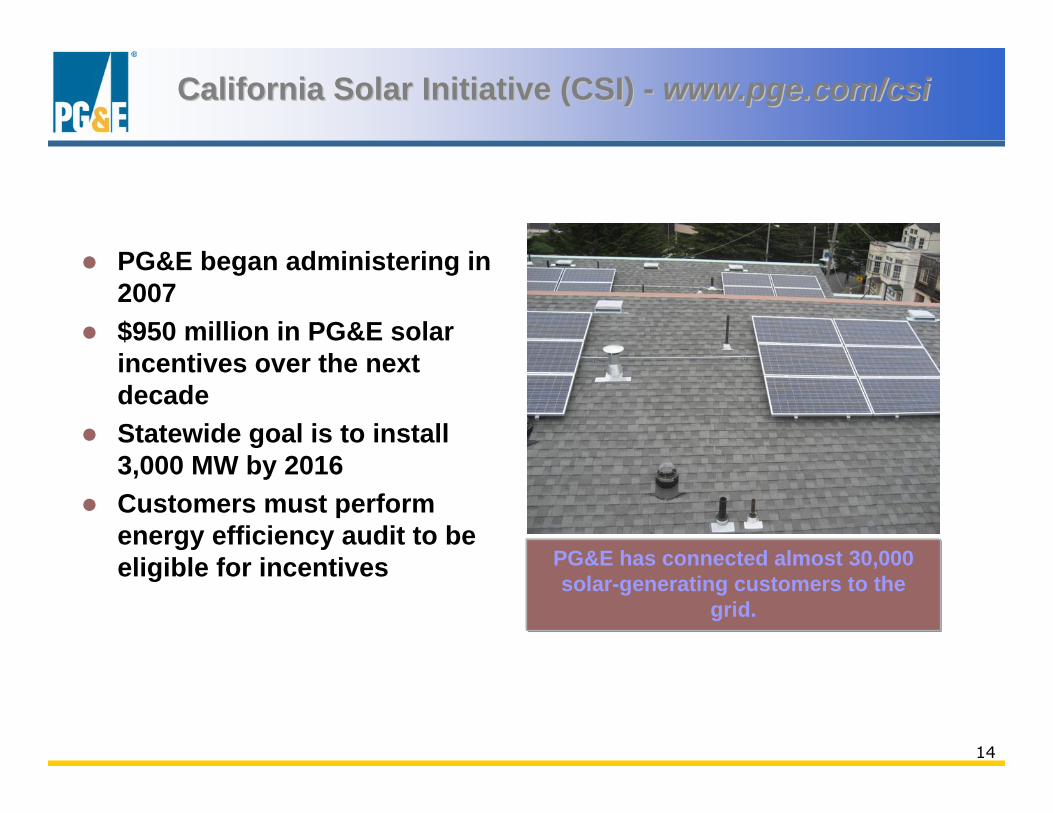
California Solar Initiative (CSI) California Solar Initiative (CSI) -- www.pge.com/csiwww.pge.com/csi
PG&E began administering in 2007$950 million in PG&E solar incentives over the next decadeStatewide goal is to install 3,000 MW by 2016Customers must perform energy efficiency audit to be eligible for incentives PG&E has connected almost 30,000
solar-generating customers to the grid.

15
• The California Solar Initiative provides a financial incentive for the installation of solar on a home or business
• CSI incentives vary by incentive type, customer segment and system size
• Incentive amounts gradually reduce over time in 10 Steps Residential currently at Step 5: $1.55/W or $0.22/kWh Non-residential currently at Step 6: $1.10/W or $0.15/kWh
• First funding is reserved, then once installation is complete, the incentive payment is made
• Structured to be a 10-year program to develop a sustainable solar industry in California
What is the California Solar Initiative?
16
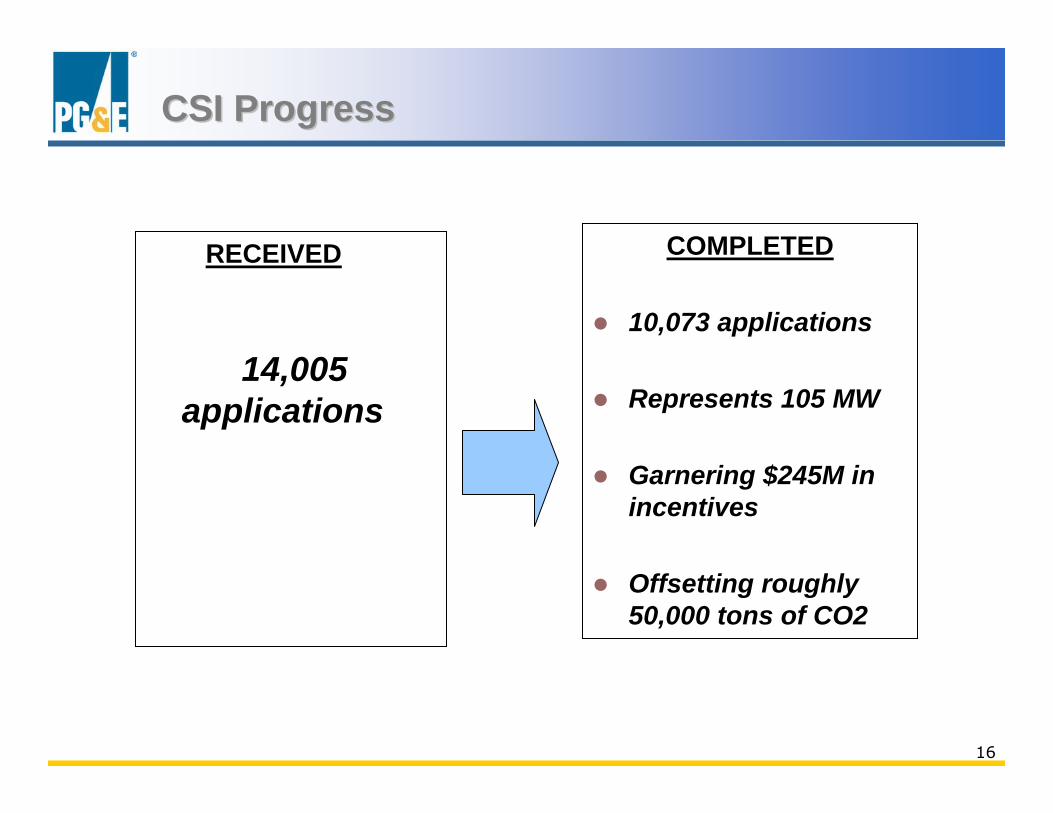
CSI ProgressCSI Progress
RECEIVED
14,005 applications
COMPLETED
10,073 applications
Represents 105 MW
Garnering $245M in incentives
Offsetting roughly 50,000 tons of CO2
17
0
200
400
600
800
1000
1200
1400Ja
nu
ary
Fe
bru
ary
Ma
rch
Ap
ril
Ma
y
Jun
e
July
Au
gu
st
Se
pte
mb
er
Oct
ob
er
No
vem
be
r
De
cem
be
r
Mon
thly
Inte
rcon
nect
ions
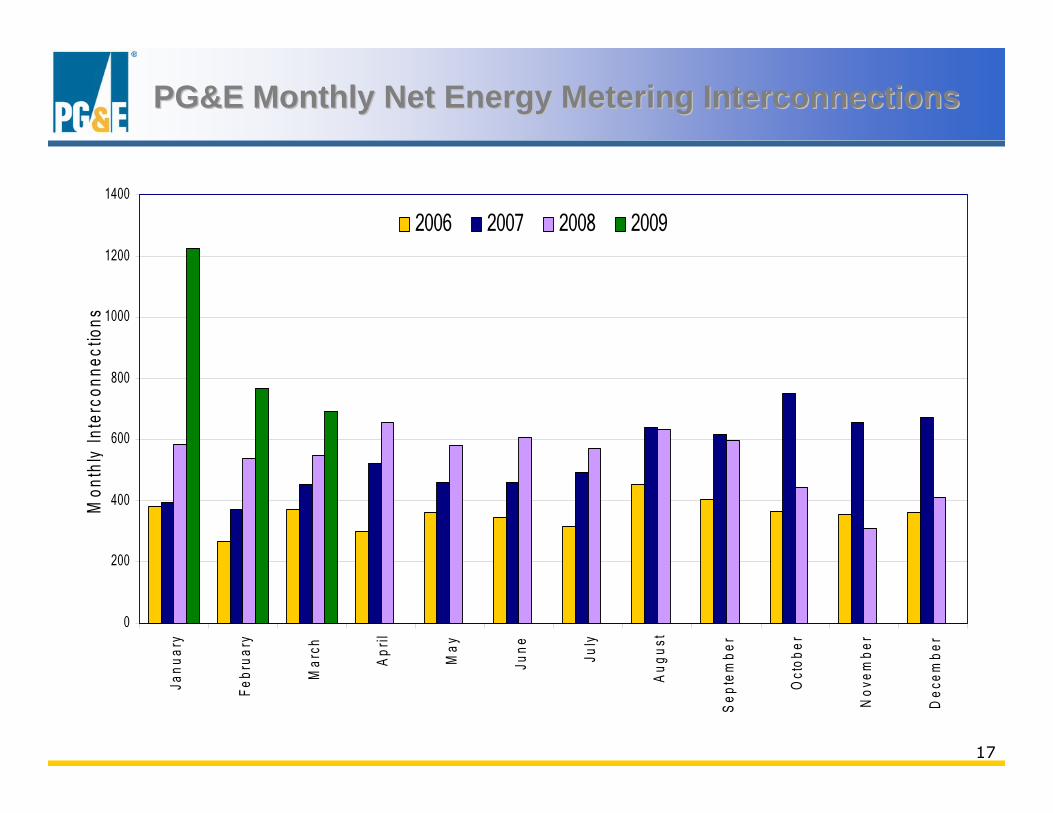
2006 2007 2008 2009
PG&E Monthly Net Energy Metering InterconnectionsPG&E Monthly Net Energy Metering Interconnections

18
97.6%96.9%
97.7% 97.5%96.5%
98.1%97.3%
99.2%97.7%
96.5%95.1%
97.2%
80%
85%
90%
95%
100%
Jan-08
Feb-08
Mar-08
Apr-08
May-08
Jun-08
Jul-08
Aug-08
Sep-08
Oct-08
Nov-08
Dec-08
Exceeds = 96%
Meets = 90%
Percent NEM Percent NEM ““Application Complete to Application Complete to InterconnectionInterconnection”” within 12 Work Days Cycle Timewithin 12 Work Days Cycle Time

19
Percent NEM Percent NEM ““Application Complete to Application Complete to InterconnectionInterconnection”” within 12 Work Days Cycle Timewithin 12 Work Days Cycle Time
99.2%98.1% 98.0% 97.9% 97.5% 97.2% 97.1% 96.9% 96.8% 96.7% 96.7% 96.6%
80%
85%
90%
95%
100%
Jan-09
Feb-09
Mar-09
Apr-09
May-09
Jun-09
Jul-09
Aug-09
Sep-09
Oct-09
Nov-09
Dec-09
Exceeds = 96%
Meets = 90%
YTD Average = 97.9%

20
Integrating Intermittent Renewables Integrating Intermittent Renewables
• Solar and wind are both intermittent resources
• Very few renewable resources are dispatchable
• Today, integrating renewable resources requires more fast-response natural gas power plants
• New technologies will provide other options in the future

21
CCGT Power Plant
Ren
ewab
le R
esou
rce
Gen
erat
ion
Renewable Resource IntegrationRenewable Resource Integration
Today:Today:• Clean, flexible, natural gas-fueled resources are currently necessary to
back up intermittent resources• Significantly improved air emissions profile than retiring plants, but still
fossil-fueled
Local Storage
Rooftop PVCentralized Storage
Tomorrow:Tomorrow:• Utility scale distributed storage to back up intermittent resources and
timeshift resource availability to be coincident with demand • Distributed generation and distributed storage to apply similar principles
at the customer premise• Demand response programs used to integrate intermittent renewables
22
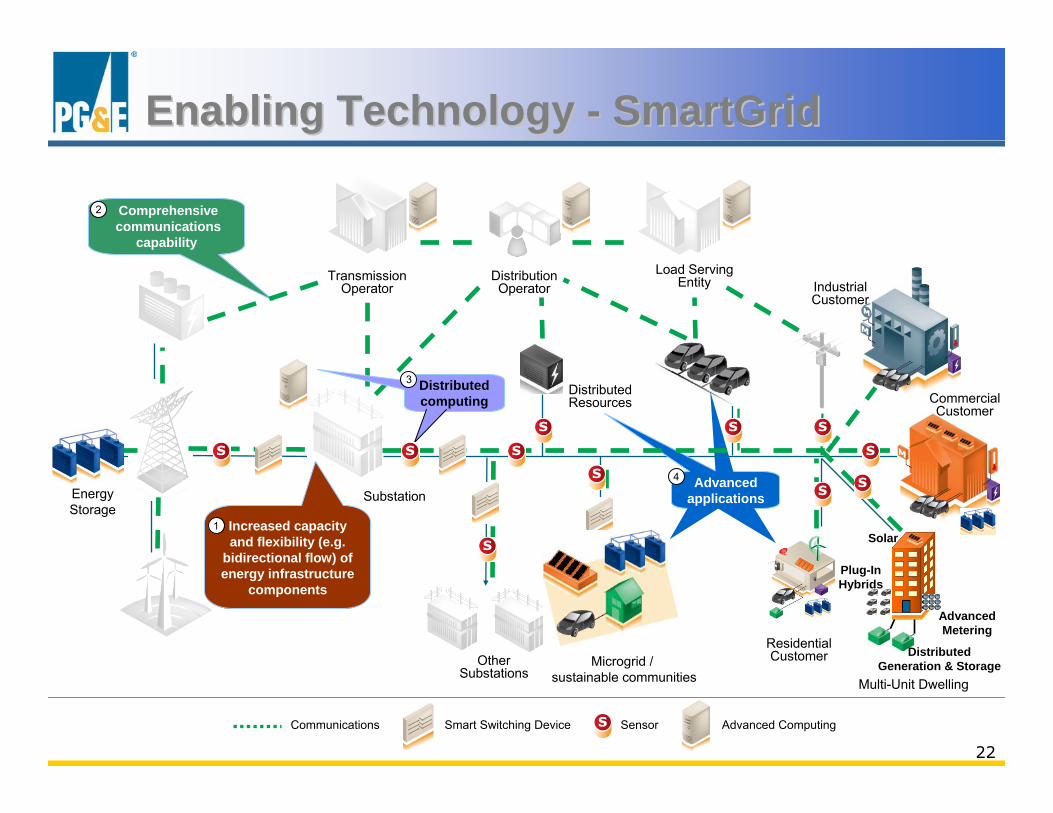
Enabling Technology Enabling Technology -- SmartGridSmartGrid
Sensor Advanced ComputingSmart Switching DeviceCommunications
TransmissionOperator
DistributionOperator
Load ServingEntity
Substation
OtherSubstations
ResidentialCustomer
Multi-Unit Dwelling
IndustrialCustomer
CommercialCustomer
DistributedResources
Microgrid / sustainable communities
EnergyStorage
Advanced applications
4
Comprehensivecommunications
capability
2
Distributed computing
3
Increased capacity and flexibility (e.g.
bidirectional flow) of energy infrastructure
components
1
Plug-InHybrids
DistributedGeneration & Storage
AdvancedMetering
Solar