Embed Size (px)
Citation preview
Leading causes of death in Israel 2000-2012
Nehama Goldberger, Myriam Aburbeh, Ziona Haklai
Health Information Division
September
2015
ww
w.h
eal
th.g
ov.
il
Contents
Leading causes of death in Israel – summary ........................................................ 1
Trends ................................................................................................................................. 1
International Comparison ............................................................................................ 3
Ranking of leading causes of death in Israel by age ............................................ 6
Multiple causes of death .............................................................................................. 9
Tables - Leading causes of death by year ................................................................ 10
Appendix – detailed cause of death, 2012 ............................................................. 28
Leading causes of death in Israel, 2000-2012 1
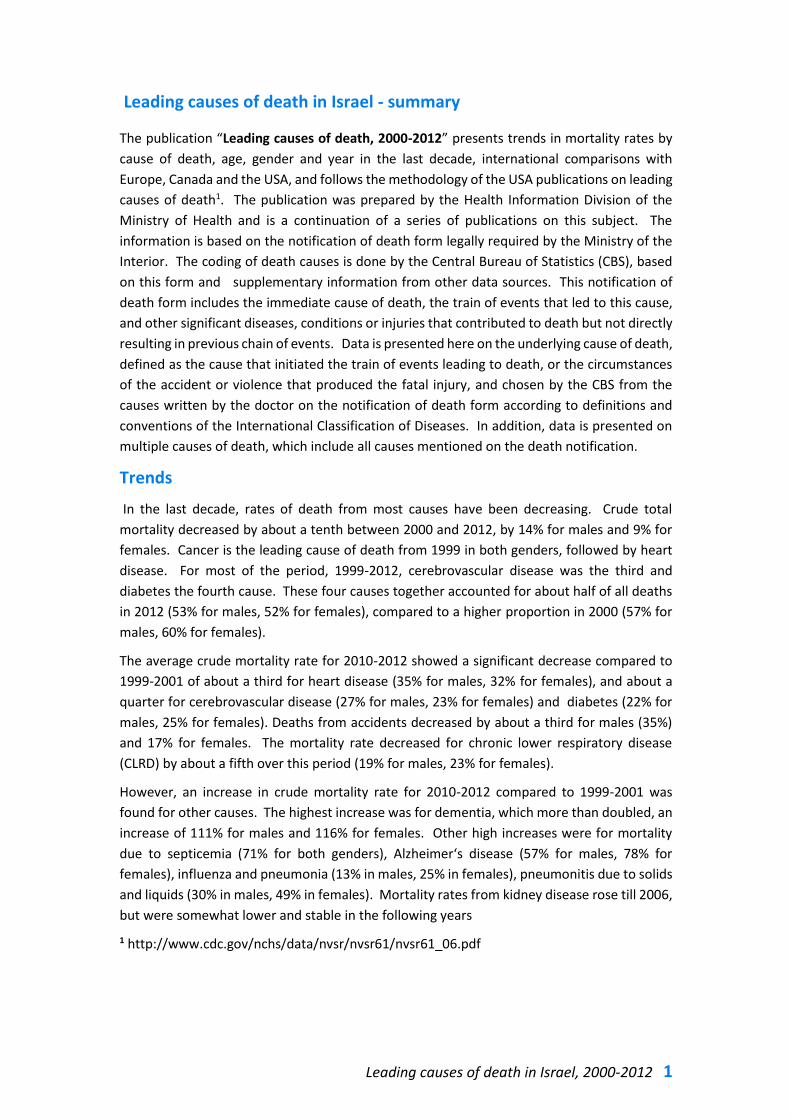
Leading causes of death in Israel - summary
The publication “Leading causes of death, 2000-2012” presents trends in mortality rates by
cause of death, age, gender and year in the last decade, international comparisons with
Europe, Canada and the USA, and follows the methodology of the USA publications on leading
causes of death1. The publication was prepared by the Health Information Division of the
Ministry of Health and is a continuation of a series of publications on this subject. The
information is based on the notification of death form legally required by the Ministry of the
Interior. The coding of death causes is done by the Central Bureau of Statistics (CBS), based
on this form and supplementary information from other data sources. This notification of
death form includes the immediate cause of death, the train of events that led to this cause,
and other significant diseases, conditions or injuries that contributed to death but not directly
resulting in previous chain of events. Data is presented here on the underlying cause of death,
defined as the cause that initiated the train of events leading to death, or the circumstances
of the accident or violence that produced the fatal injury, and chosen by the CBS from the
causes written by the doctor on the notification of death form according to definitions and
conventions of the International Classification of Diseases. In addition, data is presented on
multiple causes of death, which include all causes mentioned on the death notification.
Trends
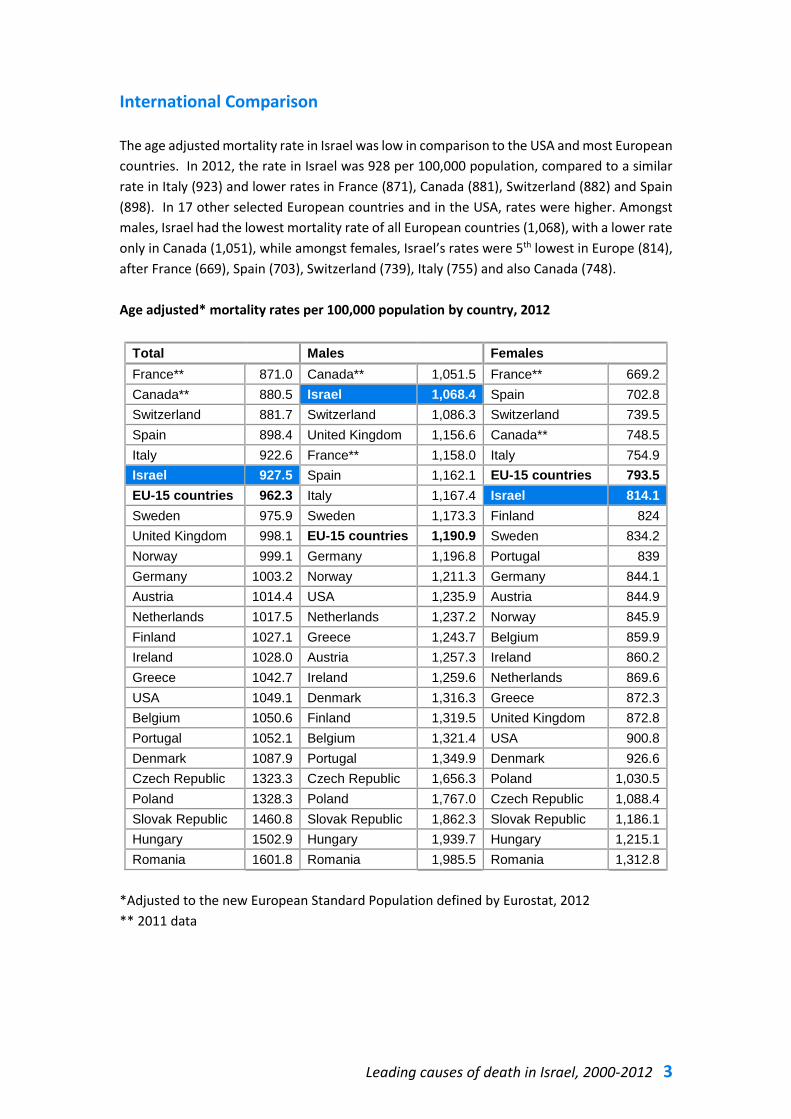
In the last decade, rates of death from most causes have been decreasing. Crude total
mortality decreased by about a tenth between 2000 and 2012, by 14% for males and 9% for
females. Cancer is the leading cause of death from 1999 in both genders, followed by heart
disease. For most of the period, 1999-2012, cerebrovascular disease was the third and
diabetes the fourth cause. These four causes together accounted for about half of all deaths
in 2012 (53% for males, 52% for females), compared to a higher proportion in 2000 (57% for
males, 60% for females).
The average crude mortality rate for 2010-2012 showed a significant decrease compared to
1999-2001 of about a third for heart disease (35% for males, 32% for females), and about a
quarter for cerebrovascular disease (27% for males, 23% for females) and diabetes (22% for
males, 25% for females). Deaths from accidents decreased by about a third for males (35%)
and 17% for females. The mortality rate decreased for chronic lower respiratory disease
(CLRD) by about a fifth over this period (19% for males, 23% for females).
However, an increase in crude mortality rate for 2010-2012 compared to 1999-2001 was
found for other causes. The highest increase was for dementia, which more than doubled, an
increase of 111% for males and 116% for females. Other high increases were for mortality
due to septicemia (71% for both genders), Alzheimer‘s disease (57% for males, 78% for
females), influenza and pneumonia (13% in males, 25% in females), pneumonitis due to solids
and liquids (30% in males, 49% in females). Mortality rates from kidney disease rose till 2006,
but were somewhat lower and stable in the following years
1 http://www.cdc.gov/nchs/data/nvsr/nvsr61/nvsr61_06.pdf
2 Ministry of health, Israel
Trends Mortality Rates by cause, 1999-2012
3- year moving average/100,000 population
Males Females
3- year moving average mortality rate:
Percentage change between 1999-2001 and 2010-2012
Males Females
0
20
40
60
80
100
120
140
160
Malignant neoplasms
Heart disease
Cerebrovascular disease
Diabetes
Kidney disease
Septicemia
0
20
40
60
80
100
120
140
160
Malignant neoplasms
Heart disease
Cerebrovascular disease
Diabetes
Septicemia
Dementia
Kidney disease
-4%
-35%
-27%
-22%
6%
71%
Malignant neoplasms
Heart disease
Cerebrovascular disease
Diabetes
Kidney disease
Septicemia
-5.4
-28.5
-25.2
-24.2
67.8
144.1
-6.0
Malignant neoplasms
Heart disease
Cerebrovascular disease
Diabetes
Septicemia
Dementia
Kidney disease
Leading causes of death in Israel, 2000-2012 3
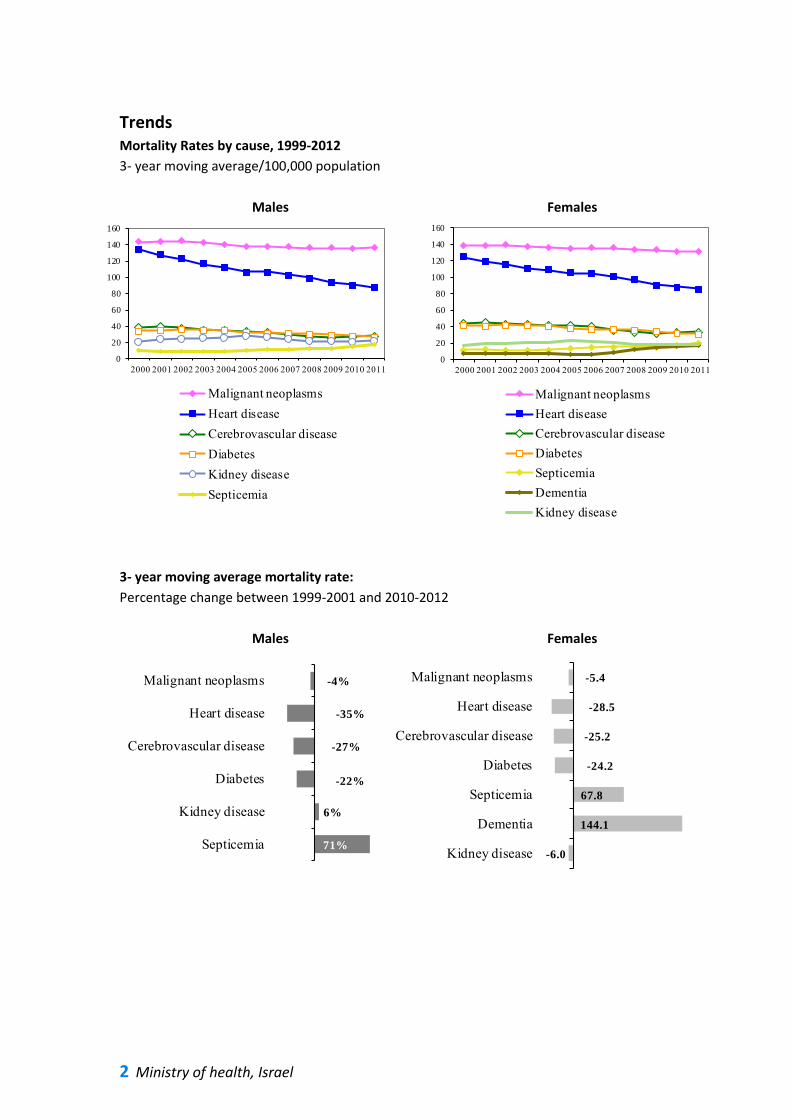
International Comparison
The age adjusted mortality rate in Israel was low in comparison to the USA and most European
countries. In 2012, the rate in Israel was 928 per 100,000 population, compared to a similar
rate in Italy (923) and lower rates in France (871), Canada (881), Switzerland (882) and Spain
(898). In 17 other selected European countries and in the USA, rates were higher. Amongst
males, Israel had the lowest mortality rate of all European countries (1,068), with a lower rate
only in Canada (1,051), while amongst females, Israel’s rates were 5th lowest in Europe (814),
after France (669), Spain (703), Switzerland (739), Italy (755) and also Canada (748).
Age adjusted* mortality rates per 100,000 population by country, 2012
Total Males Females
France** 871.0 Canada** 1,051.5 France** 669.2
Canada** 880.5 Israel 1,068.4 Spain 702.8
Switzerland 881.7 Switzerland 1,086.3 Switzerland 739.5
Spain 898.4 United Kingdom 1,156.6 Canada** 748.5
Italy 922.6 France** 1,158.0 Italy 754.9
Israel 927.5 Spain 1,162.1 EU-15 countries 793.5
EU-15 countries 962.3 Italy 1,167.4 Israel 814.1
Sweden 975.9 Sweden 1,173.3 Finland 824
United Kingdom 998.1 EU-15 countries 1,190.9 Sweden 834.2
Norway 999.1 Germany 1,196.8 Portugal 839
Germany 1003.2 Norway 1,211.3 Germany 844.1
Austria 1014.4 USA 1,235.9 Austria 844.9
Netherlands 1017.5 Netherlands 1,237.2 Norway 845.9
Finland 1027.1 Greece 1,243.7 Belgium 859.9
Ireland 1028.0 Austria 1,257.3 Ireland 860.2
Greece 1042.7 Ireland 1,259.6 Netherlands 869.6
USA 1049.1 Denmark 1,316.3 Greece 872.3
Belgium 1050.6 Finland 1,319.5 United Kingdom 872.8
Portugal 1052.1 Belgium 1,321.4 USA 900.8
Denmark 1087.9 Portugal 1,349.9 Denmark 926.6
Czech Republic 1323.3 Czech Republic 1,656.3 Poland 1,030.5
Poland 1328.3 Poland 1,767.0 Czech Republic 1,088.4
Slovak Republic 1460.8 Slovak Republic 1,862.3 Slovak Republic 1,186.1
Hungary 1502.9 Hungary 1,939.7 Hungary 1,215.1
Romania 1601.8 Romania 1,985.5 Romania 1,312.8
*Adjusted to the new European Standard Population defined by Eurostat, 2012
** 2011 data
4 Ministry of health, Israel
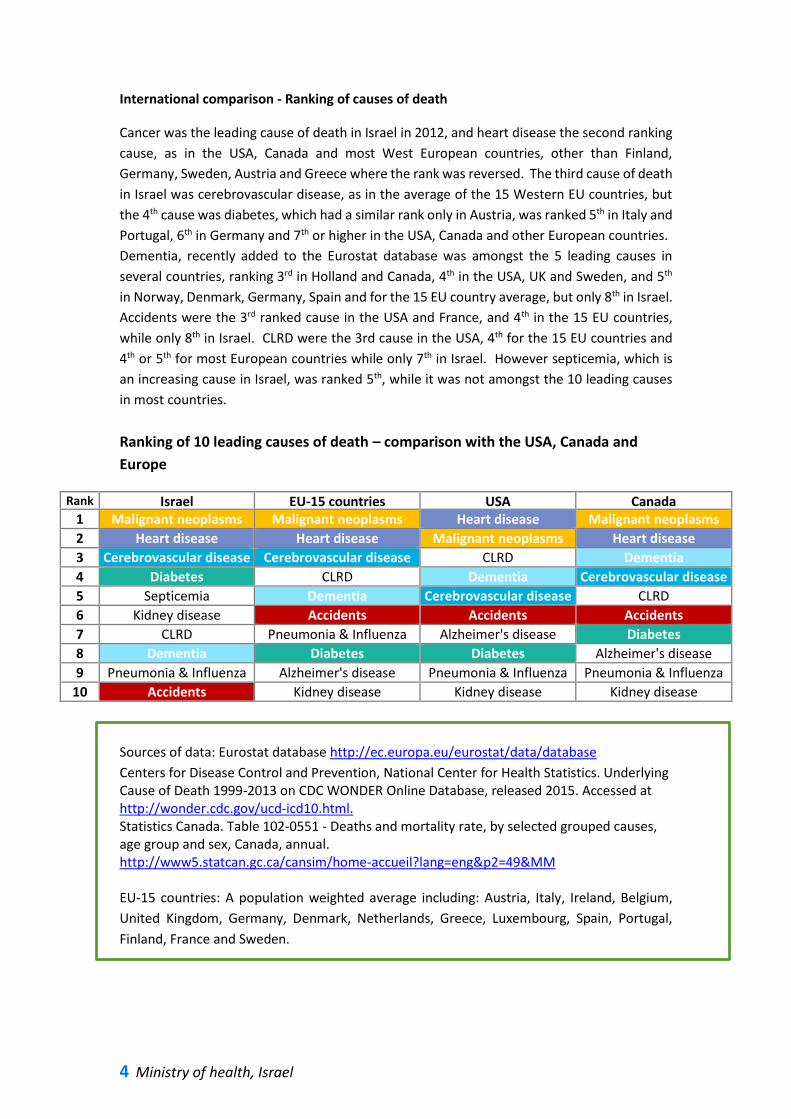
International comparison - Ranking of causes of death
Cancer was the leading cause of death in Israel in 2012, and heart disease the second ranking
cause, as in the USA, Canada and most West European countries, other than Finland,
Germany, Sweden, Austria and Greece where the rank was reversed. The third cause of death
in Israel was cerebrovascular disease, as in the average of the 15 Western EU countries, but
the 4th cause was diabetes, which had a similar rank only in Austria, was ranked 5th in Italy and
Portugal, 6th in Germany and 7th or higher in the USA, Canada and other European countries.
Dementia, recently added to the Eurostat database was amongst the 5 leading causes in
several countries, ranking 3rd in Holland and Canada, 4th in the USA, UK and Sweden, and 5th
in Norway, Denmark, Germany, Spain and for the 15 EU country average, but only 8th in Israel.
Accidents were the 3rd ranked cause in the USA and France, and 4th in the 15 EU countries,
while only 8th in Israel. CLRD were the 3rd cause in the USA, 4th for the 15 EU countries and
4th or 5th for most European countries while only 7th in Israel. However septicemia, which is
an increasing cause in Israel, was ranked 5th, while it was not amongst the 10 leading causes
in most countries.
Ranking of 10 leading causes of death – comparison with the USA, Canada and
Europe
Rank Israel EU-15 countries USA Canada 1 Malignant neoplasms Malignant neoplasms Heart disease Malignant neoplasms
2 Heart disease Heart disease Malignant neoplasms Heart disease
3 Cerebrovascular disease Cerebrovascular disease CLRD Dementia
4 Diabetes CLRD Dementia Cerebrovascular disease
5 Septicemia Dementia Cerebrovascular disease CLRD
6 Kidney disease Accidents Accidents Accidents
7 CLRD Pneumonia & Influenza Alzheimer's disease Diabetes
8 Dementia Diabetes Diabetes Alzheimer's disease
9 Pneumonia & Influenza Alzheimer's disease Pneumonia & Influenza Pneumonia & Influenza
10 Accidents Kidney disease Kidney disease Kidney disease
Sources of data: Eurostat database http://ec.europa.eu/eurostat/data/database
Centers for Disease Control and Prevention, National Center for Health Statistics. Underlying Cause of Death 1999-2013 on CDC WONDER Online Database, released 2015. Accessed at http://wonder.cdc.gov/ucd-icd10.html. Statistics Canada. Table 102-0551 - Deaths and mortality rate, by selected grouped causes, age group and sex, Canada, annual. http://www5.statcan.gc.ca/cansim/home-accueil?lang=eng&p2=49&MM EU-15 countries: A population weighted average including: Austria, Italy, Ireland, Belgium,
United Kingdom, Germany, Denmark, Netherlands, Greece, Luxembourg, Spain, Portugal,
Finland, France and Sweden.
Leading causes of death in Israel, 2000-2012 5
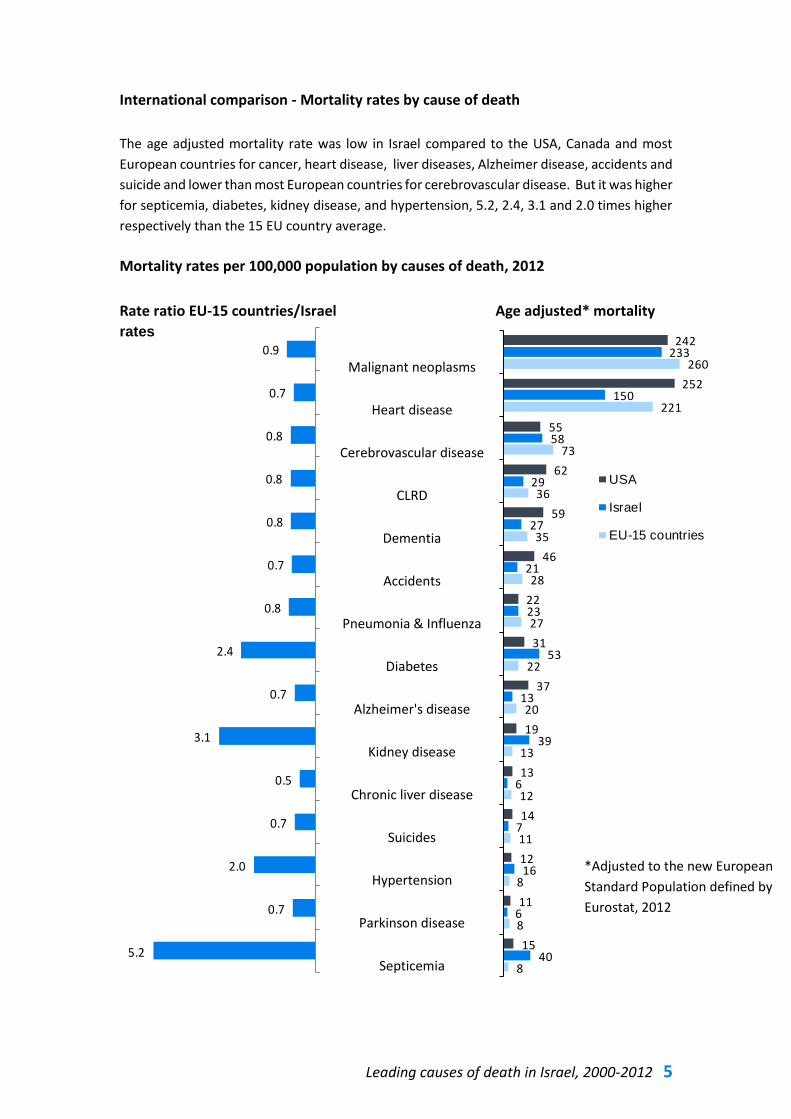
International comparison - Mortality rates by cause of death
The age adjusted mortality rate was low in Israel compared to the USA, Canada and most
European countries for cancer, heart disease, liver diseases, Alzheimer disease, accidents and
suicide and lower than most European countries for cerebrovascular disease. But it was higher
for septicemia, diabetes, kidney disease, and hypertension, 5.2, 2.4, 3.1 and 2.0 times higher
respectively than the 15 EU country average.
Mortality rates per 100,000 population by causes of death, 2012
Rate ratio EU-15 countries/Israel Age adjusted* mortality
rates
Malignant neoplasms
Heart disease
Cerebrovascular disease
CLRD
Dementia
Accidents
Pneumonia & Influenza
Diabetes
Alzheimer's disease
Kidney disease
Chronic liver disease
Suicides
Hypertension
Parkinson disease
Septicemia 5.2
0.7
2.0
0.7
0.5
3.1
0.7
2.4
0.8
0.7
0.8
0.8
0.8
0.7
0.9
8
8
8
11
12
13
20
22
27
28
35
36
73
221
260
40
6
16
7
6
39
13
53
23
21
27
29
58
150
233
15
11
12
14
13
19
37
31
22
46
59
62
55
252
242
USA
Israel
EU-15 countries
*Adjusted to the new European
Standard Population defined by
Eurostat, 2012
6 Ministry of health, Israel
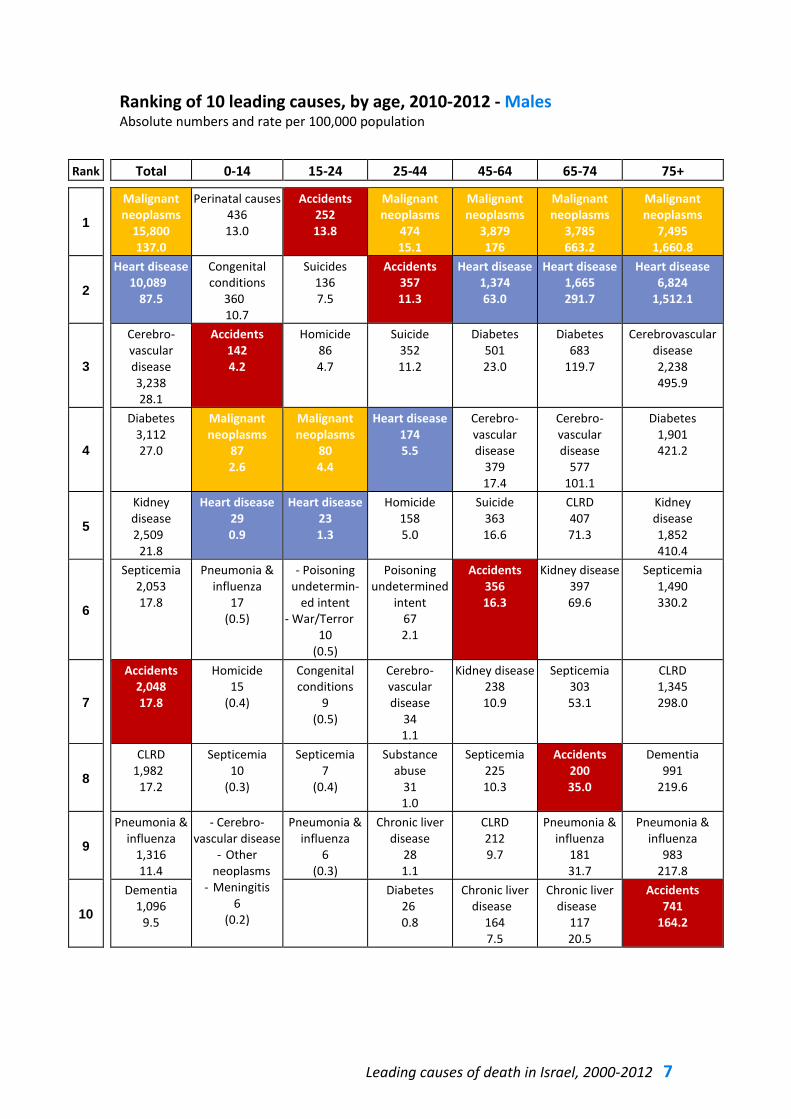
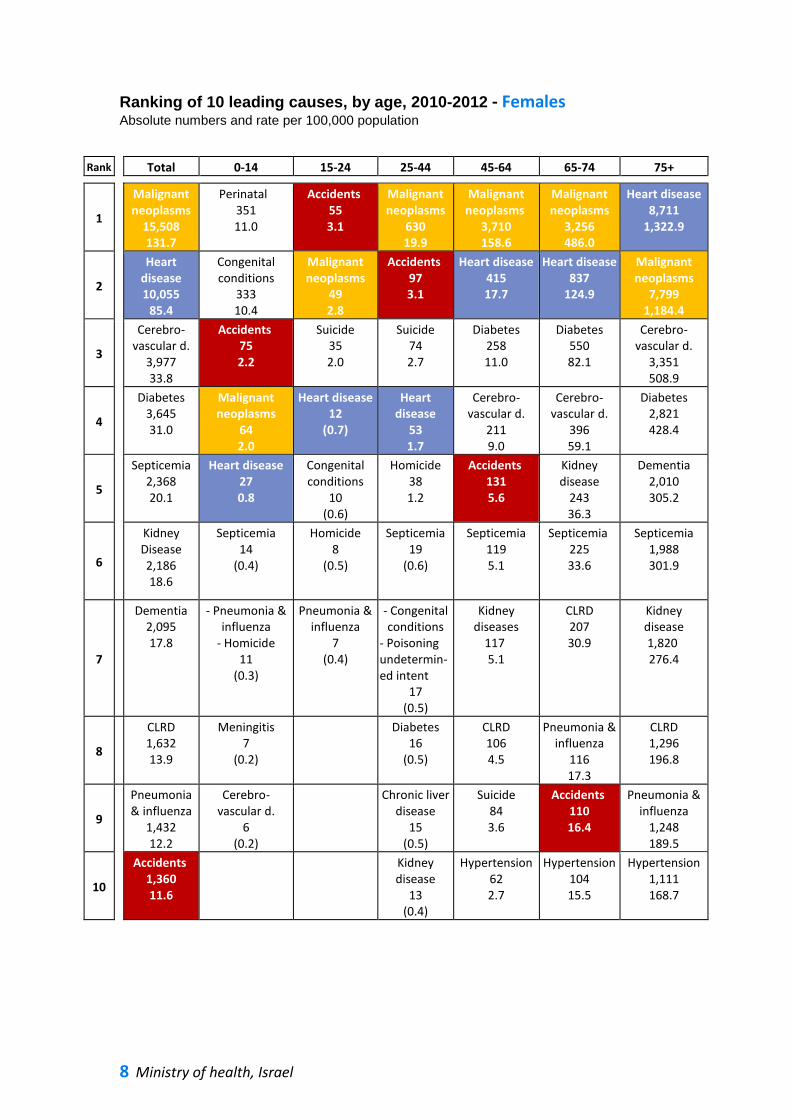
Ranking of leading causes of death in Israel by age
On average in 2010-2012, cancer was the leading underlying cause of death for total deaths,
and amongst females aged 25-74 and males over 25. Heart disease was the leading cause for
females over 75, and the second cause for males over 45 and females aged 45-74. For both
genders, accidents were the leading cause for age 15-24 and the second cause for 25-44.
Suicide was the second cause of death for males aged 15-24, and the 3rd cause for males aged
25-44 and females aged 15-44.
All ages: In recent years, about a quarter of all male and female deaths in Israel were from
cancer, and a fifth from heart disease. The 3rd and 4th causes were cerebrovascular disease
and diabetes, whose rates have been similar in recent years, and the following cause was
kidney disease. These five leading causes account for about 60% of all deaths in recent years.
Age 0-4: In 2012, conditions of the perinatal period (perinatal) and congenital malformations,
deformations and chromosomal abnormalities (congenital conditions) were the leading
causes, followed by accidents. These causes accounted for about 70% of deaths at this age.
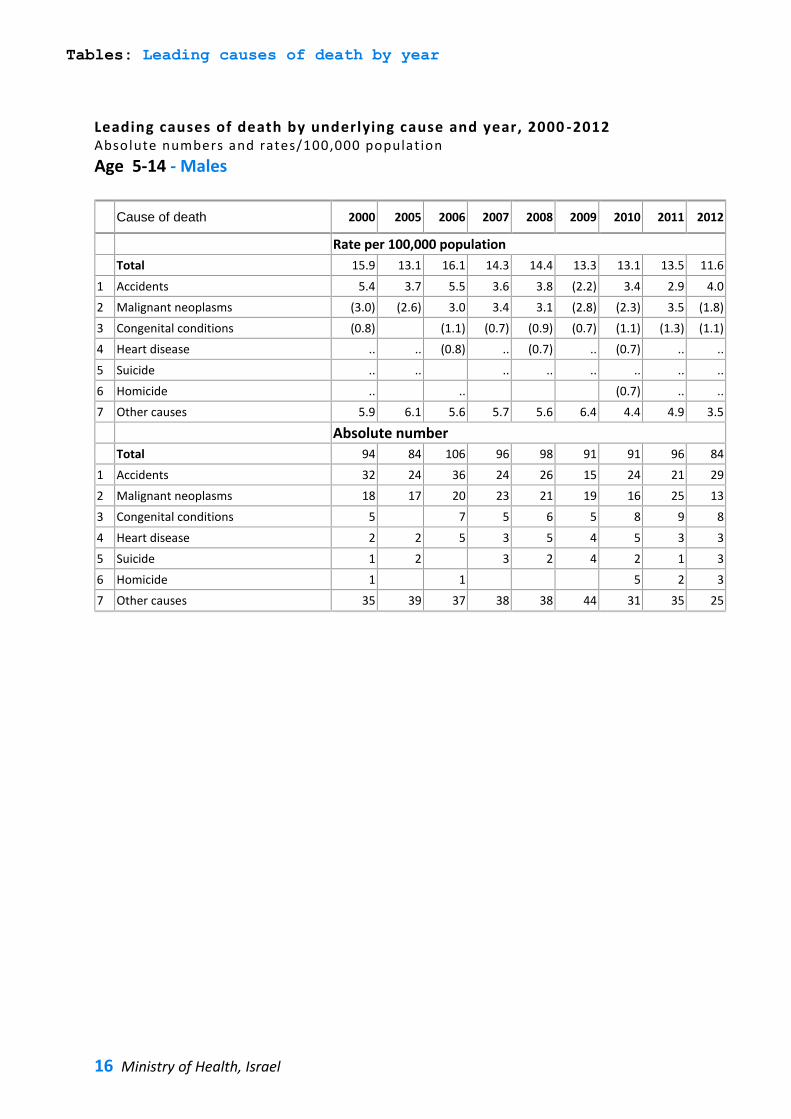
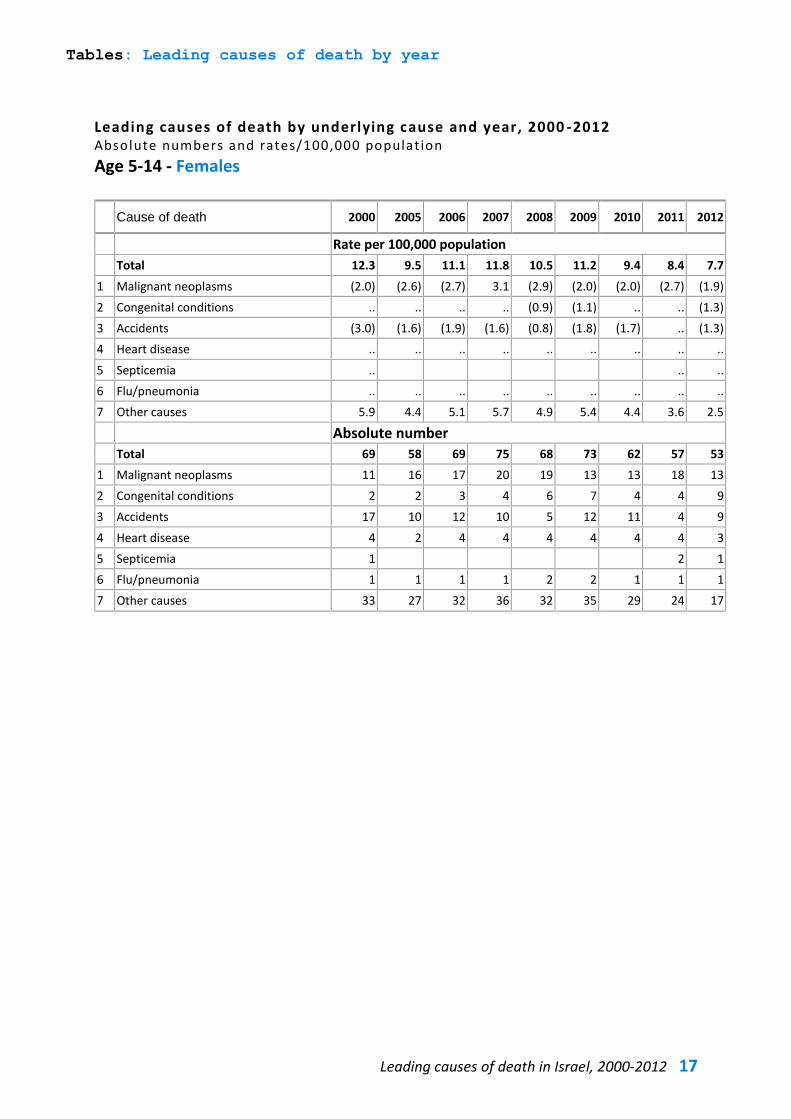
Age 5-14: Accidents and cancer were the leading causes for boys in 2012, while they had the
opposite ranking for girls. For boys the 3rd cause was congenital conditions, with the same
number of deaths as accidents for girls.
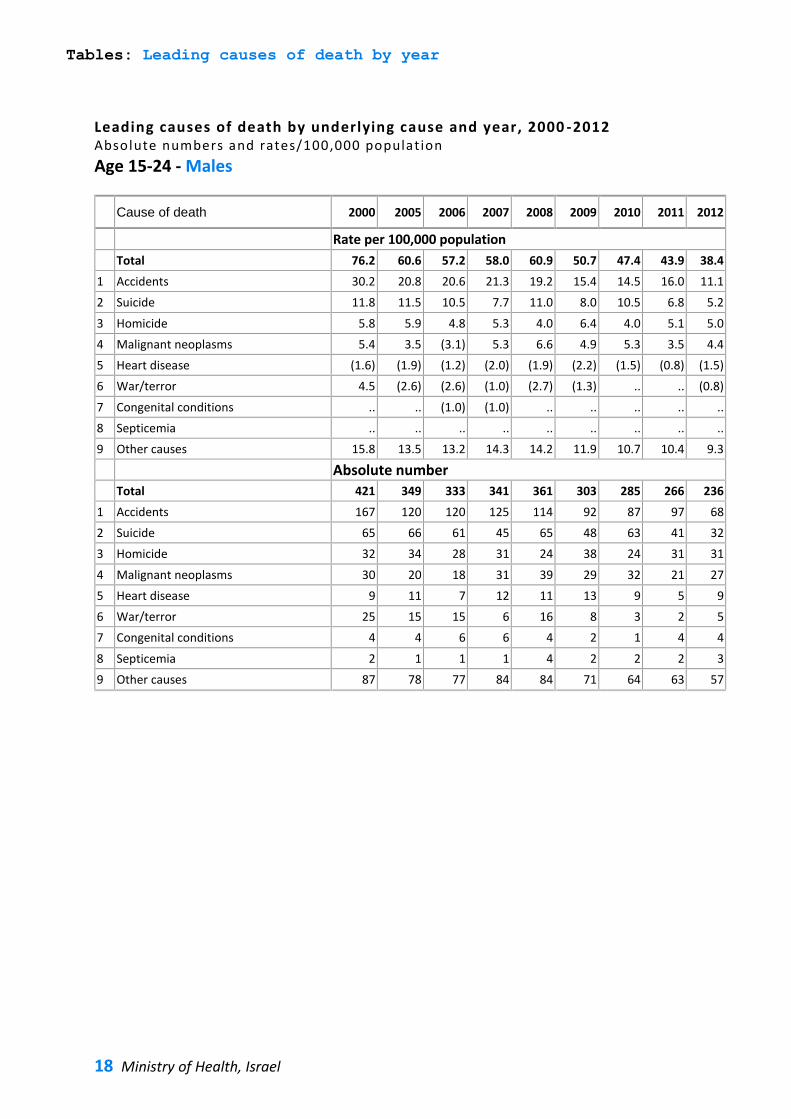
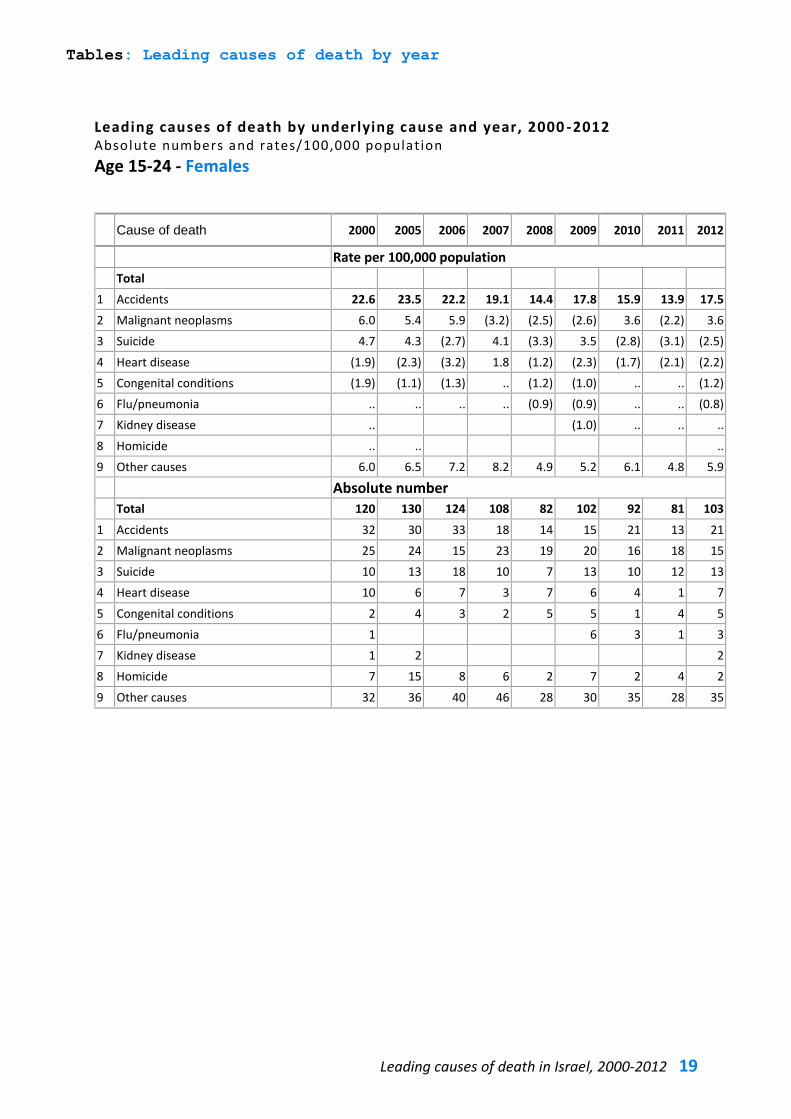
Age 15-24: In 2012, the external causes of accidents, suicide and homicide were the 3 leading
causes for boys. For girls, too, accidents were the leading cause followed by cancer (4th for
boys) and suicide.
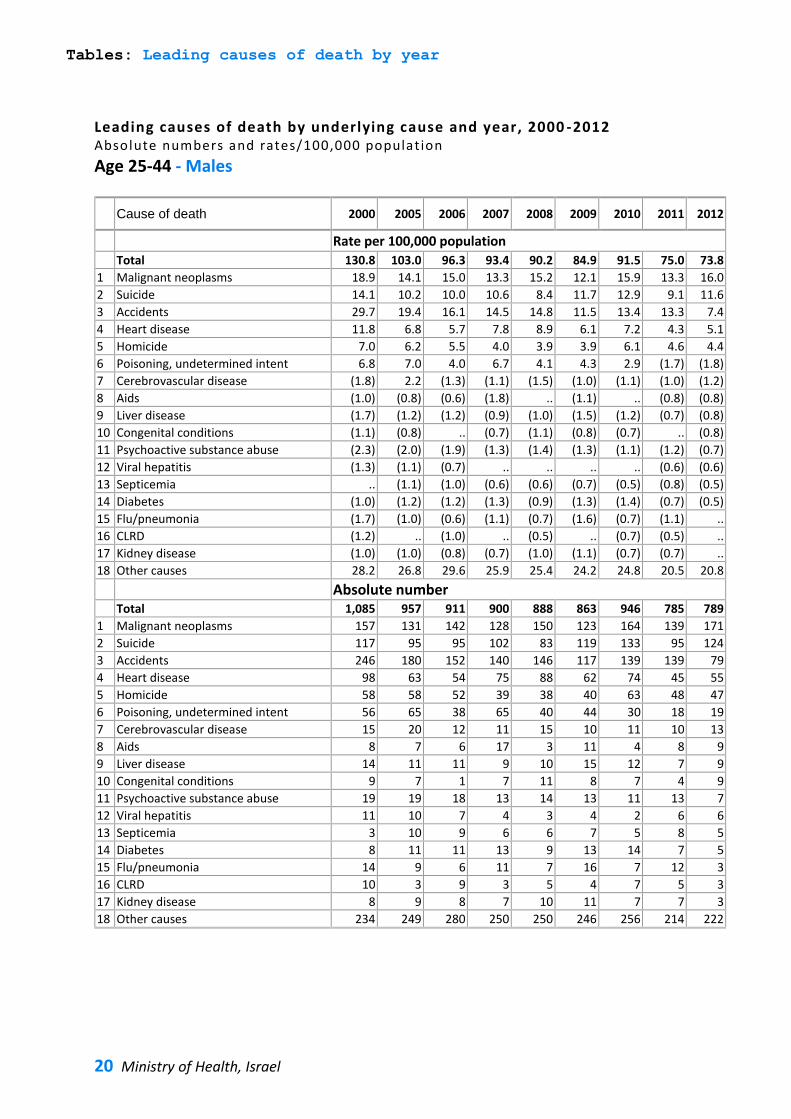
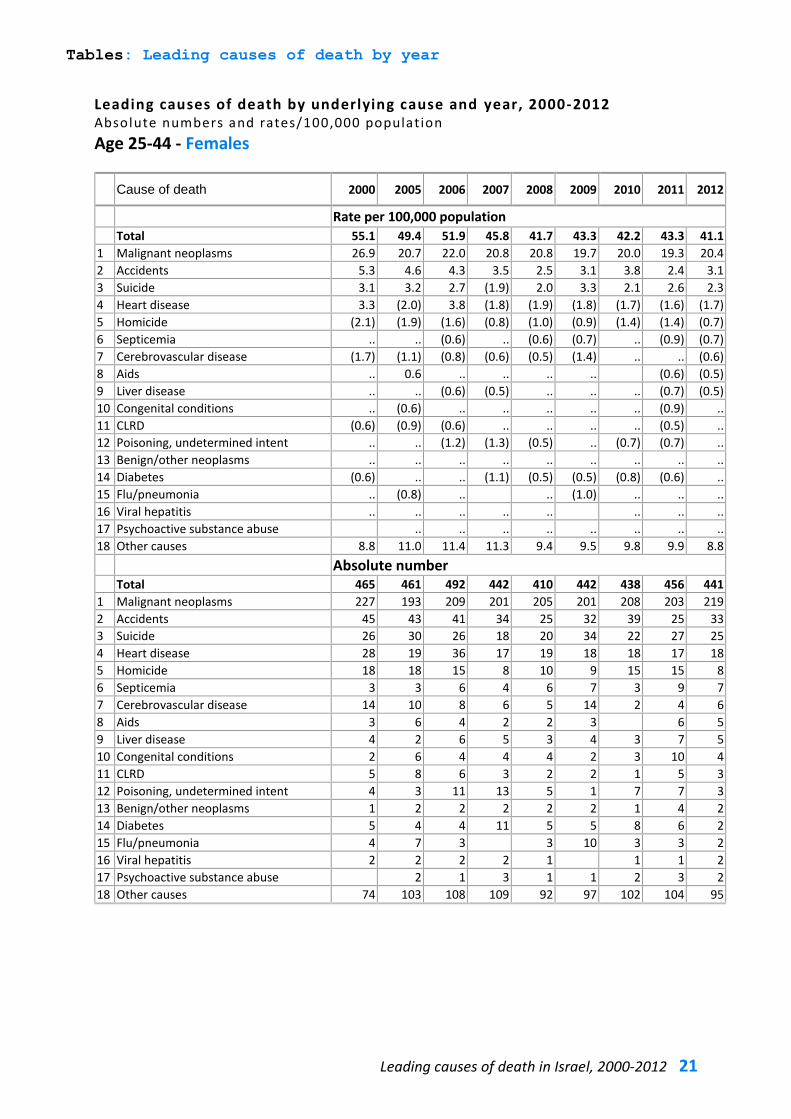
Age 25-44: Cancer was the leading cause for both genders in 2012, suicide 2nd and accidents
3rd for males, with the reverse ranking for females, followed by heart disease 4th and homicide
5th for both genders. Amongst males, poisoning with undetermined intent was the next cause,
which may be connected with drug abuse.
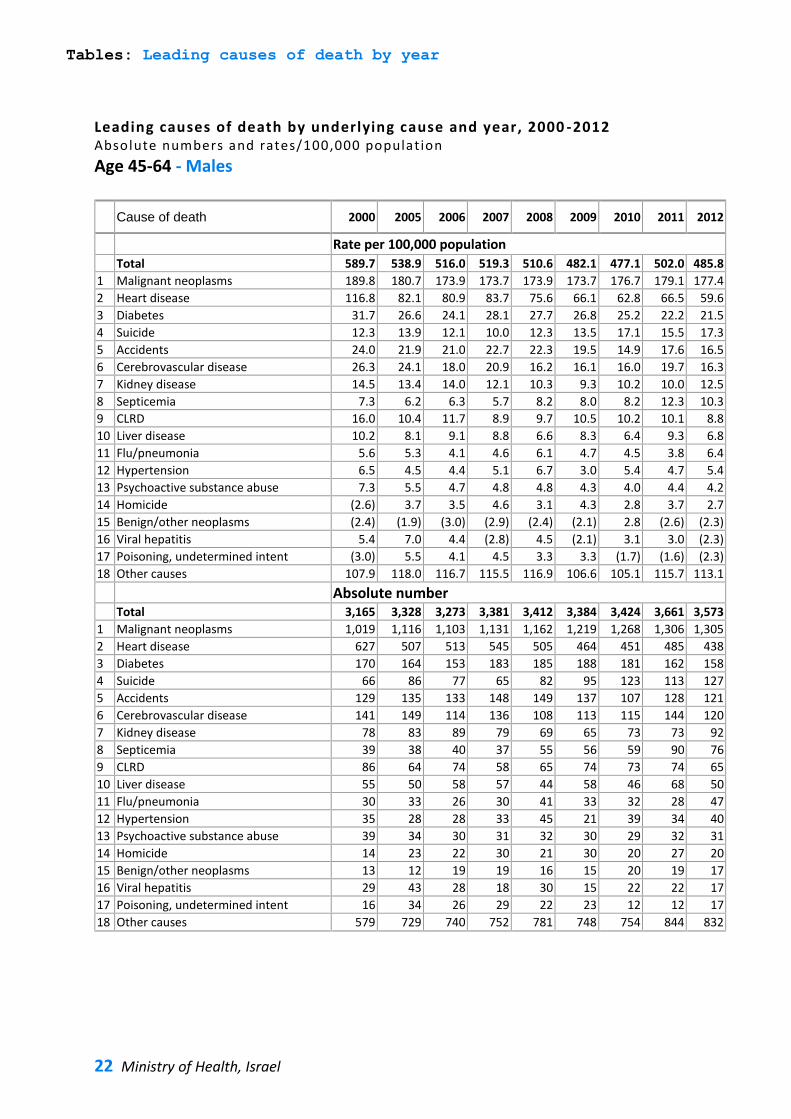
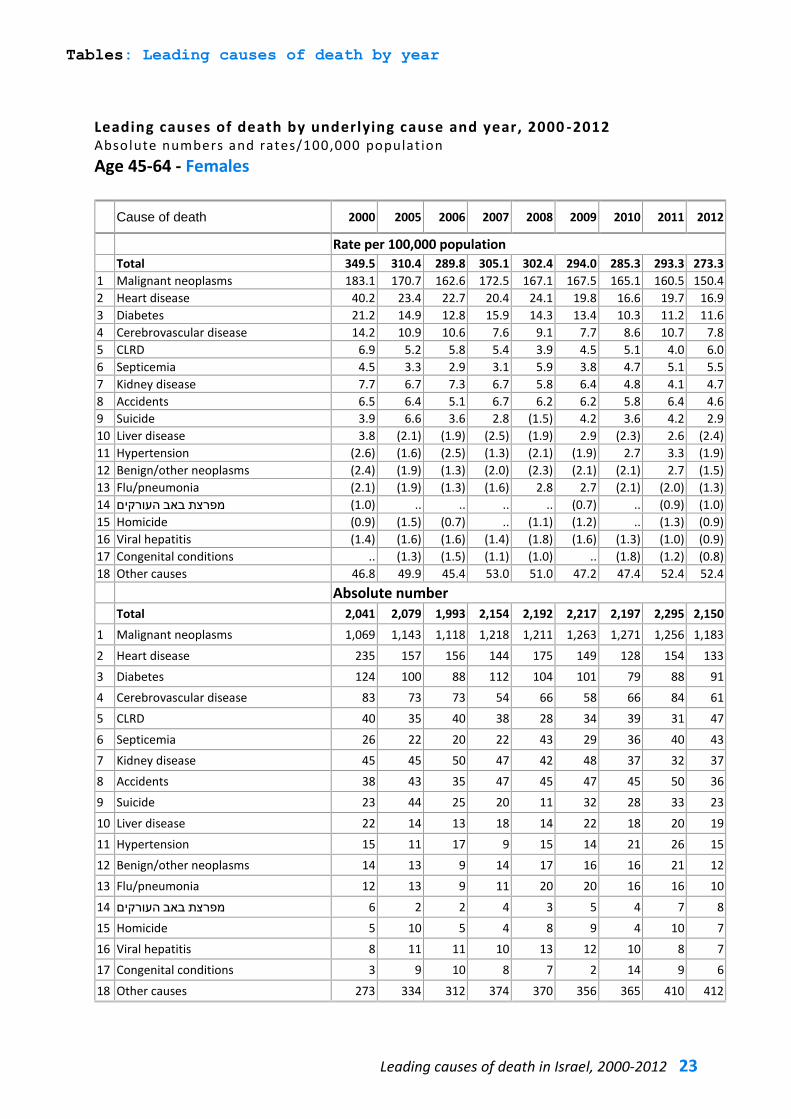
Age 45-74: The 3 leading causes for both genders in 2012 were the same: cancer, heart
disease, and diabetes while cerebrovascular disease was the 4th cause for females aged 45-74
and males aged 65-74. Suicide was the 4th cause for males aged 45-64 and accidents the 5th
cause, while for females the 5th cause was CLRD. For ages 65-74 kidney disease was the 5th
cause for males and septicemia the 6th with the reverse ranking for females.
Age 75 and over: In 2012, cancer was the leading cause for males and heart disease the
second, the ranking was reversed for females. Cerebrovascular disease was the 3rd cause for
both genders, kidney disease 4th for males and diabetes 4th for females and 5th for males.
Septicemia ranked 5th for females and 6th for males. Dementia, a disease which has increased
considerably as underlying cause in recent years, was 6th for females.
Leading causes of death in Israel, 2000-2012 7
Ranking of 10 leading causes, by age, 2010-2012 - Males Absolute numbers and rate per 100,000 population
Rank Total 0-14 15-24 25-44 45-64 65-74 75+
1
Malignant neoplasms
,15 800 7.013
Perinatal causes 364
0.13
Accidents 522 3.81
Malignant neoplasms
744 5.11
Malignant neoplasms
879,3
176
Malignant neoplasms
785,3
63.26
Malignant neoplasms
495,7
60.81,6
2
Heart disease 089,10
87.5
Congenital conditions
036 0.71
Suicides 361
7.5
Accidents 573
1.31
Heart disease ,1 374 3.06
Heart disease 651,6
291.7
Heart disease 824,6
12.11,5
3
Cerebro-vascular disease
,3 238 8.12
Accidents 421
4.2
Homicide 86 4.7
Suicide 523
11.2
Diabetes 015
3.02
Diabetes 836
19.71
Cerebrovascular disease
238,2
95.94
4
Diabetes 123,1 .072
Malignant neoplasms
87 6.2
Malignant neoplasms
08 4.4
Heart disease 741
5.5
Cerebro-vascular disease
937
4.17
Cerebro-vascular disease
775
101.1
Diabetes 011,9
21.24
5
Kidney disease
509,2 8.21
Heart disease 29 0.9
Heart disease 32 3.1
Homicide 815
5.0
Suicide 633
6.61
CLRD 074
1.37
Kidney disease
852,1
410.4
6
Septicemia 2,053
7.81
Pneumonia & influenza
71 )5.0(
- Poisoning undetermin-
ed intent - War/Terror
01 )5.0(
Poisoning undetermined
intent 67
2.1
Accidents 563
6.31
Kidney disease 93 7
69.6
Septicemia 490,1
330.2
7
Accidents 048,2 7.81
Homicide 51
)0.4(
Congenital conditions
9
)5.0(
Cerebro-vascular disease
43
1.1
Kidney disease 382
10.9
Septicemia 303
53.1
CLRD 453,1
98.02
8
CLRD 821,9
7.21
Septicemia 01
)0.3(
Septicemia 7
)4.0(
Substance abuse
31 1.0
Septicemia 252
10.3
Accidents 020
5.03
Dementia 919
219.6
9
Pneumonia & influenza
316,1 4.11
- Cerebro- vascular disease
- Other neoplasms
- Meningitis 6
)0.2(
Pneumonia & influenza
6 )3.0(
Chronic liver disease
28
1.1
CLRD 122
9.7
Pneumonia & influenza
811
1.73
Pneumonia & influenza
839
17.82
10
Dementia
691,0 5.9
Diabetes 26
0.8
Chronic liver disease
164 7.5
Chronic liver disease
171 20.5
Accidents 417
2.641
8 Ministry of health, Israel
Ranking of 10 leading causes, by age, 2010-2012 - Females Absolute numbers and rate per 100,000 population
Rank Total 0-14 15-24 25-44 45-64 65-74 75+
1
Malignant neoplasms
508,15
.7131
Perinatal 351 1.01
Accidents 55
3.1
Malignant neoplasms
630 9.19
Malignant neoplasms
013,7 58.61
Malignant neoplasms
256,3 86.04
Heart disease 8,711
22.91,3
2
Heart disease
055,10 5.48
Congenital conditions
333
10.4
Malignant neoplasms
49
2.8
Accidents 79
3.1
Heart disease 154
7.71
Heart disease 378
24.91
Malignant neoplasms
799,7
4.41,18
3
Cerebro-vascular d.
977,3
8.33
Accidents 57
2.2
Suicide 35
2.0
Suicide 74
7.2
Diabetes 582
0.11
Diabetes 505
2.18
Cerebro-vascular d.
351,3
508.9
4
Diabetes 453,6
0.13
Malignant neoplasms
46
0.2
Heart disease 12
(7.0)
Heart disease
53
1.7
Cerebro-vascular d.
112
9.0
Cerebro-vascular d.
963
59.1
Diabetes 821,2
28.44
5
Septicemia 2,368 20.1
Heart disease 27
8.0
Congenital conditions
10 )0.6(
Homicide 83
2.1
Accidents 311
5.6
Kidney disease
432
6.33
Dementia 2,010
305.2
6
Kidney Disease
862,1 6.18
Septicemia 14
(0.4)
Homicide 8
)5.0(
Septicemia 19
(0.6)
Septicemia 191
5.1
Septicemia 252
3.63
Septicemia 988,1
301.9
7
Dementia 2,095
7.81
- Pneumonia & influenza
- Homicide 11
)0.3(
Pneumonia & influenza
7 )4.0(
- Congenital conditions
- Poisoning undetermin- ed intent
17 )0.5(
Kidney diseases
711
1.5
CLRD 207
30.9
Kidney disease
820,1 4.276
8
CLRD 632,1
9.13
Meningitis 7
(0.2)
Diabetes 16
(0.5)
CLRD 610
4.5
Pneumonia & influenza
161 7.31
CLRD 961,2
96.81
9
Pneumonia & influenza
321,4
2.12
Cerebro-vascular d.
6 (0.2)
Chronic liver disease
15 )5.0(
Suicide 84
3.6
Accidents 110
16.4
Pneumonia & influenza
481,2
89.51
10
Accidents 1,360
6.11
Kidney disease
13 (0.4)
Hypertension 26
7.2
Hypertension 104 5.51
Hypertension 111,1
8.716
Leading causes of death in Israel, 2000-2012 9
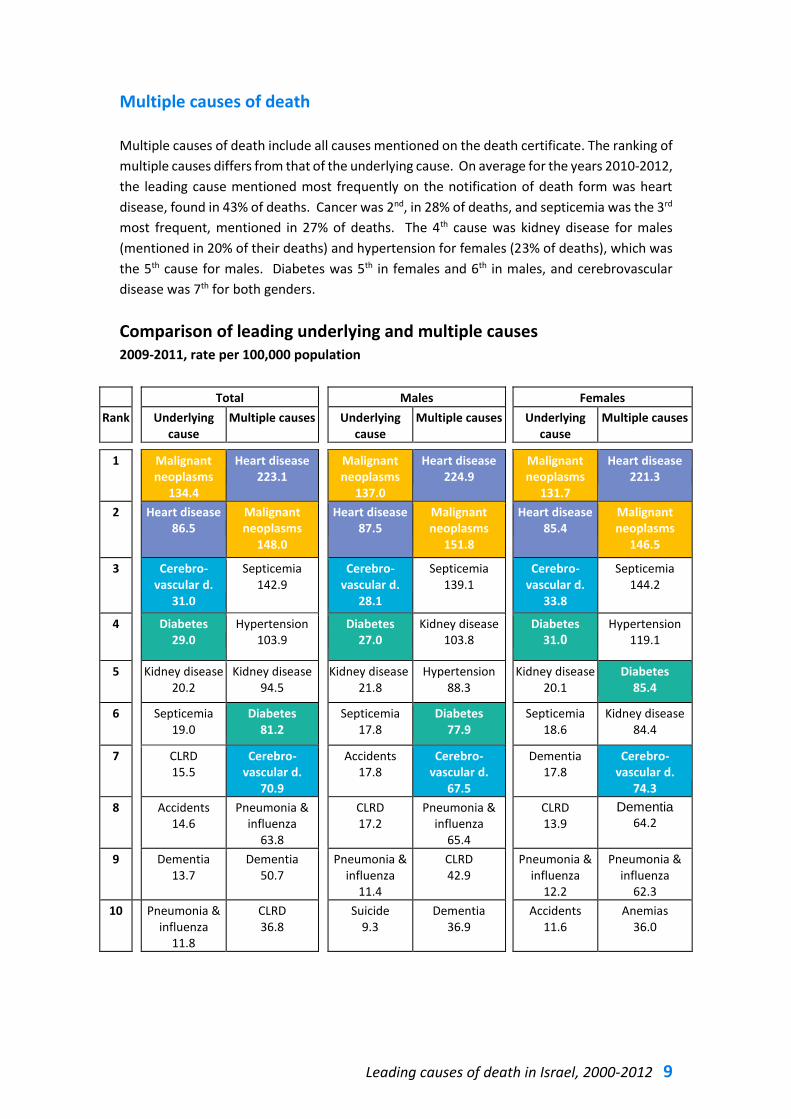
Multiple causes of death
Multiple causes of death include all causes mentioned on the death certificate. The ranking of
multiple causes differs from that of the underlying cause. On average for the years 2010-2012,
the leading cause mentioned most frequently on the notification of death form was heart
disease, found in 43% of deaths. Cancer was 2nd, in 28% of deaths, and septicemia was the 3rd
most frequent, mentioned in 27% of deaths. The 4th cause was kidney disease for males
(mentioned in 20% of their deaths) and hypertension for females (23% of deaths), which was
the 5th cause for males. Diabetes was 5th in females and 6th in males, and cerebrovascular
disease was 7th for both genders.
Comparison of leading underlying and multiple causes 2009-2011, rate per 100,000 population
Total Males Females
Rank Underlying cause
Multiple causes Underlying cause
Multiple causes Underlying cause
Multiple causes
1 Malignant
neoplasms 134.4
Heart disease 223.1
Malignant neoplasms
137.0
Heart disease 224.9
Malignant neoplasms
.7131
Heart disease 221.3
2 Heart disease 6.58
Malignant neoplasms
148.0
Heart disease 87.5
Malignant neoplasms
151.8
Heart disease 5.48
Malignant neoplasms
146.5
3 Cerebro-vascular d.
1.03
Septicemia 142.9
Cerebro-vascular d.
8.12
Septicemia 139.1
Cerebro-vascular d.
8.33
Septicemia 144.2
4 Diabetes 0.29
Hypertension 103.9
Diabetes 7.02
Kidney disease 103.8
Diabetes 0.31
Hypertension 119.1
5 Kidney disease 20.2
Kidney disease 94.5
Kidney disease .21 8
Hypertension 88.3
Kidney disease 20.1
Diabetes 85.4
6 Septicemia 9.01
Diabetes 81.2
Septicemia 7.81
Diabetes 77.9
Septicemia 8.61
Kidney disease 84.4
7 CLRD .15 5
Cerebro-vascular d.
70.9
Accidents 7.81
Cerebro-vascular d.
67.5
Dementia 7.81
Cerebro-vascular d.
74.3
8 Accidents 4.61
Pneumonia & influenza
63.8
CLRD 7.21
Pneumonia & influenza
65.4
CLRD 9.13
Dementia 64.2
9 Dementia 3.71
Dementia 50.7
Pneumonia & influenza
11.4
CLRD 42.9
Pneumonia & influenza
2.12
Pneumonia & influenza
62.3
10 Pneumonia & influenza
8.11
CLRD 36.8
Suicide 3.9
Dementia 36.9
Accidents 6.11
Anemias 36.0
Tables: Leading causes of death by year
10 Ministry of Health, Israel
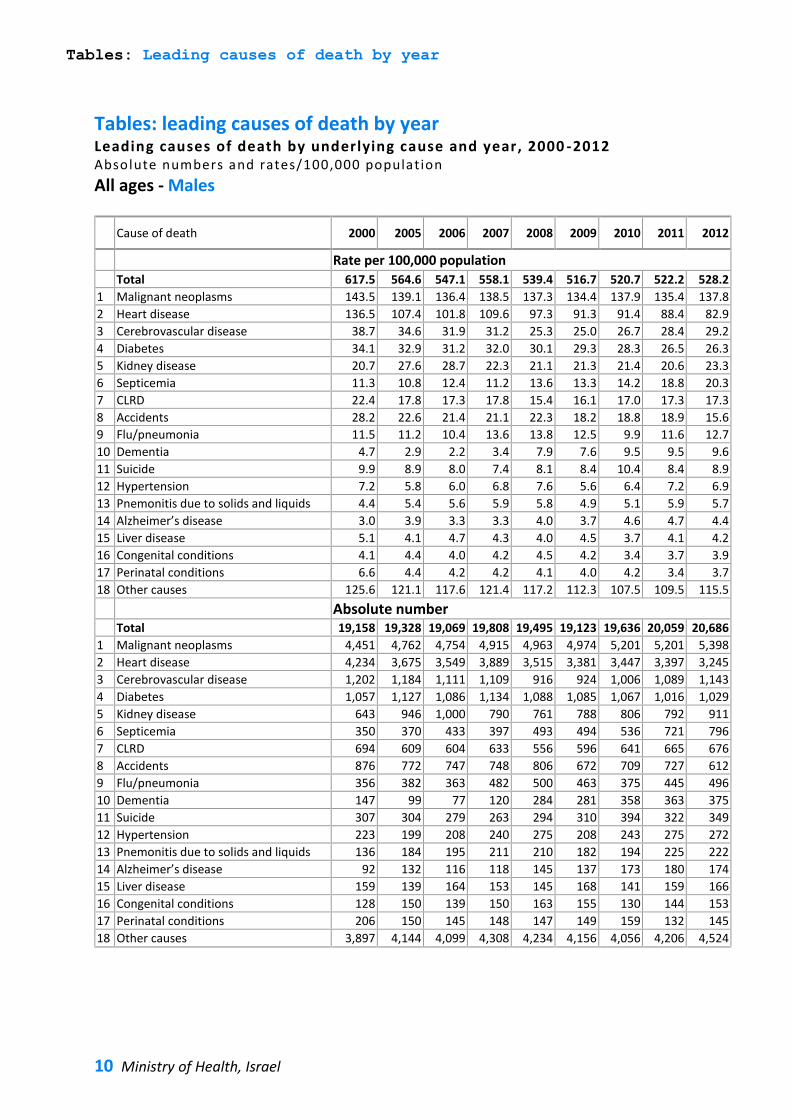
Tables: leading causes of death by year Leading causes of death by underlying cause and year, 2000 -2012 Absolute numbers and rates/100,000 population
All ages - Males
Cause of death 2000 2005 2006 2007 2008 2009 2010 2011 2012
Rate per 100,000 population
Total 617.5 564.6 547.1 558.1 539.4 516.7 520.7 522.2 528.2
1 Malignant neoplasms 143.5 139.1 136.4 138.5 137.3 134.4 137.9 135.4 137.8
2 Heart disease 136.5 107.4 101.8 109.6 97.3 91.3 91.4 88.4 82.9
3 Cerebrovascular disease 38.7 34.6 31.9 31.2 25.3 25.0 26.7 28.4 29.2
4 Diabetes 34.1 32.9 31.2 32.0 30.1 29.3 28.3 26.5 26.3
5 Kidney disease 20.7 27.6 28.7 22.3 21.1 21.3 21.4 20.6 23.3
6 Septicemia 11.3 10.8 12.4 11.2 13.6 13.3 14.2 18.8 20.3
7 CLRD 22.4 17.8 17.3 17.8 15.4 16.1 17.0 17.3 17.3
8 Accidents 28.2 22.6 21.4 21.1 22.3 18.2 18.8 18.9 15.6
9 Flu/pneumonia 11.5 11.2 10.4 13.6 13.8 12.5 9.9 11.6 12.7
10 Dementia 4.7 2.9 2.2 3.4 7.9 7.6 9.5 9.5 9.6
11 Suicide 9.9 8.9 8.0 7.4 8.1 8.4 10.4 8.4 8.9
12 Hypertension 7.2 5.8 6.0 6.8 7.6 5.6 6.4 7.2 6.9
13 Pnemonitis due to solids and liquids 4.4 5.4 5.6 5.9 5.8 4.9 5.1 5.9 5.7
14 Alzheimer’s disease 3.0 3.9 3.3 3.3 4.0 3.7 4.6 4.7 4.4
15 Liver disease 5.1 4.1 4.7 4.3 4.0 4.5 3.7 4.1 4.2
16 Congenital conditions 4.1 4.4 4.0 4.2 4.5 4.2 3.4 3.7 3.9
17 Perinatal conditions 6.6 4.4 4.2 4.2 4.1 4.0 4.2 3.4 3.7
18 Other causes 125.6 121.1 117.6 121.4 117.2 112.3 107.5 109.5 115.5
Absolute number Total 19,158 19,328 19,069 19,808 19,495 19,123 19,636 20,059 20,686
1 Malignant neoplasms 4,451 4,762 4,754 4,915 4,963 4,974 5,201 5,201 5,398
2 Heart disease 4,234 3,675 3,549 3,889 3,515 3,381 3,447 3,397 3,245
3 Cerebrovascular disease 1,202 1,184 1,111 1,109 916 924 1,006 1,089 1,143
4 Diabetes 1,057 1,127 1,086 1,134 1,088 1,085 1,067 1,016 1,029
5 Kidney disease 643 946 1,000 790 761 788 806 792 911
6 Septicemia 350 370 433 397 493 494 536 721 796
7 CLRD 694 609 604 633 556 596 641 665 676
8 Accidents 876 772 747 748 806 672 709 727 612
9 Flu/pneumonia 356 382 363 482 500 463 375 445 496
10 Dementia 147 99 77 120 284 281 358 363 375
11 Suicide 307 304 279 263 294 310 394 322 349
12 Hypertension 223 199 208 240 275 208 243 275 272
13 Pnemonitis due to solids and liquids 136 184 195 211 210 182 194 225 222
14 Alzheimer’s disease 92 132 116 118 145 137 173 180 174
15 Liver disease 159 139 164 153 145 168 141 159 166
16 Congenital conditions 128 150 139 150 163 155 130 144 153
17 Perinatal conditions 206 150 145 148 147 149 159 132 145
18 Other causes 3,897 4,144 4,099 4,308 4,234 4,156 4,056 4,206 4,524
Tables: Leading causes of death by year
11 Leading causes of death in Israel, 2000-2012
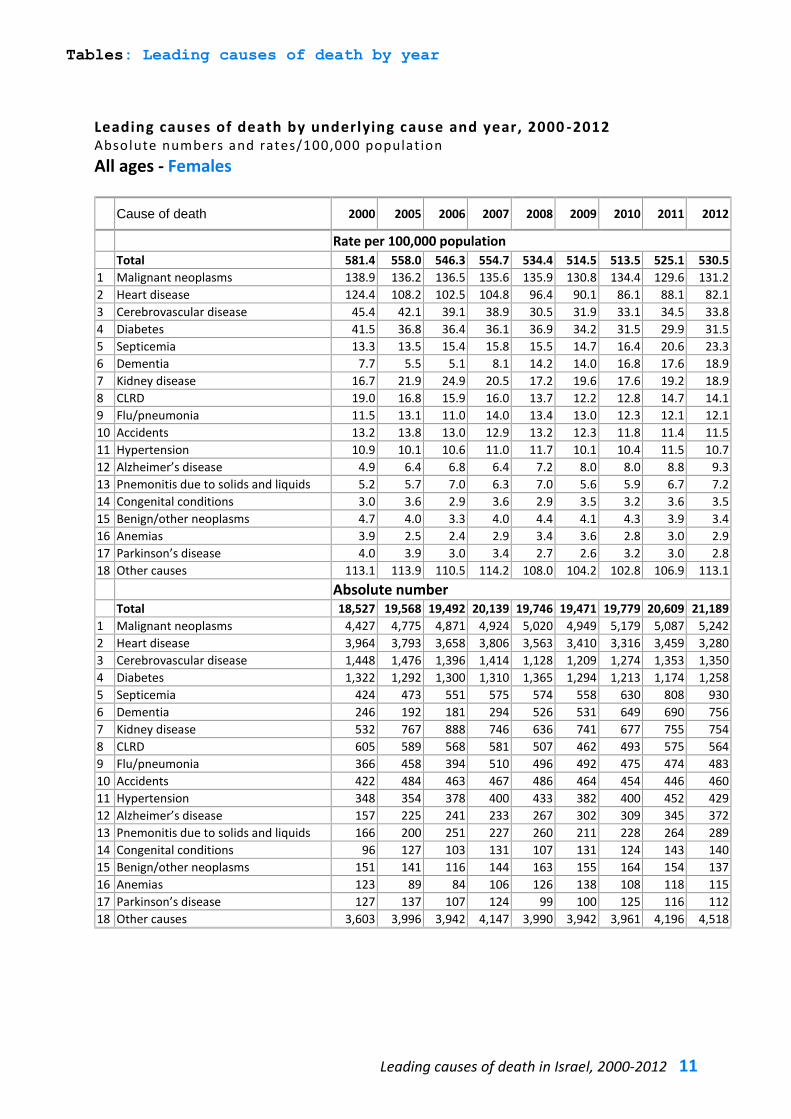
Leading causes of death by underlying cause and year, 2000 -2012 Absolute numbers and rates/100,000 population All ages - Females
Cause of death 2000 2005 2006 2007 2008 2009 2010 2011 2012
Rate per 100,000 population
Total 581.4 558.0 546.3 554.7 534.4 514.5 513.5 525.1 530.5
1 Malignant neoplasms 138.9 136.2 136.5 135.6 135.9 130.8 134.4 129.6 131.2
2 Heart disease 124.4 108.2 102.5 104.8 96.4 90.1 86.1 88.1 82.1
3 Cerebrovascular disease 45.4 42.1 39.1 38.9 30.5 31.9 33.1 34.5 33.8
4 Diabetes 41.5 36.8 36.4 36.1 36.9 34.2 31.5 29.9 31.5
5 Septicemia 13.3 13.5 15.4 15.8 15.5 14.7 16.4 20.6 23.3
6 Dementia 7.7 5.5 5.1 8.1 14.2 14.0 16.8 17.6 18.9
7 Kidney disease 16.7 21.9 24.9 20.5 17.2 19.6 17.6 19.2 18.9
8 CLRD 19.0 16.8 15.9 16.0 13.7 12.2 12.8 14.7 14.1
9 Flu/pneumonia 11.5 13.1 11.0 14.0 13.4 13.0 12.3 12.1 12.1
10 Accidents 13.2 13.8 13.0 12.9 13.2 12.3 11.8 11.4 11.5
11 Hypertension 10.9 10.1 10.6 11.0 11.7 10.1 10.4 11.5 10.7
12 Alzheimer’s disease 4.9 6.4 6.8 6.4 7.2 8.0 8.0 8.8 9.3
13 Pnemonitis due to solids and liquids 5.2 5.7 7.0 6.3 7.0 5.6 5.9 6.7 7.2
14 Congenital conditions 3.0 3.6 2.9 3.6 2.9 3.5 3.2 3.6 3.5
15 Benign/other neoplasms 4.7 4.0 3.3 4.0 4.4 4.1 4.3 3.9 3.4
16 Anemias 3.9 2.5 2.4 2.9 3.4 3.6 2.8 3.0 2.9
17 Parkinson’s disease 4.0 3.9 3.0 3.4 2.7 2.6 3.2 3.0 2.8
18 Other causes 113.1 113.9 110.5 114.2 108.0 104.2 102.8 106.9 113.1
Absolute number Total 18,527 19,568 19,492 20,139 19,746 19,471 19,779 20,609 21,189
1 Malignant neoplasms 4,427 4,775 4,871 4,924 5,020 4,949 5,179 5,087 5,242
2 Heart disease 3,964 3,793 3,658 3,806 3,563 3,410 3,316 3,459 3,280
3 Cerebrovascular disease 1,448 1,476 1,396 1,414 1,128 1,209 1,274 1,353 1,350
4 Diabetes 1,322 1,292 1,300 1,310 1,365 1,294 1,213 1,174 1,258
5 Septicemia 424 473 551 575 574 558 630 808 930
6 Dementia 246 192 181 294 526 531 649 690 756
7 Kidney disease 532 767 888 746 636 741 677 755 754
8 CLRD 605 589 568 581 507 462 493 575 564
9 Flu/pneumonia 366 458 394 510 496 492 475 474 483
10 Accidents 422 484 463 467 486 464 454 446 460
11 Hypertension 348 354 378 400 433 382 400 452 429
12 Alzheimer’s disease 157 225 241 233 267 302 309 345 372
13 Pnemonitis due to solids and liquids 166 200 251 227 260 211 228 264 289
14 Congenital conditions 96 127 103 131 107 131 124 143 140
15 Benign/other neoplasms 151 141 116 144 163 155 164 154 137
16 Anemias 123 89 84 106 126 138 108 118 115
17 Parkinson’s disease 127 137 107 124 99 100 125 116 112
18 Other causes 3,603 3,996 3,942 4,147 3,990 3,942 3,961 4,196 4,518
Tables: Leading causes of death by year
12 Ministry of Health, Israel
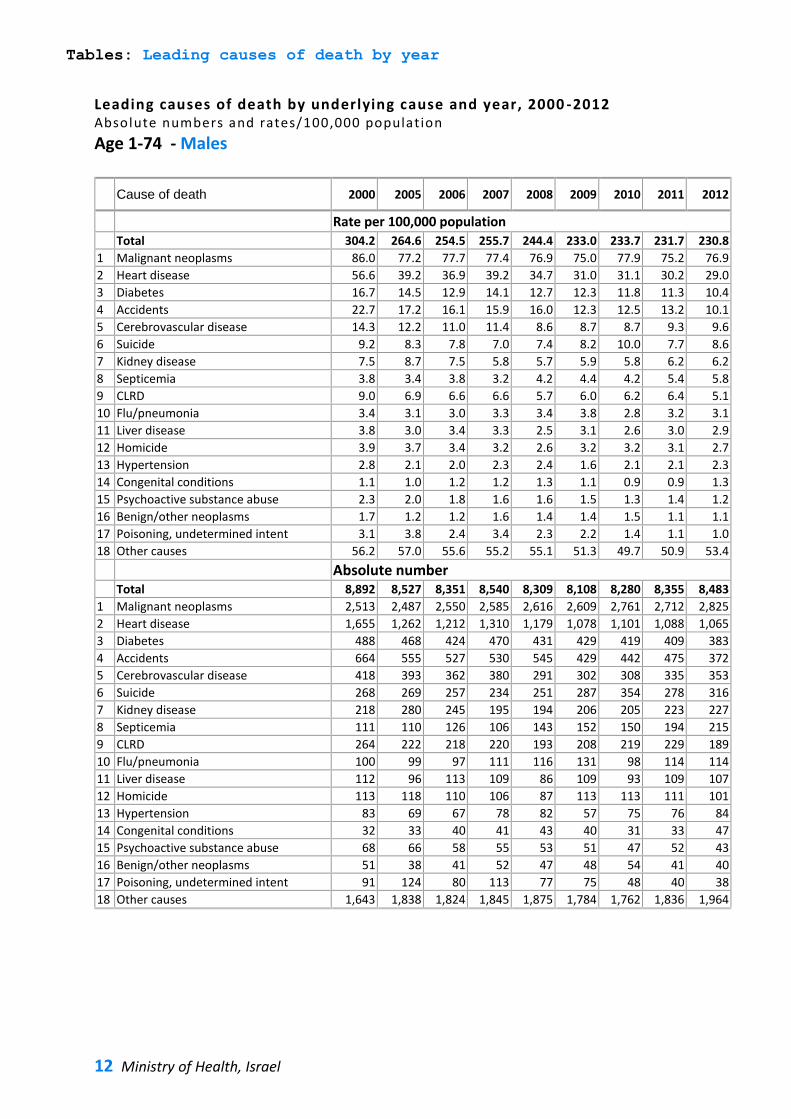
Leading causes of death by underlying cause and year, 2000 -2012 Absolute numbers and rates/100,000 population Age 74-1 - Males
Cause of death 2000 2005 2006 2007 2008 2009 2010 2011 2012
Rate per 100,000 population
Total 304.2 264.6 254.5 255.7 244.4 233.0 233.7 231.7 230.8
1 Malignant neoplasms 86.0 77.2 77.7 77.4 76.9 75.0 77.9 75.2 76.9
2 Heart disease 56.6 39.2 36.9 39.2 34.7 31.0 31.1 30.2 29.0
3 Diabetes 16.7 14.5 12.9 14.1 12.7 12.3 11.8 11.3 10.4
4 Accidents 22.7 17.2 16.1 15.9 16.0 12.3 12.5 13.2 10.1
5 Cerebrovascular disease 14.3 12.2 11.0 11.4 8.6 8.7 8.7 9.3 9.6
6 Suicide 9.2 8.3 7.8 7.0 7.4 8.2 10.0 7.7 8.6
7 Kidney disease 7.5 8.7 7.5 5.8 5.7 5.9 5.8 6.2 6.2
8 Septicemia 3.8 3.4 3.8 3.2 4.2 4.4 4.2 5.4 5.8
9 CLRD 9.0 6.9 6.6 6.6 5.7 6.0 6.2 6.4 5.1
10 Flu/pneumonia 3.4 3.1 3.0 3.3 3.4 3.8 2.8 3.2 3.1
11 Liver disease 3.8 3.0 3.4 3.3 2.5 3.1 2.6 3.0 2.9
12 Homicide 3.9 3.7 3.4 3.2 2.6 3.2 3.2 3.1 2.7
13 Hypertension 2.8 2.1 2.0 2.3 2.4 1.6 2.1 2.1 2.3
14 Congenital conditions 1.1 1.0 1.2 1.2 1.3 1.1 0.9 0.9 1.3
15 Psychoactive substance abuse 2.3 2.0 1.8 1.6 1.6 1.5 1.3 1.4 1.2
16 Benign/other neoplasms 1.7 1.2 1.2 1.6 1.4 1.4 1.5 1.1 1.1
17 Poisoning, undetermined intent 3.1 3.8 2.4 3.4 2.3 2.2 1.4 1.1 1.0
18 Other causes 56.2 57.0 55.6 55.2 55.1 51.3 49.7 50.9 53.4
Absolute number Total 8,892 8,527 8,351 8,540 8,309 8,108 8,280 8,355 8,483
1 Malignant neoplasms 2,513 2,487 2,550 2,585 2,616 2,609 2,761 2,712 2,825
2 Heart disease 1,655 1,262 1,212 1,310 1,179 1,078 1,101 1,088 1,065
3 Diabetes 488 468 424 470 431 429 419 409 383
4 Accidents 664 555 527 530 545 429 442 475 372
5 Cerebrovascular disease 418 393 362 380 291 302 308 335 353
6 Suicide 268 269 257 234 251 287 354 278 316
7 Kidney disease 218 280 245 195 194 206 205 223 227
8 Septicemia 111 110 126 106 143 152 150 194 215
9 CLRD 264 222 218 220 193 208 219 229 189
10 Flu/pneumonia 100 99 97 111 116 131 98 114 114
11 Liver disease 112 96 113 109 86 109 93 109 107
12 Homicide 113 118 110 106 87 113 113 111 101
13 Hypertension 83 69 67 78 82 57 75 76 84
14 Congenital conditions 32 33 40 41 43 40 31 33 47
15 Psychoactive substance abuse 68 66 58 55 53 51 47 52 43
16 Benign/other neoplasms 51 38 41 52 47 48 54 41 40
17 Poisoning, undetermined intent 91 124 80 113 77 75 48 40 38
18 Other causes 1,643 1,838 1,824 1,845 1,875 1,784 1,762 1,836 1,964
Tables: Leading causes of death by year
13 Leading causes of death in Israel, 2000-2012
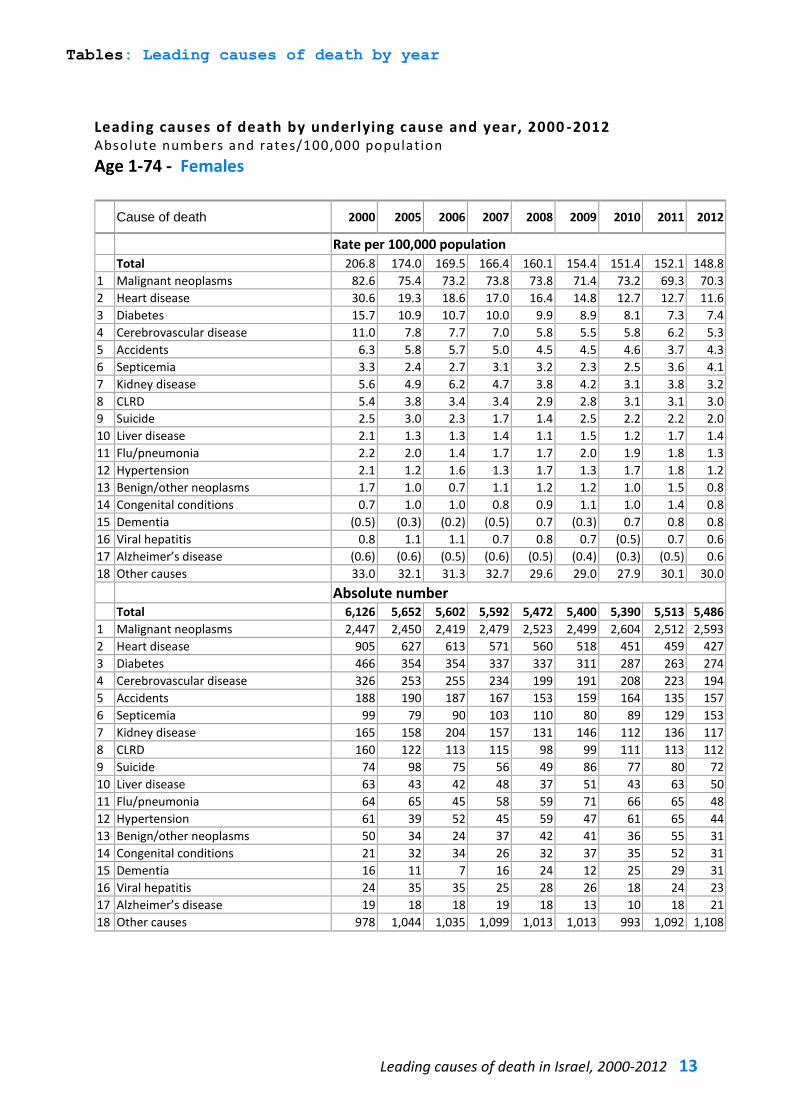
Leading causes of death by underlying cause and year, 2000 -2012 Absolute numbers and rates/100,000 population Age - 74-1 Females
Cause of death 2000 2005 2006 2007 2008 2009 2010 2011 2012
Rate per 100,000 population
Total 206.8 174.0 169.5 166.4 160.1 154.4 151.4 152.1 148.8
1 Malignant neoplasms 82.6 75.4 73.2 73.8 73.8 71.4 73.2 69.3 70.3
2 Heart disease 30.6 19.3 18.6 17.0 16.4 14.8 12.7 12.7 11.6
3 Diabetes 15.7 10.9 10.7 10.0 9.9 8.9 8.1 7.3 7.4
4 Cerebrovascular disease 11.0 7.8 7.7 7.0 5.8 5.5 5.8 6.2 5.3
5 Accidents 6.3 5.8 5.7 5.0 4.5 4.5 4.6 3.7 4.3
6 Septicemia 3.3 2.4 2.7 3.1 3.2 2.3 2.5 3.6 4.1
7 Kidney disease 5.6 4.9 6.2 4.7 3.8 4.2 3.1 3.8 3.2
8 CLRD 5.4 3.8 3.4 3.4 2.9 2.8 3.1 3.1 3.0
9 Suicide 2.5 3.0 2.3 1.7 1.4 2.5 2.2 2.2 2.0
10 Liver disease 2.1 1.3 1.3 1.4 1.1 1.5 1.2 1.7 1.4
11 Flu/pneumonia 2.2 2.0 1.4 1.7 1.7 2.0 1.9 1.8 1.3
12 Hypertension 2.1 1.2 1.6 1.3 1.7 1.3 1.7 1.8 1.2
13 Benign/other neoplasms 1.7 1.0 0.7 1.1 1.2 1.2 1.0 1.5 0.8
14 Congenital conditions 0.7 1.0 1.0 0.8 0.9 1.1 1.0 1.4 0.8
15 Dementia (0.5) (0.3) (0.2) (0.5) 0.7 (0.3) 0.7 0.8 0.8
16 Viral hepatitis 0.8 1.1 1.1 0.7 0.8 0.7 (0.5) 0.7 0.6
17 Alzheimer’s disease (0.6) (0.6) (0.5) (0.6) (0.5) (0.4) (0.3) (0.5) 0.6
18 Other causes 33.0 32.1 31.3 32.7 29.6 29.0 27.9 30.1 30.0
Absolute number Total 6,126 5,652 5,602 5,592 5,472 5,400 5,390 5,513 5,486
1 Malignant neoplasms 2,447 2,450 2,419 2,479 2,523 2,499 2,604 2,512 2,593
2 Heart disease 905 627 613 571 560 518 451 459 427
3 Diabetes 466 354 354 337 337 311 287 263 274
4 Cerebrovascular disease 326 253 255 234 199 191 208 223 194
5 Accidents 188 190 187 167 153 159 164 135 157
6 Septicemia 99 79 90 103 110 80 89 129 153
7 Kidney disease 165 158 204 157 131 146 112 136 117
8 CLRD 160 122 113 115 98 99 111 113 112
9 Suicide 74 98 75 56 49 86 77 80 72
10 Liver disease 63 43 42 48 37 51 43 63 50
11 Flu/pneumonia 64 65 45 58 59 71 66 65 48
12 Hypertension 61 39 52 45 59 47 61 65 44
13 Benign/other neoplasms 50 34 24 37 42 41 36 55 31
14 Congenital conditions 21 32 34 26 32 37 35 52 31
15 Dementia 16 11 7 16 24 12 25 29 31
16 Viral hepatitis 24 35 35 25 28 26 18 24 23
17 Alzheimer’s disease 19 18 18 19 18 13 10 18 21
18 Other causes 978 1,044 1,035 1,099 1,013 1,013 993 1,092 1,108
Tables: Leading causes of death by year
14 Ministry of Health, Israel
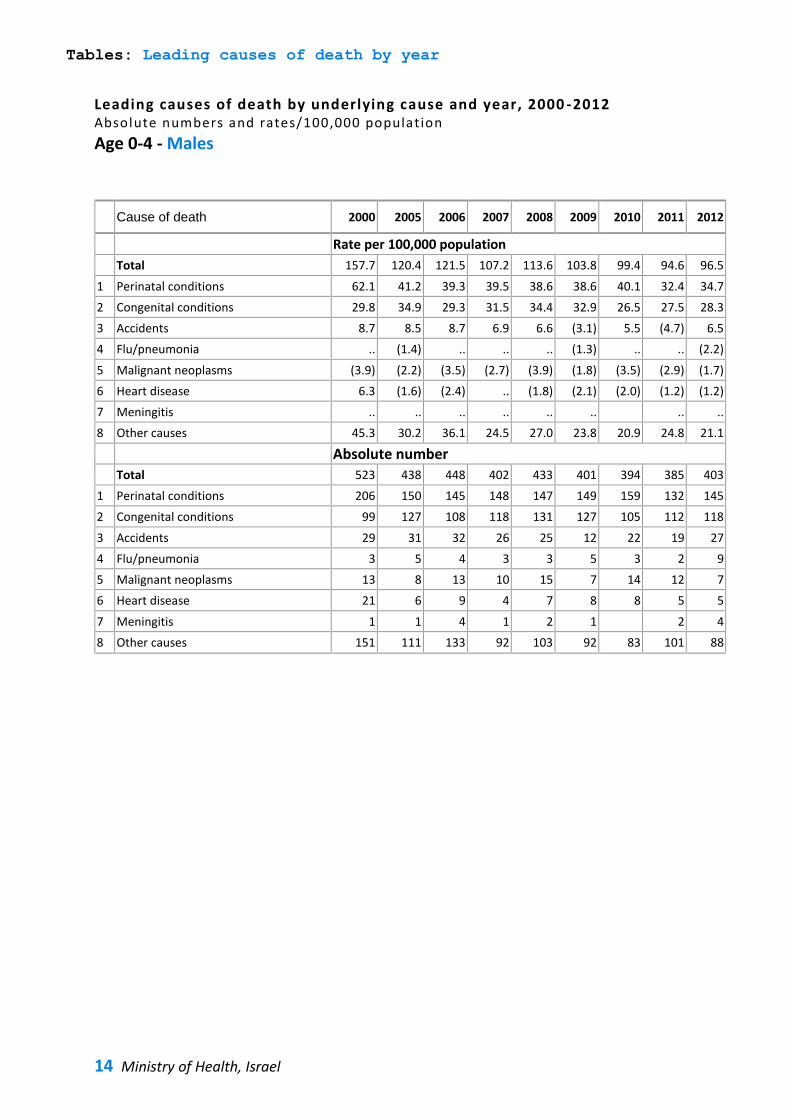
Leading causes of death by underlying cause and year, 2000 -2012 Absolute numbers and rates/100,000 population Age 4-0 - Males
Cause of death 2000 2005 2006 2007 2008 2009 2010 2011 2012
Rate per 100,000 population
Total 157.7 120.4 121.5 107.2 113.6 103.8 99.4 94.6 96.5
1 Perinatal conditions 62.1 41.2 39.3 39.5 38.6 38.6 40.1 32.4 34.7
2 Congenital conditions 29.8 34.9 29.3 31.5 34.4 32.9 26.5 27.5 28.3
3 Accidents 8.7 8.5 8.7 6.9 6.6 (3.1) 5.5 (4.7) 6.5
4 Flu/pneumonia .. (1.4) .. .. .. (1.3) .. .. (2.2)
5 Malignant neoplasms (3.9) (2.2) (3.5) (2.7) (3.9) (1.8) (3.5) (2.9) (1.7)
6 Heart disease 6.3 (1.6) (2.4) .. (1.8) (2.1) (2.0) (1.2) (1.2)
7 Meningitis .. .. .. .. .. .. .. ..
8 Other causes 45.3 30.2 36.1 24.5 27.0 23.8 20.9 24.8 21.1
Absolute number
Total 523 438 448 402 433 401 394 385 403
1 Perinatal conditions 206 150 145 148 147 149 159 132 145
2 Congenital conditions 99 127 108 118 131 127 105 112 118
3 Accidents 29 31 32 26 25 12 22 19 27
4 Flu/pneumonia 3 5 4 3 3 5 3 2 9
5 Malignant neoplasms 13 8 13 10 15 7 14 12 7
6 Heart disease 21 6 9 4 7 8 8 5 5
7 Meningitis 1 1 4 1 2 1 2 4
8 Other causes 151 111 133 92 103 92 83 101 88
Tables: Leading causes of death by year
15 Leading causes of death in Israel, 2000-2012
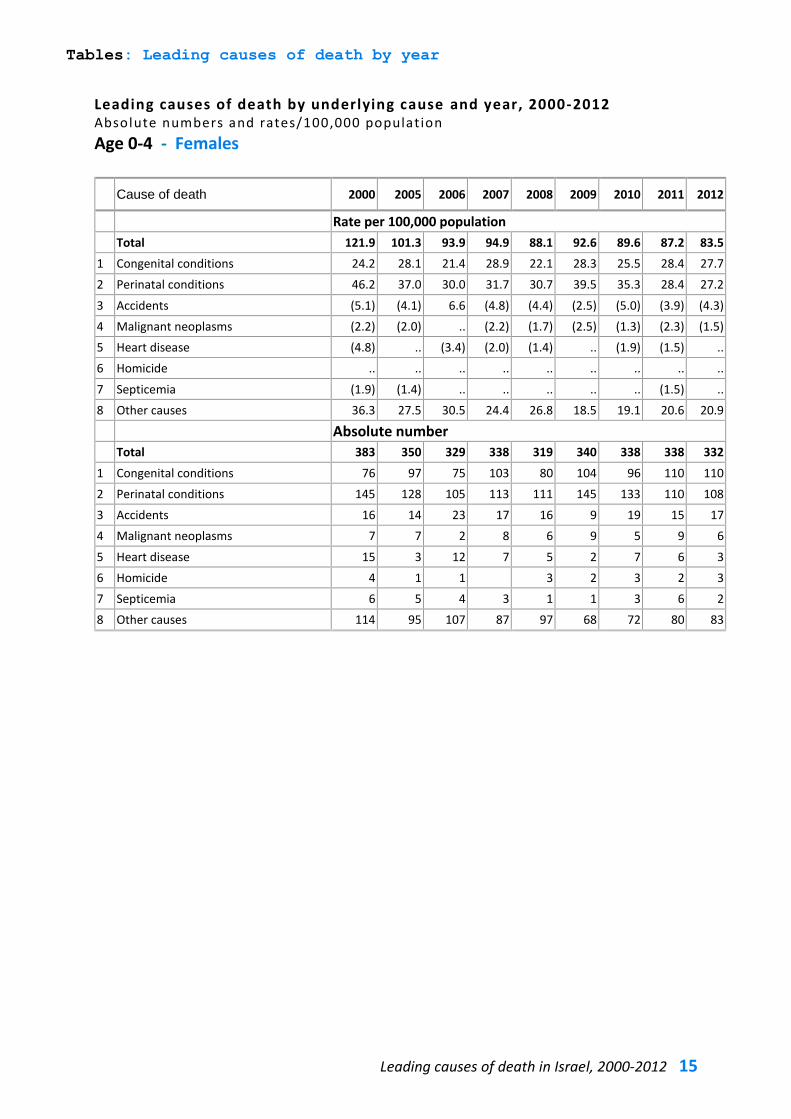
Leading causes of death by underlying cause and year, 2000-2012 Absolute numbers and rates/100,000 population Age 4-0 - Females
Cause of death 2000 2005 2006 2007 2008 2009 2010 2011 2012
Rate per 100,000 population
Total 121.9 101.3 93.9 94.9 88.1 92.6 89.6 87.2 83.5
1 Congenital conditions 24.2 28.1 21.4 28.9 22.1 28.3 25.5 28.4 27.7
2 Perinatal conditions 46.2 37.0 30.0 31.7 30.7 39.5 35.3 28.4 27.2
3 Accidents (5.1) (4.1) 6.6 (4.8) (4.4) (2.5) (5.0) (3.9) (4.3)
4 Malignant neoplasms (2.2) (2.0) .. (2.2) (1.7) (2.5) (1.3) (2.3) (1.5)
5 Heart disease (4.8) .. (3.4) (2.0) (1.4) .. (1.9) (1.5) ..
6 Homicide .. .. .. .. .. .. .. .. ..
7 Septicemia (1.9) (1.4) .. .. .. .. .. (1.5) ..
8 Other causes 36.3 27.5 30.5 24.4 26.8 18.5 19.1 20.6 20.9
Absolute number
Total 383 350 329 338 319 340 338 338 332
1 Congenital conditions 76 97 75 103 80 104 96 110 110
2 Perinatal conditions 145 128 105 113 111 145 133 110 108
3 Accidents 16 14 23 17 16 9 19 15 17
4 Malignant neoplasms 7 7 2 8 6 9 5 9 6
5 Heart disease 15 3 12 7 5 2 7 6 3
6 Homicide 4 1 1 3 2 3 2 3
7 Septicemia 6 5 4 3 1 1 3 6 2
8 Other causes 114 95 107 87 97 68 72 80 83
Tables: Leading causes of death by year
16 Ministry of Health, Israel
Leading causes of death by underlying cause and year, 2000 -2012 Absolute numbers and rates/100,000 population Age 5-14 - Males
Cause of death 2000 2005 2006 2007 2008 2009 2010 2011 2012
Rate per 100,000 population
Total 15.9 13.1 16.1 14.3 14.4 13.3 13.1 13.5 11.6
1 Accidents 5.4 3.7 5.5 3.6 3.8 (2.2) 3.4 2.9 4.0
2 Malignant neoplasms (3.0) (2.6) 3.0 3.4 3.1 (2.8) (2.3) 3.5 (1.8)
3 Congenital conditions (0.8) (1.1) (0.7) (0.9) (0.7) (1.1) (1.3) (1.1)
4 Heart disease .. .. (0.8) .. (0.7) .. (0.7) .. ..
5 Suicide .. .. .. .. .. .. .. ..
6 Homicide .. .. (0.7) .. ..
7 Other causes 5.9 6.1 5.6 5.7 5.6 6.4 4.4 4.9 3.5
Absolute number
Total 94 84 106 96 98 91 91 96 84
1 Accidents 32 24 36 24 26 15 24 21 29
2 Malignant neoplasms 18 17 20 23 21 19 16 25 13
3 Congenital conditions 5 7 5 6 5 8 9 8
4 Heart disease 2 2 5 3 5 4 5 3 3
5 Suicide 1 2 3 2 4 2 1 3
6 Homicide 1 1 5 2 3
7 Other causes 35 39 37 38 38 44 31 35 25
Tables: Leading causes of death by year
17 Leading causes of death in Israel, 2000-2012
Leading causes of death by underlying cause and year, 2000 -2012 Absolute numbers and rates/100,000 population Age 5-14 - Females
Cause of death 2000 2005 2006 2007 2008 2009 2010 2011 2012
Rate per 100,000 population
Total 12.3 9.5 11.1 11.8 10.5 11.2 9.4 8.4 7.7
1 Malignant neoplasms (2.0) (2.6) (2.7) 3.1 (2.9) (2.0) (2.0) (2.7) (1.9)
2 Congenital conditions .. .. .. .. (0.9) (1.1) .. .. (1.3)
3 Accidents (3.0) (1.6) (1.9) (1.6) (0.8) (1.8) (1.7) .. (1.3)
4 Heart disease .. .. .. .. .. .. .. .. ..
5 Septicemia .. .. ..
6 Flu/pneumonia .. .. .. .. .. .. .. .. ..
7 Other causes 5.9 4.4 5.1 5.7 4.9 5.4 4.4 3.6 2.5
Absolute number
Total 69 58 69 75 68 73 62 57 53
1 Malignant neoplasms 11 16 17 20 19 13 13 18 13
2 Congenital conditions 2 2 3 4 6 7 4 4 9
3 Accidents 17 10 12 10 5 12 11 4 9
4 Heart disease 4 2 4 4 4 4 4 4 3
5 Septicemia 1 2 1
6 Flu/pneumonia 1 1 1 1 2 2 1 1 1
7 Other causes 33 27 32 36 32 35 29 24 17
Tables: Leading causes of death by year
18 Ministry of Health, Israel
Leading causes of death by underlying cause and year, 2000 -2012 Absolute numbers and rates/100,000 population Age 15-24 - Males
Cause of death 2000 2005 2006 2007 2008 2009 2010 2011 2012
Rate per 100,000 population
Total 76.2 60.6 57.2 58.0 60.9 50.7 47.4 43.9 38.4
1 Accidents 30.2 20.8 20.6 21.3 19.2 15.4 14.5 16.0 11.1
2 Suicide 11.8 11.5 10.5 7.7 11.0 8.0 10.5 6.8 5.2
3 Homicide 5.8 5.9 4.8 5.3 4.0 6.4 4.0 5.1 5.0
4 Malignant neoplasms 5.4 3.5 (3.1) 5.3 6.6 4.9 5.3 3.5 4.4
5 Heart disease (1.6) (1.9) (1.2) (2.0) (1.9) (2.2) (1.5) (0.8) (1.5)
6 War/terror 4.5 (2.6) (2.6) (1.0) (2.7) (1.3) .. .. (0.8)
7 Congenital conditions .. .. (1.0) (1.0) .. .. .. .. ..
8 Septicemia .. .. .. .. .. .. .. .. ..
9 Other causes 15.8 13.5 13.2 14.3 14.2 11.9 10.7 10.4 9.3
Absolute number
Total 421 349 333 341 361 303 285 266 236
1 Accidents 167 120 120 125 114 92 87 97 68
2 Suicide 65 66 61 45 65 48 63 41 32
3 Homicide 32 34 28 31 24 38 24 31 31
4 Malignant neoplasms 30 20 18 31 39 29 32 21 27
5 Heart disease 9 11 7 12 11 13 9 5 9
6 War/terror 25 15 15 6 16 8 3 2 5
7 Congenital conditions 4 4 6 6 4 2 1 4 4
8 Septicemia 2 1 1 1 4 2 2 2 3
9 Other causes 87 78 77 84 84 71 64 63 57
Tables: Leading causes of death by year
19 Leading causes of death in Israel, 2000-2012
Leading causes of death by underlying cause and year, 2000 -2012 Absolute numbers and rates/100,000 population Age 15-24 - Females
Cause of death 2000 2005 2006 2007 2008 2009 2010 2011 2012
Rate per 100,000 population
Total
1 Accidents 22.6 23.5 22.2 19.1 14.4 17.8 15.9 13.9 17.5
2 Malignant neoplasms 6.0 5.4 5.9 (3.2) (2.5) (2.6) 3.6 (2.2) 3.6
3 Suicide 4.7 4.3 (2.7) 4.1 (3.3) 3.5 (2.8) (3.1) (2.5)
4 Heart disease (1.9) (2.3) (3.2) 1.8 (1.2) (2.3) (1.7) (2.1) (2.2)
5 Congenital conditions (1.9) (1.1) (1.3) .. (1.2) (1.0) .. .. (1.2)
6 Flu/pneumonia .. .. .. .. (0.9) (0.9) .. .. (0.8)
7 Kidney disease .. (1.0) .. .. ..
8 Homicide .. .. ..
9 Other causes 6.0 6.5 7.2 8.2 4.9 5.2 6.1 4.8 5.9
Absolute number
Total 120 130 124 108 82 102 92 81 103
1 Accidents 32 30 33 18 14 15 21 13 21
2 Malignant neoplasms 25 24 15 23 19 20 16 18 15
3 Suicide 10 13 18 10 7 13 10 12 13
4 Heart disease 10 6 7 3 7 6 4 1 7
5 Congenital conditions 2 4 3 2 5 5 1 4 5
6 Flu/pneumonia 1 6 3 1 3
7 Kidney disease 1 2 2
8 Homicide 7 15 8 6 2 7 2 4 2
9 Other causes 32 36 40 46 28 30 35 28 35
Tables: Leading causes of death by year
20 Ministry of Health, Israel
Leading causes of death by underlying cause and year, 2000 -2012 Absolute numbers and rates/100,000 population Age 25-44 - Males
Cause of death 2000 2005 2006 2007 2008 2009 2010 2011 2012
Rate per 100,000 population
Total 130.8 103.0 96.3 93.4 90.2 84.9 91.5 75.0 73.8
1 Malignant neoplasms 18.9 14.1 15.0 13.3 15.2 12.1 15.9 13.3 16.0
2 Suicide 14.1 10.2 10.0 10.6 8.4 11.7 12.9 9.1 11.6
3 Accidents 29.7 19.4 16.1 14.5 14.8 11.5 13.4 13.3 7.4
4 Heart disease 11.8 6.8 5.7 7.8 8.9 6.1 7.2 4.3 5.1
5 Homicide 7.0 6.2 5.5 4.0 3.9 3.9 6.1 4.6 4.4
6 Poisoning, undetermined intent 6.8 7.0 4.0 6.7 4.1 4.3 2.9 (1.7) (1.8)
7 Cerebrovascular disease (1.8) 2.2 (1.3) (1.1) (1.5) (1.0) (1.1) (1.0) (1.2)
8 Aids (1.0) (0.8) (0.6) (1.8) .. (1.1) .. (0.8) (0.8)
9 Liver disease (1.7) (1.2) (1.2) (0.9) (1.0) (1.5) (1.2) (0.7) (0.8)
10 Congenital conditions (1.1) (0.8) .. (0.7) (1.1) (0.8) (0.7) .. (0.8)
11 Psychoactive substance abuse (2.3) (2.0) (1.9) (1.3) (1.4) (1.3) (1.1) (1.2) (0.7)
12 Viral hepatitis (1.3) (1.1) (0.7) .. .. .. .. (0.6) (0.6)
13 Septicemia .. (1.1) (1.0) (0.6) (0.6) (0.7) (0.5) (0.8) (0.5)
14 Diabetes (1.0) (1.2) (1.2) (1.3) (0.9) (1.3) (1.4) (0.7) (0.5)
15 Flu/pneumonia (1.7) (1.0) (0.6) (1.1) (0.7) (1.6) (0.7) (1.1) ..
16 CLRD (1.2) .. (1.0) .. (0.5) .. (0.7) (0.5) ..
17 Kidney disease (1.0) (1.0) (0.8) (0.7) (1.0) (1.1) (0.7) (0.7) ..
18 Other causes 28.2 26.8 29.6 25.9 25.4 24.2 24.8 20.5 20.8
Absolute number Total 1,085 957 911 900 888 863 946 785 789
1 Malignant neoplasms 157 131 142 128 150 123 164 139 171
2 Suicide 117 95 95 102 83 119 133 95 124
3 Accidents 246 180 152 140 146 117 139 139 79
4 Heart disease 98 63 54 75 88 62 74 45 55
5 Homicide 58 58 52 39 38 40 63 48 47
6 Poisoning, undetermined intent 56 65 38 65 40 44 30 18 19
7 Cerebrovascular disease 15 20 12 11 15 10 11 10 13
8 Aids 8 7 6 17 3 11 4 8 9
9 Liver disease 14 11 11 9 10 15 12 7 9
10 Congenital conditions 9 7 1 7 11 8 7 4 9
11 Psychoactive substance abuse 19 19 18 13 14 13 11 13 7
12 Viral hepatitis 11 10 7 4 3 4 2 6 6
13 Septicemia 3 10 9 6 6 7 5 8 5
14 Diabetes 8 11 11 13 9 13 14 7 5
15 Flu/pneumonia 14 9 6 11 7 16 7 12 3
16 CLRD 10 3 9 3 5 4 7 5 3
17 Kidney disease 8 9 8 7 10 11 7 7 3
18 Other causes 234 249 280 250 250 246 256 214 222
Tables: Leading causes of death by year
21 Leading causes of death in Israel, 2000-2012
Leading causes of death by underlying cause and year, 2000-2012 Absolute numbers and rates/100,000 population Age 25-44 - Females
Cause of death 2000 2005 2006 2007 2008 2009 2010 2011 2012
Rate per 100,000 population
Total 55.1 49.4 51.9 45.8 41.7 43.3 42.2 43.3 41.1
1 Malignant neoplasms 26.9 20.7 22.0 20.8 20.8 19.7 20.0 19.3 20.4
2 Accidents 5.3 4.6 4.3 3.5 2.5 3.1 3.8 2.4 3.1
3 Suicide 3.1 3.2 2.7 (1.9) 2.0 3.3 2.1 2.6 2.3
4 Heart disease 3.3 (2.0) 3.8 (1.8) (1.9) (1.8) (1.7) (1.6) (1.7)
5 Homicide (2.1) (1.9) (1.6) (0.8) (1.0) (0.9) (1.4) (1.4) (0.7)
6 Septicemia .. .. (0.6) .. (0.6) (0.7) .. (0.9) (0.7)
7 Cerebrovascular disease (1.7) (1.1) (0.8) (0.6) (0.5) (1.4) .. .. (0.6)
8 Aids .. 0.6 .. .. .. .. (0.6) (0.5)
9 Liver disease .. .. (0.6) (0.5) .. .. .. (0.7) (0.5)
10 Congenital conditions .. (0.6) .. .. .. .. .. (0.9) ..
11 CLRD (0.6) (0.9) (0.6) .. .. .. .. (0.5) ..
12 Poisoning, undetermined intent .. .. (1.2) (1.3) (0.5) .. (0.7) (0.7) ..
13 Benign/other neoplasms .. .. .. .. .. .. .. .. ..
14 Diabetes (0.6) .. .. (1.1) (0.5) (0.5) (0.8) (0.6) ..
15 Flu/pneumonia .. (0.8) .. .. (1.0) .. .. ..
16 Viral hepatitis .. .. .. .. .. .. .. ..
17 Psychoactive substance abuse .. .. .. .. .. .. .. ..
18 Other causes 8.8 11.0 11.4 11.3 9.4 9.5 9.8 9.9 8.8
Absolute number Total 465 461 492 442 410 442 438 456 441
1 Malignant neoplasms 227 193 209 201 205 201 208 203 219
2 Accidents 45 43 41 34 25 32 39 25 33
3 Suicide 26 30 26 18 20 34 22 27 25
4 Heart disease 28 19 36 17 19 18 18 17 18
5 Homicide 18 18 15 8 10 9 15 15 8
6 Septicemia 3 3 6 4 6 7 3 9 7
7 Cerebrovascular disease 14 10 8 6 5 14 2 4 6
8 Aids 3 6 4 2 2 3 6 5
9 Liver disease 4 2 6 5 3 4 3 7 5
10 Congenital conditions 2 6 4 4 4 2 3 10 4
11 CLRD 5 8 6 3 2 2 1 5 3
12 Poisoning, undetermined intent 4 3 11 13 5 1 7 7 3
13 Benign/other neoplasms 1 2 2 2 2 2 1 4 2
14 Diabetes 5 4 4 11 5 5 8 6 2
15 Flu/pneumonia 4 7 3 3 10 3 3 2
16 Viral hepatitis 2 2 2 2 1 1 1 2
17 Psychoactive substance abuse 2 1 3 1 1 2 3 2
18 Other causes 74 103 108 109 92 97 102 104 95
Tables: Leading causes of death by year
22 Ministry of Health, Israel
Leading causes of death by underlying cause and year, 2000 -2012 Absolute numbers and rates/100,000 population Age 45-64 - Males
Cause of death 2000 2005 2006 2007 2008 2009 2010 2011 2012
Rate per 100,000 population
Total 589.7 538.9 516.0 519.3 510.6 482.1 477.1 502.0 485.8
1 Malignant neoplasms 189.8 180.7 173.9 173.7 173.9 173.7 176.7 179.1 177.4
2 Heart disease 116.8 82.1 80.9 83.7 75.6 66.1 62.8 66.5 59.6
3 Diabetes 31.7 26.6 24.1 28.1 27.7 26.8 25.2 22.2 21.5
4 Suicide 12.3 13.9 12.1 10.0 12.3 13.5 17.1 15.5 17.3
5 Accidents 24.0 21.9 21.0 22.7 22.3 19.5 14.9 17.6 16.5
6 Cerebrovascular disease 26.3 24.1 18.0 20.9 16.2 16.1 16.0 19.7 16.3
7 Kidney disease 14.5 13.4 14.0 12.1 10.3 9.3 10.2 10.0 12.5
8 Septicemia 7.3 6.2 6.3 5.7 8.2 8.0 8.2 12.3 10.3
9 CLRD 16.0 10.4 11.7 8.9 9.7 10.5 10.2 10.1 8.8
10 Liver disease 10.2 8.1 9.1 8.8 6.6 8.3 6.4 9.3 6.8
11 Flu/pneumonia 5.6 5.3 4.1 4.6 6.1 4.7 4.5 3.8 6.4
12 Hypertension 6.5 4.5 4.4 5.1 6.7 3.0 5.4 4.7 5.4
13 Psychoactive substance abuse 7.3 5.5 4.7 4.8 4.8 4.3 4.0 4.4 4.2
14 Homicide (2.6) 3.7 3.5 4.6 3.1 4.3 2.8 3.7 2.7
15 Benign/other neoplasms (2.4) (1.9) (3.0) (2.9) (2.4) (2.1) 2.8 (2.6) (2.3)
16 Viral hepatitis 5.4 7.0 4.4 (2.8) 4.5 (2.1) 3.1 3.0 (2.3)
17 Poisoning, undetermined intent (3.0) 5.5 4.1 4.5 3.3 3.3 (1.7) (1.6) (2.3)
18 Other causes 107.9 118.0 116.7 115.5 116.9 106.6 105.1 115.7 113.1
Absolute number Total 3,165 3,328 3,273 3,381 3,412 3,384 3,424 3,661 3,573
1 Malignant neoplasms 1,019 1,116 1,103 1,131 1,162 1,219 1,268 1,306 1,305
2 Heart disease 627 507 513 545 505 464 451 485 438
3 Diabetes 170 164 153 183 185 188 181 162 158
4 Suicide 66 86 77 65 82 95 123 113 127
5 Accidents 129 135 133 148 149 137 107 128 121
6 Cerebrovascular disease 141 149 114 136 108 113 115 144 120
7 Kidney disease 78 83 89 79 69 65 73 73 92
8 Septicemia 39 38 40 37 55 56 59 90 76
9 CLRD 86 64 74 58 65 74 73 74 65
10 Liver disease 55 50 58 57 44 58 46 68 50
11 Flu/pneumonia 30 33 26 30 41 33 32 28 47
12 Hypertension 35 28 28 33 45 21 39 34 40
13 Psychoactive substance abuse 39 34 30 31 32 30 29 32 31
14 Homicide 14 23 22 30 21 30 20 27 20
15 Benign/other neoplasms 13 12 19 19 16 15 20 19 17
16 Viral hepatitis 29 43 28 18 30 15 22 22 17
17 Poisoning, undetermined intent 16 34 26 29 22 23 12 12 17
18 Other causes 579 729 740 752 781 748 754 844 832
Tables: Leading causes of death by year
23 Leading causes of death in Israel, 2000-2012
Leading causes of death by underlying cause and year, 2000 -2012 Absolute numbers and rates/100,000 population Age 45-64 - Females
Cause of death 2000 2005 2006 2007 2008 2009 2010 2011 2012
Rate per 100,000 population
Total 349.5 310.4 289.8 305.1 302.4 294.0 285.3 293.3 273.3
1 Malignant neoplasms 183.1 170.7 162.6 172.5 167.1 167.5 165.1 160.5 150.4
2 Heart disease 40.2 23.4 22.7 20.4 24.1 19.8 16.6 19.7 16.9
3 Diabetes 21.2 14.9 12.8 15.9 14.3 13.4 10.3 11.2 11.6
4 Cerebrovascular disease 14.2 10.9 10.6 7.6 9.1 7.7 8.6 10.7 7.8
5 CLRD 6.9 5.2 5.8 5.4 3.9 4.5 5.1 4.0 6.0
6 Septicemia 4.5 3.3 2.9 3.1 5.9 3.8 4.7 5.1 5.5
7 Kidney disease 7.7 6.7 7.3 6.7 5.8 6.4 4.8 4.1 4.7
8 Accidents 6.5 6.4 5.1 6.7 6.2 6.2 5.8 6.4 4.6
9 Suicide 3.9 6.6 3.6 2.8 (1.5) 4.2 3.6 4.2 2.9
10 Liver disease 3.8 (2.1) (1.9) (2.5) (1.9) 2.9 (2.3) 2.6 (2.4)
11 Hypertension (2.6) (1.6) (2.5) (1.3) (2.1) (1.9) 2.7 3.3 (1.9)
12 Benign/other neoplasms (2.4) (1.9) (1.3) (2.0) (2.3) (2.1) (2.1) 2.7 (1.5)
13 Flu/pneumonia (2.1) (1.9) (1.3) (1.6) 2.8 2.7 (2.1) (2.0) (1.3)
העורקים באב מפרצת 14 (1.0) .. .. .. .. (0.7) .. (0.9) (1.0)
15 Homicide (0.9) (1.5) (0.7) .. (1.1) (1.2) .. (1.3) (0.9)
16 Viral hepatitis (1.4) (1.6) (1.6) (1.4) (1.8) (1.6) (1.3) (1.0) (0.9)
17 Congenital conditions .. (1.3) (1.5) (1.1) (1.0) .. (1.8) (1.2) (0.8)
18 Other causes 46.8 49.9 45.4 53.0 51.0 47.2 47.4 52.4 52.4
Absolute number Total 2,041 2,079 1,993 2,154 2,192 2,217 2,197 2,295 2,150
1 Malignant neoplasms 1,069 1,143 1,118 1,218 1,211 1,263 1,271 1,256 1,183
2 Heart disease 235 157 156 144 175 149 128 154 133
3 Diabetes 124 100 88 112 104 101 79 88 91
4 Cerebrovascular disease 83 73 73 54 66 58 66 84 61
5 CLRD 40 35 40 38 28 34 39 31 47
6 Septicemia 26 22 20 22 43 29 36 40 43
7 Kidney disease 45 45 50 47 42 48 37 32 37
8 Accidents 38 43 35 47 45 47 45 50 36
9 Suicide 23 44 25 20 11 32 28 33 23
10 Liver disease 22 14 13 18 14 22 18 20 19
11 Hypertension 15 11 17 9 15 14 21 26 15
12 Benign/other neoplasms 14 13 9 14 17 16 16 21 12
13 Flu/pneumonia 12 13 9 11 20 20 16 16 10
העורקים באב מפרצת 14 6 2 2 4 3 5 4 7 8
15 Homicide 5 10 5 4 8 9 4 10 7
16 Viral hepatitis 8 11 11 10 13 12 10 8 7
17 Congenital conditions 3 9 10 8 7 2 14 9 6
18 Other causes 273 334 312 374 370 356 365 410 412
Tables: Leading causes of death by year
24 Ministry of Health, Israel
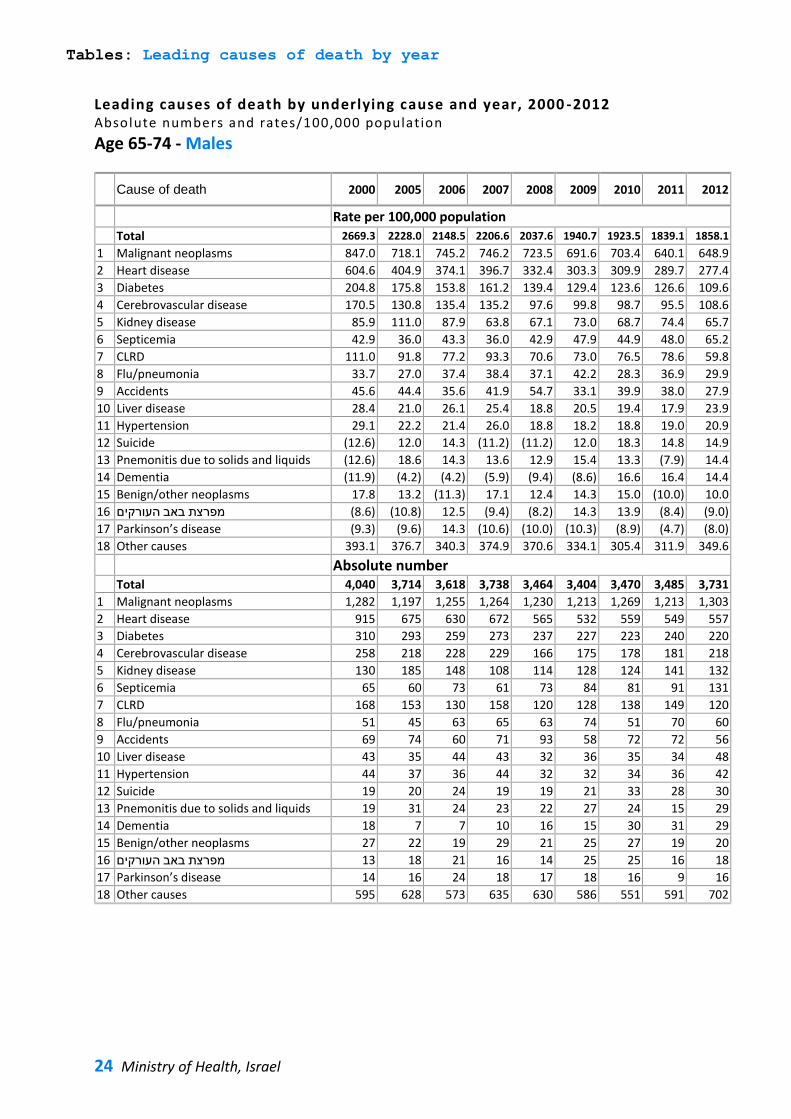
Leading causes of death by underlying cause and year, 2000 -2012 Absolute numbers and rates/100,000 population Age 65-74 - Males
Cause of death 2000 2005 2006 2007 2008 2009 2010 2011 2012
Rate per 100,000 population
Total 2669.3 2228.0 2148.5 2206.6 2037.6 1940.7 1923.5 1839.1 1858.1
1 Malignant neoplasms 847.0 718.1 745.2 746.2 723.5 691.6 703.4 640.1 648.9
2 Heart disease 604.6 404.9 374.1 396.7 332.4 303.3 309.9 289.7 277.4
3 Diabetes 204.8 175.8 153.8 161.2 139.4 129.4 123.6 126.6 109.6
4 Cerebrovascular disease 170.5 130.8 135.4 135.2 97.6 99.8 98.7 95.5 108.6
5 Kidney disease 85.9 111.0 87.9 63.8 67.1 73.0 68.7 74.4 65.7
6 Septicemia 42.9 36.0 43.3 36.0 42.9 47.9 44.9 48.0 65.2
7 CLRD 111.0 91.8 77.2 93.3 70.6 73.0 76.5 78.6 59.8
8 Flu/pneumonia 33.7 27.0 37.4 38.4 37.1 42.2 28.3 36.9 29.9
9 Accidents 45.6 44.4 35.6 41.9 54.7 33.1 39.9 38.0 27.9
10 Liver disease 28.4 21.0 26.1 25.4 18.8 20.5 19.4 17.9 23.9
11 Hypertension 29.1 22.2 21.4 26.0 18.8 18.2 18.8 19.0 20.9
12 Suicide (12.6) 12.0 14.3 (11.2) (11.2) 12.0 18.3 14.8 14.9
13 Pnemonitis due to solids and liquids (12.6) 18.6 14.3 13.6 12.9 15.4 13.3 (7.9) 14.4
14 Dementia (11.9) (4.2) (4.2) (5.9) (9.4) (8.6) 16.6 16.4 14.4
15 Benign/other neoplasms 17.8 13.2 (11.3) 17.1 12.4 14.3 15.0 (10.0) 10.0
העורקים באב מפרצת 16 (8.6) (10.8) 12.5 (9.4) (8.2) 14.3 13.9 (8.4) (9.0)
17 Parkinson’s disease (9.3) (9.6) 14.3 (10.6) (10.0) (10.3) (8.9) (4.7) (8.0)
18 Other causes 393.1 376.7 340.3 374.9 370.6 334.1 305.4 311.9 349.6
Absolute number Total 4,040 3,714 3,618 3,738 3,464 3,404 3,470 3,485 3,731
1 Malignant neoplasms 1,282 1,197 1,255 1,264 1,230 1,213 1,269 1,213 1,303
2 Heart disease 915 675 630 672 565 532 559 549 557
3 Diabetes 310 293 259 273 237 227 223 240 220
4 Cerebrovascular disease 258 218 228 229 166 175 178 181 218
5 Kidney disease 130 185 148 108 114 128 124 141 132
6 Septicemia 65 60 73 61 73 84 81 91 131
7 CLRD 168 153 130 158 120 128 138 149 120
8 Flu/pneumonia 51 45 63 65 63 74 51 70 60
9 Accidents 69 74 60 71 93 58 72 72 56
10 Liver disease 43 35 44 43 32 36 35 34 48
11 Hypertension 44 37 36 44 32 32 34 36 42
12 Suicide 19 20 24 19 19 21 33 28 30
13 Pnemonitis due to solids and liquids 19 31 24 23 22 27 24 15 29
14 Dementia 18 7 7 10 16 15 30 31 29
15 Benign/other neoplasms 27 22 19 29 21 25 27 19 20
העורקים באב מפרצת 16 13 18 21 16 14 25 25 16 18
17 Parkinson’s disease 14 16 24 18 17 18 16 9 16
18 Other causes 595 628 573 635 630 586 551 591 702
Tables: Leading causes of death by year
25 Leading causes of death in Israel, 2000-2012
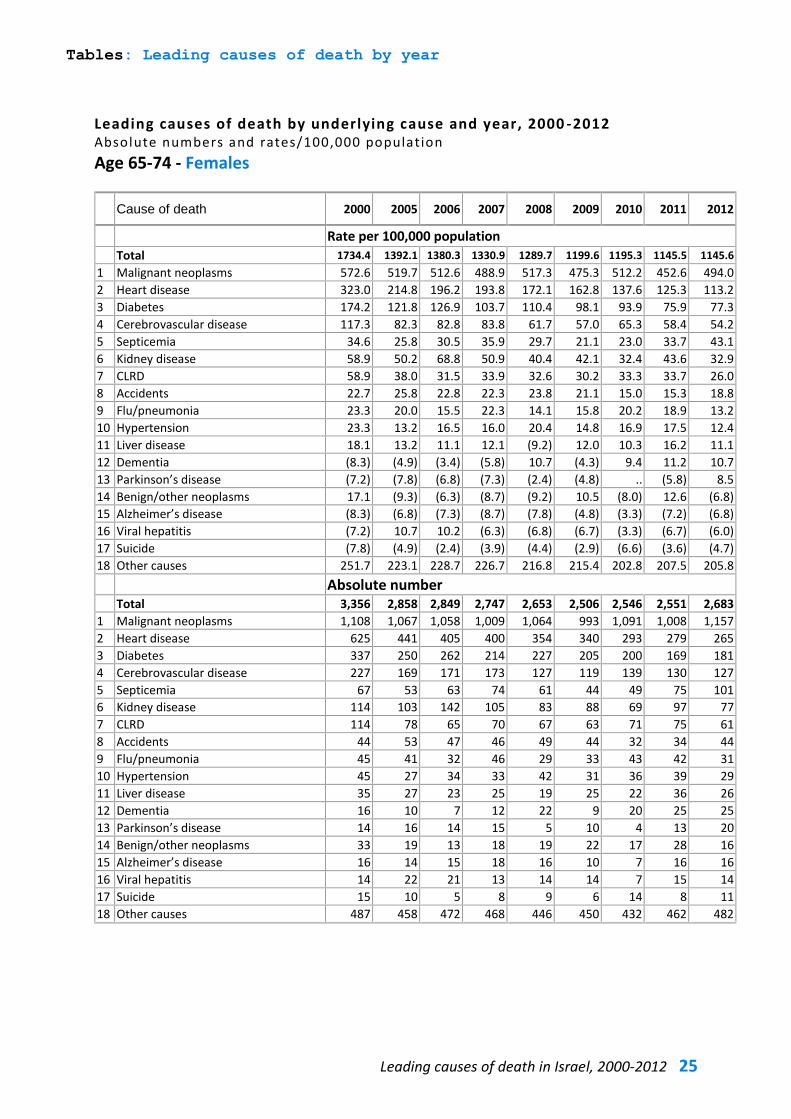
Leading causes of death by underlying cause and year, 2000 -2012 Absolute numbers and rates/100,000 population Age 65-74 - Females
Cause of death 2000 2005 2006 2007 2008 2009 2010 2011 2012
Rate per 100,000 population
Total 1734.4 1392.1 1380.3 1330.9 1289.7 1199.6 1195.3 1145.5 1145.6
1 Malignant neoplasms 572.6 519.7 512.6 488.9 517.3 475.3 512.2 452.6 494.0
2 Heart disease 323.0 214.8 196.2 193.8 172.1 162.8 137.6 125.3 113.2
3 Diabetes 174.2 121.8 126.9 103.7 110.4 98.1 93.9 75.9 77.3
4 Cerebrovascular disease 117.3 82.3 82.8 83.8 61.7 57.0 65.3 58.4 54.2
5 Septicemia 34.6 25.8 30.5 35.9 29.7 21.1 23.0 33.7 43.1
6 Kidney disease 58.9 50.2 68.8 50.9 40.4 42.1 32.4 43.6 32.9
7 CLRD 58.9 38.0 31.5 33.9 32.6 30.2 33.3 33.7 26.0
8 Accidents 22.7 25.8 22.8 22.3 23.8 21.1 15.0 15.3 18.8
9 Flu/pneumonia 23.3 20.0 15.5 22.3 14.1 15.8 20.2 18.9 13.2
10 Hypertension 23.3 13.2 16.5 16.0 20.4 14.8 16.9 17.5 12.4
11 Liver disease 18.1 13.2 11.1 12.1 (9.2) 12.0 10.3 16.2 11.1
12 Dementia (8.3) (4.9) (3.4) (5.8) 10.7 (4.3) 9.4 11.2 10.7
13 Parkinson’s disease (7.2) (7.8) (6.8) (7.3) (2.4) (4.8) .. (5.8) 8.5
14 Benign/other neoplasms 17.1 (9.3) (6.3) (8.7) (9.2) 10.5 (8.0) 12.6 (6.8)
15 Alzheimer’s disease (8.3) (6.8) (7.3) (8.7) (7.8) (4.8) (3.3) (7.2) (6.8)
16 Viral hepatitis (7.2) 10.7 10.2 (6.3) (6.8) (6.7) (3.3) (6.7) (6.0)
17 Suicide (7.8) (4.9) (2.4) (3.9) (4.4) (2.9) (6.6) (3.6) (4.7)
18 Other causes 251.7 223.1 228.7 226.7 216.8 215.4 202.8 207.5 205.8
Absolute number Total 3,356 2,858 2,849 2,747 2,653 2,506 2,546 2,551 2,683
1 Malignant neoplasms 1,108 1,067 1,058 1,009 1,064 993 1,091 1,008 1,157
2 Heart disease 625 441 405 400 354 340 293 279 265
3 Diabetes 337 250 262 214 227 205 200 169 181
4 Cerebrovascular disease 227 169 171 173 127 119 139 130 127
5 Septicemia 67 53 63 74 61 44 49 75 101
6 Kidney disease 114 103 142 105 83 88 69 97 77
7 CLRD 114 78 65 70 67 63 71 75 61
8 Accidents 44 53 47 46 49 44 32 34 44
9 Flu/pneumonia 45 41 32 46 29 33 43 42 31
10 Hypertension 45 27 34 33 42 31 36 39 29
11 Liver disease 35 27 23 25 19 25 22 36 26
12 Dementia 16 10 7 12 22 9 20 25 25
13 Parkinson’s disease 14 16 14 15 5 10 4 13 20
14 Benign/other neoplasms 33 19 13 18 19 22 17 28 16
15 Alzheimer’s disease 16 14 15 18 16 10 7 16 16
16 Viral hepatitis 14 22 21 13 14 14 7 15 14
17 Suicide 15 10 5 8 9 6 14 8 11
18 Other causes 487 458 472 468 446 450 432 462 482
Tables: Leading causes of death by year
26 Ministry of Health, Israel
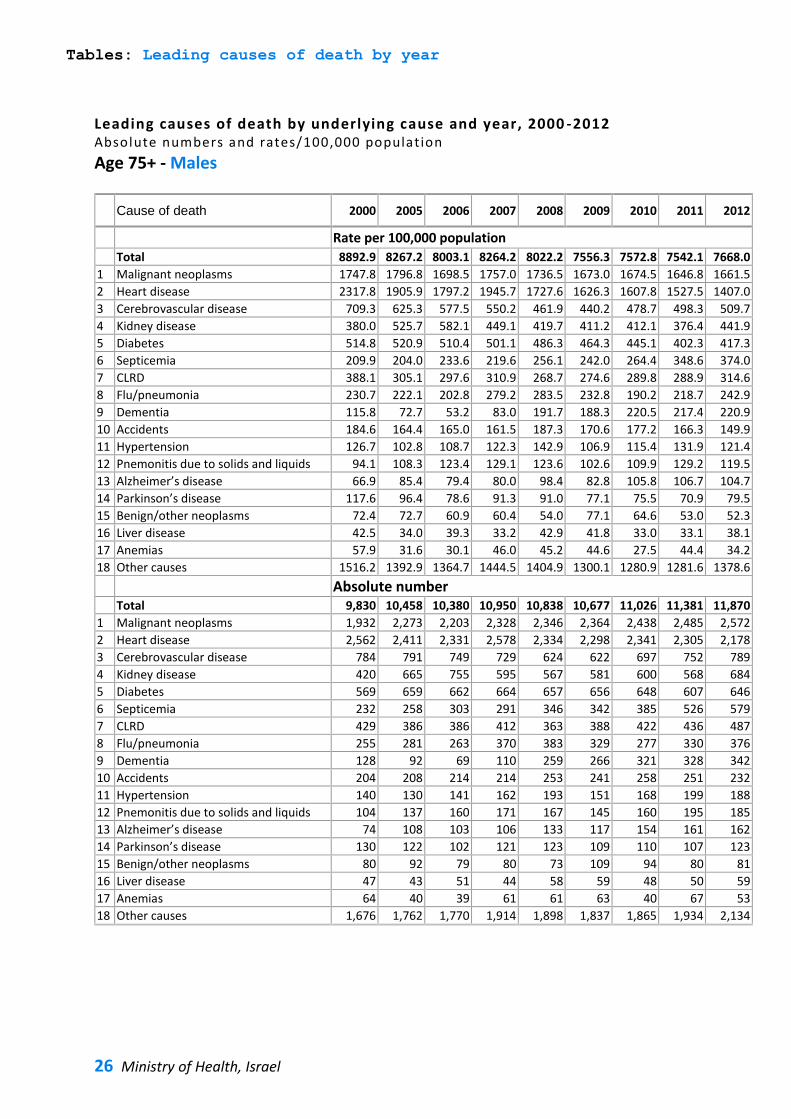
Leading causes of death by underlying cause and year, 2000 -2012 Absolute numbers and rates/100,000 population Age 75+ - Males
Cause of death 2000 2005 2006 2007 2008 2009 2010 2011 2012
Rate per 100,000 population
Total 8892.9 8267.2 8003.1 8264.2 8022.2 7556.3 7572.8 7542.1 7668.0
1 Malignant neoplasms 1747.8 1796.8 1698.5 1757.0 1736.5 1673.0 1674.5 1646.8 1661.5
2 Heart disease 2317.8 1905.9 1797.2 1945.7 1727.6 1626.3 1607.8 1527.5 1407.0
3 Cerebrovascular disease 709.3 625.3 577.5 550.2 461.9 440.2 478.7 498.3 509.7
4 Kidney disease 380.0 525.7 582.1 449.1 419.7 411.2 412.1 376.4 441.9
5 Diabetes 514.8 520.9 510.4 501.1 486.3 464.3 445.1 402.3 417.3
6 Septicemia 209.9 204.0 233.6 219.6 256.1 242.0 264.4 348.6 374.0
7 CLRD 388.1 305.1 297.6 310.9 268.7 274.6 289.8 288.9 314.6
8 Flu/pneumonia 230.7 222.1 202.8 279.2 283.5 232.8 190.2 218.7 242.9
9 Dementia 115.8 72.7 53.2 83.0 191.7 188.3 220.5 217.4 220.9
10 Accidents 184.6 164.4 165.0 161.5 187.3 170.6 177.2 166.3 149.9
11 Hypertension 126.7 102.8 108.7 122.3 142.9 106.9 115.4 131.9 121.4
12 Pnemonitis due to solids and liquids 94.1 108.3 123.4 129.1 123.6 102.6 109.9 129.2 119.5
13 Alzheimer’s disease 66.9 85.4 79.4 80.0 98.4 82.8 105.8 106.7 104.7
14 Parkinson’s disease 117.6 96.4 78.6 91.3 91.0 77.1 75.5 70.9 79.5
15 Benign/other neoplasms 72.4 72.7 60.9 60.4 54.0 77.1 64.6 53.0 52.3
16 Liver disease 42.5 34.0 39.3 33.2 42.9 41.8 33.0 33.1 38.1
17 Anemias 57.9 31.6 30.1 46.0 45.2 44.6 27.5 44.4 34.2
18 Other causes 1516.2 1392.9 1364.7 1444.5 1404.9 1300.1 1280.9 1281.6 1378.6
Absolute number Total 9,830 10,458 10,380 10,950 10,838 10,677 11,026 11,381 11,870
1 Malignant neoplasms 1,932 2,273 2,203 2,328 2,346 2,364 2,438 2,485 2,572
2 Heart disease 2,562 2,411 2,331 2,578 2,334 2,298 2,341 2,305 2,178
3 Cerebrovascular disease 784 791 749 729 624 622 697 752 789
4 Kidney disease 420 665 755 595 567 581 600 568 684
5 Diabetes 569 659 662 664 657 656 648 607 646
6 Septicemia 232 258 303 291 346 342 385 526 579
7 CLRD 429 386 386 412 363 388 422 436 487
8 Flu/pneumonia 255 281 263 370 383 329 277 330 376
9 Dementia 128 92 69 110 259 266 321 328 342
10 Accidents 204 208 214 214 253 241 258 251 232
11 Hypertension 140 130 141 162 193 151 168 199 188
12 Pnemonitis due to solids and liquids 104 137 160 171 167 145 160 195 185
13 Alzheimer’s disease 74 108 103 106 133 117 154 161 162
14 Parkinson’s disease 130 122 102 121 123 109 110 107 123
15 Benign/other neoplasms 80 92 79 80 73 109 94 80 81
16 Liver disease 47 43 51 44 58 59 48 50 59
17 Anemias 64 40 39 61 61 63 40 67 53
18 Other causes 1,676 1,762 1,770 1,914 1,898 1,837 1,865 1,934 2,134
Tables: Leading causes of death by year
27 Leading causes of death in Israel, 2000-2012
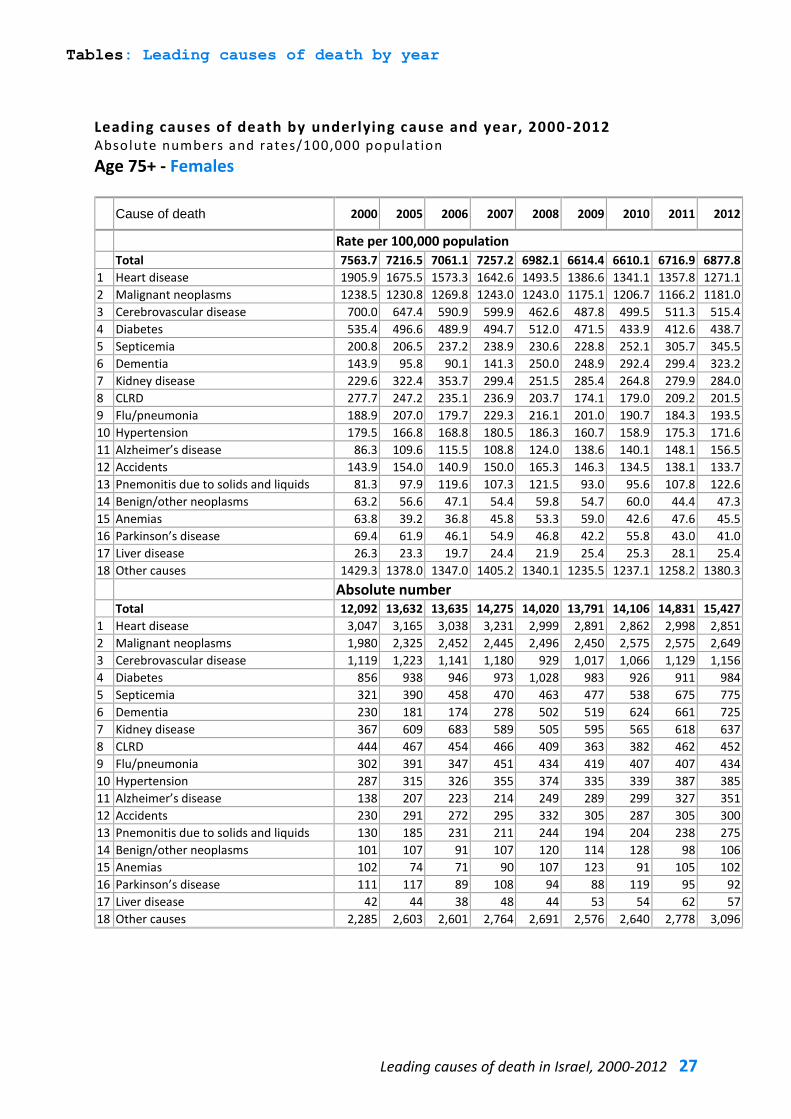
Leading causes of death by underlying cause and year, 2000 -2012 Absolute numbers and rates/100,000 population Age 75+ - Females
Cause of death 2000 2005 2006 2007 2008 2009 2010 2011 2012
Rate per 100,000 population
Total 7563.7 7216.5 7061.1 7257.2 6982.1 6614.4 6610.1 6716.9 6877.8
1 Heart disease 1905.9 1675.5 1573.3 1642.6 1493.5 1386.6 1341.1 1357.8 1271.1
2 Malignant neoplasms 1238.5 1230.8 1269.8 1243.0 1243.0 1175.1 1206.7 1166.2 1181.0
3 Cerebrovascular disease 700.0 647.4 590.9 599.9 462.6 487.8 499.5 511.3 515.4
4 Diabetes 535.4 496.6 489.9 494.7 512.0 471.5 433.9 412.6 438.7
5 Septicemia 200.8 206.5 237.2 238.9 230.6 228.8 252.1 305.7 345.5
6 Dementia 143.9 95.8 90.1 141.3 250.0 248.9 292.4 299.4 323.2
7 Kidney disease 229.6 322.4 353.7 299.4 251.5 285.4 264.8 279.9 284.0
8 CLRD 277.7 247.2 235.1 236.9 203.7 174.1 179.0 209.2 201.5
9 Flu/pneumonia 188.9 207.0 179.7 229.3 216.1 201.0 190.7 184.3 193.5
10 Hypertension 179.5 166.8 168.8 180.5 186.3 160.7 158.9 175.3 171.6
11 Alzheimer’s disease 86.3 109.6 115.5 108.8 124.0 138.6 140.1 148.1 156.5
12 Accidents 143.9 154.0 140.9 150.0 165.3 146.3 134.5 138.1 133.7
13 Pnemonitis due to solids and liquids 81.3 97.9 119.6 107.3 121.5 93.0 95.6 107.8 122.6
14 Benign/other neoplasms 63.2 56.6 47.1 54.4 59.8 54.7 60.0 44.4 47.3
15 Anemias 63.8 39.2 36.8 45.8 53.3 59.0 42.6 47.6 45.5
16 Parkinson’s disease 69.4 61.9 46.1 54.9 46.8 42.2 55.8 43.0 41.0
17 Liver disease 26.3 23.3 19.7 24.4 21.9 25.4 25.3 28.1 25.4
18 Other causes 1429.3 1378.0 1347.0 1405.2 1340.1 1235.5 1237.1 1258.2 1380.3
Absolute number Total 12,092 13,632 13,635 14,275 14,020 13,791 14,106 14,831 15,427
1 Heart disease 3,047 3,165 3,038 3,231 2,999 2,891 2,862 2,998 2,851
2 Malignant neoplasms 1,980 2,325 2,452 2,445 2,496 2,450 2,575 2,575 2,649
3 Cerebrovascular disease 1,119 1,223 1,141 1,180 929 1,017 1,066 1,129 1,156
4 Diabetes 856 938 946 973 1,028 983 926 911 984
5 Septicemia 321 390 458 470 463 477 538 675 775
6 Dementia 230 181 174 278 502 519 624 661 725
7 Kidney disease 367 609 683 589 505 595 565 618 637
8 CLRD 444 467 454 466 409 363 382 462 452
9 Flu/pneumonia 302 391 347 451 434 419 407 407 434
10 Hypertension 287 315 326 355 374 335 339 387 385
11 Alzheimer’s disease 138 207 223 214 249 289 299 327 351
12 Accidents 230 291 272 295 332 305 287 305 300
13 Pnemonitis due to solids and liquids 130 185 231 211 244 194 204 238 275
14 Benign/other neoplasms 101 107 91 107 120 114 128 98 106
15 Anemias 102 74 71 90 107 123 91 105 102
16 Parkinson’s disease 111 117 89 108 94 88 119 95 92
17 Liver disease 42 44 38 48 44 53 54 62 57
18 Other causes 2,285 2,603 2,601 2,764 2,691 2,576 2,640 2,778 3,096
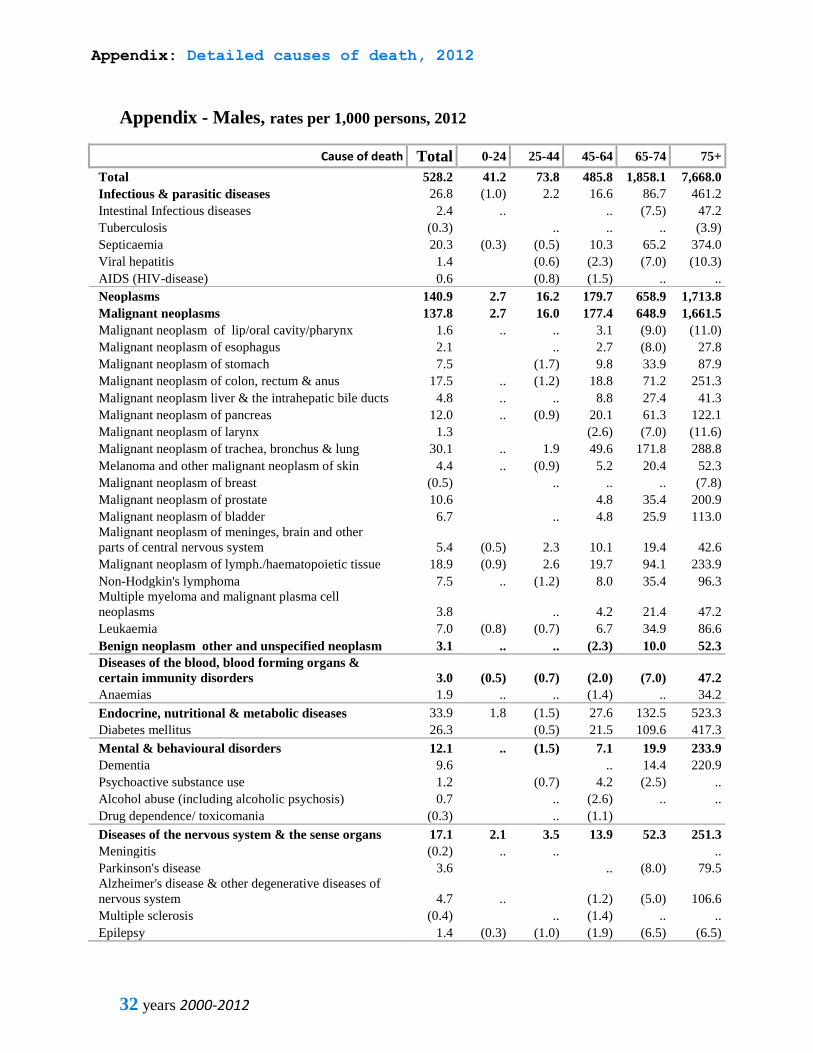
Appendix: Detailed causes of death, 2012
28 years 2000-2012
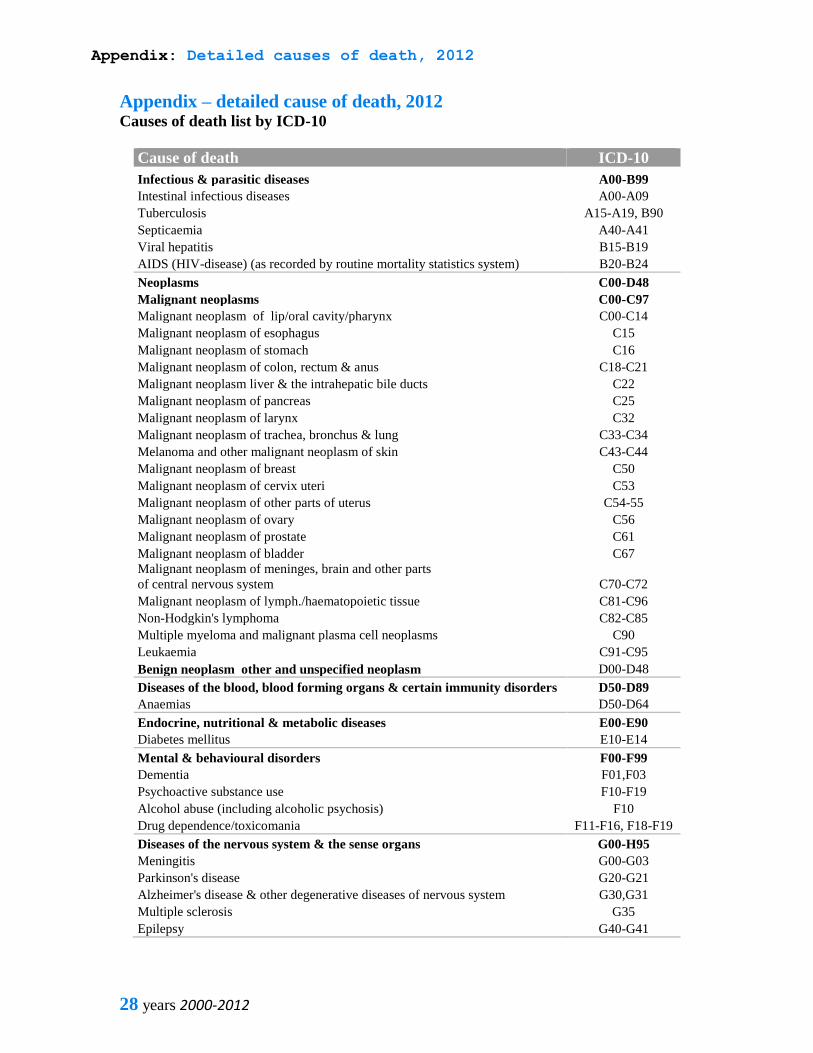
Appendix – detailed cause of death, 2012 Causes of death list by ICD-10
Cause of death ICD-10
Infectious & parasitic diseases A00-B99
Intestinal infectious diseases A00-A09
Tuberculosis A15-A19, B90
Septicaemia A40-A41
Viral hepatitis B15-B19
AIDS (HIV-disease) (as recorded by routine mortality statistics system) B20-B24
Neoplasms C00-D48
Malignant neoplasms C00-C97
Malignant neoplasm of lip/oral cavity/pharynx C00-C14
Malignant neoplasm of esophagus C15
Malignant neoplasm of stomach C16
Malignant neoplasm of colon, rectum & anus C18-C21
Malignant neoplasm liver & the intrahepatic bile ducts C22
Malignant neoplasm of pancreas C25
Malignant neoplasm of larynx C32
Malignant neoplasm of trachea, bronchus & lung C33-C34
Melanoma and other malignant neoplasm of skin C43-C44
Malignant neoplasm of breast C50
Malignant neoplasm of cervix uteri C53
Malignant neoplasm of other parts of uterus C54-55
Malignant neoplasm of ovary C56
Malignant neoplasm of prostate C61
Malignant neoplasm of bladder C67
Malignant neoplasm of meninges, brain and other parts
of central nervous system C70-C72
Malignant neoplasm of lymph./haematopoietic tissue C81-C96
Non-Hodgkin's lymphoma C82-C85
Multiple myeloma and malignant plasma cell neoplasms C90
Leukaemia C91-C95
Benign neoplasm other and unspecified neoplasm D00-D48
Diseases of the blood, blood forming organs & certain immunity disorders D50-D89
Anaemias D50-D64
Endocrine, nutritional & metabolic diseases E00-E90
Diabetes mellitus E10-E14
Mental & behavioural disorders F00-F99
Dementia F01,F03
Psychoactive substance use F10-F19
Alcohol abuse (including alcoholic psychosis) F10
Drug dependence/toxicomania F11-F16, F18-F19
Diseases of the nervous system & the sense organs G00-H95
Meningitis G00-G03
Parkinson's disease G20-G21
Alzheimer's disease & other degenerative diseases of nervous system G30,G31
Multiple sclerosis G35
Epilepsy G40-G41
Appendix: Detailed causes of death, 2012
29 Leading causes of death in Israel summary
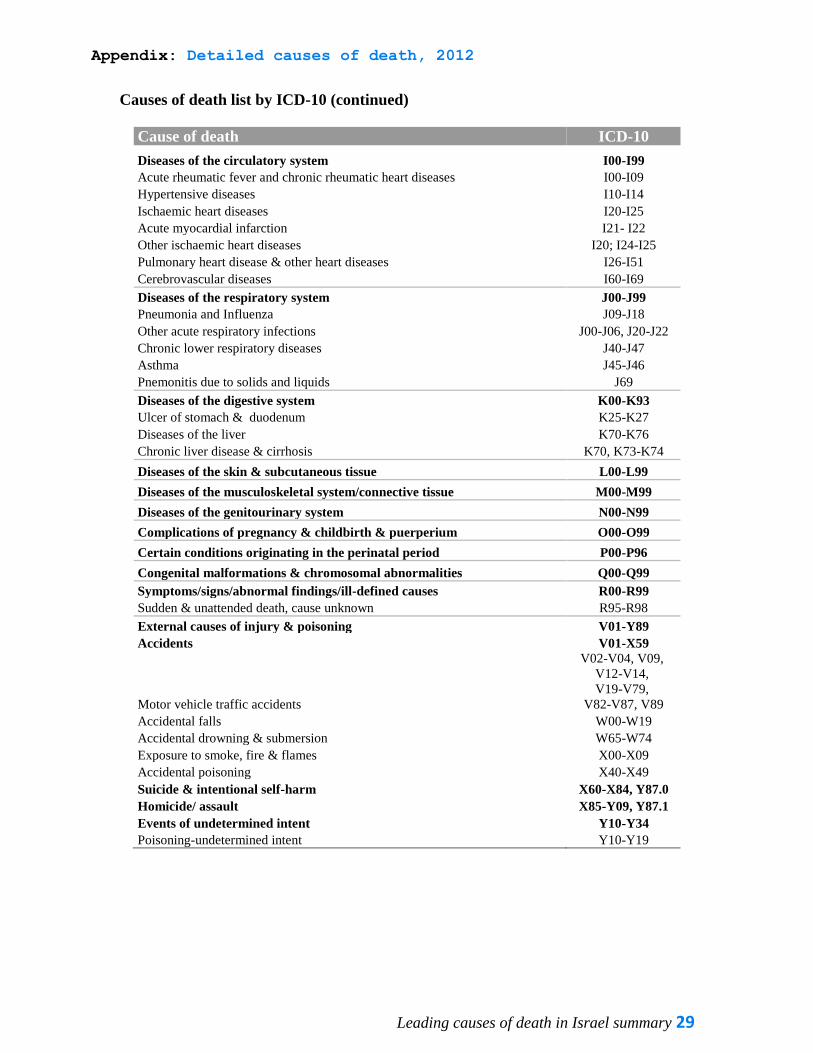
Causes of death list by ICD-10 (continued)
Cause of death ICD-10
Diseases of the circulatory system I00-I99
Acute rheumatic fever and chronic rheumatic heart diseases I00-I09
Hypertensive diseases I10-I14
Ischaemic heart diseases I20-I25
Acute myocardial infarction I21- I22
Other ischaemic heart diseases I20; I24-I25
Pulmonary heart disease & other heart diseases I26-I51
Cerebrovascular diseases I60-I69
Diseases of the respiratory system J00-J99
Pneumonia and Influenza J09-J18
Other acute respiratory infections J00-J06, J20-J22
Chronic lower respiratory diseases J40-J47
Asthma J45-J46
Pnemonitis due to solids and liquids J69
Diseases of the digestive system K00-K93
Ulcer of stomach & duodenum K25-K27
Diseases of the liver K70-K76
Chronic liver disease & cirrhosis K70, K73-K74
Diseases of the skin & subcutaneous tissue L00-L99
Diseases of the musculoskeletal system/connective tissue M00-M99
Diseases of the genitourinary system N00-N99
Complications of pregnancy & childbirth & puerperium O00-O99
Certain conditions originating in the perinatal period P00-P96
Congenital malformations & chromosomal abnormalities Q00-Q99
Symptoms/signs/abnormal findings/ill-defined causes R00-R99
Sudden & unattended death, cause unknown R95-R98
External causes of injury & poisoning V01-Y89
Accidents V01-X59
Motor vehicle traffic accidents
V02-V04, V09,
V12-V14,
V19-V79,
V82-V87, V89
Accidental falls W00-W19
Accidental drowning & submersion W65-W74
Exposure to smoke, fire & flames X00-X09
Accidental poisoning X40-X49
Suicide & intentional self-harm X60-X84, Y87.0
Homicide/ assault X85-Y09, Y87.1
Events of undetermined intent Y10-Y34
Poisoning-undetermined intent Y10-Y19
Appendix: Detailed causes of death, 2012
30 years 2000-2012
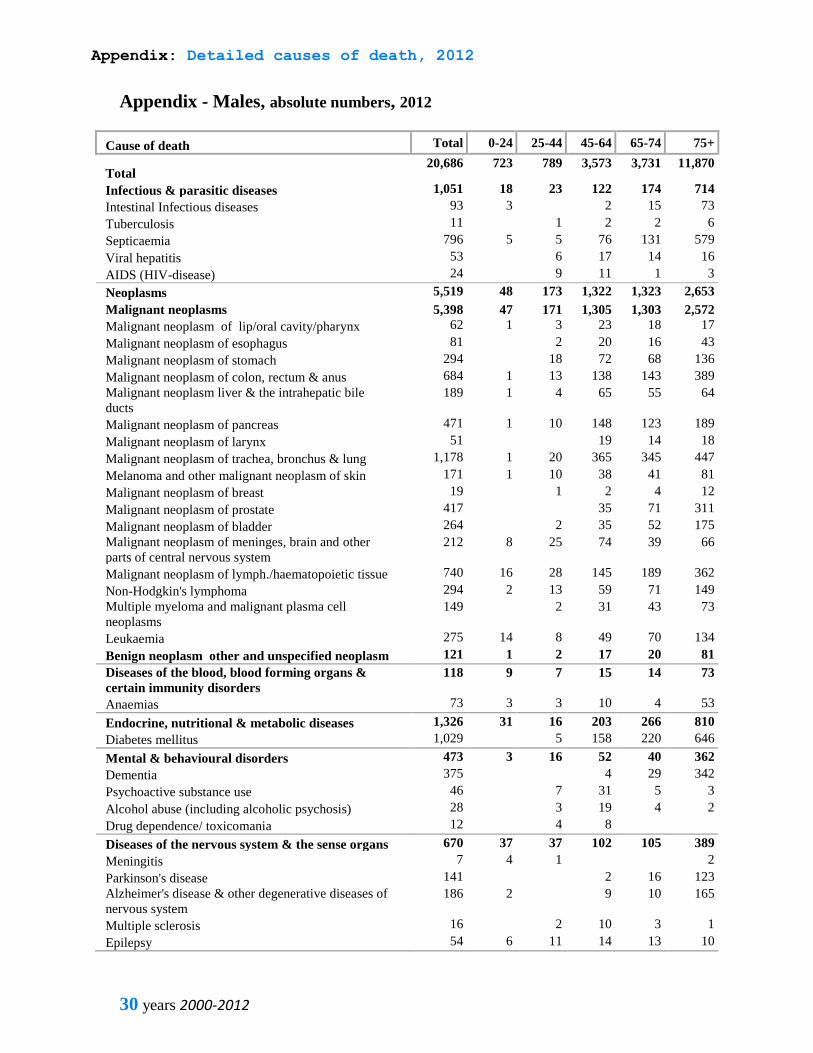
Appendix - Males, absolute numbers, 2012
Cause of death Total 0-24 25-44 45-64 65-74 75+
Total 20,686 723 789 3,573 3,731 11,870
Infectious & parasitic diseases 1,051 18 23 122 174 714
Intestinal Infectious diseases 93 3 2 15 73
Tuberculosis 11 1 2 2 6
Septicaemia 796 5 5 76 131 579
Viral hepatitis 53 6 17 14 16
AIDS (HIV-disease) 24 9 11 1 3
Neoplasms 5,519 48 173 1,322 1,323 2,653
Malignant neoplasms 5,398 47 171 1,305 1,303 2,572
Malignant neoplasm of lip/oral cavity/pharynx 62 1 3 23 18 17
Malignant neoplasm of esophagus 81 2 20 16 43
Malignant neoplasm of stomach 294 18 72 68 136
Malignant neoplasm of colon, rectum & anus 684 1 13 138 143 389
Malignant neoplasm liver & the intrahepatic bile
ducts
189 1 4 65 55 64
Malignant neoplasm of pancreas 471 1 10 148 123 189
Malignant neoplasm of larynx 51 19 14 18
Malignant neoplasm of trachea, bronchus & lung 1,178 1 20 365 345 447
Melanoma and other malignant neoplasm of skin 171 1 10 38 41 81
Malignant neoplasm of breast 19 1 2 4 12
Malignant neoplasm of prostate 417 35 71 311
Malignant neoplasm of bladder 264 2 35 52 175
Malignant neoplasm of meninges, brain and other
parts of central nervous system
212 8 25 74 39 66
Malignant neoplasm of lymph./haematopoietic tissue 740 16 28 145 189 362
Non-Hodgkin's lymphoma 294 2 13 59 71 149
Multiple myeloma and malignant plasma cell
neoplasms
149 2 31 43 73
Leukaemia 275 14 8 49 70 134
Benign neoplasm other and unspecified neoplasm 121 1 2 17 20 81
Diseases of the blood, blood forming organs &
certain immunity disorders
118 9 7 15 14 73
Anaemias 73 3 3 10 4 53
Endocrine, nutritional & metabolic diseases 1,326 31 16 203 266 810
Diabetes mellitus 1,029 5 158 220 646
Mental & behavioural disorders 473 3 16 52 40 362
Dementia 375 4 29 342
Psychoactive substance use 46 7 31 5 3
Alcohol abuse (including alcoholic psychosis) 28 3 19 4 2
Drug dependence/ toxicomania 12 4 8
Diseases of the nervous system & the sense organs 670 37 37 102 105 389
Meningitis 7 4 1 2
Parkinson's disease 141 2 16 123
Alzheimer's disease & other degenerative diseases of
nervous system
186 2 9 10 165
Multiple sclerosis 16 2 10 3 1
Epilepsy 54 6 11 14 13 10
Appendix: Detailed causes of death, 2012
31 Leading causes of death in Israel summary
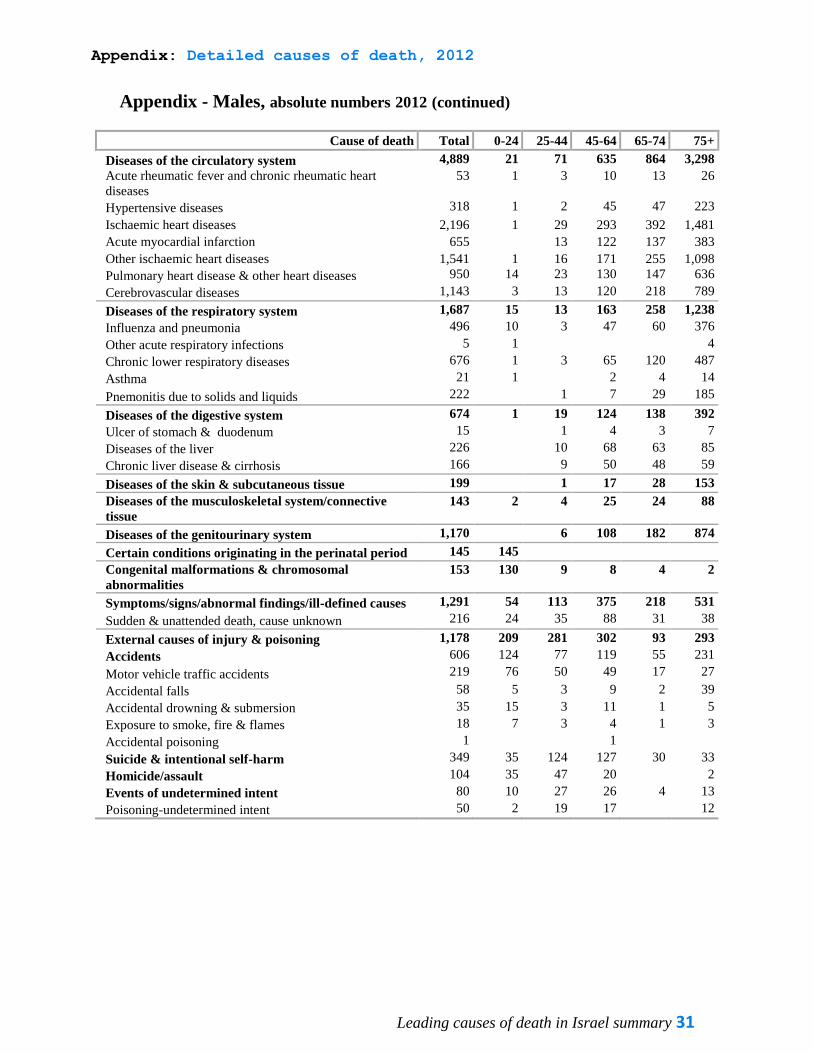
Appendix - Males, absolute numbers 2012 (continued)
Cause of death Total 0-24 25-44 45-64 65-74 75+
Diseases of the circulatory system 4,889 21 71 635 864 3,298
Acute rheumatic fever and chronic rheumatic heart
diseases
53 1 3 10 13 26
Hypertensive diseases 318 1 2 45 47 223
Ischaemic heart diseases 2,196 1 29 293 392 1,481
Acute myocardial infarction 655 13 122 137 383
Other ischaemic heart diseases 1,541 1 16 171 255 1,098
Pulmonary heart disease & other heart diseases 950 14 23 130 147 636
Cerebrovascular diseases 1,143 3 13 120 218 789
Diseases of the respiratory system 1,687 15 13 163 258 1,238
Influenza and pneumonia 496 10 3 47 60 376
Other acute respiratory infections 5 1 4
Chronic lower respiratory diseases 676 1 3 65 120 487
Asthma 21 1 2 4 14
Pnemonitis due to solids and liquids 222 1 7 29 185
Diseases of the digestive system 674 1 19 124 138 392
Ulcer of stomach & duodenum 15 1 4 3 7
Diseases of the liver 226 10 68 63 85
Chronic liver disease & cirrhosis 166 9 50 48 59
Diseases of the skin & subcutaneous tissue 199 1 17 28 153
Diseases of the musculoskeletal system/connective
tissue
143 2 4 25 24 88
Diseases of the genitourinary system 1,170 6 108 182 874
Certain conditions originating in the perinatal period 145 145
Congenital malformations & chromosomal
abnormalities
153 130 9 8 4 2
Symptoms/signs/abnormal findings/ill-defined causes 1,291 54 113 375 218 531
Sudden & unattended death, cause unknown 216 24 35 88 31 38
External causes of injury & poisoning 1,178 209 281 302 93 293
Accidents 606 124 77 119 55 231
Motor vehicle traffic accidents 219 76 50 49 17 27
Accidental falls 58 5 3 9 2 39
Accidental drowning & submersion 35 15 3 11 1 5
Exposure to smoke, fire & flames 18 7 3 4 1 3
Accidental poisoning 1 1
Suicide & intentional self-harm 349 35 124 127 30 33
Homicide/assault 104 35 47 20 2
Events of undetermined intent 80 10 27 26 4 13
Poisoning-undetermined intent 50 2 19 17 12
Appendix: Detailed causes of death, 2012
32 years 2000-2012
Appendix - Males, rates per 1,000 persons, 2012
Cause of death Total 0-24 25-44 45-64 65-74 75+
Total 528.2 41.2 73.8 485.8 1,858.1 7,668.0
Infectious & parasitic diseases 26.8 (1.0) 2.2 16.6 86.7 461.2
Intestinal Infectious diseases 2.4 .. .. (7.5) 47.2
Tuberculosis (0.3) .. .. .. (3.9)
Septicaemia 20.3 (0.3) (0.5) 10.3 65.2 374.0
Viral hepatitis 1.4 (0.6) (2.3) (7.0) (10.3)
AIDS (HIV-disease) 0.6 (0.8) (1.5) .. ..
Neoplasms 140.9 2.7 16.2 179.7 658.9 1,713.8
Malignant neoplasms 137.8 2.7 16.0 177.4 648.9 1,661.5
Malignant neoplasm of lip/oral cavity/pharynx 1.6 .. .. 3.1 (9.0) (11.0)
Malignant neoplasm of esophagus 2.1 .. 2.7 (8.0) 27.8
Malignant neoplasm of stomach 7.5 (1.7) 9.8 33.9 87.9
Malignant neoplasm of colon, rectum & anus 17.5 .. (1.2) 18.8 71.2 251.3
Malignant neoplasm liver & the intrahepatic bile ducts 4.8 .. .. 8.8 27.4 41.3
Malignant neoplasm of pancreas 12.0 .. (0.9) 20.1 61.3 122.1
Malignant neoplasm of larynx 1.3 (2.6) (7.0) (11.6)
Malignant neoplasm of trachea, bronchus & lung 30.1 .. 1.9 49.6 171.8 288.8
Melanoma and other malignant neoplasm of skin 4.4 .. (0.9) 5.2 20.4 52.3
Malignant neoplasm of breast (0.5) .. .. .. (7.8)
Malignant neoplasm of prostate 10.6 4.8 35.4 200.9
Malignant neoplasm of bladder 6.7 .. 4.8 25.9 113.0
Malignant neoplasm of meninges, brain and other
parts of central nervous system 5.4 (0.5) 2.3 10.1 19.4 42.6
Malignant neoplasm of lymph./haematopoietic tissue 18.9 (0.9) 2.6 19.7 94.1 233.9
Non-Hodgkin's lymphoma 7.5 .. (1.2) 8.0 35.4 96.3
Multiple myeloma and malignant plasma cell
neoplasms 3.8 .. 4.2 21.4 47.2
Leukaemia 7.0 (0.8) (0.7) 6.7 34.9 86.6
Benign neoplasm other and unspecified neoplasm 3.1 .. .. (2.3) 10.0 52.3
Diseases of the blood, blood forming organs &
certain immunity disorders 3.0 (0.5) (0.7) (2.0) (7.0) 47.2
Anaemias 1.9 .. .. (1.4) .. 34.2
Endocrine, nutritional & metabolic diseases 33.9 1.8 (1.5) 27.6 132.5 523.3
Diabetes mellitus 26.3 (0.5) 21.5 109.6 417.3
Mental & behavioural disorders 12.1 .. (1.5) 7.1 19.9 233.9
Dementia 9.6 .. 14.4 220.9
Psychoactive substance use 1.2 (0.7) 4.2 (2.5) ..
Alcohol abuse (including alcoholic psychosis) 0.7 .. (2.6) .. ..
Drug dependence/ toxicomania (0.3) .. (1.1)
Diseases of the nervous system & the sense organs 17.1 2.1 3.5 13.9 52.3 251.3
Meningitis (0.2) .. .. ..
Parkinson's disease 3.6 .. (8.0) 79.5
Alzheimer's disease & other degenerative diseases of
nervous system 4.7 .. (1.2) (5.0) 106.6
Multiple sclerosis (0.4) .. (1.4) .. ..
Epilepsy 1.4 (0.3) (1.0) (1.9) (6.5) (6.5)
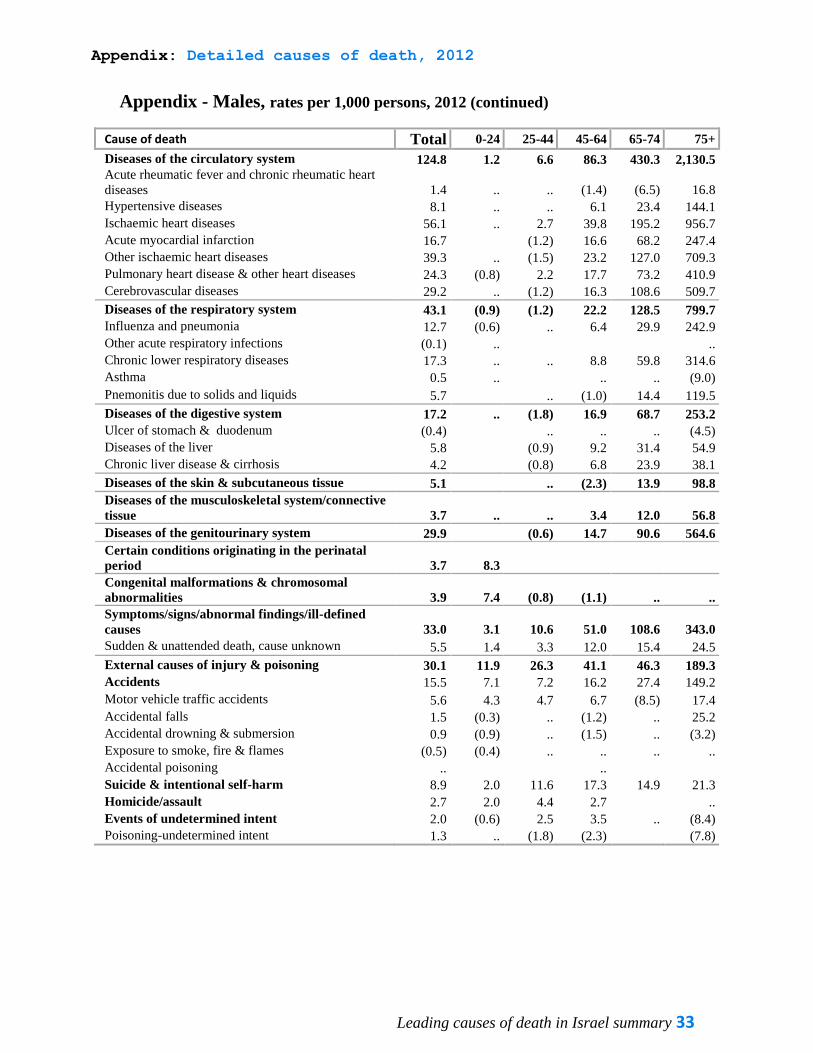
Appendix: Detailed causes of death, 2012
33 Leading causes of death in Israel summary
Appendix - Males, rates per 1,000 persons, 2012 (continued)
Cause of death Total 0-24 25-44 45-64 65-74 75+
Diseases of the circulatory system 124.8 1.2 6.6 86.3 430.3 2,130.5
Acute rheumatic fever and chronic rheumatic heart
diseases 1.4 .. .. (1.4) (6.5) 16.8
Hypertensive diseases 8.1 .. .. 6.1 23.4 144.1
Ischaemic heart diseases 56.1 .. 2.7 39.8 195.2 956.7
Acute myocardial infarction 16.7 (1.2) 16.6 68.2 247.4
Other ischaemic heart diseases 39.3 .. (1.5) 23.2 127.0 709.3
Pulmonary heart disease & other heart diseases 24.3 (0.8) 2.2 17.7 73.2 410.9
Cerebrovascular diseases 29.2 .. (1.2) 16.3 108.6 509.7
Diseases of the respiratory system 43.1 (0.9) (1.2) 22.2 128.5 799.7
Influenza and pneumonia 12.7 (0.6) .. 6.4 29.9 242.9
Other acute respiratory infections (0.1) .. ..
Chronic lower respiratory diseases 17.3 .. .. 8.8 59.8 314.6
Asthma 0.5 .. .. .. (9.0)
Pnemonitis due to solids and liquids 5.7 .. (1.0) 14.4 119.5
Diseases of the digestive system 17.2 .. (1.8) 16.9 68.7 253.2
Ulcer of stomach & duodenum (0.4) .. .. .. (4.5)
Diseases of the liver 5.8 (0.9) 9.2 31.4 54.9
Chronic liver disease & cirrhosis 4.2 (0.8) 6.8 23.9 38.1
Diseases of the skin & subcutaneous tissue 5.1 .. (2.3) 13.9 98.8
Diseases of the musculoskeletal system/connective
tissue 3.7 .. .. 3.4 12.0 56.8
Diseases of the genitourinary system 29.9 (0.6) 14.7 90.6 564.6
Certain conditions originating in the perinatal
period 3.7 8.3
Congenital malformations & chromosomal
abnormalities 3.9 7.4 (0.8) (1.1) .. ..
Symptoms/signs/abnormal findings/ill-defined
causes 33.0 3.1 10.6 51.0 108.6 343.0
Sudden & unattended death, cause unknown 5.5 1.4 3.3 12.0 15.4 24.5
External causes of injury & poisoning 30.1 11.9 26.3 41.1 46.3 189.3
Accidents 15.5 7.1 7.2 16.2 27.4 149.2
Motor vehicle traffic accidents 5.6 4.3 4.7 6.7 (8.5) 17.4
Accidental falls 1.5 (0.3) .. (1.2) .. 25.2
Accidental drowning & submersion 0.9 (0.9) .. (1.5) .. (3.2)
Exposure to smoke, fire & flames (0.5) (0.4) .. .. .. ..
Accidental poisoning .. ..
Suicide & intentional self-harm 8.9 2.0 11.6 17.3 14.9 21.3
Homicide/assault 2.7 2.0 4.4 2.7 ..
Events of undetermined intent 2.0 (0.6) 2.5 3.5 .. (8.4)
Poisoning-undetermined intent 1.3 .. (1.8) (2.3) (7.8)
Appendix: Detailed causes of death, 2012
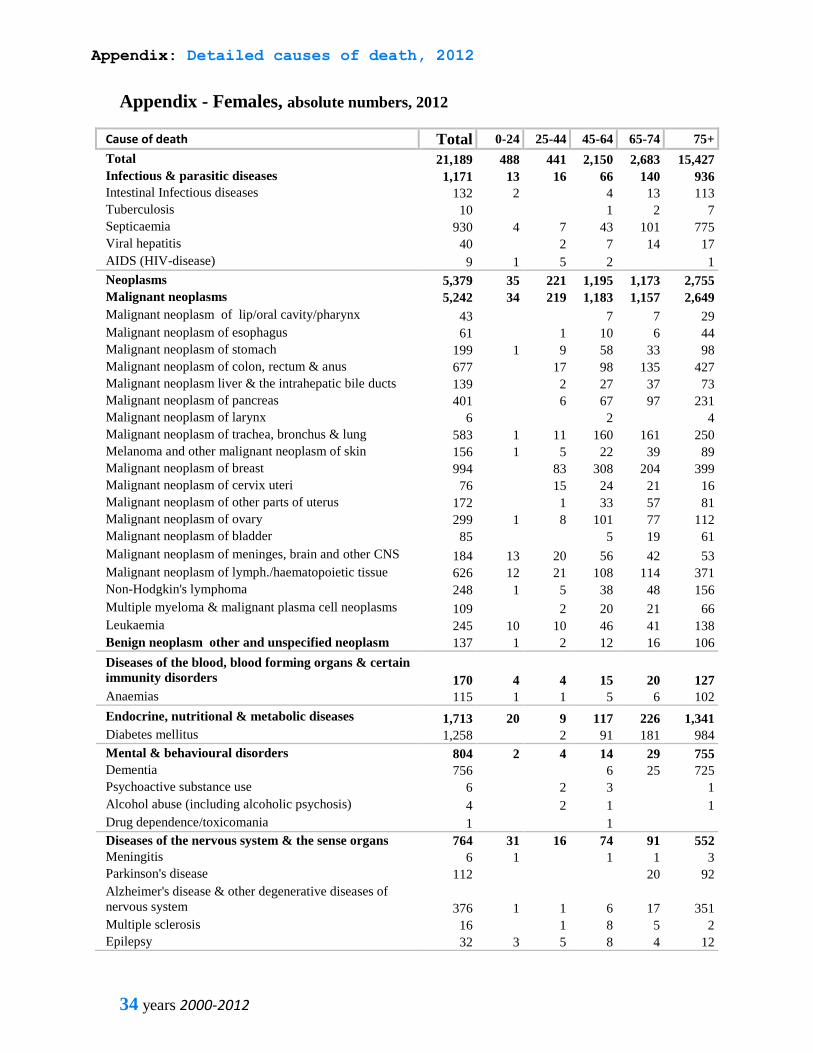
34 years 2000-2012
Appendix - Females, absolute numbers, 2012
Cause of death Total 0-24 25-44 45-64 65-74 75+
Total 21,189 488 441 2,150 2,683 15,427
Infectious & parasitic diseases 1,171 13 16 66 140 936
Intestinal Infectious diseases 132 2 4 13 113
Tuberculosis 10 1 2 7
Septicaemia 930 4 7 43 101 775
Viral hepatitis 40 2 7 14 17
AIDS (HIV-disease) 9 1 5 2 1
Neoplasms 5,379 35 221 1,195 1,173 2,755
Malignant neoplasms 5,242 34 219 1,183 1,157 2,649
Malignant neoplasm of lip/oral cavity/pharynx 43 7 7 29
Malignant neoplasm of esophagus 61 1 10 6 44
Malignant neoplasm of stomach 199 1 9 58 33 98
Malignant neoplasm of colon, rectum & anus 677 17 98 135 427
Malignant neoplasm liver & the intrahepatic bile ducts 139 2 27 37 73
Malignant neoplasm of pancreas 401 6 67 97 231
Malignant neoplasm of larynx 6 2 4
Malignant neoplasm of trachea, bronchus & lung 583 1 11 160 161 250
Melanoma and other malignant neoplasm of skin 156 1 5 22 39 89
Malignant neoplasm of breast 994 83 308 204 399
Malignant neoplasm of cervix uteri 76 15 24 21 16
Malignant neoplasm of other parts of uterus 172 1 33 57 81
Malignant neoplasm of ovary 299 1 8 101 77 112
Malignant neoplasm of bladder 85 5 19 61
Malignant neoplasm of meninges, brain and other CNS 184 13 20 56 42 53
Malignant neoplasm of lymph./haematopoietic tissue 626 12 21 108 114 371
Non-Hodgkin's lymphoma 248 1 5 38 48 156
Multiple myeloma & malignant plasma cell neoplasms 109 2 20 21 66
Leukaemia 245 10 10 46 41 138
Benign neoplasm other and unspecified neoplasm 137 1 2 12 16 106
Diseases of the blood, blood forming organs & certain
immunity disorders 170 4 4 15 20 127
Anaemias 115 1 1 5 6 102
Endocrine, nutritional & metabolic diseases 1,713 20 9 117 226 1,341
Diabetes mellitus 1,258 2 91 181 984
Mental & behavioural disorders 804 2 4 14 29 755
Dementia 756 6 25 725
Psychoactive substance use 6 2 3 1
Alcohol abuse (including alcoholic psychosis) 4 2 1 1
Drug dependence/toxicomania 1 1
Diseases of the nervous system & the sense organs 764 31 16 74 91 552
Meningitis 6 1 1 1 3
Parkinson's disease 112 20 92
Alzheimer's disease & other degenerative diseases of
nervous system 376 1 1 6 17 351
Multiple sclerosis 16 1 8 5 2
Epilepsy 32 3 5 8 4 12
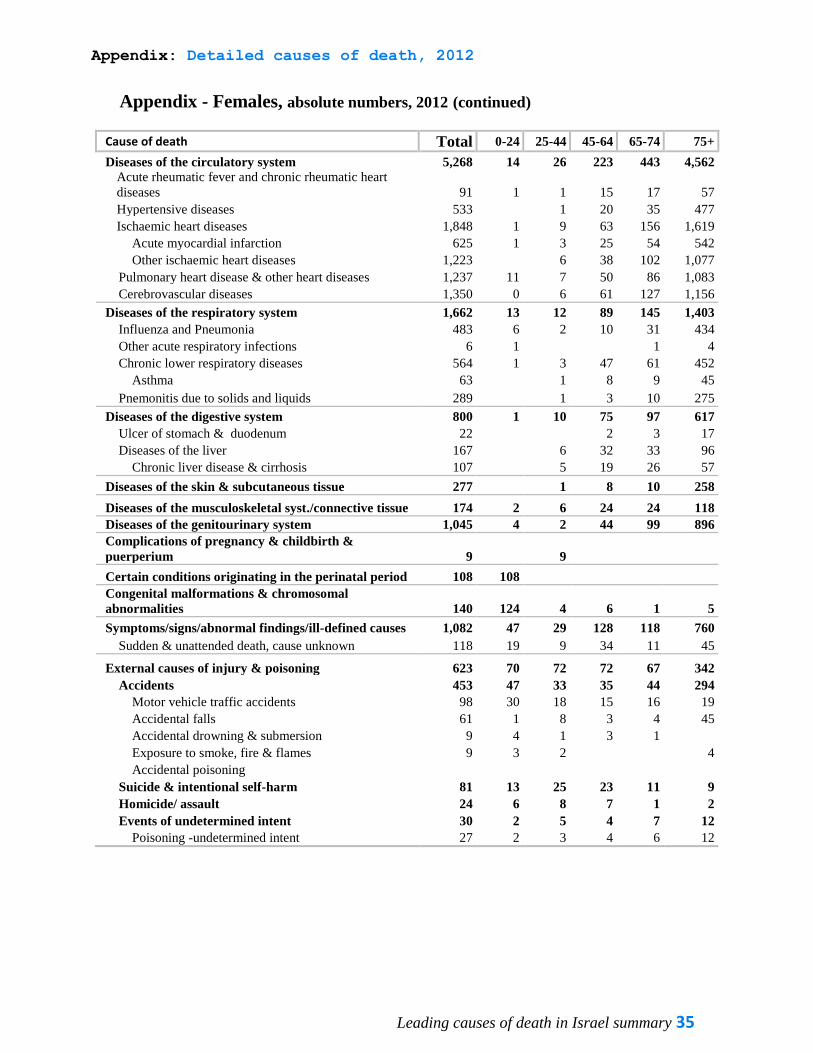
Appendix: Detailed causes of death, 2012
35 Leading causes of death in Israel summary
Appendix - Females, absolute numbers, 2012 (continued)
Cause of death Total 0-24 25-44 45-64 65-74 75+
Diseases of the circulatory system 5,268 14 26 223 443 4,562
Acute rheumatic fever and chronic rheumatic heart
diseases 91 1 1 15 17 57
Hypertensive diseases 533 1 20 35 477
Ischaemic heart diseases 1,848 1 9 63 156 1,619
Acute myocardial infarction 625 1 3 25 54 542
Other ischaemic heart diseases 1,223 6 38 102 1,077
Pulmonary heart disease & other heart diseases 1,237 11 7 50 86 1,083
Cerebrovascular diseases 1,350 0 6 61 127 1,156
Diseases of the respiratory system 1,662 13 12 89 145 1,403
Influenza and Pneumonia 483 6 2 10 31 434
Other acute respiratory infections 6 1 1 4
Chronic lower respiratory diseases 564 1 3 47 61 452
Asthma 63 1 8 9 45
Pnemonitis due to solids and liquids 289 1 3 10 275
Diseases of the digestive system 800 1 10 75 97 617
Ulcer of stomach & duodenum 22 2 3 17
Diseases of the liver 167 6 32 33 96
Chronic liver disease & cirrhosis 107 5 19 26 57
Diseases of the skin & subcutaneous tissue 277 1 8 10 258
Diseases of the musculoskeletal syst./connective tissue 174 2 6 24 24 118
Diseases of the genitourinary system 1,045 4 2 44 99 896
Complications of pregnancy & childbirth &
puerperium 9 9
Certain conditions originating in the perinatal period 108 108
Congenital malformations & chromosomal
abnormalities 140 124 4 6 1 5
Symptoms/signs/abnormal findings/ill-defined causes 1,082 47 29 128 118 760
Sudden & unattended death, cause unknown 118 19 9 34 11 45
External causes of injury & poisoning 623 70 72 72 67 342
Accidents 453 47 33 35 44 294
Motor vehicle traffic accidents 98 30 18 15 16 19
Accidental falls 61 1 8 3 4 45
Accidental drowning & submersion 9 4 1 3 1
Exposure to smoke, fire & flames 9 3 2 4
Accidental poisoning
Suicide & intentional self-harm 81 13 25 23 11 9
Homicide/ assault 24 6 8 7 1 2
Events of undetermined intent 30 2 5 4 7 12
Poisoning -undetermined intent 27 2 3 4 6 12
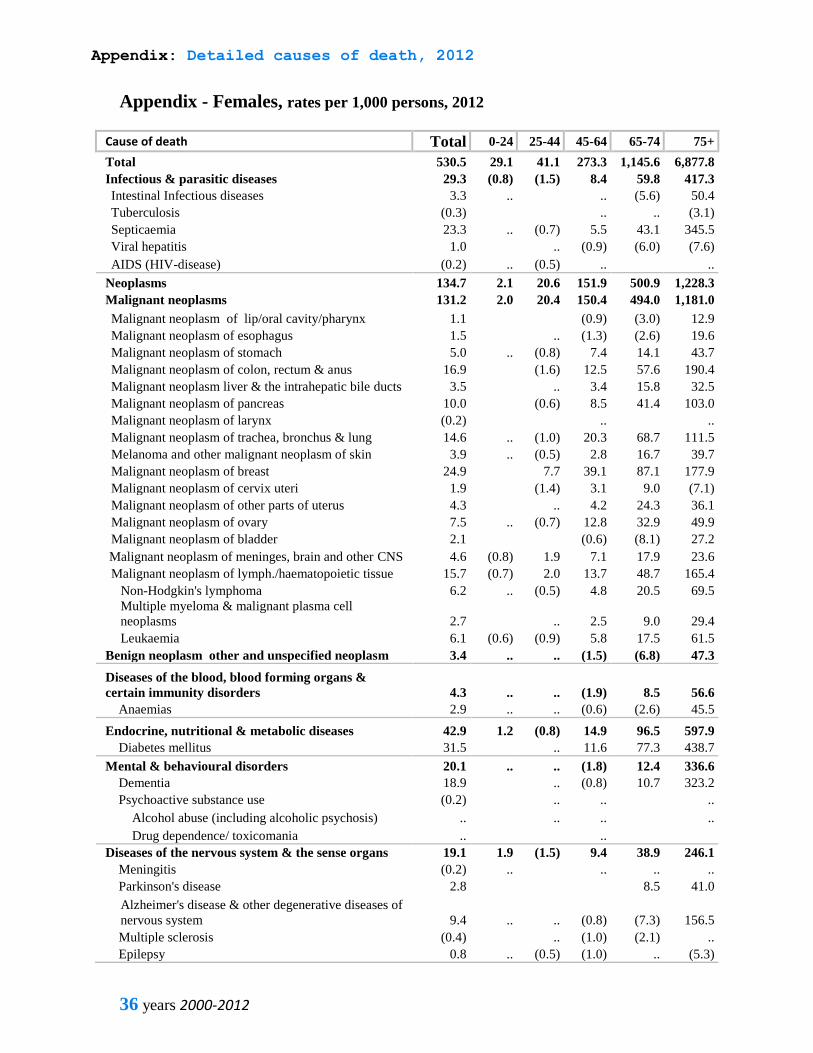
Appendix: Detailed causes of death, 2012
36 years 2000-2012
Appendix - Females, rates per 1,000 persons, 2012
Cause of death Total 0-24 25-44 45-64 65-74 75+
Total 530.5 29.1 41.1 273.3 1,145.6 6,877.8
Infectious & parasitic diseases 29.3 (0.8) (1.5) 8.4 59.8 417.3
Intestinal Infectious diseases 3.3 .. .. (5.6) 50.4
Tuberculosis (0.3) .. .. (3.1)
Septicaemia 23.3 .. (0.7) 5.5 43.1 345.5
Viral hepatitis 1.0 .. (0.9) (6.0) (7.6)
AIDS (HIV-disease) (0.2) .. (0.5) .. ..
Neoplasms 134.7 2.1 20.6 151.9 500.9 1,228.3
Malignant neoplasms 131.2 2.0 20.4 150.4 494.0 1,181.0
Malignant neoplasm of lip/oral cavity/pharynx 1.1 (0.9) (3.0) 12.9
Malignant neoplasm of esophagus 1.5 .. (1.3) (2.6) 19.6
Malignant neoplasm of stomach 5.0 .. (0.8) 7.4 14.1 43.7
Malignant neoplasm of colon, rectum & anus 16.9 (1.6) 12.5 57.6 190.4
Malignant neoplasm liver & the intrahepatic bile ducts 3.5 .. 3.4 15.8 32.5
Malignant neoplasm of pancreas 10.0 (0.6) 8.5 41.4 103.0
Malignant neoplasm of larynx (0.2) .. ..
Malignant neoplasm of trachea, bronchus & lung 14.6 .. (1.0) 20.3 68.7 111.5
Melanoma and other malignant neoplasm of skin 3.9 .. (0.5) 2.8 16.7 39.7
Malignant neoplasm of breast 24.9 7.7 39.1 87.1 177.9
Malignant neoplasm of cervix uteri 1.9 (1.4) 3.1 9.0 (7.1)
Malignant neoplasm of other parts of uterus 4.3 .. 4.2 24.3 36.1
Malignant neoplasm of ovary 7.5 .. (0.7) 12.8 32.9 49.9
Malignant neoplasm of bladder 2.1 (0.6) (8.1) 27.2
Malignant neoplasm of meninges, brain and other CNS 4.6 (0.8) 1.9 7.1 17.9 23.6
Malignant neoplasm of lymph./haematopoietic tissue 15.7 (0.7) 2.0 13.7 48.7 165.4
Non-Hodgkin's lymphoma 6.2 .. (0.5) 4.8 20.5 69.5
Multiple myeloma & malignant plasma cell
neoplasms 2.7 .. 2.5 9.0 29.4
Leukaemia 6.1 (0.6) (0.9) 5.8 17.5 61.5
Benign neoplasm other and unspecified neoplasm 3.4 .. .. (1.5) (6.8) 47.3
Diseases of the blood, blood forming organs &
certain immunity disorders 4.3 .. .. (1.9) 8.5 56.6
Anaemias 2.9 .. .. (0.6) (2.6) 45.5
Endocrine, nutritional & metabolic diseases 42.9 1.2 (0.8) 14.9 96.5 597.9
Diabetes mellitus 31.5 .. 11.6 77.3 438.7
Mental & behavioural disorders 20.1 .. .. (1.8) 12.4 336.6
Dementia 18.9 .. (0.8) 10.7 323.2
Psychoactive substance use (0.2) .. .. ..
Alcohol abuse (including alcoholic psychosis) .. .. .. ..
Drug dependence/ toxicomania .. ..
Diseases of the nervous system & the sense organs 19.1 1.9 (1.5) 9.4 38.9 246.1
Meningitis (0.2) .. .. .. ..
Parkinson's disease 2.8 8.5 41.0
Alzheimer's disease & other degenerative diseases of
nervous system 9.4 .. .. (0.8) (7.3) 156.5
Multiple sclerosis (0.4) .. (1.0) (2.1) ..
Epilepsy 0.8 .. (0.5) (1.0) .. (5.3)
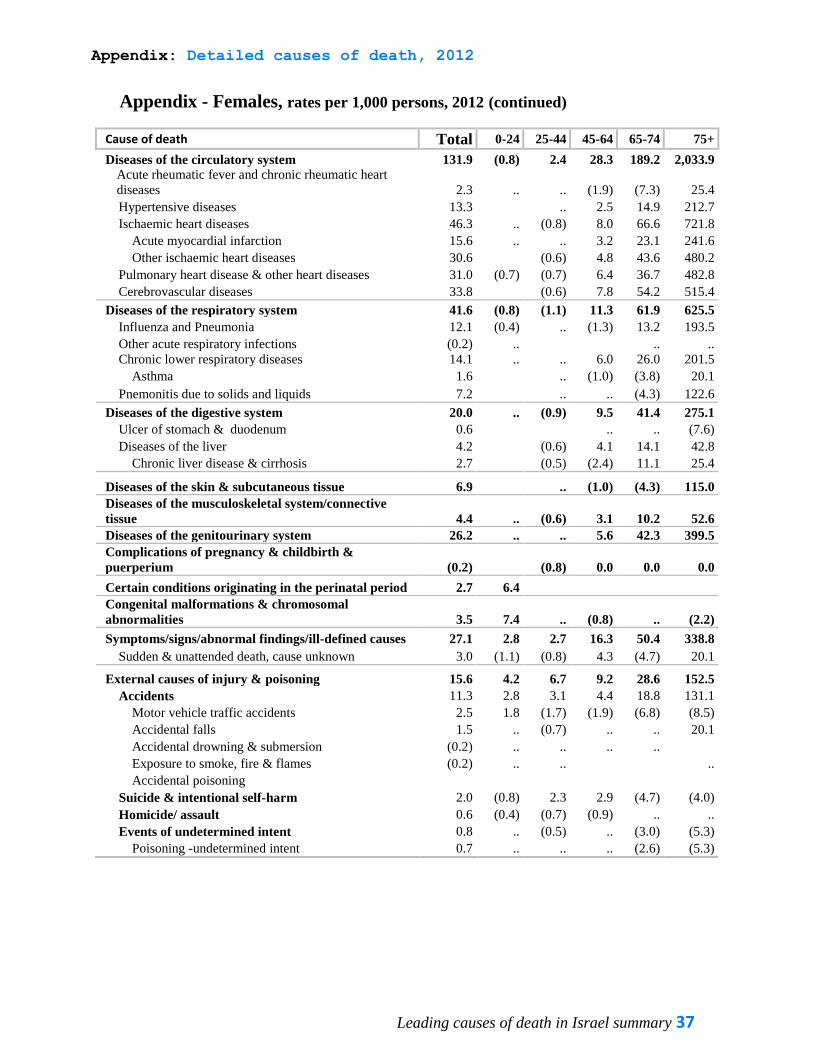
Appendix: Detailed causes of death, 2012
37 Leading causes of death in Israel summary
Appendix - Females, rates per 1,000 persons, 2012 (continued)
Cause of death Total 0-24 25-44 45-64 65-74 75+
Diseases of the circulatory system 131.9 (0.8) 2.4 28.3 189.2 2,033.9
Acute rheumatic fever and chronic rheumatic heart
diseases 2.3 .. .. (1.9) (7.3) 25.4
Hypertensive diseases 13.3 .. 2.5 14.9 212.7
Ischaemic heart diseases 46.3 .. (0.8) 8.0 66.6 721.8
Acute myocardial infarction 15.6 .. .. 3.2 23.1 241.6
Other ischaemic heart diseases 30.6 (0.6) 4.8 43.6 480.2
Pulmonary heart disease & other heart diseases 31.0 (0.7) (0.7) 6.4 36.7 482.8
Cerebrovascular diseases 33.8 (0.6) 7.8 54.2 515.4
Diseases of the respiratory system 41.6 (0.8) (1.1) 11.3 61.9 625.5
Influenza and Pneumonia 12.1 (0.4) .. (1.3) 13.2 193.5
Other acute respiratory infections (0.2) .. .. ..
Chronic lower respiratory diseases 14.1 .. .. 6.0 26.0 201.5
Asthma 1.6 .. (1.0) (3.8) 20.1
Pnemonitis due to solids and liquids 7.2 .. .. (4.3) 122.6
Diseases of the digestive system 20.0 .. (0.9) 9.5 41.4 275.1
Ulcer of stomach & duodenum 0.6 .. .. (7.6)
Diseases of the liver 4.2 (0.6) 4.1 14.1 42.8
Chronic liver disease & cirrhosis 2.7 (0.5) (2.4) 11.1 25.4
Diseases of the skin & subcutaneous tissue 6.9 .. (1.0) (4.3) 115.0
Diseases of the musculoskeletal system/connective
tissue 4.4 .. (0.6) 3.1 10.2 52.6
Diseases of the genitourinary system 26.2 .. .. 5.6 42.3 399.5
Complications of pregnancy & childbirth &
puerperium (0.2) (0.8) 0.0 0.0 0.0
Certain conditions originating in the perinatal period 2.7 6.4
Congenital malformations & chromosomal
abnormalities 3.5 7.4 .. (0.8) .. (2.2)
Symptoms/signs/abnormal findings/ill-defined causes 27.1 2.8 2.7 16.3 50.4 338.8
Sudden & unattended death, cause unknown 3.0 (1.1) (0.8) 4.3 (4.7) 20.1
External causes of injury & poisoning 15.6 4.2 6.7 9.2 28.6 152.5
Accidents 11.3 2.8 3.1 4.4 18.8 131.1
Motor vehicle traffic accidents 2.5 1.8 (1.7) (1.9) (6.8) (8.5)
Accidental falls 1.5 .. (0.7) .. .. 20.1
Accidental drowning & submersion (0.2) .. .. .. ..
Exposure to smoke, fire & flames (0.2) .. .. ..
Accidental poisoning
Suicide & intentional self-harm 2.0 (0.8) 2.3 2.9 (4.7) (4.0)
Homicide/ assault 0.6 (0.4) (0.7) (0.9) .. ..
Events of undetermined intent 0.8 .. (0.5) .. (3.0) (5.3)
Poisoning -undetermined intent 0.7 .. .. .. (2.6) (5.3)