Embed Size (px)
Citation preview
w w w . e i d e b a i l l y . c o m
Ross Manson, [email protected]
701.239.8634
Leadership: Five Imperatives Hospitals
and Health Systems Can Plan for Now
to Succeed in the Future
w w w . e i d e b a i l l y . c o m
Presentation Disclaimer
• These seminar materials are intended to provide the seminar participants
with guidance in general health care industry matters. The materials do not
constitute, and should not be treated as professional advice regarding the
use of any particular health care industry technique. Every effort has been
made to assure the accuracy of these materials. Eide Bailly LLP and the
author do not assume responsibility for any individual's reliance upon the
written or oral information provided during the seminar. Seminar participants
should independently verify all statements made before applying them to a
particular fact situation, and should independently determine the health care
reform consequences of any particular health care reform technique before
recommending the technique to a client or implementing it on the client's
behalf.
2
w w w . e i d e b a i l l y . c o m
5 Imperatives for future success:
1. Invest in a comprehensive customer experience strategy.
2. Embrace, Mobilize, and Secure Data.
3. Reduce variation through statistical modeling.
4. Redefine your capital asset investment philosophy.
5. Encourage diversity of thought.
w w w . e i d e b a i l l y . c o m
Traditional Issues/Topics…still important.
• Revenue cycle management
• Service line analysis
• Quality improvement initiatives
• Operational efficiency

Consumers and their Experience
w w w . e i d e b a i l l y . c o m
Current Patient Experiences
• Struggle to get a Physician appointment.
• Patients get lost on hospital campus.
• Sticker shock after receiving their bill.
• Do not know how to follow up.
• Doesn’t this shout out the need for a more comprehensive
patient experience strategy?
w w w . e i d e b a i l l y . c o m
$5,277
$4,955
$4,823
$4,565
$4,316
$4,129
$3,997*
$3,515
$3,354
$3,281*
$2,973*
$2,713
$2,661*
$2,412*
$2,137*
$1,787*
$1,619
$1,543
$12,865
$12,591*
$12,011
$11,786
$11,429*
$10,944*
$9,773
$9,860*
$9,325*
$8,824
$8,508*
$8,167*
$7,289*
$6,657*
$5,866*
$5,274*
$4,819*
$4,247
2016
2015
2014
2013
2012
2011
2010
2009
2008
2007
2006
2005
2004
2003
2002
2001
2000
1999
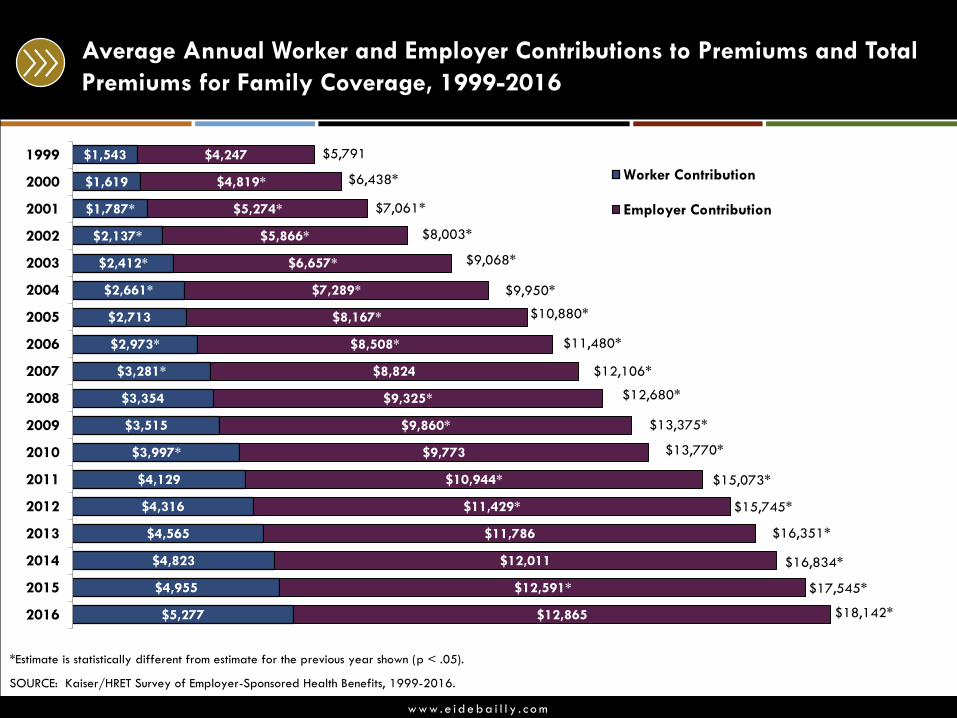
Worker Contribution
Employer Contribution
$18,142*
Average Annual Worker and Employer Contributions to Premiums and Total
Premiums for Family Coverage, 1999-2016
*Estimate is statistically different from estimate for the previous year shown (p < .05).
SOURCE: Kaiser/HRET Survey of Employer-Sponsored Health Benefits, 1999-2016.
$5,791
$6,438*
$7,061*
$8,003*
$9,068*
$9,950*
$10,880*
$11,480*
$12,106*
$12,680*
$13,375*
$13,770*
$15,073*
$15,745*
$16,351*
$16,834*
$17,545*
w w w . e i d e b a i l l y . c o m
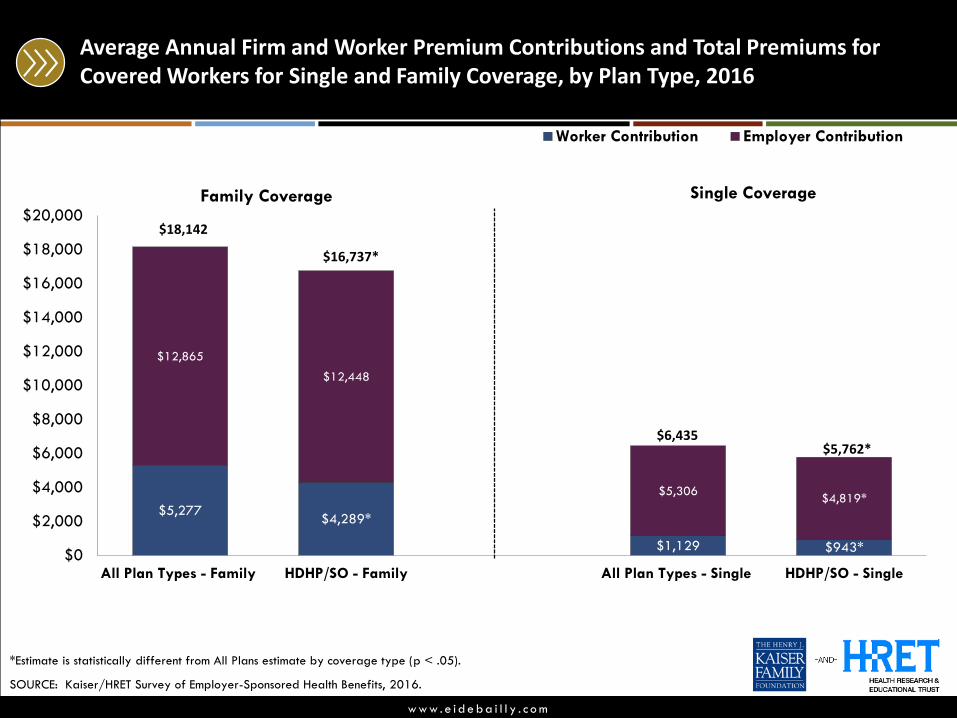
Average Annual Firm and Worker Premium Contributions and Total Premiums for Covered Workers for Single and Family Coverage, by Plan Type, 2016
$943*$1,129
$4,289*$5,277
$4,819*$5,306
$12,448
$12,865
$0
$2,000
$4,000
$6,000
$8,000
$10,000
$12,000
$14,000
$16,000
$18,000
$20,000
HDHP/SO - SingleAll Plan Types - SingleHDHP/SO - FamilyAll Plan Types - Family
Worker Contribution Employer Contribution
*Estimate is statistically different from All Plans estimate by coverage type (p < .05).
SOURCE: Kaiser/HRET Survey of Employer-Sponsored Health Benefits, 2016.
$18,142
$16,737*
$5,762*$6,435
Family Coverage Single Coverage
w w w . e i d e b a i l l y . c o m
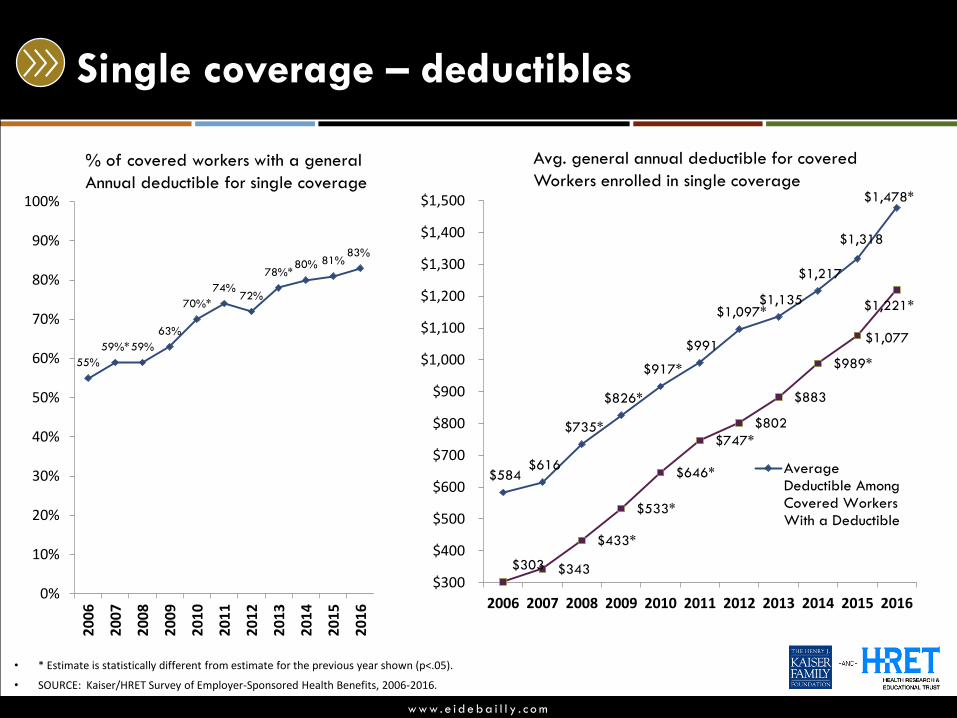
Single coverage – deductibles
55%
59%*59%
63%
70%*
74%72%
78%*80% 81%
83%
0%
10%
20%
30%
40%
50%
60%
70%
80%
90%
100%
20
06
20
07
20
08
20
09
20
10
20
11
20
12
20
13
20
14
20
15
20
16
$584 $616
$735*
$826*
$917*
$991
$1,097*$1,135
$1,217
$1,318
$1,478*
$303 $343
$433*
$533*
$646*
$747*
$802
$883
$989*
$1,077
$1,221*
$300
$400
$500
$600
$700
$800
$900
$1,000
$1,100
$1,200
$1,300
$1,400
$1,500
2006 2007 2008 2009 2010 2011 2012 2013 2014 2015 2016
AverageDeductible AmongCovered WorkersWith a Deductible
• * Estimate is statistically different from estimate for the previous year shown (p<.05).
• SOURCE: Kaiser/HRET Survey of Employer-Sponsored Health Benefits, 2006-2016.
% of covered workers with a general
Annual deductible for single coverage
Avg. general annual deductible for covered
Workers enrolled in single coverage
w w w . e i d e b a i l l y . c o m
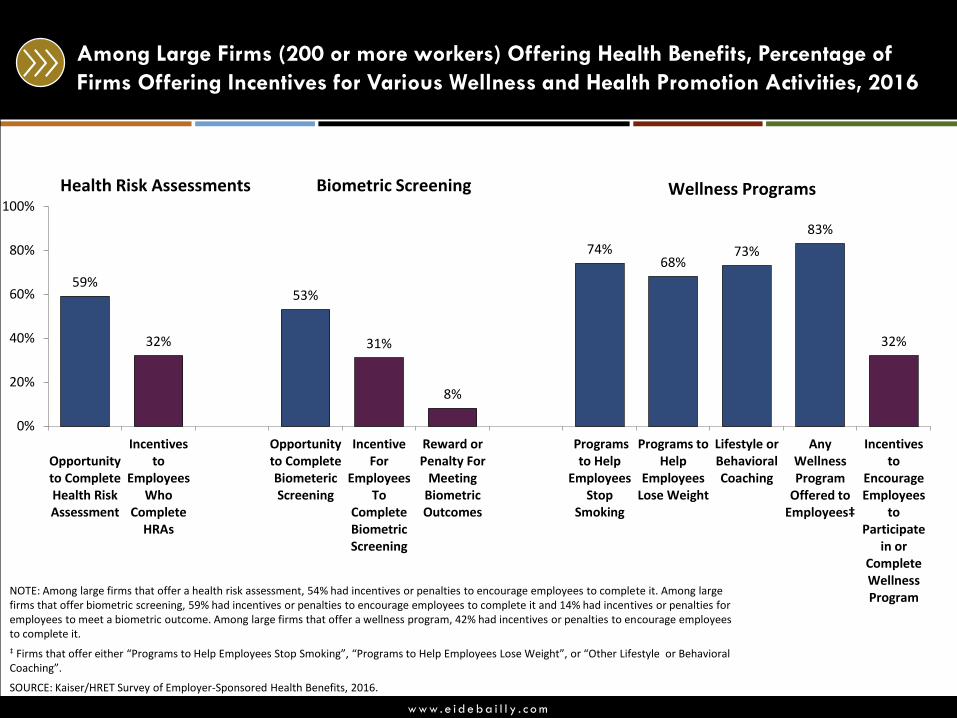
Among Large Firms (200 or more workers) Offering Health Benefits, Percentage of
Firms Offering Incentives for Various Wellness and Health Promotion Activities, 2016
NOTE: Among large firms that offer a health risk assessment, 54% had incentives or penalties to encourage employees to complete it. Among large firms that offer biometric screening, 59% had incentives or penalties to encourage employees to complete it and 14% had incentives or penalties for employees to meet a biometric outcome. Among large firms that offer a wellness program, 42% had incentives or penalties to encourage employees to complete it.
‡ Firms that offer either “Programs to Help Employees Stop Smoking”, “Programs to Help Employees Lose Weight”, or “Other Lifestyle or Behavioral Coaching”.
SOURCE: Kaiser/HRET Survey of Employer-Sponsored Health Benefits, 2016.
59%
32%
53%
31%
8%
74%68%
73%
83%
32%
0%
20%
40%
60%
80%
100%
Opportunityto CompleteHealth RiskAssessment
Incentivesto
EmployeesWho
CompleteHRAs
Opportunityto CompleteBiometericScreening
IncentiveFor
EmployeesTo
CompleteBiometricScreening
Reward orPenalty For
MeetingBiometricOutcomes
Programsto Help
EmployeesStop
Smoking
Programs toHelp
EmployeesLose Weight
Lifestyle orBehavioralCoaching
Any Wellness Program
Offered to Employees‡
Incentivesto
EncourageEmployees
toParticipate
in orCompleteWellnessProgram
Health Risk Assessments Biometric Screening Wellness Programs
w w w . e i d e b a i l l y . c o m
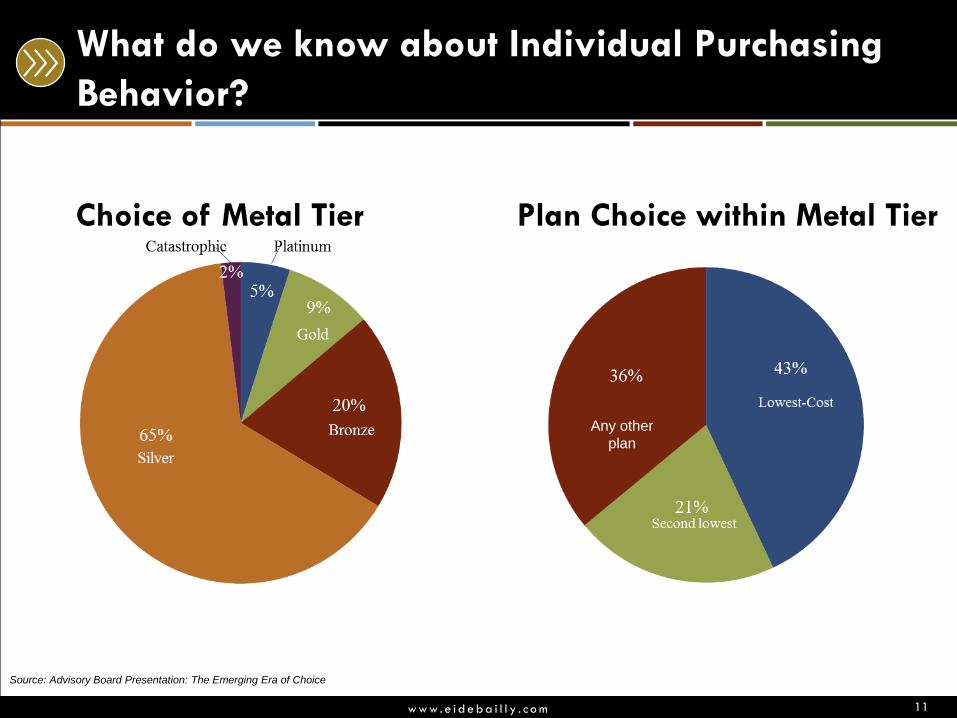
What do we know about Individual Purchasing
Behavior?
Choice of Metal Tier Plan Choice within Metal Tier
11
Any other
plan
Source: Advisory Board Presentation: The Emerging Era of Choice
w w w . e i d e b a i l l y . c o m
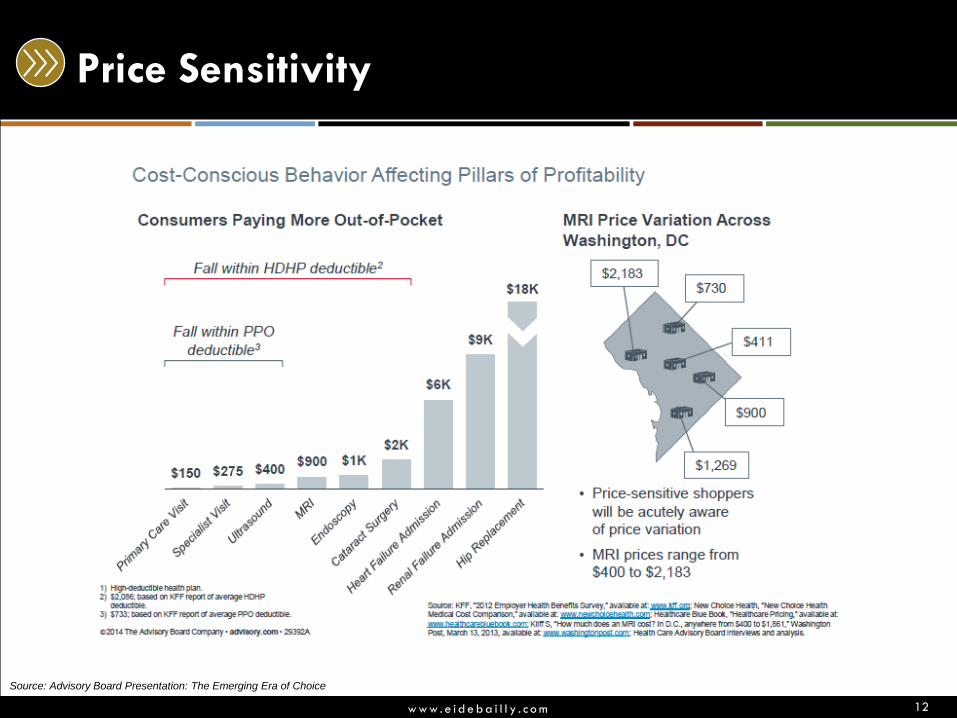
Price Sensitivity
12
Source: Advisory Board Presentation: The Emerging Era of Choice
w w w . e i d e b a i l l y . c o m
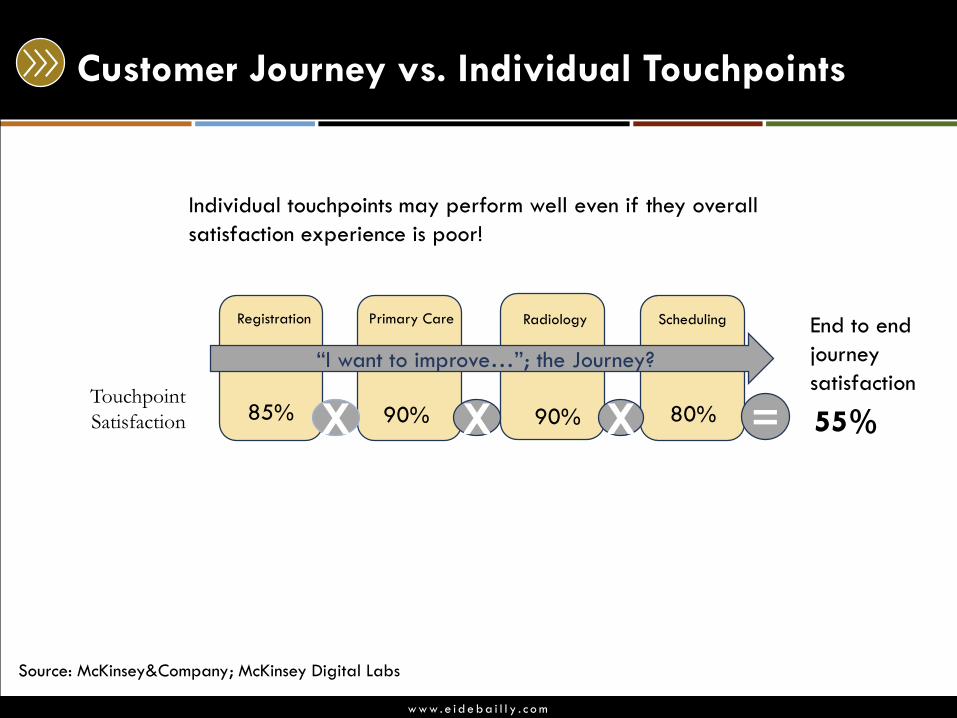
Customer Journey vs. Individual Touchpoints
Registration RadiologyPrimary Care Scheduling
Touchpoint
Satisfaction
Individual touchpoints may perform well even if they overall
satisfaction experience is poor!
X X X =85% 90% 90% 80% 55%
“I want to improve…”; the Journey?
End to end
journey
satisfaction
Source: McKinsey&Company; McKinsey Digital Labs
w w w . e i d e b a i l l y . c o m
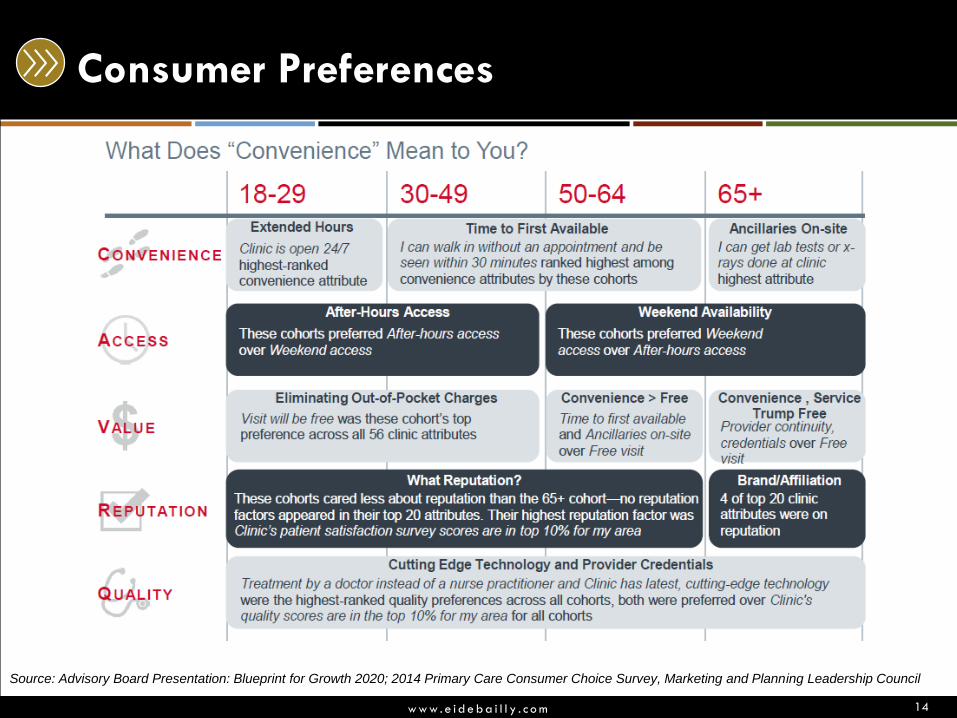
Consumer Preferences
14
Source: Advisory Board Presentation: Blueprint for Growth 2020; 2014 Primary Care Consumer Choice Survey, Marketing and Planning Leadership Council
w w w . e i d e b a i l l y . c o m
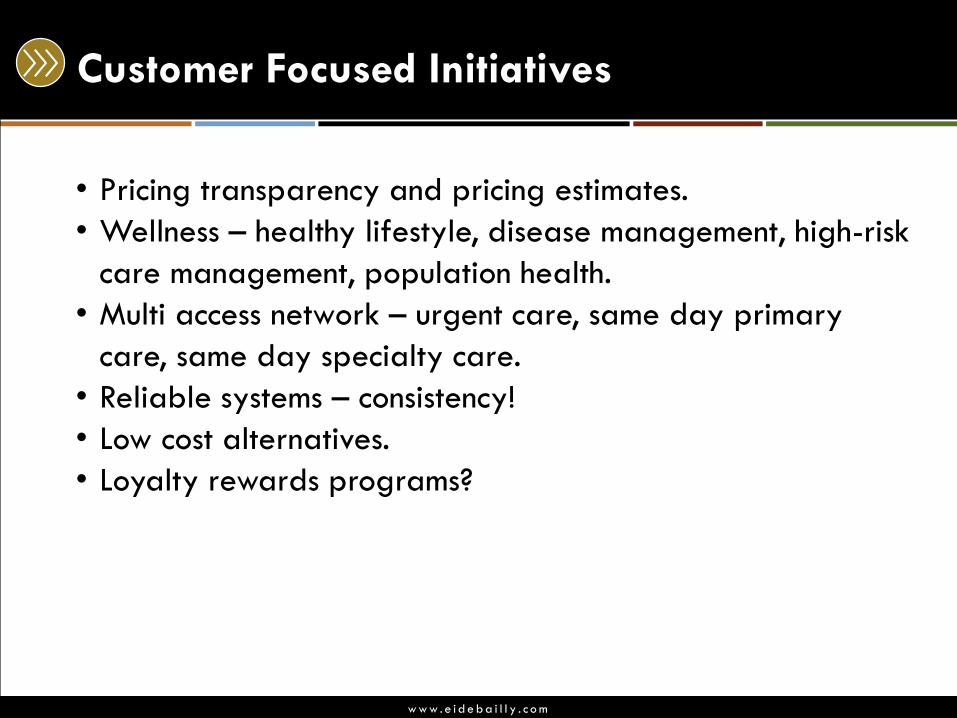
Customer Focused Initiatives
• Pricing transparency and pricing estimates.
• Wellness – healthy lifestyle, disease management, high-risk
care management, population health.
• Multi access network – urgent care, same day primary
care, same day specialty care.
• Reliable systems – consistency!
• Low cost alternatives.
• Loyalty rewards programs?
Embrace. Mobilize. Secure Data
w w w . e i d e b a i l l y . c o m
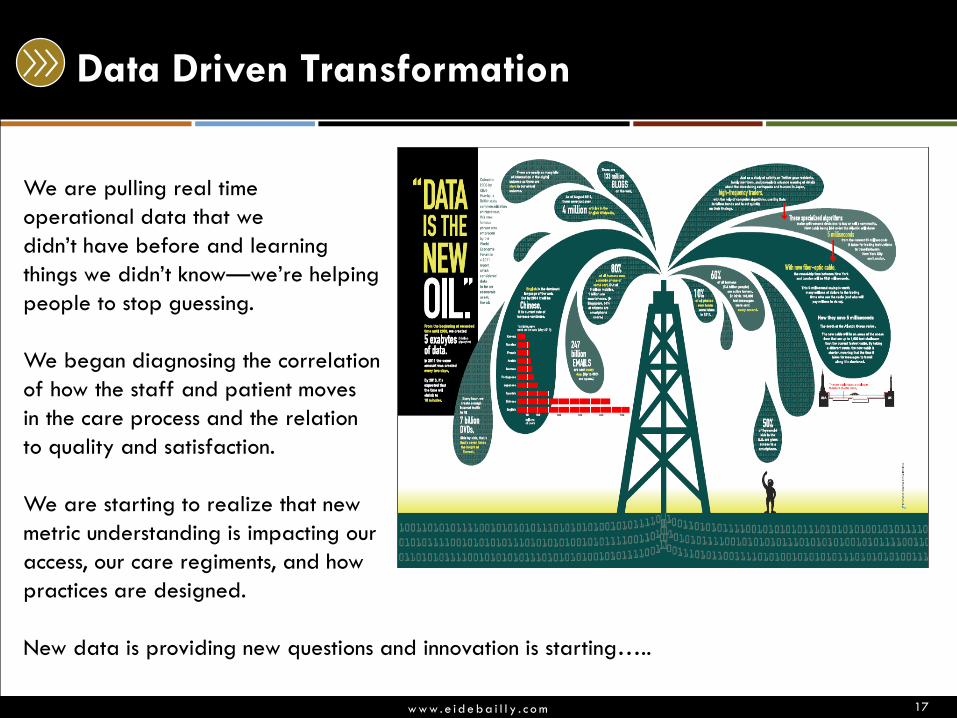
Data Driven Transformation
17
We are pulling real time
operational data that we
didn’t have before and learning
things we didn’t know—we’re helping
people to stop guessing.
We began diagnosing the correlation
of how the staff and patient moves
in the care process and the relation
to quality and satisfaction.
We are starting to realize that new
metric understanding is impacting our
access, our care regiments, and how
practices are designed.
New data is providing new questions and innovation is starting…..
w w w . e i d e b a i l l y . c o m
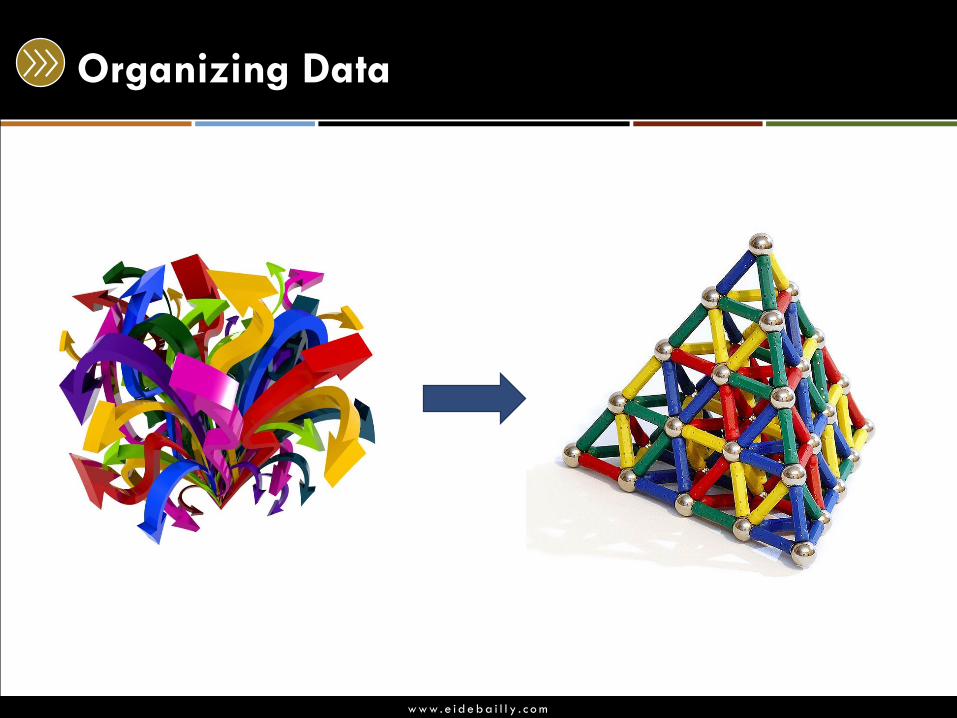
Organizing Data

w w w . e i d e b a i l l y . c o m
Elements of Data Management in Health Systems
Data pools are expanding
• EMR’s are gathering a sea of
data and helping to
understand cost of care.
• Real time location systems
(RTLS) providing deeper
information on “how” we
work.
• EDW’s – electronic data
warehouses – getting reports
out is very difficult.
Lagging information
• We keep reporting on what
happened in the past.
• Lagging, operational data
has limited usefulness.
• Staff need to know sooner of
variation in operational costs.
• The speed we expect the
data is quickly increasing.
w w w . e i d e b a i l l y . c o m
Moving Closer to Real Time
• To the extent that we can pull costs from new Electronic
Medical Records, costs associated with care are being
recorded and available sooner in the care process
• Systems such as RTLS provide real time understanding of
flow and resource use in the care process
• Operational Data is helping us understand Opportunity
Costs
• Organizations that have invested into improvement
programs are gathering new operational data that is
leading to financial and care improvements!
20
w w w . e i d e b a i l l y . c o m
A Shift Of Data Management
• Data Sets Will Only Get Bigger
• More reporting will be requested
• Reports Are Going Mobile
• New Streams of Data Are Being Added
• Real Time Information
• Correlative Information
• Costs Are Being Understand in More Levels of the
Organization
• Advanced Reporting Capabilities will Help Us Educate
People and Contain Costs
21
w w w . e i d e b a i l l y . c o m
What’s Fueling the Paradigm Shit
1) Operational data is becoming more abundant.
2) Care providers are learning the value of operational
data closer to the point of care.
3) Data is getting more mobile and providers understanding
how mobility can help drive decisions.
22

w w w . e i d e b a i l l y . c o m
Leveraging BI to Gain Understanding
23
w w w . e i d e b a i l l y . c o m
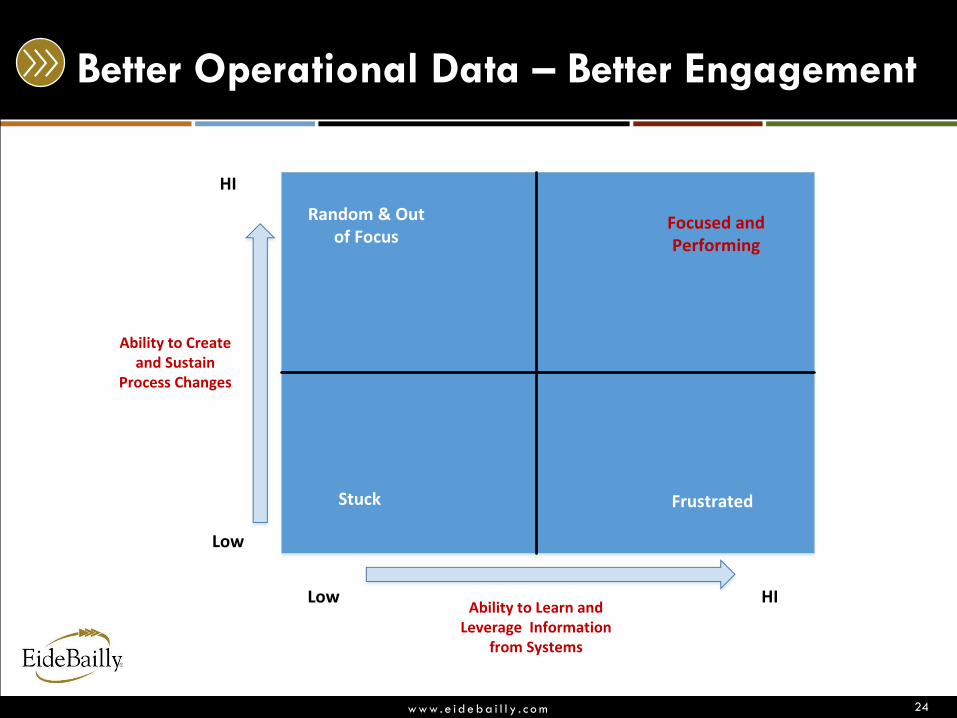
Better Operational Data – Better Engagement
24
Ability to Create and Sustain
Process Changes
HI
Low
Ability to Learn and Leverage Information
from Systems
Low HI
Stuck Frustrated
Random & Out of Focus
Focused and Performing
w w w . e i d e b a i l l y . c o m
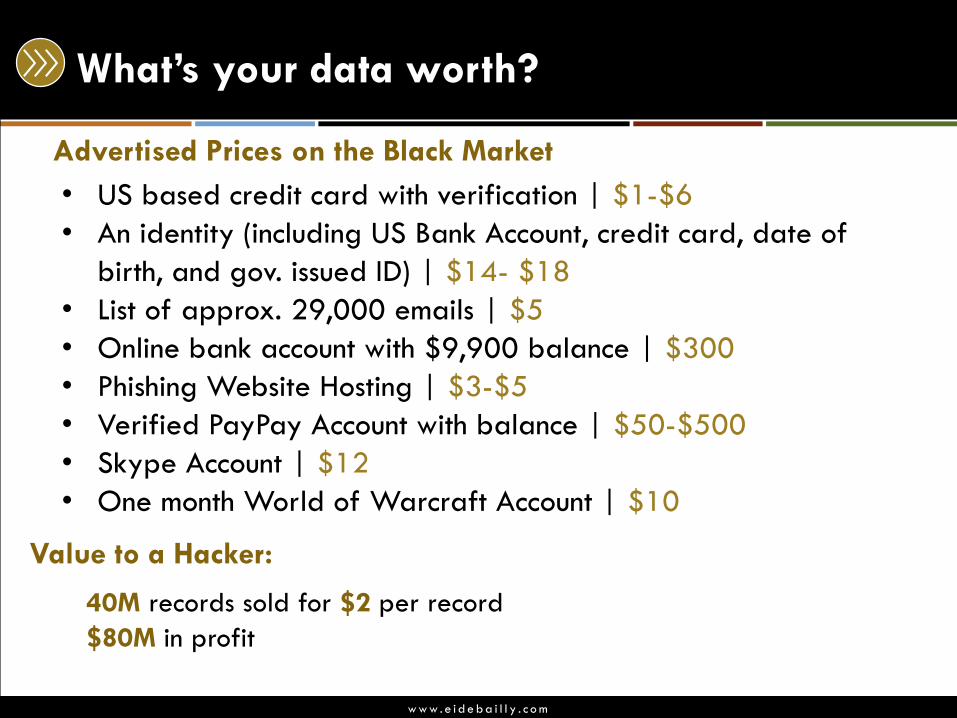
What’s your data worth?
• US based credit card with verification | $1-$6
• An identity (including US Bank Account, credit card, date of
birth, and gov. issued ID) | $14- $18
• List of approx. 29,000 emails | $5
• Online bank account with $9,900 balance | $300
• Phishing Website Hosting | $3-$5
• Verified PayPay Account with balance | $50-$500
• Skype Account | $12
• One month World of Warcraft Account | $10
Advertised Prices on the Black Market
Value to a Hacker:
40M records sold for $2 per record
$80M in profit
w w w . e i d e b a i l l y . c o m
www.eidebail ly.com/cybersecurity
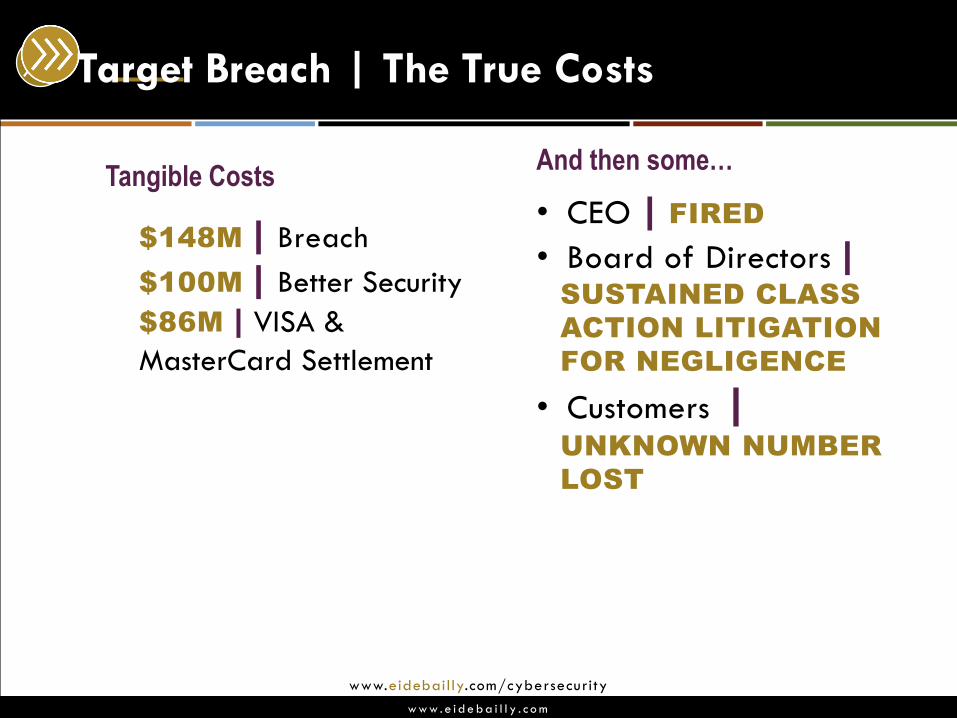
Target Breach | The True Costs
$148M | Breach
$100M | Better Security
$86M | VISA &
MasterCard Settlement
• CEO | FIRED
• Board of Directors |SUSTAINED CLASS
ACTION LITIGATION
FOR NEGLIGENCE
• Customers |UNKNOWN NUMBER
LOST
Tangible CostsAnd then some…

w w w . e i d e b a i l l y . c o m
No Business is Safe
w w w . e i d e b a i l l y . c o m
www.eidebail ly.com/cybersecurity
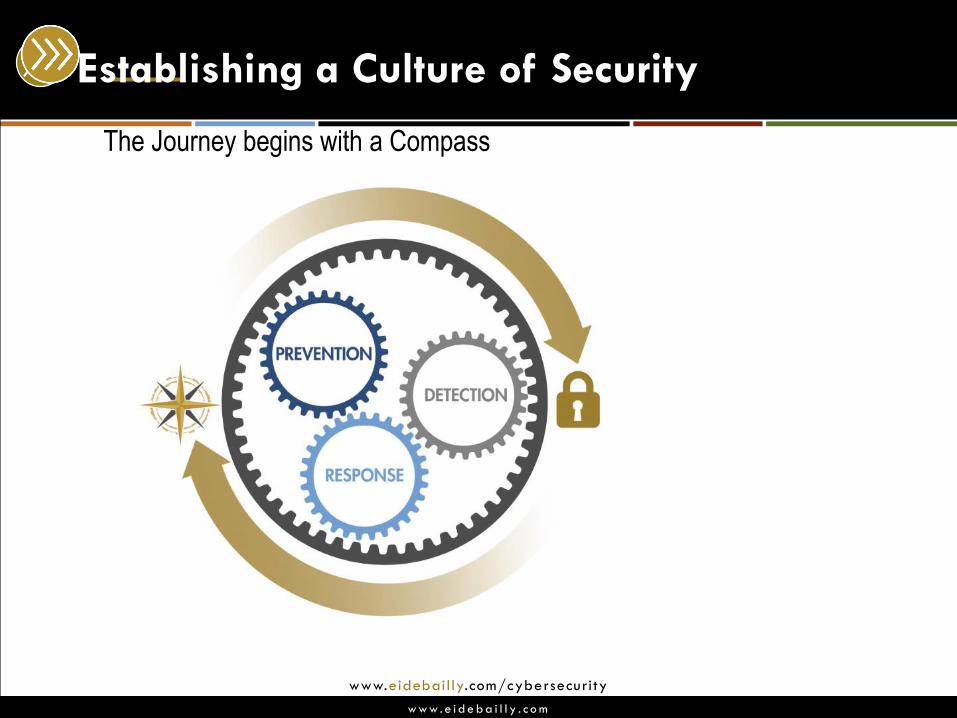
Establishing a Culture of Security
The Journey begins with a Compass
w w w . e i d e b a i l l y . c o m
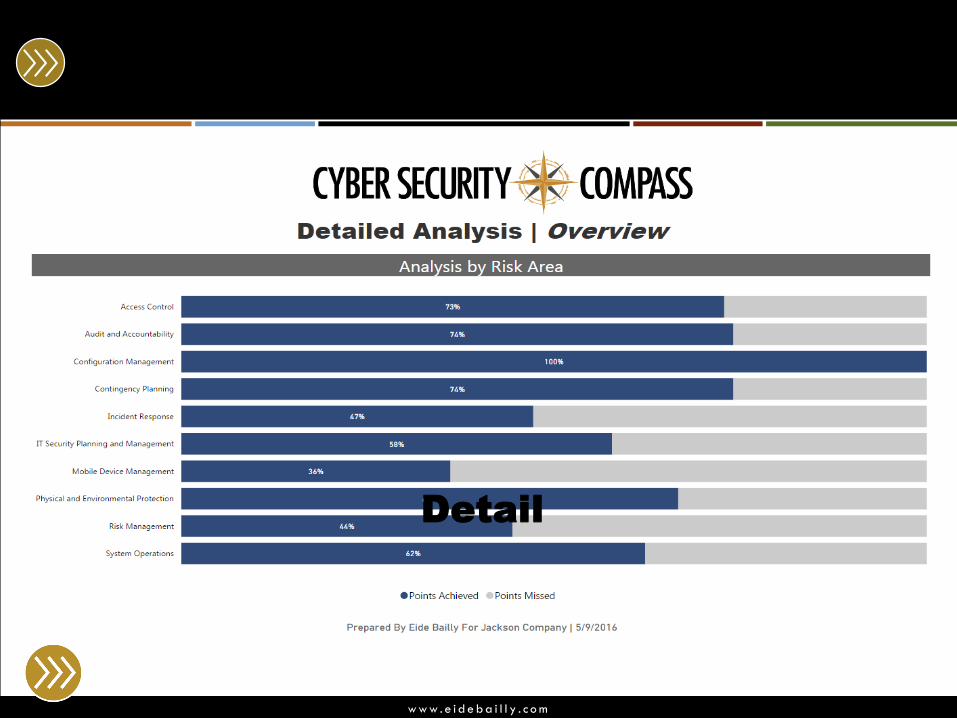
w w w . e i d e b a i l l y . c o m
Detail

Variation
w w w . e i d e b a i l l y . c o m
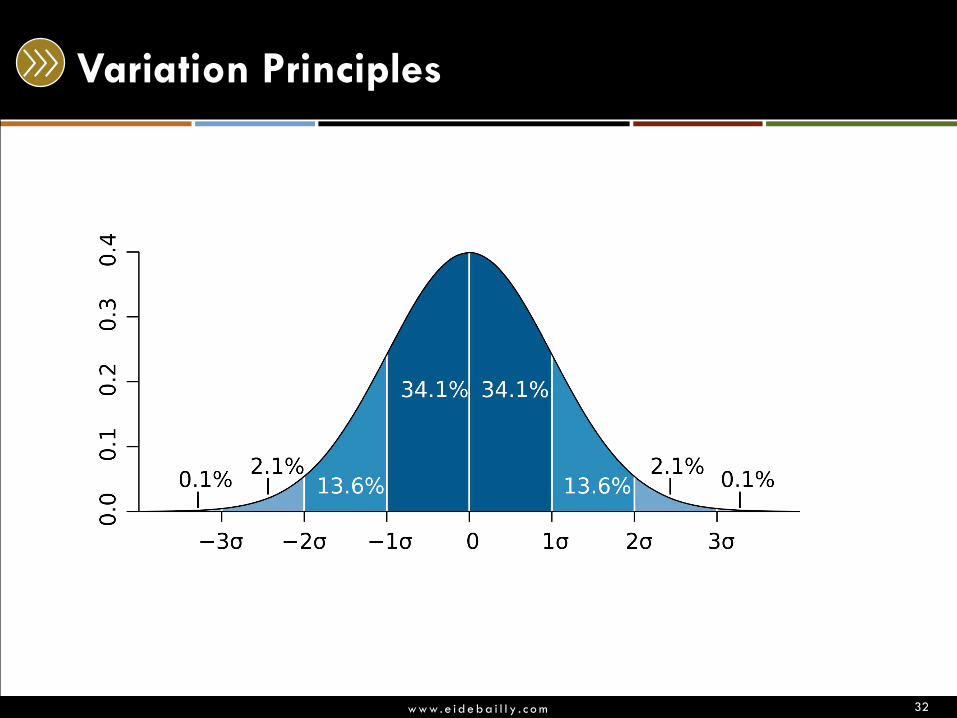
Variation Principles
32
w w w . e i d e b a i l l y . c o m
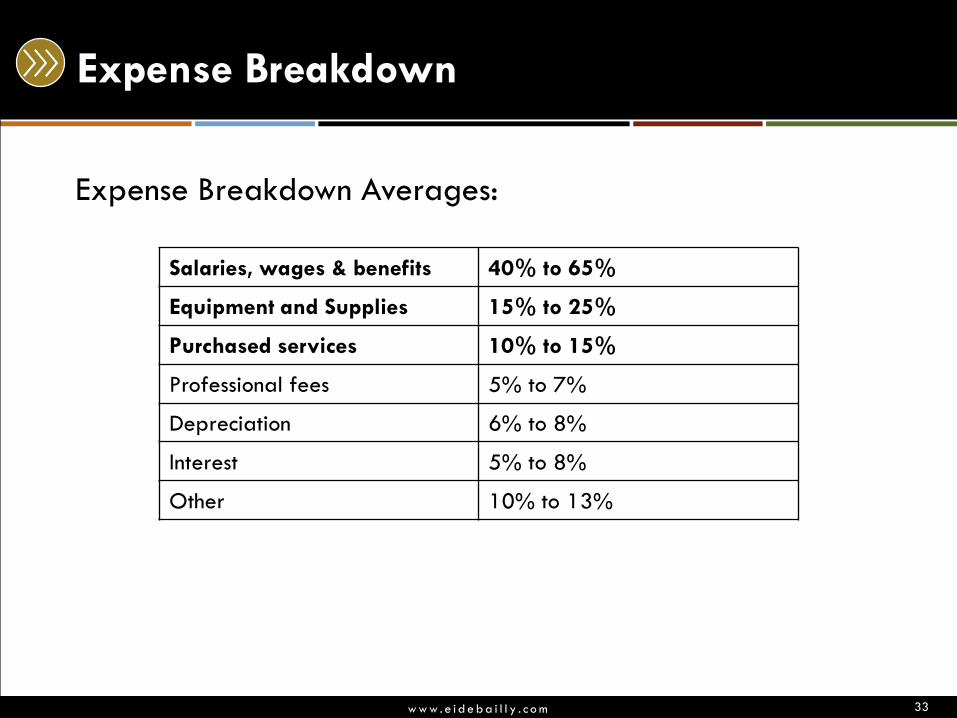
Expense Breakdown
Expense Breakdown Averages:
33
Salaries, wages & benefits 40% to 65%
Equipment and Supplies 15% to 25%
Purchased services 10% to 15%
Professional fees 5% to 7%
Depreciation 6% to 8%
Interest 5% to 8%
Other 10% to 13%
w w w . e i d e b a i l l y . c o m
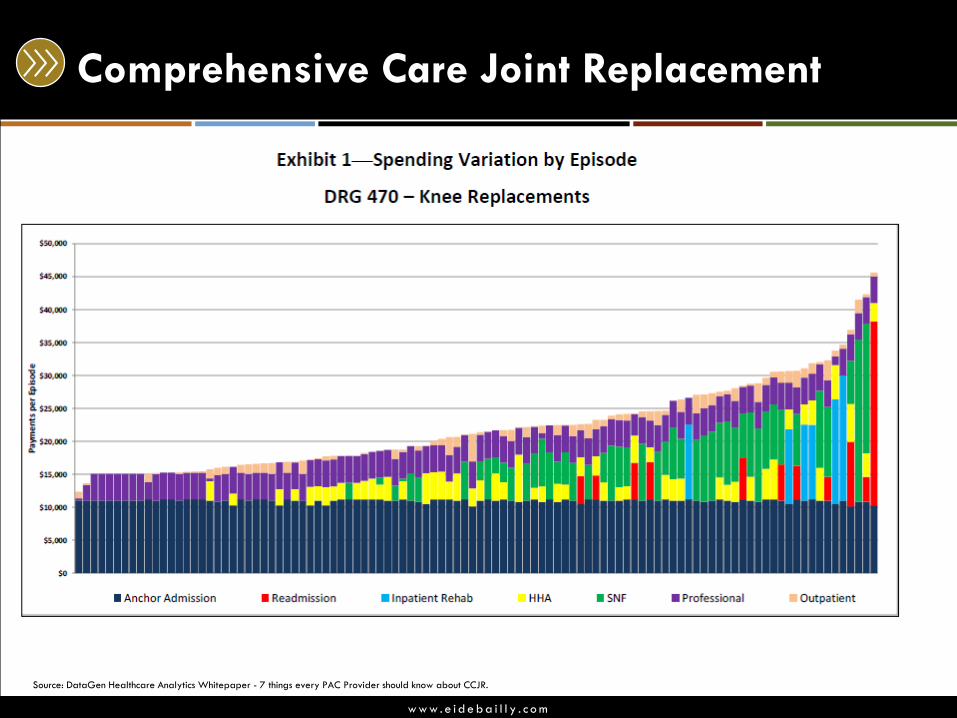
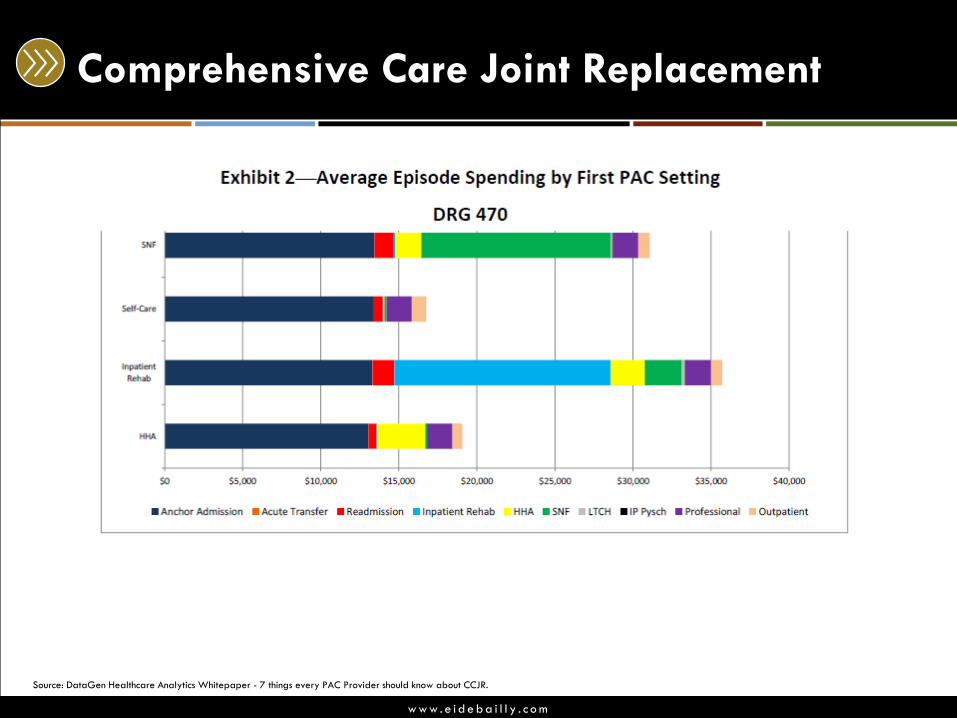
Comprehensive Care Joint Replacement
Source: DataGen Healthcare Analytics Whitepaper - 7 things every PAC Provider should know about CCJR.
w w w . e i d e b a i l l y . c o m
Comprehensive Care Joint Replacement
Source: DataGen Healthcare Analytics Whitepaper - 7 things every PAC Provider should know about CCJR.
w w w . e i d e b a i l l y . c o m
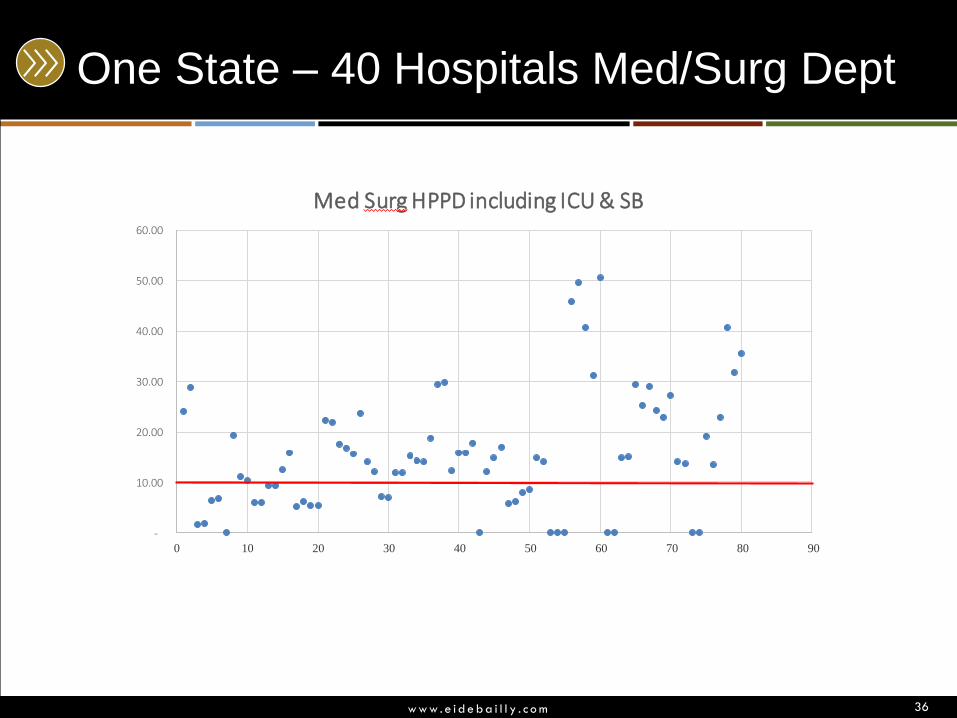
One State – 40 Hospitals Med/Surg Dept
36
-
10.00
20.00
30.00
40.00
50.00
60.00
0 10 20 30 40 50 60 70 80 90
Med Surg HPPD including ICU & SB
w w w . e i d e b a i l l y . c o m
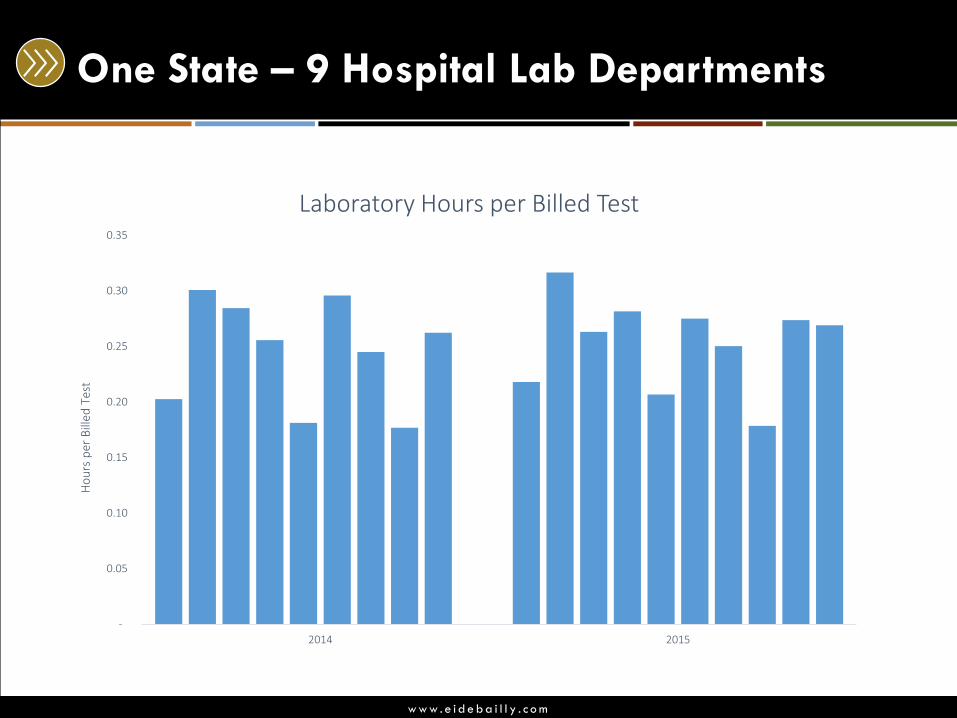
One State – 9 Hospital Lab Departments
-
0.05
0.10
0.15
0.20
0.25
0.30
0.35
2014 2015
Ho
urs
per
Bill
ed T
est
Laboratory Hours per Billed Test
w w w . e i d e b a i l l y . c o m
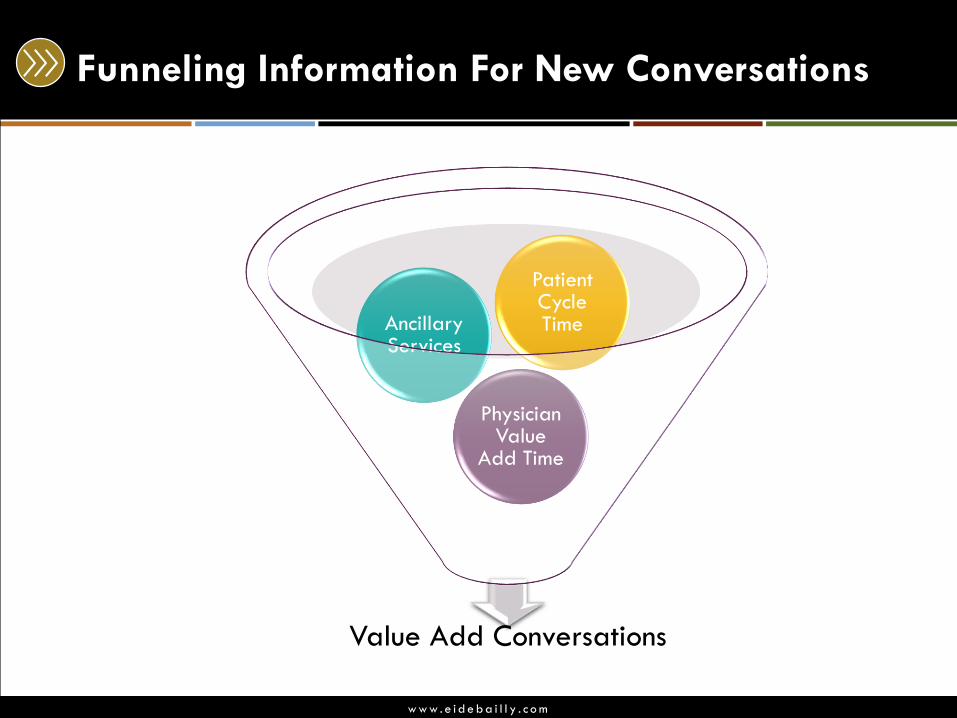
Funneling Information For New Conversations
Value Add Conversations
Physician Value
Add Time
Ancillary Services
Patient Cycle Time
w w w . e i d e b a i l l y . c o m
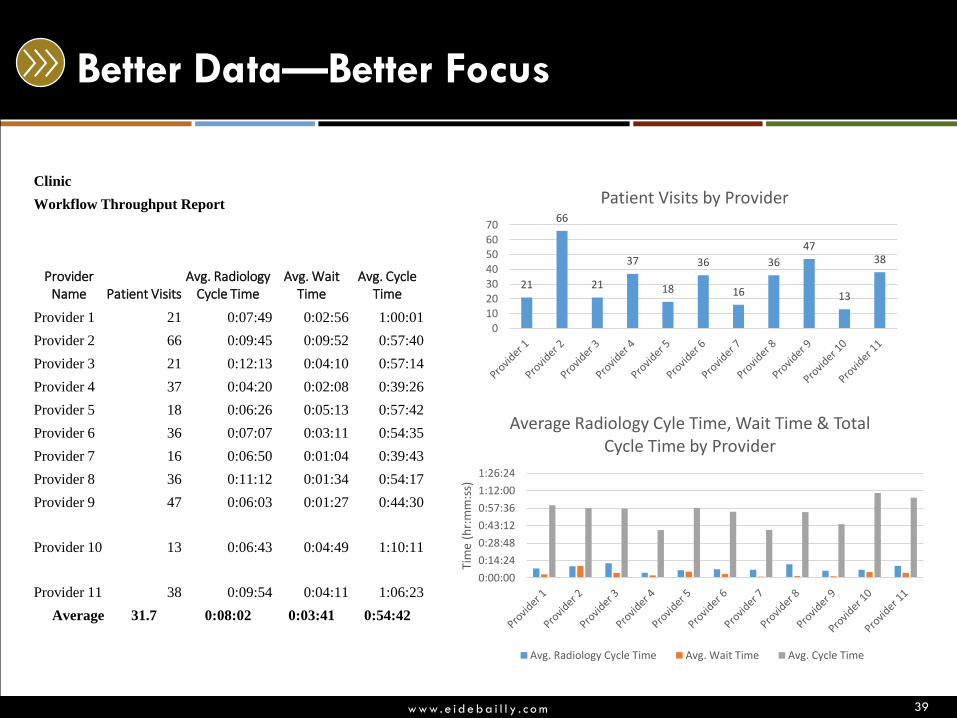
Better Data—Better Focus
39
Clinic
Workflow Throughput Report
Provider Name Patient Visits
Avg. Radiology Cycle Time
Avg. Wait Time
Avg. Cycle Time
Provider 1 21 0:07:49 0:02:56 1:00:01
Provider 2 66 0:09:45 0:09:52 0:57:40
Provider 3 21 0:12:13 0:04:10 0:57:14
Provider 4 37 0:04:20 0:02:08 0:39:26
Provider 5 18 0:06:26 0:05:13 0:57:42
Provider 6 36 0:07:07 0:03:11 0:54:35
Provider 7 16 0:06:50 0:01:04 0:39:43
Provider 8 36 0:11:12 0:01:34 0:54:17
Provider 9 47 0:06:03 0:01:27 0:44:30
Provider 10 13 0:06:43 0:04:49 1:10:11
Provider 11 38 0:09:54 0:04:11 1:06:23
Average 31.7 0:08:02 0:03:41 0:54:42
21
66
21
37
18
36
16
36
47
13
38
010203040506070
Patient Visits by Provider
0:00:00
0:14:24
0:28:48
0:43:12
0:57:36
1:12:00
1:26:24Ti
me
(hr:
mm
:ss)
Average Radiology Cyle Time, Wait Time & Total Cycle Time by Provider
Avg. Radiology Cycle Time Avg. Wait Time Avg. Cycle Time
w w w . e i d e b a i l l y . c o m
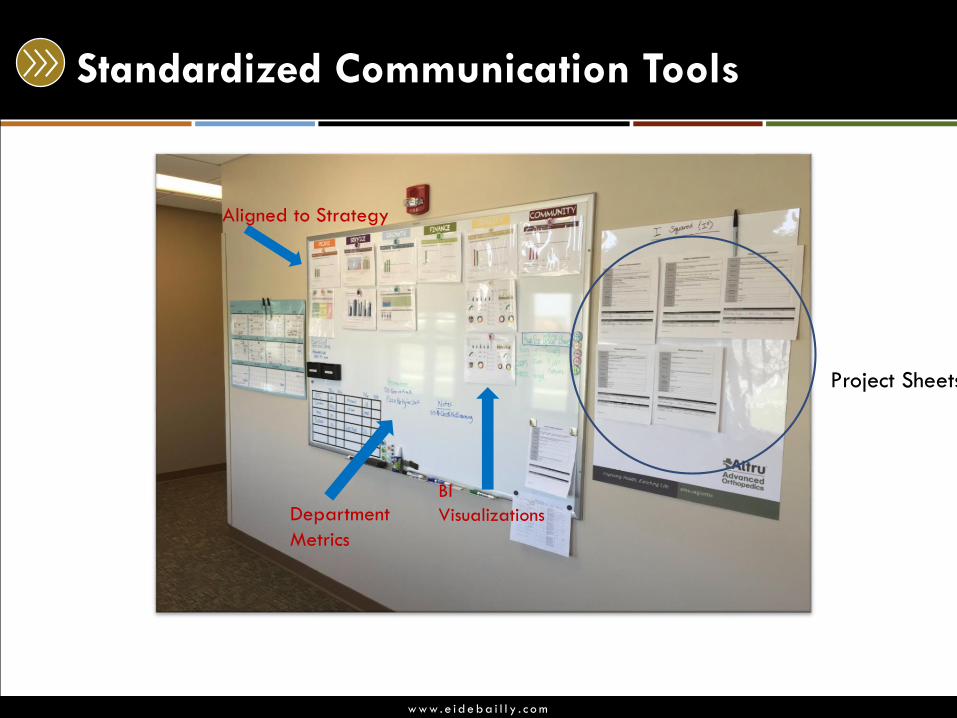
Standardized Communication Tools
Project Sheets
Department
Metrics
Aligned to Strategy
BI
Visualizations
w w w . e i d e b a i l l y . c o m
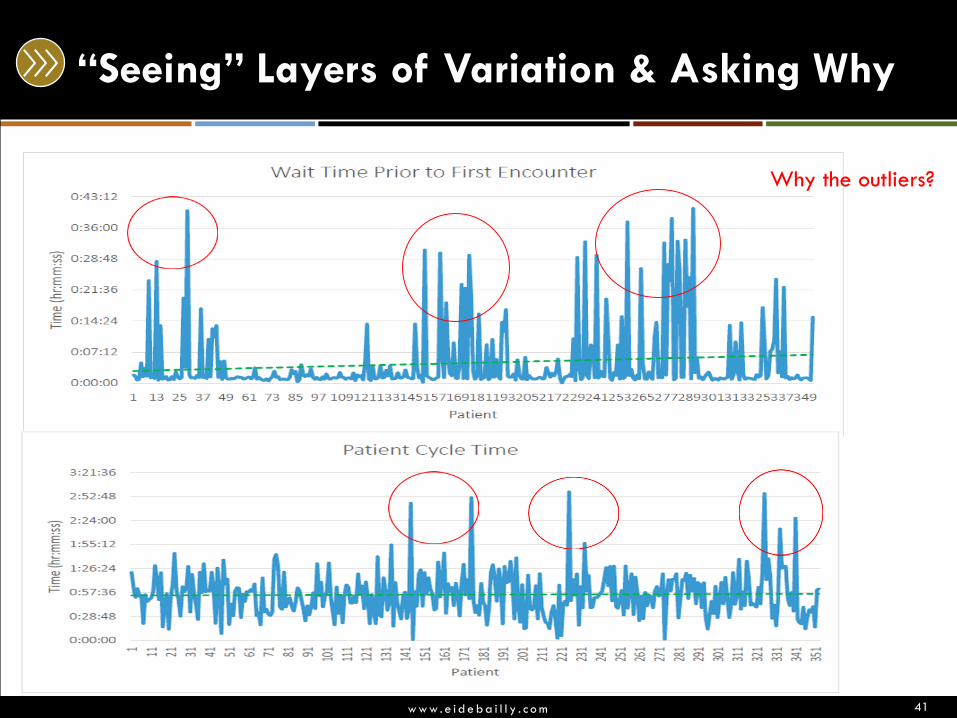
“Seeing” Layers of Variation & Asking Why
41
Why the outliers?
w w w . e i d e b a i l l y . c o m
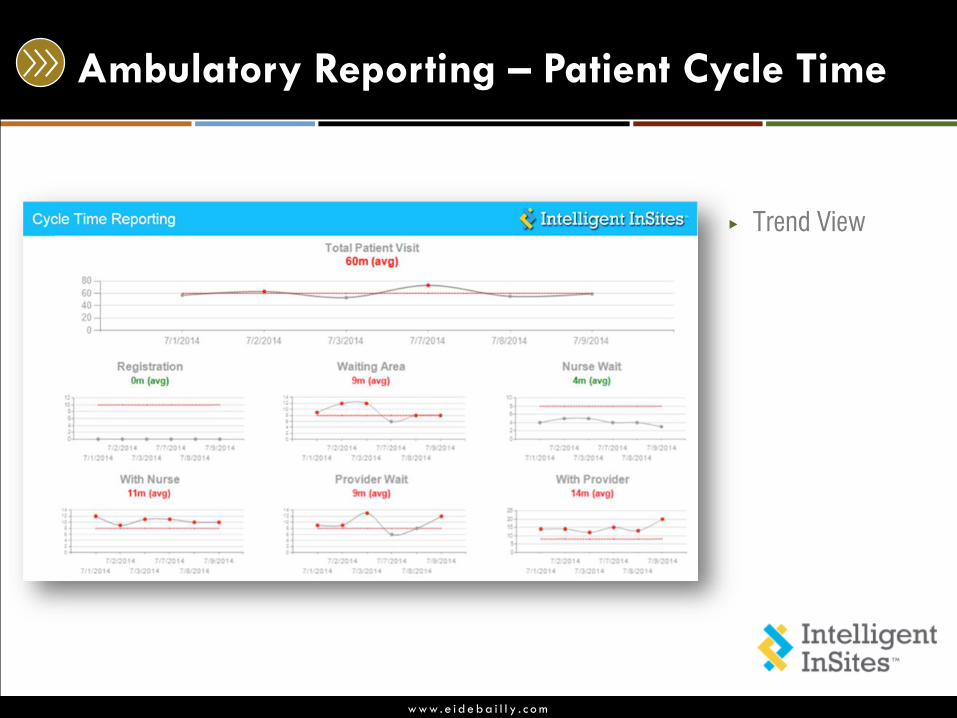
Ambulatory Reporting – Patient Cycle Time
▶ Trend View
w w w . e i d e b a i l l y . c o m
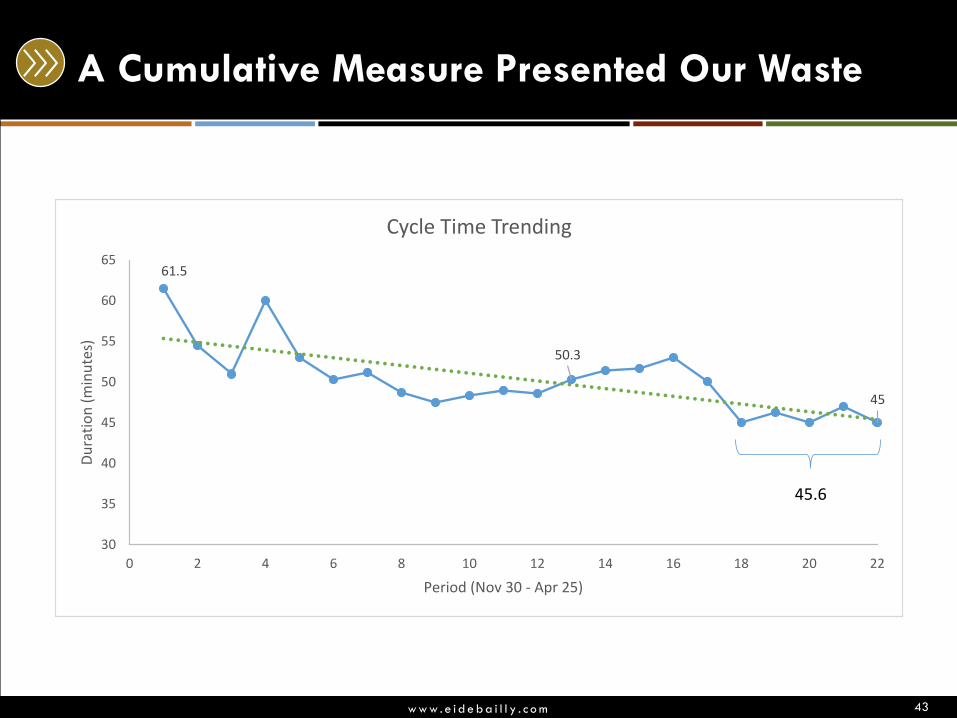
A Cumulative Measure Presented Our Waste
43
61.5
50.3
45
30
35
40
45
50
55
60
65
0 2 4 6 8 10 12 14 16 18 20 22
Du
rati
on
(m
inu
tes)
Period (Nov 30 - Apr 25)
Cycle Time Trending
45.6
w w w . e i d e b a i l l y . c o m
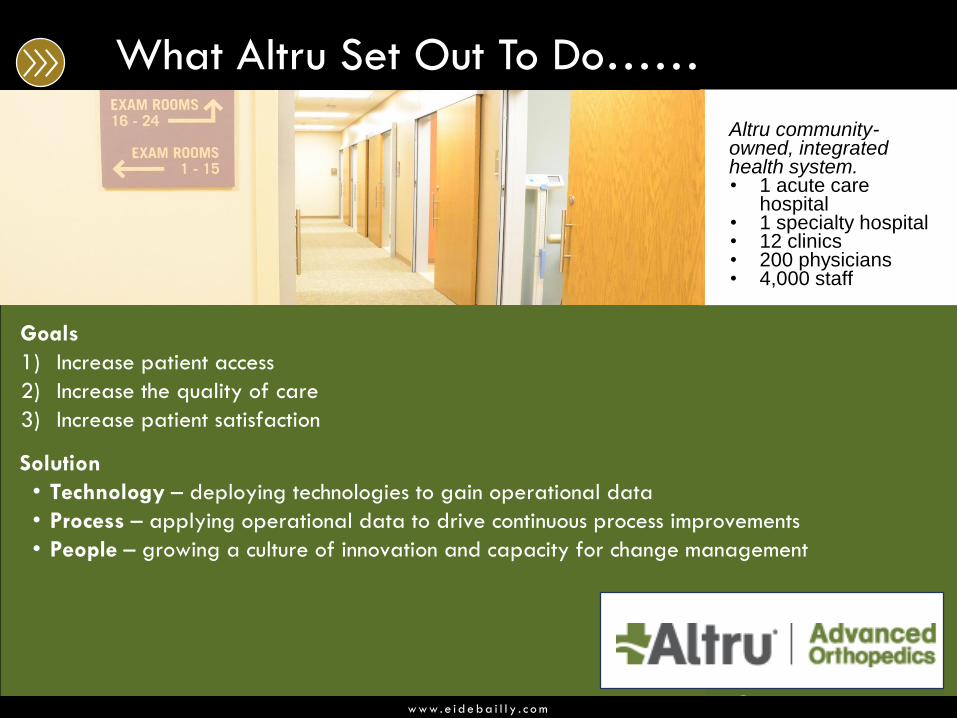
Goals
1) Increase patient access
2) Increase the quality of care
3) Increase patient satisfaction
Altru community-owned, integrated health system.• 1 acute care
hospital• 1 specialty hospital• 12 clinics• 200 physicians• 4,000 staff
Solution
• Technology – deploying technologies to gain operational data
• Process – applying operational data to drive continuous process improvements
• People – growing a culture of innovation and capacity for change management
What Altru Set Out To Do……
w w w . e i d e b a i l l y . c o m
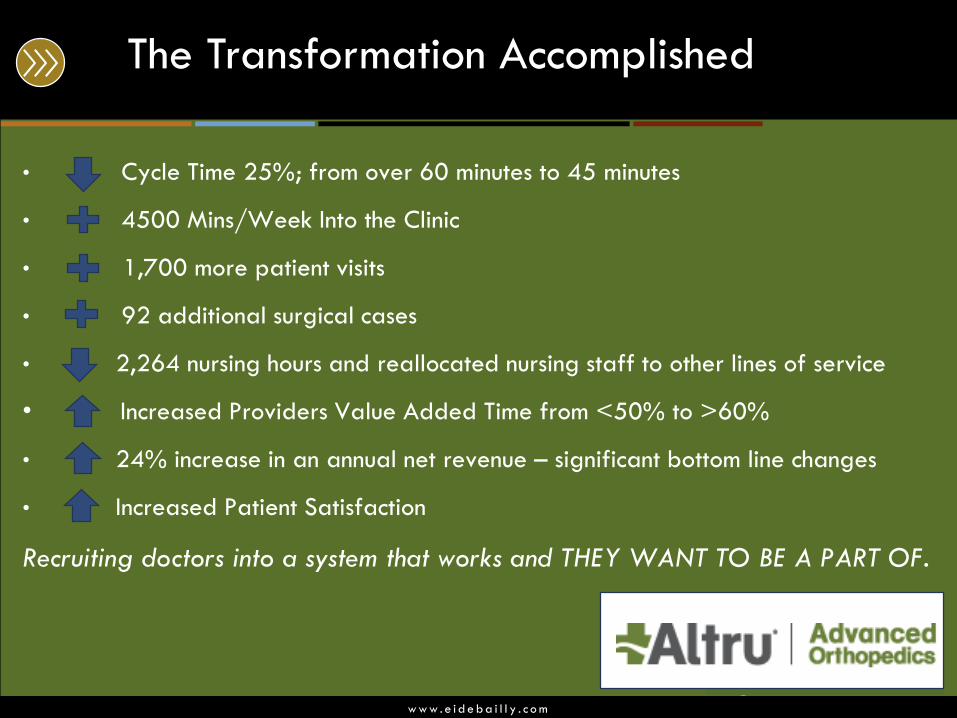
• Cycle Time 25%; from over 60 minutes to 45 minutes
• 4500 Mins/Week Into the Clinic
• 1,700 more patient visits
• 92 additional surgical cases
• 2,264 nursing hours and reallocated nursing staff to other lines of service
• Increased Providers Value Added Time from <50% to >60%
• 24% increase in an annual net revenue – significant bottom line changes
• Increased Patient Satisfaction
Recruiting doctors into a system that works and THEY WANT TO BE A PART OF.
The Transformation Accomplished

Capital Asset Investment
w w w . e i d e b a i l l y . c o m
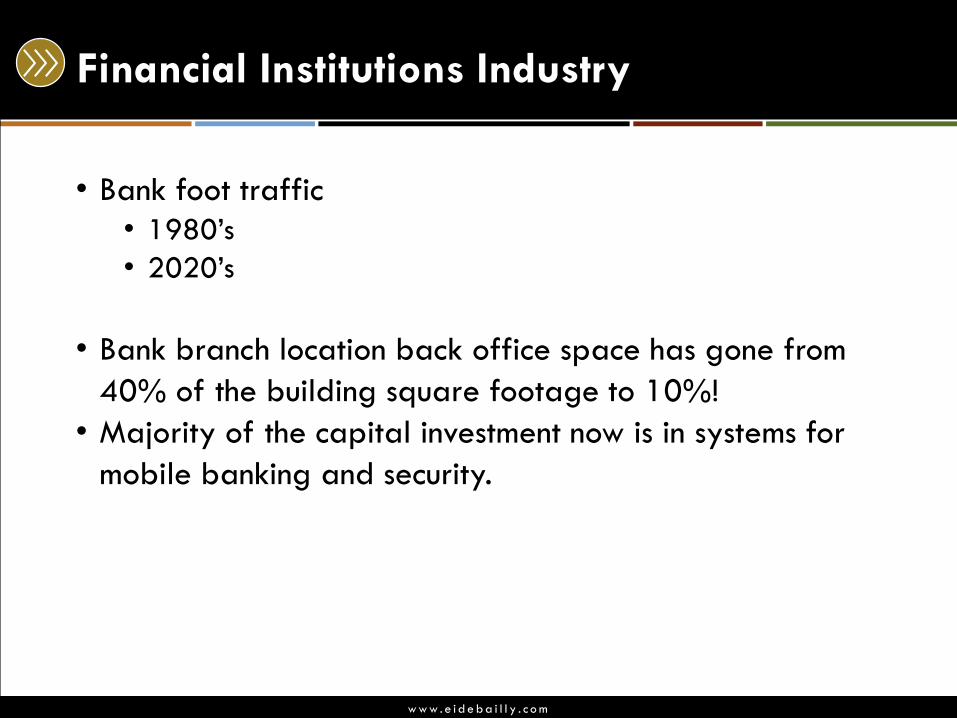
Financial Institutions Industry
• Bank foot traffic
• 1980’s
• 2020’s
• Bank branch location back office space has gone from
40% of the building square footage to 10%!
• Majority of the capital investment now is in systems for
mobile banking and security.
w w w . e i d e b a i l l y . c o m
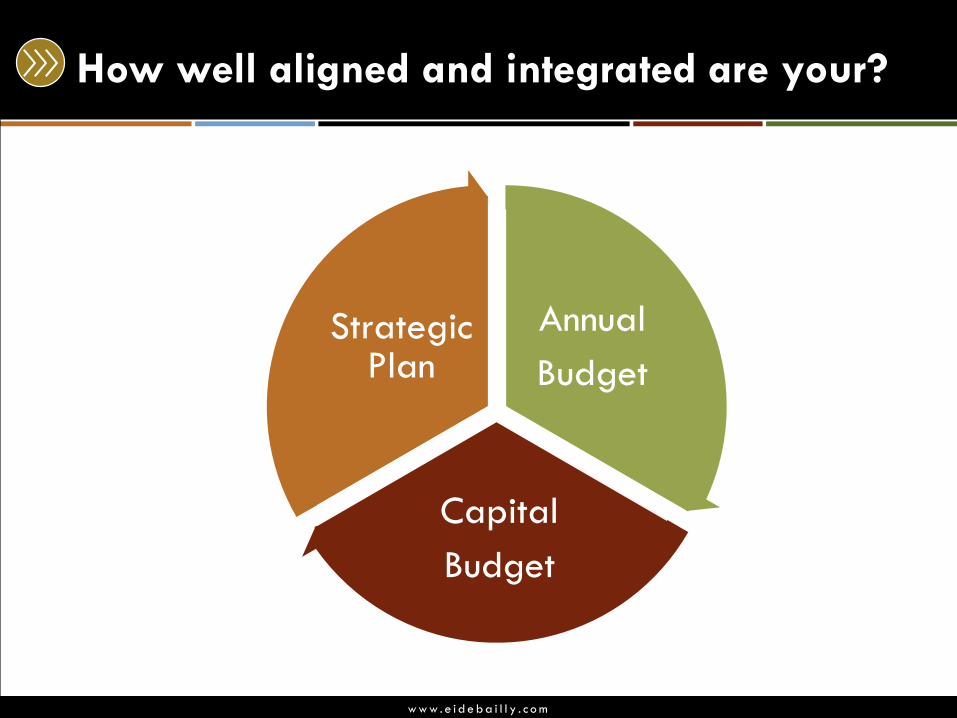
How well aligned and integrated are your?
Annual
Budget
Capital
Budget
Strategic Plan
w w w . e i d e b a i l l y . c o m
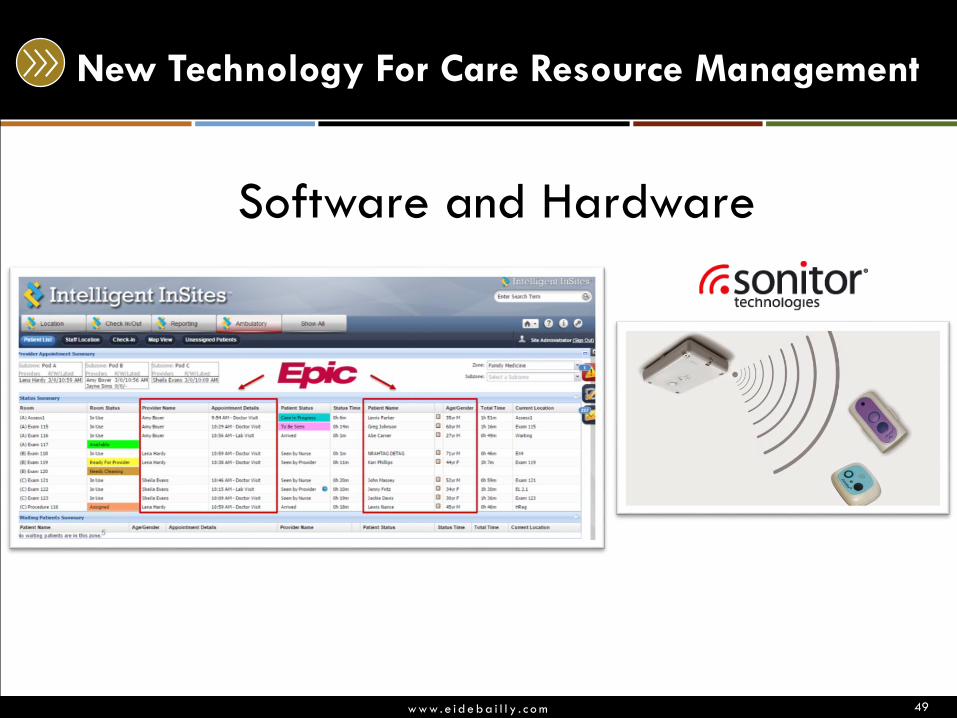
New Technology For Care Resource Management
49
Software and Hardware
w w w . e i d e b a i l l y . c o m
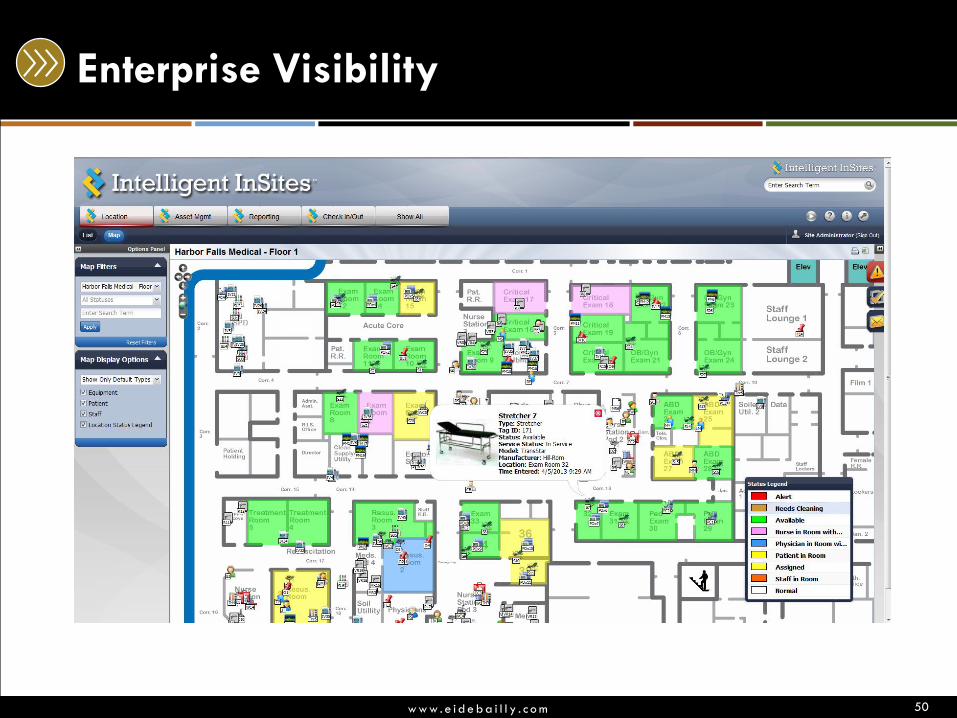
Enterprise Visibility
50
w w w . e i d e b a i l l y . c o m
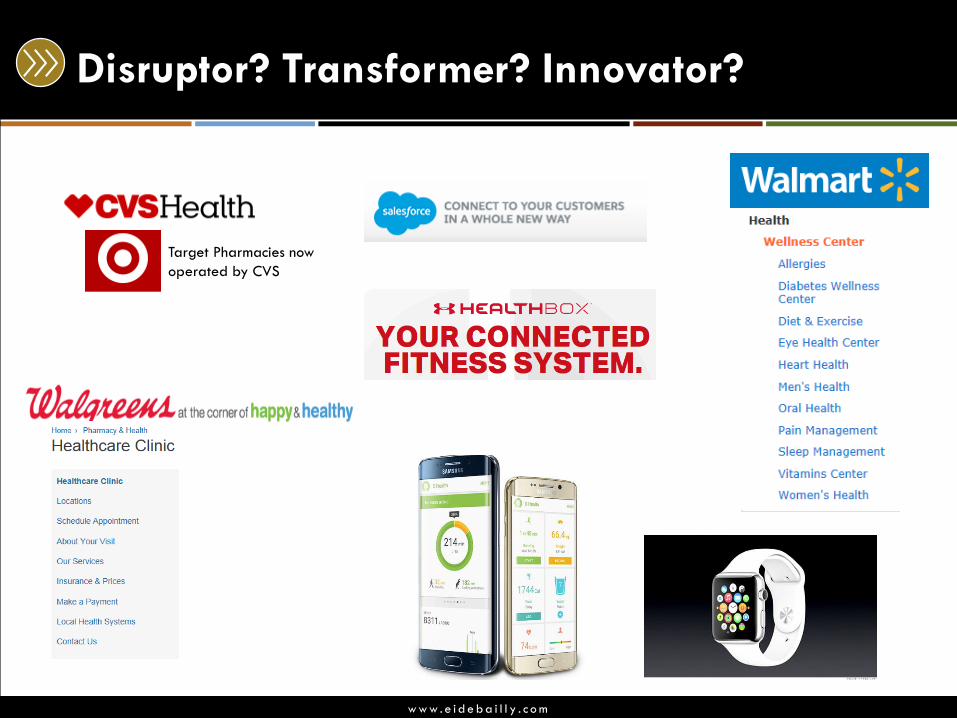
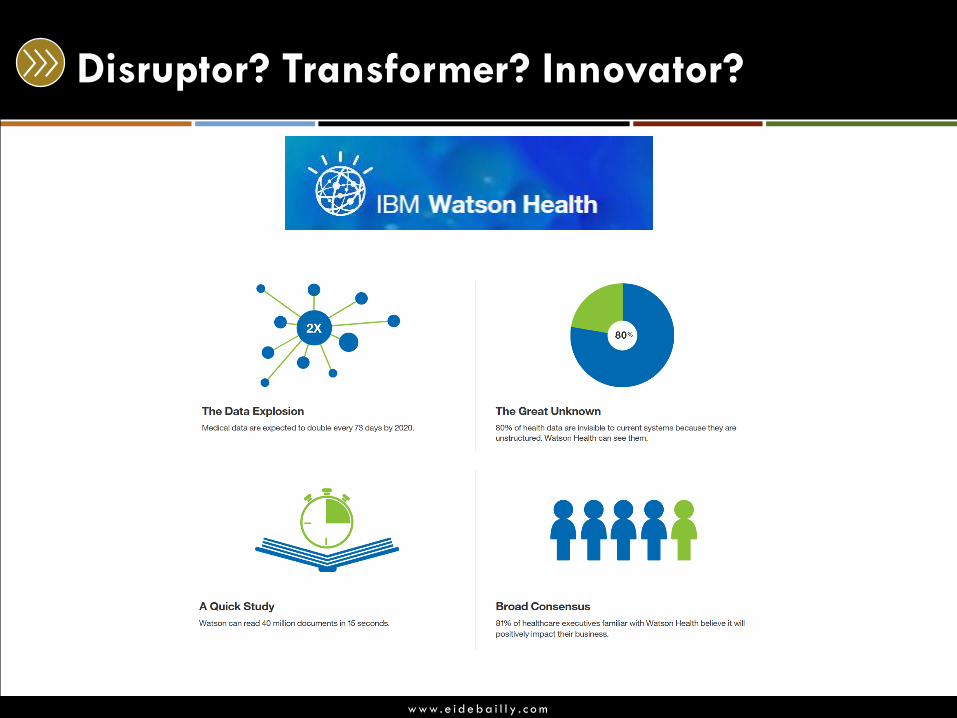
Disruptor? Transformer? Innovator?
Target Pharmacies now
operated by CVS
w w w . e i d e b a i l l y . c o m
Disruptor? Transformer? Innovator?
w w w . e i d e b a i l l y . c o m
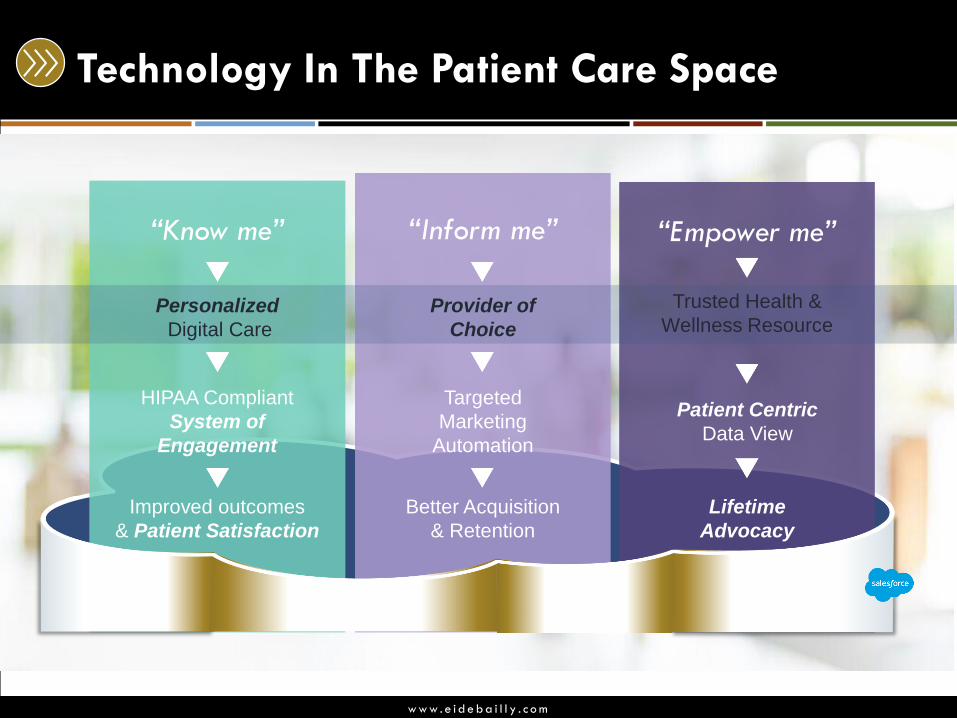
Technology In The Patient Care Space
“Inform me” “Empower me”“Know me”
Personalized
Digital Care
HIPAA Compliant
System of
Engagement
Improved outcomes
& Patient Satisfaction
Provider of
Choice
Targeted
Marketing
Automation
Better Acquisition
& Retention
Trusted Health &
Wellness Resource
Patient Centric
Data View
Lifetime
Advocacy
w w w . e i d e b a i l l y . c o m
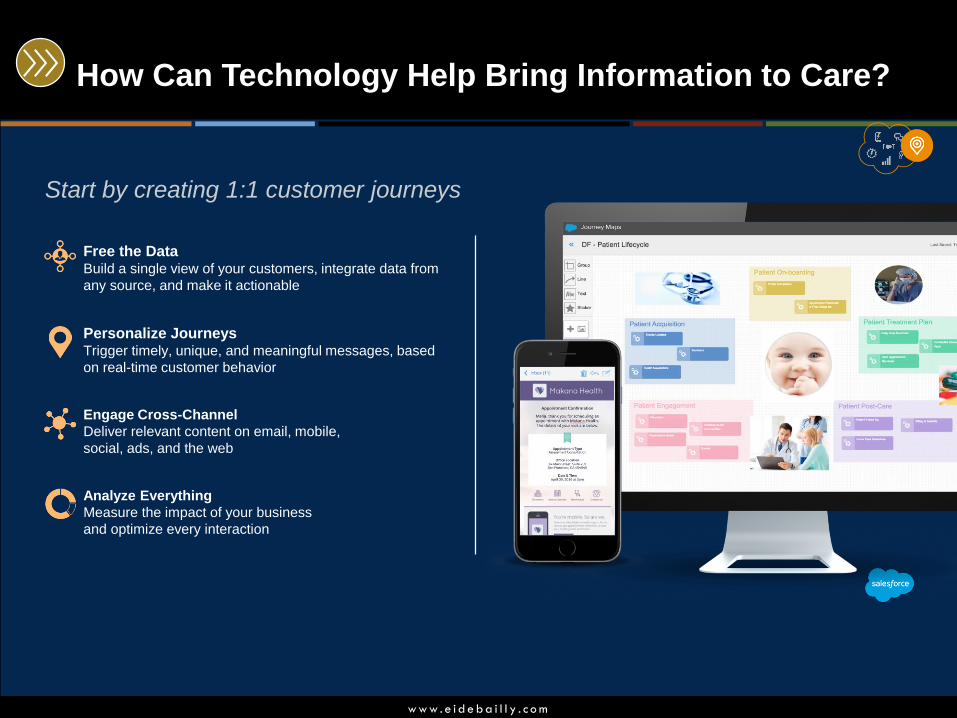
How Can Technology Help Bring Information to Care?
Free the DataBuild a single view of your customers, integrate data from
any source, and make it actionable
Personalize JourneysTrigger timely, unique, and meaningful messages, based
on real-time customer behavior
Engage Cross-Channel
Deliver relevant content on email, mobile,
social, ads, and the web
Analyze Everything
Measure the impact of your business
and optimize every interaction
Start by creating 1:1 customer journeys
w w w . e i d e b a i l l y . c o m
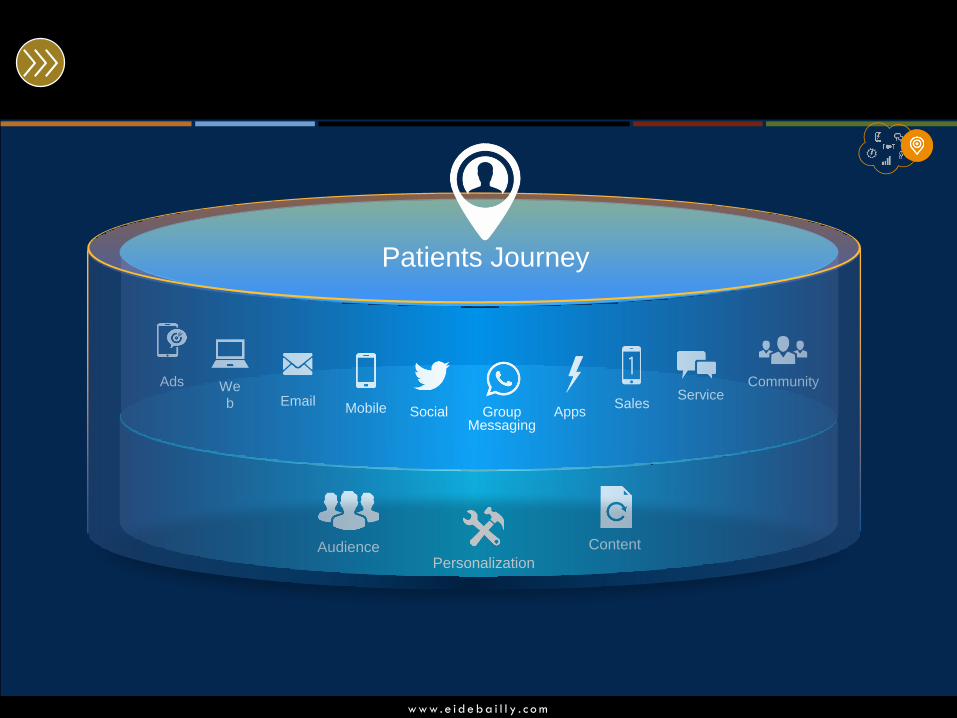
AudiencePersonalization
Content
Apps
ServiceAds We
b EmailMobile Social Group
Messaging
Sales
Community
Patients Journey
w w w . e i d e b a i l l y . c o m
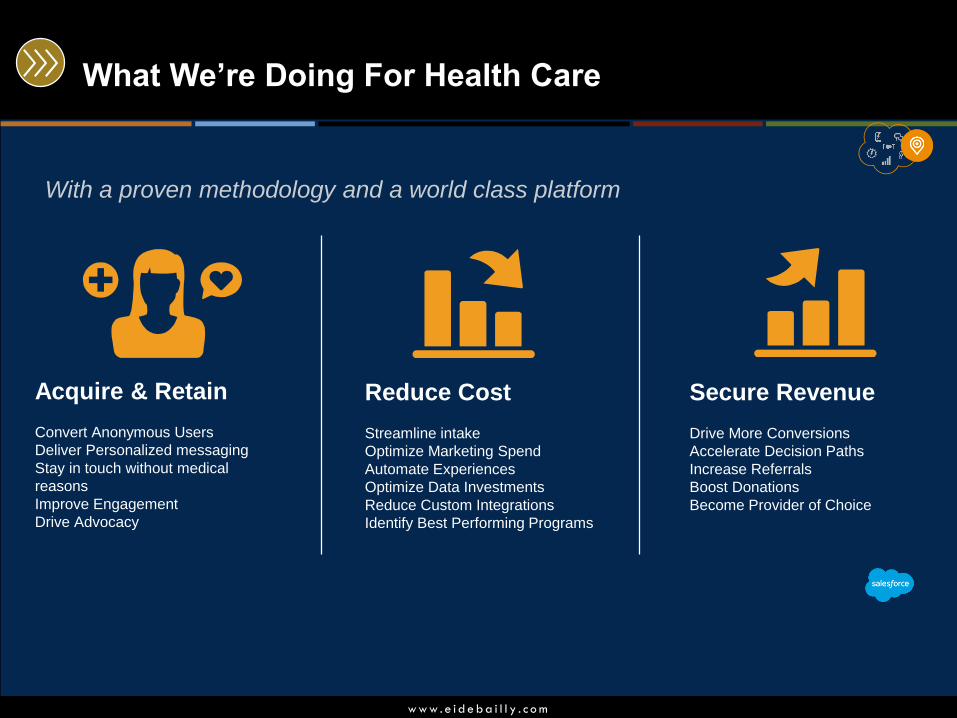
What We’re Doing For Health Care
Secure Revenue
Drive More Conversions
Accelerate Decision Paths
Increase Referrals
Boost Donations
Become Provider of Choice
With a proven methodology and a world class platform
Acquire & Retain
Convert Anonymous Users
Deliver Personalized messaging
Stay in touch without medical
reasons
Improve Engagement
Drive Advocacy
Reduce Cost
Streamline intake
Optimize Marketing Spend
Automate Experiences
Optimize Data Investments
Reduce Custom Integrations
Identify Best Performing Programs
w w w . e i d e b a i l l y . c o m
Disruptor? Transformer? Innovator?
• http://www.beckershospitalreview.com/hospital-
management-administration/30-disruptive-healthcare-
companies-to-watch.html
• Radiology
• Lab
• Home Health
• Physician visits
• Therapists
• Emergency room
w w w . e i d e b a i l l y . c o m
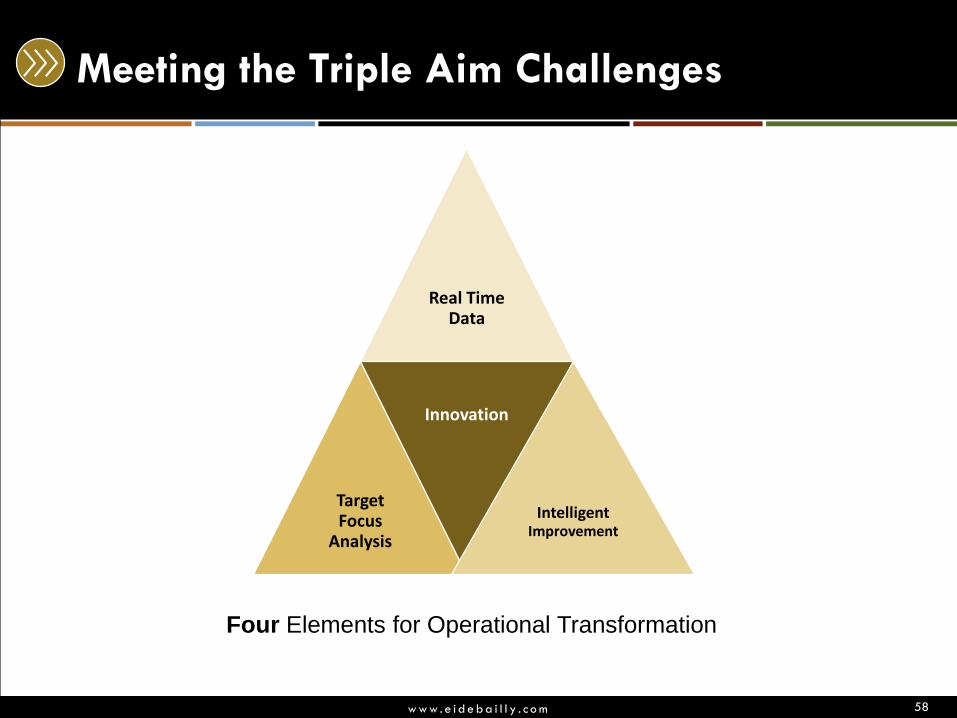
Meeting the Triple Aim Challenges
58
Real Time Data
Target Focus
Analysis
Innovation
IntelligentImprovement
Four Elements for Operational Transformation
w w w . e i d e b a i l l y . c o m
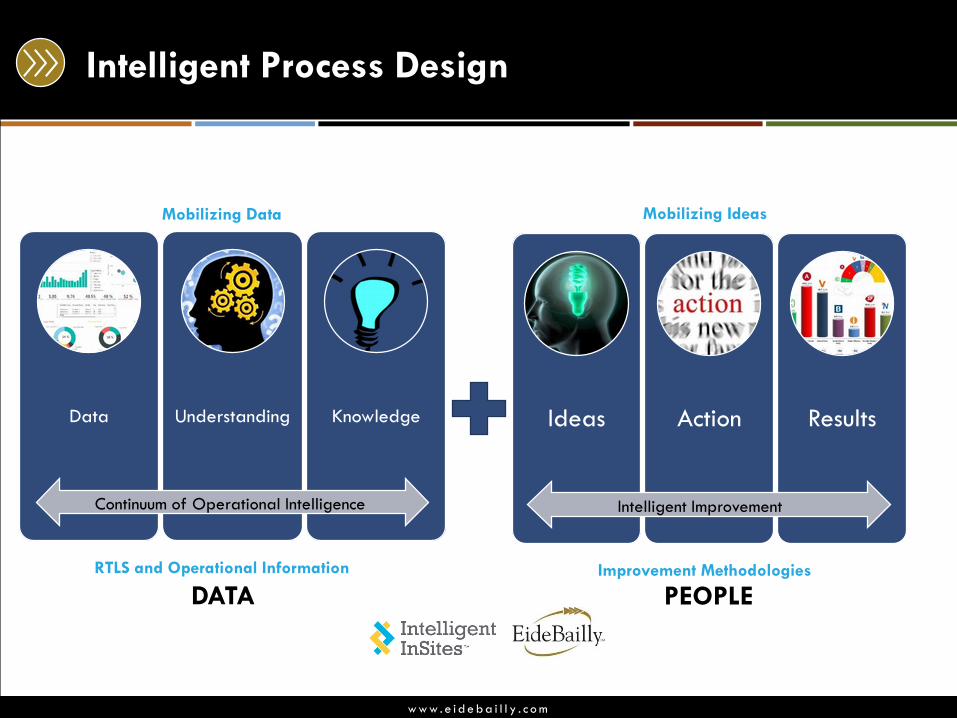
Intelligent Process Design
Data Understanding Knowledge
Continuum of Operational Intelligence
Ideas Action Results
Intelligent Improvement
Mobilizing Data Mobilizing Ideas
RTLS and Operational Information Improvement Methodologies
DATA PEOPLE
w w w . e i d e b a i l l y . c o m
Clarity Builds Innovation and Transformation
Find your operational data.
Invest if you need to get them
Synergize your programs,
design it so it works without
creating more silos
Trust your team, they are
incredibly intelligent and
passionate about patient care
Create different conversations
and a structure that captures
and manages ideas and
change.

w w w . e i d e b a i l l y . c o m
Business Valuation…Future Considerations
• Capital Investment strategy is required for:1) Current routine needs and, 2) To fund strategic investments.
• Cannot only take actions that improve short-term (yearly) earnings at the expense of long-term value creation.
• Calculated risk-taking, in the form of investment, will be the Healthcare Providers that distinguish themselves as successful in the long run.
• What steps are you putting into your Capital Investment philosophy to ask questions about capital investments that maintain Relevancy and Innovation practices?

Diversity of Thought
w w w . e i d e b a i l l y . c o m
Leadership Is Vital To The Journey
One of the recurring sources of health care waste stems from staff not having the information they need to make better decisions
Second source of waste is old information that negatively impacts culture and engagement
Understanding where and how resources are allocated helps staff drive utilization
Leaders have a responsibility to build a culture for innovation
w w w . e i d e b a i l l y . c o m
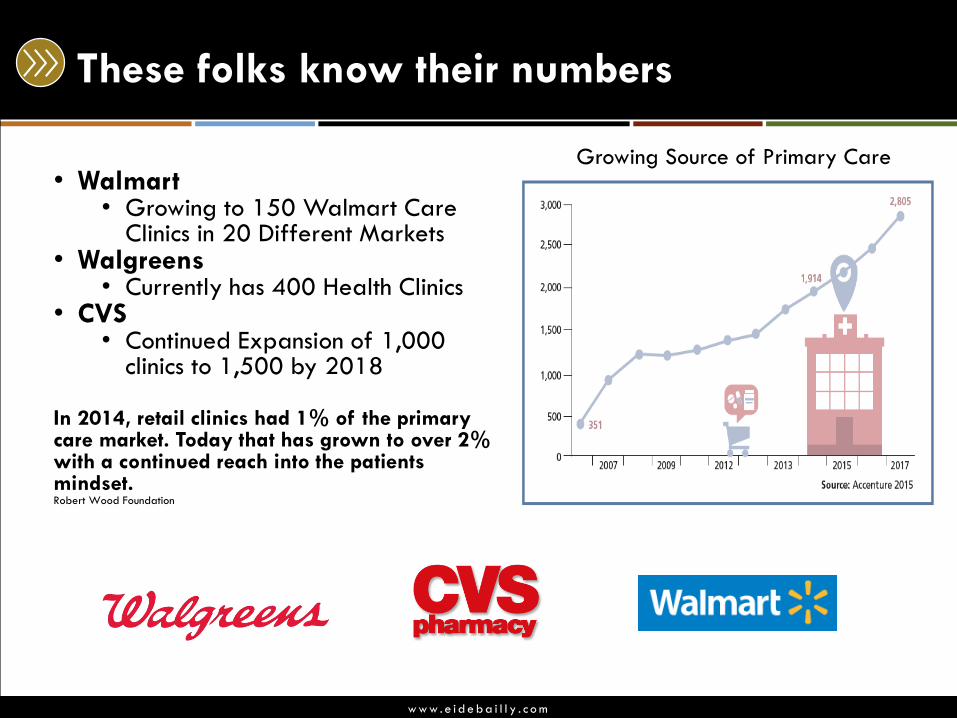
These folks know their numbers
• Walmart• Growing to 150 Walmart Care
Clinics in 20 Different Markets• Walgreens
• Currently has 400 Health Clinics• CVS
• Continued Expansion of 1,000 clinics to 1,500 by 2018
In 2014, retail clinics had 1% of the primary care market. Today that has grown to over 2% with a continued reach into the patients mindset. Robert Wood Foundation
Growing Source of Primary Care
w w w . e i d e b a i l l y . c o m
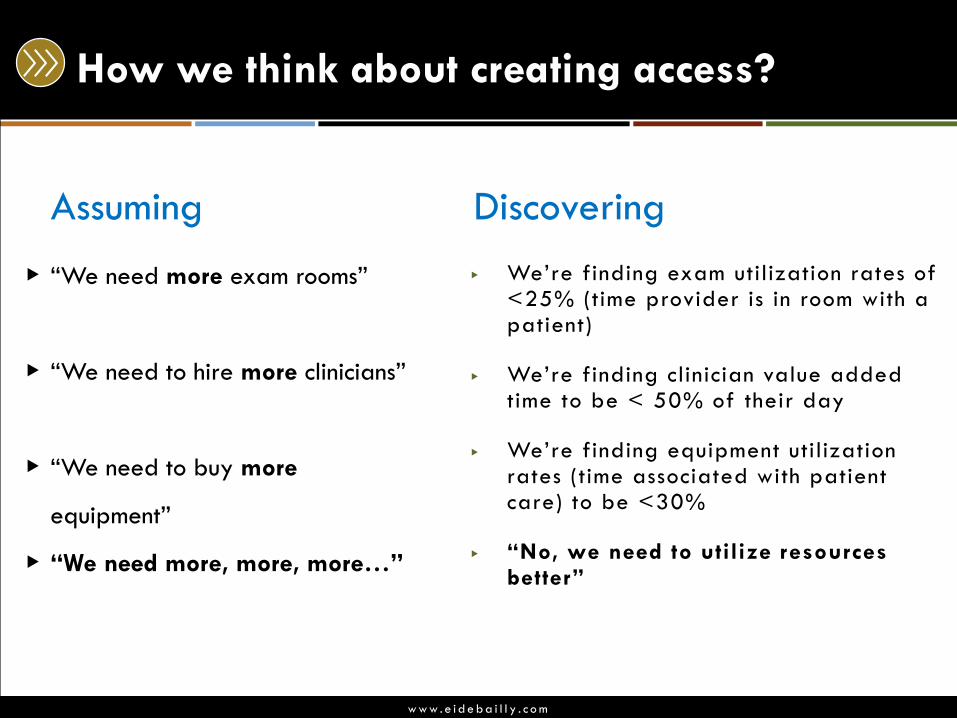
How we think about creating access?
▶ “We need more exam rooms”
▶ “We need to hire more clinicians”
▶ “We need to buy more
equipment”
▶ “We need more, more, more…”
▶ We’re finding exam utilization rates of <25% (time provider is in room with a patient)
▶ We’re finding clinician value added time to be < 50% of their day
▶ We’re finding equipment utilization rates (time associated with patient care) to be <30%
▶ “No, we need to utilize resources better”
Assuming Discovering
w w w . e i d e b a i l l y . c o m
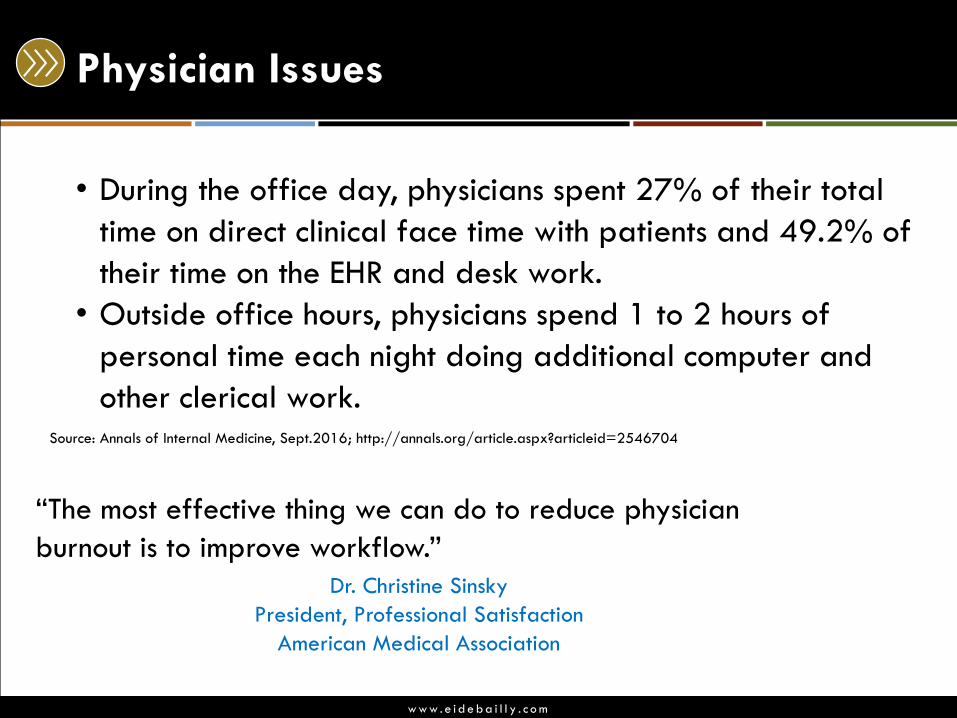
Physician Issues
• During the office day, physicians spent 27% of their total
time on direct clinical face time with patients and 49.2% of
their time on the EHR and desk work.
• Outside office hours, physicians spend 1 to 2 hours of
personal time each night doing additional computer and
other clerical work. Source: Annals of Internal Medicine, Sept.2016; http://annals.org/article.aspx?articleid=2546704
“The most effective thing we can do to reduce physician
burnout is to improve workflow.”
Dr. Christine Sinsky
President, Professional Satisfaction
American Medical Association

w w w . e i d e b a i l l y . c o m
Surround yourself with….
• People who round out your weaknesses and will call you on
them.
• People who have different styles, interests and experience.
• Highly motivated people.
w w w . e i d e b a i l l y . c o m
This presentation is presented with the understanding that the information contained does not constitute legal, accounting or other professional advice. It is not intended
to be responsive to any individual situation or concerns, as the contents of this presentation are intended for general informational purposes only. Viewers are urged
not to act upon the information contained in this presentation without first consulting competent legal, accounting or other professional advice regarding implications of
a particular factual situation. Questions and additional information can be submitted to your Eide Bailly representative, or to the presenter of this session.
Questions?