Embed Size (px)
Citation preview

LEADERSHIP AND MANAGEMENT OF WILDLIFE REINTRODUCTION
PROGRAMS
A Thesis
by
ALEXANDRA E. SUTTON
Submitted to the Office of Graduate Studies of Texas A&M University
in partial fulfillment of the requirements for the degree of
MASTER OF SCIENCE
August 2009
Major Subject: Wildlife and Fisheries Sciences
LEADERSHIP AND MANAGEMENT OF WILDLIFE REINTRODUCTION
PROGRAMS
A Thesis
by
ALEXANDRA E. SUTTON
Submitted to the Office of Graduate Studies of Texas A&M University
in partial fulfillment of the requirements for the degree of
MASTER OF SCIENCE
Approved by:
Chair of Committee, Roel R. Lopez Committee Members, Thomas E. Lacher, Jr. Gerard T. Kyle Jean A. Madsen Head of Department, Thomas E. Lacher, Jr.
August 2009
Major Subject: Wildlife and Fisheries Sciences

iii
ABSTRACT
Leadership and Management of Wildlife Reintroduction Programs. (August 2009)
Alexandra E. Sutton, B.S., Howard University
Chair of Advisory Committee: Dr. Roel R. Lopez
Wildlife reintroduction programs are a type of conservation initiative meant to
preserve biodiversity through the restoration of damaged areas and the reintroduction of
extirpated species. Unfortunately, such reintroductions have a history of limited success,
ad hoc procedures, and little focus on hypothetico-deductive design. This study sought
to identify some of the trends in the leadership, management, and structure of wildlife
reintroduction programs through the use of a case study and survey. The survey was
distributed to reintroduction practitioners and biologists worldwide in an attempt to
identify patterns of organizational behavior within the field. Some general trends
indicated that most reintroductions had active and monitoring phases of 4 or more years
(59% and 75% of respondents respectively), adhered closely to World Conservation
Union (IUCN) Reintroduction Guidelines (43% of respondents), had a somewhat
hierarchical structure (50% of respondents), held annual long-term goal-setting meetings
(56%), observed annual employee evaluations (63%), and underwent project evaluations
annually, using both internal (74%) and external (39%) evaluative instruments. Opinion
questions regarding the ultimate performance of the project indicated that although 75%

iv
of researchers felt that their project had made good progress, only 63% said that a formal
evaluation had confirmed this statement.

v
DEDICATION
Dedicated to my family and LSWWC
vi
ACKNOWLEDGEMENTS
I would like to thank my committee chair, Dr. Roel R. Lopez, and my committee
members, Dr. Thomas E. Lacher, Jr., Dr. Gerard T. Kyle, and Dr. Jean A. Madsen, for
their guidance and support throughout the course of this research. Special thanks go to
Dr. Gillian Bowser, for her help, mentorship, guidance, commentary, and research
support; and to Dr. George A. Middendorf, for his encouragement, his guidance, his
mentorship, and his kindness. Thanks also to Dr. Robert McCleery for his invaluable
contributions.
Thank you to all the members of the Sea Eagle Recovery Project, for hosting me,
interviewing with me, and providing me with such fantastic research materials. Special
thanks to Kevin Duffy, John Love, Roy Dennis, and Claire Smith, for their exceptional
help and hospitality.
I would also like to thank my colleagues and labmates: Miguel Licona, Krista
Adamek, Zach Hurst, Annaliese Scoggin, and Israel Parker, as well as the department
faculty and staff for all their hard work and continual support. Many thanks go to
Jennifer Mikolajewski, for her irreplaceable friendship and support. I also extend a
message of gratitude to the MSC Leland T. Jordan Institute, which funded my research
in Scotland, and to the Diversity Office of Texas A&M University for supporting me
during my time here.
Finally, thanks immeasurably to my family and friends for their encouragement,
patience and love.

vii
NOMENCLATURE
CBP Community-Based Program
EC Experience Characteristics
ET Experience Type
ETH Experience Theme
ICDP Integrated Conservation and Development Program
JNCC Joint Nature Conservancy Council
NCC Nature Conservancy Council
RSPB Royal Society for the Protection of Birds
SERP Sea Eagle Recovery Project
SEPT Sea Eagle Project Team
SNH Scottish Natural Heritage
viii
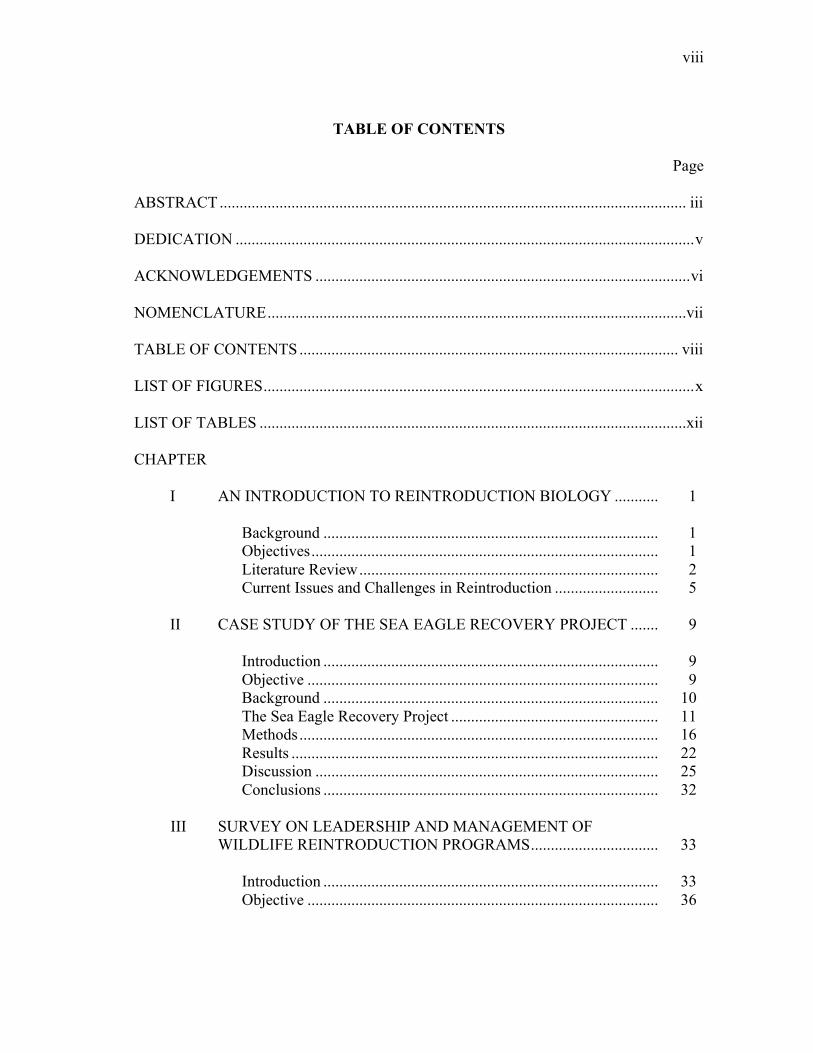
TABLE OF CONTENTS
Page
ABSTRACT ..................................................................................................................... iii DEDICATION ...................................................................................................................v ACKNOWLEDGEMENTS ..............................................................................................vi NOMENCLATURE.........................................................................................................vii TABLE OF CONTENTS ............................................................................................... viii LIST OF FIGURES............................................................................................................x LIST OF TABLES ...........................................................................................................xii
CHAPTER
I AN INTRODUCTION TO REINTRODUCTION BIOLOGY ........... 1 Background .................................................................................... 1 Objectives....................................................................................... 1 Literature Review........................................................................... 2 Current Issues and Challenges in Reintroduction .......................... 5 II CASE STUDY OF THE SEA EAGLE RECOVERY PROJECT ....... 9
Introduction .................................................................................... 9 Objective ........................................................................................ 9 Background .................................................................................... 10 The Sea Eagle Recovery Project .................................................... 11 Methods.......................................................................................... 16 Results ............................................................................................ 22 Discussion ...................................................................................... 25 Conclusions .................................................................................... 32
III SURVEY ON LEADERSHIP AND MANAGEMENT OF WILDLIFE REINTRODUCTION PROGRAMS................................ 33 Introduction .................................................................................... 33 Objective ........................................................................................ 36

ix
CHAPTER Page Background .................................................................................... 37 Methods.......................................................................................... 39
Results ............................................................................................ 42 Discussion ...................................................................................... 53 Limitations .................................................................................... 55
IV CONCLUSIONS AND FUTURE DIRECTIONS FOR REINTRODUCTION RESEARCH..................................................... 57 Introduction .................................................................................... 57 Summary of Results ....................................................................... 57 Conclusion...................................................................................... 59
LITERATURE CITED ............................................................................................. 60
APPENDIX A ........................................................................................................... 71
APPENDIX B ........................................................................................................... 74
VITA ......................................................................................................................... 98

x
LIST OF FIGURES
FIGURE Page
1 Respondents by Type to Leadership and Management of Wildlife
Reintroduction Programs Survey .............................................................. 43
2 Reported Years of Experience with Wildlife Reintroductions among
Survey Respondents ................................................................................... 43
3 Reported Length of Reintroduction Program Phases ................................. 44 4 Reported Frequency of Task Supervision in Reintroduction Programs..... 45 5 Reported Degrees of Autonomy in Reintroduction Programs .................. 46 6 Reported Degrees of Hierarchy in Reintroduction Programs ................... 46
7 Reported Levels of Ranked Authority among Reintroduction Employees
and Volunteers............................................................................................ 47
8 Reported Frequency of General Meetings in Reintroduction Programs ... 48
9 Reported Frequency of Goal-Setting Meetings in Wildlife
Reintroduction Programs ........................................................................... 49
10 Reported Frequencies and Types of Evaluation in Wildlife
Reintroduction Programs ........................................................................... 49
11 Reported Numbers of Staff Dedicated to Public Relations and Media
Affairs or Public Outreach and Education ................................................ 50
12 Reported Perceptions and Evaluations of Success in Wildlife
Reintroduction Programs............................................................................ 52

xi
FIGURE Page
13 Reported Perceptions and Evaluations of Progress in Wildlife
Reintroduction Programs ........................................................................... 53

xii
LIST OF TABLES
TABLE Page 1 Summary of White-tailed Sea Eagle Reintroduction Phases ..................... 12 2 Table of Codes/Subcodes Used for Sea Eagle Interview Analysis ............ 20 3 Documents and Audiovisual Materials Collected Regarding the SERP.... 22 4 Experience Types (ETs) and Characteristics (ECs) of the SERP .............. 24
5 Results of Autonomy and Hierarchy (Experience Theme 1) in the SERP. 25
6 Results of Accountability, Goals and Evaluation (Experience Theme 2)
in the SERP ................................................................................................ 27
7 Results of Public Relations (Experience Theme 3) in the SERP ............... 30
8 Reported Partnerships in Wildlife Reintroduction Programs..................... 51
1
CHAPTER I
AN INTRODUCTION TO REINTRODUCTION BIOLOGY
BACKGROUND1
The goal of this chapter is to provide the reader with a brief history of
reintroduction biology, as well as an introduction to current issues and challenges facing
the field. This project was designed specifically to address an apparent paucity in the
literature regarding the human dimensions of reintroduction biology. In order to present
that paucity in context, an introductory understanding of the field is required. To that
end, the next chapter offers a review of reintroduction literature, introducing some of the
history and current status of reintroduction biology, and identifying some key areas
which future research might be beneficial to the field as a whole.
OBJECTIVES
The objectives of my study were to explore in-depth the organizational structure
of the Sea Eagle (Haliaeetus albicilla) Recovery Project, as well as to use a survey
instrument to identify patterns of organizational behavior across a variety of wildlife
reintroduction programs. The first chapter of this thesis has served as an introduction to
the history and current status of reintroduction biology; the next chapter, a case study of
the Sea Eagle Recovery Project, will explore in-depth some of the particular issues that
may arise within a reintroduction project. The subsequent and final chapter, publishing
the results of a survey of reintroduction practitioners and biologists, will attempt to
identify some variables that may contribute to reintroduction success.
1 This thesis follows the style of Conservation Biology.

2
LITERATURE REVIEW
Reintroduction biology is a discipline within conservation biology, a synthetic
science with the ultimate goal of promoting, restoring, and maintaining the world’s
biological diversity (Groom et al. 2005). The World Conservation Union (IUCN) defines
a reintroduction program as “an attempt to establish a species in an area that was once
part of its historical range, but from which it has been extirpated or become extinct”
(IUCN 1998:6). The reintroduction of species for the purpose of conservation has only
recently become a management goal (Seddon et al. 2007). Thus, reintroduction biology
remains a relative newcomer within the broader field of conservation sciences (Sarrazin
and Barbault 1996; Seddon et al. 2007).
Reintroduction Before Conservation: Restocking and Recreation (1700–1900)
Reintroduction biology has its roots in animal domestication, livestock and
wildlife management, restocking of wild game and the experimental release of captive
animals (Morris 1986). Early wildlife management practices and laws were driven
primarily by sport hunters, who sought to maintain populations of wild game for
recreational purposes, sometimes in connection with hunting estates, ranches, or
plantations.
In Britain, the release of populations of popular game (such as pheasants) was
common practice on hunting estates; one of the earliest recorded restocking campaigns
was the 19th century release of capercaille (Tetrao urogallus) in England, restoring a
population which had been extirpated in approximately 1785 (Morris 1986). The 19th
3
century in Britain also saw the reintroduction of the roe deer (Capreolus capreolus) and
red squirrel (Sciurus vulgaris), both for recreational reasons (Bertram and Moltu 1986).
In the United States, hunting ranches and plantations continued to be popular
throughout the early 19th century, particularly in the South, and these were often the sites
of wildlife releases for the purpose of recreational restocking. As the century drew to a
close, however, the Civil War and subsequent period of Reconstruction took focus away
from recreation in the South, bringing an end to many of the hunting plantations. In the
meantime, the Gold Rush and westward expansion led to the development of a new land
ethos in the Western United States, and sportsmen, ranchers, and settlers became leaders
in the field of wildlife management. The beginning of this era was marked by the
establishment of Yellowstone National Park in 1872, and continued with the passing of
the Lacey Act, the first Federal wildlife protection act, in 1900. The Lacey Act restricted
the transport of illegally killed animals, laying the foundation for later wildlife protection
laws such as the U.S. Endangered Species Act (National Research Council 1995).
Reintroduction in the Era of Conservation: Pioneering and Introduction (1901 -
1960)
As the United States and United Kingdom began to transition into an era of
increased wilderness awareness, more attention began to be paid to wildlife. Thus, one
of the earliest examples of an actual reintroduction project is the 1907 release of 15
American bison (Bison bison) into a reserve in Oklahoma (Kleiman 1989; Beck 2001).
The release required planning, study of the animals and their needs, legislation, and post-
release monitoring, many of the key aspects of reintroductions today.
4
However, many of these early reintroductions were undertaken simply as
opportunistic management exercises; they generally relied on little planning or
preparation of animals for reintroduction, and sometimes used inappropriate founder
animals (e.g., wildlife confiscated from illegal pet trade, surrendered exotics, etc.)
(Seddon et al. 2007, Armstrong and Seddon 2008).
Reintroduction in the Era of Conservation: Awareness and Exploration (1961 –
1988)
Early reintroduction projects after 1961 continued the tradition of opportunistic,
recreational, and ad hoc releases. However, as the decade progressed, greater attention
began to be paid to the conservation sciences, and this trend was reflected in
reintroduction work. In the United States, the publishing of Rachel Carson’s Silent
Spring in 1962 brought concerns about the natural environment to the forefront of the
American consciousness; this continued through the ratification of the 1973 U.S.
Endangered Species Act.
At the same time, release of large, charismatic vertebrates began taking place
around the globe, and the subsequent media and scientific attention captured further
public interest (Seddon et al. 2007). Some notable reintroductions are: the 1979
reintroduction of brush-tailed bettong (Bettongia penicillata) to Australia (Delroy et al.
1986); the 1983 reintroduction of swift fox (Vulpes velox) to Canada (Smeeton and
Weagle 2000); the 1984 reintroduction of golden lion tamarins (Leontopithecus rosalia)
to Brazil (Kleiman 1989); the 1982 and 1988 reintroductions of Arabian oryx (Oryx
leucoryx) to Oman (Stanley Price 1986, 1989), and the high-profile 1987 capture of all
5
remaining wild California condors with the intent of reintroducing them in later years
(California Condor Conservation 2008).
Reintroduction in the Era of Conservation: Establishment and Legitimacy (1988 –
2009)
The high visibility and popularity of these reintroductions led to a burst in
popularity, prompting new projects to be hastily undertaken, sometimes without due
consideration of the needs of the environment or focal species. After a series of ill-fated
releases throughout the 1980’s, the IUCN formed the Reintroduction Specialist Group
(RSG) as a special group within the Species Survival Commission (SSC) (Stanley Price
and Soorae 2003, Armstrong and Seddon 2008). The establishment of the RSG further
solidified reintroduction biology as a science, and provided a centralized forum for
reintroduction practitioners. In 1998, the RSG put forth the first draft of the IUCN Re-
introduction Guidelines, a set of statutes that outlined the considerations, studies, and
provisions recommended for a successful and responsible reintroduction. The
establishment of these Guidelines, which have undergone several revisions since their
introduction, marked an important step forward in the pursuit of internal consistency for
reintroduction biologists. Reintroduction biologists and practitioners took another
important step forward in 2008, with the coordination of the 1st International Wildlife
Reintroduction Conference, hosted at the Lincoln Park Zoo in Chicago, Illinois, USA.
CURRENT ISSUES AND CHALLENGES IN REINTRODUCTION
As reintroduction biology moves forward, it faces both the opportunities and
challenges of any maturing science, as well as taking on the ongoing issues of

6
conservation biology. As a nascent science, reintroduction biology behaves as any
entrepreneurial industry would, seeking efficacy and legitimacy as it seeks to establish
itself on the scientific landscape. Unfortunately, the field has encountered significant
challenges to both its efficacy as a practice and its legitimacy as a science.
Efficacy and Legitimacy of Reintroduction Biology
The efficacy of reintroduction biology has been questioned repeatedly, in part
because of its historically low success rate (a problem that has not improved over time)
(Clark and Westrum 1989; Snyder et al. 1996; Fischer and Lindemeyer 2000). This poor
performance and apparent taxonomic biases has raised concerns about whether
reintroductions have value as conservation tools. Some have suggested, somewhat
disparagingly, that the primary value of the reintroduction lies in its ability to attract
attention (Lipsey and Child 2007).
The scientific legitimacy of reintroduction biology has also been challenged, due
to the dearth of replicable experimental designs in the reintroduction literature. This
paucity, however, must be considered in the context of the unique history and needs of
reintroduction biology. Historic reintroductions have been primarily opportunistic or ad
hoc; because of this, little precedent exists for experimental design in the field. Seddon
et al. (2007:307) described the maturation of the experimental/deductive process within
the field as being “in its infancy,” pointing out that the field remains largely in a state of
inductive inference, not yet prepared to deductively test and disprove hypotheses about
how reintroductions might best be practiced. Some have suggested that experimental
design in reintroductions could take advantage of the extant reintroduction structure,
7
deriving deductively tested hypotheses from manipulative management of releases,
modeling of reintroduced populations, monitoring studies, captive breeding studies, and
pre-release behavioral experimentation (Sarrazin and Barbault 1996, Seddon et al. 2007).
However, reintroduction projects face unique logistic challenges that may make
replicable experimental designs difficult to create and execute. Reintroductions are often
high-profile, media-friendly events that engage public interest, particularly through the
use of charismatic animals in romantic settings (Morris 1986; Kleiman 1989; Lipsey and
Child 2007; Seddon et al. 2007). Because of this, they often become lucrative events for
government or NGO officials, offering the opportunity to show authorities taking
concrete action towards improving the state of the environment (Seddon et al. 2007). It
may be difficult, therefore, to persuade officials of the need for experimental design,
particularly when a modified design might in any way interfere with the public relations
benefits of the current methods.
Rigor and Evaluation in Conservation Biology
Reintroduction biology also carries over an inherited problem from its parent
science, conservation biology. Conservation biology lacks the regular and rigorous
evaluation procedures of many other disciplines, leading to a lack of certainty about the
efficacy of conservation practices and work (Kleiman et al. 1999; Ferrarro and
Pattanayak 2006; Nichols and Williams 2006; Pullin and Stewart 2006). Because
reintroduction biology is a relatively young discipline within this broader field, it is even
farther from developing to the point of internal evaluation and consistency sought by
conservation biologists. The IUCN Guidelines for Reintroduction (1998) were published

8
with the intent to remedy this problem by providing a checklist for evaluating pre- and
post-reintroduction processes. However, the provision of these guidelines does not
necessitate their implementation, and lack of evaluation continues to be a challenge for
the field.

9
CHAPTER II
CASE STUDY OF THE SEA EAGLE RECOVERY PROJECT
INTRODUCTION
The reintroduction of an extirpated species can be a complex, expensive, and
time-consuming operation (Kleiman 1989; Lipsey and Child 2007; Seddon et al. 2007).
Because of the legal, ecological, and sociopolitical complexities involved in a
reintroduction program, practitioners must be capable biologists and planners, as well as
adept educators and human relations specialists (Sarrazin and Barbault 1996).
Evaluations of reintroduction programs are rare, but are generally retrospective,
relegated to the sponsoring organization or entities, and produced in the form of reports
or status updates on the progress of the species (Seddon et al. 2007). Because these
reports are intended to address focal points of the reintroduction in a clear and concise
manner, they rarely delve deeply into the complexities of reintroduction management,
protocol, or organization.
OBJECTIVE
The goal of this chapter is to provide a better understanding of the process of
wildlife reintroduction through a case study of reintroduction leadership and
management. The use of a case study approach allows for in-depth exploration of a
single topic, and allows the researcher to ask questions directly of participants and
practitioners and examine the literature available relative to the project. This ultimately
results in a synthetic review of documentation, personal communication, observation and
participation, all of which can be used to contextualize the experience (Miles and
10
Huberman 1994; Stake 1995; Yin 2003; Creswell 2007). To that end, I undertook this
case study of the Sea Eagle Recovery Project (SERP) in Scotland. I conducted
interviews with practitioners, took notes as an observer-practitioner, and conducted a
review of archival documentation (i.e., newspaper articles, opinion pieces, children’s
books, journal articles, etc.) related to the project.
BACKGROUND
The White-tailed Sea Eagle
The white-tailed sea eagle (Haliaeetus albicilla; Gaelic: Iolaire mhara), in the
family Accipitridae, is the largest bird of prey in the United Kingdom. It possesses a
wingspan over 2 m, and an average male/female weight of 4.5/6 kg, with females
significantly larger than males (Love 1983; Royal Society for the Protection of Birds
2006). Adults of the species are brown with pale heads and white, wedge-shaped tails,
yellow beaks, yellow un-feathered legs, and golden eyes (Love 1983; RSPB 2006). The
average lifespan is 15-20 years in the wild, and sexual maturity is reached at
approximately 5 years of age. Extended juvenilia has been observed in some captive-
raised eaglets (R. Dennis, Sea Eagle Project Team, personal communication). White-
tailed sea eagles (WTSE) are monogamous, territorial breeders; nest building occurs in
high trees or on rocky ledges, and eyries may be reused throughout the lifetime of the
bird (Love 1983; Green et al. 1996; Bainbridge et al. 2002; RSPB 2006).
Diet and Range.The diet of the white-tailed sea eagle consists primarily of fish
and small mammals, with occasional predation of small birds and scavenging of carrion.
The predation of lambs has led to major conflicts with crofters in some areas of the sea

11
eagle’s range, and may have been a factor originally contributing to their persecution
(Love 1983; RSPB 2005). The WTSE’s range extends over most of northern Europe and
Asia, with roaming birds observed as far south as the Mediterranean (RSPB 2006).
Extinction of the Eagle.The sea eagle is native to Scotland, and has been a
significant figure in both the written historical and archaeological record of the region,
appearing in literature as early as the 7th century, and in carvings on Pictish relics
predating the Bronze Age (Love 1983, 2006; Scottish Natural Heritage 1996; RSPB
2006). Agricultural expansion and urban growth in the 18th and19th centuries led to the
widespread persecution of carnivores and birds of prey (Love 1983; SNH 1996). The sea
eagle population began to decline in the 19th century, and was extirpated completely by
the early 20th century. The last wild pair appeared on the Isle of Skye in 1916, and the
last wild individual was shot in Shetland in 1918 (Love 1983; Bainbridge et al. 2002;
Mudge et al. 1996).
THE SEA EAGLE RECOVERY PROJECT
The Sea Eagle Recovery Project (SERP) is a nationwide effort to reintroduce the
white-tailed sea eagle (H. albicilla) to its former range throughout the United Kingdom.
The SERP was begun in 1968, and its four phases (Table 1) have taken place in
Scotland, as that was the last stronghold of the species until their extirpation in the early
20th century (Love 1983). Norway, the United Kingdom’s nearest northern European
neighbor, maintains a viable population of sea eagles that has acted as the donor
population throughout the duration of the Scottish project (Green et al. 1996, Mudge et
al. 1996).

12
Table 1. Summary of White-tailed Sea Eagle Reintroduction Phases.
Phase/Location Year No. of Birds Released Final Status
Pilot Phase:
(Fair Isle) 1968
4
(2 male, 2 female) Unsuccessful*
Phase 1:
the Hebrides
(Isle of Rum)
1975–1985
82
(39 male, 43 female) Successful*
Phase 2:
Western Scotland
(Wester Ross)
1993–1998
58 Successful*
Phase 3:
Eastern Scotland
(Fife)
2007–
present
29
Ongoing (Successful)*
*These measures were self-reported.
The Sea Eagle Project Team
The Sea Eagle Project Team (SEPT) is a collaborative group of scientists,
managers, and practitioners who guide and manage the Sea Eagle Recovery Project.
Many SEPT members represent partner organizations in the process, although some are
experts on the species, or in the field of raptor ecology, who volunteer their advice to the
panel. The SEPT steers the Sea Eagle Recovery Project, while working under the
13
auspices of whichever government and non-government organizations are sponsoring
that particular phase of the reintroduction (Mudge et al. 1996; Love 2006).
Pilot Phase: Fair Isle (1968)
The first effort to reintroduce the sea eagle was undertaken, on a small scale, in
Argyll in 1959. A more comprehensive test reintroduction was undertaken on Fair Isle in
1968, and involved the release of 4 Norwegian birds; of these birds, one died and 3
dispersed (Love 1983). The latter reintroduction did not establish a breeding population
on Fair Isle, but it did become an important pioneering step in establishing the viability
of the reintroduction on a larger scale (Joint Nature Conservancy Council 1988; RSPB
2006).
Structure.Because the pilot phase was largely exploratory, it did not require
much staff or organizational structure for its execution. Less than 5 individuals
(including 2 non-participant observers) were present for the original Fair Isle release.
The release took place at the Fair Isle Bird Observatory, a popular bird-watching
destination in the north of Scotland.
Phase I: Isle of Rum (1975–1983)
The first official reintroduction of the sea eagle took place on the Isle of Rum
(then, Rhum), and from 1975–1985, a total of 85 eagles (40 male; 45 female) were
imported from Norway. A total of 82 eagles (39 male; 43 female) were ultimately
released on the Isle of Rum (JNCC 1988). First nests were built in 1982; first clutches of
eggs (3 clutches) were laid in 1983; first hatching (3 clutches hatched) in 1985; first
chick fledged in July 1985. By the end of the first phase of the Sea Eagle Recovery

14
Project in 1985, 80 birds had survived, and 6 young had been bred in the wild, making
the reintroduction one of the most successful in the history of the United Kingdom
(JNCC 1988).
Structure.The first phase of the reintroduction was sponsored by the Nature
Conservancy Council (NCC). At the time, the NCC served as the main supervisory body
of the British government in the area of ecology, and the reintroduction was approved
and sponsored through their offices (JNCC 1988). This meant that employees were hired
on through the NCC, and supervision and evaluation took place under the auspices of
NCC staff (Love 1983).
Phase II: Western Scotland (1993–1998)
A second phase of the sea eagle reintroduction was then begun in 1993 (Scottish
Natural Heritage 1995; Love 2006). The five-year scheme was led by Scottish Natural
Heritage (SNH) in cooperation with the Royal Society for the Protection of Birds
(RSPB), and involved the release of 58 total birds. By 1995, the total number of wild sea
eagles bred in Scotland had reached 46 (SNH 1995), however, population growth
appeared to be stagnating. Green et al. (1996) reported that the long-term viability of the
population seemed dubious, presenting a dire forecast of decline in the population unless
further releases took place. By the conclusion of the five-year effort, 18 breeding pairs
had established in the wild, raising 9 broods of 13 eaglets total (Love 2006).
From 1998–2003, breeding pair numbers increased and approximately 12 eaglets
survived each year. By 2003, 31 pairs had established, and 26 young fledged from 25
clutches. The subsequent year, 2004, yielded 19 young, and 2005 yielded 24 fledglings

15
(Love 2006). Although breeding was improving, and the western population continued
to strengthen, some persecution remained, and by the end of 2004, 25 eagles had been
reported dead, 25% of whom had been killed illegally, primarily through poisoning
(Love 2006).
Structure.In 1992, the Nature Conservancy Council (NCC), who had overseen
the first phase of the reintroduction, was split by region into English Nature, Scottish
Natural Heritage (SNH), and the Countryside Council for Wales (CCW), with the Joint
Nature Conservation Committee (JNCC) acting as an overseeing statutory body (JNCC
2008). Scottish Natural Heritage then took the helm of the project, which eventually fell
under their 1995 Species Action Programme (SAP), which detailed the needs and
conservation agendas for threatened and endangered species in Scotland (SNH 1995).
By the second phase of the reintroduction, the Royal Society for the Protection of
Birds (RSPB), who had previously opposed the reintroduction, lent their support to the
project by helping to monitor the growing population of released eagles. However,
although the RSPB provided staff and materials to gather and analyze monitoring data,
fieldwork was still managed by employees of SNH.
Phase III: Eastern Scotland (2007–2012)
The third phase of reintroduction began in August of 2007 and marked the launch
of a five-year scheme to further the mission of reintroduction by expanding the sea eagle
population throughout its historic range (BBC 2008). Although recolonization was
expected to take place naturally, over time, the creation of an eastern Scotland
population would strengthen the overall presence of the eagle in Scotland while

16
hastening its recolonization of the entire region. In keeping with the goal of range
expansion, 2007 also marked the launch of the Irish Sea Eagle Project, which released
15 Norwegian chicks into Killarney National Park in County Kerry (RSPB 2007).
Structure.The third phase of the reintroduction has seen a reversal of positions,
as well as the addition of new members. The RSPB, who previously handled the
monitoring of the reintroduced population, are now the authority on matters of
fieldwork; SNH has since taken a less active role in the physical management of the
birds. Forestry Commission Scotland, the government body responsible for the
maintenance and management of forested areas of Scotland, has also become a partner
on the Sea Eagle Recovery Project.
METHODS
The case study method offered a unique opportunity to undertake an in-depth
exploration of a phenomenon (Miles and Huberman 1994; Stake 1995; Yin 2003;
Creswell 2007), and was therefore chosen for this project. As exploratory research, I felt
the topic could be best addressed by gathering data from a variety of sources (e.g.,
participant-observer field notes, interviews, document and audiovisual analysis, and
literature review) and synthesizing information into a comprehensive analysis.
Study Site
My research focused on the Sea Eagle Recovery Project (SERP), a nationwide
effort to reintroduce the white-tailed sea eagle to its former range throughout the United
Kingdom. As such, the sites of study were relative to the locations of the releases, as
well as to the headquarters of the sponsoring organizations and the current postings of

17
the Project practitioners. Interviews took place in Stirling, Inverness, Dunphail,
Tobermory, Fort William, Broadford, and Edinburgh, Scotland.
Site Selection. The SERP was selected for this study because of its celebrated
and high-profile success (RSPB 2006, BBC 2005, SNH 1995). Additionally, it was
selected because its sociopolitical context was similar to that of the United States,
hopefully mitigating some of the difficulties of cross-cultural research. Both the UK and
the USA function on generally capitalist, value-oriented economies (CIA 2009a, b).
Interviews: Collection and Analysis
Interview Protocol. I conducted a total of 17 face-to-face, in-depth, semi-
structured (also: "focused", Yin 2003) interviews, of an average duration of 45 minutes
each. Follow-up interviews were conducted via Skype telephone service with 2 of the
original interviewees. Questions pertained to the individual interviewee's experience
with sea eagles during, prior to, and after the reintroduction project, as well as the
organizational structure of the project during the individual’s time of employment, and
the overall experience of working with the project (Appendix A). I made general use of a
modified logic model framework, based in the Gugiu and Rodriguez-Campos semi-
structured interview protocol (2007), to guide the interview process. This method
consisted of a series of introductory questions to gain basic information about the
interviewee, followed by a series of open-ended questions intended to engage the
interviewee in dialogue about their experiences. No time limit was provided for the
duration of interviews, and so some variability in length does appear.

18
My interviews took place in several different locations around Scotland; I
generally allowed decisions about where to meet to be made by the interviewee, and
sites were usually determined by their personal comfort with the region and ease of
access. Interviews were face to face, except in cases of logistic infeasibility, whereafter
interviews were conducted by Skype telephone. The choice of telephone or face-to-face
interview is not believed to have a significant impact on data (Marcus and Crane 1986;
Sturges and Hanrahan 2004).
Interviewee Selection. I collated a list of potential interviewees prior to
departing for my study site; this list was amended constantly throughout the data
collection process. I gathered new names of potential interviewees using a snowball
sampling method, whereby initial contacted interviewees identified others within the
same group, with perspectives either similar to or different from theirs, who might also
be willing to participate in the project. This method is frequently used in social science
research, as it can allow for targeted access to specific population subgroups (Goodman
1961).
During the interviewee selection process, I imposed further selection criteria
requiring all interviewees to have been dedicated, paid, full-time employees on the
reintroduction project for at least 3 months. These selection criteria support a purposive
sampling approach, intended to provide illustrative detail about a process, rather than
increase generalizability of results (Erlandson 1993; Lincoln and Guba 1985).
Interview Transcription. I transferred all digital audio files of interviews onto a
secure laptop and converted them into mp3 files. I then transcribed interviews, either
19
personally or through the use of a professional transcription service, into text documents
using Apple iTunes software, activated with keystroke stop/start cues. All interviews
were transcribed confidentially; interviewees were assigned numbers and no identifying
information was recorded. These methods, filed under protocol number 2008-0131,
were determined to be exempt from review by the Texas A&M Office of Research
Compliance’s Institutional Review Board, under federal code 45 CFR 46.101(b)(2).
Interview Analysis. I printed and read all transcribed interviews. The reading
of the transcripts offered an opportunity to notice and mark (“tag”) recurrent concepts.
Passages of the interview transcription which indicated a singular thought, idea, or
concept were tagged; passages that were not relevant to the Sea Eagle Recovery Project
were not. These tagged concepts were then clarified into a data-guided classification
system (“typology”) (Caracelli and Greene 1993, Creswell 2007) as 3 experience themes
(ETHs) encompassing 8 experience types (ETs) and 44 experience characteristics (ECs)
(Table 2). The final typology reflected the types and characteristics (quality, frequency,
etc.) of SERP practitioner experiences. This process matches the overall rhetorical
structure that has been suggested by Stake (1995) and supported by Creswell (2007) for
conducting case study research.

20
Table 2. Table of Codes/Subcodes Used for Sea Eagle Interview Analysis.
Experience Type (ET) Experience Characteristic (EC) Codes and Subcodes Contact with Supervisor (CS-) Frequent (F) /Infrequent (I)
Positive (+) /Negative ($)
Position/Job Duties (JD-) Autonomous (A) /Non-autonomous (Na)
Primary (P) /Secondary (S)
Subcodes: Fieldwork (Fw)/Administrative work (Aw)/
Public Relations work (PRw)/Supervise Others (So)
Relationship with Coworkers
(RC-)
Shared Responsibilities (SR)/ Divided Resp. (DR)
Egalitarian (E) /Hierarchical (H)
Goal-Setting and Evaluation
Process (GSE-)
Proximate (P) /Ultimate (U)
Subcodes: Formal (L) / Informal (casual)(C); Positive
(beneficial) (+) /Negative (costly) ($)*; Frequent (F)
/Infrequent (I)
Contact with Public (CP-) Positive (+) /Negative ($)*
Frequent (F) /Infrequent (I)
Public/Media Relations (PR-) Internally Generated (Y)/Externally Generated (X)
- Positive (+) /Negative ($)*
- Frequent (F) /Infrequent (I)
Progress of Program (PP-) Good (G) /Bad (B)*
Performance of Program
(PO-)
Good (G) /Bad (B)*
*For these code sets, Neutral (N) was also an option.

21
Document/Audiovisual Materials: Collection and Analysis
Document Collection.In addition to interviews, I gathered documentation such
as pamphlets, newsletters, newspaper and internet articles, books, brochures, DVDs, TV
programs, flyers and informational packets either presented by or related to the Sea
Eagle Recovery Project. I collected these items from archival collections at the Royal
Society for the Protection of Birds (RSPB) Scotland headquarters, the Scottish Natural
Heritage (SNH) offices, and a variety of wildlife centers located around the country. I
gathered further items as donations from the private collections of biologists and
practitioners who had worked on the Sea Eagle Recovery Project (Table 3).
Document Analysis. I analyzed documents using the typology developed from
the interview analysis phase. The resultant data were then integrated into the 8-variable
experience type (ET) framework. This process allowed me not only to contribute more
data to the development of the framework, but also offered an opportunity to increase the
reliability of data through triangulation.
22
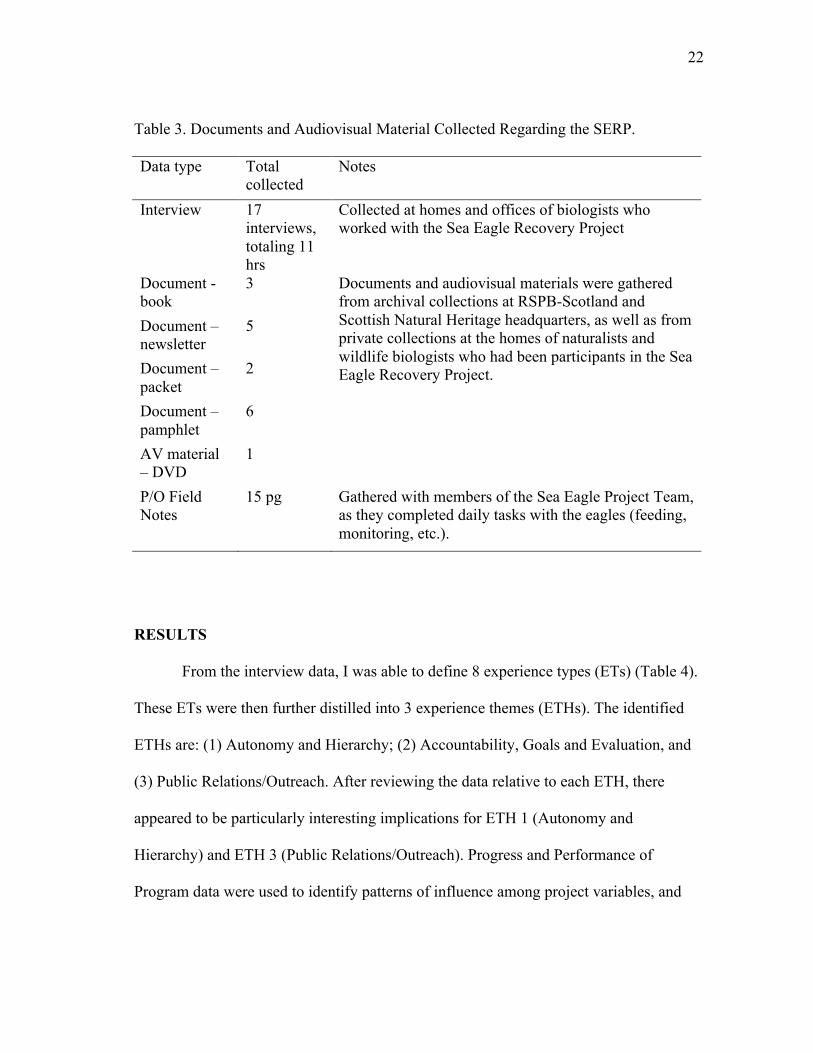
Table 3. Documents and Audiovisual Material Collected Regarding the SERP.
Data type Total collected
Notes
Interview 17 interviews, totaling 11 hrs
Collected at homes and offices of biologists who worked with the Sea Eagle Recovery Project
Document - book
3
Document – newsletter
5
Document – packet
2
Document – pamphlet
6
AV material – DVD
1
Documents and audiovisual materials were gathered from archival collections at RSPB-Scotland and Scottish Natural Heritage headquarters, as well as from private collections at the homes of naturalists and wildlife biologists who had been participants in the Sea Eagle Recovery Project.
P/O Field Notes
15 pg Gathered with members of the Sea Eagle Project Team, as they completed daily tasks with the eagles (feeding, monitoring, etc.).
RESULTS
From the interview data, I was able to define 8 experience types (ETs) (Table 4).
These ETs were then further distilled into 3 experience themes (ETHs). The identified
ETHs are: (1) Autonomy and Hierarchy; (2) Accountability, Goals and Evaluation, and
(3) Public Relations/Outreach. After reviewing the data relative to each ETH, there
appeared to be particularly interesting implications for ETH 1 (Autonomy and
Hierarchy) and ETH 3 (Public Relations/Outreach). Progress and Performance of
Program data were used to identify patterns of influence among project variables, and

23
were collected from interviews and document analysis. Good/Bad/Fair/Neutral were
assessed subjectively during analysis, based on the quality attributed by interviewees to
each, in response to specific questions asked during the interview.
In ETH 1 (Autonomy and Hierarchy), there appeared to be improvements in the
progress and performance of the program associated with 2 particular elements of
managerial style. These were (1) an increase in hierarchy and clear division of
responsibilities amongst team members, although not necessarily a decrease in
autonomy, and (2) an improved relationship with supervisors, although not necessarily
an increase in supervisory contact.
In ETH 3 (Public Relations), there appeared to be a relationship between the type
and tenor of internally generated press and the quality of the relationship with the public.
Several interviewees mentioned the change in internally generated information and
press: from positive-only (“Sea Eagles are great!”) to offering both positive and negative
information (“Here are some of the benefits and risks of a sea eagle reintroduction.”),
and suggested that it may have played a role in public acceptance. This hypothesis was
supported by a chronological cross-analysis of program press materials with opinion or
citizen-contributed sections in local newspapers.

24
Table 4. Experience Types (ETs) and Characteristics (ECs) of the SERP.
Experience Types (ETs)
Pilot Phase Phase I Phase II Phase III
Autonomy of Position (ETH 1) Autonomous Less Autonomy Autonomous Less Autonomy Contact with Supervisor (ETH 1) Neutral Frequent Infrequent Frequent
Negative Neutral Positive Neutral Relationship with Colleagues (ETH 1)
Divided Responsibilities
Shared Responsibilities
Divided Responsibilities
Divided Responsibilities
Hierarchical Egalitarian Neutral Hierarchical Proximate Goal-Setting and Evaluation (ETH 2)
Frequent Frequent Frequent Frequent
Informal Informal Both Informal
and Formal Informal
Ultimate Goal-Setting and Evaluation (ETH 2)
Neutral Infrequent Infrequent Infrequent
Formal Formal Formal Formal
Externally Generated Press/PR (ETH 3) Frequent Frequent Frequent Neutral
Positive Positive Both Positive
and Negative Positive
Internally Generated Press/PR (EHT 3) Not Applicable Frequent Infrequent Frequent
Not Applicable Positive Positive Both Positive
and Negative Contact with Public (ETH 3) Neutral Neutral Frequent Frequent
Not Applicable Negative Both Positive
and Negative Both Positive and Negative
Progress of the Program Good Poor Fair Good Performance of the Program Poor Good Good Good

25
DISCUSSION
Autonomy and Hierarchy: ETH 1
Autonomy refers to the ability of team members to function independently, either
while in the office or in the field. Hierarchy refers to the assignation of responsibilities
and privileges to team members according to a graded or ranked system. Elements of
this ETH included: (a) Autonomy of position, referring to the apparent ability of each
reintroduction team member to independently make decisions and take action to further
the goals of the reintroduction; (b) Contact with Supervisor, referring to both the
frequency and quality of interactions with both immediate and indirect supervisors; and
(c) Relationship to Colleagues, measured along an egalitarian/hierarchical scale, as well
as along a shared responsibilities/divided responsibilities scale.
Table 5. Results of Autonomy and Hierarchy (Experience Theme 1) in the SERP.
Experience Types (ETs)
Pilot Phase Phase I Phase II Phase III
Autonomy of Position (ETH 1) Autonomous Less Autonomy Autonomous Less Autonomy Contact with Supervisor (ETH 1) Neutral Frequent Infrequent Frequent
Negative Neutral Positive Neutral Relationship with Colleagues (ETH 1)
Divided Responsibilities
Shared Responsibilities
Divided Responsibilities
Divided Responsibilities
Hierarchical Egalitarian Neutral Hierarchical

26
Autonomy appeared to fluctuate throughout the various phases of the SERP
(Table 5), with little apparent effect on performance. This supports the findings of Farh
and Scott (1983), who found that in an experimental setting, variation in autonomy had a
negligible effect on performance. However, Dodd and Ganster (1996) challenged those
findings, suggesting that perhaps autonomy only affects performance relative to the type
of task being performed. They distinguish between high-variety and low-variety task
assignments, and found that in high-variety tasks, increased autonomy improved
performance by 16%, while the effect on low-variety tasks was negligible. Langfred
(2000) found similar results, stating that high autonomy improved performance when
task interdependences (i.e. shared responsibilities) of a group were also high.
This may have relevance for the perceived lack of macroscopic relationship
between autonomy and performance in SERP. That is; within a single phase of a
reintroduction, autonomy might have affected performance only if the type of tasks
being performed by practitioners were of sufficiently high variety or high
interdependence. High-variety and high-interdependence assignments would be expected
in phases of the reintroduction that were less hierarchical and involved more shared
responsibilities. In such scenarios, employees would be expected to pitch in on all
aspects of the reintroduction, and increasing autonomy may have improved performance.
Unfortunately, such a combination of factors did not appear during the four
SERP phases. Although the opposite effect could be perceived in Phase 3 (which was
more hierarchical, had divided responsibilities, reduced autonomy, and was ultimately
very successful) cannot be taken as evidence that the alternate correlation would exist.

27
Accountability, Goals and Evaluation: ETH 2
Accountability refers to the ability or expectation of practitioners to explain or
justify their actions through formal or informal evaluation or review. It is reflected in the
determination of goals, followed by the evaluation of the completion of those goals.
Evaluation refers to the complete process of professional assessment, which may be
undertaken by either internal or external agents of the program. This ETH included: (a)
Proximate goal-setting and evaluation, referring to the establishment of immediate/short-
term formal or informal goals, and the evaluation or assessment of whether or not those
goals had been met; and (b) Ultimate goal-setting and evaluation, referring to the
establishment of ultimate/long-term formal or informal goals, and the evaluation or
assessment of whether or not those goals had been met
Table 6. Results of Accountability, Goals and Evaluation (Experience Theme 2) in the
SERP.
Experience Types (ETs)
Pilot Phase Phase I Phase II Phase III
Proximate Goal-Setting and Evaluation (ETH 2)
Frequent Frequent Frequent Frequent
Informal Informal Both Informal
and Formal Informal
Ultimate Goal-Setting and Evaluation (ETH 2)
Neutral Infrequent Infrequent Infrequent
Formal Formal Formal Formal

28
The amount of accountability in an organization may be reflected in its
performance rating and evaluation process. Theoretically, the implementation of
performance ratings increases accountability by holding participants responsible for
actions taken and results produced. In reality, this may not always be the case, as
performance ratings and evaluations may be inefficient, inappropriate, or
counterproductive to improving performance (Halachmi 2002, De Lancer Julnes 2006,
Tilbury 2006).
SERP findings neither supported nor negated this notion. Throughout all phases,
ultimate goals were formally set and evaluated infrequently, while proximate goals were
informally set and evaluated frequently(Table 6). There was so little inter-phase
variation in this category, in fact, that it would be difficult to detect even the slightest
indication of an effect on performance, which varied, throughout the duration of the
SERP.
Public Relations/Outreach: ETH 3
Public Relations/Outreach refers to the effort made by the reintroduction to
interact with, access, educate, or include members of the public during the reintroduction
process. Elements of this ETH included: (a) Internally Generated Press/Public Relations,
referring to any press or public relations efforts that were initiated and controlled by the
program itself and measured in terms of frequency and quality; (b) Externally Generated
Press/Public Relations, referring to any press or public relations efforts that the program
chose to participate in, but were not directly controlled or initiated by the program itself
29
and measured in terms of frequency and quality; (c) Contact with Public, measured in
terms of frequency and quality.
It can be difficult to parse the contribution of public relations to the ultimate
performance of an organization or project, largely because the intangible benefits of
improved relationships, improved legitimacy, or improved public opinion can be
difficult or cumbersome to measure (Bennett and Gabriel 2001, Likely 2003, Phillips
2006). But because reintroduction programs can be closely interrelated with issues of
public sentiment (Clark and Westrum 1989, Kleiman 1989, Seddon et al. 2007), the
relationship between public relations and program performance can have particular
salience to this field.
Despite the difficulty in determining exact measurement patterns for connecting
public relations to performance, it can be generally logically assumed that high-quality
PR efforts will have a positive effect on public sentiment, and ultimately, performance,
whereas low-quality PR efforts will have a negligible or detrimental effect. The
question, then, should focus on devising measurements of quality for PR efforts.
In the case of the SERP, I believe it would be best to rate PR quality by three
characteristics: (1) adherence to scientific fact, (2) inclusivity of presentation (i.e. not
overly technical, expensive, or esoteric), and (3) appeal of PR product. Working with
these criteria, we can make better sense of the SERP findings.

30
Table 7. Results of Public Relations (Experience Theme 3) in the SERP.
Experience Types (ETs)
Pilot Phase Phase I Phase II Phase III
Externally Generated Press/PR (ETH 3) Frequent Frequent Frequent Neutral
Positive Positive Both Positive
and Negative Positive
Internally Generated Press/PR (EHT 3) Not Applicable Frequent Infrequent Frequent
Not Applicable Positive Positive Both Positive
and Negative Contact with Public (ETH 3) Neutral Neutral Frequent Frequent
Not Applicable Negative Both Positive
and Negative Both Positive and Negative
In Phase 1, both internal and external PR efforts were frequent, and highly
positive (Table 7). Early publications regarding sea eagles focused heavily on the merits
of the SERP, frequently using either quixotic petition (e.g. “the triumphant return of the
Scottish sea eagle”) or an intellectual plea to aestheticism (e.g. “the majestic eagle
soaring above the river”). The avoidance of controversial issues in these early PR efforts
(keeping mum on the topic of lamb predation, in particular) meant that this phase
avoided direct address of factual problems. Inclusivity was also reduced, as the sea
eagles were introduced to secret locations on an island nature preserve in the Outer
Hebrides, making active participation in the SERP inaccessible to most citizens, and
31
simultaneously reducing the appeal of the project. Public reaction to the SERP during
this phase was generally negative, and a record of an almost 25% persecution rate of sea
eagles was recorded in Phase 1 (JNCC 1988).
Phase 2 improved upon the PR efforts of Phase 1 by expressing greater
adherence to scientific fact and improving inclusivity. Phase 2 PR addressed the issue of
lamb predation head-on through the creation of a “support program” for predated
crofters, and began to openly address the challenges of the SERP in print. Phase 2 also
saw the opening of the sea eagle viewing site, the formation of community partnerships
to protect sea eagle nests, and the widespread distribution of brochures and pamphlets
which offered simple, unbiased information about the SERP. Public opinion of the SERP
improved during this time, with some communities becoming very active supporters of
the program (Table 7).
Phase 3 saw a dramatic change in PR efforts, with a specially increased focus on
inclusivity. Publications vary from children’s books to highly technical annual reports,
and particular attention has been paid to linguistic parity, with brochures and pamphlets
now listing the Gaelic names of the eagle alongside its English one. There also seems to
be a heavy focus on appeal, with a profusion of positive and aesthetic pamphlets,
articles, brochures, and promotional items advertising the aesthetics and romantic ideals
of the sea eagle.
Generally, the Public Relations of the SERP appear to have improved in some
areas over time, but may lag in others. Undoubtedly, the quality of public relations

32
affects popular opinion of the SERP, but the exact ways in which these two things relate
would require a more deeply focused probe than this case study offers.
CONCLUSIONS
The interview method allowed for the acquisition of stories, statements, histories,
and details of experience that were very useful for an exploratory case study. The
interviews provided a range of information that could then be synthesized into patterns,
the first step towards creating predictive hypotheses.
Future Directions
Now that a preliminary outline of experience characteristics and themes has been
established, it might be beneficial to the body of research for a second, more directed
case study to take place. If undertaken as part of a comparative case series, this could
probe more deeply into the particularities of experience within the SERP, and would
allow for contextualization of that experience relative to other reintroductions. Another
option, the one that I have pursued in the third chapter of this thesis, would be to use the
identified experience themes, types, and characteristics (Table 2) to produce a survey
instrument that could offer the opportunity to analyze a wider range of projects, although
with less depth than the case study approach might. Another area of research that might
be fruitful is the study of cross-cultural value orientations within the reintroduction.
Although the initial phases of the reintroduction took place only in Scotland, more recent
developments have seen the launch of a reintroduction in Ireland, and the proposal of
reintroductions to England and Wales. These future reintroductions might offer rich
opportunities for study and further understanding of the reintroduction experience.

33
CHAPTER III
SURVEY ON LEADERSHIP AND MANAGEMENT OF WILDLIFE
REINTRODUCTION PROGRAMS
INTRODUCTION
Many factors can influence the success of a reintroduction program, due in part
to the complexity of habitat systems within which species might be reintroduced (Steury
and Murray 2004). Some factors which have shown to be influential are: changes in
climate (McCarty 2001), competition with extant populations (Lomolino and Channell
1995), the presence of predators and parasites (Lomolino and Channell 1995),
prevalence or transference of disease (Cunningham 1996), quality of available habitat
(Wolf et al. 1996), size of release range (Wolf et al. 1998), proximity of release site to
central areas of historic range (Lomolino and Channell 1995), size and density of
reintroduced population (Wauters et al. 1997; Wolf et al. 1998; Armstrong et al. 2002;
Steury and Murray 2004), and presence of anthropogenic stressors (Steury and Murray
2004; Teixeira et al. 2007).
It is clear that the biological challenges to reintroduction are significant.
However, consideration must also be given to the human dimensions of reintroduction
work, which can also play a consequential role in determining the ultimate success of a
program. Reintroduction programs are complex initiatives, generally requiring long-term
financial and political support (Kleiman et al. 1994; IUCN 1998), and demanding the use
of both interpersonal and biological skills from its practitioners (Dietz and Nagagata
1986; Clark and Westrum 1989; Sarrazin and Barbault 1996); for this reason,

34
reintroduction programs necessitate a particular focus on the human element that other
conservation initiatives do not require. Furthermore, reintroduction projects require even
more communication and human interaction than most conservation programs because
unlike a study of an existing, increasing, migrating, or diminishing wildlife population, a
reintroduction project produces an immediate, human-led initiation of major change to
an ecological community. When that ecological community coexists with a human
community, then the project also necessitates a change to that human lifestyle as well. In
addition to this, reintroductions tend to be high-profile projects, often including elements
of public education/outreach, and attracting attention from various media outlets. In
heaping addition to this, reintroduction biologists only perform their work reactively –
there is never a need to reintroduce something that has not been extirpated in the first
place. However, this reactivity may take place whether an extirpation has been as recent
as last year or as distant as three centuries ago. In either case, unique challenges for the
human community will arise with the reintroduction of an extirpated species to their
ecological strata.
Because of these factors, reintroduction biologists tend to work even more
closely with the human dimensions of conservation than other sub-disciplines might,
necessitating at least some familiarity with aspects of conservation work outside of the
simple scientific sphere. Some reintroductions may take it upon themselves to offer
public education and involvement events; others, particularly those taking place within a
zoo, aquarium, or pre-existing wildlife park, may be able to use this preexisting
infrastructure to create a dialogue with the surrounding community. Programs supported

35
by environmental campaigns may use the campaign itself as a mechanism for
information dissemination, through which knowledge sharing and community dialogue
can occur (Smith et al. 2007).
Outside of public relations, education and outreach, another critical human
dimension to be considered is the reintroduction team itself. As Clark and Westrum
(1989) point out, the unique challenges of a reintroduction program require practitioners
to have the ability to double as program managers or operate in a leadership capacity for
the duration of the project. Clark and Westrum also note that reintroductions are high-
stress, highly interactive situations requiring vast amounts of teamwork, public response,
and human coordination. The ability to operate effectively in such an environment is not
a universal trait – reintroduction planners must carefully consider the personalities and
abilities of each team member to interact with their coworkers, other entities, and the
public. Jacobson and McDuff (1998), however, bemoan the lack of human dimensions
aptitude in conservation biology, accusing the discipline of rearing “idiot savants” –
researchers who are highly capable biologists, but inept social actors. Sarrazin and
Barbault (1996) note that reintroduction biology, in particular, suffers from inexperience
in building strong relationships between communities, managers, and scientists. This is a
dangerous weakness for reintroductions to have, because lack of communication about
conservation initiatives can lead to antagonism within local communities that can
seriously hinder or halt reintroduction efforts, as well as sour relationships for future
work (Reading and Kellert 1993). Particularly for conservation biologists, who act as
practitioners of a crisis discipline and are frequently tasked with finding immediate,

36
accessible responses to threats to biodiversity (Soulé 1985; Beissinger 1990; Fleishman
et al. 1999), a hostile community could mean an inaccessible ecosystem. In the case of a
biodiversity emergency, an inability to relate to communities could mean an inability to
perform critical conservation work.
A better approach to the rearing of new conservation and reintroduction
biologists might be a more interdisciplinary approach to programming, as some
scientists have suggested (Sarrazin and Barbault 1996; Jacobson and McDuff 1998;
Smith et al. 2003; Marshall et al. 2007). The use of resources drawn from anthropology,
sociology, psychology, business, economics, finance, education and political science
(among others) would offer biologists and practitioners a vast volume of
interdisciplinary experience from which they could draw innovative solutions. However,
this request for more scientific ecumenism is a call to action that has not yet been
answered. In fact, Seddon et al.’s (2007) literature review, which categorized 454 papers
from 101 journals related to reintroduction, found that the least-common topic of
published articles (<5%) was the use of interdisciplinary theories or practices in
reintroduction biology.
OBJECTIVE
In viewing reintroduction biology through an interdisciplinary lens, certain
problem areas seem to arise: the relative rarity or frequency of rigorous program
evaluations (Kleiman et al. 1999; Ostermann et al. 2001; Stern et al. 2005) which can
lead to inconsistencies in performance and a lack of accountability for failure; difficulty
encountered in the goal-setting process and in defining uniform reintroduction success

37
criteria (Kleiman 1989; Fleishman et al. 1999), which can contribute to the first problem;
architectural constraints such as the existence of the long-term financial and political
support generally required by reintroductions (IUCN 1998); and difficulty encountered
in the design of efficient, relevant, and appropriate organizational structures (Clark and
Westrum 1989). These problems are not novel – they are dealt with every day in the
literature of management and organizational structure. Therefore, the goal of this chapter
will be (a) to describe the use of a survey instrument to gain insight into the general
trends of organizational behavior in reintroduction programs, then (b) to characterize
those trends in the face of predictions about organizational behavior and process.
BACKGROUND
Organizational Structure
Conservation initiatives are frequently organized along two major lines of
development: large, integrated conservation-development projects (ICDPs), and smaller-
scale, community-based projects (CBPs) (Brandon and Wells 1992). While ICDPs
sometimes struggle with overwhelming obstacles as they present new conservation
initiatives, smaller-scale, community-based projects can experience both long- and short-
term success in their work (Brandon and Wells 1992). This disparity may exist because
ICDPs, in contrast to CBPs, tend to function on a larger spatial and economic scale
(Horwich and Lyon 2007), tend to be short term and have more external funding (Smith
et al. 2003), tend to be less flexible in implementation, and generally are not able to
provide a mutable, reactive model for conservation within a specific sociopolitical
context (Brandon and Wells 1992; Horwich and Lyon 2007).

38
These organizational issues may influence the performance of a reintroduction
project by changing its procedural system; evidence for this can be found in the
economics literature. Research there has drawn clear links between organizational
structure and performance, suggesting that the effects manifest through the
organizational process. Structure can, for instance, influence the efficiency of knowledge
transfer (Jensen and Meckling 1990). In reintroduction programs, deficiencies in the
speed and clarity with which information is exchanged could be disastrous for
practitioners, who often must act quickly when problems arise in the field.
Organizational structure has additionally been linked to the overall productivity of
program employees (Dalton et al. 1980), a critical factor in both science and business.
Structure can also change the value of innovation within an institution (Russell and
Russell 1992); in a reintroduction program, this could mean that new ideas or changes
could be introduced, accepted, and integrated more slowly. Lastly, organizational
structure can influence the credibility of the marketing (John and Martin 1984) – an
organization bogged down by unnecessary bureaucracy, for example, might have more
difficulty delivering on promised items, events, or effects. This could specifically be a
problem for reintroduction programs, which can often be high profile, and whose
outcome can be affected by the quality of relationship the program maintains with the
public. Sarrazin and Barbault (1996) note that reintroduction biology, in particular,
suffers from inexperience in building strong relationships between communities and
practitioners, and that this can be detrimental to the science. Reading and Kellert (1993)
found that poor information-sharing and relationship-building between conservation

39
initiatives and communities led to local antagonism that could seriously hinder or halt
reintroduction efforts, as well as sour relationships for future work.
METHODS
I designed and conducted a survey using the 5-point Likert scale format (Likert
1932). The survey was divided into 6 sections and consisted of 47 closed-ended
questions, requiring approximately 20 minutes for completion. The survey asked
questions regarding the experiences of respondents while working for a wildlife
reintroduction project. Two invitations were sent to participate in the survey: (1) upon its
opening; (2) at the two-week interval/two weeks prior to closing. These methods, filed
under protocol number 2008-0131, were also determined to be exempt from review by
the Texas A&M Office of Research Compliance’s Institutional Review Board, under
federal code 45 CFR 46.101(b)(2).
Participant Selection
In order to target the distribution of the survey to my intended audience, I
compiled a list of wildlife reintroductions and their practitioners, based on literature
reviews and a thorough review of the IUCN-published Reintroduction News online
newsletter. From these two sources, I collected the emails of any practitioners listed as
contactable authors or practitioners, either on published literature or in the public
Reintroduction News Directory of Practitioners. This purposive sampling was
undertaken to improve the quality of data collection and likelihood of response; more
recent projects are less likely to have staff who have since retired or deceased.

40
Otherwise, I showed no bias in participant selection relating to species, size or length of
project, or budget.
Data Collection
I distributed 401 invitations via email to the selected reintroduction practitioners,
selected from the reintroduction literature according to the criteria listed above. The
invitation asked participants to complete a brief online survey, consisting of 47 questions
divided into 6 sections. These 6 sections represent the 4 themes compiled from the case
study of the Sea Eagle Recovery Project (SERP, Chapter II). The 6 sections were: (i)
About Your Project, (ii) About You and Your Position, (iii) About Organizational
Structure, (iv) About Goal-Setting, Meetings and Evaluation, (v) About Public Relations
and Outreach, and (vi) About Success and Performance. A brief review of each of these
sections is provided below.
About Your Project. This section asked questions about the general timeline of
the reintroduction project (i.e. the length of each planning/action/monitoring phase).
These questions were asked for two reasons: (a) they provided a neutral introduction to
the survey’s style and the types of questions the respondent would be asked, and (b) they
could later be used to provide general information about the most common parameters of
reintroduction projects in terms of duration.
About You and Your Position. Questions were asked about the respondent’s
personal experience with the reintroduction project, and reintroduction biology in
general. It also asked questions regarding the type and seniority of the respondent’s
position within their reintroduction project. These questions were asked in order to
41
further introduce the respondent to the survey, and in order to provide a context of
position that could later serve to make a distinction between respondents, offering more
targeted information about the perceptions/experiences of a subpopulation (e.g., how do
the responses of senior employees differ from junior employees).
About Organizational Structure. The focus in this section related to the size
and hierarchical structure of the reintroduction project. These questions were asked in
order to provide information that could later contextualize the experiences of the
reintroduction project relative to size and hierarchical style.
About Goal-Setting, Meetings and Evaluation. This section asked questions
related to the frequency and type of goal-setting and evaluation processes within the
reintroduction project. These questions were asked in order to provide information that
could contextualize any potential relationship between the goal-setting/evaluation
process in the program and ultimate program experience.
About Public Relations and Outreach. This section asked questions about the
public outreach and media relations, education, and affiliations created by the
reintroduction with other institutions in its field (i.e. other reintroductions) as well as
other institutions outside of its field (i.e. 3rd party entities: media organizations, schools,
etc.). These questions were asked in order to provide information that could later be used
to seek any potential relationship between the participation of the reintroduction in
cooperative engagements and the ultimate experience of the project.
About Program Performance and Success. Finally, this section asked
respondents simple questions about the success/failure and performance of their

42
programs, both from an internal and an external assessment. These questions, though the
simplest, were arguably the most significant, as they provided the opportunity to
contextualize all other project parameters in the light of the project’s ultimately assessed
success/failure.
Data Analysis
Because of the exploratory nature of the survey, I felt it was most appropriate to
make use of general trend reporting to describe patterns of the results. This descriptive
analysis was undertaken with the Qualtrics website software to generate descriptive
statistics relative to the 47 questions (Qualtrics 2009).
RESULTS
Results indicated several trends among reintroduction practitioners (Appendix
B). Survey results are presented by section, in the order used to provide questions to
respondents.
Respondent Demographics
Respondents were primarily senior employees and founders of wildlife
reintroduction programs (Figure 1). Most had 1–3 years of experience at the time they
began their reintroduction programs, although a relatively large portion cited over 12
years of experience (Figure 2).

43
Figure 1. Respondents by Type to Leadership and Management of Wildlife
Reintroduction Programs Survey.
Figure 2. Reported Years of Experience with Wildlife Reintroductions among Survey
Respondents.
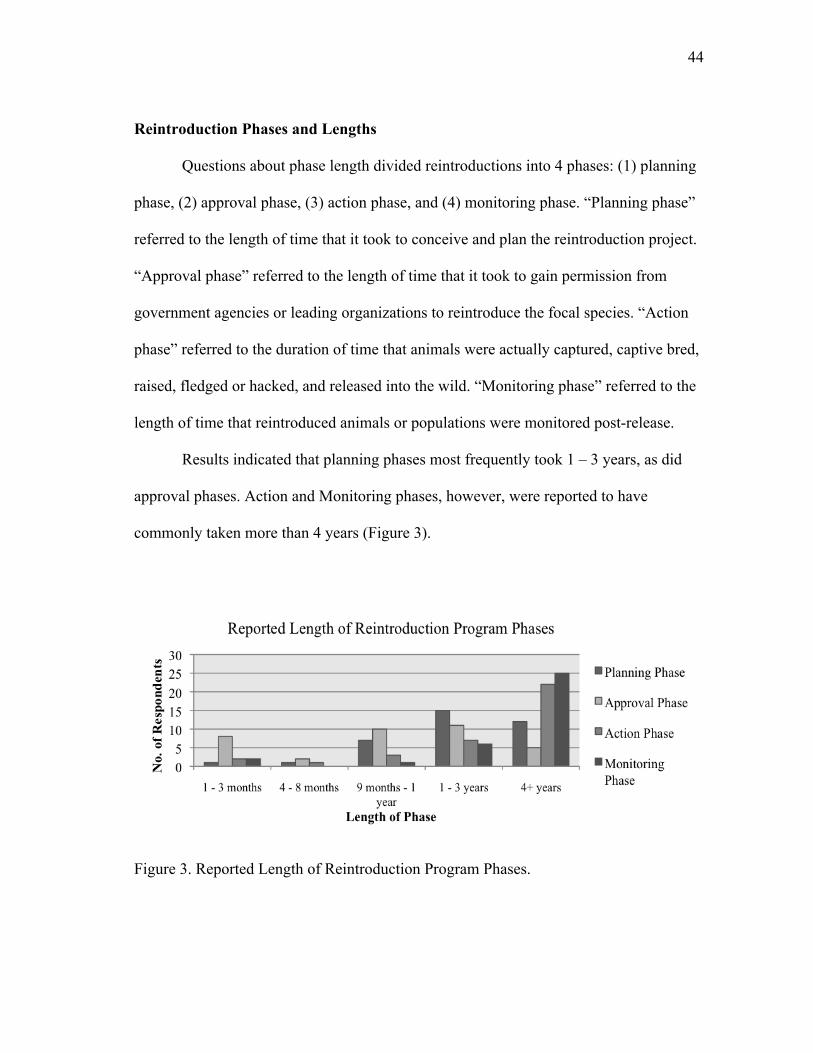
44
Reintroduction Phases and Lengths
Questions about phase length divided reintroductions into 4 phases: (1) planning
phase, (2) approval phase, (3) action phase, and (4) monitoring phase. “Planning phase”
referred to the length of time that it took to conceive and plan the reintroduction project.
“Approval phase” referred to the length of time that it took to gain permission from
government agencies or leading organizations to reintroduce the focal species. “Action
phase” referred to the duration of time that animals were actually captured, captive bred,
raised, fledged or hacked, and released into the wild. “Monitoring phase” referred to the
length of time that reintroduced animals or populations were monitored post-release.
Results indicated that planning phases most frequently took 1 – 3 years, as did
approval phases. Action and Monitoring phases, however, were reported to have
commonly taken more than 4 years (Figure 3).
Figure 3. Reported Length of Reintroduction Program Phases.

45
Autonomy and Hierarchy
Results indicated that tasks assigned were rarely monitored in reintroduction
programs, either directly or indirectly, by supervisors (Figure 4). However, most
respondents identified their program only as having been “somewhat autonomous”
(Figure 5). Hierarchy reports, on the other hand, appeared to confirm task supervision
reports, with most respondents stating that their reintroductions had only been
“somewhat hierarchical” (Figure 6). This appears to be confirmed by levels of authority,
wherein most respondents reported only one level of authority between the most senior
and most junior employees or volunteers in the program (Figure 7).
Figure 4. Reported Frequency of Task Supervision in Reintroduction Programs.

46
Figure 5. Reported Degrees of Autonomy in Reintroduction Programs.
Figure 6. Reported Degrees of Hierarchy in Reintroduction Programs.

47
Figure 7. Reported Levels of Ranked Authority among Reintroduction Employees and
Volunteers.
Goals, Evaluation, and Accountability
General meetings were most commonly reported as being all-staff meetings and
taking place annually (Figure 8). Meetings held specifically to determine, modify, or
augment goals or targets for the program (“goal-setting meetings”) were most commonly
reported to take place annually for long-term goals, and monthly for short-term goals
(Figure 9). However, it should be noted that this represents two overlapping ranges,
with short-term meetings taking place more frequently (as frequently as daily) and long-
term meetings taking place more rarely (as rarely as never).

48
Subsequent evaluations of these goals were most commonly reported to take
place annually (Figure 10), although internal program evaluations were reported twice as
frequently as external evaluations. "Internal evaluations" were defined as formal or
informal meetings, papers, or presentations that assessed or discussed the progress,
success, or performance of the reintroduction relative to its stated goals or targets. These
evaluations must have been conducted by entities or individuals who were also
employees or volunteers with the reintroduction project. “External evaluations” were
defined as formal or informal meetings, papers, or presentations that assessed or
discussed the progress, success, or performance of the reintroduction relative to its stated
goals or targets. These evaluations must have been conducted by entities or individuals
who were not employees or volunteers with the reintroduction project.
Figure 8. Reported Frequency of General Meetings in Reintroduction Programs.
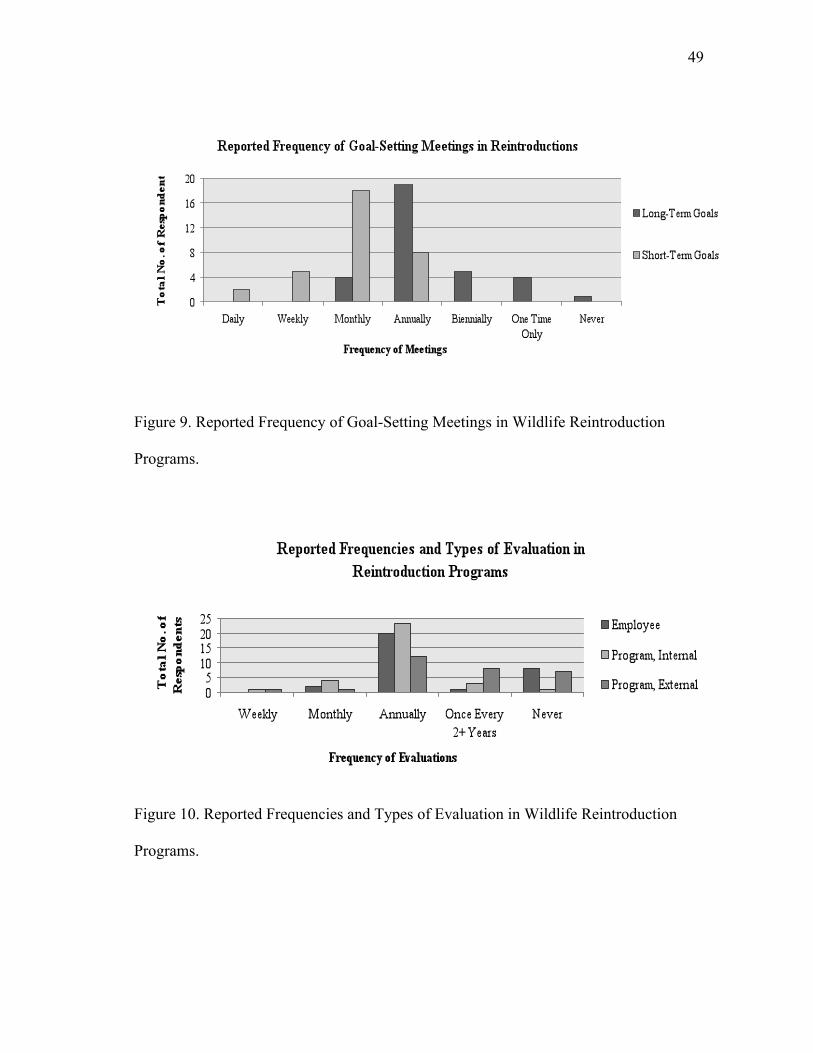
49
Figure 9. Reported Frequency of Goal-Setting Meetings in Wildlife Reintroduction
Programs.
Figure 10. Reported Frequencies and Types of Evaluation in Wildlife Reintroduction
Programs.

50
Public Relations and Outreach
In general, programs had little to no staff dedicated specifically either to public
relations/media affairs or public education and outreach (Figure 11). However,
partnerships appeared to play a considerable role in reintroduction work. Conservation
organizations and initiatives may partner with other entities, either in their fields or their
communities, in order to broaden the scope of their projects and extend outreach
capabilities. A “partnership” was defined as an ongoing, mutually recognized, formal or
informal association between the reintroduction and one or more separate entities or
organizations. Results from all partnership types indicated that reintroduction projects
most commonly partnered with print media, national wildlife conservation organizations,
or local community organizations. Programs were least commonly reported to partner
with corporations/business or other reintroduction programs (Table 8).
Figure 11. Reported Numbers of Staff Dedicated to Public Relations and Media Affairs
or Public Outreach and Education.

51
Table 8. Reported Partnerships in Wildlife Reintroduction Programs.
Type of Media No
partnerships 1 - 2 3 - 4 5 - 6 7+
Total Reported
Partnerships Newspapers, magazines, or other forms of print media 9 13 8 0 2 23 Television/radio stations or other forms of audiovisual media 13 12 6 0 0 18 Websites, blogs, or other forms of internet media 13 13 5 0 1 19 Primary Schools 13 6 3 0 8 17 Secondary Schools 14 5 5 2 5 17 Colleges/ Universities 10 12 3 3 2 20 International Wildlife or Conservation Organizations 11 13 6 0 1 20 National Wildlife or Conservation Organizations 7 14 9 1 1 24 Regional, Local, or Community Organizations (i.e. community improvement groups) 7 10 7 3 4 24 Naturalist or Local Wildlife Enthusiast Organizations 11 11 4 3 3 21 Other Reintroduction Programs 18 10 3 1 1 15 Corporations or Businesses 18 8 4 1 1 14

52
Perceptions and Evaluations of Success and Progress
Many respondents perceived their programs to be successful. However, a slight
gap existed between those who felt their program was a success (57%) and those who
reported that their programs had been formally evaluated as successful (63%). A wider
gap existed between those who believed their reintroduction had made good progress
(74%) and those whose programs had been formally evaluated as having made good
progress (60%) (Figures 12–13).
Figure 12. Reported Perceptions and Evaluations of Success in Wildlife Reintroduction
Programs.

53
Figure 13. Reported Perceptions and Evaluations of Progress in Wildlife Reintroduction
Programs.
DISCUSSION
The survey method yielded salient and valuable information regarding trends in
the management of reintroduction programs. The benefit of knowing these trends lies in
the ability to recognize management behaviors and organizational habits common to all
reintroductions. If patterns can be identified across multiple reintroduction programs,
then that knowledge can lay the groundwork for manipulative experimental designs. The
ability to design and undertake controlled experiments regarding reintroduction
management could improve not only the quality of scientific endeavors taking place
within reintroduction biology, but the quality of reintroduction biology itself.

54
Reintroduction Partnerships. The question of partnerships can be tricky for
any conservation initiative. Certainly, partnering with a likeminded organization can be
appealing, as it can allow a project to target new demographics, to reach previously
inaccessible audiences, and to stretch its resources farther than it could alone. However,
partnerships can also mean increases in costs, through increased capital spending,
personnel management, mediation and liaisons, etc. Trends in the survey indicated that
reintroduction programs had limited partnership participation. This may indicate a
deliberate course of action, intended to avoid unnecessary expenditures in a conservation
initiative that is already stretched thin. However, it may also be indicative of an
overlooked opportunity in conservation planning. In order to judge the value of
partnerships, a more thorough examination of the benefits and costs of partnering for
reintroduction programs would have to be undertaken.
Autonomy and Hierarchy. Autonomy and hierarchy generally indicated that
reintroduction programs tended to have low hierarchy and limited task supervision. This
fits with Clark and Westrum’s (1989) postulations about high-performance teams in
reintroduction, in which they suggest that because reintroductions are high-pressure,
fast-moving programs, team members must be able to work autonomously, but also
capable of positive interaction with other participants. Autonomy reports varied widely,
and this may be further support for the relationship suggested by Dodd and Ganster
(1996), who suggest that autonomy matters only insofar as it is relative to task type (high
vs. low variety).

55
Goal-Setting, Evaluation, and Accountability. The general trend of the results
tended towards annual all-staff meetings and employee evaluations. Program
evaluations, when undertaken, were generally internal and annual. This trend is reflected
in the reintroduction literature, in which annual reports of a species’ progress are
common, but hypothetico-deductive experimental designs are rare (Seddon et al. 2007).
Furthermore, it highlights the lack of rigorous evaluation in conservation lamented by
Kleiman et al. (1999), and supported by a literature review of accountability
publications. Accountability has been found to influence performance evaluation in
unusual and sometimes counterintuitive ways. For example, when an individual
evaluating project performance feels accountable to the individuals or projects being
rated, the rater is more likely to provide a higher score. The closer the relationship
between rater and ratee, the more likely ratings are to be skewed positively (Roch and
McNall 2007).
This means that internal evaluations, wherein evaluator and evaluated both feel a
sense of accountability towards each other, may lend itself towards biased reporting. A
clearer picture of the program and its performance can be gained through rigorous
external evaluation. Thus, the findings of accountability research underscore the need for
rigorous, external evaluations in conservation biology, particularly in reference to high-
pressure and high-contact initiatives such as reintroduction programs.
LIMITATIONS
One of the limitations of this survey was its small sample size. I sent survey
invitations to 401 recipients. Only 44 (11%) of invitees responded to and completed the
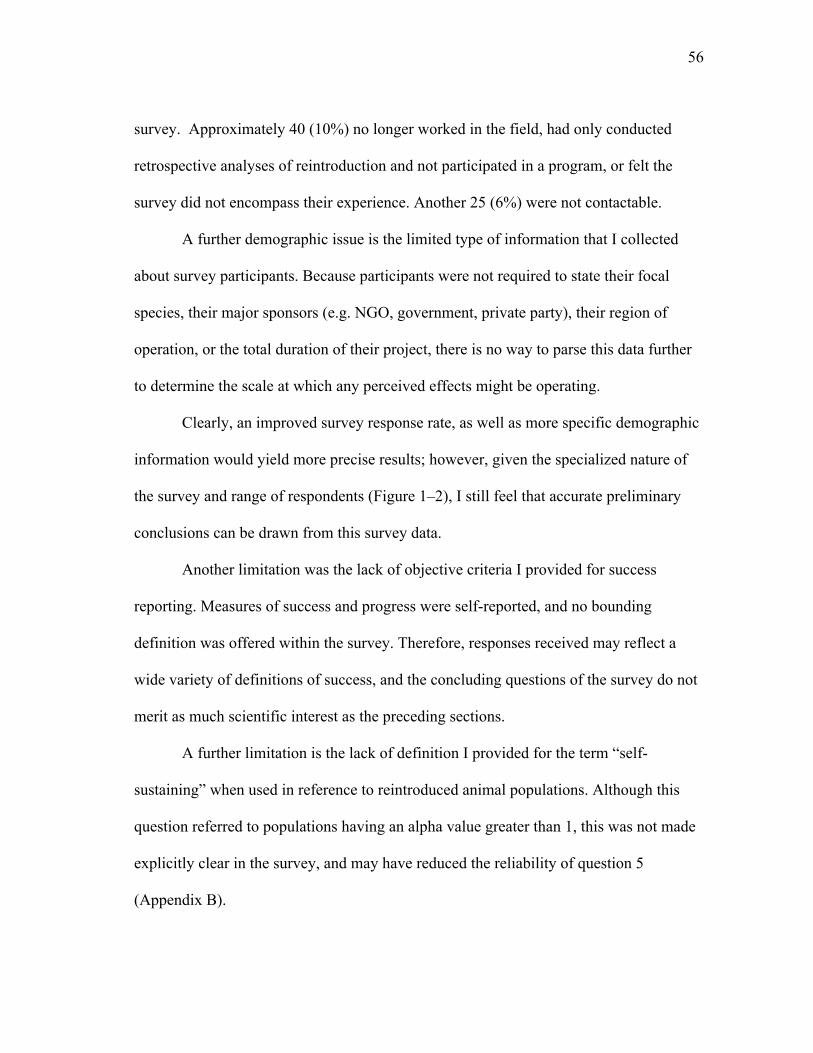
56
survey. Approximately 40 (10%) no longer worked in the field, had only conducted
retrospective analyses of reintroduction and not participated in a program, or felt the
survey did not encompass their experience. Another 25 (6%) were not contactable.
A further demographic issue is the limited type of information that I collected
about survey participants. Because participants were not required to state their focal
species, their major sponsors (e.g. NGO, government, private party), their region of
operation, or the total duration of their project, there is no way to parse this data further
to determine the scale at which any perceived effects might be operating.
Clearly, an improved survey response rate, as well as more specific demographic
information would yield more precise results; however, given the specialized nature of
the survey and range of respondents (Figure 1–2), I still feel that accurate preliminary
conclusions can be drawn from this survey data.
Another limitation was the lack of objective criteria I provided for success
reporting. Measures of success and progress were self-reported, and no bounding
definition was offered within the survey. Therefore, responses received may reflect a
wide variety of definitions of success, and the concluding questions of the survey do not
merit as much scientific interest as the preceding sections.
A further limitation is the lack of definition I provided for the term “self-
sustaining” when used in reference to reintroduced animal populations. Although this
question referred to populations having an alpha value greater than 1, this was not made
explicitly clear in the survey, and may have reduced the reliability of question 5
(Appendix B).

57
CHAPTER IV
CONCLUSIONS AND FUTURE DIRECTIONS FOR REINTRODUCTION
RESEARCH
INTRODUCTION
The ultimate outcome of this thesis has taken the form of 6 central conclusions
about the future of reintroduction research. In order to improve, broaden, and enrich
reintroduction research, I recommend that reintroduction biologists seek to: (1) maintain
hierarchy (Chapter II); (2) experiment with autonomy (Chapter II, III); (3) develop
partnerships (Chapter III); (4) improve and externalize evaluation (Chapter III); (5)
invest in high-quality public relations (Chapter II); and (6) make use of interdisciplinary
approaches.
SUMMARY OF RESULTS
Maintain Hierarchy
Interview results indicated that a hierarchical design and clear division of
responsibilities may have had positive effects on the reintroduction process. In complex
conservation initiatives, certainty of one’s job and duties can streamline operations
within a team and improve outcomes.
Experiment with Autonomy
Because preliminary results have not yet shown completely how autonomy
relates to the efficacy of program processes, the necessary solution is to design
hypothetico-deductive experiments to study its influence.

58
Develop Partnerships
Although partnerships were reported by most respondents, 3 types of
partnerships dominated. Exploration of other partnership types (e.g. corporate
partnerships) may have value for future reintroduction work.
Furthermore, partnerships formed with other reintroduction programs were
reported infrequently (<50% of respondents). If communication between reintroduction
programs could be increased and improved through partnership, better knowledge-
sharing and more efficient reintroduction processes might result.
Invest in High-Quality Public Relations
The relationship between public relations work and program performance is one
that should be investigated further, with more precise assessment tools. However,
preliminary data clearly indicates that maintaining high-quality public relations over
time can have a positive effect on participant experiences.
Improve and Externalize Evaluation
As many others have already pointed out, the lack of evaluation in conservation
initiatives is a major stumbling block to their progress and improvement. Without
regular, rigorous evaluation, reintroduction programs may find themselves doomed to
repeat the failures and oversights of the past. Furthermore, research published in the
management and business literature is explicit about the possible risks associated with
internal review in high-contact, high-pressure corporate environments that parallel
experience of a reintroduction program. This should encourage reintroduction biologists
to value external evaluations and reviews in the pursuit of accuracy.

59
Interdisciplinary Approaches
Lastly, I encourage reintroduction biologists to embrace interdisciplinary research.
Elements of sociology, business, finance, political science, psychology, anthropology,
and many other disciplines manifest themselves strongly in reintroduction research, and
their value must not be overlooked. The fields of sociology, marketing, communications
and anthropology have been invaluable in the process of this thesis, and I have no doubt
that they would be useful tools for any researcher in the field.
CONCLUSION
Now that this thesis has identified a few of the apparent trends in reintroduction
leadership and management, the next step will be to explore those trends through
manipulative experiments. By varying the amount of hierarchy or autonomy in a
program, increasing or decreasing the frequency of evaluation, or establishing and
augmenting new partnership and public outreach methods, reintroduction biology can
find new ways to improve program management and structure. This thesis sought to
identify and explore some trends and areas of focus for fruitful future research in
reintroduction biology, and now that those have been described here, I hope that future
researchers will take this opportunity to continue this vein of research, and advance the
field even farther forward.
60
LITERATURE CITED
Armstrong, D. P., and P. J. Seddon. 2007. Directions in reintroduction biology.
Trends in Ecology and Evolution 23: 20–25.
Armstrong, D. P., R. S. Davidson, W. J. Dimond, J. K. Perrott, I. Castro, J. G. Ewen, R.
Griffiths, and J. Taylor. 2002. Population dynamics of reintroduced forest birds
on New Zealand islands. Journal of Biogeography 29: 609–621.
Bainbridge, L.P., R. J. Evans, R. A. Broad, C. H. Crooke, K. Duffy, R. E. Green, J. A.
Love, and G. P. Mudge. 2002. Re-introduction of white-tailed eagles
(Haaliaeutus albicilla) to Scotland. Pages 393–406 in D. B. A. Thompson,
editor. Birds of Prey in a Changing Environment. The Stationary Office, Perth,
Scotland, UK.
Beck, B. B., L. G. Rapaport, M. R. Stanley Price, A. C. Wilson. 1994. Reintroduction of
captive-born animals. Pages 265–284 in P. J. S. Olney, G. M. Mace, and A. T. C.
Feistner, editors. Creative Conservation: Interactive Management of Wild and
Captive Animals. Chapman and Hall, London, United Kingdom.
Beissinger, S. R. 1990. On the limits and directions of conservation biology. BioScience
40: 456–457.
Bennett, R., and H. Gabriel. 2001. Reputation, trust and supplier commitment: the case
of shipping company/seaport relations. Journal of Business and Industrial
Marketing 16: 424–438.
Bertram, B. C. R., and D. P. Moltu. 1986. Reintroducing red squirrels into Regent’s
Park. Mammal Review 16: 81–88.
61
Brandon, K. E., and M. Wells. 1992. Planning for people and parks: design dilemmas.
World Development 20: 557–570.
British Broadcasting Company (BBC). 2008. Young sea eagles are 'doing well'.
22 February 2008. Available from
http://news.bbc.co.uk/2/hi/uk_news/scotland/tayside_and_central/7259363.stm
(accessed February 2008).
California Condor Conservation (CCC). 2008. California Condor Recovery Program.
Available from http://cacondorconservation.org/content/programs/ (accessed
March 2008).
Caracelli, V. J., Greene, J. C. (1993). Data analysis strategies for mixed-method
evaluation designs. Educational Evaluation and Policy Analysis 15: 195–207.
Central Intelligence Agency World Factbook (CIA). 2009a. United Kingdom.
Available from https://www.cia.gov/library/publications/the-world-
factbook/geos/UK.html (accessed 8 June 2009).
Central Intelligence Agency World Factbook (CIA). 2009b. United States of America.
Available from https://www.cia.gov/library/publications/the-world-
factbook/geos/US.html (accessed 8 June 2009).
Clark, T. W., and R. Westrum. 1989. High-performance teams in wildlife conservation:
a species reintroduction and recovery example. Environmental Management 13:
663-670.
Creswell, J.W. 2007. Qualitative Inquiry and Research Design: Choosing Among Five
Approaches. 2nd edition. Sage Publishers, Thousand Oaks, CA, USA.
62
Cunningham, A. A. 1996. Disease risks of wildlife translocations. Conservation Biology
10: 349–353.
Dalton, D. R., W. D. Todor, M. J. Spendolini, G. J. Fielding, and L. W. Porter. 1980.
Structure and performance: a critical review. Academy of Management Review
5: 49–64.
Delroy, L. B., J. Earl, I. Radbone, A. C. Robinson, and M. Hewett. 1986. The breeding
and reestablishment of the brush-tailed bettong, Bettongia penicillata, in south
Australia. Australian Wildlife Research 13: 387–396.
Dietz, L. A., and E. Nagagata. 1986. Community conservation education program for the
golden lion tamarin. J. Atkinson, editor. Pages 8–16 in Building Support for
Conservation in Rural Areas: Workshop Proceedings Vol. 1. QLF-Atlantic
Center for the Environment, Ipswich, MA, USA.
Dodd, N. G., and D. C. Ganster. 1996. The interactive effects of variety, autonomy, and
feedback on attitudes and performance. Journal of Organizational Behavior 17:
329–347.
Dzialak, M. R., M. J. Lacki, and S. Vorisek. 2005. Survival, mortality, and morbidity
among peregrine falcons reintroduced in Kentucky. Journal of Raptor Research
41: 61–65.
Erlandson, D.A. 1993. Doing Naturalistic Inquiry. Sage Publishing, Newbury Park, CA,
USA.
Farh, J. L., and W. E. Scott, Jr. 1983. The experimental effects of" autonomy" on

63
performance and self-reports of satisfaction. Organizational Behavior and Human
Performance 31: 203–222.
Ferraro, P.J., and S. K. Pattanyak. 2006. Money for nothing? A call for empirical
evaluation of biodiversity conservation investments. PLoS Biology 4: e105.
Fischer, J., and D. B. Lindenmayer. 2000. An assessment of the published results of
animal relocations. Biological Conservation 96: 1–11.
Fleishman, E., G. H. Wolff, C. L. Boggs, P. R. Ehrlich, A. E. Launer, J. O. Niles, and T.
H. Ricketts. 1999. Conservation in practice: overcoming obstacles to
implementation. Conservation Biology 13: 450–452.
Goodman, L. A. 1961. Snowball sampling. Annals of Mathematical Statistics 32:148–
170.
Green, R. E., M. W. Pienkowski, J. A. Love. 1996. Long-term viability of the re-
introduced population of the white-tailed eagle Haaliaetus albicilla in Scotland.
The Journal of Applied Ecology 33: 357–368.
Groom, M. J., Meffe, G. K., and C. R. Carroll. 2005. Principles of Conservation
Biology, 3rd edition. Sinauer Associates, Sunderland, MA, USA.
Gugiu, P. C., and L. Rodriguez-Campos. 2007. Semi-structured interview protocol for
constructing logic models. Evaluation and Program Planning 30: 339–350.
Halachmi, A. 2002. Performance measurement: a look at some possible dysfunctions.
Work Study: A Journal of Productivity Science 51: 230–239.
Horwich, R. H., and J. Lyon. 2007. Community conservation: practitioners’ answer to
critics. Oryx 41: 376–385.
64
International Union for the Conservation of Nature and Natural Resources (IUCN).
1998. Guidelines for reintroductions. IUCN/SSC Re-introduction Specialist
Group, Gland, Switzerland and Cambridge, UK.
Jacobson, S. K., and M. D. McDuff. 1998. Training idiot savants: the lack of human
dimensions in conservation biology. Conservation Biology 12:263–267.
Jensen, M. C., and W. H. Meckling. 1990. Specific and general knowledge, and
organizational structure. Journal of Applied Corporate Finance 8: 4–18.
John, G., and J. Martin. 1984. Effects of organizational structure of marketing planning
on credibility and utilization of plan output. Journal of Marketing Research 21:
170–183.
Johnson, R. B., and A. J. Onwuegbuzie. 2004. Mixed methods research: a research
paradigm whose time has come. Educational Researcher 33: 14–26.
Joint Nature Conservation Committee (JNCC). 1988. The reintroduction of the white-
tailed sea eagle to Scotland: 1975-1987. Report Series: Research and Survey in
Nature Conservation Series No. 12. JNCC Publications, Inverness, Scotland, UK.
Joint Nature Conservation Committee (JNCC). 2008. About JNCC. Available from
http://www.jncc.gov.uk/page-1729 (accessed February 2008).
Kleiman, D. G. 1989. Reintroduction of captive mammals for conservation. BioScience
39: 152–161.
Kleiman, D.G., R. P. Reading, B. J. Miller, T. W. Clark, J. M. Scott, J. Robinson, R. L
Wallace, R. J Cabin, and F. Felleman. 1999. Improving the evaluation of
conservation programs. Conservation Biology 14: 356–365.
65
Kleiman, D.G., M. R. Stanley Price, and B. B. Beck. 1994. Criteria for reintroductions.
P. J. S. Olney, G. M. Mace, and A. T. C. Feistner, editors. Pages 287–300 in
Creative Conservation: Interactive Management of Wild and Captive Animals.
Chapman and Hall, London, United Kingdom.
Langfred, C.W. 2000. Work-group design and autonomy: A field study of the
interaction between task interdependence and group autonomy. Small Group
Research 31: 54–70.
Likert, R. 1932. A technique for the measurement of attitudes. Archives of Psychology
140:1–55.
Lincoln, Y., and Guba, E. 1985. Naturalistic Inquiry. Sage Publishing, Newbury Park,
CA, USA.
Lipsey, M. K, and M. F. Child. 2007. Combining the fields of reintroduction biology
and restoration ecology. Conservation Biology 21: 1387–1390.
Lomolino, M. V., and R. Channell. 1995. Splendid isolation: patterns of range collapse
in endangered mammals. Journal of Mammalogy 76: 335-347.
Love, J. A. 1983. Return of the Sea Eagle. Cambridge University Press, Cambridge, UK.
Love, J. A. 2006. Sea Eagles: Naturally Scottish. Scottish Natural Heritage Publishing
Unit, Perth, UK.
Marcus, A. C., and L. A. Crane. 1986 Telephone surveys in public health research.
Medical Care 24: 97-112.
Marshall, K. B., R. White, and A. Fisher. 2007. Conflicts between humans over wildlife

66
management: on the diversity of stakeholder attitudes and implications for
conflict management. Biodiversity and Conservation 16: 3129– 3146.
McCarty, J. P. 2001. Ecological consequences of recent climate change. Conservation
Biology 15: 320–331.
Morris, P. A. 1986. An introduction to reintroductions. Mammal Review 16: 49–52.
Mudge, G., K. Duffy, K. Thompson, and J. A. Love. 1996. Naturally Scottish: Sea
Eagles. Scottish Natural Heritage Design and Publications, Perth, UK.
National Research Council (NRC) Committee on Scientific Issues in the Endangered
Species Act. 1995. Science and the Endangered Species Act. National Academies
Press, Washington, DC, USA.
Nichols, J. D., and B. K. Williams. 2006. Monitoring for conservation. Trends in
Ecology and Evolution 21: 668–673.
Ostermann, S. D., J. R. Deforge, W. D. Edge. 2001. Captive breeding and reintroduction
evaluation criteria: a case study of peninsular bighorn sheep. Conservation
Biology 15: 749–760.
Phillips, D. 2006. Relationships are the core value for organisations: A practitioner
perspective. Corporate Communications: An International Journal 11: 34–42.
Pullin, A. S., and G. B. Stewart. 2006. Guidelines for systematic review in conservation
and environmental management. Conservation Biology 20: 1647–1656.
Qualtrics Online Survey Software. 2009. Available from http://www.qualtrics.com
(accessed March 2009).
Reading, R. P., and S. R. Kellert. 1993. Attitudes toward a proposed reintroduction of
67
black-footed ferrets (Mustela nigripes). Conservation Biology 7: 569–580.
Roch, S. G., and L. A. McNall. 2007. An investigation of factors influencing
accountability and performance ratings. The Journal of Psychology 141: 499–
523.
Royal Society for the Protection of Birds (RSPB). 2005. Information: White-tailed eagle.
Royal Society for the Protection of Birds, Scotland Headquarters, Edinburgh,
Scotland, UK.
Royal Society for the Protection of Birds (RSPB). 2006. White-tailed eagles. Royal
Society for the Protection of Birds, Scotland Headquarters, Edinburgh, Scotland,
UK.
Royal Society for the Protection of Birds (RSPB). 2007. Sea eagle project Newsletter
2007. Royal Society for the Protection of Birds, Scotland Headquarters,
Edinburgh, Scotland, UK.
Royal Society for the Protection of Birds (RSPB). 2008. About Us. Available from
http://www.rspb.org/about/index.asp (accessed February 2007).
Russell, R. D., and C. J. Russell. 1992. An examination of the effects of organizational
norms, organizational structure, and environmental uncertainty on
entrepreneurial strategy. Journal of Management 18: 639–656.
Sarrazin, F., and R. Barbault. 1996. Reintroduction: challenges and lessons for basic
ecology. Trends in Ecology and Evolution 11: 474–478.
Scott, J. M., D. Murray, and B. Griffith. 1999. Lynx reintroduction. Science 286: 49–51.
Scottish Natural Heritage (SNH). 1995. Species Action Programme. Scottish Natural

68
Heritage, Perth, Scotland, United Kingdom.
Scottish Natural Heritage (SNH). 2007. A Five Year Species Action Framework:
Making a Difference for Scotland’s Species. Scottish Natural Heritage, Perth,
Scotland, United Kingdom.
Scottish Natural Heritage (SNH). 2008. Sea Eagles. Return of a native: reintroduction.
Available from http://www.snh.org.uk/publications/on-
line/NaturallyScottish/seaeagles/page3.asp (accessed February 2007).
Seddon, P. J., D. P. Armstrong, and R. F. Maloney. 2007. Developing the science of
reintroduction biology. Conservation Biology 21: 303–312.
Smeeton, C., and K. Weagle. 2000. The reintroduction of the swift fox Vulpes velox to
South Central Saskatchewan, Canada. Oryx 34: 171–179.
Smith, K. N., J. H. Shaw, T. Bettinger, B. Caniglia, and T. Carter. 2007. Conservation
partnerships between zoos and aquariums, federal and state agencies, and
nongovernmental organizations. Zoo Biology 26: 471–486.
Smith, R. J., R. H. J. Muir, M. J. Walpole, A. Balmford, and N. Leader-Williams. 2003.
Governance and the loss of biodiversity. Nature 426: 67–70.
Soulé, M. E. 1985. What is conservation biology? BioScience 35: 727-734.
Stake, R.E. 1995. The Art of Case Study Research. Sage Publishing, Thousand Oaks,
CA, USA.
Stanley Price, M. R. 1986. The reintroduction of the Arabian oryx: into Oman.
International Zoo Yearbook 24: 179–188.
Stanley Price, M. R. 1989. Animal Reintroductions, the Arabian Oryx into Oman.

69
Cambridge, UK: Cambridge University Press.
Stanley Price, M. R., and P. S. Soorae. 2003. Reintroductions: whence and whither?
International Zoo Yearbook 38: 61–75.
Steury, T. D., and D. L. Murray. 2004. Modeling the reintroduction of lynx to the
southern portion of its range. Biological Conservation 117: 127–141.
Sturges, J.E., and K. J. Hanrahan. 2004. Comparing telephone and face-to-face
qualitative interviewing: a research note. Qualitative Research 4: 107-118.
Teixeira, C. P., C. Schetini de Azevedo, M. Mendl, C. F. Cipreste, and R. J. Young.
2007. Revisiting translocation and reintroduction programmes: the importance of
considering stress. Animal Behaviour 73: 1–13.
Tilbury, C. 2006. Accountability via performance measurement: the case of Child
Protection Services. Australian Journal of Public Administration 65: 48–61.
Wauters, L. A., L. Somers, and A. A. Dhondt. 1997. Settlement behaviour and
population dynamics of reintroduced red squirrels Sciurus vulgaris in a park in
Antwerp, Belgium. Biological Conservation 82: 101–107.
Wolf, C. M., B. Griffith, C. Reed, and S. A. Temple. 1996. Avian and mammalian
reintroductions: update and reanalysis of 1987 survey data. Conservation Biology
10: 1142–1154.
Wolf, C. M., T. Garland Jr, and B. Griffith. 1998. Predictors of avian and mammalian
translocation success: reanalysis with phylogenetically independent contrasts.
Biological Conservation. 86: 243–255.
Yin, R. K. 2003. Case Study Research: Design and Methods. 3rd edition. Sage

70
Publishing, Thousand Oaks, CA, USA.
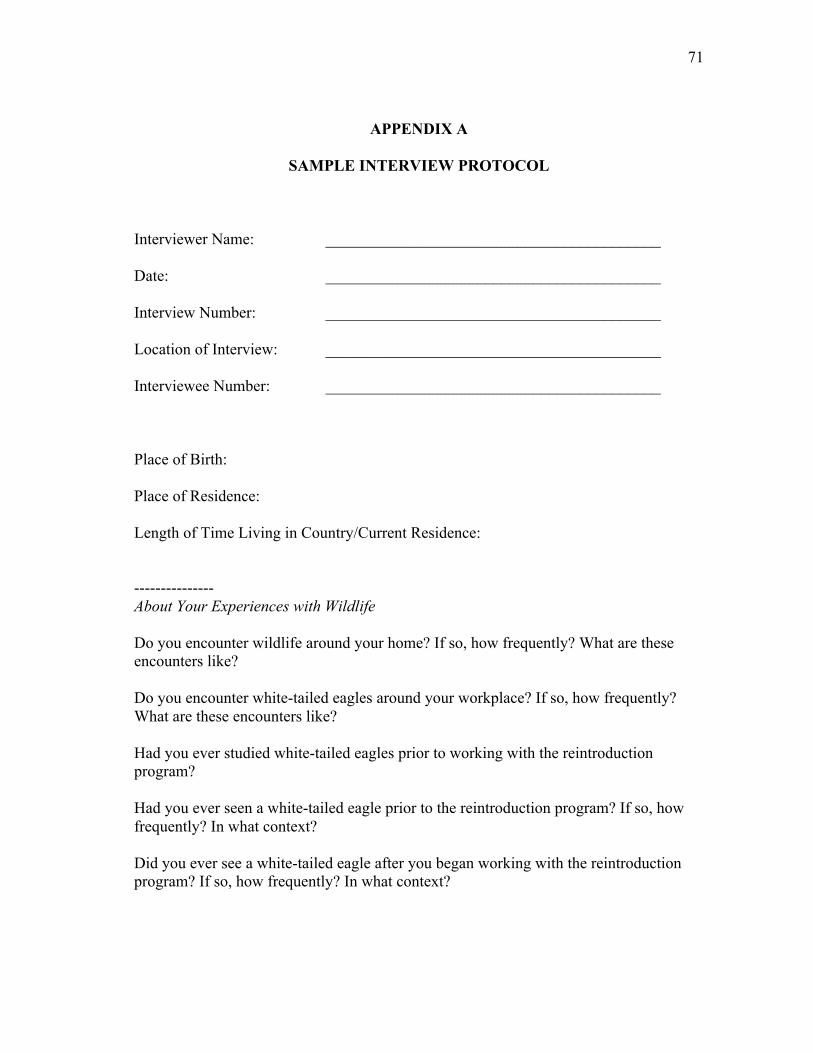
71
APPENDIX A
SAMPLE INTERVIEW PROTOCOL
Interviewer Name: __________________________________________
Date: __________________________________________
Interview Number: __________________________________________
Location of Interview: __________________________________________
Interviewee Number: __________________________________________
Place of Birth:
Place of Residence:
Length of Time Living in Country/Current Residence:
--------------- About Your Experiences with Wildlife Do you encounter wildlife around your home? If so, how frequently? What are these encounters like? Do you encounter white-tailed eagles around your workplace? If so, how frequently? What are these encounters like?
Had you ever studied white-tailed eagles prior to working with the reintroduction program?
Had you ever seen a white-tailed eagle prior to the reintroduction program? If so, how frequently? In what context? Did you ever see a white-tailed eagle after you began working with the reintroduction program? If so, how frequently? In what context?

72
Prior to the WTE, had you ever worked on or participated in any reintroduction program? During/after the WTE, did you work on or participate in any other reintroduction program? -------------- About the Reintroduction Program In which phases of the reintroduction have you been involved? [Eagle: Phase 1 – Isle of Rum; Phase 2 – Wester Ross; Phase 3 – East Coast (Fife)] [Condor: Phase 1 – Rescue/Capture and Captive Breeding; Phase 2 – Los Padres/Hopper Mountain; Phase 3 – Vermillion Cliffs; Phase 4 – Pinnacles and Today] Who was your employer during each phase of the reintroduction in which you participated? Who is your current employer? What was your job title/position during each phase of the reintroduction in which you participated? Did any other people hold your same position during your time working with the reintroduction? To whom were you responsible while you held this position? What were their positions? Under which entities were they employed? Were you ever responsible for any employees/volunteers while you held this position? What were their positions? Under which entities were they employed? Approximately how many other people were employed to work on the reintroduction under your same entity? Have you participated in or been present at any releases? If so, which ones? ------------------ About the Organizational Structure and Decision-Making Process What was the organizational structure of the reintroduction program like? Has it changed since you began working on the reintroduction? If so, in what ways? How many levels of management existed? What was the highest level of management/responsibility?
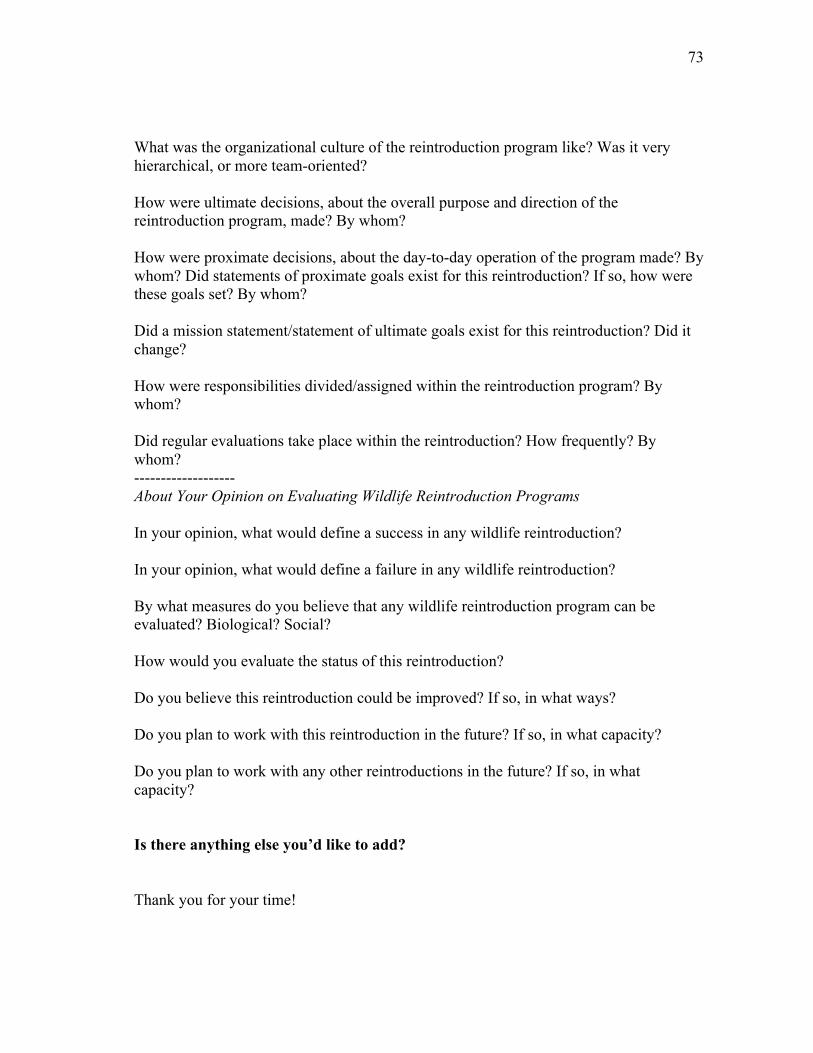
73
What was the organizational culture of the reintroduction program like? Was it very hierarchical, or more team-oriented? How were ultimate decisions, about the overall purpose and direction of the reintroduction program, made? By whom? How were proximate decisions, about the day-to-day operation of the program made? By whom? Did statements of proximate goals exist for this reintroduction? If so, how were these goals set? By whom? Did a mission statement/statement of ultimate goals exist for this reintroduction? Did it change? How were responsibilities divided/assigned within the reintroduction program? By whom? Did regular evaluations take place within the reintroduction? How frequently? By whom? ------------------- About Your Opinion on Evaluating Wildlife Reintroduction Programs In your opinion, what would define a success in any wildlife reintroduction? In your opinion, what would define a failure in any wildlife reintroduction? By what measures do you believe that any wildlife reintroduction program can be evaluated? Biological? Social? How would you evaluate the status of this reintroduction? Do you believe this reintroduction could be improved? If so, in what ways? Do you plan to work with this reintroduction in the future? If so, in what capacity? Do you plan to work with any other reintroductions in the future? If so, in what capacity? Is there anything else you’d like to add? Thank you for your time!

74
APPENDIX B
LEADERSHIP AND MANAGEMENT OF WILDLIFE REINTRODUCTIONS
SURVEY RESULTS
1. Approximately how long was the “planning phase” of your reintroduction project? This refers to the length of time that it took to conceive and plan the reintroduction project.
# Answer Response % 1 1 - 3 months 1 3% 2 4 - 8 months 1 3% 3 9 months - 1 year 7 19% 4 1 - 3 years 15 41% 5 4+ years 13 35% Total 37 100% Statistic Value Mean 4.03 Variance 0.92 Standard Deviation 0.96 Total Responses 37 2. Approximately how long was the “approval phase” of your reintroduction project? This refers to the length of time that it took to gain permission from government agencies or leading organizations to reintroduce this species.
# Answer Response % 1 1-3 months 8 22% 2 4 - 8 months 2 5% 3 9 months - 1 year 10 27% 4 1 - 3 years 12 32% 5 4+ years 5 14% Total 37 100%
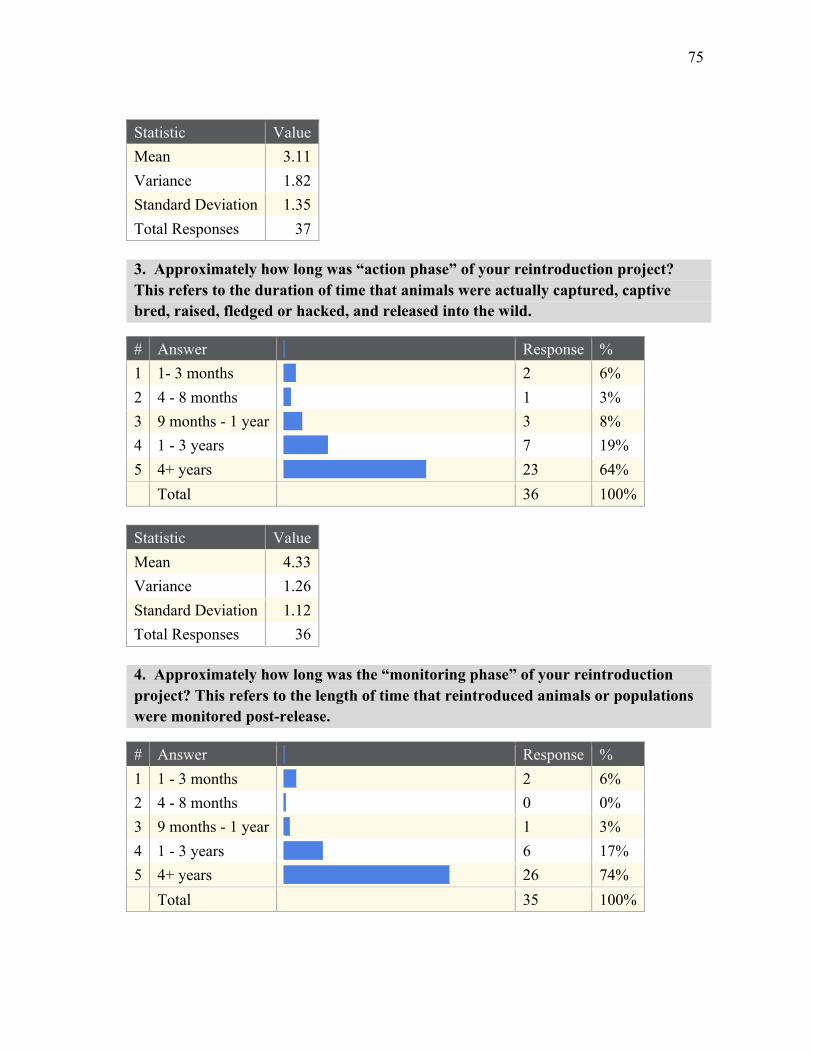
75
Statistic Value Mean 3.11 Variance 1.82 Standard Deviation 1.35 Total Responses 37 3. Approximately how long was “action phase” of your reintroduction project? This refers to the duration of time that animals were actually captured, captive bred, raised, fledged or hacked, and released into the wild.
# Answer Response % 1 1- 3 months 2 6% 2 4 - 8 months 1 3% 3 9 months - 1 year 3 8% 4 1 - 3 years 7 19% 5 4+ years 23 64% Total 36 100% Statistic Value Mean 4.33 Variance 1.26 Standard Deviation 1.12 Total Responses 36 4. Approximately how long was the “monitoring phase” of your reintroduction project? This refers to the length of time that reintroduced animals or populations were monitored post-release.
# Answer Response % 1 1 - 3 months 2 6% 2 4 - 8 months 0 0% 3 9 months - 1 year 1 3% 4 1 - 3 years 6 17% 5 4+ years 26 74% Total 35 100%
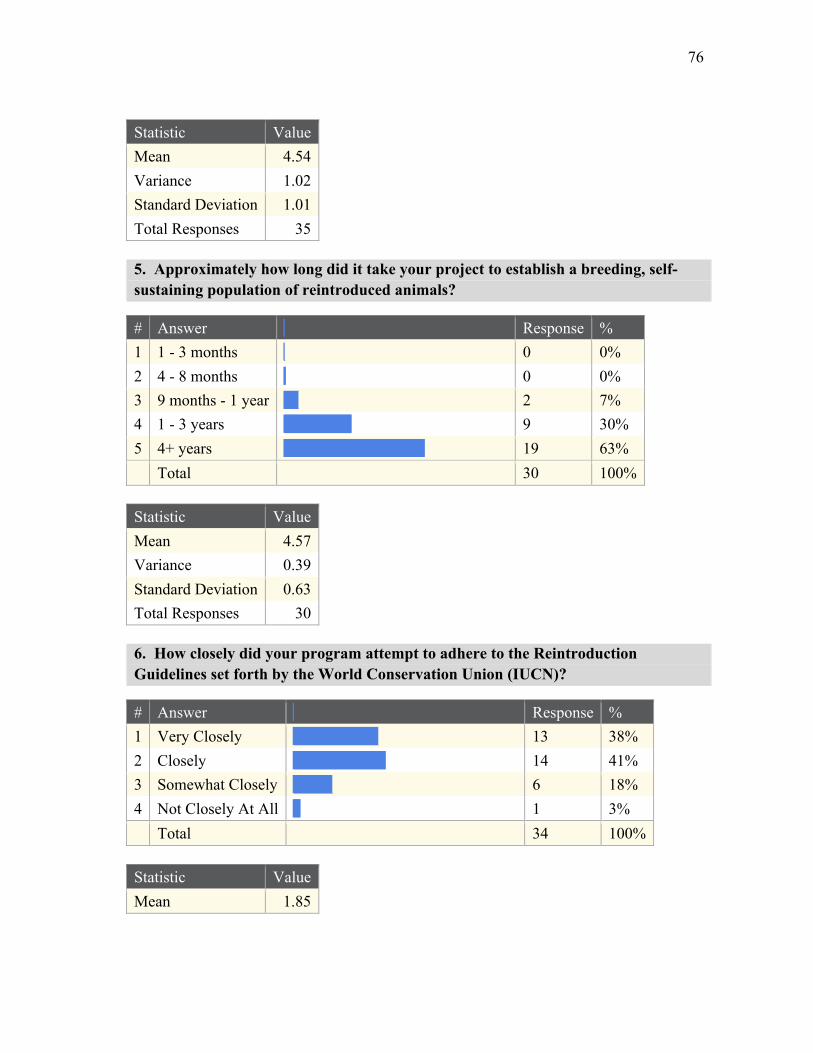
76
Statistic Value Mean 4.54 Variance 1.02 Standard Deviation 1.01 Total Responses 35 5. Approximately how long did it take your project to establish a breeding, self-sustaining population of reintroduced animals?
# Answer Response % 1 1 - 3 months 0 0% 2 4 - 8 months 0 0% 3 9 months - 1 year 2 7% 4 1 - 3 years 9 30% 5 4+ years 19 63% Total 30 100% Statistic Value Mean 4.57 Variance 0.39 Standard Deviation 0.63 Total Responses 30 6. How closely did your program attempt to adhere to the Reintroduction Guidelines set forth by the World Conservation Union (IUCN)?
# Answer Response % 1 Very Closely 13 38% 2 Closely 14 41% 3 Somewhat Closely 6 18% 4 Not Closely At All 1 3% Total 34 100% Statistic Value Mean 1.85
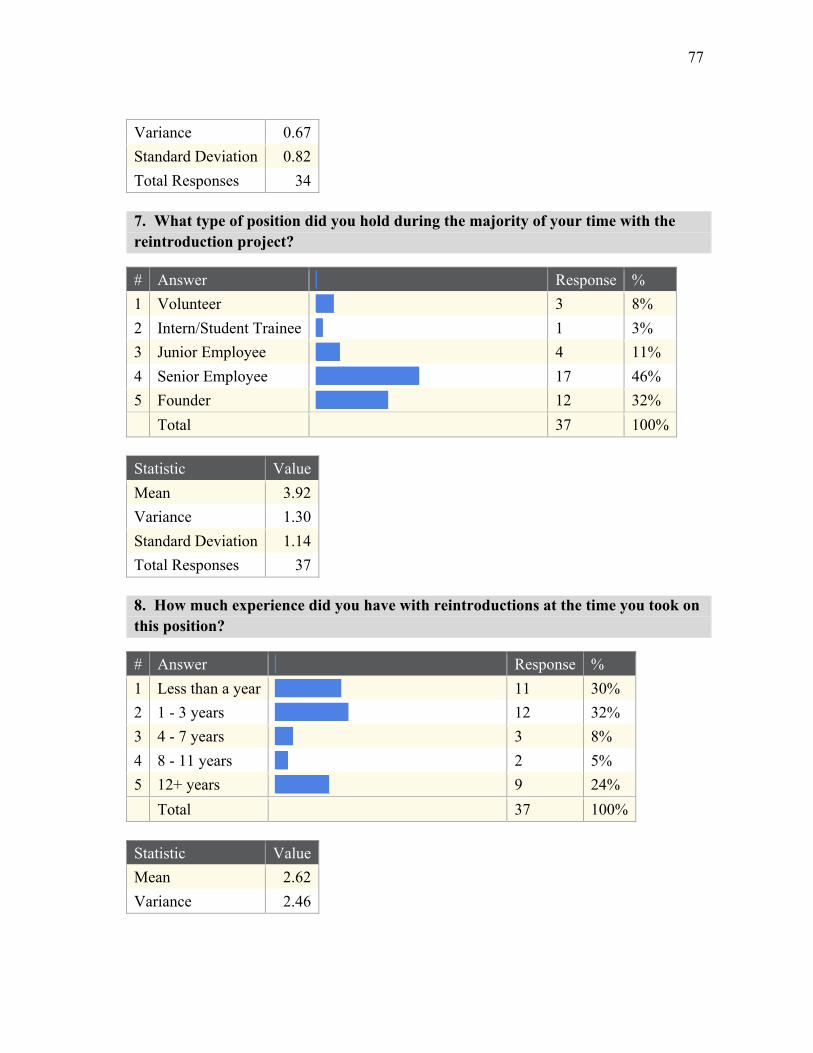
77
Variance 0.67 Standard Deviation 0.82 Total Responses 34 7. What type of position did you hold during the majority of your time with the reintroduction project?
# Answer Response % 1 Volunteer 3 8% 2 Intern/Student Trainee 1 3% 3 Junior Employee 4 11% 4 Senior Employee 17 46% 5 Founder 12 32% Total 37 100% Statistic Value Mean 3.92 Variance 1.30 Standard Deviation 1.14 Total Responses 37 8. How much experience did you have with reintroductions at the time you took on this position?
# Answer Response % 1 Less than a year 11 30% 2 1 - 3 years 12 32% 3 4 - 7 years 3 8% 4 8 - 11 years 2 5% 5 12+ years 9 24% Total 37 100% Statistic Value Mean 2.62 Variance 2.46

78
Standard Deviation 1.57 Total Responses 37 9. What was the primary responsibility of your position?
# Answer Response % 1 Administrative work 1 3% 2 Fieldwork 12 32% 3 Supervisory work 16 43% 4 Public Relations work 1 3% 5 Other 7 19% Total 37 100% Statistic Value Mean 3.03 Variance 1.25 Standard Deviation 1.12 Total Responses 37 10. How frequently were these responsibilities shared with coworkers?
# Answer Response % 1 Never 2 5% 2 Rarely 5 14% 3 Occasionally 5 14% 4 Frequently 17 46% 5 Always 8 22% Total 37 100% Statistic Value Mean 3.65 Variance 1.29 Standard Deviation 1.14 Total Responses 37

79
11. How frequently were these responsibilities monitored directly by supervisors?
# Answer Response % 1 Never 6 16% 2 Rarely 16 43% 3 Occasionally 3 8% 4 Frequently 5 14% 5 Always 7 19% Total 37 100% Statistic Value Mean 2.76 Variance 1.97 Standard Deviation 1.40 Total Responses 37 12. How frequently were these responsibilities monitored indirectly by supervisors?
# Answer Response % 1 Never 4 11% 2 Rarely 11 31% 3 Occasionally 7 19% 4 Frequently 7 19% 5 Always 7 19% Total 36 100% Statistic Value Mean 3.06 Variance 1.77 Standard Deviation 1.33 Total Responses 36

80
13. How frequently was your performance evaluated by supervisors?
# Answer Response % 1 Daily 1 3% 2 Weekly 1 3% 3 Monthly 3 9% 4 Seasonally 10 30% 5 Annually 18 55% Total 33 100% Statistic Value Mean 4.30 Variance 0.97 Standard Deviation 0.98 Total Responses 33 14. How autonomous was your position within the reintroduction project?"Autonomy" refers to the ability of a staff member to operate independent of direct supervision, and to make decisions which may influence the outcome of the reintroduction without first processing the action through a bureaucratic procedure.
# Answer Response % 1 Not Autonomous 2 5% 2 Somewhat Autonomous 12 32% 3 Autonomous 8 22% 4 Very Autonomous 10 27% 5 Completely Autonomous 5 14% Total 37 100% Statistic Value Mean 3.11 Variance 1.38 Standard Deviation 1.17 Total Responses 37

81
15. Approximately how many employees of each type did your project have? As stated above, “junior” refers to positions such as or equivalent to: interns, seasonal hires, contract, short-term and entry-level employees. “Senior” refers to positions such as or equivalent to salaried team members, consultants, administrators, coordinators, executives and managers.
# Question none 1 - 3 4 - 7 8 - 11 12+ Responses Mean 1 Full-time Senior Staff 4 21 5 1 1 32 2.19 2 Full-time Junior Staff 5 13 6 0 2 26 2.27 3 Full-time Volunteer 15 5 4 0 0 24 1.54 4 Part-time Senior Staff 6 13 3 1 0 23 1.96 5 Part-time Junior Staff 7 11 2 1 1 22 2.00 6 Part-time Volunteer 3 10 3 4 9 29 3.21
Statistic Full-time Senior Staff
Full-time Junior Staff
Full-time Volunteer
Part-time Senior Staff
Part-time Junior Staff
Part-time Volunteer
Mean 2.19 2.27 1.54 1.96 2.00 3.21 Variance 0.67 1.08 0.61 0.59 1.05 2.17 Standard Deviation 0.82 1.04 0.78 0.77 1.02 1.47
Total Responses 32 26 24 23 22 29
16. Approximately many levels of authority existed between the most junior employee and the most senior employee in your project? A “level of authority” refers to one employee acting in a direct or indirect supervisory, administrative, or managerial role to another employee.
# Answer Response % 1 Equal authority 0 0% 2 1 level 14 42% 3 2 levels 9 27% 4 3 levels 7 21% 5 4+ levels 3 9% Total 33 100%
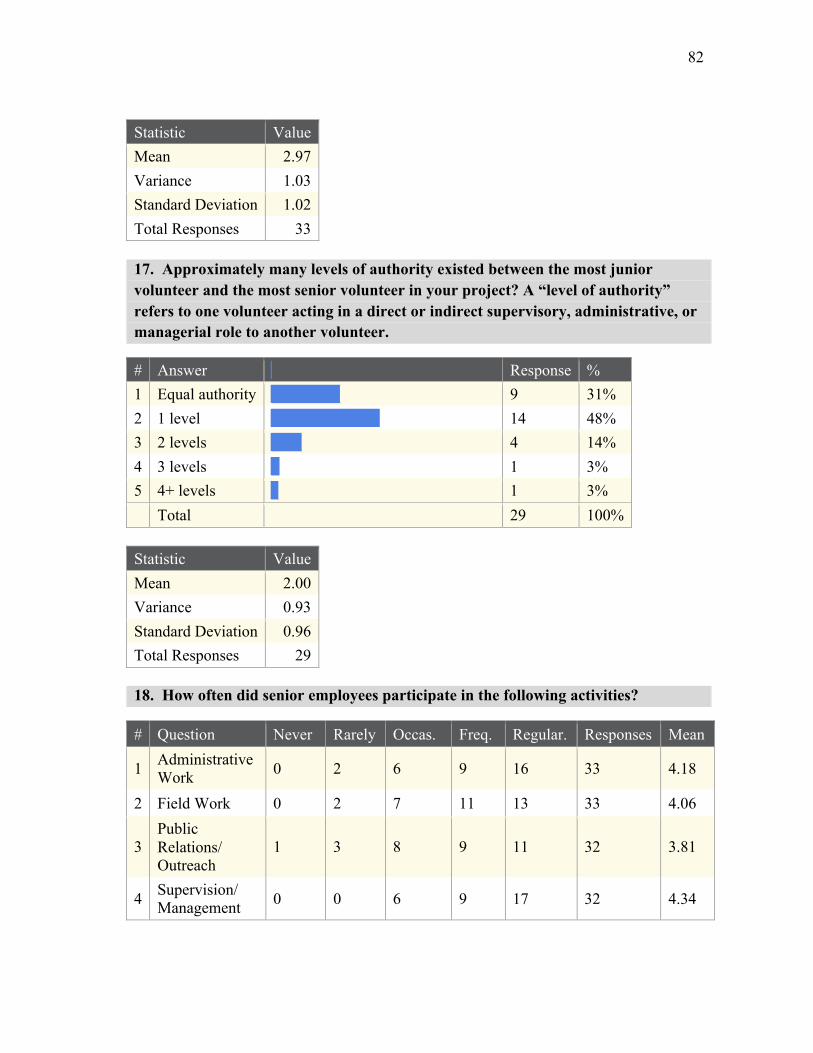
82
Statistic Value Mean 2.97 Variance 1.03 Standard Deviation 1.02 Total Responses 33 17. Approximately many levels of authority existed between the most junior volunteer and the most senior volunteer in your project? A “level of authority” refers to one volunteer acting in a direct or indirect supervisory, administrative, or managerial role to another volunteer.
# Answer Response % 1 Equal authority 9 31% 2 1 level 14 48% 3 2 levels 4 14% 4 3 levels 1 3% 5 4+ levels 1 3% Total 29 100% Statistic Value Mean 2.00 Variance 0.93 Standard Deviation 0.96 Total Responses 29 18. How often did senior employees participate in the following activities?
# Question Never Rarely Occas. Freq. Regular. Responses Mean
1 Administrative Work 0 2 6 9 16 33 4.18
2 Field Work 0 2 7 11 13 33 4.06
3 Public Relations/ Outreach
1 3 8 9 11 32 3.81
4 Supervision/ Management 0 0 6 9 17 32 4.34
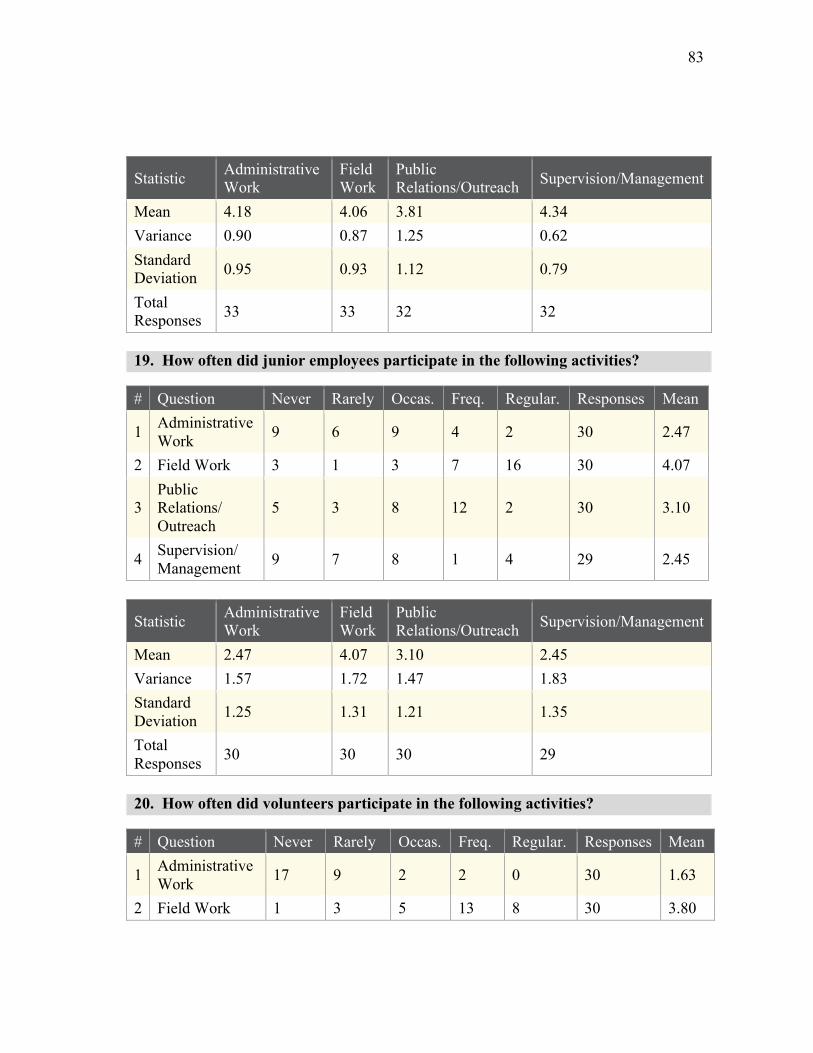
83
Statistic Administrative Work
Field Work
Public Relations/Outreach Supervision/Management
Mean 4.18 4.06 3.81 4.34 Variance 0.90 0.87 1.25 0.62 Standard Deviation 0.95 0.93 1.12 0.79
Total Responses 33 33 32 32
19. How often did junior employees participate in the following activities?
# Question Never Rarely Occas. Freq. Regular. Responses Mean
1 Administrative Work 9 6 9 4 2 30 2.47
2 Field Work 3 1 3 7 16 30 4.07
3 Public Relations/ Outreach
5 3 8 12 2 30 3.10
4 Supervision/ Management 9 7 8 1 4 29 2.45
Statistic Administrative Work
Field Work
Public Relations/Outreach Supervision/Management
Mean 2.47 4.07 3.10 2.45 Variance 1.57 1.72 1.47 1.83 Standard Deviation 1.25 1.31 1.21 1.35
Total Responses 30 30 30 29
20. How often did volunteers participate in the following activities?
# Question Never Rarely Occas. Freq. Regular. Responses Mean
1 Administrative Work 17 9 2 2 0 30 1.63
2 Field Work 1 3 5 13 8 30 3.80
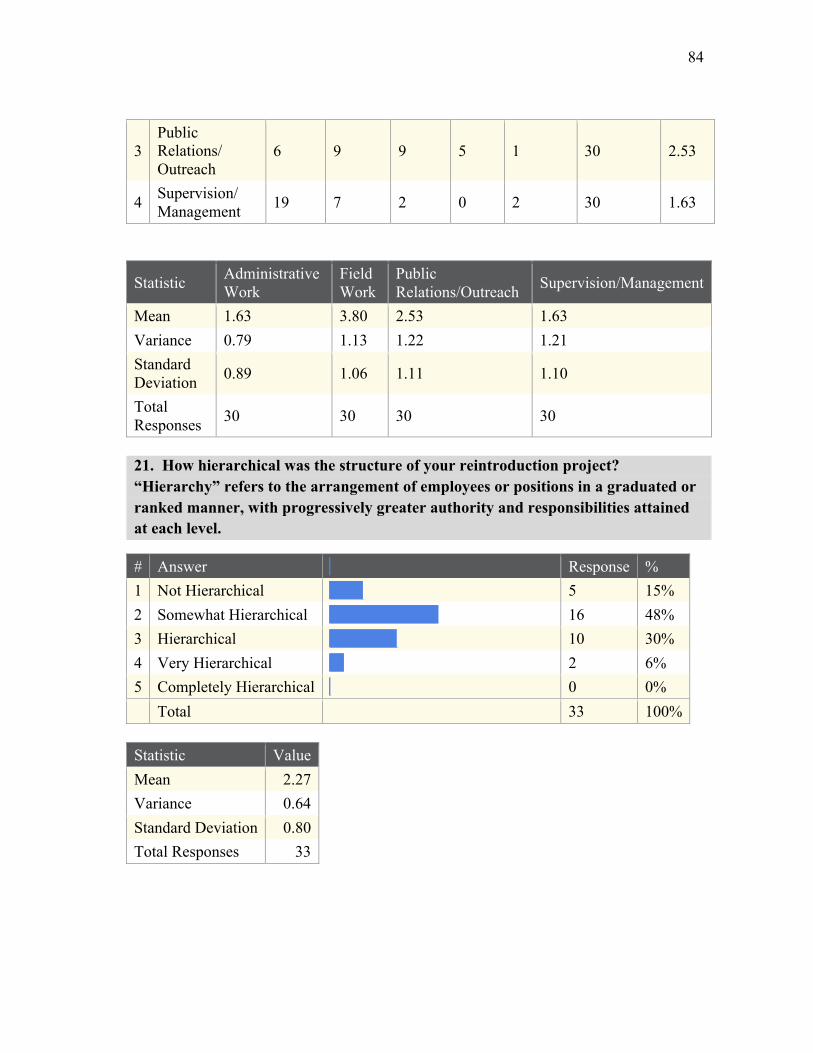
84
3 Public Relations/ Outreach
6 9 9 5 1 30 2.53
4 Supervision/ Management 19 7 2 0 2 30 1.63
Statistic Administrative Work
Field Work
Public Relations/Outreach Supervision/Management
Mean 1.63 3.80 2.53 1.63 Variance 0.79 1.13 1.22 1.21 Standard Deviation 0.89 1.06 1.11 1.10
Total Responses 30 30 30 30
21. How hierarchical was the structure of your reintroduction project? “Hierarchy” refers to the arrangement of employees or positions in a graduated or ranked manner, with progressively greater authority and responsibilities attained at each level.
# Answer Response % 1 Not Hierarchical 5 15% 2 Somewhat Hierarchical 16 48% 3 Hierarchical 10 30% 4 Very Hierarchical 2 6% 5 Completely Hierarchical 0 0% Total 33 100% Statistic Value Mean 2.27 Variance 0.64 Standard Deviation 0.80 Total Responses 33

85
22. How often were meetings held to set or discuss the long-term goals of the reintroduction project?
# Answer Response % 1 Monthly 4 12% 2 Annually 19 58% 3 Biennially 5 15% 4 One Time Only 4 12% 5 Never 1 3% Total 33 100% Statistic Value Mean 2.36 Variance 0.93 Standard Deviation 0.96 Total Responses 33 23. How often were meetings held to set or discuss the short-term goals of the reintroduction project?
# Answer Response % 1 Daily 2 6% 2 Weekly 5 15% 3 Monthly 18 55% 4 Annually 8 24% 5 Never 0 0% Total 33 100% Statistic Value Mean 2.97 Variance 0.66 Standard Deviation 0.81 Total Responses 33
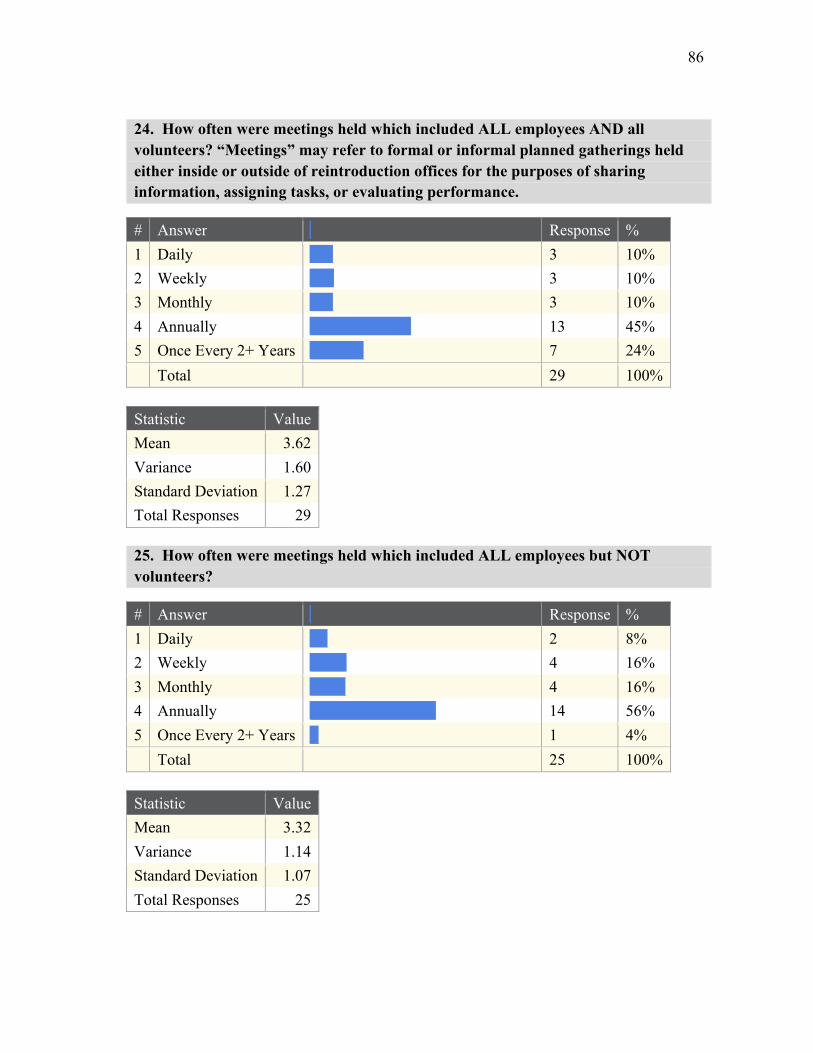
86
24. How often were meetings held which included ALL employees AND all volunteers? “Meetings” may refer to formal or informal planned gatherings held either inside or outside of reintroduction offices for the purposes of sharing information, assigning tasks, or evaluating performance.
# Answer Response % 1 Daily 3 10% 2 Weekly 3 10% 3 Monthly 3 10% 4 Annually 13 45% 5 Once Every 2+ Years 7 24% Total 29 100% Statistic Value Mean 3.62 Variance 1.60 Standard Deviation 1.27 Total Responses 29 25. How often were meetings held which included ALL employees but NOT volunteers?
# Answer Response % 1 Daily 2 8% 2 Weekly 4 16% 3 Monthly 4 16% 4 Annually 14 56% 5 Once Every 2+ Years 1 4% Total 25 100% Statistic Value Mean 3.32 Variance 1.14 Standard Deviation 1.07 Total Responses 25

87
26. How often were meetings held which included ONLY senior employees?
# Answer Response % 1 Daily 2 7% 2 Weekly 4 14% 3 Monthly 8 29% 4 Annually 12 43% 5 Once Every 2+ Years 2 7% Total 28 100% Statistic Value Mean 3.29 Variance 1.10 Standard Deviation 1.05 Total Responses 28 27. How often were staff meetings held which included ONLY junior employees?
# Answer Response % 1 Daily 0 0% 2 Weekly 3 18% 3 Monthly 5 29% 4 Annually 5 29% 5 Once Every 2+ Years 4 24% Total 17 100% Statistic Value Mean 3.59 Variance 1.13 Standard Deviation 1.06 Total Responses 17

88
28. How often were evaluations held for individual employees? “Evaluations” may be formal or informal personal meetings at which employee performance may be assessed and discussed, with another employee acting in a direct or indirect supervisory, administrative, or managerial role.
# Answer Response % 1 Weekly 0 0% 2 Monthly 2 6% 3 Annually 20 65% 4 Once Every 2+ Years 1 3% 5 Never 8 26% Total 31 100% Statistic Value Mean 3.48 Variance 0.92 Standard Deviation 0.96 Total Responses 31 29. How often were evaluations held for teams or groups of employees?
# Answer Response % 1 Weekly 0 0% 2 Monthly 2 6% 3 Annually 9 29% 4 Once Every 2+ Years 1 3% 5 Never 19 61% Total 31 100% Statistic Value Mean 4.19 Variance 1.16 Standard Deviation 1.08 Total Responses 31
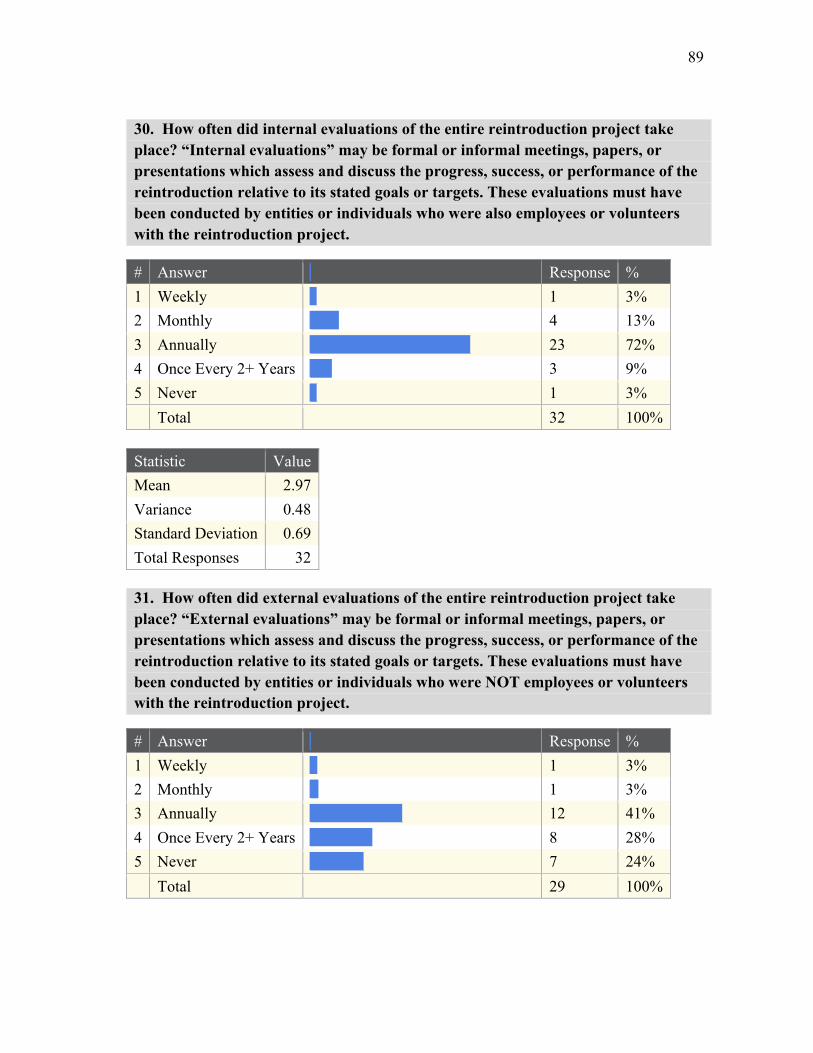
89
30. How often did internal evaluations of the entire reintroduction project take place? “Internal evaluations” may be formal or informal meetings, papers, or presentations which assess and discuss the progress, success, or performance of the reintroduction relative to its stated goals or targets. These evaluations must have been conducted by entities or individuals who were also employees or volunteers with the reintroduction project.
# Answer Response % 1 Weekly 1 3% 2 Monthly 4 13% 3 Annually 23 72% 4 Once Every 2+ Years 3 9% 5 Never 1 3% Total 32 100% Statistic Value Mean 2.97 Variance 0.48 Standard Deviation 0.69 Total Responses 32 31. How often did external evaluations of the entire reintroduction project take place? “External evaluations” may be formal or informal meetings, papers, or presentations which assess and discuss the progress, success, or performance of the reintroduction relative to its stated goals or targets. These evaluations must have been conducted by entities or individuals who were NOT employees or volunteers with the reintroduction project.
# Answer Response % 1 Weekly 1 3% 2 Monthly 1 3% 3 Annually 12 41% 4 Once Every 2+ Years 8 28% 5 Never 7 24% Total 29 100%

90
Statistic Value Mean 3.66 Variance 1.02 Standard Deviation 1.01 Total Responses 29 32. Did your project have staff dedicated exclusively to managing public relations and/or media affairs for the reintroduction?
# Answer Response % 1 No dedicated staff 23 68% 2 1 person 6 18% 3 2 - 3 people 4 12% 4 4 - 5 people 0 0% 5 6+ people 1 3% Total 34 100% Statistic Value Mean 1.53 Variance 0.86 Standard Deviation 0.93 Total Responses 34 33. Did your project have staff dedicated exclusively to managing public outreach and/or education for the reintroduction?
# Answer Response % 1 No dedicated staff 22 65% 2 1 person 7 21% 3 2 - 3 people 4 12% 4 4 - 5 people 1 3% 5 6+ people 0 0% Total 34 100%

91
Statistic Value Mean 1.53 Variance 0.68 Standard Deviation 0.83 Total Responses 34 34. Approximately how often did your reintroduction project share information about the focal species or the project itself with the public and/or media?This may refer to press releases, newsletters, announcements via email, blog, or website updates, media coverage in the form of television projects, newspaper or internet articles, or billboards, fliers and posters.
# Answer Response % 1 Daily 2 6% 2 Weekly 5 16% 3 Monthly 10 31% 4 Annually 12 38% 5 Once Every 2+ Years 3 9% Total 32 100% Statistic Value Mean 3.28 Variance 1.11 Standard Deviation 1.05 Total Responses 32

92
35. Did your project partner with any of the following types of media organizations to share information about the reintroduction project? A “partnership” may be defined as an ongoing, mutually recognized, formal or informal association between the reintroduction and one or more separate print media groups or organizations.
# Question none 1 - 2
3 - 4
5 - 6 7+ Responses Mean
1 Newspapers, magazines, or other forms of print media 9 13 8 0 2 32 2.16
2 Television/radio stations or other forms of audiovisual media 13 12 6 0 0 31 1.77
3 Websites, blogs, or other forms of internet media 13 13 5 0 1 32 1.84
Statistic Newspapers, magazines, or other forms of print media
Television/radio stations or other forms of audiovisual media
Websites, blogs, or other forms of internet media
Mean 2.16 1.77 1.84 Variance 1.10 0.58 0.85 Standard Deviation 1.05 0.76 0.92
Total Responses 32 31 32
36. Did your project partner with any of the following types of educational organizations to share information about the reintroduction project?
# Question none 1 - 2 3 - 4 5 - 6 7+ Responses Mean 1 Primary Schools 13 6 3 0 8 30 2.47 2 Secondary Schools 14 5 5 2 5 31 2.32 3 Colleges/Universities 10 12 3 3 2 30 2.17 Statistic Primary Schools Secondary Schools Colleges/Universities Mean 2.47 2.32 2.17 Variance 2.81 2.29 1.45 Standard Deviation 1.68 1.51 1.21 Total Responses 30 31 30

93
37. Did your project partner with any of the following types of non-governmental organizations to share information about the reintroduction project?
# Question none 1 - 2
3 - 4
5 - 6
7+ Responses Mean
1 International Wildlife or Conservation Organizations 11 13 6 0 1 31 1.94
2 National Wildlife or Conservation Organizations 7 14 9 1 1 32 2.22
3 Regional, Local, or Community Organizations (i.e. community improvement groups)
7 10 7 3 4 31 2.58
4 Naturalist or Local Wildlife Enthusiast Organizations 11 11 4 3 3 32 2.25
Statistic
International Wildlife or Conservation Organizations
National Wildlife or Conservation Organizations
Regional, Local, or Community Organizations (i.e. community improvement groups)
Naturalist or Local Wildlife Enthusiast Organizations
Mean 1.94 2.22 2.58 2.25 Variance 0.86 0.89 1.72 1.68 Standard Deviation 0.93 0.94 1.31 1.30
Total Responses 31 32 31 32
38. Did your project partner with any corporations or businesses?
# Answer Response % 1 none 18 56% 2 1 - 2 8 25% 3 3 - 4 4 13% 4 5 - 6 1 3% 5 7+ 1 3% Total 32 100%

94
Statistic Value Mean 1.72 Variance 1.05 Standard Deviation 1.02 Total Responses 32 39. Did your project partner with any other reintroduction projects?
# Answer Response % 1 none 18 55% 2 1 - 2 10 30% 3 3 - 4 3 9% 4 5 - 6 1 3% 5 7+ 1 3% Total 33 100% Statistic Value Mean 1.70 Variance 0.97 Standard Deviation 0.98 Total Responses 33 40. Did your project participate in any festivals, fairs, bazaars, or other forms of public leisure events to share information about the reintroduction project? “Participation” in an event refers to the scheduled appearance of a project representative, the presentation of a performance or speech, the maintenance of a booth or information table, or the active presentation of information for the recruitment of volunteers.
# Answer Response % 1 Never 13 39% 2 Rarely 4 12% 3 Occasionally 11 33% 4 Frequently 4 12% 5 Regularly 1 3% Total 33 100%
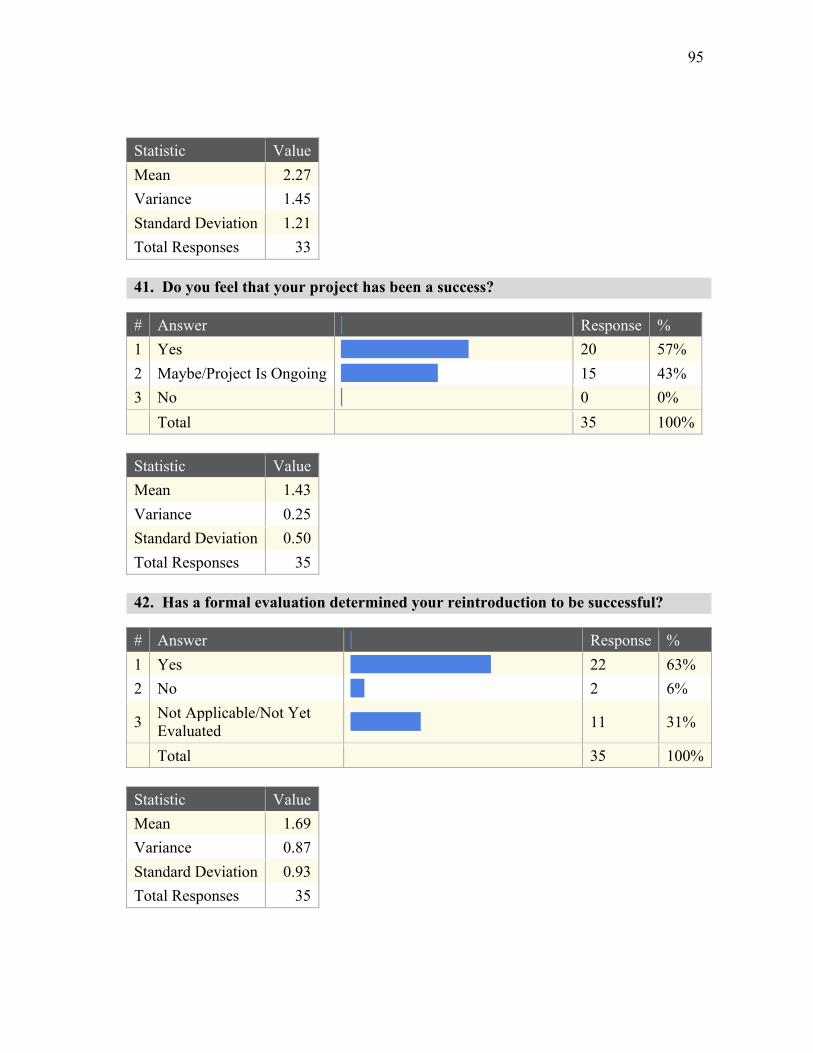
95
Statistic Value Mean 2.27 Variance 1.45 Standard Deviation 1.21 Total Responses 33 41. Do you feel that your project has been a success?
# Answer Response % 1 Yes 20 57% 2 Maybe/Project Is Ongoing 15 43% 3 No 0 0% Total 35 100% Statistic Value Mean 1.43 Variance 0.25 Standard Deviation 0.50 Total Responses 35 42. Has a formal evaluation determined your reintroduction to be successful?
# Answer Response % 1 Yes 22 63% 2 No 2 6%
3 Not Applicable/Not Yet Evaluated 11 31%
Total 35 100% Statistic Value Mean 1.69 Variance 0.87 Standard Deviation 0.93 Total Responses 35

96
43. Do you feel that your reintroduction has made good progress?
# Answer Response % 1 Yes 26 74% 2 Maybe/Project Is Ongoing 8 23% 3 No 1 3% Total 35 100% Statistic Value Mean 1.29 Variance 0.27 Standard Deviation 0.52 Total Responses 35 44. Has a formal evaluation determined your reintroduction to be making/have made good progress?
# Answer Response % 1 Yes 21 60% 2 No 5 14%
3 Not Applicable/Not Yet Evaluated 9 26%
Total 35 100% Statistic Value Mean 1.66 Variance 0.76 Standard Deviation 0.87 Total Responses 35

97
45. Do you plan to continue working with this reintroduction in the future?
# Answer Response % 1 Yes 24 71% 2 Maybe 9 26% 3 No 1 3% Total 34 100% Statistic Value Mean 1.32 Variance 0.29 Standard Deviation 0.53 Total Responses 34

98
VITA
Alexandra E. Sutton received her Bachelor of Science degree in biology from
Howard University in 2007. During her time at Howard University, she was active as
secretary of the Environmental Society, and as a member of the Ecological Society of
America’s SEEDS program. She was awarded an NSF Undergraduate Environmental
Biology Scholarship, as well as an ESA Travel Fellowship. She entered the Wildlife and
Fisheries program at Texas A&M University in September 2007, where she was
awarded a Diversity Fellowship and L.T. Jordan Institute for International Awareness
Research Fellowship. She received her Master of Science degree in August 2009. Her
research interests include reintroduction biology and conservation practices.
Ms. Sutton may be reached through the Department of Wildlife & Fisheries
Sciences, 210 Nagle Hall, Texas A&M University, College Station, TX 77843-5777 or
by email: [email protected].