Embed Size (px)
Citation preview

LEADERSHIP AND
DIVERSITY SURVEY
REPORT 2017
Board Diversity Publicly Listed Companies in Kenya
and the Influence on Financial Performance
Report Prepared by Samuel N. Njihia - Kenya Institute of Management

Kenya Institute of Management- Business Intelligence and Research i
Foreword by the Kenya Institute of Management CEO

Kenya Institute of Management- Business Intelligence and Research ii
Foreword by the Nairobi Stocks Exchange CEO

Kenya Institute of Management- Business Intelligence and Research iii
Foreword by the Graca Machel Trust

Kenya Institute of Management- Business Intelligence and Research iv
Foreword by the Barclays Bank Kenya

Kenya Institute of Management- Business Intelligence and Research v
Table of Contents
Foreword by the Kenya Institute of Management CEO ..................................................... i
Foreword by the Nairobi Stocks Exchange CEO ............................................................... ii
Foreword by the Graca Machel Trust ................................................................................ iii
Foreword by the Barclays Bank Kenya .............................................................................. iv
Table of Contents .................................................................................................................... v
List of Figures ........................................................................................................................... i
List of Tables .......................................................................................................................... iii
Executive Summary .............................................................................................................. iv
Introduction ............................................................................................................................. 1
Methodology ............................................................................................................................ 2
Findings .................................................................................................................................... 4
Global Perspective ............................................................................................................... 4
Gender diversity .............................................................................................................. 4
Age diversity .................................................................................................................... 7
Professional and educational background diversity .................................................. 9
Nationality diversity ..................................................................................................... 10
Board diversity influence on financial performance ................................................ 11
Local Perspective from our Research Findings ............................................................. 14
Gender diversity; Kenya ............................................................................................... 15
Board chair positions by gender .................................................................................. 17
Age diversity: Kenya ..................................................................................................... 20
Education diversity: Kenya .......................................................................................... 21
Professional diversity: Kenya ...................................................................................... 23
Nationality diversity: Kenya ........................................................................................ 24
Board diversity influence on financial performance ................................................ 24
Influence of Gender on Organization Performance ................................................. 25
Influence of Age on Organization Performance ....................................................... 26

Kenya Institute of Management- Business Intelligence and Research vi
Conclusion .......................................................................................................................... 28
References .............................................................................................................................. 29

i
List of Figures
Figure 1: Survey process ........................................................................................................ 2
Figure 2: Women representation in the boardroom globally by regions ........................ 5
Figure 3: Executive board positions held by women globally by region ....................... 6
Figure 4: Path to gender parity in the boardroom globally .............................................. 6
Figure 5: Average age of board directors globally by region ........................................... 7
Figure 6: Average debut age into the boardroom globally by gender ............................ 9
Figure 7: Non-nationals representation in boardrooms globally by regions ............... 10
Figure 8: Sample of 112 Fortune 1000 companies in the in the years 1993 and 1998. . 12
Figure 9: Sample of 248 companies in the years, 1998-2002 in Norway ....................... 13
Figure 10: Sample of 243 large Australian companies, in the years 2003-2006. ........... 14
Figure 11: Gender representation in NSE listed companies' boardrooms .................... 15
Figure 12: Kenya vs other countries in women boardroom representation ................. 16
Figure 13: Growth in women representation in NSE listed companies' boardrooms 16
Figure 14: Representation of female board members by sector ..................................... 17
Figure 15: Women representation in chairperson’s positions; Kenya Vs othe regions
globally ................................................................................................................................... 18
Figure 16: Women outnumbered 11 to 1 in board chairperson positions .................... 18
Figure 17: Women representation in senior management positions in Kenya's listed
companies............................................................................................................................... 19

Kenya Institute of Management- Business Intelligence and Research ii
Figure 18: Age distribution of board directors in Kenya ................................................ 20
Figure 19: Age distribution by gender of board directors in Kenya ............................. 21
Figure 20: Education diversity Kenya ................................................................................ 22
Figure 21: Education diversity in Kenya's corporate boardroom .................................. 22
Figure 22: Professional diversity in Kenya's corporate boardrooms ............................. 23
Figure 23: Non-Kenyan representation in Kenya's corporate boardrooms .................. 24

Kenya Institute of Management- Business Intelligence and Research iii
List of Tables
Table 1: Means of financial performance by gender representation ............................. 25
Table 3: Results of test of means difference between performance of one-quarter
gender rule compliance and non-compliance ................................................................... 25
Table 3: Means of financial performance by age dispersion ........................................... 26
Table 5: Results of test of means difference between performance of age dispersion 27

Kenya Institute of Management- Business Intelligence and Research iv
Executive Summary
Kenya Institute of Management (KIM) has tracked diversity in board rooms
especially on the gender composition through the board diversity survey since 2012.
Together with other partners including the Nairobi Securities Exchange and The
Graca Marcel trust, the 2017 survey is the most comprehensive yet in terms of the
focus areas as it measures diversity beyond gender and includes age, education,
profession and nationality diversity.
To achieve this, quantitative and qualitative data for the Kenyan companies was
collected from both primary sources especially Company Secretaries within listed
organizations in Kenya and secondary sources including annual reports, press
releases, webpages. Data for comparative analysis from other markets was sought
from research elsewhere in the globe by executive search firms like Egon Zehnder
and Equillar, audit firms like Deloitte and PWC and research institutions like
Catalyst.
High level findings show that gender diversity is still a mirage in many countries
globally but there definitely exist concerted efforts to address this. No market among
those surveyed or compared with had achieved a 50:50 gender balance in the
boardroom-in fact Kenya was a trailblazer in not only developing markets but even
in comparison to advance markets.
Age diversity was also far from being achieved with most boardrooms recording
average age of 56 years which is 3 years younger than the global average 59 years
and compares even better than developed markets like the Americas (US and
Canada). Education diversity was also not high with a first degree possession
seemingly a requisite for securing board position and a Master’s degree for at least
half of the board members in review.

Kenya Institute of Management- Business Intelligence and Research v
In Kenya, when it came to professions, finance based career people were more
present in the boardrooms than any other professions with accountants, auditors,
bankers, and investment sector professionals taking over 40% of the slots. Legal
professionals and business management professionals also had high representation.
Science technology engineering and mathematics (STEM) based careers had less than
10% representation in the board room.
Nationality diversity in Kenya was also measured and 62% of the listed companies
had at least one non-Kenyan in their board which compares with the 74% global
average.
On board diversity influence on corporate performance, gender diversity when
female representation is at least 25% was found to have a positive influence on the
organizations’ compounded annual growth rate of assets and revenues

1
Introduction
Since 2012, the Kenya Institute of Management (KIM) has tracked diversity in board
rooms especially on the gender composition through the board diversity survey.
We have analyzed board composition in corporate Kenya and also the Kenyan
public service and compared the same to global trends in a bid to diversity and the
role it plays in among other things, financial performance, social impact and investor
confidence. As champions of best practice in matters of governance and
management, we initially interrogated the gender diversity in the board, then went
on to incorporate other diversity variables like age and we have now gone a step
further to include education levels, professional background and nationality.
Our 2016/2017 has also gone a step further to explore the extent to which some
countries have been able to transform their boards to better represent the society
around them, and reveals the continuing challenges in gaining parity in the
boardroom. Our 2017 survey is therefore the most comprehensive to date,
evaluating board data from 62 publicly listed companies in Kenya.
The survey took about two (2) years to complete mostly because of the challenge in
data collection occasioned by non-responsiveness to our efforts to collect primary
data from company secretaries and other company representatives. The 2015 board
diversity data came from our partners for this initiative New Faces New Voices
while the share price data came from NSE.

Kenya Institute of Management- Business Intelligence and Research 2
Methodology
The board composition variables data was collected through both primary and
secondary data sources. Primary data collection tools were designed and sent to NSE
listed company’s representatives including company secretaries, CEO’s and human
capital departments.
The difficulties in getting these representatives submit board data to us prompted us
to seek the same from secondary sources and this was done through content analysis
of print media publications and web content analysis of the targeted organizations’.
Data was collected on both variables of interest on board composition and financial
performance data including profits, turnover, assets and share price performance
over a four year period (2013- 2016).
Figure 1: Survey process

Kenya Institute of Management- Business Intelligence and Research 3
At the analysis stage, we conducted various relationship analysis to investigate the
association between board diversity variables and financial performance.
Independent T-tests were performed to determine whether organizations with
broader reflection of gender, age, education and professional background companies
have higher performance than their counterparts with limited representation. Then
the econometric model was regressed to investigate associations between various
diversity indicators including gender, age and education level against performance
measured by compound annual growth rate in the four years between 2013 and 2016
the latest year with available financial performance data. The regression approach
also helped to determine if there existed a significant relationship between board
diversity and performance. The study hypothesized that there is a significant
relationship between board diversity and organizational performance.

Kenya Institute of Management- Business Intelligence and Research 4
Findings
Global Perspective
Across the globe, conversation on diversity in the boardroom continues to gather
momentum. Data now exists on gender diversity in board rooms but other diversity
variables like age, education level and professional background remain largely un-
researched.
Gender diversity
Egon Zehnder1 2016 survey of 1,491 public companies with market caps exceeding
EUR 6bn across 44 countries* shows that gender parity in the boardroom continues
on an upward trajectory, with slow but positive progress – in 2016, nearly 19% of
seats on the boards of the largest companies globally were held by women, up from
about 14% in 2012, with 3% of this growth coming in just the last two years.
According to the report, the biggest improvement in board diversity came from
Western Europe. When Egon Zehnder began analyzing board diversity in Western
Europe in 2004, just 8% of board directors were female; in 2016, 26% of all board
directors in this region were women.
1 Egon Zehnder (2016). Global Board Diversity Analysis 2016. Egon Zehnder International, Inc. All
rights reserved.

Kenya Institute of Management- Business Intelligence and Research 5
Figure 2: Women representation in the boardroom globally by regions
Over the time period studied, Western Europe accelerated the growth of diversity
gains, with a third of this growth occurring in just the last two years. The boards of
some countries like Italy and France have been literally transformed: Since
government-enforced quotas were passed in 2011, the share of women on the boards
in Italy has increased from 8 to 32%, and in France from 21 to 38% in just four years.
Also noteworthy from the Egon Zehnder report, is that women have yet to reach the
same representation in board leadership roles and presence in executive board seats
(usually made up of CEOs and CFOs).

Kenya Institute of Management- Business Intelligence and Research 6
Figure 3: Executive board positions held by women globally by region
Only 5% of executive board roles were held by women, versus 22% of non-executive
roles. Yet, women are making progress in board contributions by holding an
increasing share of Committee and Committee Chair positions (20% and 16%,
respectively).
Another survey by Equilar a leading provider of board intelligence solutions
predicts that at the current rate, gender parity would be achieved in 2055.
Source: Equilar 2017
Figure 4: Path to gender parity in the boardroom globally
8%
6%5%
0%
9%
4%
2%
5%
Western
Europe
Eastern
Europe
US & Canada Other
Americas
Middle-East
and Africa
Asia Australasia
2012 2014 2016
% Executive board positions held by women
Global
Overall

Kenya Institute of Management- Business Intelligence and Research 7
Age diversity
A number of notable surveys from credible sources (Financial Times, Harvard
Business Review, Egon Zehnder, Deloitte et al) concede that age diversity at the top
is progressing at a nonagenarian’s pace. According to the same report, newly
appointed board members are broadening age diversity according to the recent data.
Nearly 9% of all new board members appointed since 2015 are under 45, and new
female board members are more likely than males to be under 45 – 11% to 8%,
respectively. The countries bringing the largest pool of young directors onto boards
are those in Western Europe where quotas have been instituted: France, Spain and
Italy.
Figure 5: Average age of board directors globally by region

Kenya Institute of Management- Business Intelligence and Research 8
The average entry age into the boardroom averaged 50 years globally. A significant
difference in entry age between the genders was noted with female board members
entering as 48 years while their male counterpart had to wait until they are 52 years.
An article appearing in the Huffington Post in May 2017 notes that, “The lack of
Millennials in the boardroom poses a real risk, not just to businesses, but to society
as a whole. Millennials - aged 18-35 - make up the world’s biggest demographic
group and are expected to make up 50% of the workforce by 2020. They are
unknowingly dictating the direction of change - be it in the context of technology or
business strategy and models - and so it is essential for us to take their experiences,
knowledge and expectations into account when making decisions on the direction of
our own businesses.”
Kenya Institute of Management- Business Intelligence and Research 9
Figure 6: Average debut age into the boardroom globally by gender
Financial Times (2017) also notes that, “Age does get neglected; almost everything
other than gender equality on boards can get a bit overlooked.” It’s also instructive
to note that the early entry age of women in the boardroom is characterized by
appointments to company executive positions.
Professional and educational background diversity
No data was found elsewhere in the globe on the distribution of various professions
and education level in the board room making the research in Kenya one of a kind.

Kenya Institute of Management- Business Intelligence and Research 10
Nationality diversity
Further according to the EZ report, diversity of nationality is also trending as
expansive viewpoints, experience and knowledge gained from working across
cultures and geographies increase in importance. Globally, international
representation is less common than gender diversity. Seventy percent of companies
studied have at least one non-national director, compared with 84% that have at least
one female director. Yet, 25% of the director seats we surveyed were held by non-
nationals, compared with 19% held by women. While no country has more than 40%
of its director seats held by women, there are 13 countries where more than 40% of
the director seats are held by non-nationals like the UK, United Arab Emirates and
Hong Kong.
Figure 7: Non-nationals representation in boardrooms globally by regions

Kenya Institute of Management- Business Intelligence and Research 11
International diversity is often a by-product of other factors like local geography.
U.S. boards are drawn from relatively insular networks with 11% non-nationals
compared to the global average of 25%. On the other hand, Western Europe has a
high level of non-national directors as do the Middle East and Africa due to the
fluidity of cross-border labor markets making it easier to move jobs from one
country to another.
Board diversity influence on financial performance
Globally, the Corporate Governance Research Initiative of the Stanford Graduate
School of Business has comprehensively reviewed board diversity influence on a
number of corporate outcomes in and below are the highlights;
They first note that, research evidence on board diversity and corporate outcomes is
highly mixed. Further they cite, Erhardt, Werbel, and Shrader (2003) examination of
the relationship between diverse boards and firm performance through a Sample of
112 companies in the Fortune 1000, 1993 and 1998.
They measured operating performance (ROA and ROI) at five-year intervals to
determine whether an increase in board diversity (gender and ethnicity) is
associated with an improvement in operating results. They found a positive
association between diversity and performance and concluded that diverse boards
improve corporate performance as illustrated below;

Kenya Institute of Management- Business Intelligence and Research 12
Figure 8: Sample of 112 Fortune 1000 companies in the in the years 1993 and 1998.
Another study by Ahern and Dittmar (2012) in Norway on the impact of gender
quotas on governance quality and performance sampled 248 companies in between
2001-2009. A 2003 law required 40% of Norwegian directors to be female (up from
9% prior). They found that: board composition changed dramatically in terms of
gender representation and also age, education, and experience with the law coming
into effect, new female directors were younger and less experienced and the quota
associated with significant decreases in firm value (Tobin’s Q). They concluded that
diversity quotas harm governance quality and firm value.
High in gender
diversity
High in ethnic
diversity
Increase in ROA
Increase in ROI
Source: Stanford Graduate School of Business
(2003)

Kenya Institute of Management- Business Intelligence and Research 13
Figure 9: Sample of 248 companies in the years, 1998-2002 in Norway
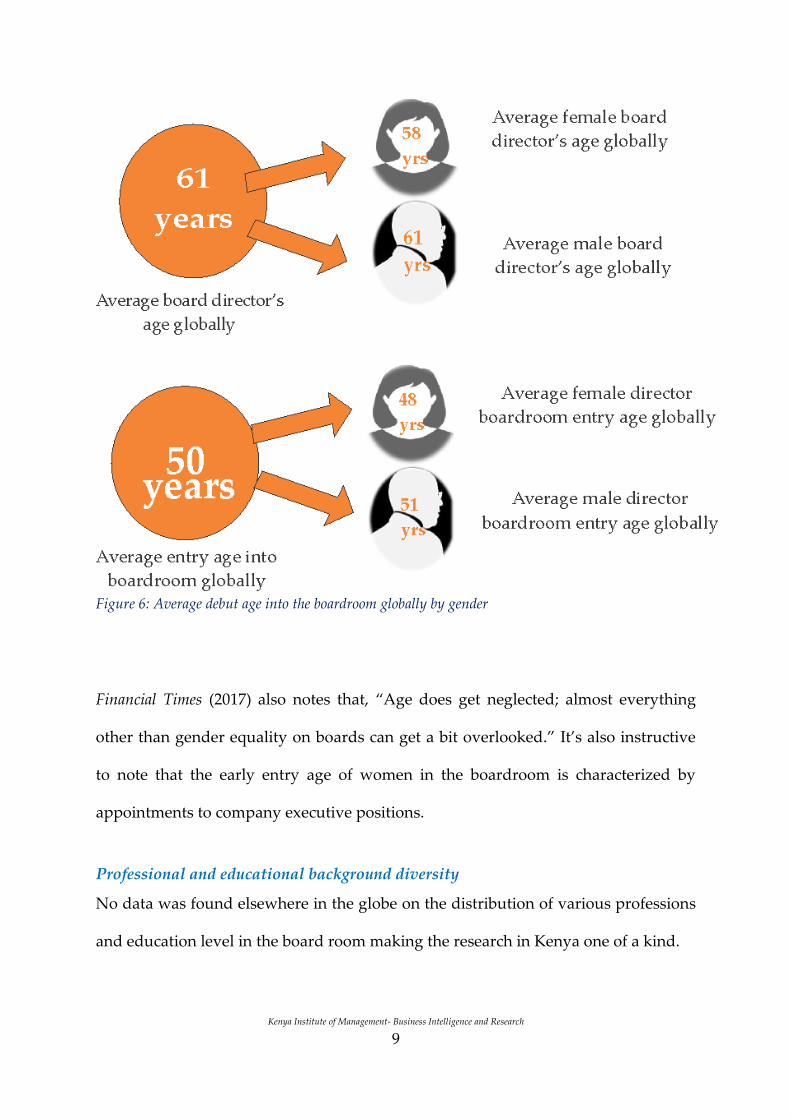
Yet another study by Wang and Clift (2009) in Australia examined the relationship
between diverse boards and firm performance in an international setting. A sample
of 243 large Australian companies, in the years 2003-2006. Gender and ethnic
diversity were tested separately. The relationship between boardroom diversity and
subsequent operating performance (ROA, ROE, and total shareholder returns) were
measured. They found no association between gender diversity and performance
and no association between ethnic diversity and performance. Conclusion: diversity
has no impact on corporate performance.
Statutory Board
diversityquotas
Are
Harmful
Governance quality and firm value
Kenya Institute of Management- Business Intelligence and Research 14
Figure 10: Sample of 243 large Australian companies, in the years 2003-2006.
The Stanford review of the relationship between boardroom diversity and corporate
performance concludes that it’s not conclusive. Research evidence is highly mixed,
some studies have found positive, others neutral, and yet others negative effects.
They note that “Diversity for the sake of diversity” tends to harm governance
quality, primarily when it leads to forced turnover and the appointment of less
experienced directors. They conclude that, “efforts to increase boardroom diversity
are best addressed through concerted efforts to recruit qualified professionals rather
than quotas.”
Local Perspective from our Research Findings
The efforts culminating into this report took about two years mostly because of
challenges experienced during the data collection stage. Coupled with un-responsive
respondents and unfulfilled promises to revert back from the targeted company
representatives, the data collection meant new strategies were adopted midway to
Board diversity
No
Impact
Corporate performance

Kenya Institute of Management- Business Intelligence and Research 15
aggregate the data from secondary sources including financial reports, company
webpages, press releases and even third party websites.
After all these efforts were combined, we managed to collect data from 52 out of the
targeted 62 publicly listed companies in Kenya which translated to 84% response
rate.
Gender diversity; Kenya
Women representation in listed companies’ board room stand at 21% in 2017 up
from 14% in 2012 and 18% in 2015.
Figure 11: Gender representation in NSE listed companies' boardrooms
While at 21% women representation in the board room Kenyan compares poorly
with best practice markets like Norway and Finland, the growth towards parity is
remarkable with representation going up by 50% in less than 5 years 2012-2017.

Kenya Institute of Management- Business Intelligence and Research 16
Figure 12: Kenya vs other countries in women boardroom representation
At current growth rates, gender parity in Kenya’s corporate boardroom
representation could be achieved in 10-12 years i.e. by the year 2030.
2015
2017
2012
Figure 13: Growth in women representation in NSE listed companies' boardrooms

Kenya Institute of Management- Business Intelligence and Research 17
Retail had the highest representation of female directors but only constituted >2% of
the total directors of the 52 sampled companies. Banking sector which had over 20%
of the total directors had 24% female directors’ representation.
Figure 14: Representation of female board members by sector
Sectors with the lowest female representation included Agriculture (9%), Media
(8%). Tourism and Hospitality (8%).
Board chair positions by gender
Board chairperson’s positions are also heavily skewed towards the male gender with
women chair at 7.7%; only 4 companies out of the 52 had female chairpersons. This
however compares better to the global average of 4% and also other advanced
markets like the US, Canada and Europe both Eastern and Western. In fact, Kenya is
trailblazing here

Kenya Institute of Management- Business Intelligence and Research 18
Figure 15: Women representation in chairperson’s positions; Kenya Vs othe regions globally
This is unchanged between 2012, 2015 and 2017 where in these 3 intervening
periods, female chair representation stood at ≈8%.
Figure 16: Women outnumbered 11 to 1 in board chairperson positions
While it may seem Kenya is leading the pack globally in women presence in board
chair positions, it’s far from attaining gender parity in the same area. In fact the
situation has not improved in the last 5 years since 2012.
1.5%
2.2%
2.6%
3.9%
4.2%
4.3%
5.0%
7.5%
7.7%
Asia
Other Americas
Australasia
Global average
US & Canada
Eastern Europe
Western Europe
Middle-East and Africa
Kenya
% of Chair positions held by women: Kenya vs other regions

Kenya Institute of Management- Business Intelligence and Research 19
Gender diversity in senior management position: Kenya
We also made attempts to gather data on senior management of the listed companies
especially on gender and age but the response rate were again low and efforts in
getting this data from secondary sources only yielded from 44 companies out of the
targeted 62 representing a 71% representation.
Figure 17: Women representation in senior management positions in Kenya's listed companies
Like in the boardroom, women representation in senior management was a quarter
meaning the 1 woman for every three men in the senior management teams. In fact 4
organizations of the 44 had no single woman in the team.

Kenya Institute of Management- Business Intelligence and Research 20
Age diversity: Kenya
52.5% of the board members are in the age bracket of 45-49 years. Averagely, Kenyan
board has an average of 55.8 years. This indicates that Kenya has lower board
average age as compared to global average of 60.6 years.
Figure 18: Age distribution of board directors in Kenya
Sixty-one percent of the female directors are in 45-59years bracket, compared with
fifty percent male directors in the same age bracket. The average age of the women
in the board 52.1 years compared to the global board’s age 57.8 years. Men in the
board had average age of 56.8years compared with the global perspective average
age of 61.2 years.

Kenya Institute of Management- Business Intelligence and Research 21
Figure 19: Age distribution by gender of board directors in Kenya
Generally, female board members tend to be younger as compared to their male
counterpart.
Education diversity: Kenya
On academic qualifications, 48% of the board members have degree and this
represent the majority. 38% have Post Graduate Diplomas.

Kenya Institute of Management- Business Intelligence and Research 22
Figure 20: Education diversity Kenya
Comparing the board qualifications, women tend to be more educated than men
with 54% of them having master and above compared to 43% men having Master
and above.
Figure 21: Education diversity in Kenya's corporate boardroom

Kenya Institute of Management- Business Intelligence and Research 23
Only 1% of women have diploma and below compared to 6% men with diploma and
below. Women are therefore required to have more qualification to sit in a board
compared to men.
Professional diversity: Kenya
Finance based professions accounted for about 50% of the board room careers with
accountants/auditors, bankers and investment professionals leading the pack.
Figure 22: Professional diversity in Kenya's corporate boardrooms
Majority of the board members have accounting background presented by 14%. Most
women board members have banking background resented by 27% and while majority
of men board men have investment background (16%).

Kenya Institute of Management- Business Intelligence and Research 24
Nationality diversity: Kenya
Globally, 24.8% of the board members are non-national and non-national women
board members are represented by 25.6%. In the survey, 13% and 22% are non-
national women and men respectively. This is quite small nationality representation
of men and women as compared to global figures.
Figure 23: Non-Kenyan representation in Kenya's corporate boardrooms
Further only 62% of the 52 listed companies reviewed had non-nationals compared
to the global average of 79% in listed companies elsewhere.
Board diversity influence on financial performance
The econometric model was regressed to investigate associations between various
diversity indicators including gender, age and education level against performance
measured by compound annual growth rate in the four years between 2013 when
the two thirds gender rule was first passed in Kenya and 2016 the latest year with

Kenya Institute of Management- Business Intelligence and Research 25
available financial performance data. The regression approach would also help show
if there is a significant relationship between board diversity and performance.
Influence of Gender on Organization Performance
Compounded annual growth rate (CAGR) using assets revenues and profits as a
measure of financial performance were calculated over a 4 year period between 2013
and 2016. Difference in gender representation was split between those organizations
that had attained at least 25% of female representation and those that had not since
the average female representation was 25% of the 30 organizations with complete
data. The table below presents group statistics analysis of significance of variation of
change.
Table 1: Means of financial performance by gender representation
One quarter
rule compliant
N Mean Std.
Deviation
Std. Error
Mean
CAGR; Assets No 19 0.066297 0.1225366 0.02811182
Yes 11 0.209637 0.22701105 0.06844641
CAGR; Profits No 19 0.058527 0.6523378 0.1496565
Yes 11 0.176386 0.2853635 0.0860403
CAGR; Revenue No 19 0.066298 0.1225366 0.0281118
Yes 11 0.227857 0.2499115 0.0753511
Further, an independent t-test of the above indicators was done and the results are
as illustrated below;
Table 2: Results of test of means difference between performance of one-quarter gender rule
compliance and non-compliance
Independent Samples Test
t-test for Equality of
Means
95% Confidence
Interval of the
Difference t df Sig. (2-
tailed)
Lower Upper
Kenya Institute of Management- Business Intelligence and Research 26
CAGR
Assets
Equal variances assumed -2.259 28 0.032 -0.27334 -0.01334
Equal variances not assumed -1.937 13.446 0.074 -0.30266 0.01598
CAGR
Profits
Equal variances assumed -0.565 28 0.576 -0.54480 0.30909
Equal variances not assumed -0.683 26.629 0.501 -0.47229 0.23657
CAGR
Revenue
Equal variances assumed -2.385 28 0.024 -0.30030 -0.02282
Equal variances not assumed -2.009 12.839 0.066 -0.33553 0.01241
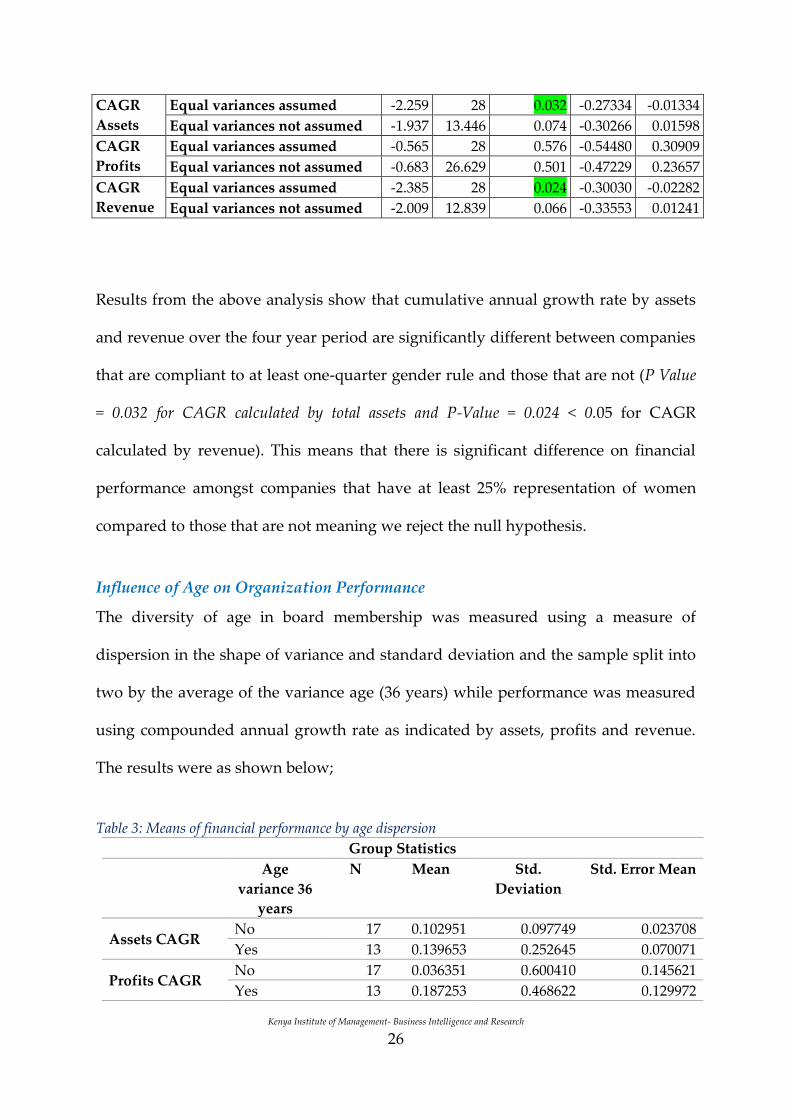
Results from the above analysis show that cumulative annual growth rate by assets
and revenue over the four year period are significantly different between companies
that are compliant to at least one-quarter gender rule and those that are not (P Value
= 0.032 for CAGR calculated by total assets and P-Value = 0.024 < 0.05 for CAGR
calculated by revenue). This means that there is significant difference on financial
performance amongst companies that have at least 25% representation of women
compared to those that are not meaning we reject the null hypothesis.
Influence of Age on Organization Performance
The diversity of age in board membership was measured using a measure of
dispersion in the shape of variance and standard deviation and the sample split into
two by the average of the variance age (36 years) while performance was measured
using compounded annual growth rate as indicated by assets, profits and revenue.
The results were as shown below;
Table 3: Means of financial performance by age dispersion
Group Statistics
Age
variance 36
years
N Mean Std.
Deviation
Std. Error Mean
Assets CAGR No 17 0.102951 0.097749 0.023708
Yes 13 0.139653 0.252645 0.070071
Profits CAGR No 17 0.036351 0.600410 0.145621
Yes 13 0.187253 0.468622 0.129972

Kenya Institute of Management- Business Intelligence and Research 27
Revenue CAGR No 17 0.102951 0.097749 0.023708
Yes 13 0.15507 0.274437 0.076115
Further, an independent t-test of the above indicators was done and the results are
as illustrated below;
Table 4: Results of test of means difference between performance of age dispersion
Independent Samples Test
t-test for Equality of
Means
95% CI of the
Difference
t df Sig. (2-
tailed)
Lower Upper
CAGR
Assets
Equal variances assumed -0.55 28 0.587 -0.1734 0.1000
Equal variances not assumed -0.496 14.76 0.627 -0.1946 0.1212
CAGR
Profits
Equal variances assumed -0.748 28 0.461 -0.5644 0.2625
Equal variances not assumed -0.773 27.975 0.446 -0.5507 0.2489
CAGR
Revenue
Equal variances assumed -0.728 28 0.473 -0.1987 0.0945
Equal variances not assumed -0.654 14.34 0.524 -0.2227 0.1185
The analysis of difference in financial performance between age dispersion above
and below the average of the variance age (36 years) did not yield any significant
results (All P-Values>0.05). We therefore cannot reject the null hypothesis that age
diversity of board members has no effect on a firm’s financial performance.
Highest education level diversity like age diversity of board members was similarly
found to have no significant effect (All P-Values>0.05) on financial performance.

Kenya Institute of Management- Business Intelligence and Research 28
Conclusion
The study has revealed the extent to which certain demographic characteristic of
board members can influence certain attributes of organizational performance
amongst the organizations surveyed. Differences are noted when it comes to assets
and revenue growth when board members of one gender do not exceed a certain
percentage. Age diversity as measured by dispersion with variance and education
level as also measured using variance, did not reveal any significant effect on
financial performance. It can therefore be concluded that gender diversity when
female representation is at least 25% has had a positive influence on the
organizations’ compounded annual growth rate of assets and revenues.

Kenya Institute of Management- Business Intelligence and Research 29
References
Barak, M.E. (2011), Managing Diversity: Toward a Globally Inclusive Workplace,
Sage Publications, Thousand Oaks.
Tanna, S., Pasiouras, F. and Nnadi, M., 2011. The effect of board size and
composition on the efficiency of UK banks. International Journal of the
Economics of Business, 18 (3), pp. 441-462.
Bartol, K. M., Evans, C. L., & Stith, M. T. (1978). Black versus white leaders: a
comparative review of the literature. Academy of Management Review, 3,
293−304
Biraben J.N. (1980), "An Essay Concerning Mankind's Evolution". Population,
Selected Papers. Vol. 4. pp. 1–13. Original paper in French: (b) Jean-Noël
Biraben (1979)."Essai sur l'évolution du nombre des hommes". Population.
Vol. 34 (no. 1). pp. 13–25.
Buse K., Bernstein R.S. and Bilimoria D. (2014). “The Influence of Board Diversity,
Board Diversity Policies and Practices, and Board Inclusion Behaviors on
Nonprofit Governance Practices”, Journal of Business Ethics, Springer
Science+Business Media Dordrecht
Cárdenas M.C, Eagly A., Salgado E., Goode W. , Heller L.I., Jauregui K., Quirós N.G.,
Gormaz N. , Bunse S., Godoy M.J. , Sánchez T.E.R., Navarro M., Sosa F.,
Aguilera Y., Schulmeyer M., Tanure B., Naranjo M., Soto B.H., Darre S., and
Tunqui R.C. (2014). Gender in Management: An International Journal,
Volume: 29 Issue: 1, pp 2-24
Kenya Institute of Management- Business Intelligence and Research 30
Catalyst Issue (2011). “The Bottom Line: Corporate Performance and Women’s
Representation on Boards (2004-2008)”
Collins, P.H. (2003). Intersections of race, class, gender and nation: Some
implications for Black family studies, Journal of Comparative Family Studies,
29(1), 27-36
Cross T.L. (1989). Towards a Culturally Competent System of Care. National
Technical Assistance Center for Children’s Mental Health and Georgetown
University Child Development Center
Cox, T., & Nkomo, S. M. (1992). Candidate age as a factor in promotability ratings.
Public Personnel Management, 21, 197−210.
Cukier W., Bindhani P., Amato S., Smarz S. and Saekang A. (2012). Diversity Leads,
Women in senior leadership positions: A profile of the greater Toronto area
(GTA), Diversity Institute, Ryerson University, Canada
Deloitte (2016). Women in the boardroom a global perspective fifth edition. Global
Centre for Corporate Governance
Deloitte (2013). A Global Diversity trend. Resetting Horizons – Human Capital
Trends.
Egon Zehnder (2016). Global Board Diversity Analysis 2016. Egon Zehnder
International, Inc. All rights reserved.
Ernst and Young (2012). Getting on board, Women join boards at higher rates,
though progress comes slowly. E&Y.

Kenya Institute of Management- Business Intelligence and Research 31
Equilar (2017). The Equilar Gender Diversity Index (GDI). Equilar Diversity
Network (EDN).
Hofbauer P.J. and Astrid , (2014) "Envisioning "inclusive organizations"", Equality,
Diversity and Inclusion: An International Journal, Vol. 33 Iss: 3
Jain S. and Lobo R. (2012). “Diversity and Inclusion: A Business Imperative in Global
Professional Services”, Springer Berlin Heidelberg, pp 181-187
Karakowsky, L., McBey, K., & Chuang, Y. (2004). Perceptions of team performance:
the impact of group composition and task-based cues. Journal of Managerial
Psychology, 19(5), 506−525
Kenya Institute of Management (2012). Bringing the other half to the boardroom:
Case Study of State Corporations and Listed Companies in Kenya
Lawrence, B. S. (1984). Age grading: the implicit organizational timetable. Journal of
Occupational Behavior, 13, 181−191.
Maier C. (2002). Leading Diversity: A Conceptual Framework. St. Gallen: Institute
for Leadership ND HR Management
McGrath, J.E., Berdahl, J.L. & Arrow, H. (1995) Traits, expectations, culture and
clout: The dynamics of diversity in workgroups. In: S.E. Jackson & M.N.
Ruderman (Eds.) Diversity in work teams. Washington DC: American
Psychological Association.
Morgan Stanley Capital International (2015). Women on Boards: Global Trends in
Gender Diversity. MSCI ESG Research.

Kenya Institute of Management- Business Intelligence and Research 32
Nehring K. and Puppe C. (2000). A theory of diversity, University of California, One
shields avenue, Davis, CA.
Njideka U. H (2013). "African Youth, Innovation and the Changing Society".
Huffington Post.
Ricol, Lasteyrie & Associés (2006). The presence of women in executive committees
and on boards of directors in the world’s top 300 companies. (as cited in
Wittenberg-Cox & Maitland, 2008).
http://iedafrica.org/index.php/policy-legal-reforms/143-the-gender-rule-quagmire-
implementing-the-two-thirds-gender-principle-in-kenya. Last accessed on
24th September, 2015.
Niclas L. Erhardt, James D. Werbel, and Charles B. Shrader. Board of Director
Diversity and Firm Financial Performance. 2003. Corporate Governance: An
International Review.
David A. Carter, Frank D’Souza, Betty J. Simkins, and W. Gary Simpson. The Gender
and Ethnic Diversity of U.S. Boards and Board Committees and Firm
Financial Performance. 2010. Corporate Governance: An International
Review.
Yi Wang and Bob Clift. Is There a ‘Business Case’ for Board Diversity? 2009. Pacific
Accounting Review (Emerald Group Publishing Limited).
Ian Gregory-Smith, Brian G. M. Main, and Charles A. O’Reilly III. Appointments,
Pay and Performance in UK Boardrooms by Gender. 2014. Economic Journal.
Kenya Institute of Management- Business Intelligence and Research 33
Shaker A. Zahra and Wilbur W. Stanton. The Implications of Board Directors’
Composition for Corporate Strategy and Performance. 1988. International
Journal of Management.
James D. Westphal and Edward J. Zajac. Who Shall Govern? CEO/Board Power,
Demographic Similarity, and New Director Selection. 1995. Administrative
Science Quarterly.
Maura A. Belliveau, Charles A. O’Reilly III, and James B. Wade. Social Capital at the
Top: Effects of Social Similarity and Status on CEO Compensation. 1996.
Academy of Management Journal.
Renée Adams and Daniel Ferreira. Women in the Boardroom and Their Impact on
Governance and Performance. 2009. Journal of Financial Economics.
Kenneth R. Ahern and Amy K. Dittmar. The Changing of the Boards: The Impact on
Firm Valuation of Mandated Female Board Representation. 2012. Quarterly
Journal of Economics.
Deborah L. Rhode and Amanda K. Packel. Diversity on Corporate Boards: How
Much Difference Does ‘Difference’ Make? 2014. Delaware Journal of
Corporate Law.
Katherine Y. Williams and Charles A. O’Reilly III. Demography and Diversity in
Organizations: A Review of 40 Years of Research. 1998. Research in
Organizational Behavior