Embed Size (px)
Citation preview

Providing the Total View of the Global Energy Market
LEADERS IN ENERGY MARKET ANALYSIS
WHO WE SERVE
WHO WE ARE
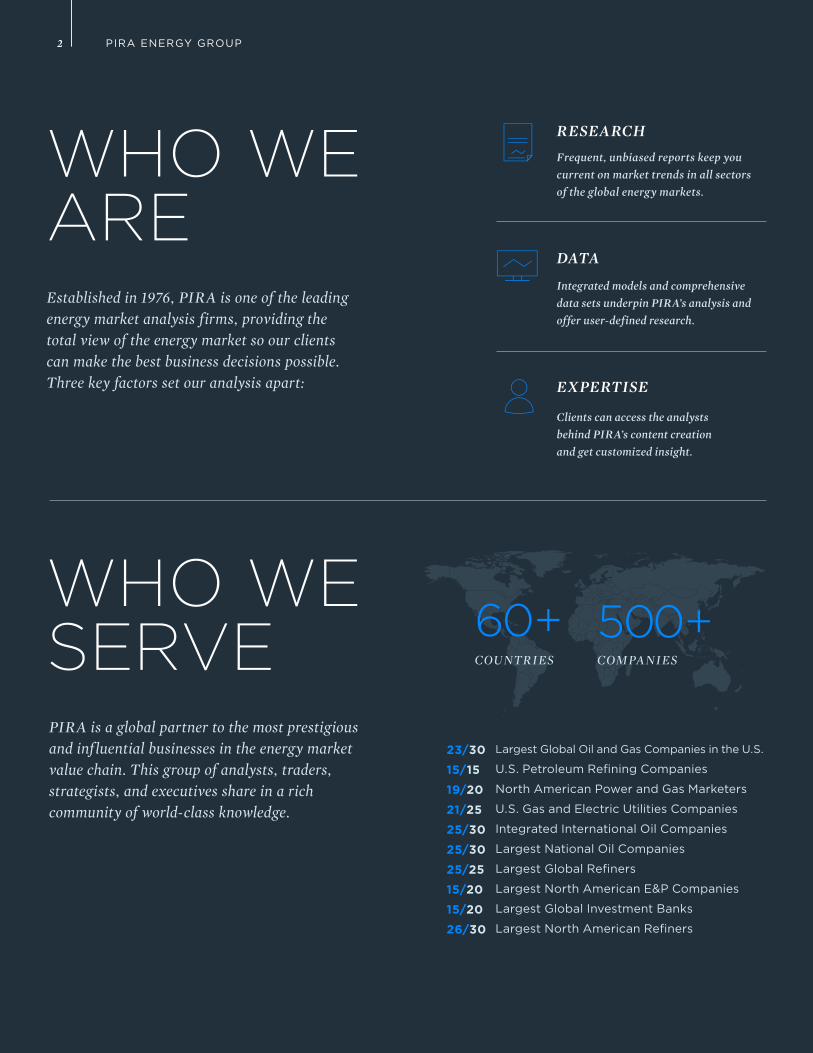
PIRA is a global partner to the most prestigious and influential businesses in the energy market value chain. This group of analysts, traders, strategists, and executives share in a rich community of world-class knowledge.
Established in 1976, PIRA is one of the leading energy market analysis firms, providing the total view of the energy market so our clients can make the best business decisions possible. Three key factors set our analysis apart:
Largest Global Oil and Gas Companies in the U.S.
U.S. Petroleum Refining Companies
North American Power and Gas Marketers
U.S. Gas and Electric Utilities Companies
Integrated International Oil Companies
Largest National Oil Companies
Largest Global Refiners
Largest North American E&P Companies
Largest Global Investment Banks
Largest North American Refiners
23/30
15/15
19/20
21/25
25/30
25/30
25/25
15/20
15/20
26/30
RESEARCH Frequent, unbiased reports keep you current on market trends in all sectors of the global energy markets.
DATA
Integrated models and comprehensive data sets underpin PIRA’s analysis and offer user-defined research.
60+COUNTRIES
500+COMPANIES
EXPERTISE
Clients can access the analysts behind PIRA’s content creation and get customized insight.
22 PIRA ENERGY GROUP

33 PIRA ENERGY GROUP
At PIRA we provide a view of the market that is truly unmatched. We pride ourselves in our objective analysis, delivered by industry thought leaders, and brought together in an integrated view across sectors and regions. We look from the top down—at macroeconomic trends, geopolitical developments, and policy changes that could disrupt our clients’ businesses at any time. We also look from the bottom up—at comprehensive fundamentals data from all sectors of the market. Each day, we continue to develop updated insights and create new solutions so that our clients are always looking at the Total View of the global energy market.
PIRA PROVIDES THE TOTAL VIEW OF THE GLOBAL ENERGY MARKET
Ask us for more information about our approach or visit us online at: www.pira.com to learn more.
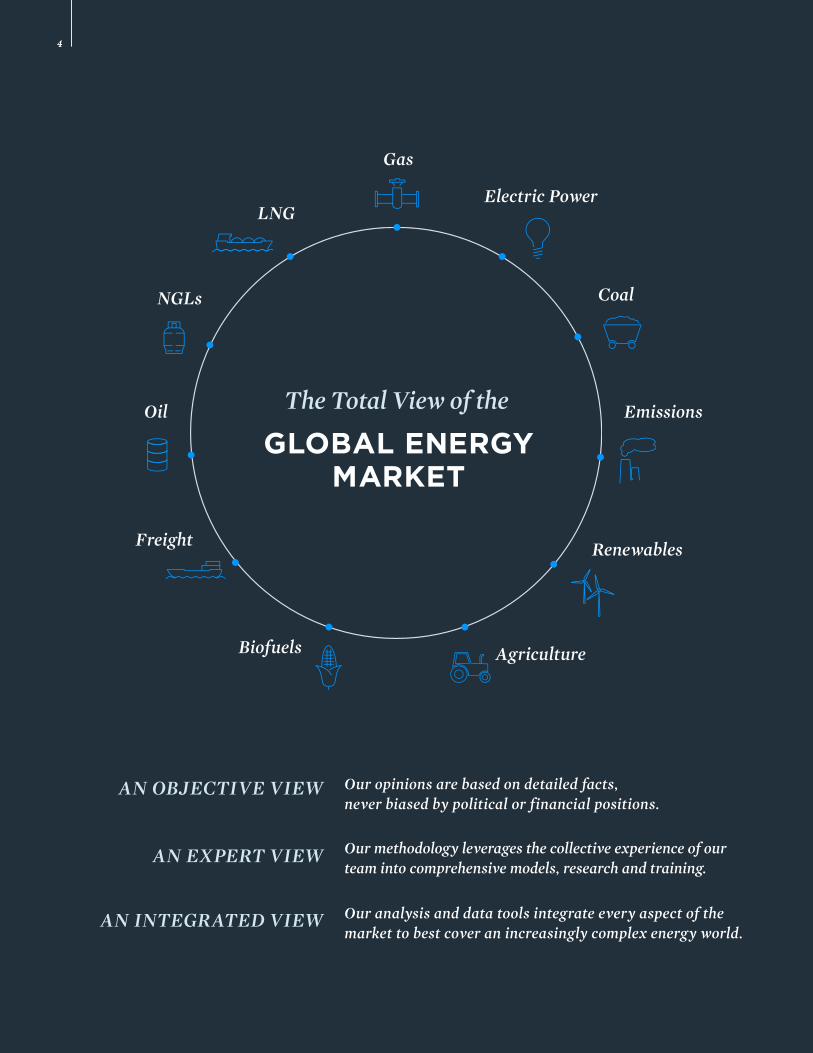
Our opinions are based on detailed facts, never biased by political or financial positions.
AN OBJECTIVE VIEW
Our methodology leverages the collective experience of our team into comprehensive models, research and training.
AN EXPERT VIEW
Our analysis and data tools integrate every aspect of the market to best cover an increasingly complex energy world.
AN INTEGRATED VIEW
Gas
Electric Power
Coal
Emissions
Renewables
AgricultureBiofuels
Freight
Oil
NGLs
LNG
GLOBAL ENERGY MARKET
44

RESEARCH
Frequent reports and timely bulletins keep you current on market trends in all sectors of the global energy markets.

The Total View of
THE OIL MARKETPIRA examines every aspect of the oil market, including supply, demand, inventories,
refining, infrastructure and trade flows, with the objective of helping our clients understand which way the market is headed.
WHY IT MATTERS
• See a detailed and integrated view of supply and demand fundamentals
• Uncover the story behind the numbers that are driving prices
• Gain insights into market changes in crude oil and refined products all along the value chain
• Understand current market developments that really matter
• Know the industry backdrop for evaluating commodity and equity investments
Features of the Global Oil Service include:
• WORLD OIL MARKET FORECAST — This essential report contains PIRA’s short- and medium-term outlook for world crude and petroleum products markets, along with critical intelligence on current market drivers. Price forecasts are provided for WTI and Brent, as well as for key petroleum products.
• WEEKLY DOE ANALYSIS — Published each Wednesday after the U.S. DOE releases its Weekly Petroleum Status Report, this report covers PIRA’s market perspective and analysis of the most recent U.S. crude oil and petroleum products supply/demand data, including forecasts for the next week.
• NORTH AMERICAN MIDCONTINENT OIL FORECAST — This monthly report examines the factors affecting shale plays and tight oil productions in the Midcontinent, as well as Canadian crude and WTI prices.
• EUROPEAN OIL MARKET FORECAST and ASIA-PACIFIC OIL MARKET FORECAST — These monthly reports provide outlooks for crude and products markets, including supply/demand analysis and forecasts, respectively, for Northwest Europe and the Mediterranean and for Dubai and Tapis crudes and Singapore products.
• THE ENERGY PRICE PORTAL — A key feature of PIRA DIMENSIONS, the Portal allows users quick and easy access to PIRA’s latest price forecasts for 34 worldwide crudes and 91 worldwide petroleum products — including the ability to create custom spreads using the Equation Manager, a utility that allows users to define, analyze and store up to 100 custom price spreads in the form of multi-variable equations using PIRA’s forecast prices. The Energy Price Portal also contains prices for fuels from the other PIRA services, allowing fast interfuel analysis.
• WORLD PETROLEUM PRODUCT DEMAND MONITOR — This monthly slide show tracks the latest global demand for light and heavy products.
• U.S. RIG MONITOR — This weekly report (and supporting Excel data file) provides a detailed summary of U.S. oil and gas drilling activity in selected plays and regions.
• CURRENT NEWS AND ANALYSIS — Brief, timely assessments and market commentaries that cover topics that are relevant for the near term and can influence trading strategy. Such items may include reports on commercial developments, political events, supply disruptions or recent micro-/macroeconomic trends.
• POLITICAL RISK SCORECARD — This weekly tracks political developments in major oil-producing and -consuming countries, while assessing price impact (bearish, neutral, bullish).
• U.S. REFINERY TURNAROUNDS REPORT — Published twice a year, this confidential survey of the U.S. refining industry’s turnaround plans is presented by PADD.
• PIRA’S ANNUAL CLIENT SEMINAR ACCESS — This flagship event, held every October in New York City, presents PIRA’s medium- and long-term view of oil, gas, coal and electricity markets, which includes a plenary session and 25-plus breakout workshops on all major energy commodity markets. PIRA holds similar events in Calgary, London and Singapore.
• PHONE/E-MAIL ACCESS TO PIRA’S GLOBAL OIL GROUP — clients can obtain timely analytical support and additional oil market information, via email and telephone, and discuss our latest insight on short-term oil markets with PIRA analysts. Periodic conference calls with oil experts are also included.
• ... PLUS MANY MORE REGULAR INSIGHTFUL REPORTS AND COMPREHENSIVE DATABASES
AND GLOBAL MACROECONOMIC ANALYSIS.
GLOBAL CRUDE OIL & PETROLEUM PRODUCTS SERVICE
Since its inception, PIRA has been the worldwide leader in crude oil and petroleum products research, delivering key intelligence and analysis on the global energy complex through this flagship offering. The Global Oil Service provides clients with in-depth and — perhaps most important — independent analysis of worldwide crude and petroleum products markets, including fundamentals data, price forecasting, and insight into market developments and emerging trends. Whether you are selling, buying or trading crude or products, the Oil Service offers the most commercially oriented analysis of supply/demand fundamentals and price movements — actual and forecast — across the globe. Like all of PIRA’s services, contents of the Global Oil Service are available via DIMENSIONS, PIRA’s online client portal, and clients also have the opportunity to communicate directly with the analysts and senior consultants behind the service’s insights.
7 CRUDE OIL & PETROLEUM
© 2015 PIRA Energy Group
• Annual Scenario Guidebook with long-range outlooks
• Quarterly Scenario Tracking reports
• Current News and Analysis bulletins
• Annual roundtables (Houston and London)
• Global Gas Database
• Fracking Policy Monitor
• Historical breakdown of capacity and process unit configuration
• Historical crude slate data with API gravity and sulfur levels
• Forecast of planned refinery downtime, investments, additions and new constructions
• By-facility historical crude distillation outages
• Major product yields (LPG, naphtha, gasoline, jet, diesel/gasoil, and fuel oil), rolled-up by country, region, company, refinery configuration, etc.
• Refinery Downtime Scenario Manager
• Regional product-quality specifications
• Regional summary capacity reports and margin chart
• Coverage of multiple fuels including crude and oil products (19 types), coal (3 types), combustibles, electricity, natural gas, hydro, nuclear, renewables (several sub-categories), and CO2 emissions
• Analysis of 143 countries
• 9 energy demand sectors
• History from 1990 and forecasts to 2035
• Ability to create user-defined custom demand scenarios
• Economic growth and population history and projections
• Full support by PIRA analysts
• Access to PIRA's latest world liquids supply actual (to 1995) and forecast (to 2035) data, including assumptions on disruptions, maintenance, and spare capacity in more than 150 countries.
• Development and production cost data for over 800 supply elements, including differentials to Brent.
• “Drilldowns” to view specific components of liquids supply, such as shale crude, bitumen, syncrude, deepwater, condensate, NGLs, and biofuels, among others.
• The ability to view crude and condensate production forecasts by quality (light sweet, medium sweet, heavy sweet, light sour, medium sour, heavy sour).
• Customizable searches for production within a specific range of API, sulfur, TAN, and 650+ values.
• Options for packages to access only the data you need: globally by country or North America only; monthly or annual frequencies; with or without the option to see production/spare capacity by quality.
SCENARIO PLANNING SERVICE (SPS)
SPS defines and tracks the critical assumptions behind our worldwide oil, gas and coal projections with a focus on our medium-term (one to two years) and longer-term (2035) outlooks.
WORLD REFINERY DATA PORTAL (WRD)
WRD provides an in-depth forward view of the international refining business. It offers cutting-edge functionality, delivering capacity data by unit and configuration, detailed ownership status and history, and refinery-by-refinery crude slate, yields and outages data — resulting in a turnkey research tool that is unmatched in the industry.
WORLD ENERGY DEMAND FORECAST PORTAL (WED)
WED offers the most comprehensive energy demand dataset available anywhere, covering demand at its most “granular” level — some 2 million data points. WED is updated regularly and provides annual energy demand data by sector, fuel and product for 143 countries, with history back to 1990 and projections through 2035.
WORLD OIL SUPPLY DATA PORTAL (WOS)
WOS provides fast and easy access to PIRA’s historical and forecast global oil supply through an online web portal. Historical data are provided beginning in 1995. Monthly forecast data are available through the end of PIRA’s short-term forecast period (12-24 months out). Long-term annual forecasts are available through 2035.
Key Features Include:
Key Features Include:
Key Features Include:
Key Features Include:
• PIRA takes key inputs: crude assays (can be client provided); product price forecasts; freight rates; by-refinery capacity outlook and runs/grade history; and competing crude(s) production outlook.
• PIRA analyzes the inputs and then outputs the following: crude property work-up; refinery modeling to provide finished-product yields; pricing netback results; identification of potential crude buyers; and evaluation of competitive economics.
OIL PRODUCER MARKETING SERVICE (OPMS)
OPMS is a customizable offering that provides valuations for any existing or newly developed crude oil stream. Though OPMS is designed specifically for producers of crude, marketers and traders can also benefit.
OPMS Methodology:
Other Services from PIRA’s Global Oil Team
© 2015 PIRA Energy Group
8 CRUDE OIL & PETROLEUM
• Region-by-region balances and inter-regional net trade flows for crude/condensate, gasoline/blendstocks, jet/kero, gasoil/diesel, and heavy fuel oil.
• Quarterly and annual forecast balances
• Flexible data retrieval (e.g. all regions for one time period, one region for multiple time periods).
• The ability to download data sets into spreadsheets, as well as the ability to generate reports and create “trade flow maps” and pie charts.
• Trading Enhancer, a tool to establish "fair market value"
• Arbitrage model
• U.S., European, and Japan crude and light product balances
• U.S., European and Japan refinery turnaround data
• Fundamentals/price analysis
• Futures analysis and charts
• The Freight Market Outlook monthly report, with coverage fleet capacity assumptions, supply/demand outlooks, commentary on recent trends and anticipated changes.
• Monthly Dry Bulk Freight Market Forecast report, analyzing the supply and demand fundamentals of coal, iron ore and steel freight markets.
• The Freight Market Outlook Portal, with data on: freight cost projections, including a breakdown of market rates and Flat Rate components; transportation rates for 18 key trades and size classes; and the Hire Rate Calculator, which converts Worldscale rates to a term hire equivalent for key worldwide crude and product trade routes.
• Monthly NGL Price Forecasts
• Monthly NGL Supply and Demand Balances
• Monthly NGL Market Developments slide show
• Weekly U.S. Propane Stock Report
• Global LPG Weekly Scorecard
• Access to PIRA’s NGL market analysts
• Global Biofuels Monthly Forecast
• Biofuels Weekly Update
• Weekly Ethanol Supply Report
• World Biofuels Plant Database
• Periodic Biofuels in Developing Markets report
• Special reports on key topics and issues
OIL TRADE FLOW PORTAL (OTF)
OTF is a valuable tool that helps users gain a better understanding of changing oil trade patterns and anticipate future changes. The online portal provides detailed, interactive balances and trade flows forecasts for crude and major refined products, both for the short term (quarterly) and long term (annual).
OIL PRODUCT TRADING ANALYZER (OPTA)
A powerful online research tool for products traders, OPTA provides the latest detailed market analysis, crude and light product balances, and prices for major petroleum products, including gasoline, RBOB, jet kerosene, distillate fuel oil, and residual fuel oil.
FREIGHT MARKET OUTLOOK (FMO)
FMO provides the key assumptions and oil flows in PIRA’s monthly World Oil Market Forecast to analyze tanker demand and develop detailed transportation balances for the major vessel groups.
GLOBAL NGL MARKET SERVICE (NGL)
NGL provides an in-depth analysis and forward-looking view of U.S. and European NGL markets, associated price forecasts, and trends for extraction economics.
GLOBAL BIOFUELS SERVICE
The Biofuels service analyzes the commercial aspects of the global biofuels market by monitoring mandates, incentives, demand, supply, capacity, prices, raw materials and market structure in countries with bioethanol and biodiesel programs.
Key Features Include:
Key Features Include:
Key Features Include:
Key Features Include:
Key Features Include:
Other Services from PIRA’s Global Oil Team (continued)
9 CRUDE OIL & PETROLEUM
© 2015 PIRA Energy Group

WHY IT MATTERS
• See an integrated view of gas supply and demand fundamentals tied to inter-fuel competition
• Uncover the story behind the numbers that are driving prices
• Gain insights into changing gas production and regional trade trends
• Understand current market developments that really matter
• Know key industry elements for evaluating natural gas commodity and equity investments
The Total View of
THE GAS MARKETPIRA offers comprehensive market analysis on worldwide natural gas markets, fully
integrated with PIRA’s views on global oil, coal, renewables, and power markets.
• North American Gas Forecast Monthly
• North American Gas Regional Monthly
• North American Gas Trade Monthly
• 21 regional gas price forecasts for N.A.
• Gas Flash Weekly
• Quarterly Fracking Policy Monitor
• U.S. Natural Gas Daily Update
• Weekly U.S. Gas Rig Monitor
• U.S. Weekly Propane Stocks by PADD
• U.S. NGL Prices and Balances
• Annual Client Seminar
• Access to PIRA’s Gas Group for analytical support
• Monthly Gas Market Forecast
• Weekly European Gas Price Scorecard
• European Daily Natural Gas Demand Forecast and Portal Data
• European Daily Electricity Demand Forecast
• Dynamic database of supply/demand data for 21 countries, including production, imports, exports, storage, demand, HDDs/CDDs, and regularly updated macroeconomic data (currencies, world economies, etc.)
• Client Seminar invitations
• Global LNG Monthly Forecast
• Weekly Global LNG Fundamentals Scorecard
• LNG Spot Price Calculator
• Global Gas Database
• Access to PIRA’s Global Gas Group for analytical support
• A queriable database, providing over 350,000 prices from more than 115 countries worldwide
• The weekly End-User Gas Price Scorecard, which offers a view (bullish, neutral, or bearish) into the price and policy changes that have a direct impact on all consumers worldwide
• Customized price forecasts for up to 10 chosen countries, updated on a quarterly basis
• Access to PIRA staff for analytical support
• Daily report with weekly regional storage levels and forecasts
• Daily discussion of short- and medium-term weather outlooks
• Daily heating/cooling degree-day data and forecasts
• Detailed breakdown of various S&D components for the two upcoming EIA reports
NORTH AMERICAN NATURAL GAS SERVICE
Through a comprehensive set of deliverables, PIRA’s North American Natural Gas Service provides clients with independent and timely analysis of U.S., Canadian and Mexican gas markets — including fundamentals data, price forecasting and analysis of market developments and emerging trends. Whether you are producing, selling, buying or trading natural gas, the service delivers a competitive edge through ongoing analysis of supply/demand fundamentals and price movements — actual and forecast, region by region — across North America.
EUROPEAN NATURAL GAS SERVICE (ENG)
ENG covers Europe’s well-established natural gas trade by analyzing by-country market fundamentals, keeping clients abreast of emerging trends in supply, demand and inventory, which in turn affect prices not only in Europe but, more and more, in North American and Asian markets as well.
GLOBAL LIQUEFIED NATURAL GAS SERVICE (LNG)
LNG provides a rigorous fundamentals analysis of worldwide LNG markets. Includes a comprehensive outlook for prices, supply, demand, trade, netbacks and arbitrage, and inter-fuel competition. Service covers both the contract flow of LNG and market-responsive spot trade.
END-USER GAS PRICE SERVICE
By using information culled from official sources in over 115 countries and territories, ranging from 1999 to the present day, the End-User Gas Price Service goes well beyond the conventional look at wholesale and oil-indexed prices by accessing a deeper layer that until now was largely fragmented and difficult to find and cross-compare.
GAS WEATHER OUTLOOK (GWO)
GWO — produced jointly with MDA EarthSat — provides forecasts of gas storage injections and withdrawals by-region, based on projected weather patterns and heating/cooling degree days throughout the summer injection and winter withdrawal periods.
Key Features Include:
Key Features Include:
Key Features Include:
Key Features Include:
Key Features Include:
11 NATURAL GAS
© 2015 PIRA Energy Group

UT LAM ENDIT LABORI OMNIATU RENIMPO 1212
The Total View of
THE POWER MARKETSPIRA’s comprehensive and granular coverage of the North American and European electric power markets provides the critical forecasts, benchmarking metrics, and up-to-date data
necessary to make informed decisions.
• See a detailed, fundamentals-driven forecasts of power markets, integrated with PIRA’s outlook on natural gas, coal, emissions, macroeconomics, policy and technology
• Uncover the story behind the numbers driving power prices
• Gain insights into operating generation in regions subject to different delivered fuel costs and emissions programs
• Understand current market developments that really matter
• Know key elements for evaluating electricity commodity and equity investments
WHY IT MATTERS
• Monthly Western Grid Electricity Market Forecast
• Monthly Eastern Grid/ERCOT Electricity Market Forecast
• Monthly U.S. Coal Market Forecast
• Regional Electric Load Estimates
• New Generation Capacity Database
• Annual Client Seminar
• Access to PIRA’s Electricity Group for analytical support
• European Electricity Monthly Outlook
• Merit Orders Report Monthly
• European Electricity Market Scorecard Weekly
• European Electricity Demand Forecast Daily
• European Natural Gas Demand Forecast Daily
• European Electricity Markets Special Features
• Daily demand forecasts for 20 countries
• Access to short- and long-term price forecasts for European electricity markets via PIRA’s Energy Price Portal
• Data on supply/demand by country and sector; renewables forecasts; and macroeconomic trends
• A short summary report in PDF
• A detailed report in Excel format
• Seven-day projections of peak-hour, on-peak, off-peak and average covering more than 65 power market regions and sub-regions.
• Demand departures from seasonal norms
NORTH AMERICAN ELECTRICITY SERVICE
PIRA’s North American Electricity Service provides fundamentals analysis, research, and forecasts of prices and supply-demand in eastern and western electricity and coal markets. Core analysis is sent to clients monthly in advance of electricity futures contract expiration and is geared for companies that value a comprehensive analysis of the fundamentals driving PIRA’s 12-month-forward price outlooks for multiple delivery points and inter-related fossil fuels markets. Additionally, PIRA’s unbiased special reports, medium-term (2+ years forward) forecasts and long-term (20+ years forward) forecasts help planners, investors and hedgers make significant decisions.
EUROPEAN ELECTRICITY SERVICE (EES)
EES provides clients with market insights into the developments of power generation, demand, cross-border trading, and prices for Europe’s most relevant markets for electricity trade. It focuses on Continental Europe (Germany, Benelux, France, Switzerland, Austria), while data and trends are also covered for the other European countries (Italy, Iberian Peninsula, UK, Nordic countries and Eastern Europe).
ELECTRICITY DAILY DEMAND FORECAST
Designed for North American electricity market participants, as well as natural gas and coal traders, Daily Demand predicts regional loads in the Eastern and Western Interconnects, ERCOT, and Quebec. The projections, sent seven days/week, incorporate the NOAA model output statistics weather forecast for more than 200 weather stations in the United States and Canada.
Key Features Include:
Key Features Include:
Key Features Include:
• The Daily Renewable Generation Forecast Report, which provides a summary of the 10-day forecast for all countries and grids covered. It shows an overview of the wind and solar generation on average across main European markets and the changes in the forecast from the previous day.
• The Hourly Generation Forecast and Data Portal, with tables provided in Excel to allow users to download and update their own price and supply/demand models. Additionally, clients have the capability to chart the data in order to visualize the volatility in hourly output.
RENEWABLE ENERGY FORECASTING SERVICE (REF)
REF provides clients with independent and timely hourly data of wind and solar generation in main European markets. Its forecasts are derived using a sophisticated statistical model that defines the historical relationship between renewable energy output, installed capacities, and several key weather factors (sourced from leading weather authority, MDA EarthSat).
Key Features Include:
13 ELECTRICITY
© 2015 PIRA Energy Group
WHY IT MATTERS
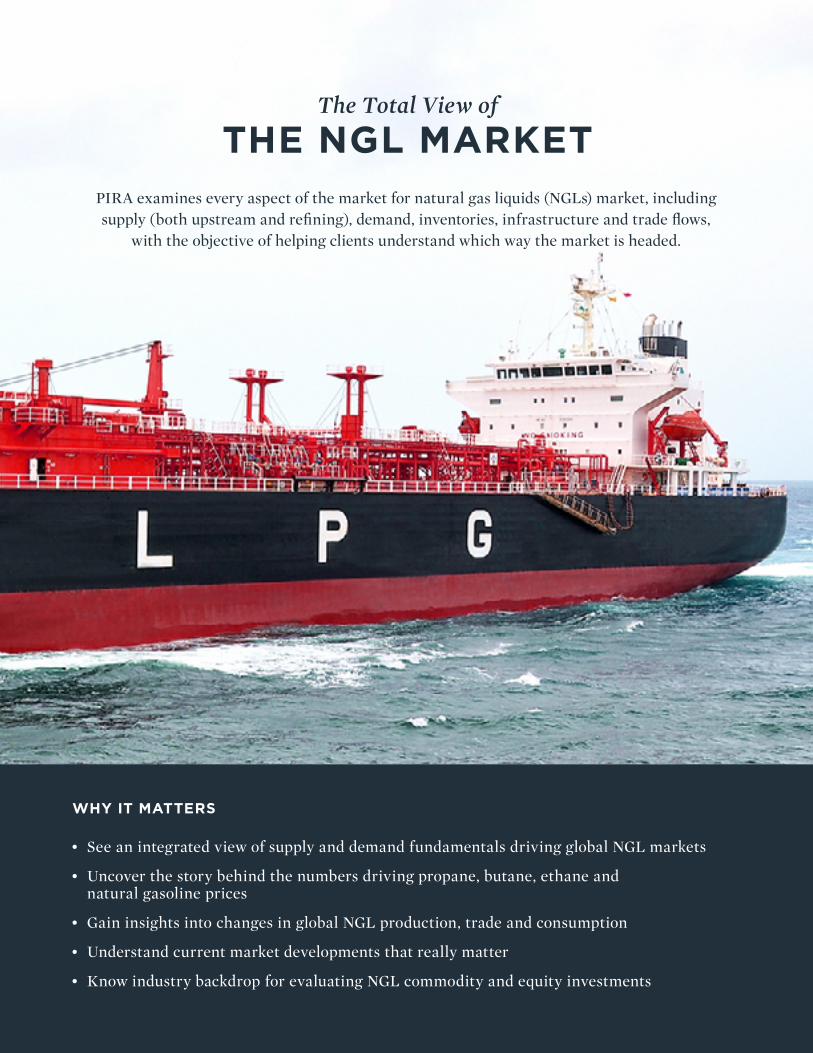
• See an integrated view of supply and demand fundamentals driving global NGL markets
• Uncover the story behind the numbers driving propane, butane, ethane and natural gasoline prices
• Gain insights into changes in global NGL production, trade and consumption
• Understand current market developments that really matter
• Know industry backdrop for evaluating NGL commodity and equity investments
The Total View of
THE NGL MARKETPIRA examines every aspect of the market for natural gas liquids (NGLs) market, including supply (both upstream and refining), demand, inventories, infrastructure and trade flows,
with the objective of helping clients understand which way the market is headed.
Key Features Include:
• Monthly NGL Price Forecasts
• Monthly NGL Supply and Demand Balances
• Monthly NGL Market Developments slide show
• Weekly U.S. Propane Stock Report
• Global LPG Weekly Scorecard
• The latest data on U.S. NGL balances, LPG demand by country, Middle East LPG exports, LPG trade flows, world ethylene capacity, U.S. extraction margins and fractionation capacity, and so on.
• Access to PIRA’s NGL market analysts
GLOBAL NGL MARKET SERVICE (NGL)
PIRA's Global NGL Market Service, through its interactive portal, offers users fast access to the same exhaustive supply/demand and pricing fundamentals data, analysis and projections that have been the hallmark of all of PIRA’s retainer services. It helps market participants to know how export supplies will develop, how international trading patterns will change, how government regulations are evolving, and what are the likely prices of NGLs and how competitive against other petrochemical feedstocks.
THE GLOBAL IMPACT OF NGL SUPPLY GROWTH: PIRA’S COMPREHENSIVE OUTLOOK TO 2035 — A NEW MULTI-CLIENT STUDY
The next 20 years will witness radical shifts in the supply, demand and trade balances for NGLs — ethane, propane, butane, and pentanes plus. On the supply side, the pace of change has accelerated, and the wave of NGL production growth in North America continues, even with the recent shock of lower prices in 2014-15. On the demand side of the equation, the story is also rapidly changing as growing supply is pricing itself to create sufficient demand. Will the mix of feeds into petrochemicals be the most affected given its price sensitivity? What other markets will be impacted? How much and where? Together, these fundamental forces will impact price spreads for other products as the surge in NGLs ultimately displaces naphtha from petrochemicals and drives refiners to shift yields more towards middle distillates. PIRA assesses the impact of these forces in a new multi-client study, “The Global Impact of NGL Supply Growth: PIRA’s Comprehensive Outlook to 2035.”
The study features:
• A detailed look by country at upstream production of natural gas liquids and net refinery LPG production.
• An in-depth outlook of the factors driving each region’s ethane, propane and butane product usage.
• Analysis of the trade flows for ethane, propane and butane and how they will evolve, driven by regional supply and demand changes.
• Regional price forecasts relative to natural gas, crude and oil products, as well as arbitrage opportunities and the key factors that will drive these relationships.
• Regional reference case supply, demand and trade projections through 2035 by year, as well as a discussion of how changes in key variables could affect those projections.
Companies purchasing “The Global Impact of NGL Supply Growth” are entitled to the following deliverables:
• WRITTEN REPORT — The report spells out the findings of the study and the bases underlying those results, and it provides a discussion of the key uncertainties that impact the major findings. The report includes an executive summary, as well as detailed discussion and illustrative charts on supply, demand, prices, trade and sensitivities.
• STUDY PRESENTATION — Clients have the opportunity to see a presentation of the key results, discuss those findings and their implications, and question the study’s authors via a WebEx workshop. The presentation will be recorded for review via PIRA's website at any time for study subscribers.
• ONLINE DATABASE — A comprehensive database providing historical data back through 2010 and forecasts through 2035 in Excel spreadsheets for: • Country-level upstream supply with key species breakouts • Country-level demand by sector including the outlook for steam cracker feeds to meet global olefin demand • Country-level net refinery LPG production • Inter-regional ethane and LPG trade flows • Price forecasts, both absolute and relative to crude/products/natural gas
• 3-MONTH FREE ACCESS TO PIRA’S GLOBAL NGL MARKET SERVICE — Buyers of study receive free access to PIRA’s Global NGL service for three months (from the point of their order). See above for more details on the service.
15 NGL
© 2015 PIRA Energy Group

WHY IT MATTERS
• See a holistic view of the fundamentals of supply and demand, including the government policies driving biofuels use
• Uncover the story behind the numbers
• Get insights into the commercial drivers along the value chain
• Understand current market developments that really matter
• Know the industry backdrop for evaluating commodity and equity investments
The Total View of
THE BIOFUELS MARKETSPIRA provides comprehensive coverage of the global markets for ethanol and biodiesel,
helping clients make informed decisions in today’s uncertain environment.
GLOBAL BIOFUELS SERVICE
PIRA’s understanding of energy markets relies on the total view of all fuel commodities, and biofuels is no exception. The business is now at a crossroads and many issues will determine how biofuels will develop. How will biofuels achieve goals of reducing dependence on imports while obtaining the maximum reduction in greenhouse gases? To what extent will oil companies enter the business? How fast will technology for second generation biofuels that are not made from food sources develop? Will governments provide the necessary support to develop the industry despite having other economic priorities? Which companies will be more aggressive in blending biofuels? What will be the impact on energy and related industries, including the need for additional refining capacity? The questions around the biofuels market — and related challenges and opportunities — abound.
To answer these questions, both established energy companies and new “agri-energy” concerns around the world need a reliable, concise, yet comprehensive and continuous source of historical and current biofuels information and analysis. They also require reasonable and objective market forecasts, allowing them to profitably navigate the rapidly emerging biofuels market. To help them, PIRA’s Global Biofuels Service provides the same exhaustive supply-and-demand fundamentals data, analysis, and projections that have been the hallmark of the other PIRA retainer services.
The Global Biofuels Service provides an in-depth analysis of the commercial markets for biofuels in the U.S., Brazil and Europe, which account for about 90% of global ethanol production. Other countries/regions with active ethanol and other biofuels programs are also covered.
The service features include:
• COMPREHENSIVE MONTHLY REPORT — Provides an up-to-date assessment of the major market dynamics, including:
• Global mandates and targets for biofuels. • U.S. Renewable Fuel Identification Number pricing (RINs). • Production, consumption, imports, exports and inventories. • Existing capacity, plants under construction and planned facilities. • Biofuels legislation – Analysis of current and pending regulations affecting biofuels development and use. • Ethanol, diesel/biodiesel prices – Analysis of the price-setting mechanism and forecasts.
• BIOFUELS WEEKLY UPDATE — Keeps clients apprised of changes in the industry on a more immediate basis than the monthly forecast, featuring updated U.S. biofuels prices and manufacturing economics.
• WEEKLY ETHANOL SUPPLY REPORT AND SCORECARD — Analyzes the data on ethanol included in the U.S. Department of Energy’s Weekly Petroleum Status Report. Included are statistics on production, inventories, imports, and ethanol-blended gasoline by PADD. The report also includes a Scorecard, which indicates how 10 key variables will likely to affect short-term prices.
• BIOFUELS IN DEVELOPING MARKETS — Delivered quarterly, tracks news and trends in regions outside of the U.S., Western Europe, and Brazil, which are covered in the Global Biofuels Monthly Forecast.
• WORLD BIOFUELS FORECAST — Annual, in-depth report that includes forecasts of production, demand and trade by region and key countries, as well as a review of global mandates.
• SPECIAL REPORTS, CURRENT NEWS AND ANALYSIS REPORTS, AND PRESENTATIONS — Important industry developments, such as legislation, global production forecasts, manufacturing economics, raw material analysis, impact on energy savings, emerging markets, reduction in greenhouse gases, new technology developments, etc., are discussed and analyzed in detail
• WORLD BIOFUELS PLANT DATABASE — Includes an up-to-date forecast of existing and planned ethanol and biodiesel facilities.
• ONLINE PORTAL — All reports, data, and presentations associated with the Biofuels Service are available through a customized “portal” on PIRA DIMENSIONS. This service includes the biofuels module of the Energy Price Portal, which provides a short- and long-term view of prices in the U.S., the leading market for ethanol. It also includes biodiesel and ethanol in Chicago and ethanol in New York.
• ACCESS TO PIRA STAFF
17 BIOFUELS
© 2015 PIRA Energy Group
WHY IT MATTERS
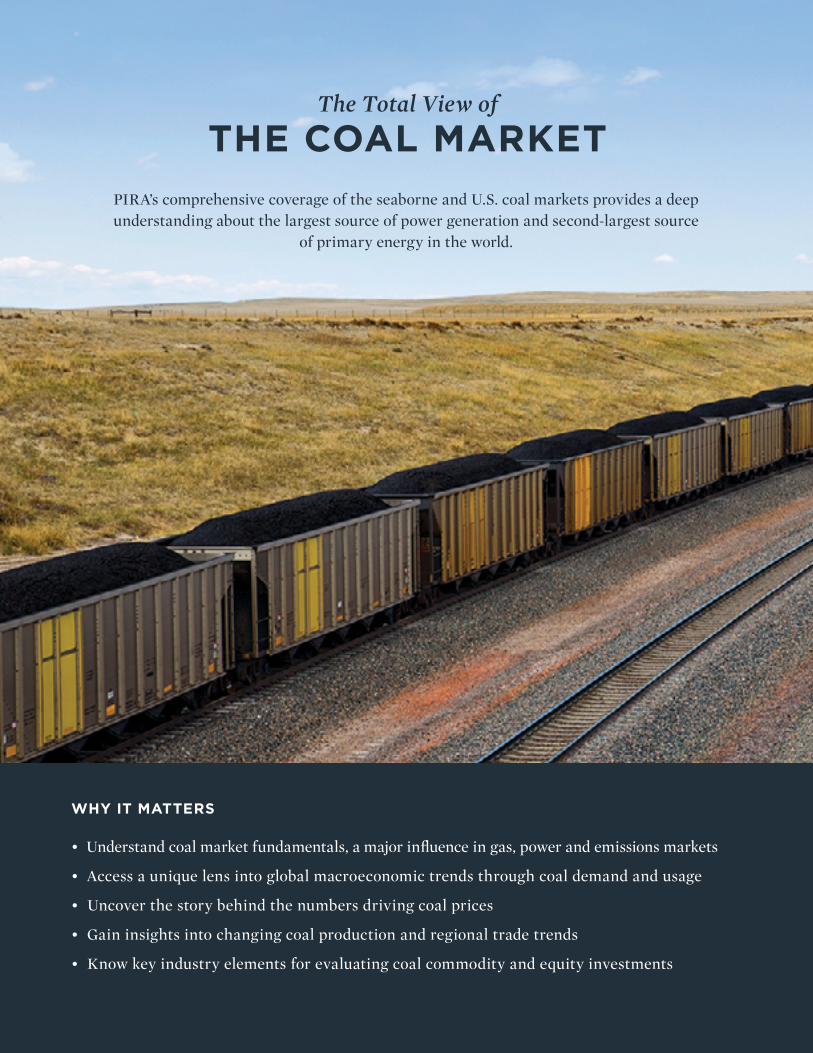
• Understand coal market fundamentals, a major influence in gas, power and emissions markets
• Access a unique lens into global macroeconomic trends through coal demand and usage
• Uncover the story behind the numbers driving coal prices
• Gain insights into changing coal production and regional trade trends
• Know key industry elements for evaluating coal commodity and equity investments
The Total View of
THE COAL MARKETPIRA’s comprehensive coverage of the seaborne and U.S. coal markets provides a deep understanding about the largest source of power generation and second-largest source
of primary energy in the world.
INTERNATIONAL COAL SERVICE
Despite increasing interest in renewables, coal remains a major fuel for electricity generation and industrial energy supply and is increasingly being traded and hedged in short-term spot markets as a global commodity. As such, there has never been a more important time to understand the international coal market and the influence that it has on regional gas and electricity markets. The International Coal Service applies PIRA’s in-depth analysis of market fundamentals to coal, leveraging our extensive expertise of downstream electricity markets with a rigorous assessment of the supply-side fundamentals. PIRA analyzes coal as a complete market — where economics dictate the destination of the incremental ton across thousands of miles of ocean.
By looking at the fundamentals affecting coal markets, PIRA provides a structured assessment and outlook that identifies market opportunities for clients, not just for coal, but in electricity, shipping, natural gas and financial markets.
The service features:
• THE MONTHLY INTERNATIONAL THERMAL COAL MARKET FORECAST — Provides an up-to-date appraisal of international thermal coal markets, focusing on the heavily traded markets in the Atlantic and Pacific basins.
• MONTHLY U.S. COAL MARKET FORECAST — Provides analysis and data on a wide range of issues affecting supply, demand, balances, and ultimately, prices of coal in various U.S. regions. As a natural complement to both PIRA’s regular power grid and emissions market coverage, the U.S. Coal Market Forecast explains the interplay of factors such as production, emissions markets, weather, transportation, natural gas competition, and the economy.
• WEEKLY SCORECARD — Summarizes important developments during the intervening weeks between the monthly reports. More than just a recap, the Scorecard concentrates on market fundamentals affecting coal prices over the next 90 days.
• U.S. COAL STOCKPILE ESTIMATES — Assesses electric power sector coal inventories by region for the current calendar month. It leverages PIRA’s strengths in order to project a forward-looking days cover (or days burn) estimate for each of 10 specific regions.
• MONTHLY DRY BULK FREIGHT MARKET FORECAST — Analyzes the supply and demand fundamentals of coal, iron ore and steel freight markets. This monthly report, providing an up-to-date market review and forward outlook, is supplemented every third month by enhanced coverage, featuring additional data granularity, tables and forecasts.
• COAL PRICES ON THE ENERGY PRICE PORTAL — All of PIRA’s price forecasts and histories are available through this single interface. International Coal clients get access to prices for:
U.S.: INTERNATIONAL:
CAPP Barge PHY CAPP Rail PHY SPRB 8400 PHY FOB Bolivar CIF ARA
CAPP CSX OTC Illinois Basin Barge PHY SPRB 8800 OTC FOB Newcastle CIF Japan
CAPP NYMEX OTC NAPP Pitt 8 PHY SPRB 8800 PHY FOB Richards Bay
• ONLINE DATABASE ACCESS — In addition to price forecasts, a data portal, regularly updated, featuring by-region coal production, regional and by-sector consumption, stocks by rank, trade, and shipping rates, port information and over 2,000 shipping distances. Clients are also able to examine coal netbacks to producer ports of origin based both on latest trade data and user inputs, while utilizing a conversion calculator to facilitate quick comparisons between different coal grades and alternative fuels.
• CURRENT ISSUES BULLETINS — One-off reports that provide briefs on important issues confronting international coal markets. They include a higher level of detail and currency on relevant topics affecting both the long- and short-term outlook.
• ACCESS TO PIRA STAFF
19 COAL
© 2015 PIRA Energy Group

WHY IT MATTERS
• Understand how policies to reduce energy sector environmental impacts and emissions drive changes that affect your bottom line
• Develop a view of how market-based environmental policy mechanisms and the value they put on clean energy affect operating and investment decisions
• Identify the complex set of economic, regulatory and legal risks that accompany new regulatory actions
• Uncover the story behind the numbers and get insights into the commercial drivers along the value chain
• Know the industry backdrop for evaluating commodity and equity investments
The Total View of
ENVIRONMENTAL MARKETSPIRA’s services gives clients both the big picture perspective on significant longer-term environmental regulatory and market developments as well as up-to-date, detailed data
and analysis needed to make informed near-term decisions.
• Monthly European Emissions Trading System Market Outlook
• North American GHG Quarterly Update
• Monthly California Emissions Trading System Market Outlook
• U.S. RGGI Scorecard
• Bulletins and special reports
• PIRA Online emissions data
• Access to PIRA’s GHG staff for analytical support
• North American SO2/NOx Quarterly Update
• North American GHG Quarterly Update
• PJM REC Market Outlook
• New England REC Market Outlook
• U.S. RGGI Scorecard
• Fracking Policy Monitor
• Monthly California Emission Trading System Market Outlook
• Bulletins and special reports
• North American EMS statistics
• U.S. Federal Regulatory Calendar
GREENHOUSE GAS EMISSIONS SERVICE(GHG)
PIRA’s Greenhouse Gas Emissions Service combines a thorough assessment of policymaking drivers with an in-depth understanding of the underlying emissions fundamentals involving fuel choices, technology and economic growth. Understanding the fundamentals of GHG also provides additional insight into markets for the primary fossil fuels (coal, gas and oil), as well as for electricity (prices, incentives for new generation and “clean energy”) and is critically important to energy-intensive industries such as refining, chemicals, cement, iron/steel and pulp/paper.
NORTH AMERICAN ENVIRONMENTAL MARKETS SERVICE (EMS)
EMS gives clients both the “big picture” as well as up-to-date, detailed data and analysis needed to make informed near-term decisions. PIRA examines the forces that affect the U.S. acid rain, fine particulate and ozone-related emissions markets (i.e. CSAPR or CAIR for NOx and SO2); markets for greenhouse gases (such as RGGI and CA/WCI); emerging controls for mercury, heavy metals, acid gases, and other waste discharges into the air, water or land. PIRA's experienced analysis of the details of complex federal, regional, state and provincial regulations can help guide decision-makers and market participants.
Key Features Include:
Key Features Include:
• The Daily Renewable Generation Forecast Report,
which provides a summary of the 10-day forecast
forall countries and grids covered. It shows an
overview of the wind and solar generation on
average across main European markets and the
changes in the forecast from the previous day.
• The Hourly Generation Forecast and Data Portal,
with tables provided in Excel to allow users to
download and update their own price and supply/
demand models. Additionally, clients have the
capability to chart the data in order to visualize
the volatility in hourly output.
RENEWABLE ENERGY FORECASTING SERVICE (REF)
REF provides clients with independent and timely hourly data of wind and solar generation in main European markets. Its forecasts are derived using a sophisticated statistical model that defines the historical relationship between renewable energy output, installed capacities, and several key weather factors (sourced from leading weather authority, MDA EarthSat).
Key Features Include:
21 ENVIRONMENTAL
© 2015 PIRA Energy Group

WHY IT MATTERS
• See a holistic view of the fundamentals of supply and demand gathered through an extensive network of growers and end-users
• Uncover the story behind the numbers
• Understand the thinking of the agricultural industry’s decision makers
• Obtain real-time, actionable intelligence on supply, demand and other market factors
• Know the industry backdrop for evaluating commodity and equity investments
The Total View of
THE AGRICULTURAL MARKETSPIRA keeps clients up to date on global agricultural markets and ever-changing production
and demand estimates, while offering insights on financial and physical trading opportunities through detailed price forecasts for corn, soybeans and wheat.
AGRICULTURAL COMMODITIES SERVICE (ACRS)
PIRA offers fundamentals on agricultural commodities — “ags” —in a fashion similar to our energy-related retainer services. ACRS is designed to keep clients up to date on global agricultural markets and ever-changing production and demand estimates, while offering insights on financial, as well as physical, trading opportunities through detailed price forecasts. The service is centered on corn, soybeans, soy products, and wheat, but coverage of other commodities such as cattle, hogs, and ethanol is also part of ACRS, as these commodities relate to demand for the underlying grains and oilseeds. While primarily quantitative in nature, ACRS also offers a unique view into the minds of major global farmers and ags professionals on everything from fertilizer purchases and application tendencies to crop and seed choices. Analysis is provided through timely reports and data sets, along with direct access to PIRA’s agriculture analysts. And existing PIRA clients who buy ACRS will have the further advantage of a single point of contact for their energy and agricultural analysis.
Clients of PIRA’s ACRS receive the following deliverables:
• OPENING PRINT - Typically released three times a week before the markets open, OP keeps clients current on ever-changing market dynamics by offering a unique perspective as well as PIRA’s near-term price targets. From analysis of weekly market-sensitive data releases, to interpretation of recent price movements, to weather forecast changes and cash market updates, OP is a concise update with timely, actionable information. During harvests and crop tours, OP is issued as frequently as five times a week “from the field,” with real-time reports on yield expectations.
• WEEKLY AGS SCORECARD - Complements Opening Print with relevant charts and graphs as well as PIRA’s 30-day outlook. During the growing seasons, special attention is given to weather forecasts and soil conditions heading into the weekends. The Scorecard takes a deeper dive into the weekly Crop Progress reports issued by the National Agriculture Statistics Service from April through November.
• WASDE PREVIEW - Issued two trading days prior to the release of the USDA’s monthly World Agricultural Supply and Demand Estimates (WASDE) reports, it focuses on what to expect in the upcoming WASDE report while also providing comparisons to the previous month. The Preview includes PIRA’s estimates of all of the WASDE components, including corn, soybeans, soybean meal, soybean oil, and wheat. Forecast changes in production, demand factors, and near-term and medium-term price forecasts are highlighted in the Preview. Analysis includes expectations from commercial trading entities and polls conducted throughout the industry.
• WASDE CONFERENCE CALLS - PIRA conducts conference calls for ACRS clients approximately one hour after the release of critical WASDE reports to discuss and examine the numbers before the markets open. During the U.S. growing season, the calls may feature a major corn and soybean producer or other agri-business professional for their impressions of the report and a “reality check” on the production numbers.
• CROP TOUR UPDATES - The Pro Farmer Crop Tour takes place annually in late August and is arguably the most important week of the year for compiling yield data on U.S. corn and soybean crops. Typically, over 1,000 field samples are taken by almost 100 crop scouts, from Ohio to South Dakota, in an effort to estimate U.S. corn and soybean production. PIRA issues updates each evening from the Tour through the Opening Print, giving clients real-time access to that day’s data as well as overall impressions on a state-by-state basis.
• THE ACRS DATABASE PORTAL, VIA PIRA DIMENSIONS - PIRA houses all the ACRS deliverables (current and archived) in a dedicated, easy-to-navigate Web portal. In addition to analytical reports, the ACRS Portal contains the statistical information on Crop Tour Data and Commitment of Traders
• PHONE AND EMAIL ACCESS TO PIRA’S AGS GROUP
23 AGRICULTURAL
© 2015 PIRA Energy Group
DATA TOOLS
Interactive models and comprehensive data sets underpin PIRA’s analysis and offer user-defined research.

25 DATA TOOLS
ENERGY PRICE PORTAL
The Energy Price Portal contains all of PIRA’s price forecasts across commodities, allowing clients quick access to a comprehensive, internally consistent view of global and regional energy prices.
• Gives clients a powerful predictive tool in forecasting price development for planning, trading, budgeting, and hedging strategies
• Offers one consistent view of all energy markets, across commodities and regions
• Allows clients to automatically update with PIRA's latest price outlook
FEATURES
• Access PIRA's latest energy price forecasts, developed through internally consistent methodologies
• See short-term monthly price forecasts or long-term annual price forecasts
• Create and store custom price spreads using the Price Equation Manager
• View prices in 16 different currencies, as real or nominal, or in different units
• Generate charts and export data
PRICES INCLUDE:
• 34 crudes: international benchmarks and major regional markers
• 91 refined product prices spread across the globe: U.S. Gulf and West Coasts, Chicago, NYH, Rotterdam, Mediterranean, Arab Gulf, Singapore, and Japan
• 14 refinery margins
• Natural gas – 30 U.S. regional basis prices and differentials, wholesale and indexed prices Europe
• All major NGLs at Mt. Belvieu, Europe and Asia
• Contract and spot LNG prices in the Atlantic Basin and Asia.
• 11 U.S. coal prices and 5 overseas citations.
• Electricity – North American (by-grid) and European (by-country) regional baseload and on-peak/off-peak prices, spark spreads, and dark spreads.
• Biofuels –Brazil ethanol, U.S. ethanol and biodiesel, and EU methyl ester.
• Emissions – EUAs, RGGI and WCI CO2, and CSAPR NOx and CO2.
26 DATA TOOLS
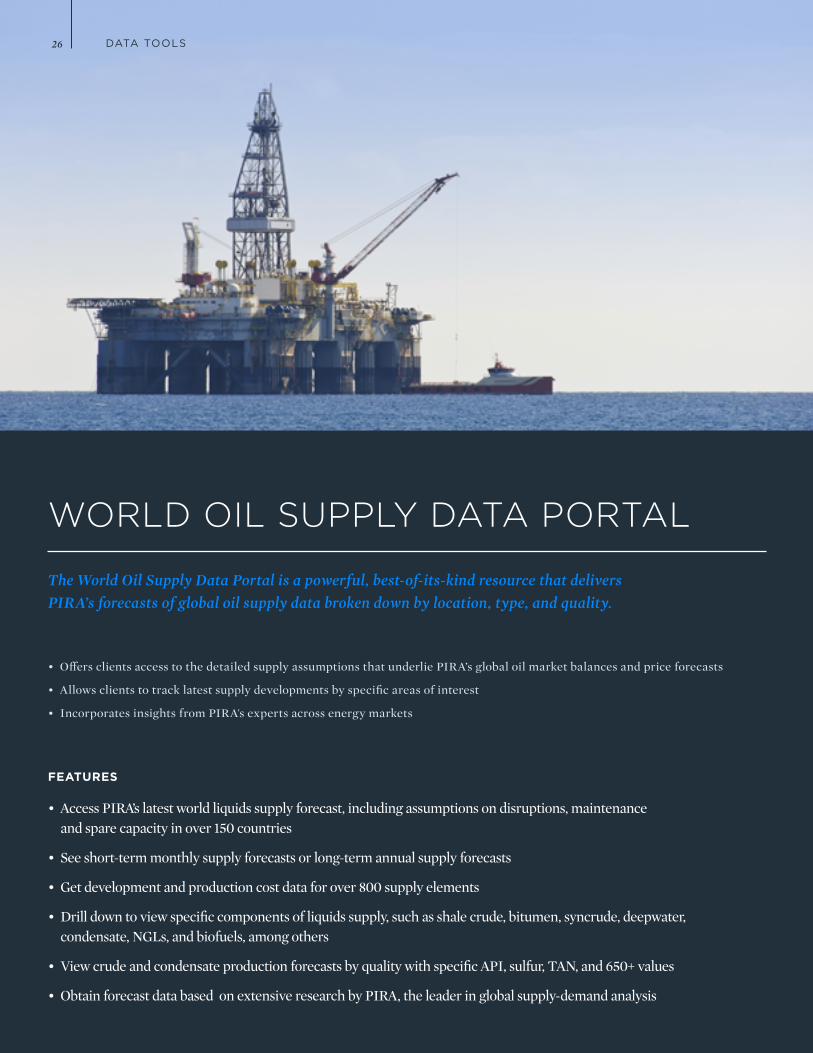
WORLD OIL SUPPLY DATA PORTAL
The World Oil Supply Data Portal is a powerful, best-of-its-kind resource that delivers PIRA’s forecasts of global oil supply data broken down by location, type, and quality.
FEATURES
• Access PIRA’s latest world liquids supply forecast, including assumptions on disruptions, maintenance and spare capacity in over 150 countries
• See short-term monthly supply forecasts or long-term annual supply forecasts
• Get development and production cost data for over 800 supply elements
• Drill down to view specific components of liquids supply, such as shale crude, bitumen, syncrude, deepwater, condensate, NGLs, and biofuels, among others
• View crude and condensate production forecasts by quality with specific API, sulfur, TAN, and 650+ values
• Obtain forecast data based on extensive research by PIRA, the leader in global supply-demand analysis
• Offers clients access to the detailed supply assumptions that underlie PIRA’s global oil market balances and price forecasts
• Allows clients to track latest supply developments by specific areas of interest
• Incorporates insights from PIRA's experts across energy markets

DATA TOOLS
WORLD ENERGY DEMAND FORECAST PORTAL
The World Energy Demand Forecast Data Portal is the most comprehensive database of its type in the world, covering energy demand by sector, fuel and product.
FEATURES
• Covers energy demand by sector, by fuel and by product for each of 140 countries
• Provides the ability for clients to test their own assumptions and create customized demand scenarios
• Reflects PIRA’s detailed projects for prices, country-specific GDP and population growth, fuel substitution, technological change and efficiency gains
• Forecast to 2035 using PIRA’s assessments of technology, policy and market incentives for every fuel and sector
• Offers access to the detailed demand assumptions that underlie PIRA's balances and price forecasts in all energy markets
• Provides a mechanism to discover important energy trends that are not apparent at the macro level through consistent historical and forecast data
• Incorporates insights from PIRA's experts across energy markets
27
DATA TOOLS
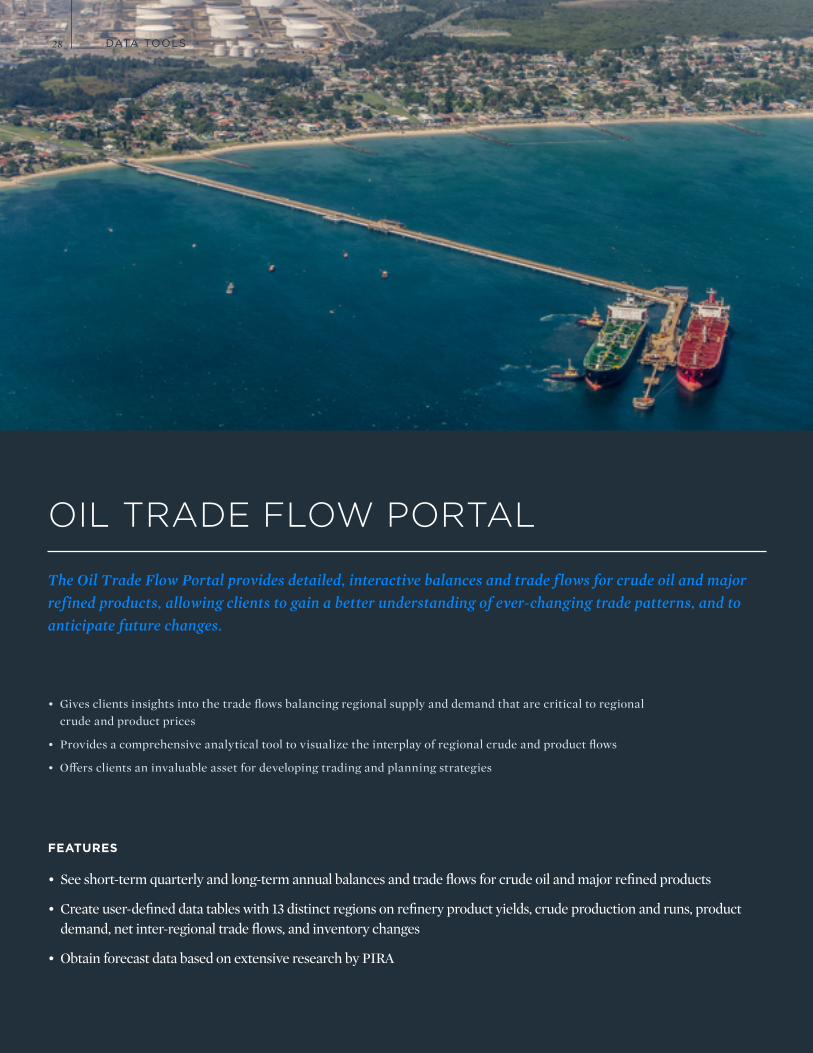
OIL TRADE FLOW PORTAL
The Oil Trade Flow Portal provides detailed, interactive balances and trade f lows for crude oil and major refined products, allowing clients to gain a better understanding of ever-changing trade patterns, and to anticipate future changes.
FEATURES
• See short-term quarterly and long-term annual balances and trade flows for crude oil and major refined products
• Create user-defined data tables with 13 distinct regions on refinery product yields, crude production and runs, product demand, net inter-regional trade flows, and inventory changes
• Obtain forecast data based on extensive research by PIRA
• Gives clients insights into the trade flows balancing regional supply and demand that are critical to regional crude and product prices
• Provides a comprehensive analytical tool to visualize the interplay of regional crude and product flows
• Offers clients an invaluable asset for developing trading and planning strategies
28
DATA TOOLS
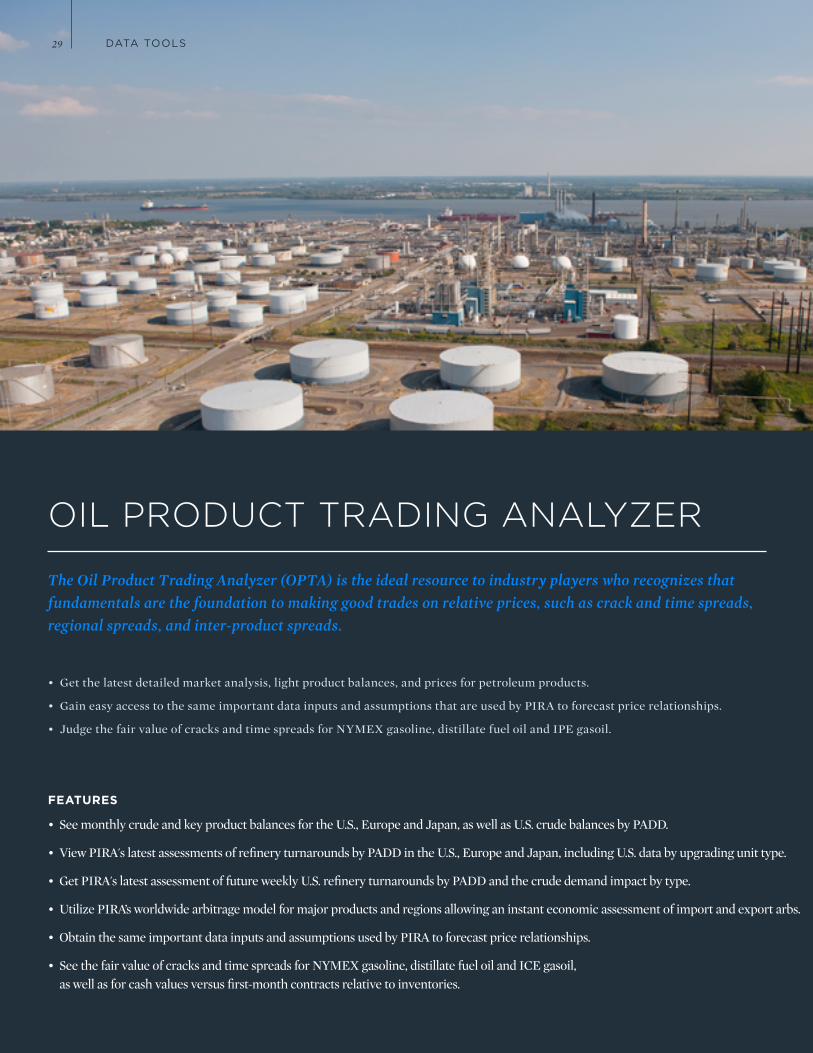
OIL PRODUCT TRADING ANALYZER
The Oil Product Trading Analyzer (OPTA) is the ideal resource to industry players who recognizes that fundamentals are the foundation to making good trades on relative prices, such as crack and time spreads, regional spreads, and inter-product spreads.
FEATURES
• See monthly crude and key product balances for the U.S., Europe and Japan, as well as U.S. crude balances by PADD.
• View PIRA's latest assessments of refinery turnarounds by PADD in the U.S., Europe and Japan, including U.S. data by upgrading unit type.
• Get PIRA's latest assessment of future weekly U.S. refinery turnarounds by PADD and the crude demand impact by type.
• Utilize PIRA’s worldwide arbitrage model for major products and regions allowing an instant economic assessment of import and export arbs.
• Obtain the same important data inputs and assumptions used by PIRA to forecast price relationships.
• See the fair value of cracks and time spreads for NYMEX gasoline, distillate fuel oil and ICE gasoil, as well as for cash values versus first-month contracts relative to inventories.
• Get the latest detailed market analysis, light product balances, and prices for petroleum products.
• Gain easy access to the same important data inputs and assumptions that are used by PIRA to forecast price relationships.
• Judge the fair value of cracks and time spreads for NYMEX gasoline, distillate fuel oil and IPE gasoil.
29
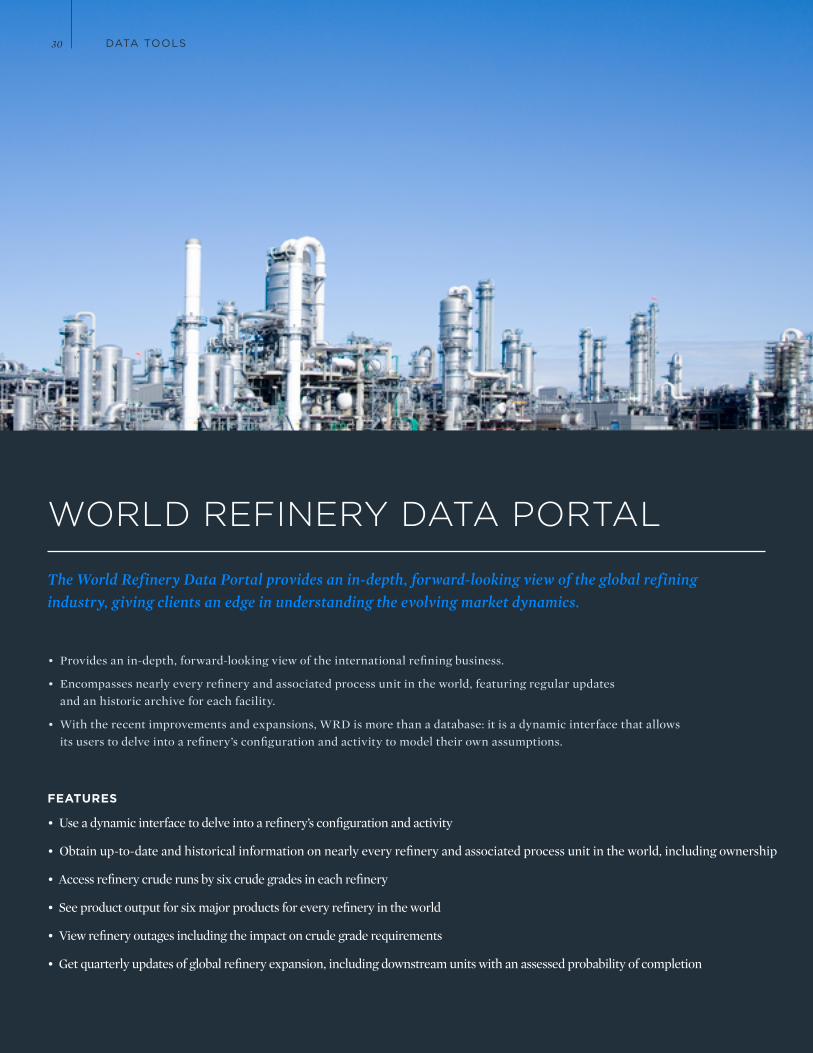
WORLD REFINERY DATA PORTAL
The World Refinery Data Portal provides an in-depth, forward-looking view of the global refining industry, giving clients an edge in understanding the evolving market dynamics.
DATA TOOLS
FEATURES
• Use a dynamic interface to delve into a refinery’s configuration and activity
• Obtain up-to-date and historical information on nearly every refinery and associated process unit in the world, including ownership
• Access refinery crude runs by six crude grades in each refinery
• See product output for six major products for every refinery in the world
• View refinery outages including the impact on crude grade requirements
• Get quarterly updates of global refinery expansion, including downstream units with an assessed probability of completion
• Provides an in-depth, forward-looking view of the international refining business.
• Encompasses nearly every refinery and associated process unit in the world, featuring regular updates and an historic archive for each facility.
• With the recent improvements and expansions, WRD is more than a database: it is a dynamic interface that allows its users to delve into a refinery’s configuration and activity to model their own assumptions.
30

NORTH AMERICANEW YORK - October• This comprehensive seminar includes a plenary session to review PIRA’s short- and
long-term outlook for world crude oil and petroleum products, natural gas, electric power, coal and emissions markets.
• The seminar features over 25 breakout sessions on specific issues or structural changes taking place in energy commodity markets throughout the world.
• Excel spreadsheets of energy forecasts by region and energy source through 2035, as well as the Seminar presentations themselves (audio and visual), are available via DIMENSIONSSM.
EUROPELONDON - June
• This event is held exclusively for PIRA oil, gas, or electricity clients headquartered in the Eastern Hemisphere.
• This seminar covers PIRA’s latest views on crude oil supply/demand and price differentials, regional petroleum product markets, refining outlook, specific trends in gas trade, as well as an outlook for electricity, coal, and emissions markets.
ASIA-PACIFICSINGAPORE - November
• Held exclusively for PIRA Clients with offices in the Asia-Pacific region.
• PIRA reviews its short- and long-term outlook for world crude oil and petroleum products, natural gas, electric power, coal and emissions, with a focus on the Asian markets. It also examines the major structural changes expected in various world energy markets.
CANADACALGARY - June
• Held exclusively for PIRA Clients with offices in Canada.
• PIRA reviews its short- and long-term outlook for world crude oil and petroleum products, natural gas, electric power, coal and emissions, with a focus on the Canadian markets. It also examines the major structural changes expected in various world energy markets.
PIRA SEMINARSANNUAL CLIENT SEMINARS
These events — offered only to those companies that retain PIRA — allow clients to meet directly with analysts, who present PIRA’s medium- and long-term view of oil, gas, coal, electricity, emissions, and agricultural markets. With different locations, clients have ease of travel and the opportunity to hear more detailed insight on their region.
31

PIRA UNIVERSITY
UNDERSTANDING GLOBAL OIL MARKETS
LONDON - Annually in June
HOUSTON - Annually in June
NEW YORK - Annually in December
• A two-day beginner- to intermediate-level training seminar providing an in-depth look at market supply/demand fundamentals and pricing and refining trends.
• An explanation of how PIRA incorporates all of its data and analysis into the development of its own forecasts of near- and long-term crude and product prices and margins.
• Extensive discussion of the role of speculators, the impact of geopolitical issues and other risk factors, as well as the development of long-term price scenarios.
UNDERSTANDING NATURAL GAS MARKETS
NEW YORK - Annually in December• A two-day training seminar that teaches the essential commercial activities and
decisions that tie together volumes and prices in the emerging global gas market.
• Helps clients develop a richer, more in-depth view of what drives North American, European, and Asian gas prices — while also helping them test their own assessments of the outlook for prices.
ENERGY MARKETS TRAINING
PIRA University (“PIRA U”) seminars are conducted by PIRA’s senior consultants and provide comprehensive market training to entry- and mid-level analysts and managers by covering every phase of the supply chains. Such an understanding is crucial to energy traders, planners, marketers, analysts, and risk managers to perform with the highest level of knowledge.
32
RECENT PIRA INDUSTRY STUDIES
PIRA conducts deep exploration of current industry topics to help you navigate the risks and opportunities for your business.
In addition to its core retainer services, PIRA also delves deep into specific market topics through periodic industry studies. Focusing on current major energy markets, regions or issues, these studies deliver in-depth research by working with clients to understand their specific interests and needs. The studies go beyond what regular retainer services or reports might cover and identify key developments and market changes, and their anticipated impact on prices.
Each study is led by a team of PIRA’s highly experienced experts who provide findings and recommendations that can immediately be applied to the work of the client’s organization. A study’s production generally involves four to 10 months of research, modeling, and written analysis.
Industry studies enable companies to obtain critical energy intelligence at a fraction of the cost of conducting a study themselves.
Each study typically includes:
• Comprehensive written report with an executive summary• A live workshop with PIRA’s energy experts• Access to an online database
33 PIRA INDUSTRY STUDIES
© 2015 PIRA Energy Group
THE GLOBAL IMPACT OF NGL SUPPLY GROWTH PIRA's Comprehensive Outlook to 2035
REGULATING CARBONImpacts of the EPA’s Final Clean Power Plan Options
PLANNING FOR TOMORROWA Five-Year Outlook for Crude Oil and Refined Product Markets, 2015-2020

WHY IT MATTERS
• Gain access to a complete archive of PIRA research in a single platform
• Search for critical insights or data and download to your own workflow
• Manage your preferences to get what you need when you want it
PIRA DIMENSIONS SM
Provides desktop and mobile access to our analysis, data and research tools. These include short- to long-term outlook reports, associated data sets,
current news & analysis and video content.

Please visit us online or contact your PIRA Sales Representative at: www.pira.com
FOR MORE INFORMATION
GLOBAL HEADQUARTERS
3 Park AvenueNew York, NY 10016-5989Tel +1 212 686 6808
EUROPE, MIDDLE EAST, AFRICA
Tel +49 7642 920 825Email [email protected]
AMERICAS
Tel +1 212 686 6808Email [email protected]
ASIA-PACIFIC
Tel +86 10 5963 0186Email [email protected]

P I R A . C O M