Embed Size (px)
Citation preview

Leader in industrial pow
er outsourcing market
Leader in industrial pow
er outsourcing market
and in green energy generation
and in green energy generation
IPO Presentation
IPO Presentation
April, 2005
April, 2005
2
�Key investment highlights
�Market and competition
�Business model and strategy
�Financial standing
�New
projects
�IPO details
Agenda
Agenda

Key investment highlights
Key investment highlights

4
�PEP is the leader in industrial power outsourcing market and in generation
& supply of green energy from
biomass
�PEP’smarket segm
ents are fast grow
ing, especially renew
able energy
�Proven track record places PEP ahead of competition
�PEP business model provides shareholders with growing and predictable cash
flow
sKey investment highlights
Key investment highlights

Market and com
petition
Market and com
petition
6
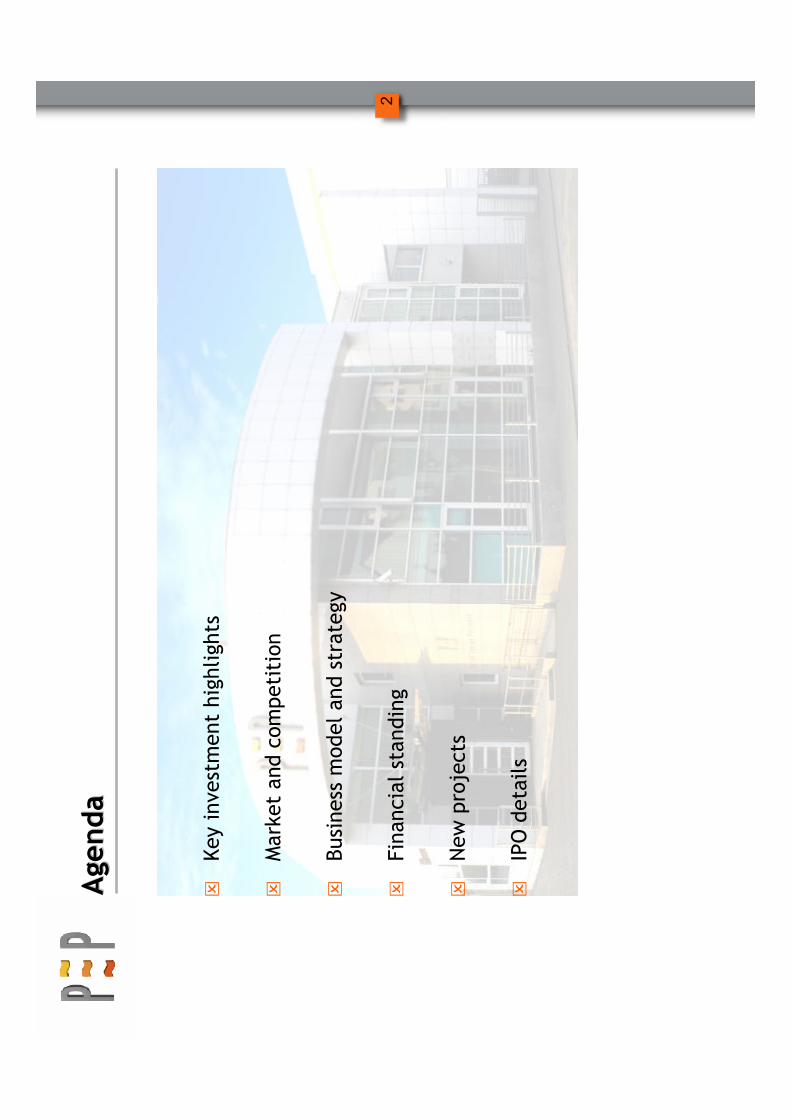
We operate in attractive niche pow
er market segm
ents
We operate in attractive niche pow
er market segm
ents
Polish energy market is worth PLN 30bn
p.a, industrial cogeneration and
renewable energyshare accounts for 10%
PEP MARKET
PEP MARKET
POWER AND HEAT PLANT
REN
EWABLE ENERGY
GROWTH
LEADER POSITION AND
GROWTH
INDUSTRIAL PLANT ALLIANCE CONCEPT
20 YEAR CONTRACT
LONG TERM SUPPLY CONTRACTS
DISTRIBUTORS
7
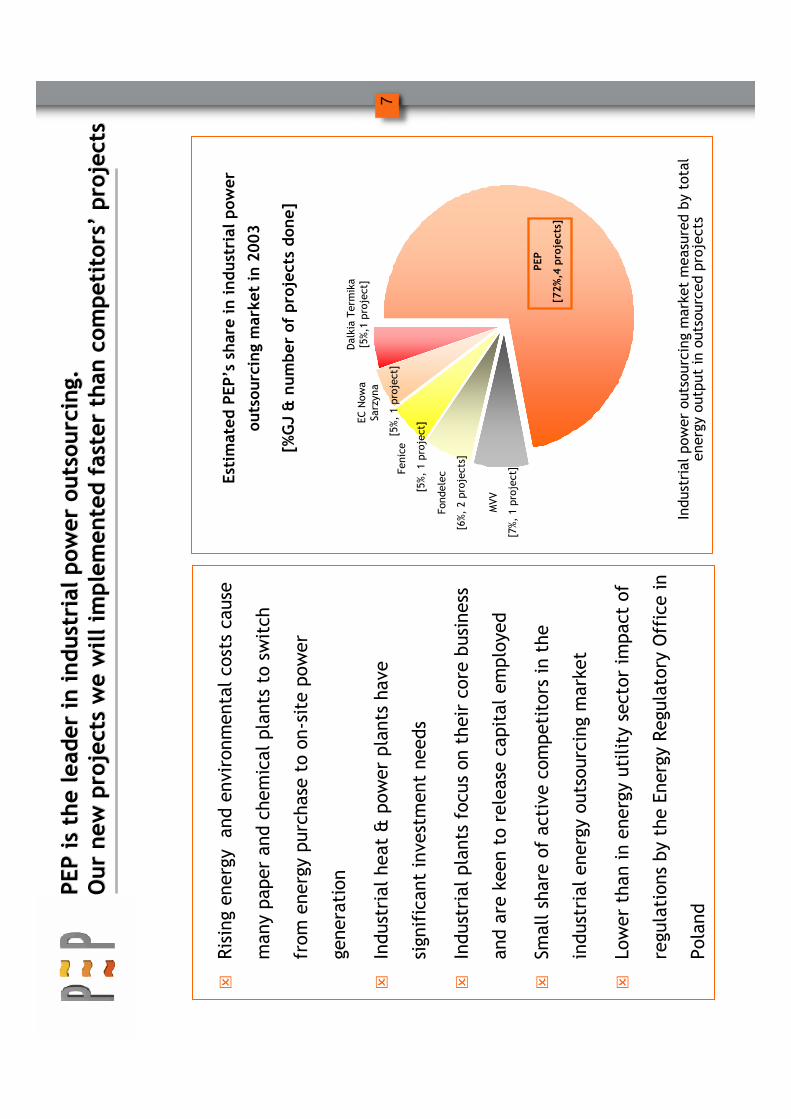
PEP is the leader in industrial pow
er outsourcing.
PEP is the leader in industrial pow
er outsourcing.
Our new projects we will implemented faster than com
petitors
Our new projects we will implemented faster than com
petitors’’projects
projects
�Rising energy and environm
ental costs cause
many paper and chem
ical plants to switch
from
energy purchase to on-site power
generation
�Industrial heat & pow
er plants have
significant investment needs
�Industrial plants focus on their core business
and are keen to release capital em
ployed
�Sm
all share of active competitors in the
industrial energy outsourcing market
�Lower than in energy utility sector impact of
regulations by the Energy Regulatory Office in
Poland
EstimatedPEP’sshare in industrial pow
er
outsourcing market in 2003
[%GJ & number of projects done]
PEP
[72%,4 projects]
Fondelec
[6%, 2 projects]
Fenice
[5%, 1 project]
ECNow
a Sarzyna
[5%, 1 project]
Dalkia Termika
[5%,1 project]
MVV
[7%, 1 project]
Industrial pow
er outsourcing market measured by total
energy output in outsourced projects
8
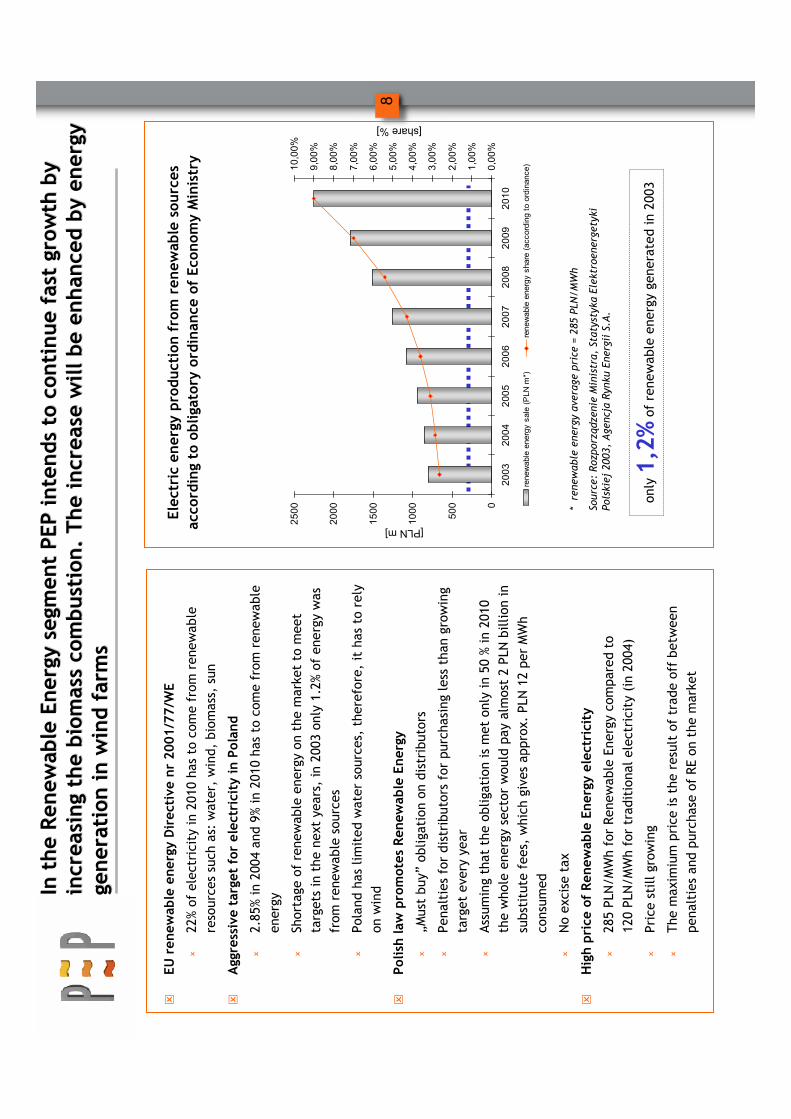
�EU
renewable energy Directive nr 2001/77/W
E
�22% of electricity in 2010 has to com
e from
renew
able
resources such as: water, wind, biomass, sun
�Aggressive target for electricity in Poland
�2.85% in 2004 and 9% in 2010 has to come from
renew
able
energy
�Shortage of renewable energy on the market to meet
targets in the next years, in 2003 only 1.2% of energy was
from
renew
able sources
�Poland has limited water sources, therefore, it has to rely
on wind
�Polish law
promotes Renewable Energy
�„Must buy”
obligation on distributors
�Penalties for distributors for purchasing less than growing
target every year
�Assum
ing that the obligation is met only in 50 % in 2010
the whole energy sector would pay almost 2 PLN billion in
substitute fees, which gives approx. PLN 12 perMWh
consum
ed
�No excise tax
�High price of Renewable Energy electricity
�285 PLN/MWhfor Renew
able Energy compared to
120 PLN/MWhfor traditional electricity (in 2004)
�Price still growing
�The
maximiumprice is the result of trade off between
penalties and purchase of RE on the market
In the Renewable Energy segm
ent PEP intends to continue fast gro
In the Renewable Energy segm
ent PEP intends to continue fast growth by
wth by
increasing the biomass combustion. The increase will be enhanced
increasing the biomass combustion. The increase will be enhancedby energy
by energy
generation in wind farms
generation in wind farms
Electric energy production from renewable sources
according to obligatory ordinance of Economy Ministry
0
500
1000
1500
2000
2500
2003
2004
2005
2006
2007
2008
2009
2010
0,00%
1,00%
2,00%
3,00%
4,00%
5,00%
6,00%
7,00%
8,00%
9,00%
10,00%
renewable energy sale (PLN m
*)renewable energy share (according to ordinance)
[PLN m]
[share %]
* renewable energy average price
= 285 PLN/MWh
Source:Rozporządzenie M
inistra,Sta
tystyka Elektroenergetyki
Polskiej2003,Agencja Rynku EnergiiS.A
.
only 1,2%
ofrenewable energy generated in 2003

Business model and strategy
Business model and strategy

10
Nov 1998PEP is successfully managing five facilities and is the leader i
PEP is successfully managing five facilities and is the leader i n industrial pow
er
n industrial pow
er
outsourcing and generation of renewable energy from
biomass
outsourcing and generation of renewable energy from
biomass
Jan 2001
June 2001
May 2002March 2004
July 2004
July 2004March 2005
Wind pow
er development j.v.with EPA
Start of CFB Boiler in Saturn
Contract withWałbrzych
Coke Mill
Mercury (Wałbrzych) in operation
CHP Saturn in operation
New
investor-PolenergyInvestments B.V. CHPJeziornain operation
CHPZakrzówin operation
Oct 2000 CHPWizówin operation
Contract withWizów
chem
ical plant
Establishing PEP; first investor-Enterprise Investors
Contract with Polar
July 1999
Nov 2000
Contract withMetsaTissue
April 2002
Contract withMondiPackaging PaperŚw
iecie
July 1998
July 1997
June 2005
CHPJeziornaoperation extension
11
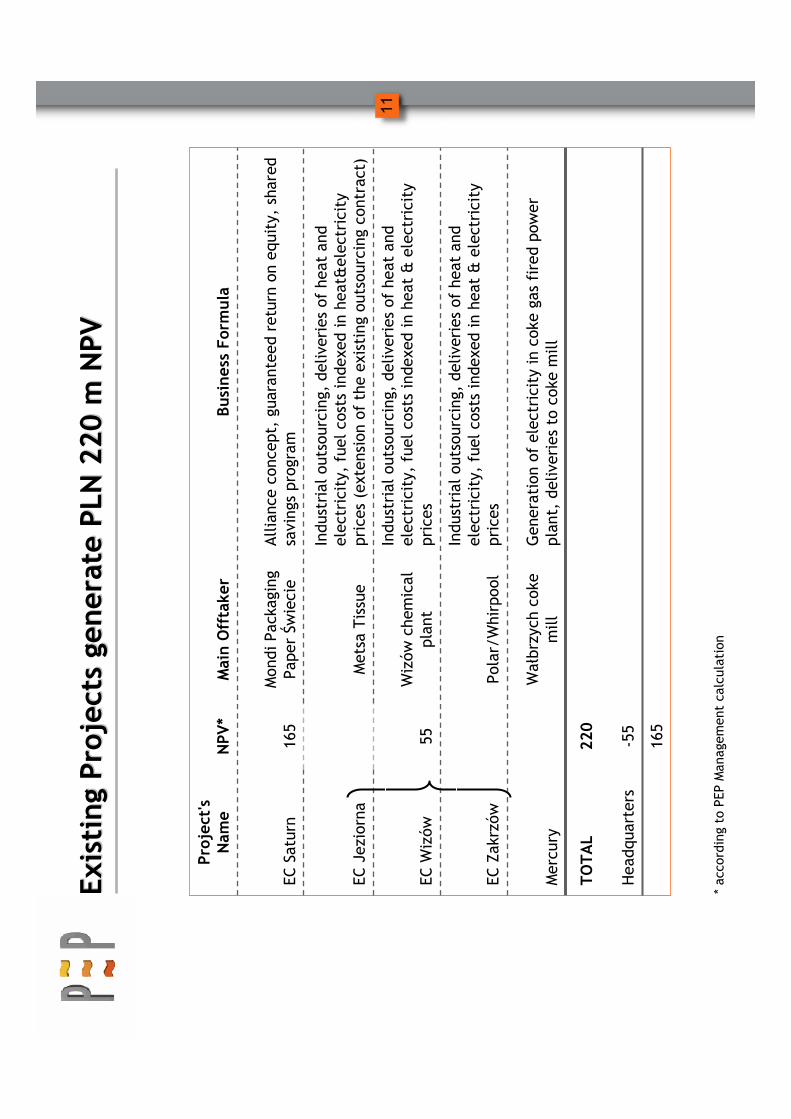
Existing Projects generate PLN 220 m NPV
Existing Projects generate PLN 220 m NPV
Industrial outsourcing, deliveries of heat and
electricity, fuel costs indexed in heat&electricity
prices (extension of the existing outsourcing contract)
MetsaTissue
EC Jeziorna
165
-55
Headquarters
220
TOTAL
Generation of electricity in coke gas fired pow
er
plant, deliveries to coke mill
Wałbrzych
coke
mill
Mercury
Industrial outsourcing, deliveries of heat and
electricity, fuel costs indexed in heat & electricity
prices
Polar/Whirpool
ECZakrzów
Industrial outsourcing, deliveries of heat and
electricity, fuel costs indexed in heat & electricity
prices
Wizów
chem
ical
plant
55EC
Wizów
Alliance concept, guaranteed return on equity, shared
savings program
MondiPackaging
PaperŚwiecie
165
EC Saturn
Business Formula
MainOfftaker
NPV*
Project's
Nam
e
* according to PEP Managem
ent calculation

12
In 2002
In 2002PEP took over the MPP
PEP took over the MPP ŚŚwiecie
wiecieheat and pow
er plant
heat and pow
er plant
�MondiPackaging PaperŚwiecieS.A. (formerFrantschach ŚwiecieS.A.), in order to
reduce the energy cost in the total manufacturing costs, had to build a boiler
combusting biom
ass coming from
the paper production process. The
planned
investment was supposed to amount to app. EUR 45 million.
�Simultaneously, MPP
Świeciewas implem
enting an investment program within its
core business, i.e. paper production, totaling EUR 180 million
�In the light of considerable investments in the core business, the com
pany could
not and did not want to make such important investments in the heat and pow
er
plant
13
�In order to implem
ent the necessary investments and reduce energy costs, the
Board of Directors made a decision on outsourcing the combined heat and pow
er
plant
�One of the essential tender terms was to come up with a co-operation model in
which MPP
Świecieretains the strategic control over the separated heat and power
plant, implem
entation of the investment program and cost reduction
�PEP proposed the so called Alliance Concept, a co-operation model which met all
the requirem
ents offering the best technical solutions and cost reduction
In 2002, PEP took over the MPP
In 2002, PEP took over the MPP ŚŚwiecie
wiecieheat and pow
er plant
heat and pow
er plant

14
�20 year contract
�PEP to implem
ent a jointly agreed investment program
�Continuous reduction of heat and electricity costs
�System
of mutual settlements based on the “open-book”principles and incurring by the
custom
er the macro risks, including FX rate risk related to debtservice and purchase of raw
materials
�For PEP, the safe and predictable IRR in long term, at the minimum level of 16% depends on:
�capital invested,
�quality of operating services,
�cost reduction level and
�ROCE of MPP
Świecie
and does not depend on the energy sales volum
e
�The benefits from
the mutual savings program are to be split between PEP and MPP
Świecie
The Alliance Concept with MPP
The Alliance Concept with MPP ŚŚwiecie
wiecieassumes:
assumes:
15
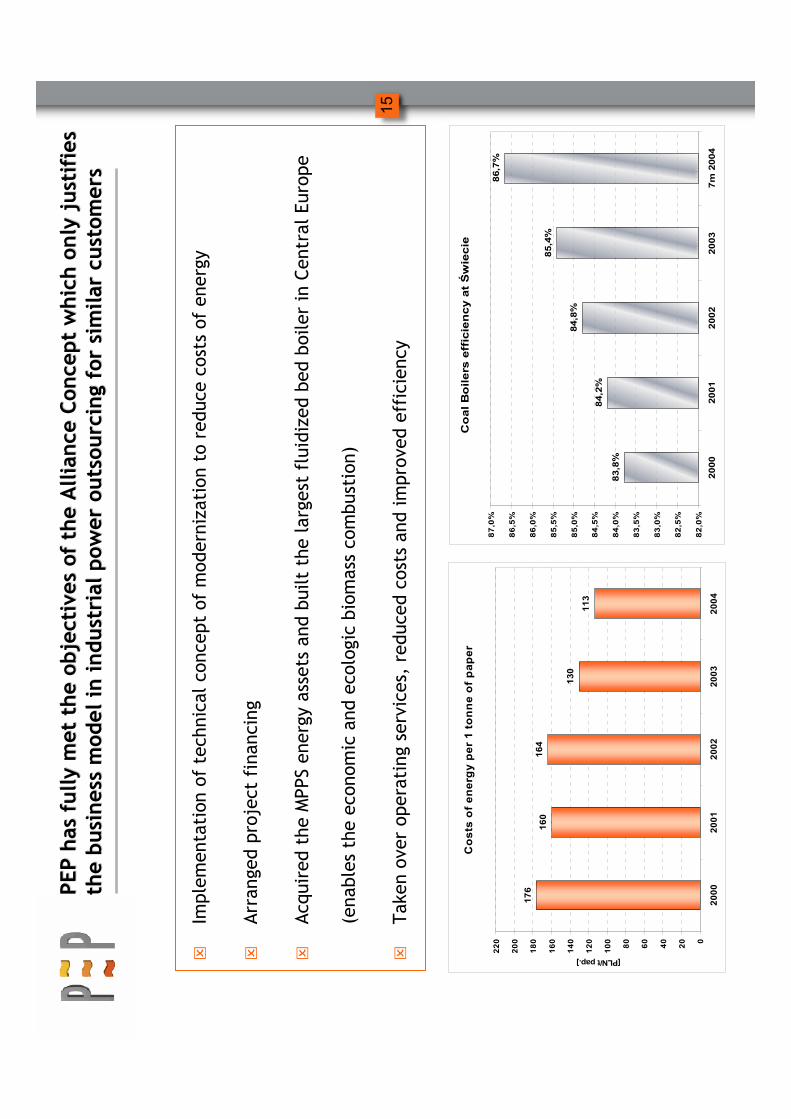
�Implem
entation of technical concept of modernization to reduce costs of energy
�Arranged project financing
�Acquired the MPPS energy assets and built the largest fluidized bed boiler in Central Europe
(enables the economic and ecologic biom
ass combustion)
�Taken overoperatingservices, reduced costs and improved efficiency
Costs of energy per 1 tonne of paper
176
160
164
130
113
0
20
40
60
80
100
120
140
160
180
200
220
2000
2001
2002
2003
2004
[PLN/t pap.]
Coal Boilers efficiency at Świecie
83,8%
84,2%
84,8%
85,4%
86,7%
82,0%
82,5%
83,0%
83,5%
84,0%
84,5%
85,0%
85,5%
86,0%
86,5%
87,0%
2000
2001
2002
2003
7m 2004
PEP has fully met the objectives of the Alliance Concept which o
PEP has fully met the objectives of the Alliance Concept which only justifies
nly justifies
the business model in industrial pow
er outsourcing for similar c
the business model in industrial pow
er outsourcing for similar custom
ers
ustom
ers
16
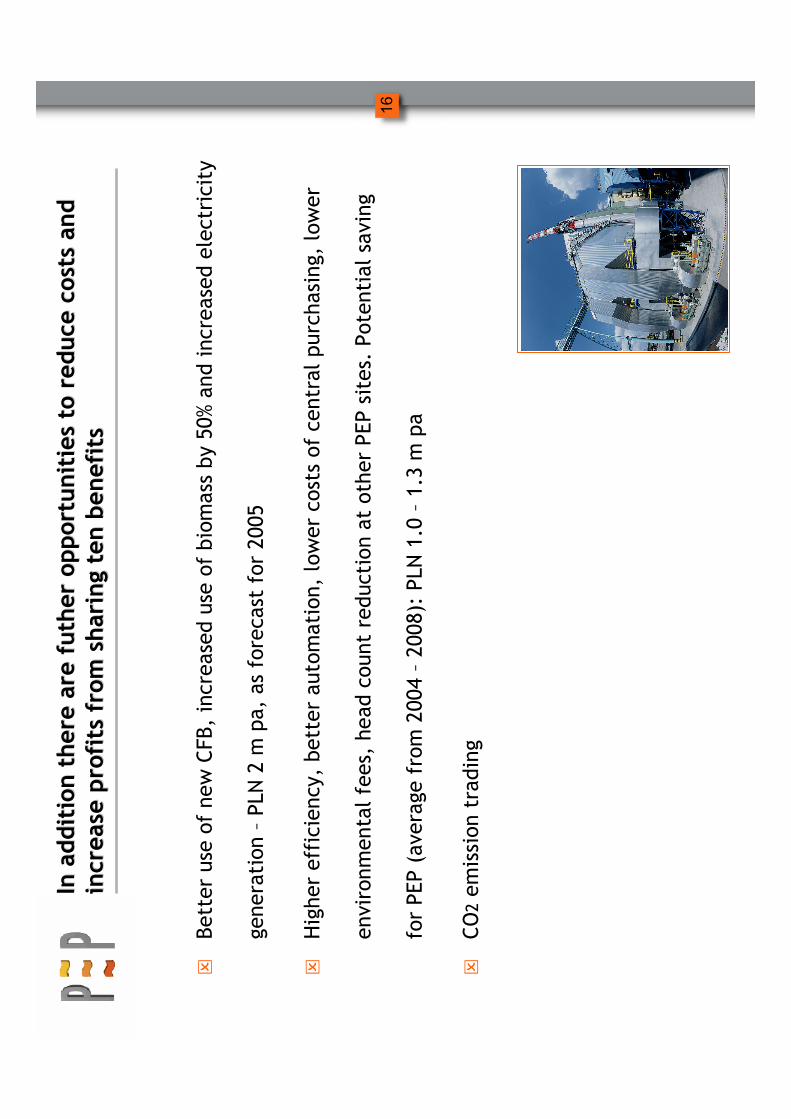
�Better use of new CFB, increased use of biomass by 50% and increased electricity
generation
–PLN 2 m pa, as forecast for 2005
�Higher efficiency, better autom
ation, low
er costs of central purchasing, lower
environm
ental fees, head count reduction at other PEP sites. Potential saving
for PEP (average from 2004 –2008): PLN 1.0 –1.3 m pa
�CO2em
ission trading
In addition there are
In addition there are
futher
futheropportunities to reduce costs and
opportunities to reduce costs and
increase profits from sharing ten benefits
increase profits from sharing ten benefits

17
Alliance Concept allows to reduce som
e risks
Alliance Concept allows to reduce som
e risks
XCost of credit
XService and
Modernizations
XEnvironm
ental
costs
XCustomer financial
standing
XEquipm
ent
efficiency
XChange in Law and
Regulations
XFuel price
increase
Custom
er
Pow
er
plant
Typical risk Profile
PEP risk Profile
XX
Cost of credit and
debt risk
XService and
Modernizations
XEnvironm
ental
costs
XCustomer
financial standing
XEquipm
ent
efficiency
XChange in Law
and Regulations
XFuel price
increase
Custom
er
PEP
Who bears the risks?

18
�Our contracts with key clients are for 20 years
�Our clients are healthy local com
panies
with good financial outlook, mainly
operating in paper, chem
ical and petrochem
ical industry
�Our business structure transfers the macroeconom
ic risk (e.g. changes in fuel price)
to the customers through agreed „pass through”mechanism or indexation formula
�Our business structure assures good return on invested equity through leverage and
contract formulas
�Our know-how
assures excellent operational results –lower energy costs for our
clientsAlliance Concept allows to generate stable and predictable cash
Alliance Concept allows to generate stable and predictable cash
flow
sflow
s
19
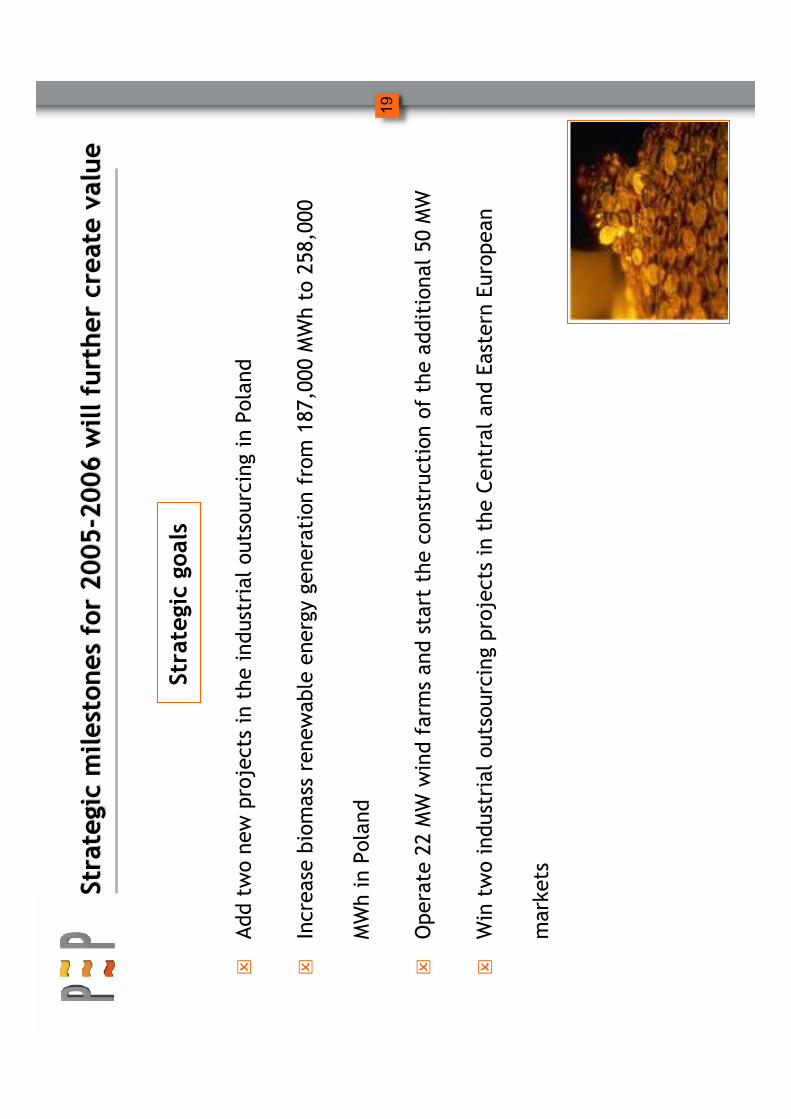
�Add two new projects in the industrial outsourcing in Poland
�Increase biomass renewable energy generation from 187,000
MWhto 258,000
MWhin Poland
�Operate 22 MW wind farms and start the construction of the additional 50 MW
�Win two industrial outsourcing projects in the Central and Eastern European
markets
Strategic milestones for 2005
Strategic milestones for 2005-- 2006 will further create value
2006 will further create value
Strategic goals

Financial standing
Financial standing

21
Key financial inform
ation
Key financial inform
ation
64 764
52 926
65 584
65 195
34 226
Operational revenue
with interests from
leased assets
40 325
26 449
8 627
2004
144 747
40 954
9 012
2005
Forecast
108 332
126 000
2 088
Capital expenditure
25 704
18 126
-3 718
Adjusted cash flow
from
operations*
6 766
14 249
-11 044
Net profit
2003
2002
2001
[‘000 PLN]
* NOTE: Cash
flow fro
m operations pre
sente
d w
ith equity and debt servicepayments disclosed
in oth
er investment in flows section of CFnet off investment VAT rece
ivables

22
PEP has proven its capability to deliver and increase shareholde
PEP has proven its capability to deliver and increase shareholder r
value from its markets
value from its markets……(1/2)
(1/2)
NOTE: Cash
flow fro
m operations pre
sente
d w
ith equity and debt servicepayments disclosed
in oth
er investment in flows section of CFand net off investment VAT rece
ivables
(5 6
41)
(3 7
18)
18 1
26
25 7
04
26 4
49
40 9
54
(6 00
0)(1
000)
4 000
9 000
14 00
019
000
24 00
029
000
34 00
039
000
44 00
0
2000
2001
2002
2003
2004
2005P
AD
JUS
TED
CA
SH
FLO
W F
RO
M O
PER
ATIO
NS
[PLN
thousa
nd]
23
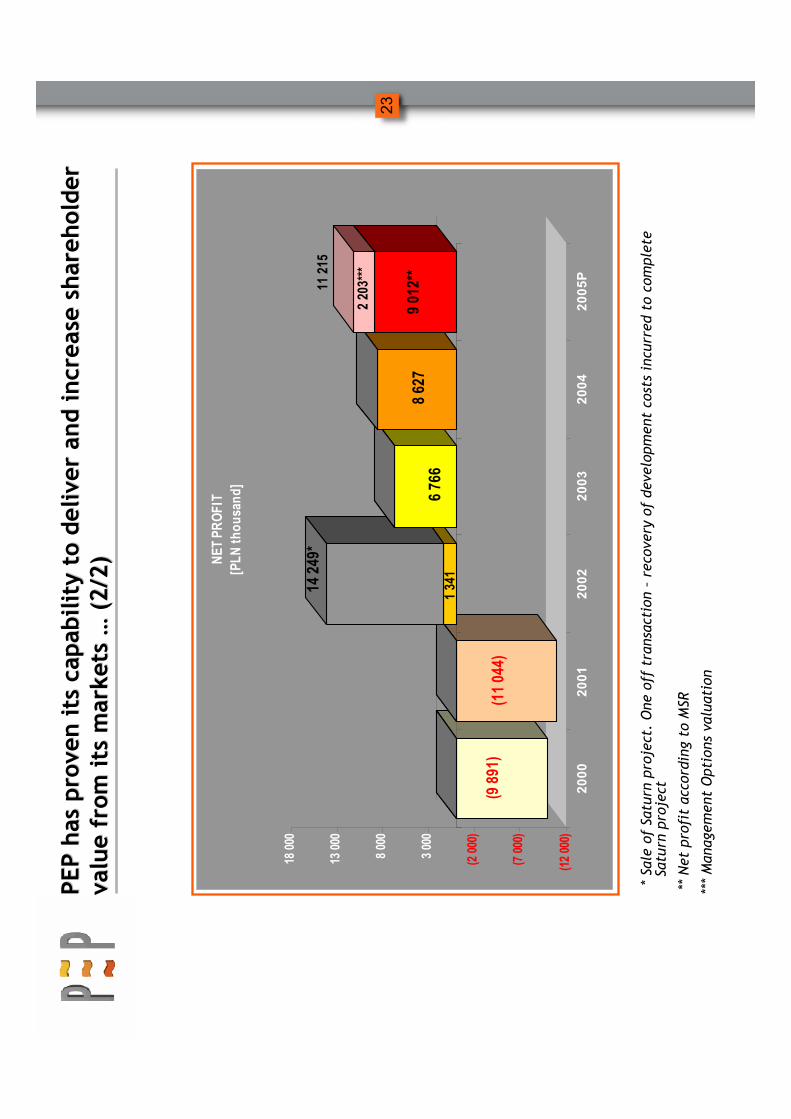
PEP has proven its capability to deliver and increase shareholde
PEP has proven its capability to deliver and increase shareholder r
value from its markets
value from its markets……(2/2)
(2/2)
*Sale
of Satu
rn pro
ject. One off transaction –
reco
very of development co
sts incu
rred to complete
Satu
rn pro
ject
** Net pro
fit accord
ing to M
SR
*** Management Options valuation
3 00
0
8 00
0
13 0
00
18 0
00
NE
T P
RO
FIT
(9 8
91)
(11 0
44)
14
249*
6 7
668
627
9 01
2**
2 20
3***
(12
000)
(7 0
00)
(2 0
00)
3 00
0
8 00
0
13 0
00
18 0
00
2000
2001
2002
2003
2004
2005P
NET
PR
OFIT
[PLN
thousa
nd]
1 34
1
11 2
15

24
Net margine
0,0%
2,0%
4,0%
6,0%
8,0%
10,0%
12,0%
14,0%
16,0%
18,0%
EC Bed
zin
Kogen
eracja
MPEC W
rocław
Praterm
PEP
2003
2004
Source: WSE, PEP
Return on equity
0,0%
1,0%
2,0%
3,0%
4,0%
5,0%
6,0%
7,0%
8,0%
9,0%
10,0%
EC Bedzin
Kogeneracja
MPEC W
rocław
Praterm
PEP
2003
2004
We have better than average profitability and higher return on e
We have better than average profitability and higher return on equity
quity
25
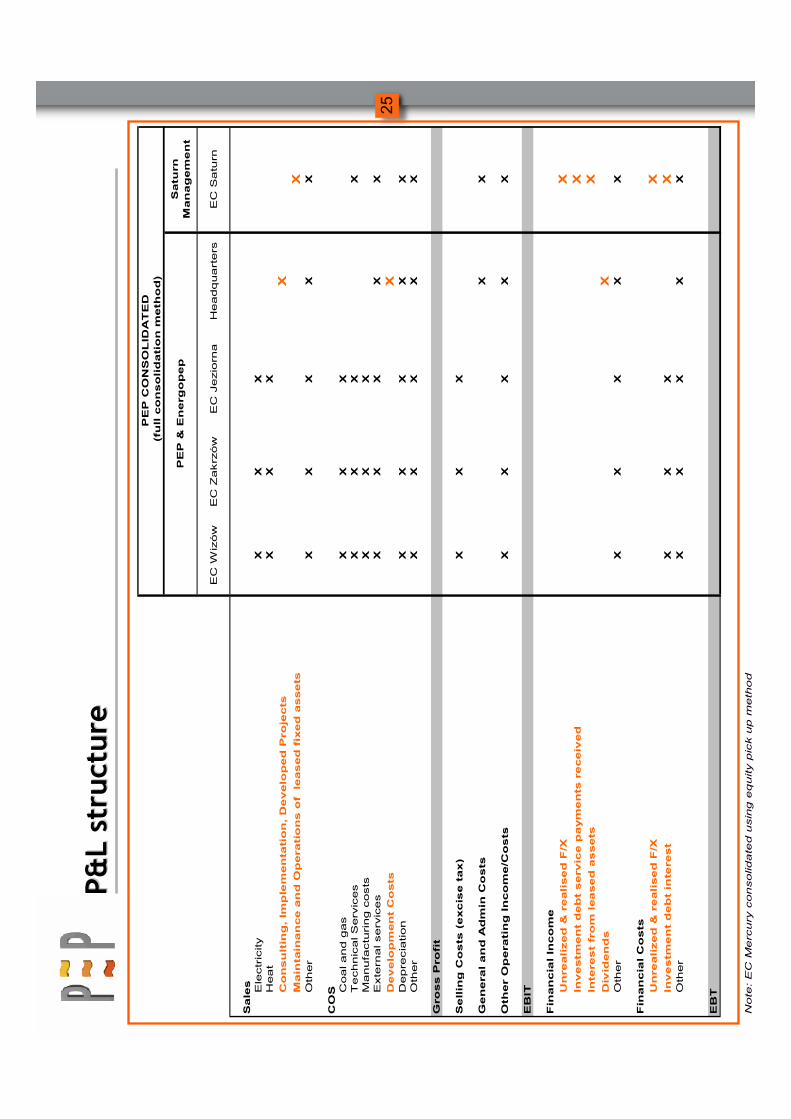
P&L structure
P&L structure
Saturn
Management
EC W
izów
EC Zakrzów
EC Jeziorna
Headquarters
EC Saturn
SalesElectricity
XX
XHeat
XX
X
Consulting, Im
plementation, Developed Projects
XMaintainance and Operations of leased fixed assets
XOther
XX
XX
X
COS Coal and gas
XX
XTechnical Services
XX
XX
Manufacturing costs
XX
XExternal services
XX
XX
X
Development Costs
XDepreciation
XX
XX
XOther
XX
XX
X
Gross Profit
Selling Costs (excise tax)
XX
X
General and Admin Costs
XX
Other Operating Income/Costs
XX
XX
X
EBIT
Financial Income
Unrealized & realised F/X
XInvestm
ent debt service payments received
XInterest from leased assets
XDividends
XOther
XX
XX
X
Financial Costs
Unrealized & realised F/X
XInvestm
ent debt interest
XX
XX
Other
XX
XX
X
EBT
Note: EC Mercury consolidated using equity pick up method
PEP & Energopep
PEP CONSOLIDATED
(full consolidation m
ethod)

New projects
New projects

27
Recently acquired projects will be financed from own cash flows
Recently acquired projects will be financed from own cash flows
and will generate additional NPV of PLN 57 m
and will generate additional NPV of PLN 57 m
Development services, no capital invested
Arctic Paper
Kostrzyń
3APK
57TOTAL
Production of green electricity based on
long term pow
er purchase agreem
ent
with indexed electricity price
Electricity
Distributors
28Wind Farm
Alliance concept, guaranteed return on
equity,shared savings program
MondiPackaging Paper
Świecie
25EC Jupiter
(Saturn
extension)
Business Formula
MainOfftaker
NPV*
Project's
Nam
e
* according to PEP Managem
ent calculation

28
Puck wind farm
Puck wind farm --project rationale
project rationale
�Planned 22 MW wind farm will be situated in potentially one of the best places
in Poland
�Wind farms generally contribute average IRR of 16%-20%
�High wind productivity, low grid connection costs and growing green energy
prices in Puck wind farm place the expected IRR in the higher end of the bracket
Planned location
of Puck wind farm

29
Puck wind farm
Puck wind farm ––project progress against key milestones
project progress against key milestones
�Wind resources assessment
and electricity generation
forecast (confirmation in
progress)
�Changes in spatial planning
plan
�Environm
ental impact
assessment report
�Lease agreem
ents
�Grid connection agreement
�Technical design
�Building permit
�Prom
issorylicencefor energy
generation
DEVELO
PMEN
T
IMPLEMEN
TATION
DEVELO
PMEN
T
ACTIONS COMPLETED
IN PROGRESS
SEPTEM
BER 2005
�Power purchase agreem
ent –
April 2005 (LOI signed in
March 2005)
�EPC contract –June 2005
�Financial closure –June
2005
�Com
mencement of
construction of wind
farm

30
�The essence of the project is to invest in a new turbine which will allow the
CHPoptimalisation(low
er cost of energy generation) and increase the
renewable energy production (additional revenues from
green energy sales)
�PEP’sbenefits will come mainly from
equity service paym
ents and additional
green energy generation
Jupiter
Jupiter ––project rationale
project rationale

31
Jupiter
Jupiter ––project progress against key milestones
project progress against key milestones
�Tendering process –presentation
of short list –1st week of April
2005
�Approval of the project by MPPS –
3rd week of April 2005
DEVELO
PMEN
T
IMPLEMEN
TATION
DEVELO
PMENT
ACTIONS COMPLETED
IN PROGRESS
July2005
�Negotiations with banks
�Financing agreem
ents signed –
May 2005
�Negotiations with turbine
manufacturers
�Key contracts signed –
1st week of June 2005
�Estimated start-up of
new turbine
construction
32
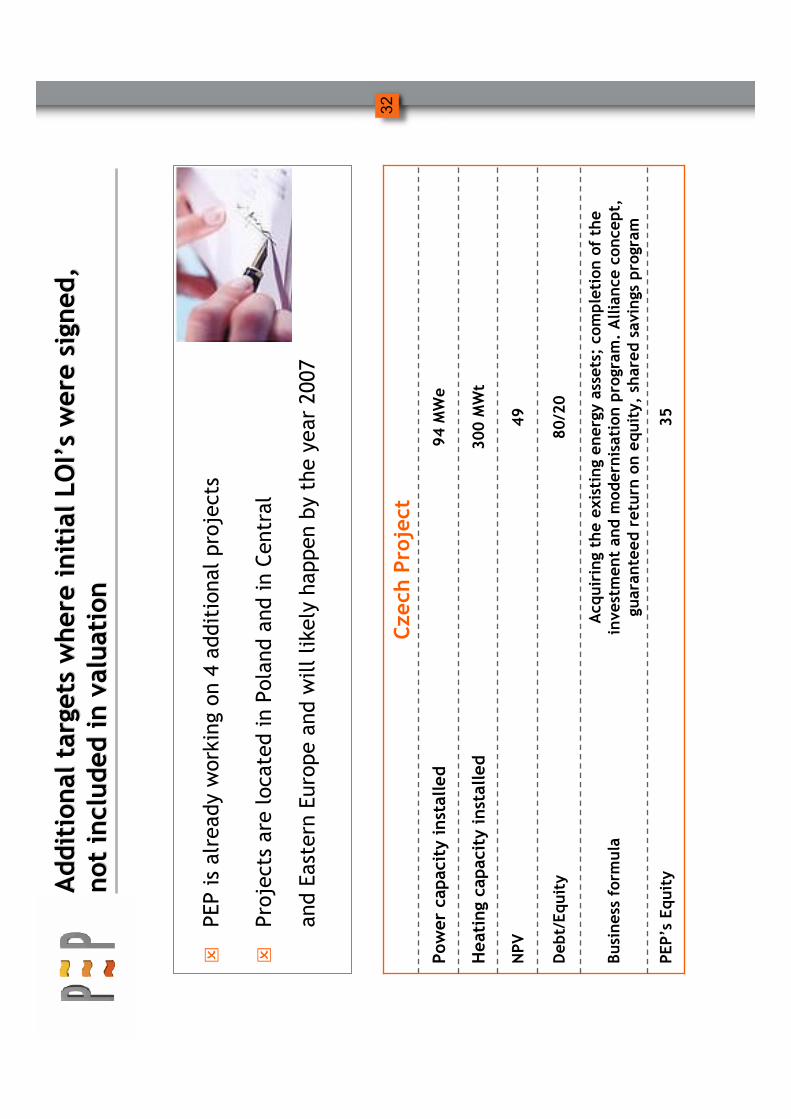
�PEP is already working on 4 additional projects
�Projects are located in Poland
and in Central
and Eastern Europe and will likely happen by the year 2007
Additional targets where initial
Additional targets where initialLO
ILO
I ’’sswere signed,
were signed,
not included in valuation
not included in valuation
94MWe
Pow
er capacity installed
300MWt
Heating capacity installed
35
PEP’sEquity
Acquiring the existing energy assets; completion of the
investment andmodernisationprogram
. Alliance concept,
guaranteed return on equity, shared savings program
Business formula
80/20
Debt/Equity
49
NPV
Czech Project

33
�PEP is the leader in industrial power outsourcing market and in generation
& supply of green energy from
biomass
�PEP’smarket segm
ents are fast grow
ing, especially renew
able energy
�Proven track record places PEP ahead of competition
�PEP business model provides shareholders with growing and predictable cash
flow
sKey investment highlights
Key investment highlights

IPO details
IPO details

35
�Public Offering: 10 651 440 shares offered byPEP’sshareholders:
�PolenergyInvestments B.V –6 151 440 shares (all shares owned)
�Polish Enterprise Fund, L.P.* –4 500 000 shares (from
10 605 768 ow
ned)
�Tranches:
�InstitutionalTranche: 80% public offering –8 521 152 shares
�RetailTranche: 20% public offering –2 130 288 shares
Offering
Offering
* Polish Enterprise Fund, L.P. is represented by Enterprise Investors Sp. z o. o.
36
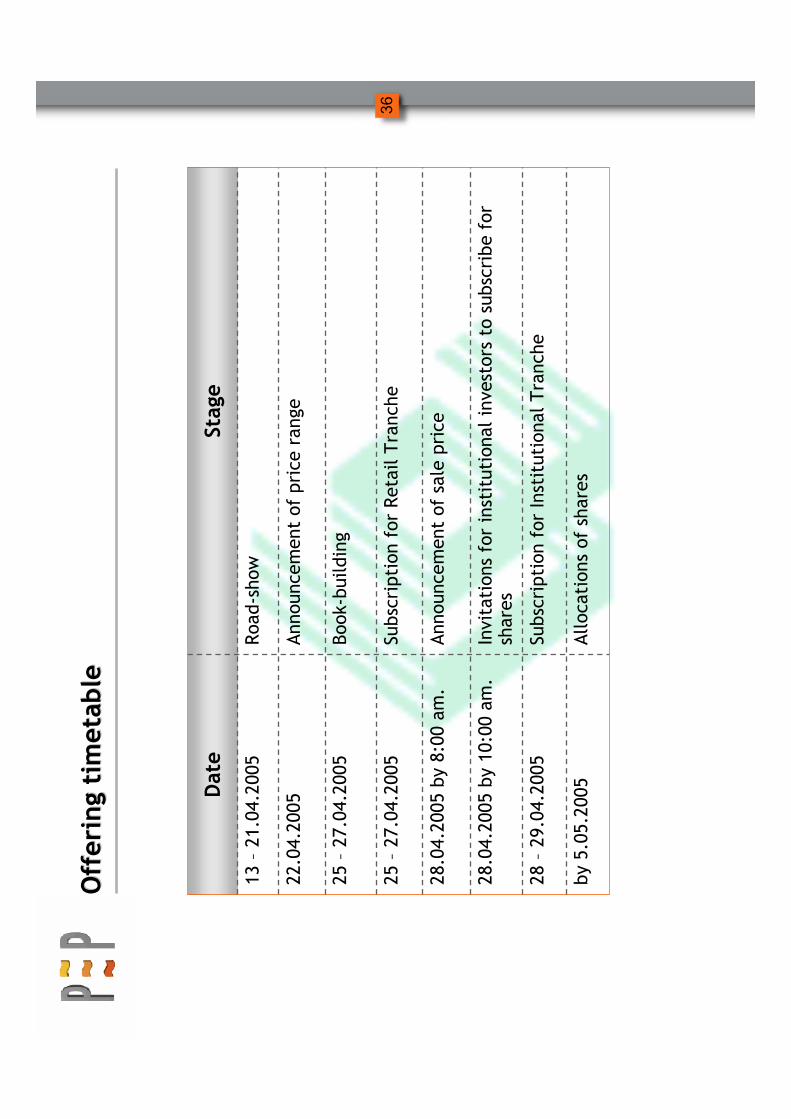
Offering timetable
Offering timetable
Allocations of shares
by 5.05.2005
Subscription for InstitutionalTranche
28 –29.04.2005
Invitations for institutional investors to subscribe for
shares
28.04.2005 by 10:00 am
.
Announcem
ent of sale price
28.04.2005 by 8:00 am.
Subscription for RetailTranche
25 –27.04.2005
Book-building
25 –27.04.2005
Announcem
ent of price range
22.04.2005
Road-show
13 –21.04.2005
Stage
Date
37
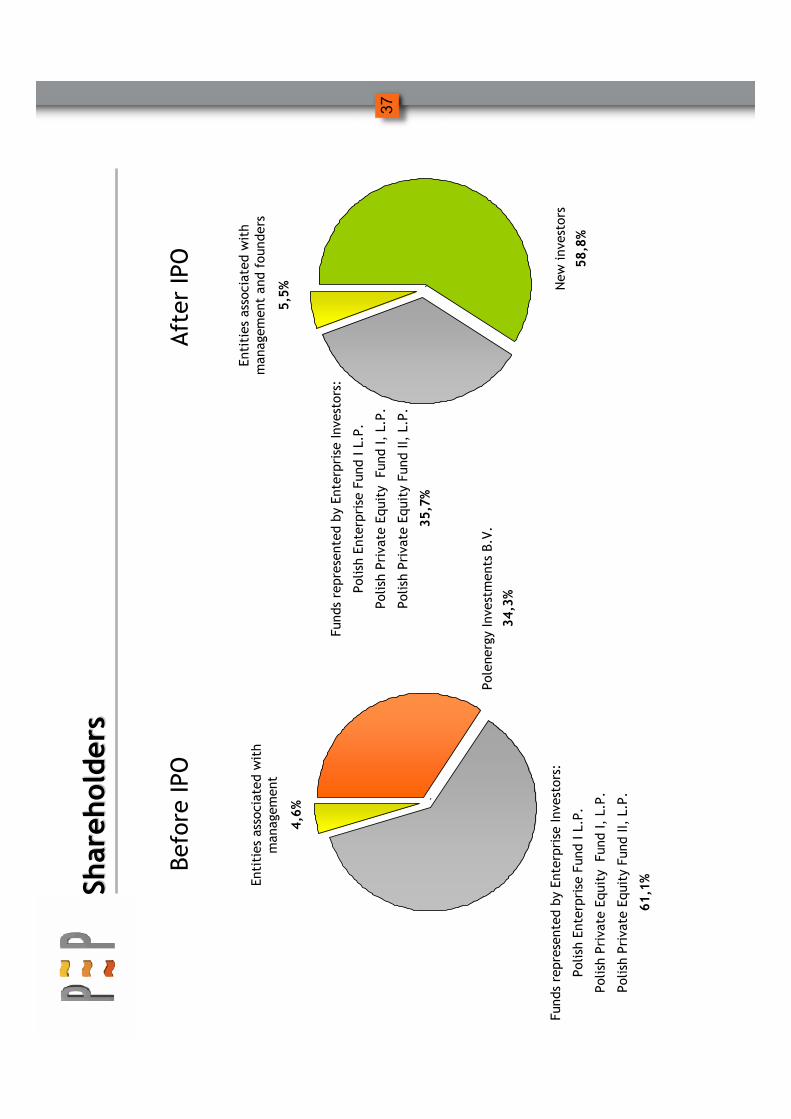
Shareholders
Shareholders
`
PolenergyInvestments B.V.
34,3%
Before IPO
After IPO
` New
investors
58,8%
Funds represented by Enterprise Investors:
Polish Enterprise Fund I L.P.
Polish Private Equity Fund I, L.P.
Polish Private Equity Fund II, L.P.
61,1%Entities associated with
managem
ent
4,6%
Funds represented by Enterprise Investors:
Polish Enterprise Fund I L.P.
Polish Private Equity Fund I, L.P.
Polish Private Equity Fund II, L.P.
35,7%
Entities associated with
managem
ent and founders
5,5%
38
Appendix

39
Quick Response by Leaders to rising energy costs and Green Electricity opportunity
Other recent projects in Industry (announced project only in Janand Feb 2005)
Replace
oil
Biom
ass
+Oil
145 MW
Includes
installatio
n of back
pressure
turbines
115
Mills areGruvon,
KarlsborgandSkarblacka
Billerud
A.B.
Bark wood
waste
Boiler
ArkhangelskPulp and
Paper Mill, Russia **
Replace
gas + oil
Biom
ass
Boiler
Stam
bolijski, Bulgaria *
PFS
Contract
with grid
Biofuels
sludge
20 MW
85 MW
Boiler +
turbine
75Chapelle Darblay, France
UPM
Varo, Sweden
Biofuels
sludge
81 MW
Turbines
50Monsteras, Sweden
Sodra
Replaced
coal fired
boiler
Bark peat
Forest
residue
sludge
107 MW
Increase
steam and
electricity
BFR
20Rauma, Finland
UPM
Remarks
Fuel
Capacity
Project
Investment
Location
Co
* sells carbon credits toNetherlandEm
ission Reduction Co up found
** expects Emission Trading to EU and generating 22 to EURO 25 million
Industry is reacting to rising energy costs
Industry is reacting to rising energy costs

40
wind
12,1%
wind
0,2%
wind
0,9%
wind
5,5%
1995
2000
2010
2020
2.327
2.572
3.054
3.511
(4.1)
(22.4)
(168)
(425)
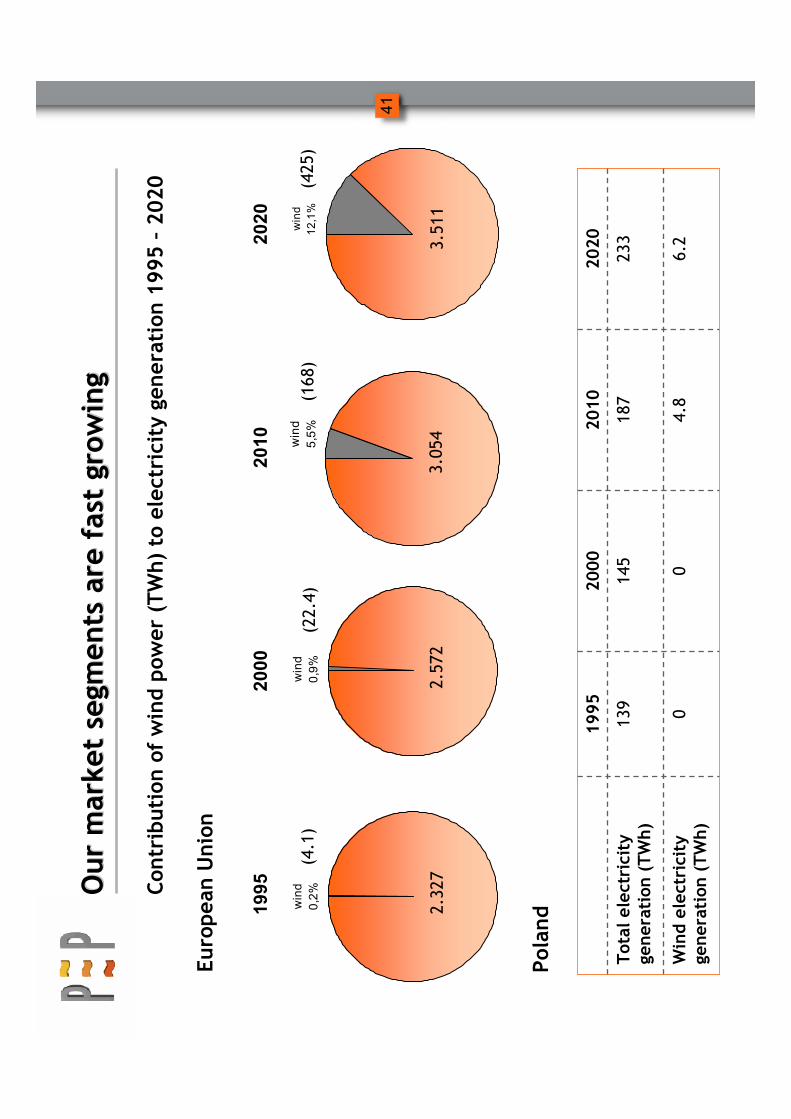
European Union
Poland wind
0,0%
139
(0.0)
wind
0,0%
145
(0.0)
wind
2,6%
187
(4.8)
wind
2,7%
233
(6.2)
Our market segm
ents are fast grow
ing
Our market segm
ents are fast grow
ing
Contribution of wind pow
er (TWh) to electricity generation 1995 –2020
41
Our market segm
ents are fast grow
ing
Our market segm
ents are fast grow
ing
4.8
187
2010
6.2
00
Wind electricity
generation (TWh)
233
145
139
Total electricity
generation (TWh)
2020
2000
1995
Contribution of wind pow
er (TWh) to electricity generation 1995 –2020
Polandw
ind
0,2%
wind
0,9%
wind
5,5%
wind
12,1%
1995
2000
2010
2020
2.327
2.572
3.054
3.511
(4.1)
(22.4)
(168)
(425)
European Union

42
EUR 2.9 m*
Financing arranged by PEP
EUR 0.8 m*
Equity contributed
20 years
Length of contract
PGNiG
Fuel supplier
Wizów
SAOfftaker
Gas-fired CHP
plant,
cogeneration
Technology
42MWt
Heating capacity installed
4Mwe
Power capacity installed
1999
Operation beginning
Key data
Com
pleted projects
Com
pleted projects
ECWizów
1999
1 EUR=4.1318 PLN (NBP average exch
ange rate
,
15.04.2005)

43
EUR 3.3 m*
Financing arranged by PEP
EUR 1.5 m*
Equity contributed
20 years
Length of contract
PGNiG
Fuel supplier
Polar S.A.
(Whirlpool Group)
Offtaker
Gas-fired CHP
plant,
cogeneration
Technology
36MWt
Heating capacity installed
3Mwe
Power capacity installed
2000
Operation beginning
Key data
ECZakrzów2000
Com
pleted projects
Com
pleted projects
*1 EUR=4.1318 PLN (NBP average exch
ange rate
,
15.04.2005)

44
n/a**
(debt financing
EUR 1.1 m* in
2005)
Financing arranged by PEP
EUR 0.5 m*
(additional equity
EUR 0.8 m in 2005)
Equity contributed
5 years
(extended in 2005
for the next 11
years)
Length of contract
Dom
estic coal
mines
Fuel supplier
MetsaTissue
Offtaker
Coal-fired CHP
plant,
cogeneration
Technology
95MWt
Heating capacity installed
6Mwe
Power capacity installed
2001
Operation beginning
Key data
* *lease agre
ement
ECJeziorna2001
Com
pleted projects
Com
pleted projects
*1 EUR=4.1318 PLN (NBP average exch
ange rate
,
15.04.2005)
45
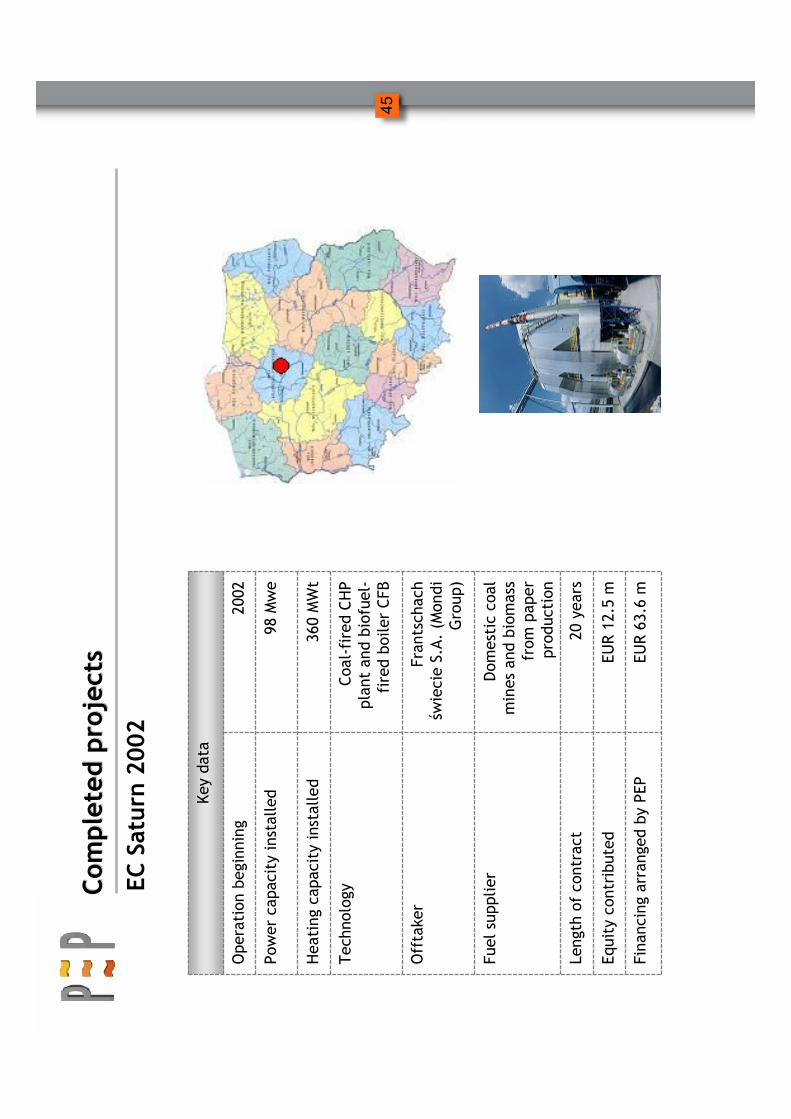
EUR 63.6 m
Financing arranged by PEP
EUR 12.5 m
Equity contributed
20 years
Length of contract
Dom
estic coal
mines and biomass
from
paper
production
Fuel supplier
Frantschach
świecieS.A. (Mondi
Group)
Offtaker
Coal-fired CHP
plant andbiofuel-
fired boiler CFB
Technology
360MWt
Heating capacity installed
98Mwe
Power capacity installed
2002
Operation beginning
Key data
EC Saturn 2002
Com
pleted projects
Com
pleted projects

46
�EPA –leading developer of wind farms in Poland
�Negotiations started in 2003, concluded in 2004
�3-year agreement, providing for sharing costs and
profits from
wind farm development
�PEP granted the right of first refusal for all farms
developed on the basis of the agreem
ent
�PEP plans to acquire and build at least 100 MW
over the next 5 years
�Both parties plan to renew
the agreement after the
first 3-year period
Wind project development j.v.with EPA 2004
Projects in progress
Projects in progress

47
EUR 2.2 m*
Financing arranged by PEP
EUR 0.8 m*
Equity contributed
6+4 years
Length of contract
Zakłady
Koksownicze
Wałbrzych
S.A.
(Coke Plant
Walbrzych)
Fuel supplier
Zakłady
Koksownicze
Wałbrzych
S.A.
(Coke Plant
Walbrzych)
Offtaker
Coke gas-fired
Power Plant
Technology
0MWt
Heating capacity installed
8.3Mwe
Power capacity installed
2005
Operation beginning
Key data
Mercury 2004
Projects in progress
Projects in progress
*1 EUR=4.1318 PLN (NBP average exch
ange rate
,
15.04.2005)
48
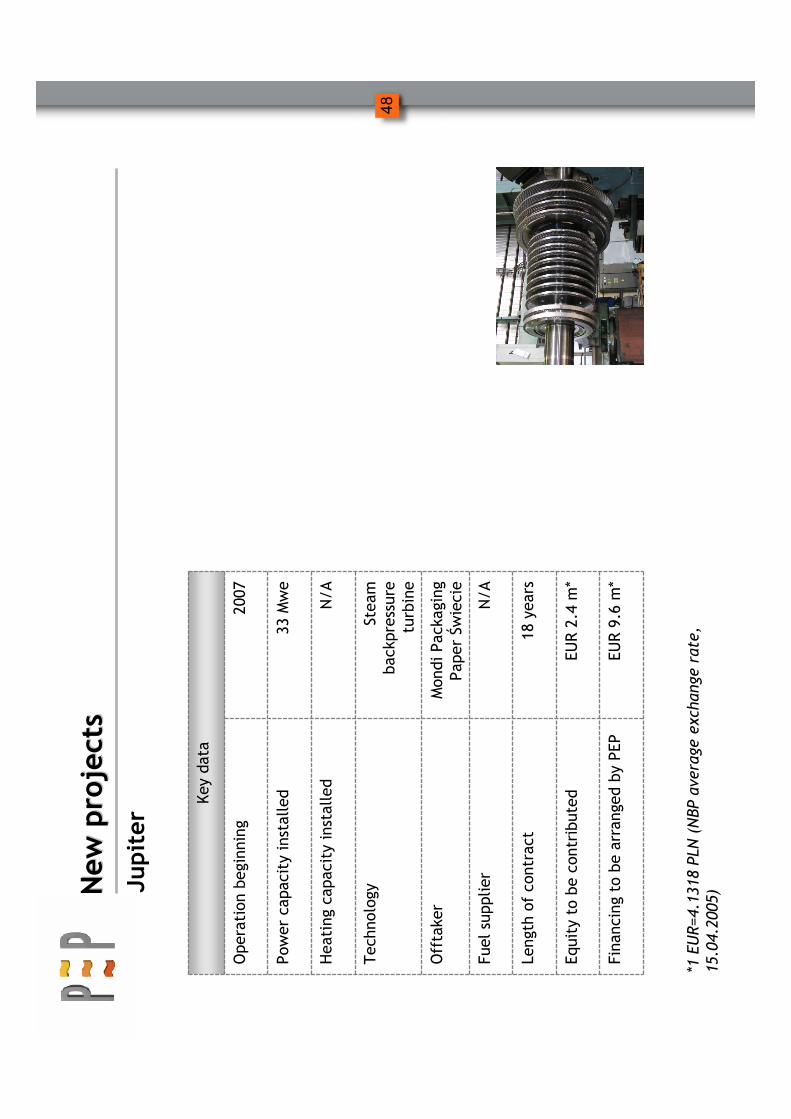
EUR 9.6 m*
Financing to be arranged by PEP
EUR 2.4 m*
Equity to be contributed
18 years
Length of contract
N/A
Fuel supplier
MondiPackaging
PaperŚwiecie
Offtaker
Steam
backpressure
turbine
Technology
N/A
Heating capacity installed
33Mwe
Power capacity installed
2007
Operation beginning
Key data
Jupiter
New projects
New projects
*1 EUR=4.1318 PLN (NBP average exch
ange rate
,
15.04.2005)

49
New projects
New projects
EUR 19.0 m*
Financing to be arranged by
PEP
EUR 5.7 m*
Equity to be contributed
20 years
Length of contract
N/A
Fuel supplier
Electricity
distributors
Offtaker
Wind turbines
Technology
N/A
Heating capacity installed
22Mwe
Power capacity installed
2006
Operation beginning
Key data
Wind Farm #1
*1 EUR=4.1318 PLN (NBP average exch
ange rate
,
15.04.2005)

50
Selected
Selectedfinancial inform
ation
financial inform
ation
2002
2003
2004
Key operational data
Production of heat
['000 GJ]
4 870
6 330
7 530
Production of electricity
['000 MWh]
449,9
474,7
520,6
Profit & loss
Revenues
['000 PLN]
63 353
60 665
50 103
Revenues growth
--4,2%
-17,4%
Gross profit
['000 PLN]
21 866
21 674
18 869
Gross profit growth
--0,9%
-12,9%
EBITDA
['000 PLN]
14 275
1 681
18 803
EBITDA growth
--88,2%
1018,6%
EBITDA m
argin
22,5%
2,8%
37,5%
Depreciation
['000 PLN]
2 663
2 841
2 191
EBIT
['000 PLN]
11 612
1 160
-
16 612
EBIT growth
--110,0%
-1532,1%
EBIT m
argin
18,3%
-1,9%
33,2%
EBT
10 294
10 317
11 003
EBT growth
-0,2%
6,6%
EBT m
argin
16,2%
17,0%
22,0%
Net profit
['000 PLN]
14 249
6 766
8 627
Net profit m
argin
22,5%
11,2%
17,2%
Earnings per share
PLN
0,82
0,39
0,50
EPS growth
--52,5%
27,5%
Balance sheet
Total assets
['000 PLN]
200 702
352 688
341 274
Receivables
['000 PLN]
122 551
255 207
243 651
Total debt
['000 PLN]
95 708
219 985
210 905
Total Debt Recovered
['000 PLN]
75 833
201 162
194 325
Net debt
['000 PLN]
77 453
186 667
174 302
Shareholders' equity
['000 PLN]
86 632
93 398
102 025
Cash flow
Cash flow from operations
['000 PLN]
12 169
7 115
17 506
Adjusted cash flow from operations
['000 PLN]
18 126
25 704
26 449
Cash flow from investment
['000 PLN]
121 583
-
93 768
-
25 162
-
Cash flow from financing
['000 PLN]
123 122
101 716
10 941

51
�Com
pletion of critical initiatives
�Com
pletionof projects developm
ent
�Em
mission
trading benefits
�Energy trading com
petence
�Benchm
arking, synergies and further cost reductions for operating plants
�Improvem
ent of development efficiency and reduction of its time span
�Succesfullyentryinto the Central Europe Markets
�Continuous improvem
ent program realization
in all sites
Our objectives for next 12 months
Our objectives for next 12 months