Embed Size (px)
Citation preview

| New York and Boston Investor Meetings | September 2016
Lead Today. Transform Tomorrow. Barclays Chicago
Utility Conference
April 11, 2017
| Barclay’s Chicago Utility Conference | April 11, 2017
Cautionary Statements
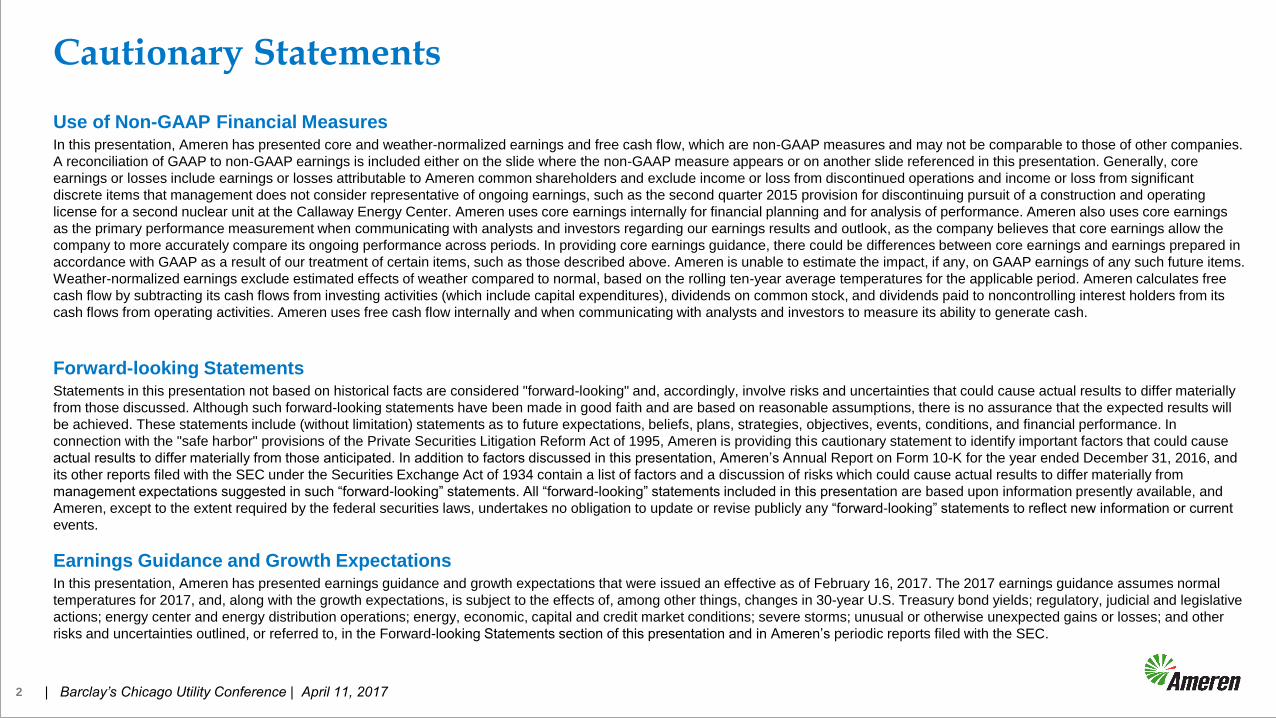
Use of Non-GAAP Financial Measures In this presentation, Ameren has presented core and weather-normalized earnings and free cash flow, which are non-GAAP measures and may not be comparable to those of other companies.
A reconciliation of GAAP to non-GAAP earnings is included either on the slide where the non-GAAP measure appears or on another slide referenced in this presentation. Generally, core
earnings or losses include earnings or losses attributable to Ameren common shareholders and exclude income or loss from discontinued operations and income or loss from significant
discrete items that management does not consider representative of ongoing earnings, such as the second quarter 2015 provision for discontinuing pursuit of a construction and operating
license for a second nuclear unit at the Callaway Energy Center. Ameren uses core earnings internally for financial planning and for analysis of performance. Ameren also uses core earnings
as the primary performance measurement when communicating with analysts and investors regarding our earnings results and outlook, as the company believes that core earnings allow the
company to more accurately compare its ongoing performance across periods. In providing core earnings guidance, there could be differences between core earnings and earnings prepared in
accordance with GAAP as a result of our treatment of certain items, such as those described above. Ameren is unable to estimate the impact, if any, on GAAP earnings of any such future items.
Weather-normalized earnings exclude estimated effects of weather compared to normal, based on the rolling ten-year average temperatures for the applicable period. Ameren calculates free
cash flow by subtracting its cash flows from investing activities (which include capital expenditures), dividends on common stock, and dividends paid to noncontrolling interest holders from its
cash flows from operating activities. Ameren uses free cash flow internally and when communicating with analysts and investors to measure its ability to generate cash.
Forward-looking Statements Statements in this presentation not based on historical facts are considered "forward-looking" and, accordingly, involve risks and uncertainties that could cause actual results to differ materially
from those discussed. Although such forward-looking statements have been made in good faith and are based on reasonable assumptions, there is no assurance that the expected results will
be achieved. These statements include (without limitation) statements as to future expectations, beliefs, plans, strategies, objectives, events, conditions, and financial performance. In
connection with the "safe harbor" provisions of the Private Securities Litigation Reform Act of 1995, Ameren is providing this cautionary statement to identify important factors that could cause
actual results to differ materially from those anticipated. In addition to factors discussed in this presentation, Ameren’s Annual Report on Form 10-K for the year ended December 31, 2016, and
its other reports filed with the SEC under the Securities Exchange Act of 1934 contain a list of factors and a discussion of risks which could cause actual results to differ materially from
management expectations suggested in such “forward-looking” statements. All “forward-looking” statements included in this presentation are based upon information presently available, and
Ameren, except to the extent required by the federal securities laws, undertakes no obligation to update or revise publicly any “forward-looking” statements to reflect new information or current
events.
Earnings Guidance and Growth Expectations In this presentation, Ameren has presented earnings guidance and growth expectations that were issued an effective as of February 16, 2017. The 2017 earnings guidance assumes normal
temperatures for 2017, and, along with the growth expectations, is subject to the effects of, among other things, changes in 30-year U.S. Treasury bond yields; regulatory, judicial and legislative
actions; energy center and energy distribution operations; energy, economic, capital and credit market conditions; severe storms; unusual or otherwise unexpected gains or losses; and other
risks and uncertainties outlined, or referred to, in the Forward-looking Statements section of this presentation and in Ameren’s periodic reports filed with the SEC.
2

| Barclay’s Chicago Utility Conference | April 11, 2017 | Barclay’s Chicago Utility Conference | April 11, 2017
Company Description
3
Fully rate-regulated electric and gas utility
2.4M
electric customers
0.9M
gas
customers
10,200MW
regulated electric
generation
capability
4,800
circuit miles
FERC-regulated
electric
transmission
Corporate Headquarters
Electric Service Territory
Electric & Natural Gas Territory
Ameren Missouri
• Electric generation, transmission and distribution business
and a natural gas distribution business in Missouri regulated
by MoPSC
• Serves 1.2 million electric and 0.1 million gas customers
• 10,200 MW of total generation capability
Ameren Illinois Electric Distribution
• Electric distribution business in Illinois regulated by ICC
• Serves 1.2 million electric customers
Ameren Illinois Natural Gas
• Natural gas distribution business in Illinois regulated by ICC
• Serves 0.8 million gas customers
Ameren Transmission
• Electric transmission businesses of Ameren Illinois and ATXI
regulated by FERC
• Ameren Illinois invests in local reliability projects
• ATXI invests in regional multi-value projects
Ameren Segments
| Barclay’s Chicago Utility Conference | April 11, 2017 4
Attractive total return
potential
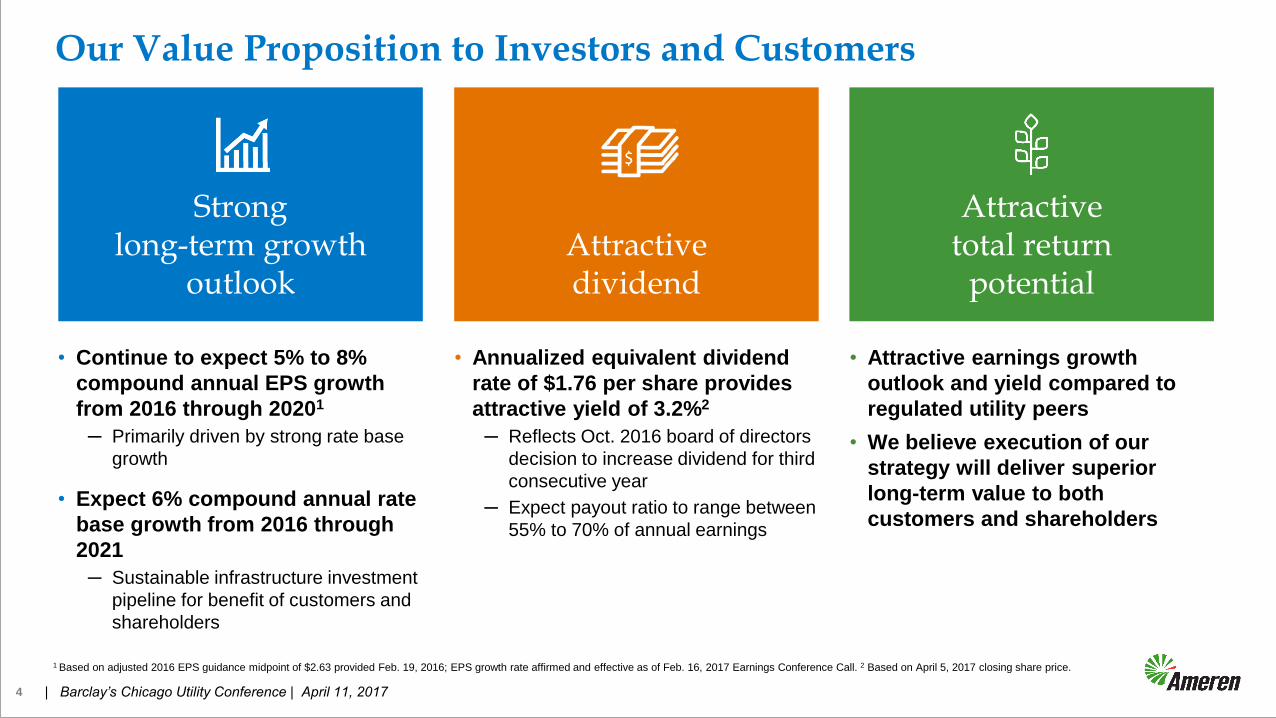
Our Value Proposition to Investors and Customers
• Continue to expect 5% to 8%
compound annual EPS growth
from 2016 through 20201
─ Primarily driven by strong rate base
growth
• Expect 6% compound annual rate
base growth from 2016 through
2021
─ Sustainable infrastructure investment
pipeline for benefit of customers and
shareholders
Strong long-term growth
outlook Attractive dividend
• Annualized equivalent dividend
rate of $1.76 per share provides
attractive yield of 3.2%2
─ Reflects Oct. 2016 board of directors
decision to increase dividend for third
consecutive year
─ Expect payout ratio to range between
55% to 70% of annual earnings
• Attractive earnings growth
outlook and yield compared to
regulated utility peers
• We believe execution of our
strategy will deliver superior
long-term value to both
customers and shareholders
1 Based on adjusted 2016 EPS guidance midpoint of $2.63 provided Feb. 19, 2016; EPS growth rate affirmed and effective as of Feb. 16, 2017 Earnings Conference Call. 2 Based on April 5, 2017 closing share price.

| Barclay’s Chicago Utility Conference | April 11, 2017 5
• Investing in and operating our utilities in a
manner consistent with existing regulatory
frameworks
• Enhancing regulatory frameworks and
advocating for responsible energy and
economic policies
• Creating and capitalizing on opportunities
for investment for the benefit of our
customers and shareholders
Our Strategic Plan
| Barclay’s Chicago Utility Conference | April 11, 2017 6
0
5
10
15
20
25
30
Mia
mi
Am
ere
n M
isso
uri
Ta
mpa
Am
ere
n Illi
nois
Atlanta
Ch
icago
Min
neap
olis
Washin
gto
n, D
C
Ph
oen
ix
US
A A
vera
ge
Ph
iladelp
hia
Ba
ltim
ore
De
troit
Sa
n F
rancis
co
Bo
sto
n
Sa
n D
iego
Ne
w Y
ork 0
20
40
60
80
100
120
140
0
100
200
300
400
500
600
2001 2004 2007 2010 2013 2016
Recordable Cases
Lost Workday Away Cases
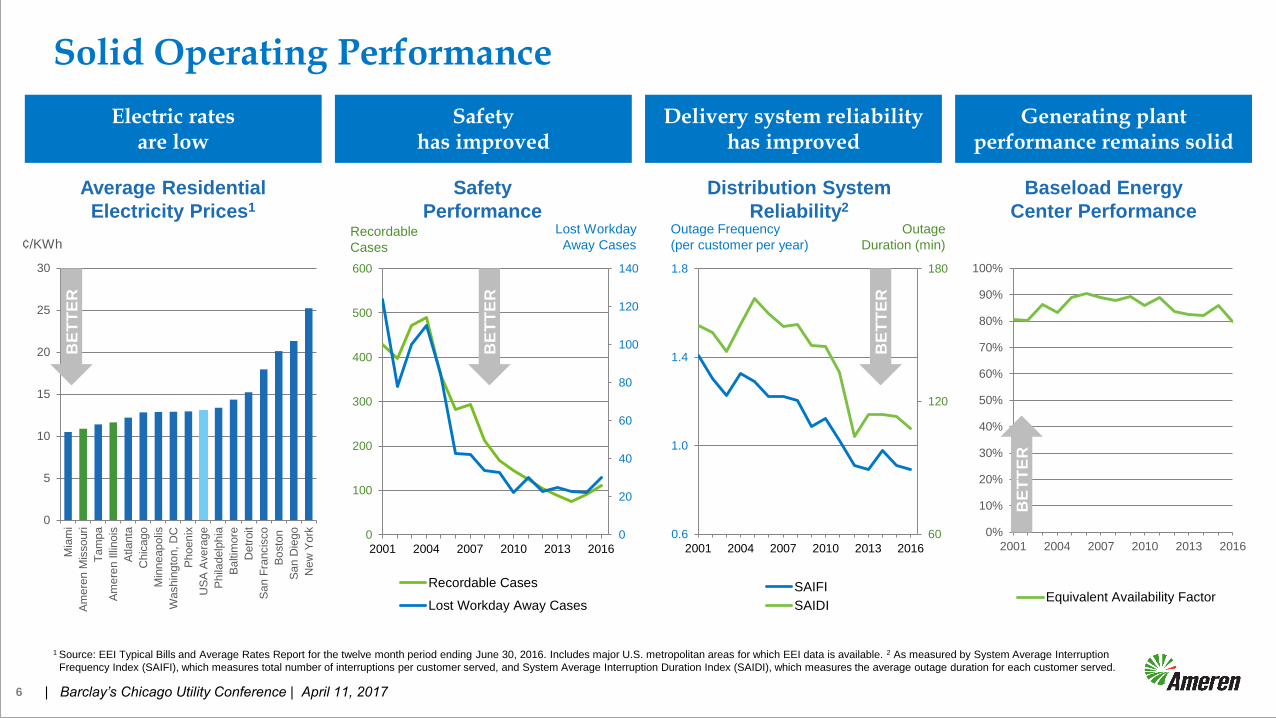
Safety
Performance
Average Residential
Electricity Prices1
BE
TT
ER
60
120
180
0.6
1.0
1.4
1.8
2001 2004 2007 2010 2013 2016
SAIFI
SAIDI
0%
10%
20%
30%
40%
50%
60%
70%
80%
90%
100%
2001 2004 2007 2010 2013 2016
Equivalent Availability Factor
Distribution System
Reliability2
Baseload Energy
Center Performance
¢/KWh Recordable
Cases
Lost Workday
Away Cases
BE
TT
ER
Outage Frequency
(per customer per year)
Outage
Duration (min)
BE
TT
ER
BE
TT
ER
Electric rates are low
Safety has improved
Delivery system reliability has improved
Generating plant performance remains solid
1 Source: EEI Typical Bills and Average Rates Report for the twelve month period ending June 30, 2016. Includes major U.S. metropolitan areas for which EEI data is available. 2 As measured by System Average Interruption
Frequency Index (SAIFI), which measures total number of interruptions per customer served, and System Average Interruption Duration Index (SAIDI), which measures the average outage duration for each customer served.
Solid Operating Performance

| Barclay’s Chicago Utility Conference | April 11, 2017
FERC-regulated: Formula ratemaking
• Allowed ROE is 10.82%, which includes the MISO participation adder of 50 basis points
• Rates reset each Jan. 1 based on forward-looking calculation with annual reconciliation
• Constructive rate treatment for ATXI’s three MISO-approved multi-value projects, including construction work in
progress in rate base and 56% hypothetical equity ratio during development
ICC-regulated: Formula ratemaking recently extended through 2022
• Allowed ROE is 580 basis points above annual average yield of 30-year U.S. Treasury
• Provides recovery of prudently incurred actual costs; based on year-end rate base
• Revenue decoupling; enhanced energy efficiency framework
ICC-regulated: Future test year ratemaking with infrastructure rider
• Allowed ROE is 9.6%
• Volume balancing adjustment for residential and small nonresidential customers
MoPSC-regulated: Historical test year ratemaking
• Fuel adjustment clause recovery mechanism; pension and other postretirement benefits cost tracking mechanism
• Constructive energy efficiency framework
Our Regulatory Frameworks
Ameren Transmission
Ameren Illinois Natural Gas
Ameren Missouri
Electric Service
7
Ameren Illinois Electric
Distribution

| Barclay’s Chicago Utility Conference | April 11, 2017 | Barclay Chicago Utility Conference | April 11, 2017
$7.4 $8.1
$2.6 $4.0 $1.3
$2.0 $13.4
$17.9
2016 2021E
Ameren TransmissionAmeren Illinois Natural GasAmeren Illinois Electric DistributionAmeren Missouri
2016 to 2021E Regulated
Infrastructure Rate Base1,3
($ Billions)
'16-'21E
13%
9%
9%
2%
6%
$3.8
$2.1
% of
Total
55%
45%
5-Yr Rate Base CAGR
+6%
CAGR
Investing Strategically, Consistent with Regulatory Frameworks
44%
56%
$4.0B, 37%
$2.6B, 24%
$1.4B, 13%
$2.2B, 20%
$0.6B,6%
$10.8 Billion of Regulated Infrastructure Investment1,2
2017-2021
Ameren Illinois
Electric
Distribution
Ameren
Illinois
Transmission
Ameren
Transmission
Company of
Illinois
Ameren Missouri
Ameren Illinois
Natural Gas
1 Issued and effective as of Feb. 16, 2017 Earnings Conference Call. 2 Dollars reflect mid-points of five-year spending range rounded to nearest $100 million. Excludes Ameren Illinois Electric Distribution’s energy efficiency
investments of ~$0.4 billion as these are not capital expenditures. 3 Reflects year-end rate base except for Ameren Transmission, which is average rate base. Includes construction work in progress for ATXI multi-value
projects. Includes expected Ameren Illinois Electric Distribution capitalization of energy efficiency investment, net of amortization, of ~$0.3 billion in 2021. Outlook also reflects current federal income tax law.
8
| Barclay’s Chicago Utility Conference | April 11, 2017
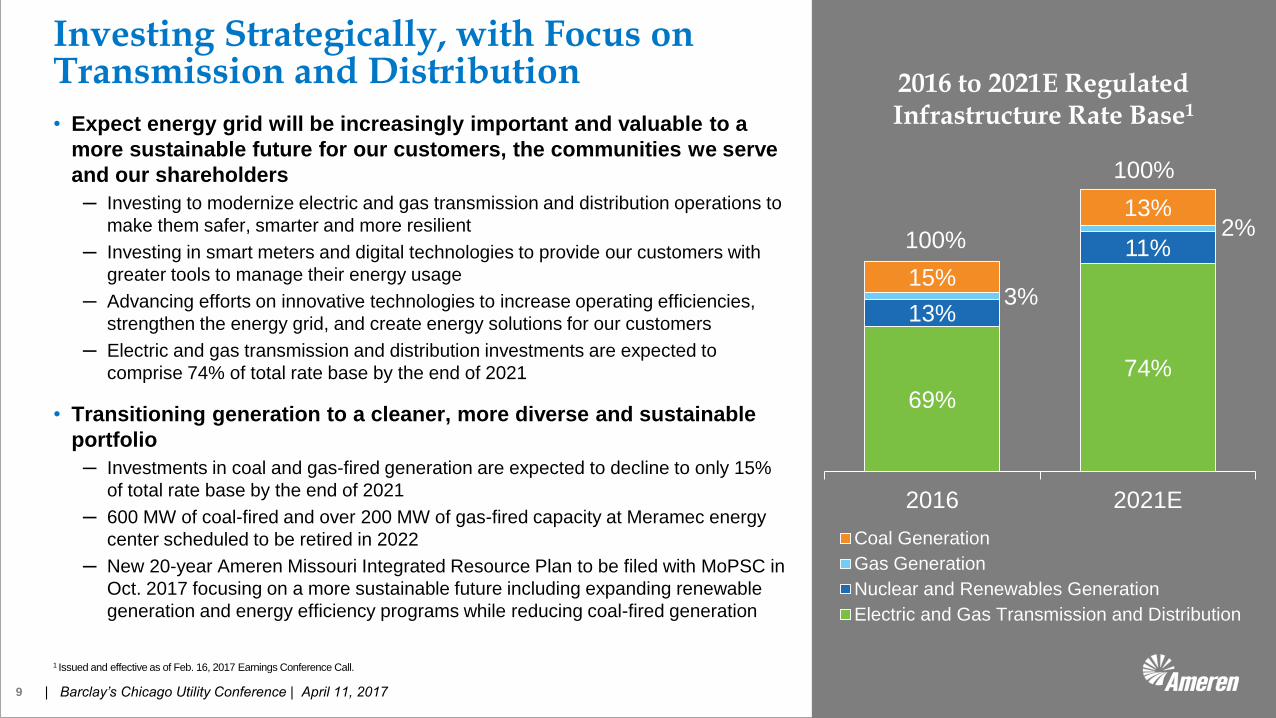
69%
74%
13%
11%
3%
2%
15%
13%
100%
100%
2016 2021E
Coal Generation
Gas Generation
Nuclear and Renewables Generation
Electric and Gas Transmission and Distribution
• Expect energy grid will be increasingly important and valuable to a
more sustainable future for our customers, the communities we serve
and our shareholders
─ Investing to modernize electric and gas transmission and distribution operations to
make them safer, smarter and more resilient
─ Investing in smart meters and digital technologies to provide our customers with
greater tools to manage their energy usage
─ Advancing efforts on innovative technologies to increase operating efficiencies,
strengthen the energy grid, and create energy solutions for our customers
─ Electric and gas transmission and distribution investments are expected to
comprise 74% of total rate base by the end of 2021
• Transitioning generation to a cleaner, more diverse and sustainable
portfolio
─ Investments in coal and gas-fired generation are expected to decline to only 15%
of total rate base by the end of 2021
─ 600 MW of coal-fired and over 200 MW of gas-fired capacity at Meramec energy
center scheduled to be retired in 2022
─ New 20-year Ameren Missouri Integrated Resource Plan to be filed with MoPSC in
Oct. 2017 focusing on a more sustainable future including expanding renewable
generation and energy efficiency programs while reducing coal-fired generation
Investing Strategically, with Focus on Transmission and Distribution
9
2016 to 2021E Regulated Infrastructure Rate Base1
1 Issued and effective as of Feb. 16, 2017 Earnings Conference Call.

| Barclay’s Chicago Utility Conference | April 11, 2017
• Cash from operations
─ Return of capital through depreciation in rates
─ Return on equity-financed portion of rate base
─ Income tax deferrals and tax assets of ~$1.9-$2.0 billion
• Income tax deferrals driven primarily by capital expenditures
• Includes ~$700 million of tax assets at year-end 2016
Net operating losses, tax credit carryforwards, expected tax refunds,
and state over-payments
~$440 million of this at parent company
Expected to be realized into 2021
• Debt financing
• No equity issuances expected
• Capitalization target: ~50% equity
2017-2021 Capital Expenditure Funding Plan1
10
Ameren Credit Ratings2
1 Issued and effective as of Feb. 16, 2017 Earnings Conference Call. Expected funding reflects current federal income tax law. 2 A credit rating is not a
recommendation to buy, sell, or hold any security and may be suspended, revised, or withdrawn at any time.
Moody's S&P
Ameren Corporation
• Issuer Baa1 BBB+
• Senior Unsecured Baa1 BBB
Ameren Missouri Senior
Secured A2 A
Ameren Illinois Senior
Secured A1 A
All outlooks “Stable.”

| Barclay’s Chicago Utility Conference | April 11, 2017
Legislative and
Regulatory Update

| Barclay’s Chicago Utility Conference | April 11, 2017
• Future Energy Jobs Act enacted in Dec. 2016; effective
June 2017
• Enhances and extends Ameren Illinois’ Electric
Distribution regulatory framework
─ Extends constructive formula ratemaking through 2022
• Enables continuation of Ameren Illinois’ strong rate base growth plan
─ Allows capitalization of, and ability to earn return on, energy
efficiency spend
• Previously expensed as incurred
• Expect to invest average of ~$110 million/year
─ Provides revenue decoupling
• Eliminates margin erosion due to, among other things,
energy efficiency
• Ensures consistent ability to earn allowed ROE
─ Deems common equity ratio of up to, and
including, 50% as prudent
Illinois Legislative Update
12
Customer and Community Benefits
Strong customer rate impact
protections; enables greater
investment, including in
energy efficiency; creates
more reliable, smarter grid;
retains cleaner energy
sources; and preserves jobs
| Barclay’s Chicago Utility Conference | April 11, 2017
Unanimous Stipulation and Agreement approved by MoPSC March 8
• Increases annual base electric revenue requirement by $92 million
─ Removes negative effect of lower sales to New Madrid smelter
• Decreases base level of net energy costs by $54 million annually, excluding cost
reductions associated with reduced sales volumes
• Reduces annual net amortizations and base level of expenses for regulatory tracking
mechanisms by $26 million
• Allowed ROE, rate base and common equity ratio not specified ─ MoPSC determined an implicit ROE in the range of 9.2% to 9.7% is reasonable
• Continues key riders and trackers
─ Fuel adjustment clause - Continues 95/5% sharing of variances in net energy costs included
in base rates
─ Pension/OPEB, uncertain income tax positions and renewable energy standards trackers
• New rates effective April 1, 2017
Missouri Electric Rate Review
13

| Barclay’s Chicago Utility Conference | April 11, 2017 14
• Proposed Missouri Legislation: The Missouri Economic Development and
Infrastructure Investment Act (SB 190)1, as approved by Senate Commerce
Committee Feb. 8
─ Deferral between rate cases of depreciation on capital projects placed in-service and of return on
incremental rate base
• Deferrals added to rate base and recovered over 20 years
• Impact of deferrals and investment above ~$800 million annually subject to cumulative revenue requirement
cap of 0.1% per month
─ Inclusion of MISO transmission charges and revenues in fuel adjustment clause
─ Property tax, cyber and physical security cost trackers
─ Economic development incentives for larger electricity consumers
─ Continued strong MoPSC oversight and consumer protections
• Amendments to SB 190 proposed March 28
─ Three-year freeze of base rates at pre opt-in level
─ $25 million payment to customers if first post opt-in base rate increase
exceeds 3% CAGR; if exceeds 3.75% CAGR must cease further deferrals
of depreciation and return between rate cases
• Would support Ameren Missouri’s ability to execute $1 billion incremental
capital investment plan over five years (submitted to MoPSC in Sept. 2016)
1 House Bill 628 is companion to Senate Bill 190.
Customer and Community Benefits
Enhanced regulatory
framework would enable
greater investment; create
more reliable, smarter grid;
facilitate transition to
cleaner, more diverse
energy portfolio; better
position Missouri for future;
and create significant
number of quality jobs
Missouri Legislative Update

| Barclay’s Chicago Utility Conference | April 11, 2017
• Ameren supports thoughtful, comprehensive tax reform
─ Lowers corporate tax rates
─ Drives economic growth and job creation
─ Benefits our customers, communities and other key stakeholders
• Reform proposals not fully-developed, but several concepts have been discussed
─ Lower corporate tax rate (20%)
─ Loss of interest expense deductibility
─ Immediate deductibility of capital expenditures
─ Preservation of state and local tax deductibility
─ Retained normalization of income taxes for ratemaking
─ Flow-back of excess deferred taxes to customers over life of assets
• Still relatively early in process, with many moving parts, but we believe
Ameren is well-positioned to maintain strong growth outlook1
─ Assessment of preliminary tax reform proposals suggests no change to earnings per
share growth guidance through 2020
─ Expected to result in one-time non-cash charge to write-down deferred tax assets to
reflect lower tax rate
─ Manageable cash flow impact
• Will continue to actively work with our industry and policy makers to advance
the interests of our key stakeholders
15
Federal Income Tax Reform
1 Issued and effective as of Feb. 16, 2017 Earnings Conference Call .

| Barclay’s Chicago Utility Conference | April 11, 2017
Strategic Focus and Guidance

| Barclay’s Chicago Utility Conference | April 11, 2017 17
Executing Our Strategy in 2017
Key Focus Areas
• Transmission
─ Advance regional multi-value projects (Illinois Rivers, Spoon River, and Mark
Twain) and local reliability projects included in investment plan
─ Continue to work for constructive outcome in pending MISO ROE complaint case
• Ameren Illinois electric and natural gas delivery
─ Continue to execute Modernization Action Plan and invest to replace and upgrade
aging natural gas infrastructure
─ Capitalize on enhanced electric distribution regulatory framework pursuant to
recently enacted Future Energy Jobs Act
• Ameren Missouri
─ Deliver constructive outcome of rate review
─ Advocate for legislation that would enhance regulatory framework
• Ameren-wide
─ Advocate for responsible energy policies at federal and state levels
─ Advocate for thoughtful, comprehensive tax reform
─ Advance innovative technology efforts
─ Relentless focus on continuous improvement of operating performance, safety,
disciplined cost management and strategic capital allocation

| Barclay’s Chicago Utility Conference | April 11, 2017
$1.47 $1.39
$0.52 $0.50
$0.24 $0.24
$0.48 $0.48 $2.65
$(0.03) $(0.03) 2016 2016 2017E
Ameren Parent and Other
Ameren Transmission
Ameren Illinois Natural Gas
Ameren Illinois Electric Distribution
Ameren Missouri
2016
WN3
$2.58
• Expect strong weather-normalized EPS growth in
2017
─ ~6.5% based on 2017 guidance range midpoint
• Remain on track to deliver strong long-term
earnings growth in the future
─ Expect 5% to 8% compound annual EPS growth from
2016 through 20201,2
─ Driven by continued execution of our strategy in 2017 and
beyond, including strong rate base growth
─ Outlook accommodates range of Treasury rates, sales
growth, spending levels and regulatory developments
Earnings Guidance
18
2017 Diluted
EPS Guidance
Range of
$2.65
to $2.852
1 Based on adjusted 2016 EPS guidance midpoint of $2.63 provided Feb. 19, 2016. 2 Issued and effective as of Feb. 16, 2017
Earnings Conference Call. 3 Excludes an estimated $0.10 per share relating to the effect of weather compared to normal
(revenues of $0.16 per share less income tax expense of 0.06 per share).
GAAP and Weather-normalized (WN) Diluted EPS 2016 vs. 2017E
2016
GAAP
$2.68
2017E
GAAP2
$2.85

| Barclay’s Chicago Utility Conference | April 11, 2017 19
Regulated by MoPSC
Increased electric service rates consistent with stipulation and agreement
─ Reflects infrastructure investments in service at Dec. 31, 2016, as well as more
recent sales and cost levels
─ Removes negative effect of lower sales to New Madrid smelter: ~+$0.12
Increased depreciation, transmission and property tax expenses
Return to normal temperatures: ~$(0.08)
Absence of 2016 performance incentive award for 2015 energy efficiency plan: $(0.07)
Callaway refueling and maintenance outage scheduled for fall 2017 vs. spring 2016
Ameren Transmission
Regulated by FERC
Higher average estimated rate base: ~$2.52 billion compared to ~$2.12 billion in
2016 reflecting infrastructure investments made under formula ratemaking
─ Expect lower projected weighted average allowed ROE vs. ~11.3% for 2016
─ Assumes FERC final order in Q2 2017
1 Issued and effective as of Feb. 16, 2017 Earnings Conference Call. 2 Estimated average rate base for Ameren Illinois and ATXI is $1.4 billion and $1.1 billion for 2017, respectively, compared to $1.2 billion and $0.9 billion for 2016, respectively.
2017 Earnings Guidance: Key Drivers and Assumptions1
2017 Diluted
EPS Guidance
Range of
$2.65
to $2.851
Ameren Missouri
| Barclay’s Chicago Utility Conference | April 11, 2017 20
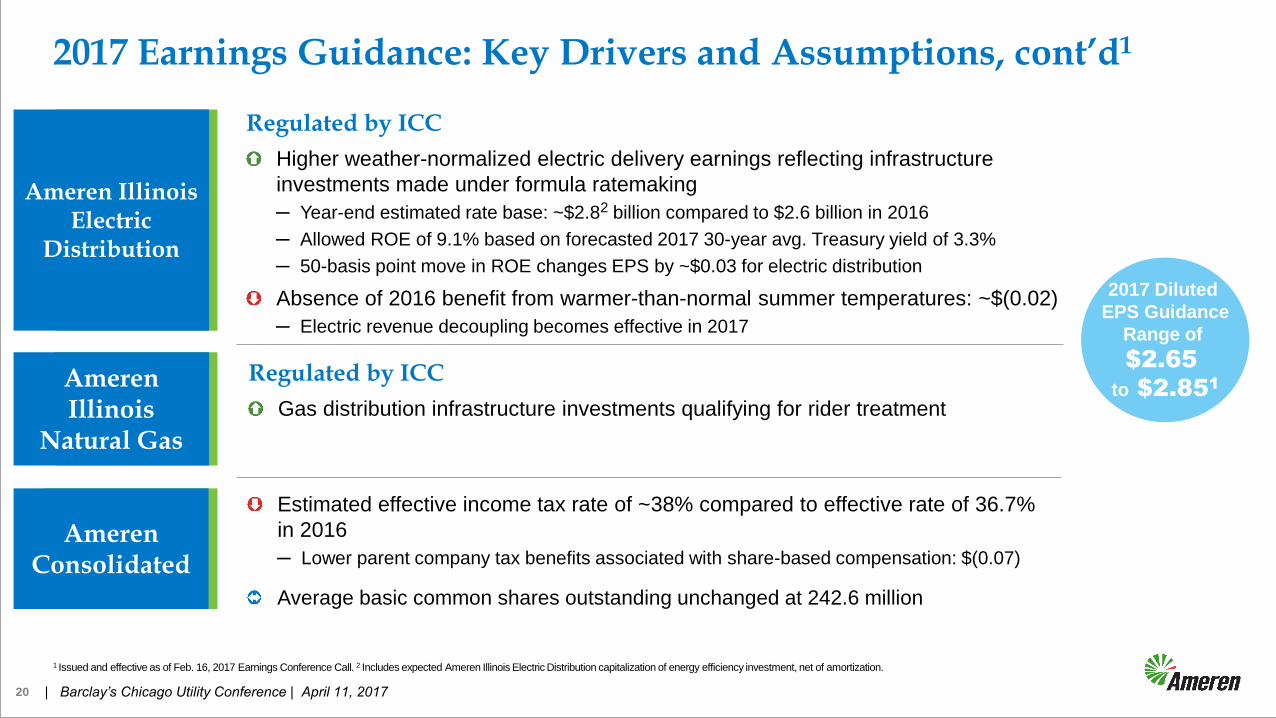
Regulated by ICC
Gas distribution infrastructure investments qualifying for rider treatment
Ameren Consolidated
Estimated effective income tax rate of ~38% compared to effective rate of 36.7%
in 2016
─ Lower parent company tax benefits associated with share-based compensation: $(0.07)
Average basic common shares outstanding unchanged at 242.6 million
2017 Earnings Guidance: Key Drivers and Assumptions, cont’d1
Regulated by ICC
Higher weather-normalized electric delivery earnings reflecting infrastructure
investments made under formula ratemaking
─ Year-end estimated rate base: ~$2.82 billion compared to $2.6 billion in 2016
─ Allowed ROE of 9.1% based on forecasted 2017 30-year avg. Treasury yield of 3.3%
─ 50-basis point move in ROE changes EPS by ~$0.03 for electric distribution
Absence of 2016 benefit from warmer-than-normal summer temperatures: ~$(0.02)
─ Electric revenue decoupling becomes effective in 2017
Ameren Illinois
Natural Gas
Ameren Illinois Electric
Distribution
1 Issued and effective as of Feb. 16, 2017 Earnings Conference Call. 2 Includes expected Ameren Illinois Electric Distribution capitalization of energy efficiency investment, net of amortization.
2017 Diluted
EPS Guidance
Range of
$2.65
to $2.851

| Barclay’s Chicago Utility Conference | April 11, 2017
$785
$480
$255
$375
$325
2017E
Ameren Transmission Company of Illinois
Ameren Illinois Transmission
Ameren Illinois Natural Gas
Ameren Illinois Electric Distribution
Ameren Missouri
2017 Capital Expenditures ($ Millions)
2017 Cash Flow Guidance1
21
($ millions)
2017 Guidance
Net cash provided by operating activities $ 1,990
Capital expenditures (2,220)
Other cash used in investing activities (35)
Dividends: common and preferred2 (435)
Free cash flow $ (700)
Maturities of long-term debt3 $ 675
Expected long-term financings in 2017 • Ameren Missouri in June
• Ameren Parent/ATXI midyear
• Ameren Illinois in Nov./Dec.
1 Issued and effective as of Feb. 16, 2017 Earnings Conference Call. 2 Approximate amount incorporating current common dividend rate. Amount and timing of
common dividends are within the sole discretion of Ameren’s board of directors. 3 Ameren Missouri’s senior secured notes of $425 million principal amount due
in June and Ameren Illinois’ senior secured notes of $250 million principal amount due in Nov.
65%
35%
$2,220
| Barclay’s Chicago Utility Conference | April 11, 2017 22
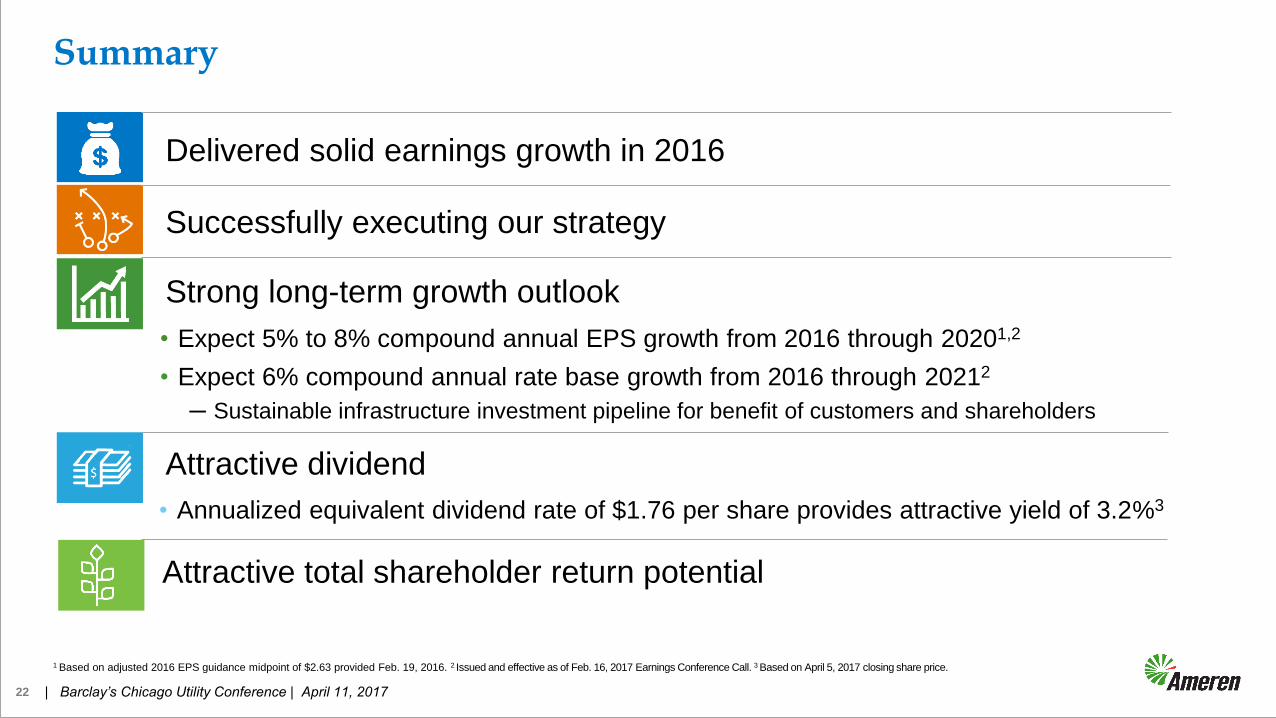
Strong long-term growth outlook
• Expect 5% to 8% compound annual EPS growth from 2016 through 20201,2
• Expect 6% compound annual rate base growth from 2016 through 20212
─ Sustainable infrastructure investment pipeline for benefit of customers and shareholders
• Annualized equivalent dividend rate of $1.76 per share provides attractive yield of 3.2%3
Delivered solid earnings growth in 2016
Successfully executing our strategy
Attractive dividend
1 Based on adjusted 2016 EPS guidance midpoint of $2.63 provided Feb. 19, 2016. 2 Issued and effective as of Feb. 16, 2017 Earnings Conference Call. 3 Based on April 5, 2017 closing share price.
Summary
Attractive total shareholder return potential

| Barclay’s Chicago Utility Conference | April 11, 2017
Appendix
| Barclay’s Chicago Utility Conference | April 11, 2017 | Barclay’s Chicago Utility Conference | April 11, 2017
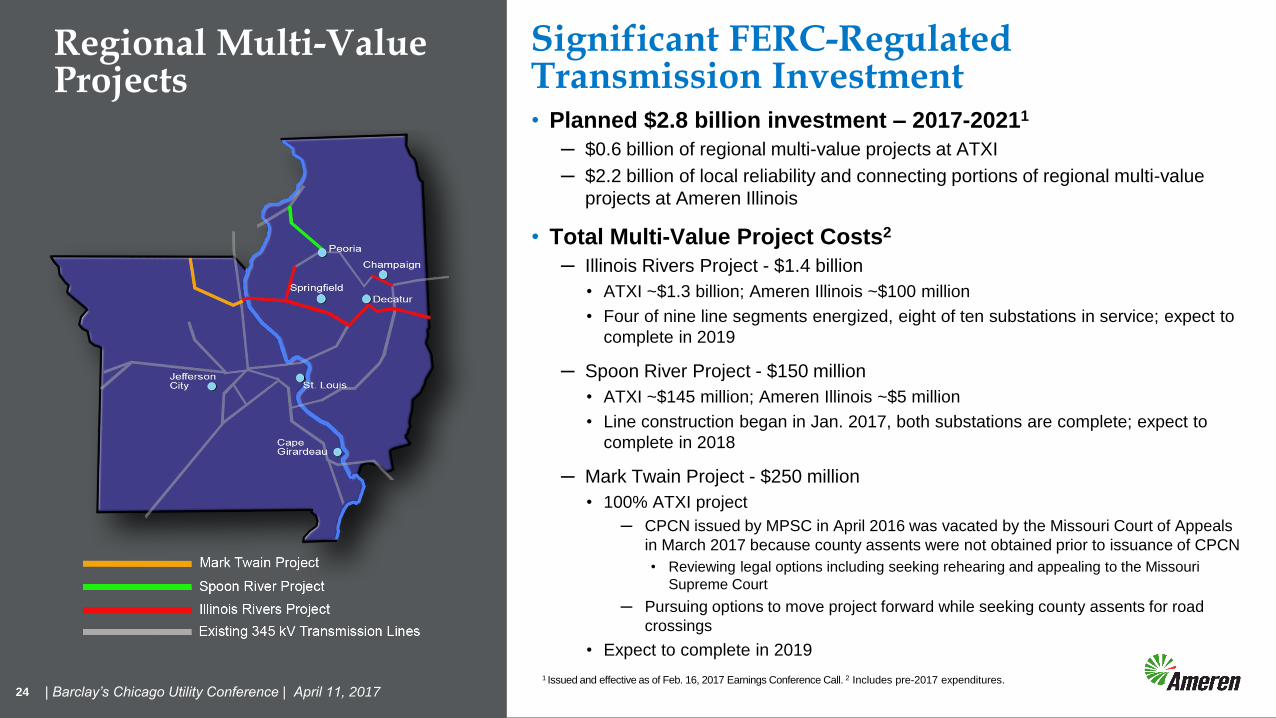
Regional Multi-Value Projects
24
• Planned $2.8 billion investment – 2017-20211
─ $0.6 billion of regional multi-value projects at ATXI
─ $2.2 billion of local reliability and connecting portions of regional multi-value
projects at Ameren Illinois
• Total Multi-Value Project Costs2
─ Illinois Rivers Project - $1.4 billion
• ATXI ~$1.3 billion; Ameren Illinois ~$100 million
• Four of nine line segments energized, eight of ten substations in service; expect to
complete in 2019
─ Spoon River Project - $150 million
• ATXI ~$145 million; Ameren Illinois ~$5 million
• Line construction began in Jan. 2017, both substations are complete; expect to
complete in 2018
─ Mark Twain Project - $250 million
• 100% ATXI project
─ CPCN issued by MPSC in April 2016 was vacated by the Missouri Court of Appeals
in March 2017 because county assents were not obtained prior to issuance of CPCN
• Reviewing legal options including seeking rehearing and appealing to the Missouri
Supreme Court
─ Pursuing options to move project forward while seeking county assents for road
crossings
• Expect to complete in 2019
1 Issued and effective as of Feb. 16, 2017 Earnings Conference Call. 2 Includes pre-2017 expenditures.
| Barclay’s Chicago Utility Conference | April 11, 2017
Significant FERC-Regulated Transmission Investment
| Barclay’s Chicago Utility Conference | April 11, 2017
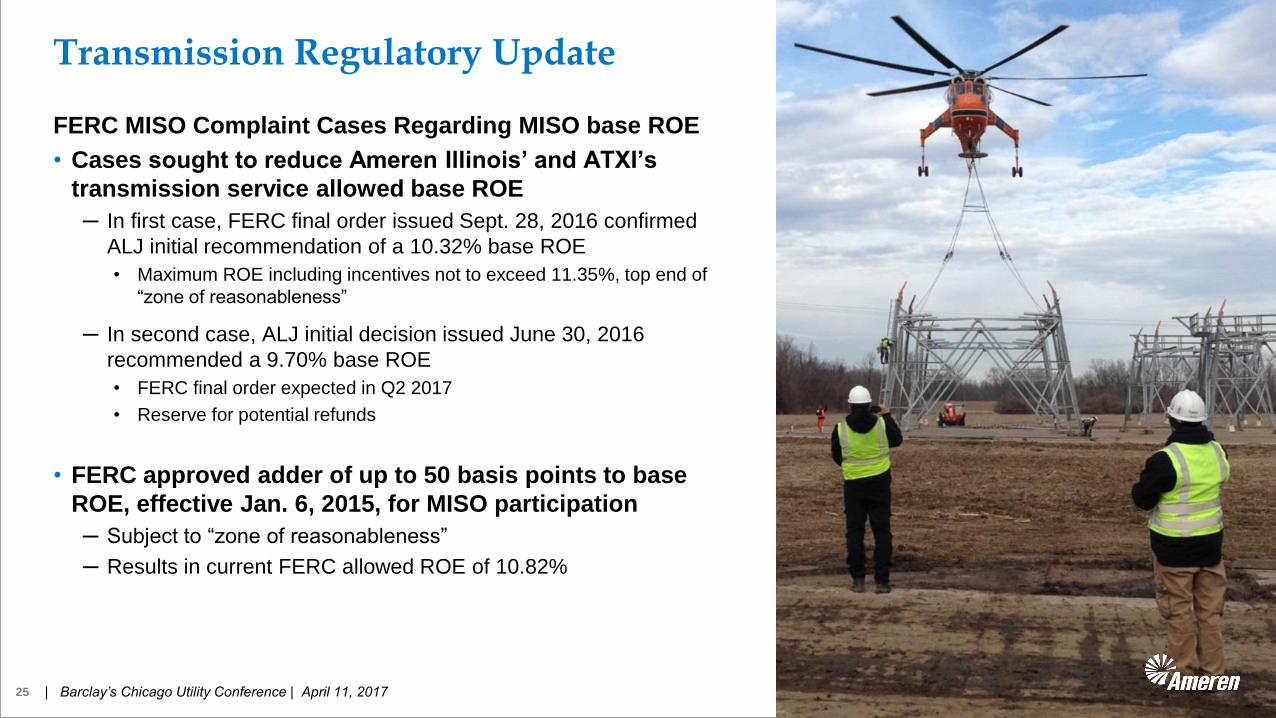
FERC MISO Complaint Cases Regarding MISO base ROE
• Cases sought to reduce Ameren Illinois’ and ATXI’s
transmission service allowed base ROE
─ In first case, FERC final order issued Sept. 28, 2016 confirmed
ALJ initial recommendation of a 10.32% base ROE
• Maximum ROE including incentives not to exceed 11.35%, top end of
“zone of reasonableness”
─ In second case, ALJ initial decision issued June 30, 2016
recommended a 9.70% base ROE
• FERC final order expected in Q2 2017
• Reserve for potential refunds
• FERC approved adder of up to 50 basis points to base
ROE, effective Jan. 6, 2015, for MISO participation
─ Subject to “zone of reasonableness”
─ Results in current FERC allowed ROE of 10.82%
Transmission Regulatory Update
25

| Barclay’s Chicago Utility Conference | April 11, 2017 26
Illinois Commerce Commission • Website: http://www.icc.illinois.gov
Missouri General Assembly / Missouri Public Service Commission • Senate Bills 190, 214 and 215: http://www.senate.mo.gov/17info/BTS_Web/BillList.aspx?SessionType=R
• House Bills 628 and 997: http://www.house.mo.gov/billlist.aspx
• 2016 electric rate review: Docket No. ER-2016-0179
• Missouri Court of Appeals order vacating CPCN for ATXI’s Mark Twain transmission project:
https://www.courts.mo.gov/file.jsp?id=111166
• MoPSC website: https://www.efis.psc.mo.gov/mpsc/DocketSheet.html
Federal Energy Regulatory Commission • Complaint challenging MISO base ROE: Docket No. EL15-45
• Website: http://elibrary.ferc.gov/idmws/search/fercadvsearch.asp
Other Filings • Ameren Illinois & ATXI Projected 2017 Attachment O:
http://www.oasis.oati.com/woa/docs/AMRN/AMRNdocs/2017_Transmission_Rates_List.html
Select Regulatory and Legislative Matters
| Barclay’s Chicago Utility Conference | April 11, 2017 27
APRIL 2017
MON. TUES. WED. THUR. FRI. SAT.
1
2 3 4 5 6 7 8
9 10 11 12 13 14 15
Barclays
Chicago
Conf.
Q1 Quiet
Period
16 17 18 19 20 21 22
23/30 24 25 26 27 28 29
MAY 2017
SUN. MON. TUES. WED. THUR. FRI. SAT.
1 2 3 4 5 6
Q1 Quiet
Period,
continued
Q1 2017
Earnings
Release
7 8 9 10 11 12 13
14 15 16 17 18 19 20
21 22 23 24 25 26 27
AGA
Conf.
28 29 30 31
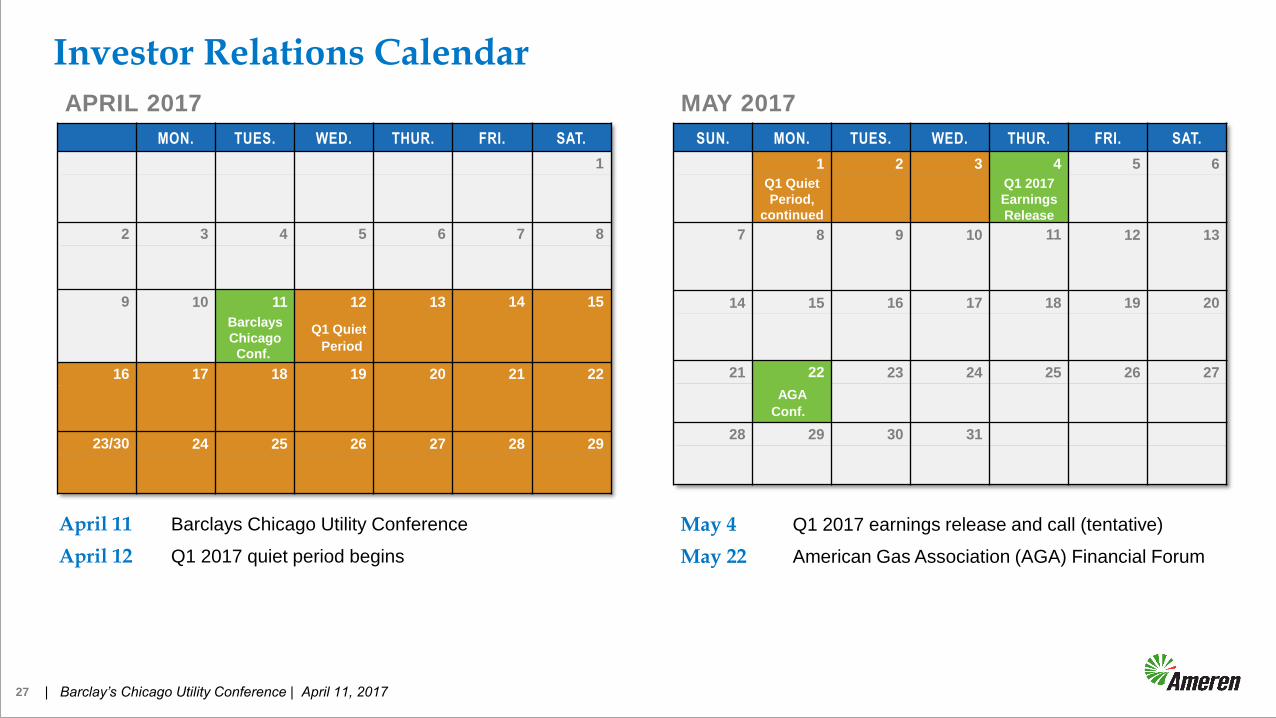
April 11 Barclays Chicago Utility Conference
April 12 Q1 2017 quiet period begins
May 4 Q1 2017 earnings release and call (tentative)
May 22 American Gas Association (AGA) Financial Forum
Investor Relations Calendar

| Barclay’s Chicago Utility Conference | April 11, 2017 28
ALJ – Administrative Law Judge
ATXI – Ameren Transmission Company of Illinois
B – Billion
CAGR – Compound annual growth rate
CPCN – Certificate of Public Convenience and Necessity
E – Estimated
EPS – Earnings per share
FERC – Federal Energy Regulatory Commission
GAAP – Generally Accepted Accounting Principles
ICC – Illinois Commerce Commission
M – Million
MISO – Midcontinent Independent System Operator, Inc.
MoPSC – Missouri Public Service Commission
MWh – Megawatthour
New Madrid smelter – New Madrid, Missouri aluminum
smelter (formerly owned by Noranda Aluminum, Inc.)
OPEB – Other Post-Employment Benefits
ROE – Return on Equity
SEC – U.S. Securities and Exchange Commission
Glossary of Terms and Abbreviations