Embed Size (px)
Citation preview
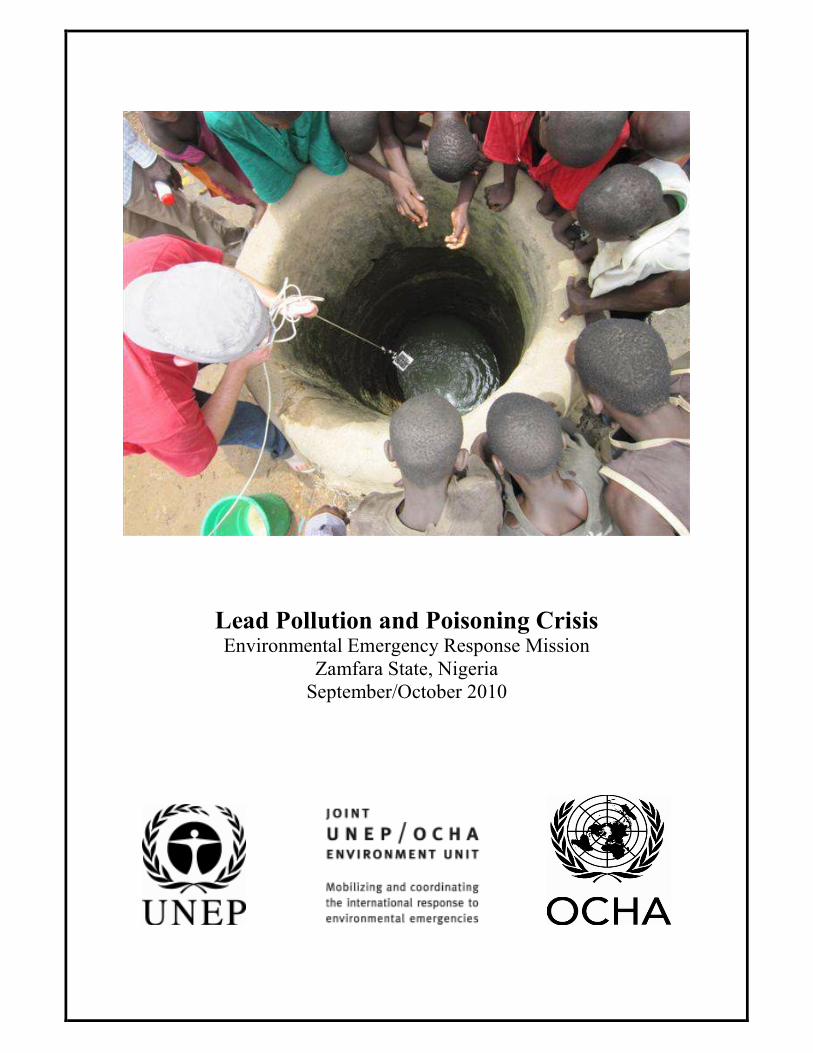
Lead Pollution and Poisoning Crisis Environmental Emergency Response Mission
Zamfara State, Nigeria
September/October 2010
2
Published in Switzerland, November 2010 by the Joint UNEP/OCHA Environment Unit Copyright © 2010 Joint UNEP/OCHA Environment Unit This publication may be reproduced in whole or in part and in any form for educational or not-for-profit purposes without special permission from the copyright holder, provided acknowledgement is made of the source. Joint UNEP/OCHA Environment Unit Palais des Nations CH-1211 Geneva 10 Switzerland Tel. +41 (0) 22 917 4419 Fax +41 (0) 22 917 0257 http://ochaonline.un.org/ochaunep Experts: Jurgen van Belle (EAM team leader), Matthew Conway (mission team leader), Gert-Jan Knetsch, Edith van Putten, Ramon Ramlal Report Editor: Joint UNEP/OCHA Environment Unit Cover photo: gathering sediment sample from drinking water well in a village of Anka LGA, Zamfara State, northern Nigeria (credit Joint UNEP/OCHA Environment Unit)
3
Table of Contents
Table of Contents................................................................................................................... 3
Executive summary ............................................................................................................... 5
List of acronyms and glossary of terms .................................................................................. 9
1 Introduction ................................................................................................................. 10
1.1 Nigeria ................................................................................................................. 10
1.2 Zamfara State ....................................................................................................... 10
1.3 Mass acute lead poisoning .................................................................................... 11
2 Response Activities...................................................................................................... 12
2.1 JEU Sampling and Analysis Mission .................................................................... 12
2.2 Assessments and Findings .................................................................................... 14
2.2.1 Sampling and analytical strategy................................................................... 14
2.2.2 Results of the measurements ......................................................................... 15
3 Conclusions ................................................................................................................. 21
3.1 Lead in drinking water.......................................................................................... 21
3.2 Lead in surface water............................................................................................ 21
3.3 Lead in soil........................................................................................................... 22
3.4 Mercury in air ...................................................................................................... 22
3.5 Mercury in water and soil ..................................................................................... 22
3.6 Possible resumption of processing activities in remediated villages ...................... 22
3.7 Further study of food pathways needed................................................................. 22
3.8 Further study needed to determine extent of lead pollution ................................... 23
3.9 Wholistic approach to further study ...................................................................... 23
4 Recommendations........................................................................................................ 24
4.1 Remediation of highly contaminated wells ........................................................... 24
4.2 Protect sensitive areas and remediate villages ....................................................... 24
4.3 Erect safety walls around wells............................................................................. 24
4.4 Assess other villages for possible contamination .................................................. 24
4.5 Key messages for inclusion in public education efforts......................................... 24
5 Further Considerations ................................................................................................. 25
6 Acknowledgements...................................................................................................... 26
7 Bibliography ................................................................................................................ 27
8 Annexes....................................................................................................................... 28
Annex I: Composition of the mission team....................................................................... 28
Annex II: Mission Itinerary.............................................................................................. 29
Annex III: Mission Terms of Reference ........................................................................... 31
Additional supplies: ..................................................................................................... 34
Annex IV: Mercury Fact Sheet......................................................................................... 36
What happens to mercury when it enters the environment? .......................................... 36
How can mercury affect my health? ............................................................................. 36
How does mercury affect children? .............................................................................. 36
Annex V: Lead Fact Sheet ............................................................................................... 37
What is lead? ............................................................................................................... 37
How can lead affect one’s health? ................................................................................ 37
How does lead affect children?..................................................................................... 37
What happens to lead when it enters the environment?................................................. 37
Health effects of lead ................................................................................................... 37
Annex VI: Background information on analysis............................................................... 38
Lead detection in water with water testing kit method .................................................. 38
Lead detection in water with GC-MS method............................................................... 38
4
Lead detection in sediment and soil with XRF method ................................................. 39
Mercury detection in air with mercury analyzer............................................................ 40
Annex VII: Background information on samples.............................................................. 41
Annex VIII: Maps............................................................................................................ 46
A. Overview.............................................................................................................. 46
B. Kirsa village ......................................................................................................... 47
C. Abare village........................................................................................................ 48
D. Bagega village...................................................................................................... 49
E. Dareta village ....................................................................................................... 50
F. Sunke village........................................................................................................ 51
5
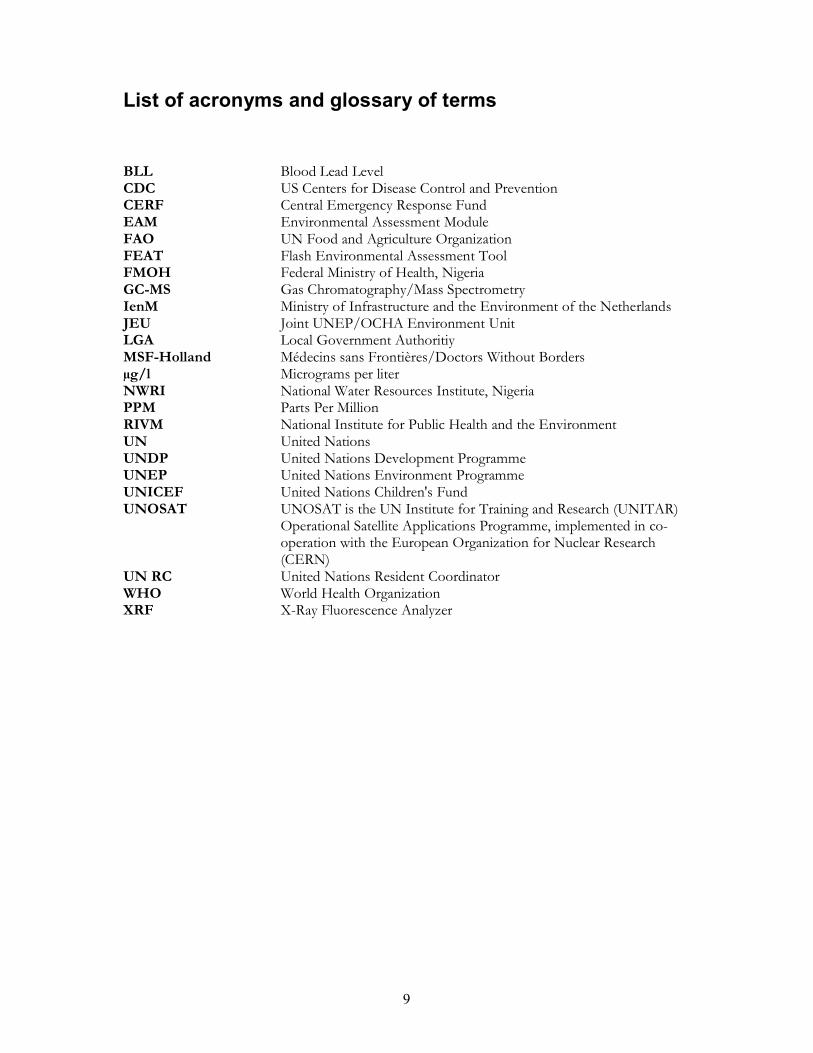
Executive summary In March 2010, an unusually high number of deaths, primarily among children under age 5 in Bukkuyum and Anka Local Government Areas (LGAs) of Zamfara State, northern Nigeria, was reported by Médecins sans Frontières (MSF-Holland) to state health authorities. Further study1 on blood samples taken by MSF revealed that the increased mortality was the result of acute lead poisoning, determined to be caused by massive environmental contamination from artisanal mining and processing of gold found in lead-rich ore. The grinding of the ore into fine particles resulted in extensive dispersal of lead dust in the villages concerned, including within family compounds. Ingestion and inhalation of the fine lead particles was determined to be the major reason for high blood lead levels in victims’ bodies. 2 Blood lead levels (BLLs) were “unprecedented” for human beings, according to the US Centers for Disease Control and Prevention (CDC). From 20 September through 7 October 2010, the Joint UNEP/OCHA Environment Unit (JEU) led a sampling and analysis mission to investigate the lead pollution emergency in Zamfara State, following requests for assistance from the Federal Ministry of Health of Nigeria and the UN Resident Coordinator. Specifically, the mission focused on determining quantities of lead in ground and surface water, building on investigations already conducted by the CDC, the World Health Organization (WHO), and the National Water Resources Institute of Nigeria (NWRI), and a team from TerraGraphics Environmental Engineering/The Blacksmith Institute, as it was determined that there was insufficient information in these domains. The mission also took the opportunity to look at lead levels in soil, and mercury levels in air. Field work focused on five villages in Anka Local Government Authority (LGA), two of which had been confirmed as lead-contaminated (Abare and Sunke); two of which were newly suspected of contamination (Kirsa and Bagega); and one of which had been remediated (Dareta). Findings Water: The mission found that drinking water from wells did not meet WHO and Nigerian standards (10 micrograms per liter) for lead limits – in at least one case, exceeding this by more than tenfold. Water in ponds was often highly contaminated (frequently reaching 200 micrograms per liter). However, no boreholes were found to have been contaminated, indicating that lead pollution most likely remains confined to areas where processing has taken place3, and has not (yet) spread throughout the groundwater aquifer. The lead found in wells and ponds was likely to have come from external sources (processing) rather than to be naturally occurring4. Soil: In the four as-yet unremediated villages visited, the soil was often highly polluted with lead: while (for example) the US standard is 400 parts per million (ppm), readings were sometimes as high as 60,000 ppm. Since young children readily ingest soil as part of normal hand-to-mouth behaviour, such high concentrations expose children to potentially harmful amounts of lead.
1
Conducted by Professor Ruddiger Arndt Haus, Labor Lademannbogen, Hamburg, Germany (www.labor-lademannbougen.de) 2 The determination was made by a joint CDC/WHO/MSF investigation team based on epidemiological, clinical and laboratory research conducted in some of the villages where ore processing activities occurred. 3 In other words, contamination did not spread to other areas such as farmlands because most of the processing has been done in compounds or near water sources like rivers, ponds or wells. 4 In most cases, exceeding of the WHO guideline was coupled with high concentrations of lead in the soil around the well. Therefore, the mission suspects that the contamination of the wells has been caused by run-off from sites where lead-contaminated ore has been/is being processed. This is consistent the mission’s findings that drinking water from boreholes was never found to be contaminated.
6
WHO has recently withdrawn the Provisional Tolerable Weekly Intake (PTWI) value for lead on the grounds that it is not possible to set an intake value that is protective for health.5 Air: As for concentrations of mercury in air, for which 50 nanograms per cubic meter is the maximum exposure for non-industrial workers in the Netherlands6, for example, readings of up to 24 micrograms per cubic meter – nearly 500 times the acceptable limit – were measured. This is cause for particular concern. Toxic effects cannot be ruled out, especially as the exposure is more or less chronic.7 Dareta village: Perhaps most troubling of all, the mission found high lead and mercury levels in a number of home compounds in the remediated village of Dareta, which could be an indication that processing activities have been continued by some individuals. Conclusions
• The mission believes that contaminated water is less of a concern than contaminated soil, due to the levels and extent of contamination, meaning that priority should be given to soil in remediation efforts.
• Contamination is coming from ‘above’, meaning that lead has been introduced into the wells from the top during processing of ore and from run-off during the rainy season.
• Lead pollution remains confined to areas (wells and ponds) where processing has taken place, and has not spread though the groundwater aquifer.
• High concentrations of lead (up to more than 1,000 µg/l – 10 times higher than the exposure limit suggested by FAO for livestock) were often found in ponds, rivers and lakes sampled by the mission. It was not in the mission’s Terms of Reference to assess the risk of consuming animal products. However, as it is common practice to use most or all of the animal after it has been slaughtered, including using bones for soup, it is reasonable to suspect that the consumption of such meat might also be an important exposure route for humans.
• Further study of food pathways (livestock, crops) should be undertaken by Federal and State experts, with support from international partners, as livestock was seen to be drinking from contaminated ponds, and crops were found to be growing in contaminated soil near affected wells.
• Until complete remediation of polluted villages takes place, and as long as ore processing continues in sensitive areas – home compounds and villages, wells and ponds used for drinking water by humans and livestock – there remains an alarming, continuing health risk.
5 http://www.who.int/foodsafety/publications/chem/summary73.pdf
6 WHO cites a tolerable exposure of 200 ng/m3 (http://www.who.int/phe/news/Mercury-flyer.pdf) 7 Studies among occupationally exposed persons have shown that chronic exposure to concentrations of 15-30
micrograms/m3 of mercury may lead to neurotoxicological and renal effects. This is in the same range as the concentration of 25 ug/m3 as measured in the affected area in Zamfara State. The measurements, however, only cover a limited time period. It remains unclear if the people in the affected area have been chronically exposed to concentrations as high as measured. The precise extent of their exposure cannot be evaluated without long-term study or bio-monitoring activities.
7
Recommendations
• Drinking water from boreholes should be a safe alternative for people in the villages. As lead is very immobile in soil, leaching of lead into ground water is not expected to be a problem.
• In cases where lead concentrations in wells were significantly (2-3 times) higher than the WHO guideline, remedial measures (i.e. closing the well) should be taken immediately by Federal, State and local authorities, after the installation of an alternative drinking water supply system (i.e. boreholes). The remediation of these wells should be integrated into an overall remediation plan.
• Measures should be taken by Federal, State and local authorities to prevent further ore processing activities from taking place at sensitive sites – such as water sources from which humans and livestock drink – and polluted villages must be remediated in the nearest possible future, thereby enabling lead-intoxicated children to return to their villages for recovery and follow-up care.
• For all wells without them, walls should be constructed to prevent the possible run-off of potentially lead-contaminated soil into these sources of drinking water.
• Any villages in Zamfara State not yet assessed where suspected and/or confirmed mining and/or ore processing activities have taken/are taking place should be assessed immediately for possible lead pollution and poisoning.
Finally, messages such as the following should be emphasized by Federal and State authorities, as well as by UNICEF and its implementing partners, in public information efforts:
• Ore processing should only occur outside of the village, as directed by local Emirs in May 2010.
• Children should not be allowed to play on former ore processing sites. They should wash their hands in unaffected water before eating to avoid contaminating food with lead soil.
• Grinders used for the processing of ore should not be used for the processing of food. Similarly, sacks used for transporting ore, and mortar and pestles used for crushing ore, should not be used for the transport and processing of food.
• Grains and any other food items should not be dried or stored on the ground where lead dust may be present.
• Information on safer mining practices needs to be disseminated to the miners. Those working with ore could consider forming associations to facilitate dissemination of information, and should include a self-regulatory component.
8
The Joint UNEP/OCHA Environment Unit (JEU) is the UN mechanism that mobilizes and coordinates international assistance to countries affected by environmental emergencies and natural disasters with significant environmental impact. It is a 16 year-old partnership between UNEP and OCHA, combining the technical expertise of UNEP with the rapid humanitarian response and coordination mechanisms of OCHA. It serves as the UN mechanism to respond to environmental emergencies, which can be defined as a sudden onset disaster or accident resulting from natural, technological or human-induced factors, or a combination of these, that cause or threaten to cause severe environmental damage as well as harm to human health and/or livelihoods. The Unit is integrated into the Emergency Services Branch of OCHA.
9
List of acronyms and glossary of terms
BLL Blood Lead Level CDC US Centers for Disease Control and Prevention CERF Central Emergency Response Fund EAM Environmental Assessment Module FAO UN Food and Agriculture Organization FEAT Flash Environmental Assessment Tool FMOH Federal Ministry of Health, Nigeria GC-MS Gas Chromatography/Mass Spectrometry IenM Ministry of Infrastructure and the Environment of the Netherlands JEU Joint UNEP/OCHA Environment Unit LGA Local Government Authoritiy MSF-Holland Médecins sans Frontières/Doctors Without Borders µg/l Micrograms per liter NWRI National Water Resources Institute, Nigeria PPM Parts Per Million RIVM National Institute for Public Health and the Environment UN United Nations UNDP United Nations Development Programme UNEP United Nations Environment Programme UNICEF United Nations Children's Fund UNOSAT UNOSAT is the UN Institute for Training and Research (UNITAR)
Operational Satellite Applications Programme, implemented in co-operation with the European Organization for Nuclear Research (CERN)
UN RC United Nations Resident Coordinator WHO World Health Organization XRF X-Ray Fluorescence Analyzer
10
1 Introduction This section provides the mission’s context, including a brief introduction to Nigeria and Zamfara State, the lead pollution emergency in Zamfara State, and the scope of the JEU mission.
1.1 Nigeria
Nigeria 8 is 923,768 km2, with a population estimated at 154,729,000 in 2009. It is located on the western coast of Africa, bordered to the west by Benin, to the north by Niger, to the east by Chad and Cameroon, and to the south by the Gulf of Guinea of the Atlantic Ocean. It is Africa’s most populous country. Nigeria has a diverse geography, with climates ranging from arid to humid equatorial. The country has abundant natural resources, notably large deposits of petroleum and natural gas.
Minerals mined in Nigeria include barite, coal, columbite (an iron-bearing mineral that accompanies tin), gold, gypsum, kaolin, lead, phosphates, rock salt, sapphires, tin, and topazes. Uranium deposits discovered in the northeaster part of the country have not yet been exploited. About two-thirds of all Nigerians earn a living from small-scale subsistence farming. Nigeria consists of 36 states and the Federal Capital Territory of Abuja. There are two tiers of government – state and local – below the federal level.
1.2 Zamfara State
Zamfara State9 is situated in the northwestern part of Nigeria and occupies 39,762 km2. Its capital is Gusau. It shares borders with Kebbi, Kaduna, Sokoto, Niger and Katsina states. It also shares an international boundary with Niger Republic to the north. The State has 14 Local Government Areas (LGAs), 62 districts and 147 political wards. Its major towns are Gusau, Kaura Namoda, Anka, Talata Mafara and Zugu. The total population of Zamfara State is estimated to be 3,582,912 out of which 716,582 are estimated to be children under the age of five years and 143,316 constitute children under the age of one year. The population is predominantly Muslim, and the State was the first in the country to establish Sharia (Islamic holy law). The predominant occupation of the people of Zamfara State is farming, with over 80 percent of its people engaged in various forms of agriculture. Major agricultural produce includes millet, guinea-corn, maize, rice, groundnuts, cotton, tobacco and beans. Some industrial infrastructure exists within the State for the processing of these raw materials into finished products.
8 Sources: Encyclopedia Britannica and the Economist Intelligence Unit 9 Source: Zamfara State Government
11
The average number of people per household in Zamfara State is 5.4, compared to 4.8 as an average for Nigeria, according to the National Population Census of 2006. Meanwhile, 18.8% of households have access to electricity, 27.6% have access to an improved source of water, and 27.5% have improved sanitation facilities (not shared), according to the National Demographic and Health Survey of 2008. Zamfara State is populated primarily by Hausa and Fulani peoples. Other ethnic groups in the State include the Bade, Kanuri, Karekare, Nupe and Tivs. The climate of Zamfara is warm tropical, with temperatures rising up to 38oC between March to June. The rainy season typically lasts from July to September, while the cold season, known as Harmattan, lasts from December to February.
1.3 Mass acute lead poisoning
Lead poisoning is most commonly caused by ingestion and inhalation of lead and lead compounds. Lead causes damage to multiple body systems, and the nervous system is particularly vulnerable, especially in young children. Chronic lead poisoning occurs when small amounts of lead are taken in over a longer period. The Centers for Disease Control and Prevention (CDC) defines childhood lead poisoning as a whole-blood lead concentration equal to or greater than 10 micrograms/dL. Acute lead poisoning, while less common, shows up more quickly and can be fatal, when a relatively large amount of lead is taken into the body over a short period of time. Children constitute the vast majority of such cases. Symptoms can include severe abdominal pain, diarrhea, nausea and vomiting, weakness of the limbs, seizures, and coma10. In March 2010, an unusually high number of deaths, primarily among children under age 5 in Bukkuyum and Anka Local Government Areas (LGAs) of Zamfara State was reported by Médecins sans Frontières (MSF-Holland) to state health authorities. Further study11 of blood samples taken by MSF revealed that the increased mortality was the result of acute lead poisoning, determined to be caused by massive environmental contamination from artisanal mining and processing of gold found in lead-rich ore. The grinding of the ore into fine particles resulted in extensive dispersal of lead dust in the villages concerned, including within family compounds. Ingestion and inhalation of the fine lead particles was determined to be the major reason for high blood lead levels in victims’ bodies.12 Blood lead levels (BLLs) were “unprecedented” for human beings, according to the CDC. Following the identification of the mass acute lead poisoning situation in Zamfara State, an immediate, two-pronged response approach was developed, consisting of a medical component and an environmental component. Medical treatment, led by MSF-Holland and in collaboration with the World Health Organization (WHO), includes use of chelating agents to reduce blood lead levels. The Zamfara State Government is leading environmental remediation efforts, with technical advice provided by the Blacksmith Institute and its implementing partner, TerraGraphics Environmental Engineering. Initial remediation of two villages (Dareta and Yargalma) was funded by the State Government. Phase two of remediation of five additional villages is funded under the auspices of UNICEF. The environmental remediation process involves removal of contaminated soil from home
10
http://medical-dictionary.thefreedictionary.com/Lead+neuropathy 11
Conducted by Professor Ruddiger Arndt Haus, Labor Lademannbogen, Hamburg, Germany (www.labor-lademannbougen.de) 12 The determination was made by a joint CDC/WHO/MSF investigation team based on epidemiological, clinical and laboratory research conducted in some of the villages where ore processing activities occurred.
12
compounds and village common areas where processing has taken place, followed by burial in landfills. It is essential that medical treatment and environmental remediation are carefully coordinated: crucial extended care (chelation therapy) cannot be provided for children who come from polluted villages, since villages must be remediated for their safe return and continued treatment. Meanwhile, several advisory and coordination bodies were established by the Federal and State authorities to address the lead poisoning crisis, namely the Inter-Ministerial Committee, created by the President and chaired by the Minister of Mines and Steel Development; the Inter-Ministerial Task Force, established and chaired by the Federal Ministry of Health; and the Zamfara State Rapid Response Team, inaugurated and chaired by the State Commissioner of Health following approval by the State Governor. At the time of this mission, only two villages had been remediated, and the list of villages suspected to be contaminated continued to grow. Efforts to temporarily settle children in “clean” villages that are not their own have had limited success.
2 Response Activities
2.1 JEU Sampling and Analysis Mission
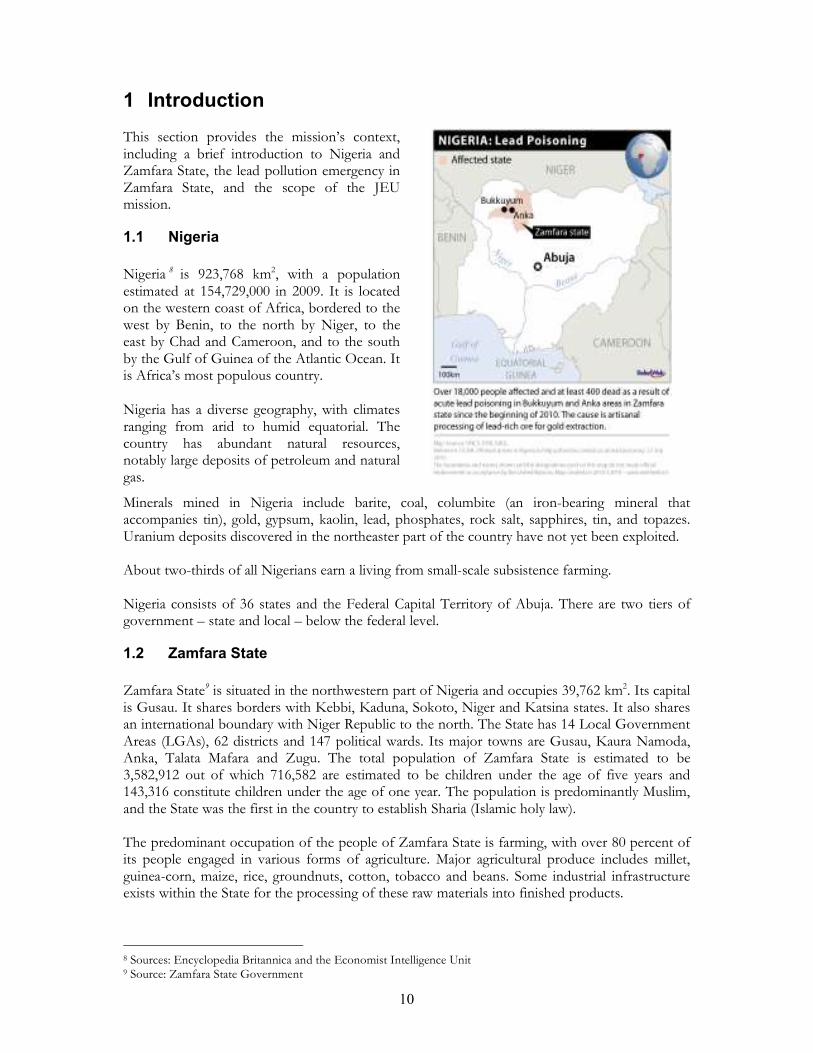
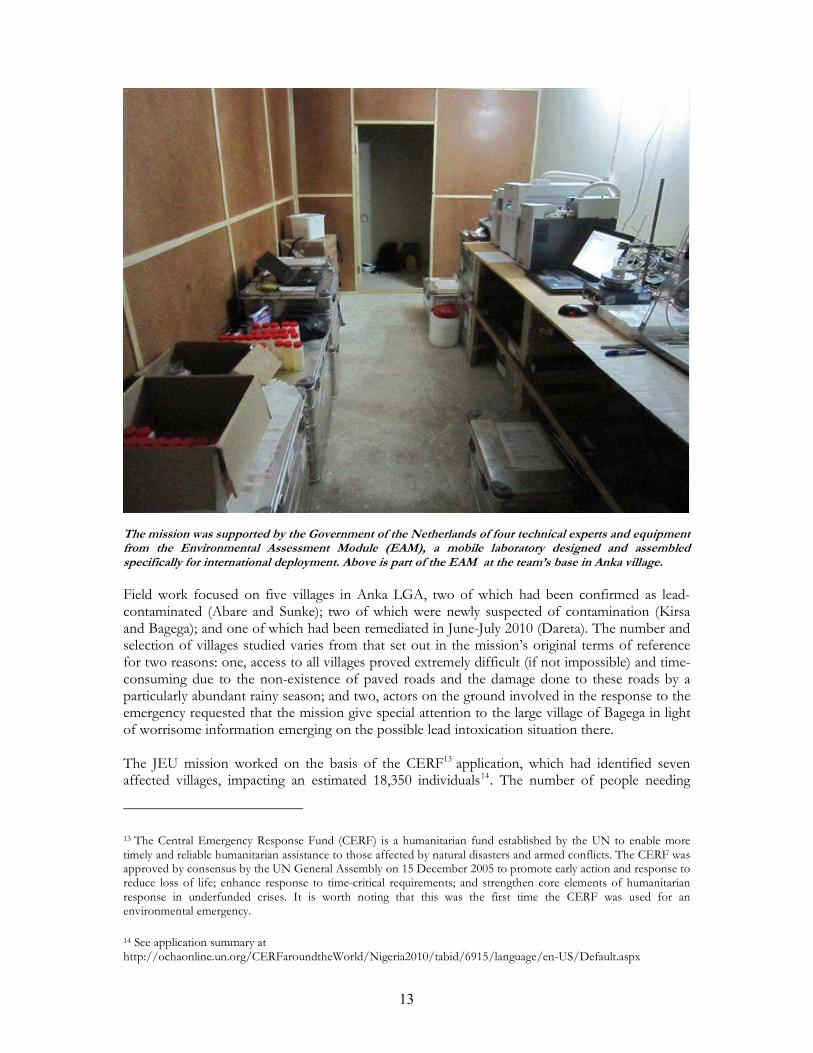
Upon the request for assistance received by the Joint UNEP/OCHA Environment Unit (JEU) from the UN Resident Coordinator in Nigeria and the Federal Ministry of Health of Nigeria, and following extensive consultations with key stakeholders involved in the response to the lead pollution and poisoning situation, it was thus agreed that the JEU would focus primarily on determining lead contamination of ground and surface water, thereby providing analytical support for decision-making and priority-setting by authorities and other actors. From 20 September through 7 October 2010, the JEU led a sampling and analysis mission to investigate the lead pollution and poisoning situation in Zamfara State, northern Nigeria, resulting from the informal processing of lead-rich ore to extract gold. Specifically, the mission focused on determining quantities of lead in ground and surface water, building on studies already done by the US Centers for Disease Control and Prevention (May-June 2010), the World Health Organization (June 2010), and the National Water Resources Institute of Nigeria (June 2010). The mission also took the opportunity to look at lead levels in soil, and mercury levels in the air. However, a number of remediation and broader development issues related to the situation were outside the scope of the mission and therefore of this report. A number of these issues may well need to be explored further by the responsible organizations. It should also be borne in mind that this report is intended for non-technical audiences, with the purpose of conveying the overall contours of the challenges in Zamfara state such that action can be taken to protect lives. It is not the purpose to offer an exhaustive or definitive scientific evaluation of all contamination issues in the state. The mission was supported by the Government of the Netherlands of four technical experts and equipment from the Environmental Assessment Module (EAM), a mobile laboratory designed and assembled specifically for international deployment. Mapping support (see Annexes) was provided by UNOSAT, which is the Operational Satellite Applications Programme of the UN Institute for Training and Research (UNITAR).
13
The mission was supported by the Government of the Netherlands of four technical experts and equipment from the Environmental Assessment Module (EAM), a mobile laboratory designed and assembled specifically for international deployment. Above is part of the EAM at the team’s base in Anka village.
Field work focused on five villages in Anka LGA, two of which had been confirmed as lead-contaminated (Abare and Sunke); two of which were newly suspected of contamination (Kirsa and Bagega); and one of which had been remediated in June-July 2010 (Dareta). The number and selection of villages studied varies from that set out in the mission’s original terms of reference for two reasons: one, access to all villages proved extremely difficult (if not impossible) and time-consuming due to the non-existence of paved roads and the damage done to these roads by a particularly abundant rainy season; and two, actors on the ground involved in the response to the emergency requested that the mission give special attention to the large village of Bagega in light of worrisome information emerging on the possible lead intoxication situation there. The JEU mission worked on the basis of the CERF13 application, which had identified seven affected villages, impacting an estimated 18,350 individuals14. The number of people needing
13 The Central Emergency Response Fund (CERF) is a humanitarian fund established by the UN to enable more timely and reliable humanitarian assistance to those affected by natural disasters and armed conflicts. The CERF was approved by consensus by the UN General Assembly on 15 December 2005 to promote early action and response to reduce loss of life; enhance response to time-critical requirements; and strengthen core elements of humanitarian response in underfunded crises. It is worth noting that this was the first time the CERF was used for an environmental emergency.
14 See application summary at http://ochaonline.un.org/CERFaroundtheWorld/Nigeria2010/tabid/6915/language/en-US/Default.aspx
14
immediate emergency medical treatment was estimated to be 2,400, representing the number of children under age 5 – those most vulnerable to acute lead poisoning15. However, it should be noted that since the CERF application was submitted, additional villages have been confirmed as being contaminated with lead, while still more remain unconfirmed but suspected. The full scale of this problem is still unknown, although efforts are underway by a variety of actors to gain a clearer understanding of the scope of the crisis.
2.2 Assessments and Findings
2.2.1 Sampling and analytical strategy
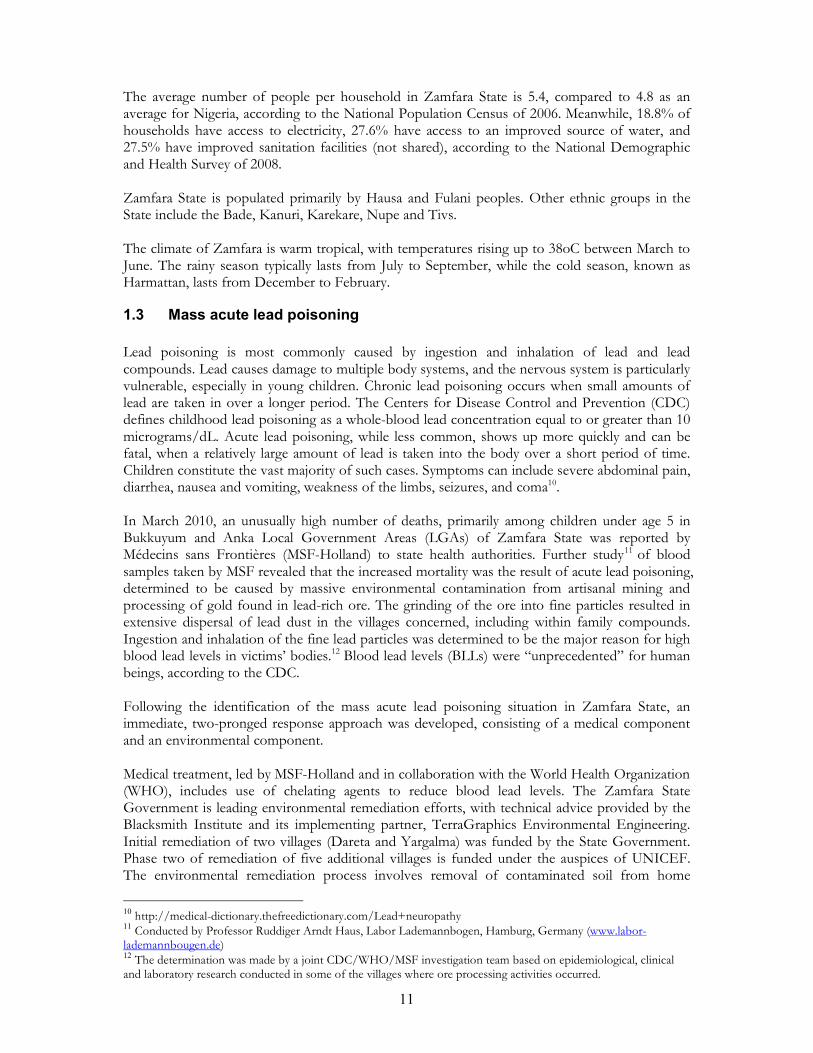
In all the villages assessed, samples were taken and indicatively analyzed from all communal and private wells of Abare, Bagega, Kirsa and Sunke, while limited, representative sampling was done in the remediated village of Dareta16. When possible, depending on the structure of the wells, sediment samples from the bottom of the wells were also taken. Additionally, samples were taken from ponds and rivers from which livestock drink, and from ponds where processing of ore takes (or has taken) place. Since livestock in northern Nigeria roam freely around and through the villages, it is expected that the animals drink wherever they find surface water. This means that drinking from specific processing places cannot be ruled out, particularly as the mission observed firsthand several instances of this. The sediment samples could not be analyzed with the lead water testing kit or GC-MS (Gas Chromatography – Mass Spectrometry), and were measured with a hand-held X-Ray Fluorescence (XRF) analyzer instead. In addition, the lead concentration of the top soil (max 5 cm) was also measured with this hand-held XRF at several sample locations (e.g. near wells). These XRF measurements of the soil were performed in collaboration with Blacksmith/TerraGraphics. The XRF is a screening device and gives only an indication of the lead content in top soil and wet sediment. There are no WHO guidelines for lead concentration in soil and sediment. However, during prior screening of the soil with a hand-held XRF,
15
For more on the particular vulnerability of young children to lead poisoning, see http://www.cdc.gov/nceh/lead/publications/books/plpyc/chapter1.htm
16 The water samples were first tested for lead with a commercially available water testing kit. This kit is accurate for concentrations above 100 µg/l. If the concentration of lead in the water sample tested below 100 µg/l, then a more sensitive analytical method using a GC-MS (Gas Chromatography – Mass Spectrometry) was performed. This was done to ensure that the analytical data would meet the WHO guideline for lead in drinking water for humans, which is 10 µg/l.
The Environmental Assessment Module (EAM) is a fully equipped mobile laboratory that can be deployed together with a small flexible team of experts quickly after a disaster involving hazardous substances in countries that lack the specialist knowledge or capacity needed to deal with environmental disasters. The module is equipped with technology for taking samples, performing environmental measurements and analyses and for communication and navigation purposes. With the equipment and personnel expertise, the EAM-team can identify a large number of chemical substances in polluted material, and advise on the nature of the pollution, and the threat it poses. The EAM is an initiative of the Netherlands Government, in particular the Ministry of Foreign Affairs and the Ministry of Infrastructure and the Environment. The aim of this initiative is to support international humanitarian missions, with a focus on health and the environment. The EAM is accommodated by the Dutch National Institute for Public Health and the Environment (RIVM).
15
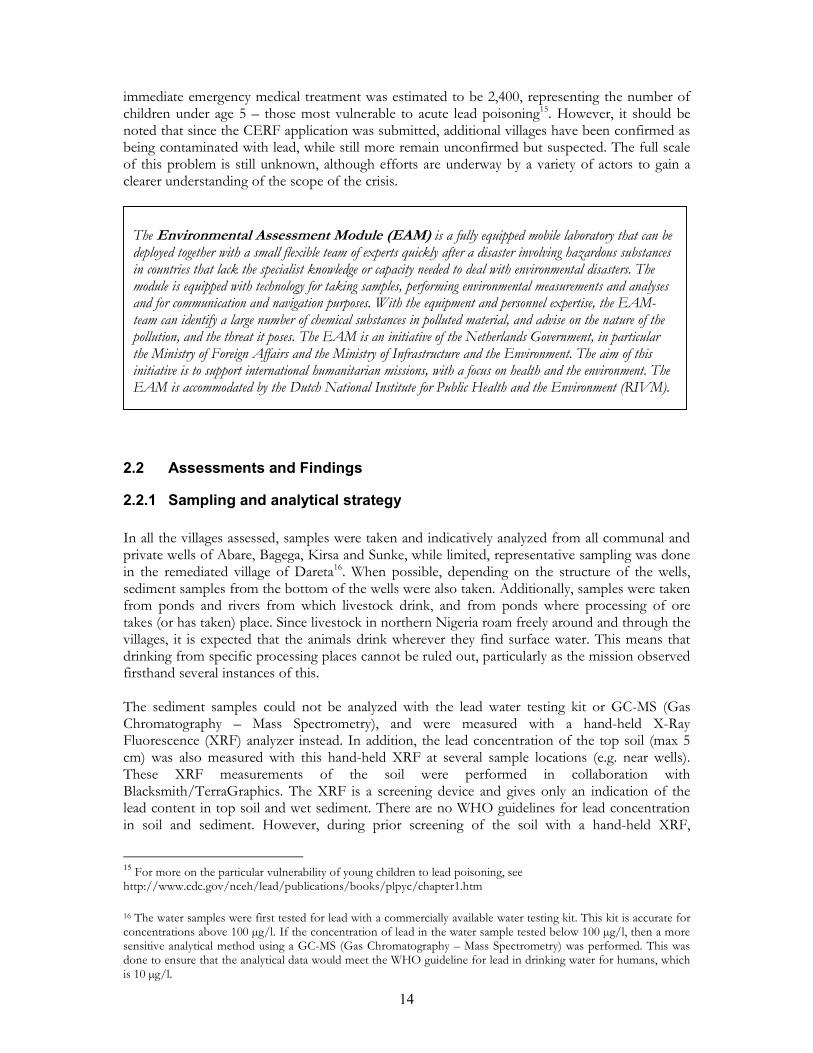
Blacksmith/TerraGraphics used the US Environmental Protection Agency (US EPA) guidelines of 400 parts per million (ppm) in soil (dry) to indicate a potential health risk. In this report, the US EPA guideline will also be used to indicate the potential health risk of lead in soil and sediment. Please note that sediment samples were not dried before testing.
Left: GC-MS; Right: XRF
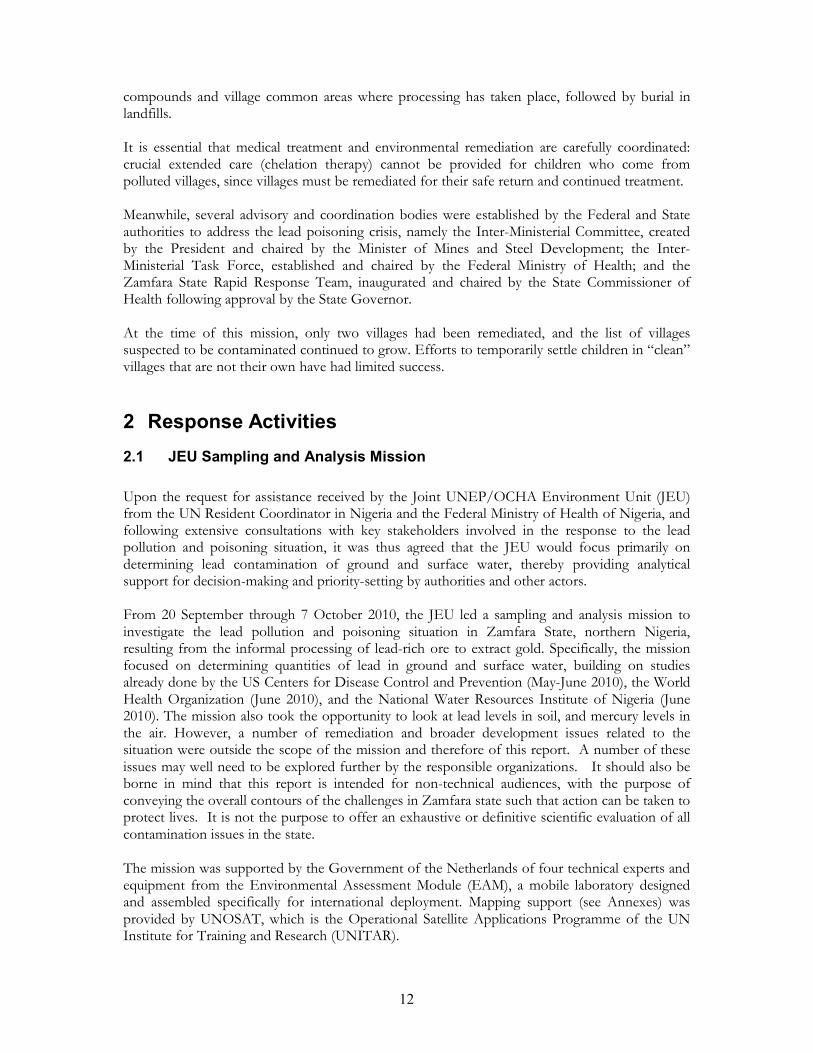
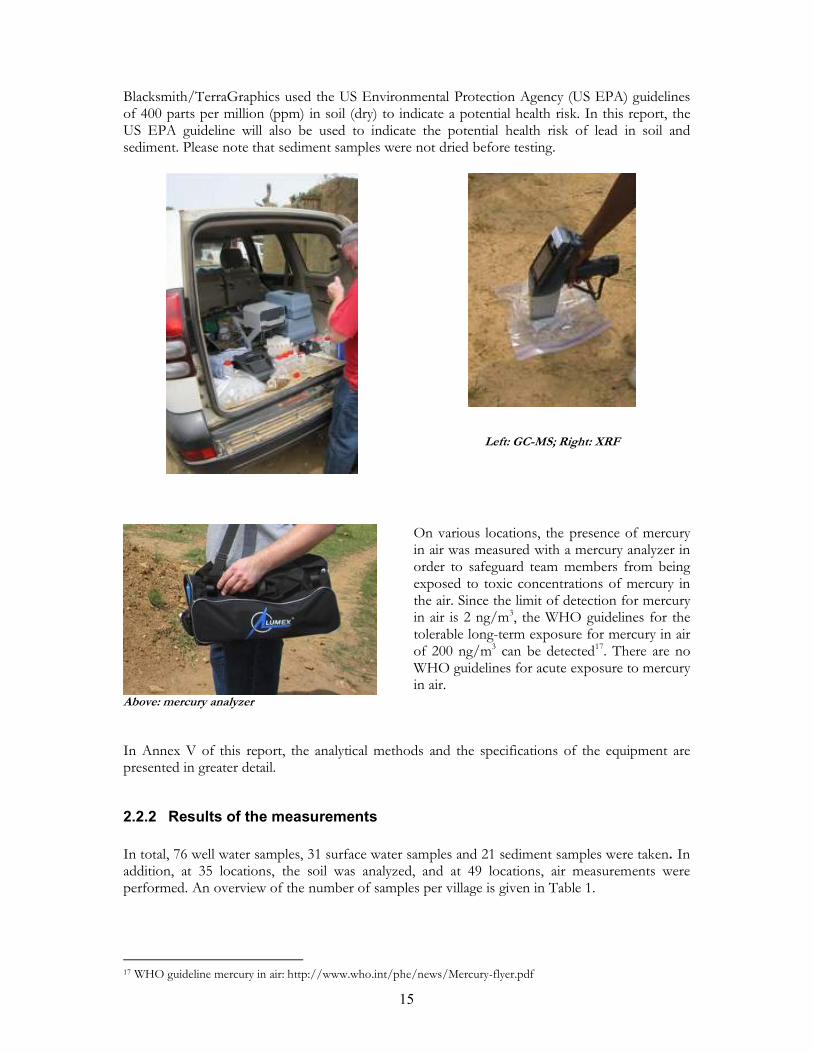
Above: mercury analyzer
On various locations, the presence of mercury in air was measured with a mercury analyzer in order to safeguard team members from being exposed to toxic concentrations of mercury in the air. Since the limit of detection for mercury in air is 2 ng/m3, the WHO guidelines for the tolerable long-term exposure for mercury in air of 200 ng/m3 can be detected17. There are no WHO guidelines for acute exposure to mercury in air.
In Annex V of this report, the analytical methods and the specifications of the equipment are presented in greater detail.
2.2.2 Results of the measurements
In total, 76 well water samples, 31 surface water samples and 21 sediment samples were taken. In addition, at 35 locations, the soil was analyzed, and at 49 locations, air measurements were performed. An overview of the number of samples per village is given in Table 1.
17 WHO guideline mercury in air: http://www.who.int/phe/news/Mercury-flyer.pdf
16
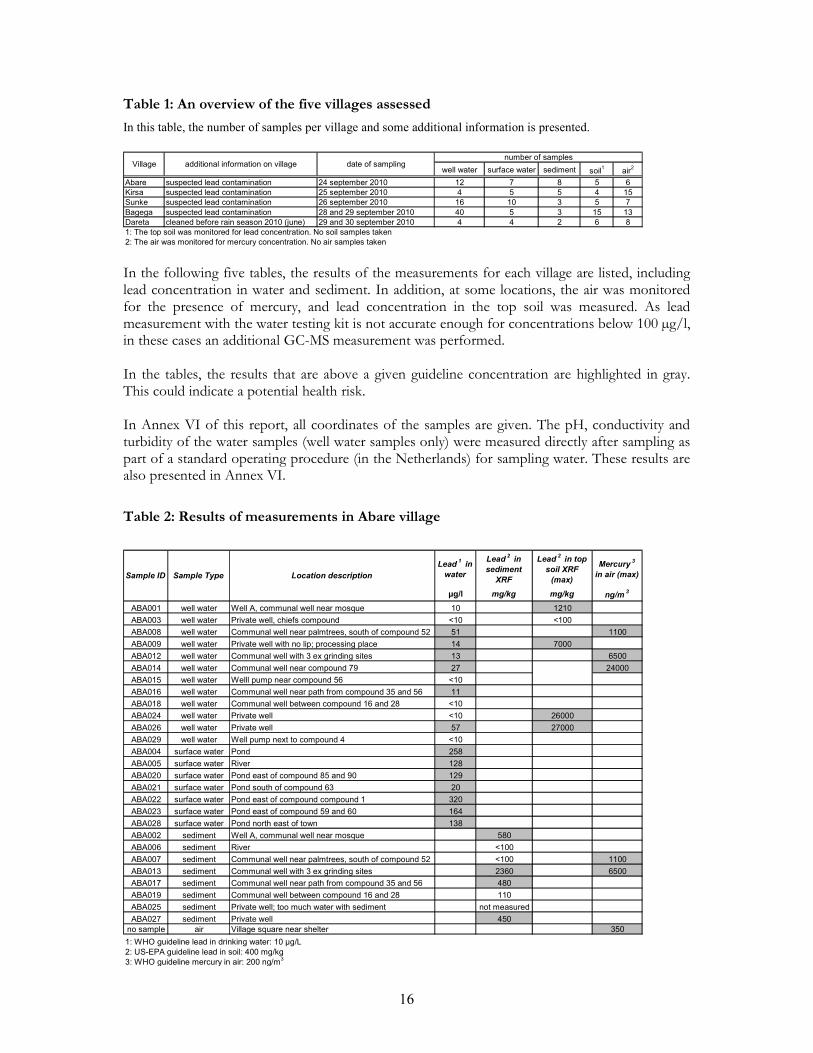
Table 1: An overview of the five villages assessed
In this table, the number of samples per village and some additional information is presented.
well water surface water sediment soil1
air2
Abare suspected lead contamination 24 september 2010 12 7 8 5 6
Kirsa suspected lead contamination 25 september 2010 4 5 5 4 15
Sunke suspected lead contamination 26 september 2010 16 10 3 5 7
Bagega suspected lead contamination 28 and 29 september 2010 40 5 3 15 13
Dareta cleaned before rain season 2010 (june) 29 and 30 september 2010 4 4 2 6 8
1: The top soil was monitored for lead concentration. No soil samples taken
2: The air was monitored for mercury concentration. No air samples taken
Village date of samplingadditional information on villagenumber of samples
In the following five tables, the results of the measurements for each village are listed, including lead concentration in water and sediment. In addition, at some locations, the air was monitored for the presence of mercury, and lead concentration in the top soil was measured. As lead measurement with the water testing kit is not accurate enough for concentrations below 100 µg/l, in these cases an additional GC-MS measurement was performed. In the tables, the results that are above a given guideline concentration are highlighted in gray. This could indicate a potential health risk. In Annex VI of this report, all coordinates of the samples are given. The pH, conductivity and turbidity of the water samples (well water samples only) were measured directly after sampling as part of a standard operating procedure (in the Netherlands) for sampling water. These results are also presented in Annex VI.
Table 2: Results of measurements in Abare village
Lead1 in
water
Lead2 in
sediment
XRF
Lead2 in top
soil XRF
(max)
Mercury3
in air (max)
µg/l mg/kg mg/kg ng/m3
ABA001 well water Well A, communal well near mosque 10 1210
ABA003 well water Private well, chiefs compound <10 <100
ABA008 well water Communal well near palmtrees, south of compound 52 51 1100
ABA009 well water Private well with no lip; processing place 14 7000
ABA012 well water Communal well with 3 ex grinding sites 13 6500
ABA014 well water Communal well near compound 79 27 24000
ABA015 well water Welll pump near compound 56 <10
ABA016 well water Communal well near path from compound 35 and 56 11
ABA018 well water Communal well between compound 16 and 28 <10
ABA024 well water Private well <10 26000
ABA026 well water Private well 57 27000
ABA029 well water Well pump next to compound 4 <10
ABA004 surface water Pond 258
ABA005 surface water River 128
ABA020 surface water Pond east of compound 85 and 90 129
ABA021 surface water Pond south of compound 63 20
ABA022 surface water Pond east of compound compound 1 320
ABA023 surface water Pond east of compound 59 and 60 164
ABA028 surface water Pond north east of town 138
ABA002 sediment Well A, communal well near mosque 580
ABA006 sediment River <100
ABA007 sediment Communal well near palmtrees, south of compound 52 <100 1100
ABA013 sediment Communal well with 3 ex grinding sites 2360 6500
ABA017 sediment Communal well near path from compound 35 and 56 480
ABA019 sediment Communal well between compound 16 and 28 110
ABA025 sediment Private well; too much water with sediment not measured
ABA027 sediment Private well 450
no sample air Village square near shelter 350
1: WHO guideline lead in drinking water: 10 µg/L2: US-EPA guideline lead in soil: 400 mg/kg3: WHO guideline mercury in air: 200 ng/m
3
Sample TypeSample ID Location description
17
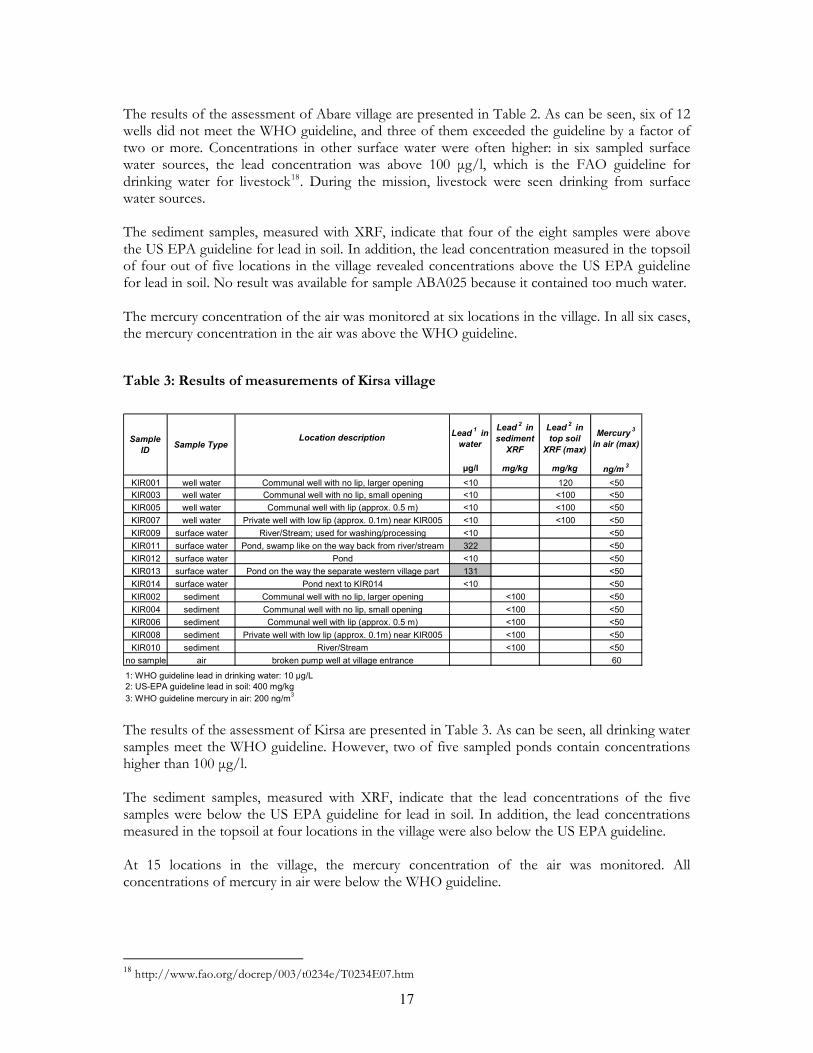
The results of the assessment of Abare village are presented in Table 2. As can be seen, six of 12 wells did not meet the WHO guideline, and three of them exceeded the guideline by a factor of two or more. Concentrations in other surface water were often higher: in six sampled surface water sources, the lead concentration was above 100 µg/l, which is the FAO guideline for drinking water for livestock18. During the mission, livestock were seen drinking from surface water sources. The sediment samples, measured with XRF, indicate that four of the eight samples were above the US EPA guideline for lead in soil. In addition, the lead concentration measured in the topsoil of four out of five locations in the village revealed concentrations above the US EPA guideline for lead in soil. No result was available for sample ABA025 because it contained too much water. The mercury concentration of the air was monitored at six locations in the village. In all six cases, the mercury concentration in the air was above the WHO guideline.
Table 3: Results of measurements of Kirsa village
Location descriptionLead
1 in
water
Lead2 in
sediment
XRF
Lead2 in
top soil
XRF (max)
Mercury3
in air (max)
µg/l mg/kg mg/kg ng/m3
KIR001 well water Communal well with no lip, larger opening <10 120 <50
KIR003 well water Communal well with no lip, small opening <10 <100 <50
KIR005 well water Communal well with lip (approx. 0.5 m) <10 <100 <50
KIR007 well water Private well with low lip (approx. 0.1m) near KIR005 <10 <100 <50
KIR009 surface water River/Stream; used for washing/processing <10 <50
KIR011 surface water Pond, swamp like on the way back from river/stream 322 <50
KIR012 surface water Pond <10 <50
KIR013 surface water Pond on the way the separate western village part 131 <50
KIR014 surface water Pond next to KIR014 <10 <50
KIR002 sediment Communal well with no lip, larger opening <100 <50
KIR004 sediment Communal well with no lip, small opening <100 <50
KIR006 sediment Communal well with lip (approx. 0.5 m) <100 <50
KIR008 sediment Private well with low lip (approx. 0.1m) near KIR005 <100 <50
KIR010 sediment River/Stream <100 <50
no sample air broken pump well at village entrance 60
1: WHO guideline lead in drinking water: 10 µg/L
2: US-EPA guideline lead in soil: 400 mg/kg
3: WHO guideline mercury in air: 200 ng/m3
Sample
IDSample Type
The results of the assessment of Kirsa are presented in Table 3. As can be seen, all drinking water samples meet the WHO guideline. However, two of five sampled ponds contain concentrations higher than 100 µg/l. The sediment samples, measured with XRF, indicate that the lead concentrations of the five samples were below the US EPA guideline for lead in soil. In addition, the lead concentrations measured in the topsoil at four locations in the village were also below the US EPA guideline. At 15 locations in the village, the mercury concentration of the air was monitored. All concentrations of mercury in air were below the WHO guideline.
18
http://www.fao.org/docrep/003/t0234e/T0234E07.htm
18
Table 4: Results of measurements of Sunke village
Lead1 in
water
Lead2 in
sediment
XRF
Lead2 in
top soil
XRF
(max)
Mercury3
in air
(max)
µg/l mg/kg mg/kg ng/m3
SUN001 well water Communal well; open <10 1080
SUN002 well water Communal well, open <10 1810 60
SUN004 well water Communal well, near pond <10 2060 5000
SUN006 well water Communal well 165 2750 100
SUN008 well water Communal hand pump <10 34800 250
SUN009 well water Private well; chief's compound <10 38
SUN010 well water Private well 16 300
SUN011 well water Private well 23
SUN012 well water Private well; cavety well: ore in compound visible <10
SUN013 well water Private well 12
SUN014 well water Private well <10
SUN015 well water Private well <10
SUN016 well water Private well <10
SUN017 well water Private well 19
SUN018 well water Private well 138
SUN019 well water Private well <10
SUN020 surface water Pond 475
SUN021 surface water Pond 176
SUN022 surface water Pond 454
SUN023 surface water Pond <10
SUN025 surface water Pond near hand pump 151
SUN026 surface water Pond 11
SUN027 surface water Pond 307
SUN028 surface water Pond near well SUN006/007; sluicing place 160
SUN029 surface water Pond; southern of the two; sluicing place 418
SUN030 surface water Pond near well SUN004/005; sluicing place 387
SUN003 sediment Communal well, open <100
SUN005 sediment Communal well, near pond <100
SUN007 sediment Communal well <100
no sample air Tree near chief's compound 60
1: WHO guideline lead in drinking water: 10 µg/L
2: US-EPA guideline lead in soil: 400 mg/kg
3: WHO guideline mercury in air: 200 ng/m3
Sample
IDSample Type Location description
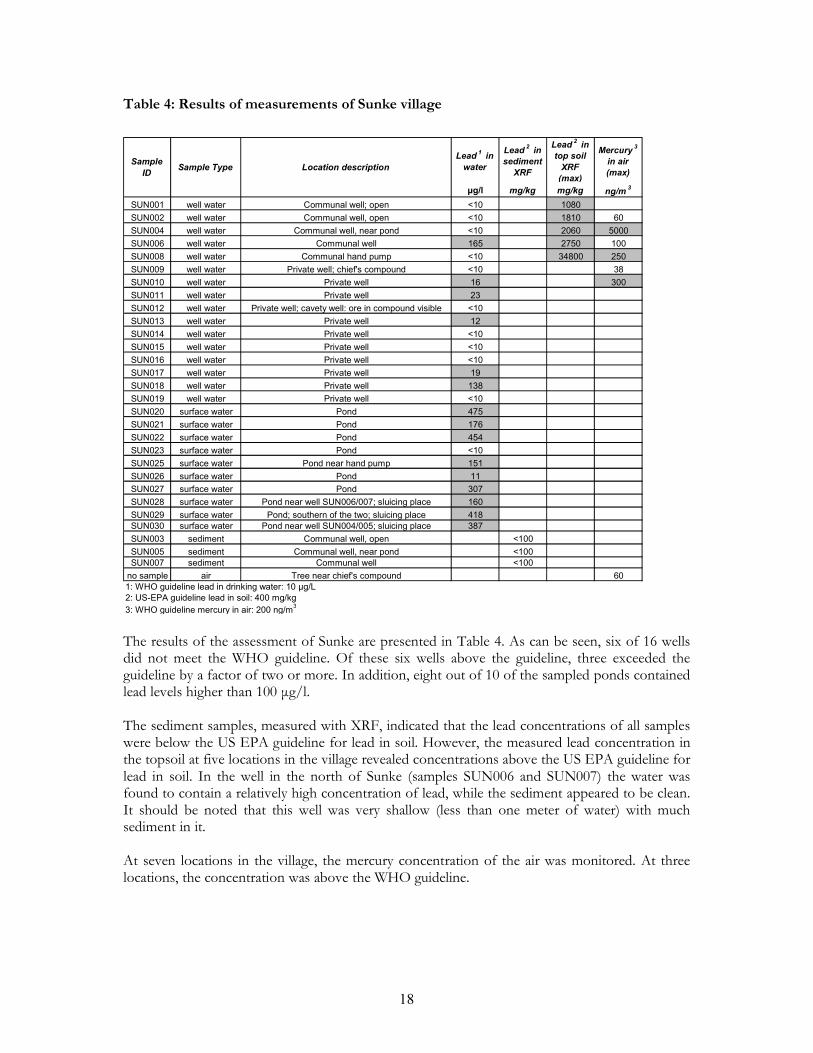
The results of the assessment of Sunke are presented in Table 4. As can be seen, six of 16 wells did not meet the WHO guideline. Of these six wells above the guideline, three exceeded the guideline by a factor of two or more. In addition, eight out of 10 of the sampled ponds contained lead levels higher than 100 µg/l. The sediment samples, measured with XRF, indicated that the lead concentrations of all samples were below the US EPA guideline for lead in soil. However, the measured lead concentration in the topsoil at five locations in the village revealed concentrations above the US EPA guideline for lead in soil. In the well in the north of Sunke (samples SUN006 and SUN007) the water was found to contain a relatively high concentration of lead, while the sediment appeared to be clean. It should be noted that this well was very shallow (less than one meter of water) with much sediment in it. At seven locations in the village, the mercury concentration of the air was monitored. At three locations, the concentration was above the WHO guideline.
19
Table 5: Results of measurements of Bagega town
Lead1
in water
Lead2 in
sediment
XRF
Lead2 in
top soil
XRF (max)
Mercury3
in air
(max)
µg/l mg/kg mg/kg ng/m3
BAG001 well water Handpump near hospital <10 380 400
BAG003 well water Communal well with wall (0,5 m) <10 800 100
BAG005 well water Private well <10
BAG006 well water Private well <10
BAG008 well water Private well <10
BAG009 well water Private well 12 15300
BAG011 well water Communal well 56 11400
BAG012 well water Private well <10
BAG013 well water Private well 130
BAG014 well water Private well 12
BAG015 well water Private well 10
BAG016 well water Private well 12
BAG017 well water Private well <10
BAG018 well water Private well <10
BAG019 well water Private well <10
BAG020 well water Private well
BAG021 well water Private well <10
BAG022 well water Communal well near mosque 120
BAG023 well water Private well 12
BAG024 well water Private well <10
BAG025 well water Private well <10
BAG026 well water Private well <10 1500
BAG027 well water Private well <10
BAG028 well water Communal well 28 1100
BAG029 well water Communal well 13
BAG030 well water Communal well <10 440
BAG031 well water Private well <10 133
BAG032 well water Communal well <10 1400
BAG033 well water Communal well 42 2700BAG034 well water Private well 18
BAG037 well water Communal well <10
BAG038 well water Private well <10
BAG066 well water Communal well near edge of town <10 680
BAG067 well water Communal well at market <10 170
BAG068 well water Private well <10 12500
BAG069 well water Private well <10 330
BAG070 well water Private well <10 1700
BAG071 well water Communal well <10 4500
BAG072 well water Communal well <10 200
BAG074 well water Private well 111 <100
BAG002 surface water Stream (processing + animal drinking place) <100 890 170
BAG035 surface water lake sluicing place 1100 500
BAG036 surface water lake sluicing place 423 500
BAG073 surface water Pond near butcher <100 560
BAG075 surface water Pond near pink mosque 269
BAG004 sediment Communal well with wall (0,5 m) 840 800 100
BAG007 sediment Private well <100
BAG010 sediment Private well 540
1: WHO guideline lead in drinking water: 10 µg/L2: US-EPA guideline lead in soil: 400 mg/kg
3: WHO guideline mercury in air: 200 ng/m3
Location descriptionSample TypeSample ID
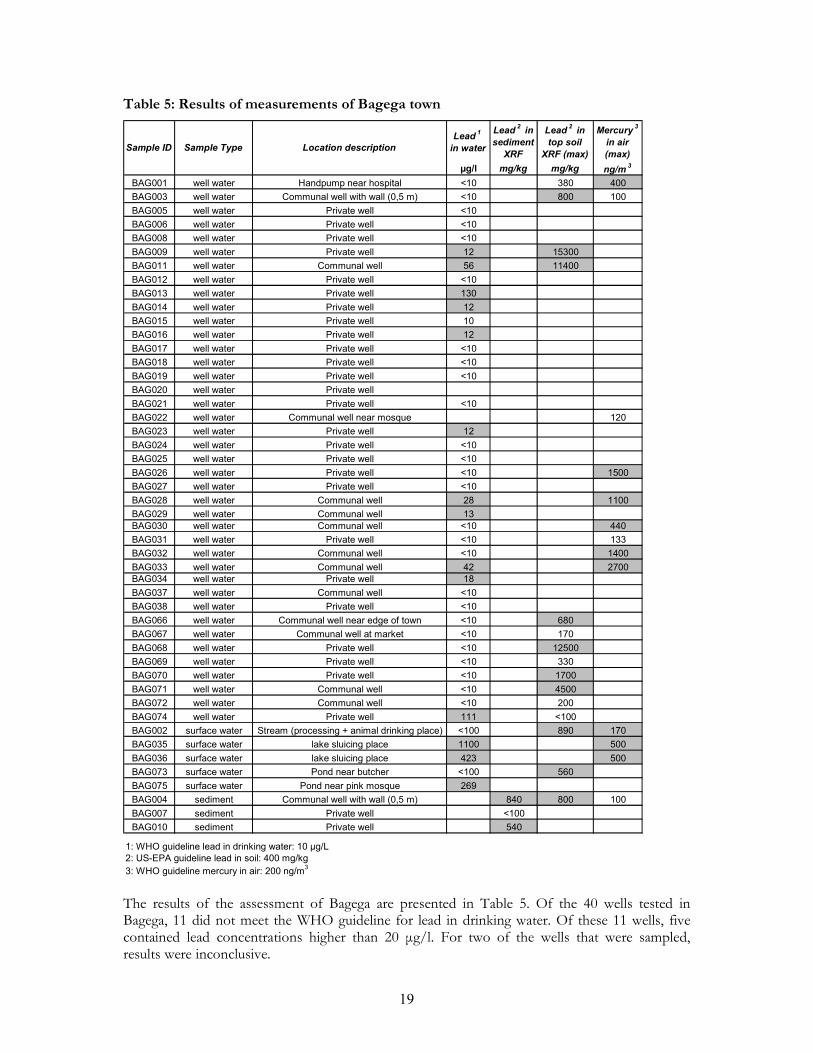
The results of the assessment of Bagega are presented in Table 5. Of the 40 wells tested in Bagega, 11 did not meet the WHO guideline for lead in drinking water. Of these 11 wells, five contained lead concentrations higher than 20 µg/l. For two of the wells that were sampled, results were inconclusive.
20
In addition, five sources of surface water were sampled. Three contained lead in concentrations above 100 µg/l. Two had a lower concentration, but were only analyzed with the water kit due to safety concerns19. The sediment samples, measured with XRF, indicated that two of the three samples were above the US EPA guideline for lead in soil. In addition, the lead concentration measured in the top soil at 10 out of 15 locations in the village were above the US EPA guideline for lead in soil. At 13 locations in the village, the mercury concentration of the air was measured. At nine of these locations, the mercury concentration was above the WHO guideline.
Table 6: Results of measurements of Dareta village
Lead1
in water
Lead2 in
sediment XRF
Lead2 in
top soil
XRF (max)
Mercury3
in air
(max)
µg/l mg/kg mg/kg ng/m3
DAR003 well water Communal well <10 15
DAR005 well water Communal well 13
DAR007 well water Private well chief <10 <100 13
DAR010 well water Private well; high mercury level in air <10 37500 6500
DAR001 surface water Dareta landfill 198
DAR002 surface water Pond at processing site at landfill 605 1100
DAR006 surface water Pond at south east entrance <10 <100 10
DAR009 surface water Old sluicing pond/ near processing well <10 130 92
DAR004 sediment Communal well (market) not measured 240 15
DAR008 sediment Private well chief not measured <100 13
1: WHO guideline lead in drinking water: 10 µg/L
2: US-EPA guideline lead in soil: 400 mg/kg
3: WHO guideline mercury in air: 200 ng/m3
Sample ID Sample Type Location description
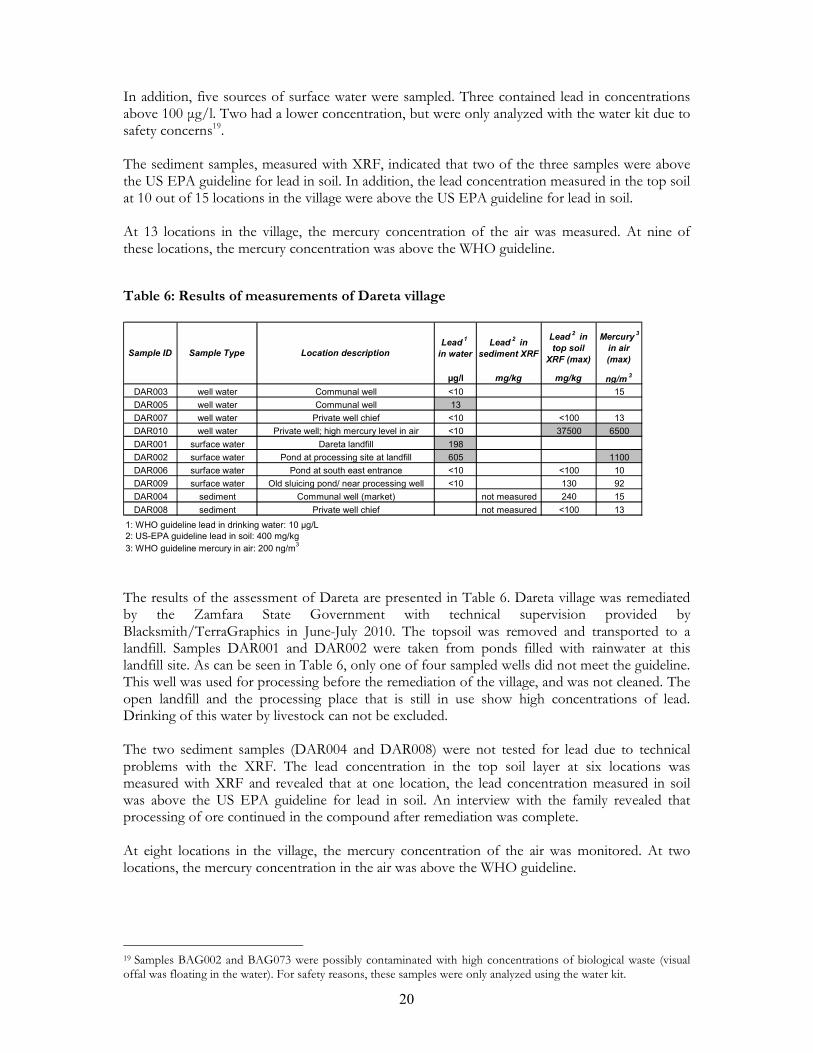
The results of the assessment of Dareta are presented in Table 6. Dareta village was remediated by the Zamfara State Government with technical supervision provided by Blacksmith/TerraGraphics in June-July 2010. The topsoil was removed and transported to a landfill. Samples DAR001 and DAR002 were taken from ponds filled with rainwater at this landfill site. As can be seen in Table 6, only one of four sampled wells did not meet the guideline. This well was used for processing before the remediation of the village, and was not cleaned. The open landfill and the processing place that is still in use show high concentrations of lead. Drinking of this water by livestock can not be excluded. The two sediment samples (DAR004 and DAR008) were not tested for lead due to technical problems with the XRF. The lead concentration in the top soil layer at six locations was measured with XRF and revealed that at one location, the lead concentration measured in soil was above the US EPA guideline for lead in soil. An interview with the family revealed that processing of ore continued in the compound after remediation was complete. At eight locations in the village, the mercury concentration of the air was monitored. At two locations, the mercury concentration in the air was above the WHO guideline.
19 Samples BAG002 and BAG073 were possibly contaminated with high concentrations of biological waste (visual offal was floating in the water). For safety reasons, these samples were only analyzed using the water kit.
21
3 Conclusions
3.1 Lead in drinking water
Measurements showed that 25-30% of wells in the villages assessed did not meet the WHO guideline for lead in drinking water, although in most wells, the limit of 10 µg/l was exceeded by no more than several µg/l. However, in some wells, concentrations of up to 10-15 times the guideline were found. In most cases, exceeding of the guideline was coupled with high concentrations of lead in the soil around the well. Therefore, the mission suspects that the contamination of the wells has been caused by dust deposition and soil run-off from sites where lead-contaminated ore has been/is being processed. This is consistent the mission’s findings that drinking water from boreholes was never contaminated. Lead concentrations found by the mission are consistent with earlier (pre-rainy season) measurements taken by the National Water Resources Institute (NWRI), suggesting that concentrations were not significantly affected by the particularly abundant rainy season. Recently, scientists have suggested that all exposure to lead should be avoided and that there is no safe exposure concentration20. This would imply that even the relatively low concentrations found in most wells by the mission might be a risk, especially for young children21. To see this in perspective, the following should be considered: when children who drink contaminated water are also exposed to lead-contaminated dust or soil, the latter probably has a bigger impact on lead body burden than the intake of water that contains lead just above the guidelines. This means that it can be expected that in a contaminated environment, exposure through drinking water is low compared to exposure through hand-to-mouth behavior. A notable aspect of the mission’s investigations is that no contamination was found in boreholes. This suggests three likely conclusions:
• Contamination is coming from ‘above’, meaning that lead has been introduced into the wells from the top during processing of ore and from soil run-off during the rainy season.
• Lead pollution remains confined to areas (wells and ponds) where processing has taken place, and has not spread though the groundwater aquifer.
• Drinking water from boreholes might be a safe alternative for people in the villages.
3.2 Lead in surface water
High concentrations of lead (up to more than 1,000 µg/l – 10 times higher than the exposure limit suggested by FAO for livestock) were often found in ponds, rivers and lakes sampled by the mission. This is not surprising since surface water sources are often used for processing ore. The mission could not determine if the concentrations found were representative for the dry season as well. However, in the sampling period (towards the end of the rainy season), the concentrations reflect concentrations to which livestock were exposed. It was not in the mission’s Terms of Reference to assess the risk of consuming animal products. However, it is common practice to use most or all of the animal after it has been slaughtered,
20 http://www.efsa.europa.eu/en/scdocs/scdoc/1570.htm 21 For more on the particular vulnerability of young children to lead poisoning, see http://www.cdc.gov/nceh/lead/publications/books/plpyc/chapter1.htm
22
including using bones for soup. Since people in the villages report illness and death among livestock, it is reasonable to suspect that the consumption of such meat might also be an important exposure route for humans.
3.3 Lead in soil
The concentrations of lead in soil in the villages varied significantly within villages, suggesting a human factor in the dispersion of lead. Higher concentrations (up to 8%) were seen close to drinking water wells and to other surface water sources. At other locations, concentrations were often much lower. At ore processing locations, incidental ingestion of soil (via hand-to-mouth behaviour and eating food with dirty hands) by young children could be a substantial exposure route. Since processing is often done within the walls of home compounds, infants and toddlers would be particularly exposed.
3.4 Mercury in air
Concentrations of mercury in air were found to be elevated close to processing sites, suggesting that emissions were coming from human activities, resulting from the injudicious discarding of mercury waste. In the villages, concentrations were often between 100 and 400 ng/m-3, with peak concentrations up to 25,000 ng/m-3. As mercury is very toxic, this could easily damage the health of exposed persons, especially children, who tend to play on the ground where mercury may have been spilled.
3.5 Mercury in water and soil
The mission was not able to assess the concentration of mercury in (drinking) water. While some research was possible on the amount of mercury in soil, the information found was very limited. Mercury was found in only one analysis, and the concentration was not very high. Mercury in soil would not be expected to emanate from a natural source. During processing, hotspots emerge which are difficult to detect with the measuring method used – i.e., spilled mercury does not mix with soil very well, leading to a heterogeneous dispersion in the soil, resulting in inconsistent detection.
3.6 Possible resumption of processing activities in remediated villages
High lead and mercury levels were found by the mission in a number of home compounds in the remediated village of Dareta, which could be an indication that ore processing activities have been continued by some individuals.
3.7 Further study of food pathways needed
Further study of food pathways (livestock, crops) should be undertaken by Federal and State experts, with support from international partners, as livestock was seen to be drinking from contaminated ponds, and crops were found to be growing in contaminated soil near affected wells.
23
3.8 Further study needed to determine extent of lead pollution
Further study of the lead pollution emergency in Zamfara State is clearly needed. The geographic extent of this crisis and the number of people potentially affected are still not known. The CDC’s recently concluded two-month assessment in conjunction with the Nigerian Field Epidemiology and Laboratory Training Program (N-FELTP) is a most welcome initiative on this front, as it should provide a detailed map of the affected area and delineate the complete scope of the situation. Similarly, a full environmental assessment of communities that have not yet been evaluated should be undertaken, as should an in-depth geological study of the region in order to ascertain the potential geographic extent of the occurrence of lead.
3.9 Wholistic approach to further study
A more wholistic study of the environment and health situations in Zamfara State should be undertaken, as the approach has thus far been rather piecemeal, i.e., one mission looking at water in certain villages, another mission looking at soil in other villages, yet another mission taking blood samples in other villages. Many factors are having an important influence on the gravity of the situation in Zamfara State, such as, for example, the poor baseline nutritional status of children of the region, which is a major contributing factor to how severely they are affected by lead poisoning.
24
4 Recommendations Within the scope of its Terms of Reference, the mission makes the following recommendations:
4.1 Remediation of highly contaminated wells
In cases where lead concentrations in wells were significantly (2-3 times) higher than the WHO guideline, remedial measures (i.e. closing the well) should be taken immediately by the appropriate authorities, after the installation of an alternative drinking water supply system (i.e. boreholes). The remediation of these wells should be integrated into an overall remediation plan.
4.2 Protect sensitive areas and remediate villages
Measures should be taken by Federal, State and local authorities to prevent further ore processing activities from taking place at sensitive sites – such as water sources from which humans and livestock drink – and polluted villages must be remediated in the nearest possible future, thereby enabling lead-intoxicated children to be treated and returned to their villages for recovery and follow-up care.
4.3 Erect safety walls around wells
For all wells without them, walls should be constructed to prevent the possible run-off of potentially lead-contaminated soil into these sources of drinking water.
4.4 Assess other villages for possible contamination
Any villages in Zamfara State not yet assessed where suspected and/or confirmed mining and/or ore processing activities have taken/are taking place should be assessed immediately for possible lead pollution and poisoning.
4.5 Key messages for inclusion in public education efforts
Finally, messages such as the following should be emphasized by Federal and State authorities, as well as by UNICEF and its implementing partners, in public information efforts:
• Children should not be allowed to play on former ore processing sites. They should wash their hands before eating to avoid contaminating the food with lead soil.
• Grinders used for the processing of ore should not be used for the processing of food. Similarly, sacks used for transporting ore, and mortar and pestles used for crushing ore, should not be used for the transport and processing of food.
• Grains and any other food items should not be dried or stored on the ground where lead dust may be present.
25
5 Further Considerations Although beyond the scope of the mission’s ToRs, owing to the complex nature of the lead pollution emergency in Zamfara State, there are a variety of observations and considerations to be made. Lead poisoning, while treatable to some degree, does irreparable damage to young children’s neurological systems (learning disabilities, reduced IQ, behavioral disorders, loss of control of muscles), threatens unborn children (lead passes directly through placenta, resulting in stillbirths, birth defects) and breastfeeding babies (lead passes freely through mothers’ breasts, the human body “mistakes” lead for much-needed calcium). Zamfara State is seeing the health and well-being of its children put in grave danger by this acute and ongoing disaster. More rapid and coordinated intervention is imperative by State and Federal authorities, with the support of the international community, in making mining safer, cleaning up polluted villages, and treating those affected by lead poisoning. Hundreds have been lost already, and thousands more are at risk. Although some US $2 million was provided by the Central Emergency Response Fund (CERF), such funding is not intended to cover all costs of a humanitarian operation. No donors are matching funds thus far provided through the CERF, turning this into a neglected, underfunded emergency. Already, actors have been forced to scale back activities at a moment when they should instead be expanding them, and in some cases finances for key activities related to remediation and coordination will be exhausted by year-end. Government authorities and the UN should consider what additional steps might be taken to access national and international resources needed to respond to this crisis. Most stakeholders familiar with the situation in Zamfara State are of the strong opinion that bans on mining should be lifted, as they often result in illegal continuation of such activities, thereby rendering them even more risky. Given the reality of extreme poverty in Zamfara State, stopping mining operations without an alternative source of income is not realistic. Focus should instead be placed on informing about and implementing safer practices; enacting stronger regulation; and establishing areas outside of villages where ore could be securely stored and safely processed without posing significant threats to human health and the environment. National and international experience and expertise in safer mining practices should be drawn upon. Given the scope and complexity of the lead pollution crisis in Zamfara State, and the need for many actors to be working together closely and sharing information regularly, the importance of coordination for the response to this emergency can not be understated. The signing of a Memorandum of Understanding between UN agencies and Government authorities to better define roles and responsibilities, and the establishment of a simple web-based platform to facilitate information sharing and activity coordination, could be considered.
26
6 Acknowledgements The mission benefitted from a generous contribution from the Government of the Netherlands of four technical experts and equipment from the Environmental Assessment Module (EAM), a mobile laboratory designed and assembled specifically for international deployment. The JEU therefore extends its special thanks and appreciation to the Dutch Ministry of Infrastructure and the Environment (IenM), the Ministry of Foreign Affairs (MinBuza), and the National Institute for Public Health and the Environment (RIVM). The JEU also extends its thanks and appreciation to the following persons and organizations, without whose support this mission would not have been possible:
• His Royal Highness, The Emir of Anka, Alhaji Attahiru Muhammad Ahmad
• Blacksmith Institute and TerraGraphics Environmental Engineering, Inc.
• MSF-Holland
• Federal Government of Nigeria
• State Government of Zamfara
• UN Children’s Fund (UNICEF) – Nigeria
• UN Development Programme (UNDP) – Nigeria
• UNOSAT, the UN Institute for Training and Research (UNITAR) Operational Satellite Applications Programme
• US Centers for Disease Control and Prevention (CDC)
• World Health Organization (WHO) – Nigeria and HQ/Geneva
27
7 Bibliography
CDC, June 2010: Zamfara State, Nigeria Outbreak Investigation, Trip report (DRAFT) CDC, Morbidity and Mortality Weekly Report: http://www.cdc.gov/mmwr/preview/mmwrhtml/mm5927a3.htm?s_cid=mm5927a3_w CDC, Preventing Lead Poisoning in Young Children: http://www.cdc.gov/nceh/lead/publications/books/plpyc/contents.htm National Water Resources Institute, Kaduna, June 2010: Drinking Water Quality Assessment in the Communities Affected by Lead Poisoning in Zamfara State UNEP, Squeezing Gold from a Stone: Addressing the Toxic Health Risks and Pollution Caused by Mercury Use in the Small Scale and Artisanal Gold Mining Sector WHO, June 2010: Outbreak of lead intoxication in Zamfara State, Nigeria, WHO support mission (DRAFT) Britannica Online Encyclopedia, Nigeria, October 2010 The Economist Intelligence Unit, Country Report/Nigeria, September 2010
28
8 Annexes
Annex I: Composition of the mission team
Matthew Conway (Team Leader) Programme Officer Joint UNEP/OCHA Environment Unit Geneva, Switzerland Jurgen van Belle (EAM team leader) Project Leader and Principal Investigator National Institute for Public Health and the Environment (RIVM) Bilthoven, the Netherlands Gert-Jan Knetsch Research Technician National Institute for Public Health and the Environment (RIVM) Bilthoven, the Netherlands Edith van Putten Environmental Researcher National Institute for Public Health and the Environment (RIVM) Bilthoven, the Netherlands Ramon Ramlal Senior Laboratory Researcher National Institute for Public Health and the Environment (RIVM) Bilthoven, the Netherlands
29
Annex II: Mission Itinerary
19 September Arrival of Mr. Conway and Mr. van Belle in Abuja for preliminary consultation 20 September Meetings in Abuja with WHO Country Representative Dr. Peter Eriki UNDP Resident Representative and UN Resident Coordinator in Nigeria Mr. Daouda Touré Federal Task Force Arrival of Ms. van Putten, Mr. Knetsch, Mr. Ramlal 21 September Travel to Gusau, Zamfara State Meeting in Kaduna with National Water Resources Institute Meeting with Zamfara State Rapid Response Committee 22 September Meeting in Gusau with Zamfara State Commissioner of Health and Permanent Secretary Travel to Anka Town, Anka LGA, Zamfara State Meeting with His Royal Highness, The Emir of Anka, Alhaji Attahiru Muhammad Ahmad Abare village introduction of JEU team 23 September Visit to Anka clinic, Dareta mines, Dareta village 24 September Abare Village sampling/analysis 25 September Kirsa Village sampling/analysis 26 September Sunke Village sampling/analysis 27 September Analysis day in Anka 28 September Bagega Village, Day One 29 September Bagega Village, Day Two Dareta Village 30 September Analysis day in Anka Dareta Village
30
1 October Analysis day in Anka Meeting with Governor of Zamfara 2 October Pack-up day 3 October Travel of team from Anka Town to Gusau Town, Zamfara State Debriefing with Zamfara State Rapid Response Team Travel of team from Gusau Town, Zamfara State to Abuja 4 October Debriefings in Abuja with: WHO Country Representative Dr. Peter Eriki Federal Task Force and Federal Minister of State for Health Depature of Mr. van Belle, Ms. van Putten, Mr. Knetsch, Mr. Ramlal 5 October Meeting with Masayoshi Matsuhita, UN Industrial Development Organization (UNIDO) Representative in Nigeria Meeting with CDC and WHO to discuss follow-up actions 6 October Meeting with UNICEF (Mr Vinod Alkari) and WHO (Dr. Emmanuel Musa) to discuss follow-up actions Meeting with UN Resident Coordinator Daouda Touré 7 October Meeting with Mohamed Sani Sidi, Director General, National Emergency Management Agency (NEMA) Meeting with Ministry of Mines and Steel Development, Sustainable Management of Mineral Resources Project, CDC, UNICEF, US Embassy Meeting with Ministry of Mines and Steel Development, Artisanal & Small Scale Mining Department (ASM)
31
Annex III: Mission Terms of Reference
Environmental Sampling and Analysis Mass Lead Poisoning - Zamfara State - Nigeria
Mission Terms of Reference 15 September 2010
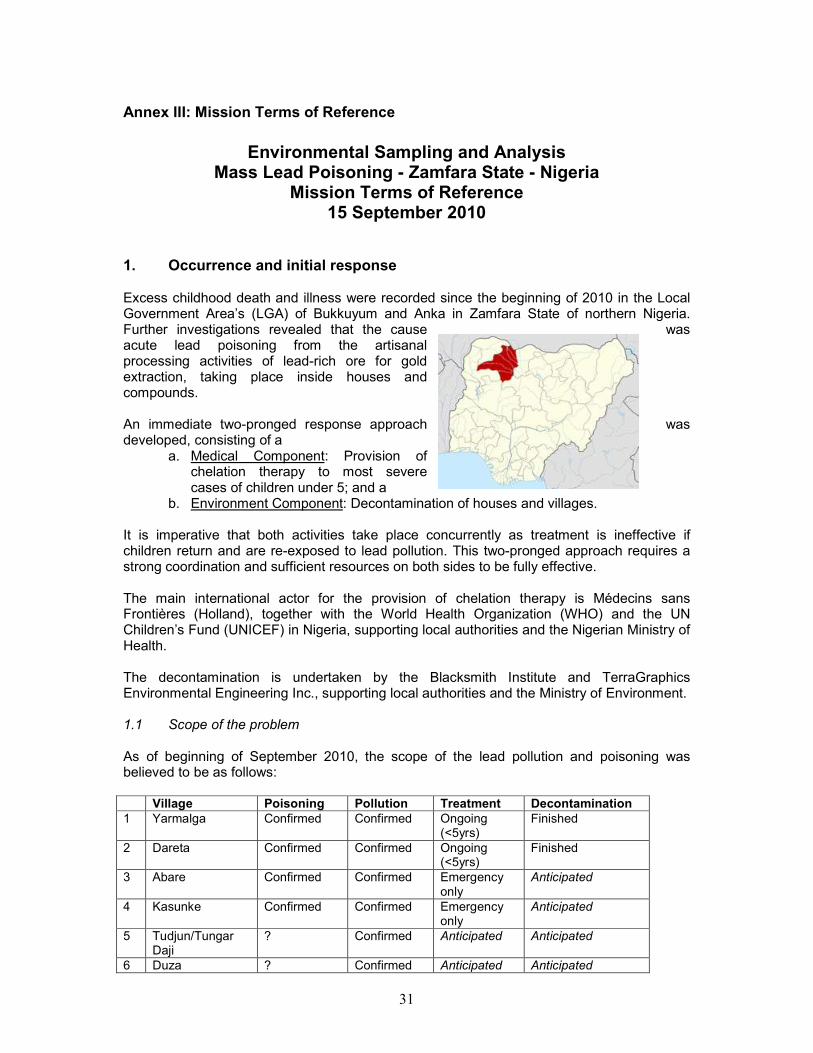
1. Occurrence and initial response Excess childhood death and illness were recorded since the beginning of 2010 in the Local Government Area’s (LGA) of Bukkuyum and Anka in Zamfara State of northern Nigeria. Further investigations revealed that the cause was acute lead poisoning from the artisanal processing activities of lead-rich ore for gold extraction, taking place inside houses and compounds. An immediate two-pronged response approach was developed, consisting of a
a. Medical Component: Provision of chelation therapy to most severe cases of children under 5; and a
b. Environment Component: Decontamination of houses and villages.
It is imperative that both activities take place concurrently as treatment is ineffective if children return and are re-exposed to lead pollution. This two-pronged approach requires a strong coordination and sufficient resources on both sides to be fully effective. The main international actor for the provision of chelation therapy is Médecins sans Frontières (Holland), together with the World Health Organization (WHO) and the UN Children’s Fund (UNICEF) in Nigeria, supporting local authorities and the Nigerian Ministry of Health. The decontamination is undertaken by the Blacksmith Institute and TerraGraphics Environmental Engineering Inc., supporting local authorities and the Ministry of Environment. 1.1 Scope of the problem As of beginning of September 2010, the scope of the lead pollution and poisoning was believed to be as follows: Village Poisoning Pollution Treatment Decontamination
1 Yarmalga Confirmed Confirmed Ongoing (<5yrs)
Finished
2 Dareta Confirmed Confirmed Ongoing (<5yrs)
Finished
3 Abare Confirmed Confirmed Emergency only
Anticipated
4 Kasunke Confirmed Confirmed Emergency only
Anticipated
5 Tudjun/Tungar Daji
? Confirmed Anticipated Anticipated
6 Duza ? Confirmed Anticipated Anticipated
32
7 Tudun Guru/Tungar Garu/Gidan Gurua
? Confirmed Emergency only
Anticipated
8 WHO has reported that, based on a hospital registry survey conducted across all 14 Zamfara State LGA’s, additional villages may be at risk. However, it is not known how many, and their location. Furthermore, the villages of Bagega and Kersa have since been identified as contaminated.
The funding request to the Central Emergency Relief Fund (CERF) puts the number of affected people at 18,350 individuals. The number of people needing immediate emergency medical treatment is estimated to be 2,400 – this represents the estimated number of children under 5. It must be noted that to date, any children over 5 and adults tested from these communities also have extremely high blood lead levels (BLLs) that will likely require treatment and follow-up. Funding of approximately US $2 million has been agreed upon by the Emergency Relief Coordinator. The now-concluding rainy season may still pose some logistical challenges to response activities (in particular to decontamination activities due to the remoteness of the villages, poor access and need for moving of heavy equipment). According to MSF in Anka/Bukkuyum, access to 5 out of 7 villages is possible by 4x4 on an intermittent basis. Due to the rainy season, there is a risk of lead contamination having spread farther and into deeper soil layers, while for standing/open sources of water, the rainy might have a further diluting and spreading effect. 1.2 Request for assistance The Chief of OCHA’s Emergency Services Branch has offered the services of the Joint UNEP/OCHA Environment Unit (JEU) to the UN Resident Coordinator in Nigeria which subsequently was welcomed. A request for assistance from the JEU was later received from the Nigerian Ministry of Health. The JEU contacted all international actors (WHO HAC/Nigeria/IPCS, MSF, UNICEF Nigeria, Blacksmith Institute, TerraGraphics, UNEP PCDMB and OCHA RO, CERF, CRD) currently involved in response activities and, based on consultations with them, the following mission is proposed to support ongoing activities. 2. Scope of Mission The assistance that would be provided by this mission is not covered by any other stakeholder and/or financing mechanism, and would feed into planned activities of all stakeholders. The focus of the mission is to provide analytical support for decision-making and priority-setting by the authorities and other actors for the decontamination activities of villages. As such, it is not directly aimed at the medical treatment component of the response activities, but due to the inter-linkages between the two, fully part of the overall response strategy. The mission will be an independent and impartial assessment mission. It will focus on identifying concentrations of heavy metals (in particular, lead) in well water and surface water and provide recommendations for the decontamination of polluted sources, taking into consideration the means available locally. Based on the findings, recommendations will be made for remediation and/or decontamination activities that can be undertaken by local authorities and their partners.
33
Specific objectives include: � Representative samples of well and surface water (ponds) for drinking water analysis for
lead (Pb) will be taken in the aforementioned villages of: Yarmalga, Dareta, Abare, Kasunke, Tudjun/Tungar Daji, Duza, and Tudun Guru/Tungar Garu/Gidan Guru; Bagega, Kersa, and Rumbuki shall also be considered, time permitting, as shall one or more “control sites” (villages not suspected of contamination) to establish baselines.
� In addition to the water samples, sampling of soil and sludge/sediment might be necessary;
� The samples will be analyzed for lead (Pb). Drinking water samples will be analyzed to meet with the WHO drinking water limit of 10 µg l-1;
� Indicative samples of surface water will be collected to be checked on contamination levels of mercury (Hg) and copper (Cu).
Mapping support Currently, no mapping support exists for the ongoing response activities. UNOSAT has generously agreed to provide remote mapping support to assist in the documentation and visualization of all ongoing response activities. 3. Output Key outputs from the assessment mission will be a consolidated, easy-to-read summary report, which will be made available in English within two weeks of completion of the mission. 4. Mission Team members
Sampling Strategy and Underlying Assumptions Drinking water Depending on the amount of wells/open water, about 50 water samples per village should be taken. A rough estimation shows that the total amount of water samples might be 400. Sludge/sediment Depending on the structure of the wells and ponds, sludge/sediment and soil sampling and analysis might also be necessary. This leads to an estimated amount of 300 extra samples. Surface water Surface water near sluicing places will be indicatively checked on Pb, Cu and Hg. Soil If soil sampling is needed, we estimate that this will require an extra 100 samples. The villages are located in an area roughly estimated to be 45 * 60 km. This means that under normal circumstances, only one village per day can be visited. It should be possible to access all villages from the LGA capital (Bukkuyum/Anka) for day trips. Therefore, with a total amount of 800 samples and an area of 2700 km2, a gender-balanced four-member team (2 sampling experts, an analysis expert and a team leader/additional sampler) would be required for a minimum deployment time of 14 days.
34
The team will consist of five persons: a Mission Team Leader (from the Joint UNEP/OCHA Environment Unit) and four staff of the Environmental Assessment Module, consisting of 2 sampling experts, an analysis expert and a team leader/addition sampler. Equipment The mission team would bring the following pieces of equipment: � Hand-held XRF-device with supplies for 400 solid samples � Water kit and disposables for 400 aqueous samples (analysis for Pb, Hg and Cu) � Sampling equipment for soil � Sampling equipment for surface water � Sampling equipment for drinking water � Sampling equipment for sludge � 400 containers for liquid samples � 400 containers for solid samples � If necessary, vaporized Hg can be checked in hotspots with contaminated water or soil
Additional supplies:
Transport (sampling and analysis equipment) Personal protective equipment (PPE) 5. Mission itinerary The mission will begin in Abuja on Monday 20 September for initial briefings and conclude on Thursday 7 October, comprising 13 full days spent in the field, and time for debriefings in Abuja at the end of the mission. Logistical support It is anticipated that in-country support would be required in the domains of: � Customs clearance of equipment � Transport in country of team and equipment � Accommodation Contact
Joint UNEP/OCHA Environment Unit Geneva, Switzerland
René Nijenhuis, Officer-in-Charge Tel: + 41 22 917 1815 Email: [email protected]
Matthew Conway, Programme Officer Tel: + 41 22 917 2373 Email: [email protected]
---------------------------- Annexes I/ Rough Overview of Measurements, Samples and Analysis II/ Mapping services
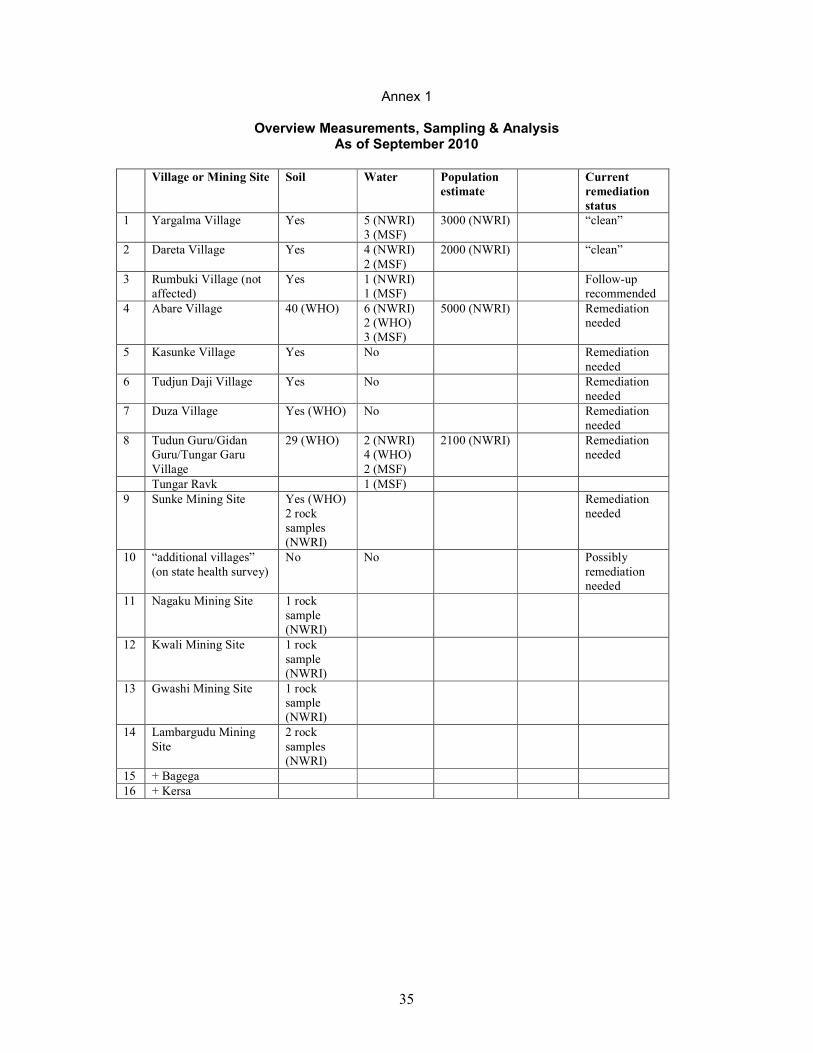
35
Annex 1
Overview Measurements, Sampling & Analysis As of September 2010
Village or Mining Site Soil Water Population
estimate
Current
remediation
status
1 Yargalma Village Yes 5 (NWRI)
3 (MSF)
3000 (NWRI) “clean”
2 Dareta Village Yes 4 (NWRI)
2 (MSF)
2000 (NWRI) “clean”
3 Rumbuki Village (not
affected)
Yes 1 (NWRI)
1 (MSF)
Follow-up
recommended
4 Abare Village 40 (WHO) 6 (NWRI)
2 (WHO)
3 (MSF)
5000 (NWRI) Remediation
needed
5 Kasunke Village Yes No Remediation
needed
6 Tudjun Daji Village Yes No Remediation
needed
7 Duza Village Yes (WHO) No Remediation
needed
8 Tudun Guru/Gidan
Guru/Tungar Garu
Village
29 (WHO) 2 (NWRI)
4 (WHO)
2 (MSF)
2100 (NWRI) Remediation
needed
Tungar Ravk 1 (MSF)
9 Sunke Mining Site Yes (WHO)
2 rock
samples
(NWRI)
Remediation
needed
10 “additional villages”
(on state health survey)
No No Possibly
remediation
needed
11 Nagaku Mining Site 1 rock
sample
(NWRI)
12 Kwali Mining Site 1 rock
sample
(NWRI)
13 Gwashi Mining Site 1 rock
sample
(NWRI)
14 Lambargudu Mining
Site
2 rock
samples
(NWRI)
15 + Bagega
16 + Kersa
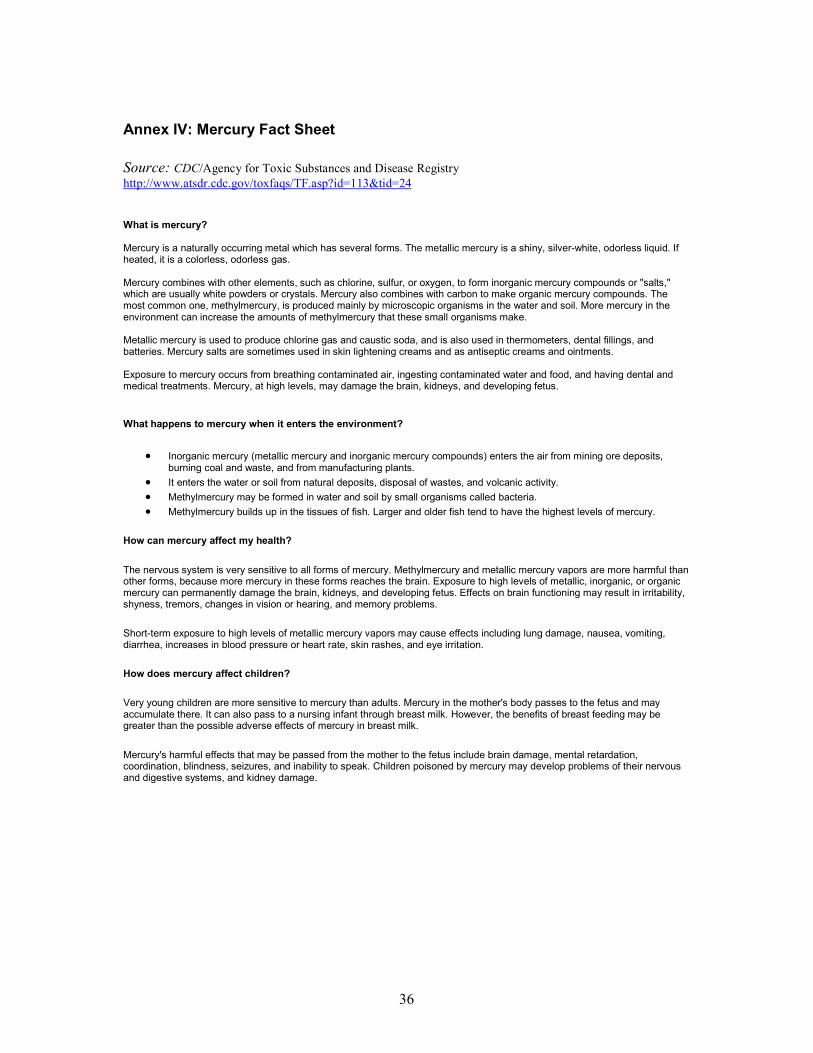
36
Annex IV: Mercury Fact Sheet
Source: CDC/Agency for Toxic Substances and Disease Registry
http://www.atsdr.cdc.gov/toxfaqs/TF.asp?id=113&tid=24
What is mercury?
Mercury is a naturally occurring metal which has several forms. The metallic mercury is a shiny, silver-white, odorless liquid. If heated, it is a colorless, odorless gas. Mercury combines with other elements, such as chlorine, sulfur, or oxygen, to form inorganic mercury compounds or "salts," which are usually white powders or crystals. Mercury also combines with carbon to make organic mercury compounds. The most common one, methylmercury, is produced mainly by microscopic organisms in the water and soil. More mercury in the environment can increase the amounts of methylmercury that these small organisms make. Metallic mercury is used to produce chlorine gas and caustic soda, and is also used in thermometers, dental fillings, and batteries. Mercury salts are sometimes used in skin lightening creams and as antiseptic creams and ointments. Exposure to mercury occurs from breathing contaminated air, ingesting contaminated water and food, and having dental and medical treatments. Mercury, at high levels, may damage the brain, kidneys, and developing fetus.
What happens to mercury when it enters the environment?
• Inorganic mercury (metallic mercury and inorganic mercury compounds) enters the air from mining ore deposits, burning coal and waste, and from manufacturing plants.
• It enters the water or soil from natural deposits, disposal of wastes, and volcanic activity.
• Methylmercury may be formed in water and soil by small organisms called bacteria.
• Methylmercury builds up in the tissues of fish. Larger and older fish tend to have the highest levels of mercury.
How can mercury affect my health?
The nervous system is very sensitive to all forms of mercury. Methylmercury and metallic mercury vapors are more harmful than other forms, because more mercury in these forms reaches the brain. Exposure to high levels of metallic, inorganic, or organic mercury can permanently damage the brain, kidneys, and developing fetus. Effects on brain functioning may result in irritability, shyness, tremors, changes in vision or hearing, and memory problems.
Short-term exposure to high levels of metallic mercury vapors may cause effects including lung damage, nausea, vomiting, diarrhea, increases in blood pressure or heart rate, skin rashes, and eye irritation.
How does mercury affect children?
Very young children are more sensitive to mercury than adults. Mercury in the mother's body passes to the fetus and may accumulate there. It can also pass to a nursing infant through breast milk. However, the benefits of breast feeding may be greater than the possible adverse effects of mercury in breast milk.
Mercury's harmful effects that may be passed from the mother to the fetus include brain damage, mental retardation, coordination, blindness, seizures, and inability to speak. Children poisoned by mercury may develop problems of their nervous and digestive systems, and kidney damage.
37
Annex V: Lead Fact Sheet
Sources: US EPA http://www.epa.gov/opptintr/lead/pubs/leadinfo.htm and CDC/Agency for Toxic Substances
and Disease Registry http://www.atsdr.cdc.gov/toxfaqs/TF.asp?id=93&tid=22 What is lead? Lead is a naturally occurring bluish-gray metal found in small amounts in the earth's crust. Lead can be found in all parts of our environment. Much of it comes from human activities including burning fossil fuels, mining, and manufacturing. Lead has many different uses. It is used in the production of batteries, ammunition, metal products (solder and pipes), and devices to shield X-rays. Because of health concerns, lead from paints and ceramic products, caulking, and pipe solder has been dramatically reduced in recent years. How can lead affect one’s health? The effects of lead are the same whether it enters the body through breathing or swallowing. Lead can affect almost every organ and system in your body. The main target for lead toxicity is the nervous system, both in adults and children. Long-term exposure of adults can result in decreased performance in some tests that measure functions of the nervous system. It may also cause weakness in fingers, wrists, or ankles. Lead exposure also causes small increases in blood pressure, particularly in middle-aged and older people and can cause anemia. Exposure to high lead levels can severely damage the brain and kidneys in adults or children and ultimately cause death. In pregnant women, high levels of exposure to lead may cause miscarriage. Highlevel exposure in men can damage the organs responsible for sperm production.
How does lead affect children?
Children are more vulnerable to lead poisoning than adults. A child who swallows large amounts of lead may develop blood anemia, severe stomachache, muscle weakness, and brain damage. If a child swallows smaller amounts of lead, much less severe effects on blood and brain function may occur. Even at much lower levels of exposure, lead can affect a child's mental and physical growth. Exposure to lead is more dangerous for young and unborn children. Unborn children can be exposed to lead through their mothers. Harmful effects include premature births, smaller babies, decreased mental ability in the infant, learning difficulties, and reduced growth in young children. These effects are more common if the mother or baby was exposed to high levels of lead. Some of these effects may persist beyond childhood. It is important to note that even children who seem healthy can have high levels of lead in their bodies. What happens to lead when it enters the environment?
• Lead itself does not break down, but lead compounds are changed by sunlight, air, and water.
• When lead is released to the air, it may travel long distances before settling to the ground.
• Once lead falls onto soil, it usually sticks to soil particles.
• Movement of lead from soil into groundwater will depend on the type of lead compound and the characteristics of the soil. Lead may cause a range of health effects, from behavioral problems and learning disabilities, to seizures and death. Children six years old and under are most at risk.
Health effects of lead
Childhood lead poisoning remains a major environmental health problem in the United States.
• People can get lead in their body if they: o Put their hands or other objects covered with lead dust in their mouths.
o Eat paint chips or soil that contains lead. o Breathe in lead dust, especially during renovations that disturb painted surfaces.
• Lead is more dangerous to children because:
o Babies and young children often put their hands and other objects in their mouths. These objects can have lead dust on them.
o Children's growing bodies absorb more lead.
o Children's brains and nervous systems are more sensitive to the damaging effects of lead.
• If not detected early, children with high levels of lead in their bodies can suffer from:
o Damage to the brain and nervous system o Behavior and learning problems, such as hyperactivity
o Slowed growth o Hearing problems
o Headaches • Lead is also harmful to adults. Adults can suffer from:
o Reproductive problems (in both men and women)
o High blood pressure and hypertension o Nerve disorders
o Memory and concentration problems o Muscle and joint pain
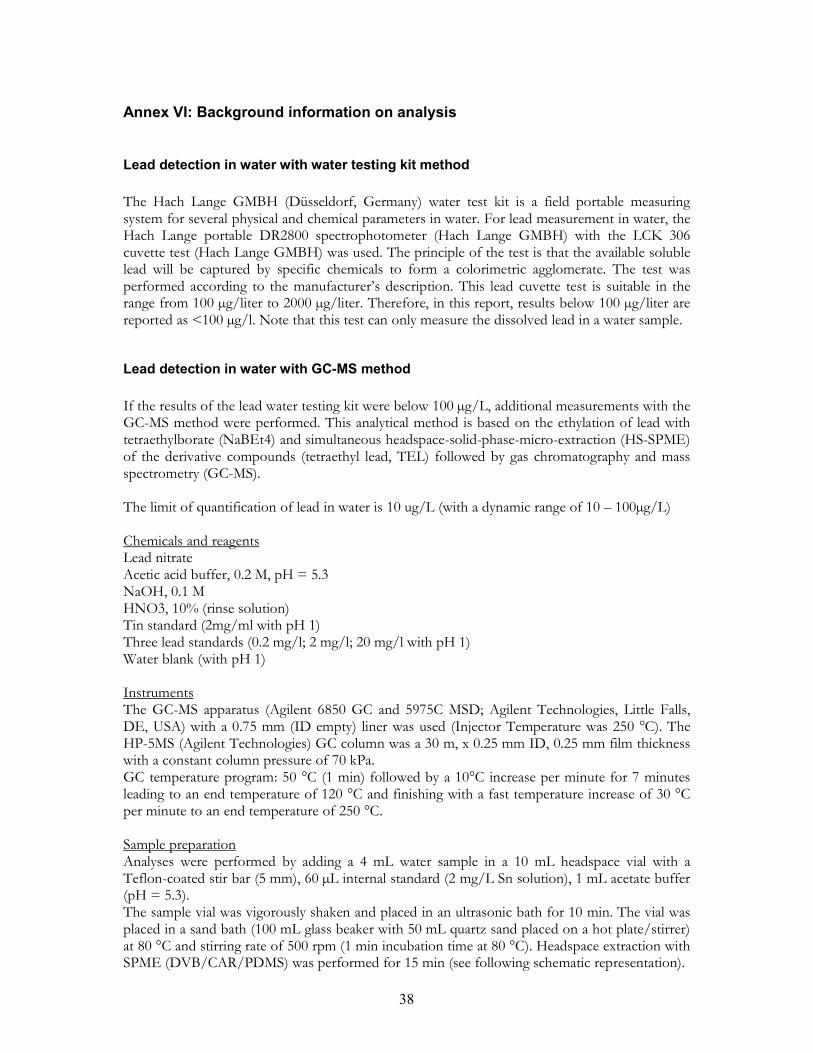
38
Annex VI: Background information on analysis
Lead detection in water with water testing kit method
The Hach Lange GMBH (Düsseldorf, Germany) water test kit is a field portable measuring system for several physical and chemical parameters in water. For lead measurement in water, the Hach Lange portable DR2800 spectrophotometer (Hach Lange GMBH) with the LCK 306 cuvette test (Hach Lange GMBH) was used. The principle of the test is that the available soluble lead will be captured by specific chemicals to form a colorimetric agglomerate. The test was performed according to the manufacturer’s description. This lead cuvette test is suitable in the range from 100 µg/liter to 2000 µg/liter. Therefore, in this report, results below 100 µg/liter are reported as <100 µg/l. Note that this test can only measure the dissolved lead in a water sample.
Lead detection in water with GC-MS method
If the results of the lead water testing kit were below 100 µg/L, additional measurements with the GC-MS method were performed. This analytical method is based on the ethylation of lead with tetraethylborate (NaBEt4) and simultaneous headspace-solid-phase-micro-extraction (HS-SPME) of the derivative compounds (tetraethyl lead, TEL) followed by gas chromatography and mass spectrometry (GC-MS). The limit of quantification of lead in water is 10 ug/L (with a dynamic range of 10 – 100µg/L) Chemicals and reagents Lead nitrate Acetic acid buffer, 0.2 M, pH = 5.3 NaOH, 0.1 M HNO3, 10% (rinse solution) Tin standard (2mg/ml with pH 1) Three lead standards (0.2 mg/l; 2 mg/l; 20 mg/l with pH 1) Water blank (with pH 1) Instruments The GC-MS apparatus (Agilent 6850 GC and 5975C MSD; Agilent Technologies, Little Falls, DE, USA) with a 0.75 mm (ID empty) liner was used (Injector Temperature was 250 °C). The HP-5MS (Agilent Technologies) GC column was a 30 m, x 0.25 mm ID, 0.25 mm film thickness with a constant column pressure of 70 kPa. GC temperature program: 50 °C (1 min) followed by a 10°C increase per minute for 7 minutes leading to an end temperature of 120 °C and finishing with a fast temperature increase of 30 °C per minute to an end temperature of 250 °C. Sample preparation Analyses were performed by adding a 4 mL water sample in a 10 mL headspace vial with a Teflon-coated stir bar (5 mm), 60 µL internal standard (2 mg/L Sn solution), 1 mL acetate buffer (pH = 5.3). The sample vial was vigorously shaken and placed in an ultrasonic bath for 10 min. The vial was placed in a sand bath (100 mL glass beaker with 50 mL quartz sand placed on a hot plate/stirrer) at 80 °C and stirring rate of 500 rpm (1 min incubation time at 80 °C). Headspace extraction with SPME (DVB/CAR/PDMS) was performed for 15 min (see following schematic representation).
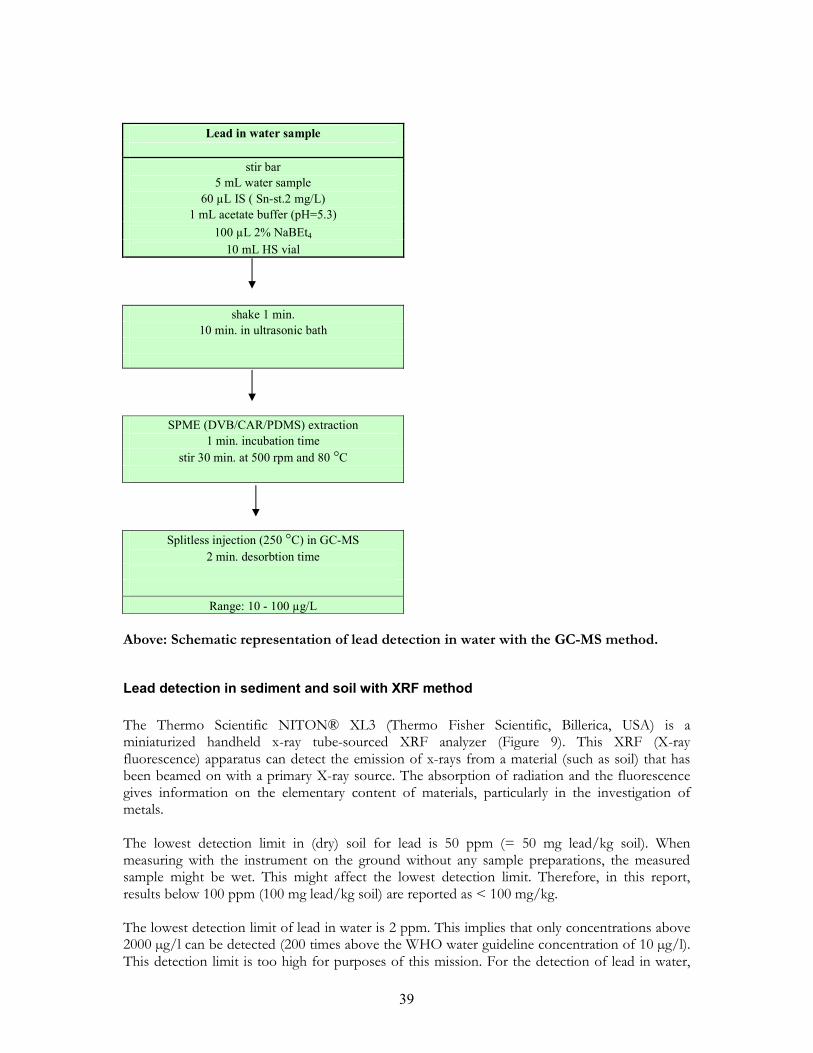
39
Lead in water sample
stir bar
5 mL water sample
60 µL IS ( Sn-st.2 mg/L)
1 mL acetate buffer (pH=5.3)
100 µL 2% NaBEt4
10 mL HS vial
shake 1 min.
10 min. in ultrasonic bath
SPME (DVB/CAR/PDMS) extraction
1 min. incubation time
stir 30 min. at 500 rpm and 80 °C
Splitless injection (250 °C) in GC-MS
2 min. desorbtion time
Range: 10 - 100 µg/L
Above: Schematic representation of lead detection in water with the GC-MS method.
Lead detection in sediment and soil with XRF method
The Thermo Scientific NITON® XL3 (Thermo Fisher Scientific, Billerica, USA) is a miniaturized handheld x-ray tube-sourced XRF analyzer (Figure 9). This XRF (X-ray fluorescence) apparatus can detect the emission of x-rays from a material (such as soil) that has been beamed on with a primary X-ray source. The absorption of radiation and the fluorescence gives information on the elementary content of materials, particularly in the investigation of metals. The lowest detection limit in (dry) soil for lead is 50 ppm (= 50 mg lead/kg soil). When measuring with the instrument on the ground without any sample preparations, the measured sample might be wet. This might affect the lowest detection limit. Therefore, in this report, results below 100 ppm (100 mg lead/kg soil) are reported as < 100 mg/kg. The lowest detection limit of lead in water is 2 ppm. This implies that only concentrations above 2000 µg/l can be detected (200 times above the WHO water guideline concentration of 10 µg/l). This detection limit is too high for purposes of this mission. For the detection of lead in water,
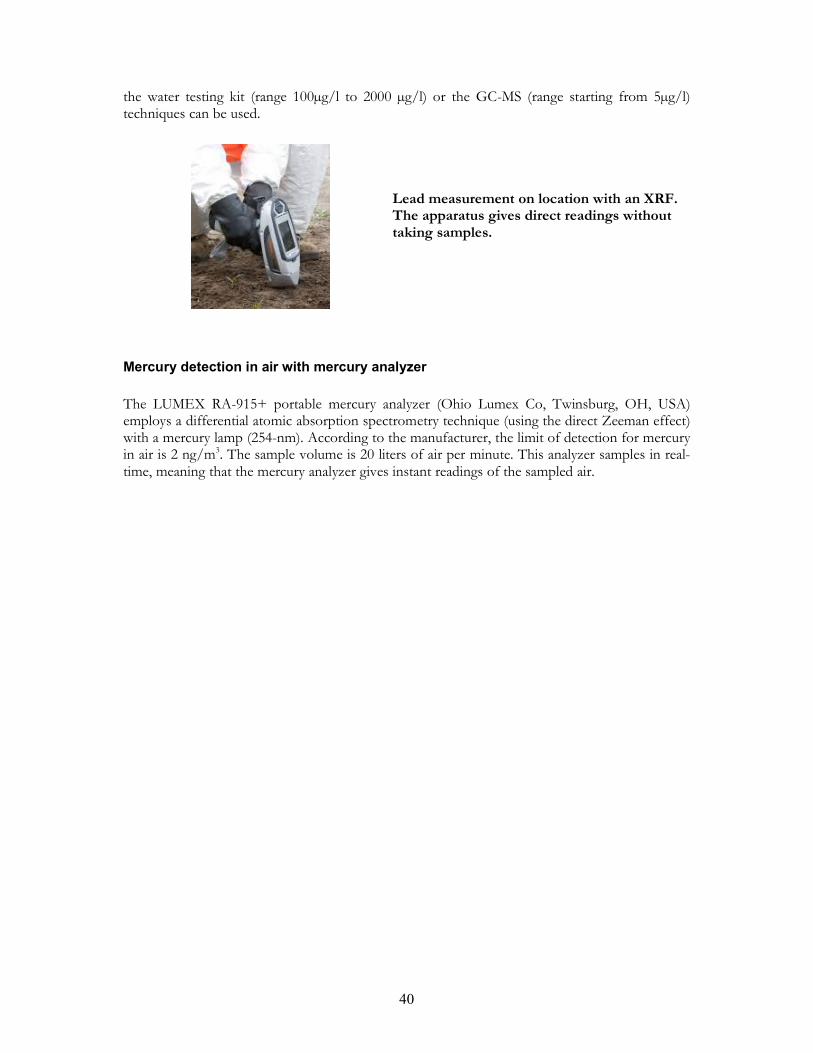
40
the water testing kit (range 100µg/l to 2000 µg/l) or the GC-MS (range starting from 5µg/l) techniques can be used.
Lead measurement on location with an XRF. The apparatus gives direct readings without taking samples.
Mercury detection in air with mercury analyzer
The LUMEX RA-915+ portable mercury analyzer (Ohio Lumex Co, Twinsburg, OH, USA) employs a differential atomic absorption spectrometry technique (using the direct Zeeman effect) with a mercury lamp (254-nm). According to the manufacturer, the limit of detection for mercury in air is 2 ng/m3. The sample volume is 20 liters of air per minute. This analyzer samples in real-time, meaning that the mercury analyzer gives instant readings of the sampled air.
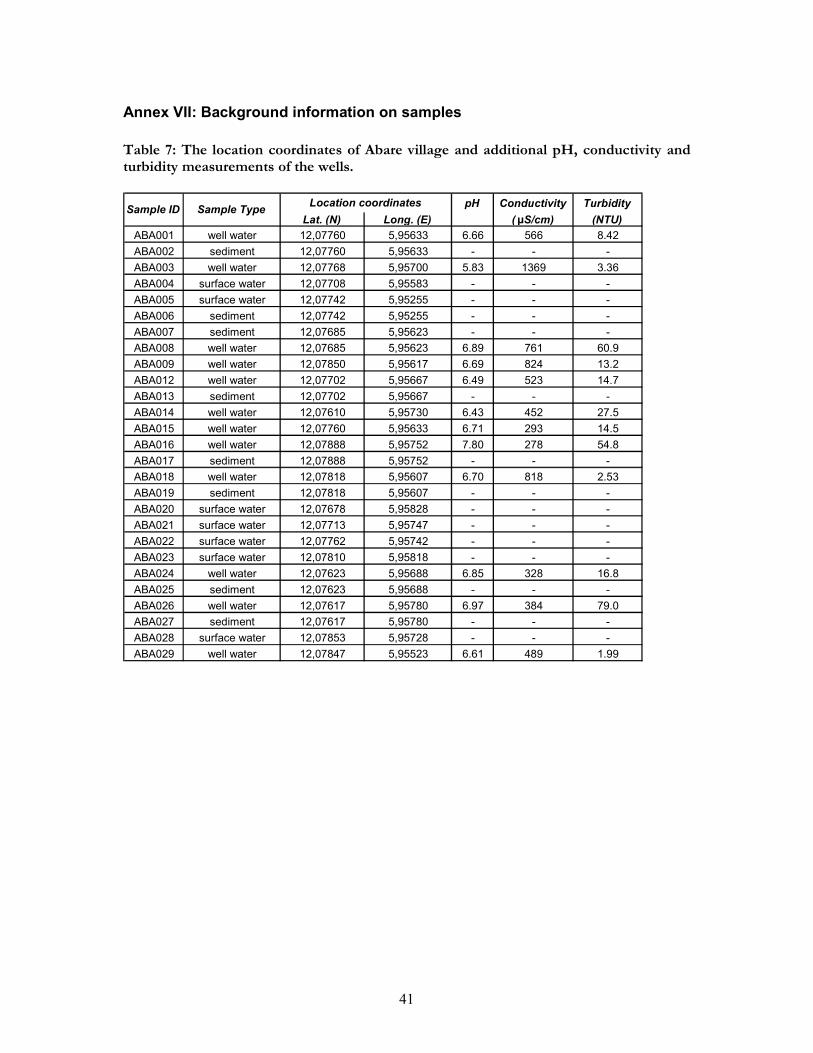
41
Annex VII: Background information on samples
Table 7: The location coordinates of Abare village and additional pH, conductivity and turbidity measurements of the wells.
pH Conductivity Turbidity
Lat. (N) Long. (E) ( µS/cm) (NTU)
ABA001 well water 12,07760 5,95633 6.66 566 8.42
ABA002 sediment 12,07760 5,95633 - - -
ABA003 well water 12,07768 5,95700 5.83 1369 3.36
ABA004 surface water 12,07708 5,95583 - - -
ABA005 surface water 12,07742 5,95255 - - -
ABA006 sediment 12,07742 5,95255 - - -
ABA007 sediment 12,07685 5,95623 - - -
ABA008 well water 12,07685 5,95623 6.89 761 60.9
ABA009 well water 12,07850 5,95617 6.69 824 13.2
ABA012 well water 12,07702 5,95667 6.49 523 14.7
ABA013 sediment 12,07702 5,95667 - - -
ABA014 well water 12,07610 5,95730 6.43 452 27.5
ABA015 well water 12,07760 5,95633 6.71 293 14.5
ABA016 well water 12,07888 5,95752 7.80 278 54.8
ABA017 sediment 12,07888 5,95752 - - -
ABA018 well water 12,07818 5,95607 6.70 818 2.53
ABA019 sediment 12,07818 5,95607 - - -
ABA020 surface water 12,07678 5,95828 - - -
ABA021 surface water 12,07713 5,95747 - - -
ABA022 surface water 12,07762 5,95742 - - -
ABA023 surface water 12,07810 5,95818 - - -
ABA024 well water 12,07623 5,95688 6.85 328 16.8
ABA025 sediment 12,07623 5,95688 - - -
ABA026 well water 12,07617 5,95780 6.97 384 79.0
ABA027 sediment 12,07617 5,95780 - - -
ABA028 surface water 12,07853 5,95728 - - -
ABA029 well water 12,07847 5,95523 6.61 489 1.99
Sample TypeSample IDLocation coordinates
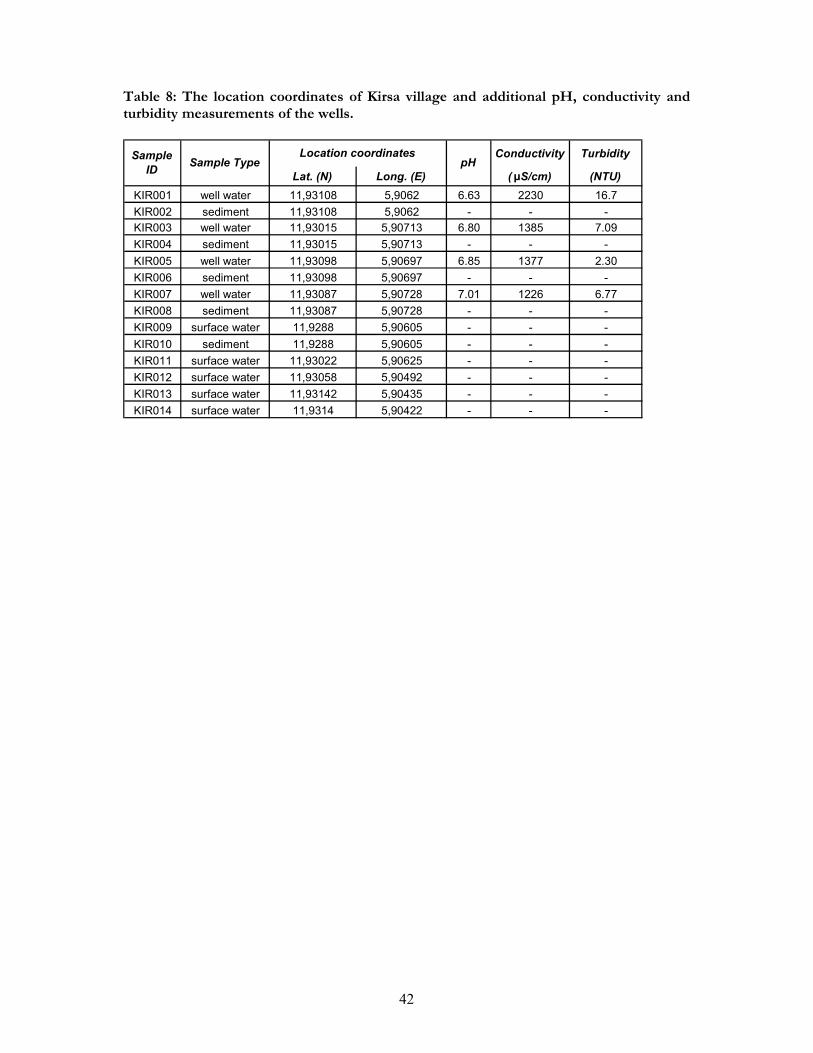
42
Table 8: The location coordinates of Kirsa village and additional pH, conductivity and turbidity measurements of the wells.
Conductivity Turbidity
Lat. (N) Long. (E) ( µS/cm) (NTU)
KIR001 well water 11,93108 5,9062 6.63 2230 16.7
KIR002 sediment 11,93108 5,9062 - - -
KIR003 well water 11,93015 5,90713 6.80 1385 7.09
KIR004 sediment 11,93015 5,90713 - - -
KIR005 well water 11,93098 5,90697 6.85 1377 2.30
KIR006 sediment 11,93098 5,90697 - - -
KIR007 well water 11,93087 5,90728 7.01 1226 6.77
KIR008 sediment 11,93087 5,90728 - - -
KIR009 surface water 11,9288 5,90605 - - -
KIR010 sediment 11,9288 5,90605 - - -
KIR011 surface water 11,93022 5,90625 - - -
KIR012 surface water 11,93058 5,90492 - - -
KIR013 surface water 11,93142 5,90435 - - -
KIR014 surface water 11,9314 5,90422 - - -
Sample
IDSample Type pH
Location coordinates
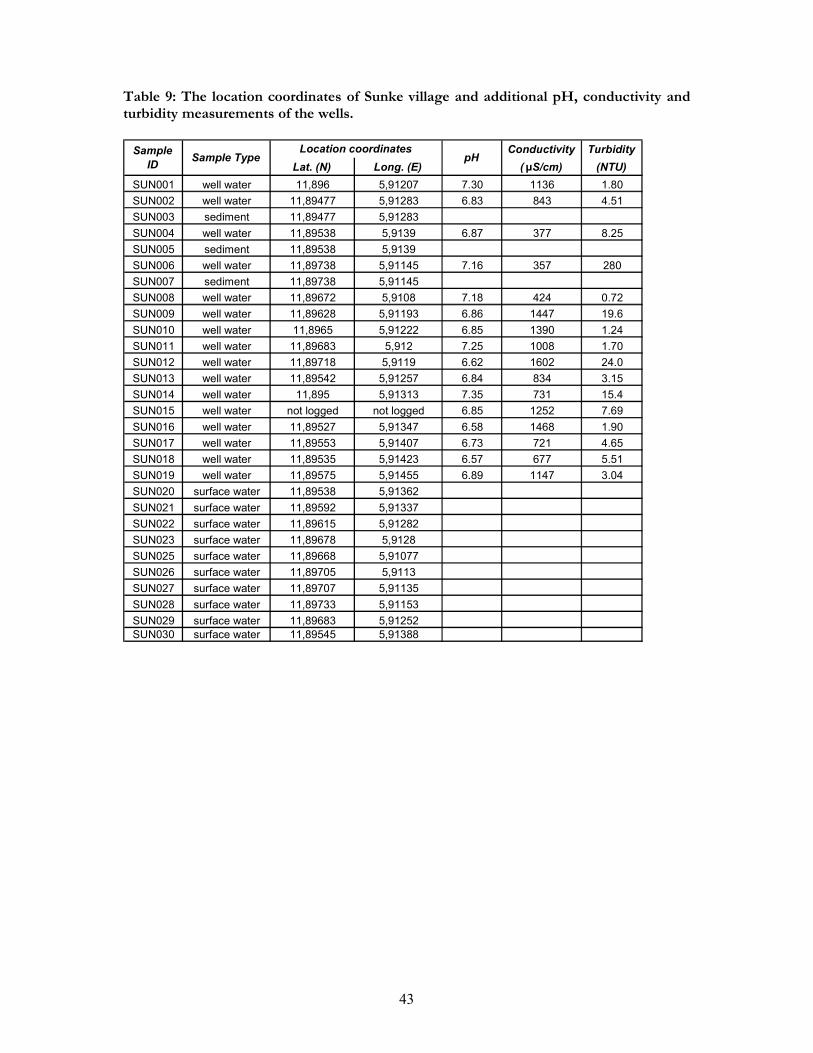
43
Table 9: The location coordinates of Sunke village and additional pH, conductivity and turbidity measurements of the wells.
Conductivity Turbidity
Lat. (N) Long. (E) ( µS/cm) (NTU)
SUN001 well water 11,896 5,91207 7.30 1136 1.80
SUN002 well water 11,89477 5,91283 6.83 843 4.51
SUN003 sediment 11,89477 5,91283
SUN004 well water 11,89538 5,9139 6.87 377 8.25
SUN005 sediment 11,89538 5,9139
SUN006 well water 11,89738 5,91145 7.16 357 280
SUN007 sediment 11,89738 5,91145
SUN008 well water 11,89672 5,9108 7.18 424 0.72
SUN009 well water 11,89628 5,91193 6.86 1447 19.6
SUN010 well water 11,8965 5,91222 6.85 1390 1.24
SUN011 well water 11,89683 5,912 7.25 1008 1.70
SUN012 well water 11,89718 5,9119 6.62 1602 24.0
SUN013 well water 11,89542 5,91257 6.84 834 3.15
SUN014 well water 11,895 5,91313 7.35 731 15.4
SUN015 well water not logged not logged 6.85 1252 7.69
SUN016 well water 11,89527 5,91347 6.58 1468 1.90
SUN017 well water 11,89553 5,91407 6.73 721 4.65
SUN018 well water 11,89535 5,91423 6.57 677 5.51
SUN019 well water 11,89575 5,91455 6.89 1147 3.04
SUN020 surface water 11,89538 5,91362
SUN021 surface water 11,89592 5,91337
SUN022 surface water 11,89615 5,91282
SUN023 surface water 11,89678 5,9128
SUN025 surface water 11,89668 5,91077
SUN026 surface water 11,89705 5,9113
SUN027 surface water 11,89707 5,91135
SUN028 surface water 11,89733 5,91153
SUN029 surface water 11,89683 5,91252
SUN030 surface water 11,89545 5,91388
Sample
IDSample Type pH
Location coordinates
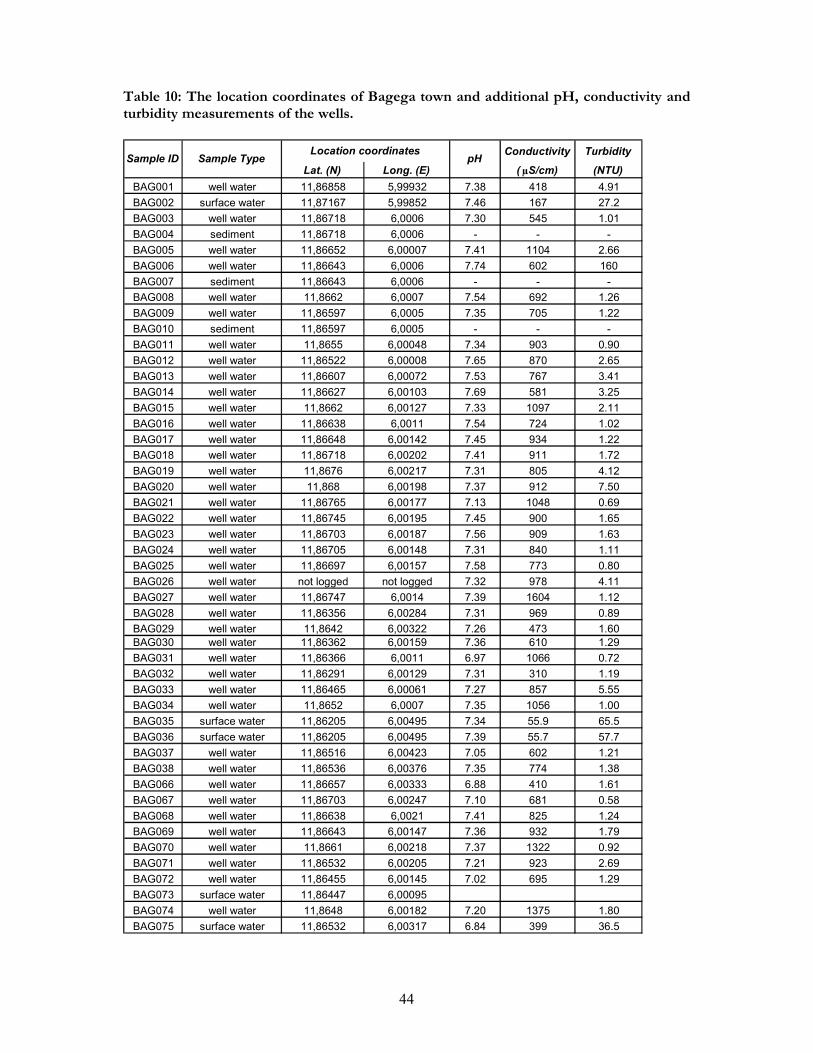
44
Table 10: The location coordinates of Bagega town and additional pH, conductivity and turbidity measurements of the wells.
Conductivity Turbidity
Lat. (N) Long. (E) ( µS/cm) (NTU)
BAG001 well water 11,86858 5,99932 7.38 418 4.91
BAG002 surface water 11,87167 5,99852 7.46 167 27.2
BAG003 well water 11,86718 6,0006 7.30 545 1.01
BAG004 sediment 11,86718 6,0006 - - -
BAG005 well water 11,86652 6,00007 7.41 1104 2.66
BAG006 well water 11,86643 6,0006 7.74 602 160
BAG007 sediment 11,86643 6,0006 - - -
BAG008 well water 11,8662 6,0007 7.54 692 1.26
BAG009 well water 11,86597 6,0005 7.35 705 1.22
BAG010 sediment 11,86597 6,0005 - - -
BAG011 well water 11,8655 6,00048 7.34 903 0.90
BAG012 well water 11,86522 6,00008 7.65 870 2.65
BAG013 well water 11,86607 6,00072 7.53 767 3.41
BAG014 well water 11,86627 6,00103 7.69 581 3.25
BAG015 well water 11,8662 6,00127 7.33 1097 2.11
BAG016 well water 11,86638 6,0011 7.54 724 1.02
BAG017 well water 11,86648 6,00142 7.45 934 1.22
BAG018 well water 11,86718 6,00202 7.41 911 1.72
BAG019 well water 11,8676 6,00217 7.31 805 4.12
BAG020 well water 11,868 6,00198 7.37 912 7.50
BAG021 well water 11,86765 6,00177 7.13 1048 0.69
BAG022 well water 11,86745 6,00195 7.45 900 1.65
BAG023 well water 11,86703 6,00187 7.56 909 1.63
BAG024 well water 11,86705 6,00148 7.31 840 1.11
BAG025 well water 11,86697 6,00157 7.58 773 0.80
BAG026 well water not logged not logged 7.32 978 4.11
BAG027 well water 11,86747 6,0014 7.39 1604 1.12
BAG028 well water 11,86356 6,00284 7.31 969 0.89
BAG029 well water 11,8642 6,00322 7.26 473 1.60
BAG030 well water 11,86362 6,00159 7.36 610 1.29
BAG031 well water 11,86366 6,0011 6.97 1066 0.72
BAG032 well water 11,86291 6,00129 7.31 310 1.19
BAG033 well water 11,86465 6,00061 7.27 857 5.55
BAG034 well water 11,8652 6,0007 7.35 1056 1.00
BAG035 surface water 11,86205 6,00495 7.34 55.9 65.5
BAG036 surface water 11,86205 6,00495 7.39 55.7 57.7
BAG037 well water 11,86516 6,00423 7.05 602 1.21
BAG038 well water 11,86536 6,00376 7.35 774 1.38
BAG066 well water 11,86657 6,00333 6.88 410 1.61
BAG067 well water 11,86703 6,00247 7.10 681 0.58
BAG068 well water 11,86638 6,0021 7.41 825 1.24
BAG069 well water 11,86643 6,00147 7.36 932 1.79
BAG070 well water 11,8661 6,00218 7.37 1322 0.92
BAG071 well water 11,86532 6,00205 7.21 923 2.69
BAG072 well water 11,86455 6,00145 7.02 695 1.29
BAG073 surface water 11,86447 6,00095
BAG074 well water 11,8648 6,00182 7.20 1375 1.80
BAG075 surface water 11,86532 6,00317 6.84 399 36.5
Sample Type pHSample IDLocation coordinates
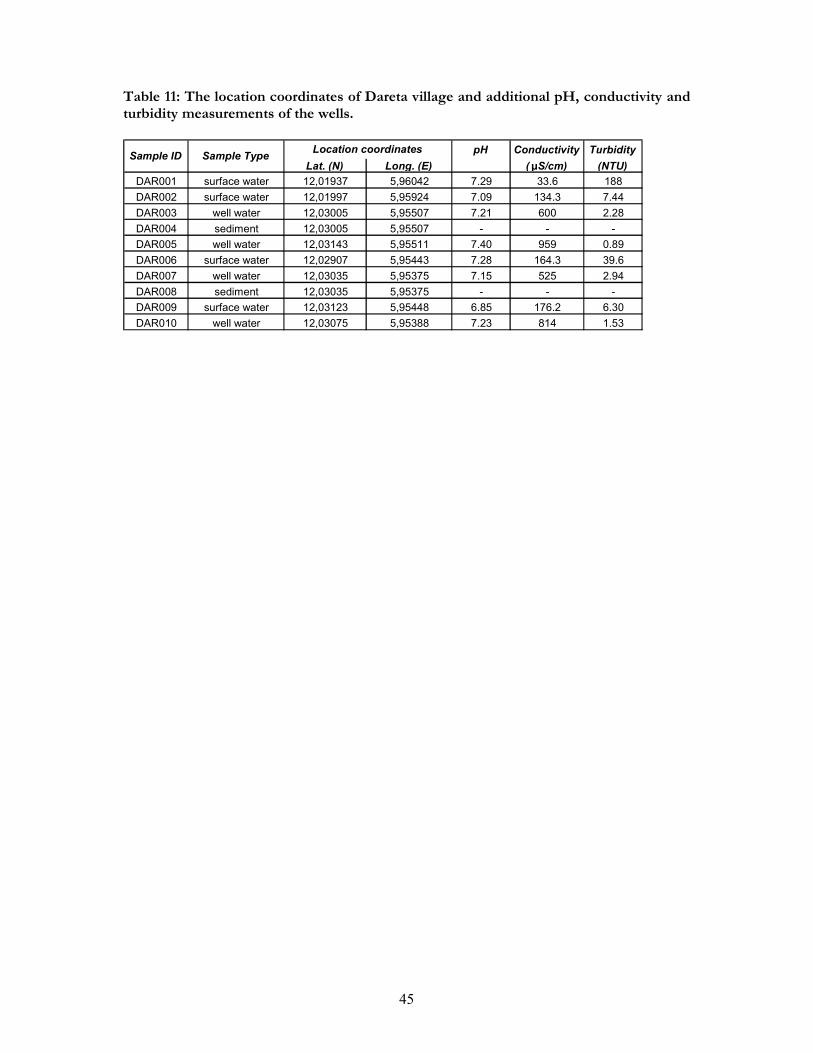
45
Table 11: The location coordinates of Dareta village and additional pH, conductivity and turbidity measurements of the wells.
pH Conductivity Turbidity
Lat. (N) Long. (E) ( µS/cm) (NTU)
DAR001 surface water 12,01937 5,96042 7.29 33.6 188
DAR002 surface water 12,01997 5,95924 7.09 134.3 7.44
DAR003 well water 12,03005 5,95507 7.21 600 2.28
DAR004 sediment 12,03005 5,95507 - - -
DAR005 well water 12,03143 5,95511 7.40 959 0.89
DAR006 surface water 12,02907 5,95443 7.28 164.3 39.6
DAR007 well water 12,03035 5,95375 7.15 525 2.94
DAR008 sediment 12,03035 5,95375 - - -
DAR009 surface water 12,03123 5,95448 6.85 176.2 6.30
DAR010 well water 12,03075 5,95388 7.23 814 1.53
Sample ID Sample TypeLocation coordinates
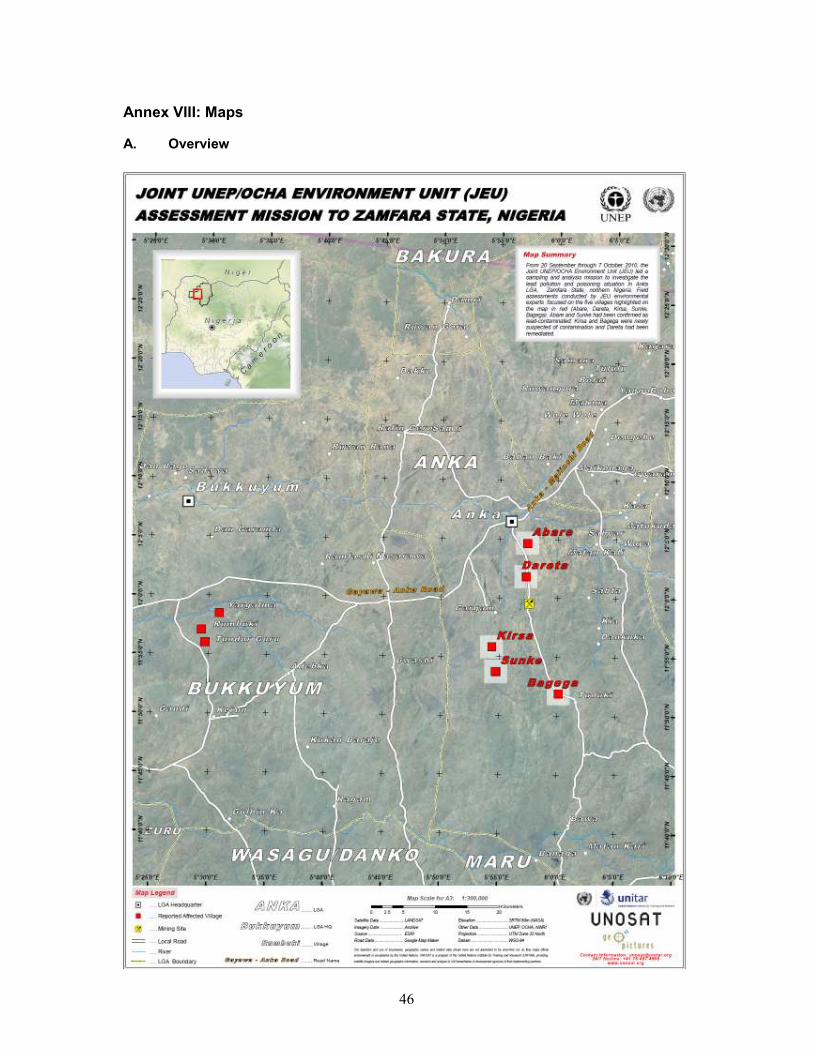
46
Annex VIII: Maps
A. Overview
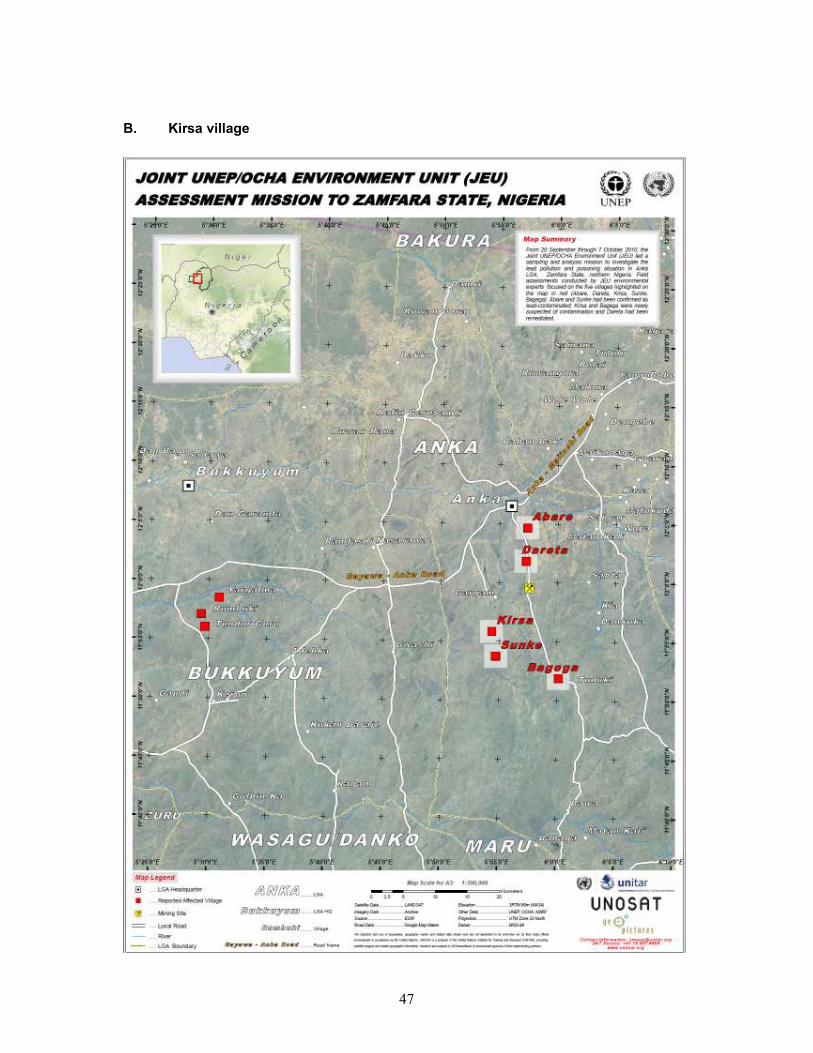
47
B. Kirsa village
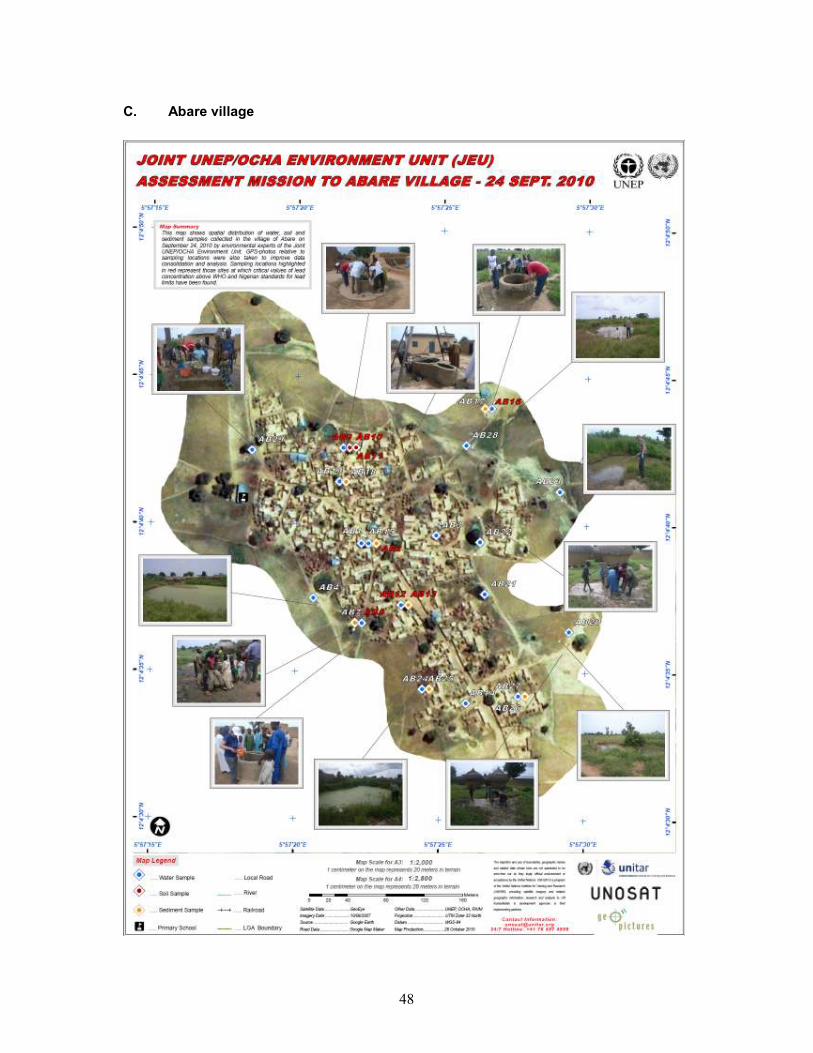
48
C. Abare village
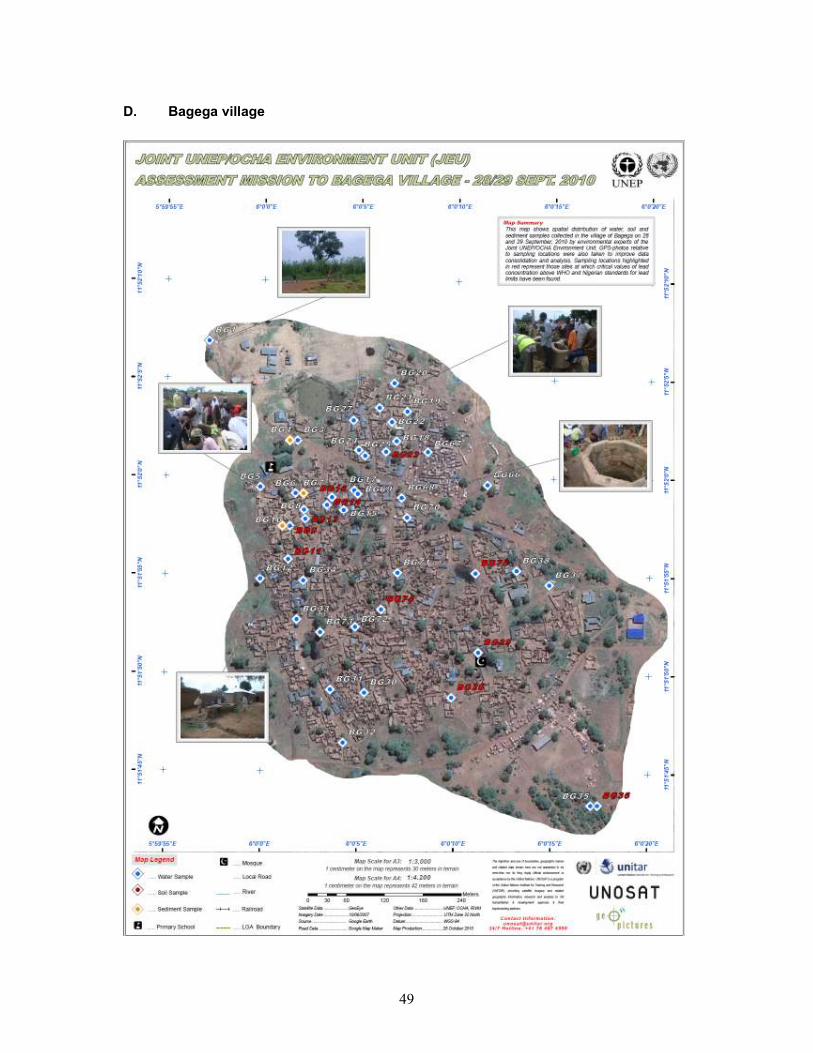
49
D. Bagega village
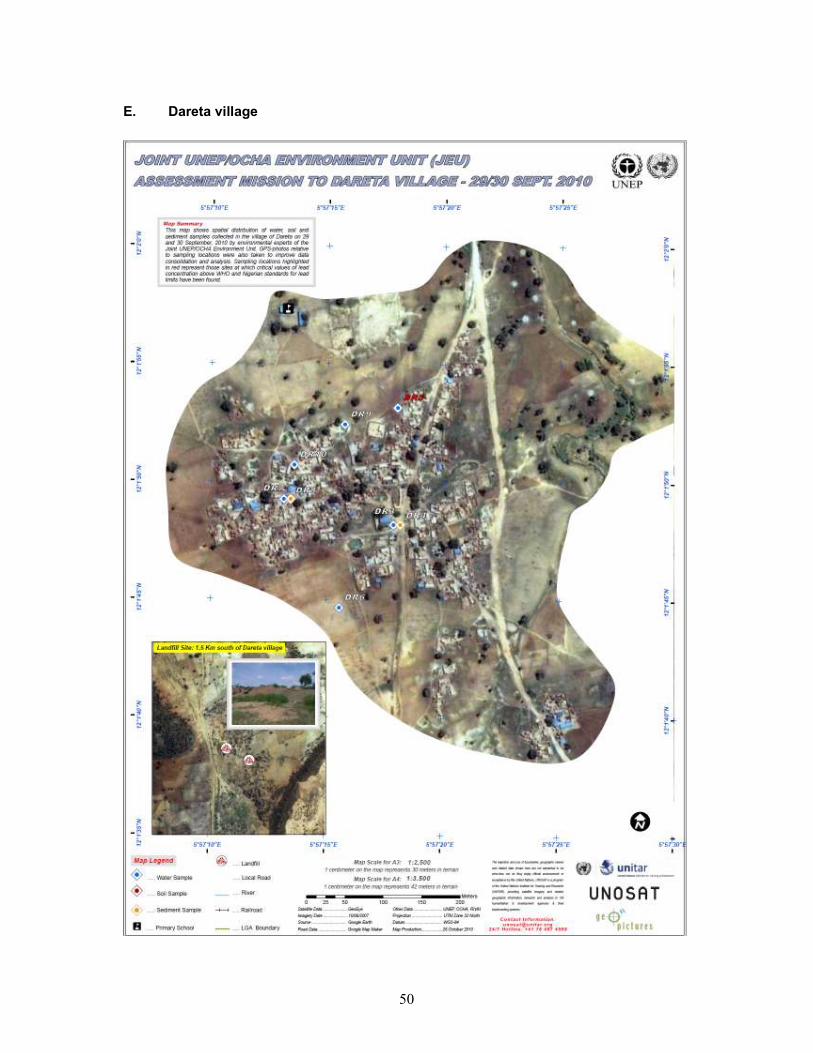
50
E. Dareta village

51
F. Sunke village