Embed Size (px)
Citation preview

Lead Poisoning Risk in the City of Lead Poisoning Risk in the City of Hartford: A GIS Analysis
Katie E Perham MPHKatie E. Perham, MPHGIS Consultant
ESRI Health GIS Conference September 21, 2009p , 9

Overview
• Background on health effects of lead in children• Background on health effects of lead in children• Hartford Health & Human Services (HHS) Lead
ProgramProgram▫ High Tech Lead Tracking Project
• Approach for lead poisoning risk analysis• Approach for lead poisoning risk analysis• Results
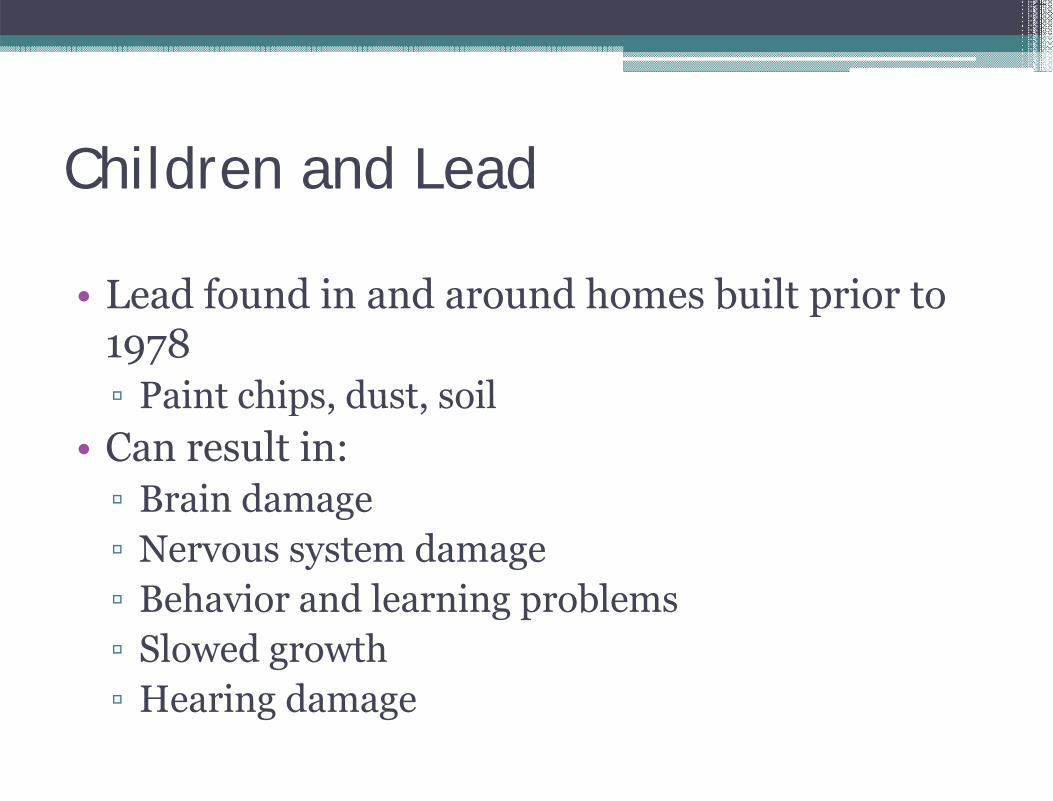
Children and Lead
• Lead found in and around homes built prior to • Lead found in and around homes built prior to 1978▫ Paint chips dust soil▫ Paint chips, dust, soil
• Can result in:Brain damage▫ Brain damage
▫ Nervous system damageB h i d l i bl▫ Behavior and learning problems
▫ Slowed growthH i d▫ Hearing damage
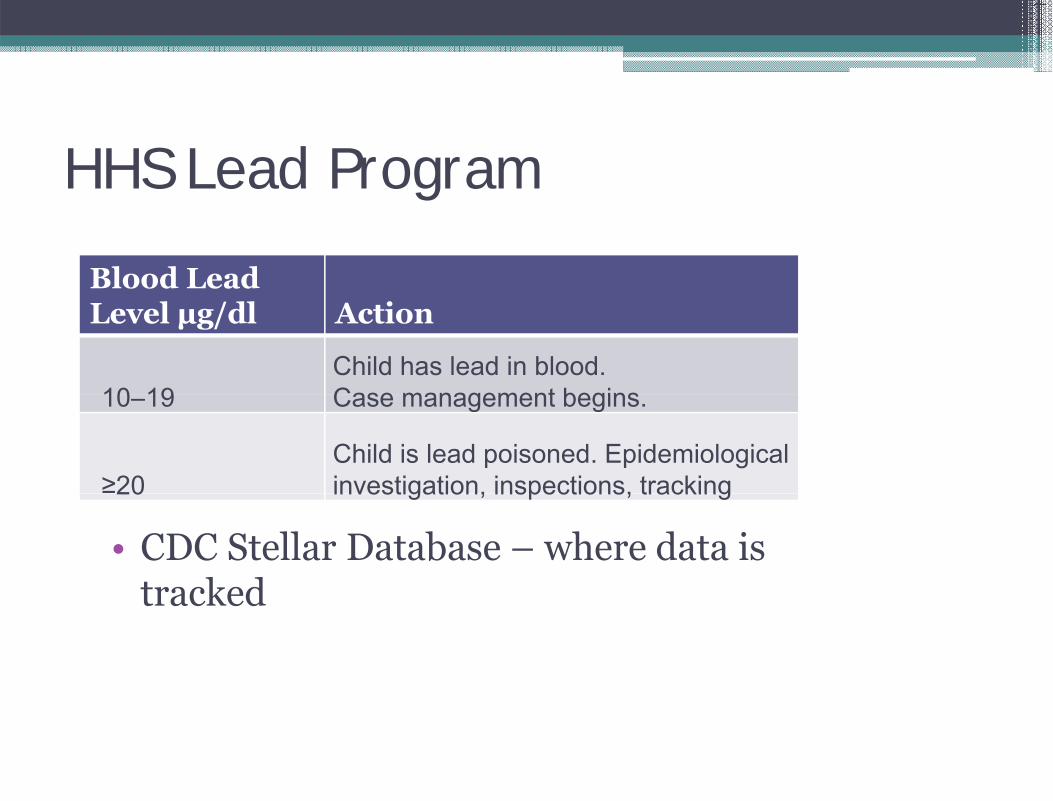
HHS Lead Programg
Blood Lead Level μg/dl Action
10 19Child has lead in blood. Case management begins10–19 Case management begins.
≥20Child is lead poisoned. Epidemiological investigation, inspections, tracking
• CDC Stellar Database – where data is tracked
20 investigation, inspections, tracking
tracked

High Tech Lead Tracking projectg g p j• EPA 2-year grant (Oct 07-Sept 09) specific to use of GIS
for prevention of lead poisoningfor prevention of lead poisoning• Collect and analyze information on lead hazard
inspectionsinspections• Identify properties with lead hazards and properties
which have been remediated• Guide remediation efforts and allow for real-time
analysis of neighborhood “hot spots” • Direct outreach and education efforts to parents and
property owners, referring them to funding sources for property abatementproperty abatement.

Research QuestionResearch Question
• Where are the highest risk areas for lead • Where are the highest risk areas for lead poisoning in Hartford?

Data Sources
Risk Factor Source
Age of Housing (Year Built) Tax Assessor
Locations of children with elevated blood lead HHS Stellar levels (1993-2007) Database
Household Income US Census
Percentage of children under age 5 US Census
B ildi id i l 2 3 BR hBuilding type: residential 2 or 3 BR apts or houses Tax Assessor
Buildings with soil samples with lead levels ≥ 400 ppm
HHS Stellar Databaseppm Database

Project Approach – Weighted Overlay Analysisj pp• Combine all GIS layers to calculate a ‘risk score’ per building
Image source: UN Food and Agriculture Organization www.fao.org/docrep/006/y4816e/y4816e0g.htm

Project Approach – Weighted Overlay Analysisj pp
Steps:Steps:
1. Assign weight to each data source2. Assign risk values based on our understanding of risk2. Assign risk values based on our understanding of risk3. Run layers through weighted overlay tool 4. Map the results4 p

WeightingWeighting
• Previous understanding of risk• Previous understanding of risk• Experience and insight into area of study• Relative influence of each layer on risk• Relative influence of each layer on risk• Alternative (weighted sum analysis) assumes all
si l s q ll i fl ti l isksix layers are equally influential on risk

Step 1: Assign weight to each data source
Risk Factor Weight
Age of Housing (Year Built) 35%
Locations of children with elevated blood lead levels 20%Locations of children with elevated blood lead levels 20%
Household Income 15%
Percentage of children under age 5 15%
Building type: residential 2 or 3 BR apts or houses 10%
Buildings with soil samples with lead levels ≥ 400 ppm 5%g p pp

Step 2: Assign rank values to data based on our understanding of risk
Layer ValuesAssigned Risk Value Risk
Pre-1950 3 Highest
Age of Housing
g
1950-1977 2
1978-2007 1
≥ 20 μg/dl 6 Highest
15-19 5
10 14 4Children with EBLL (Stellar Results)
10-14 4
5-9 3
>0-4 20 4 2
zero 1

Step 2: Assign rank values to data based on our understanding of risk
Layer ValuesAssigned Risk Value Risk
< 10K 8 Highestg
10-15K 7
15-19K 6
20-25K 5Household Income
20 25K 5
25-29K 4
30-40 3
40 50 240-50 2
50+ 1
P t f> 10% 3 Highest
Percentage of Children < age 5
1-10% 2
<1% 1

Step 2: Assign rank values to data based on our understanding of risk
Layer ValuesAssigned Risk Value Risk
≥ 400 ppm 3 Highest
Soil samples
pp g
300-400 ppm 2
< 300 1
Number of Bedrooms
2+ bedrooms 2 Highest
<2 bedrooms 1

Age of Housing

Stellar Lab Samples

Median Household Income

Percentage of Children Under Age 5

Number of Bedrooms

Soil Samples

Remove out non-residential properties

Step 3: Run weighted overlay tool
Output layerAge of Housing Percent Children <5 Output layer
32
Age of Housing Percent Children 5
32 2
+ =
75% influence 25% influence(2 x 0.75) + (3 x 0.25)
1.5 + 0.75 = 2.25Rounded to closest integer = 2 0Rounded to closest integer = 2.0

Step 4: Map the results


ResultsResults
• Buildings: 28% of residential buildings in • Buildings: 28% of residential buildings in Hartford have a very high-risk for lead poisoning
• Census blocks: 61 (out of 997) in Hartford have 90% or greater very high risk building area90% or greater very high-risk building area
N i hb h d Hi h t i k B S • Neighborhoods: Highest risk are Barry Square, Frog Hollow and the Northeast


ConclusionsConclusions
• Based on results outreach strategies have been • Based on results, outreach strategies have been designed to educate residents and property owners to improve housing conditionsowners to improve housing conditions
• Grant applications submitted• GIS layers developed will be used going forward • GIS layers developed will be used going forward
in the future stages of the High Tech Lead Tracking Project e g mobile field applicationsTracking Project, e.g. mobile field applications