Embed Size (px)
Citation preview

Department of Chemical Engineering and Biotechnology
CHALMERS UNIVERSITY OF TECHNOLOGY
Gothenburg, Sweden 2015
Bachelor’s Thesis 2015:123
Leaching and recovery of metals from
municipal solid waste incineration ashes
Bachelor of Science Thesis in Chemical Engineering Thesis Worker: Taha Haider Khan
Supervisor: Karin Karlfeldt Fedje
Examiner: Ann-Margret Strömvall

2

3
REPORT NO. 2015:123
Leaching And Recovery From MSWI Fly Ash
TAHA H. KHAN
Department of Biotechnology and Chemical Engineering
CHALMERS UNIVERSITY OF TECHNOLOGY
Göteborg, Sweden 19
4
Leaching and recovery from MSWI fly ash
TAHA H. KHAN
© TAHA KHAN , 2015.
Technical report no 2015:123
Department of biotechnology and chemical engineering
Chalmers University of Technology
SE-412 96 Göteborg
Sweden
Telephone + 46 (0)31-772 1000
Leaching and recovery of metals from municipal solid waste incineration ashes. TAHA KHAN
Department of Chemical Engineering and Biotechnology
Chalmers University of Technology

5
Abstract As the demand to obtain a more sustainable and green society researchers and
engineers has been pushed beyond their limits to find new solutions to match their
demands. As various types of ashes are collected from different incineration
techniques, these ashes need to be managed before it is to late. These ashes, fly ash,
bottom ash and boiler ash, contain high concentrations of toxic metals compounds
that are very hazardous from an environmental point of view and from a health
perceptive. The toxic containment in these ashes has to be taken care rapidly for
several reasons. Scientists has concluded that in the near future their will be a lack of
metals that is one reason why these ashes should be taken care of so the contained
metals could be recovered from these ashes. This can be done through chemical
leaching; researchers have determined that leaching of ashes should be carried out in
acid solutions. It has been shown that metals leach most efficient at lower pH value
but for some metals the release rate of metals are still as efficient at higher pH value.
In this thesis project, two different ashes at different particle fractions has been
leached with hydrochloric acid and the metal content was determined with ICP-MS at
an external lab by analyzing the various leachate mixtures. The obtained results in
this experiment showed that Zinc had the highest percentage of leaching from the
various ashes that was examined.
Keywords: MSWI, ashes, fly ash, incineration, pH.

6
Table of Contents
1. Introduction .................................................................................................................... 7
2. Aim ..................................................................................................................................... 8
3. Theory ............................................................................................................................... 9 3.1 Waste Incineration.............................................................................................................. 9
3.1.2 Mass burn-combustor .............................................................................................................. 9 3.1.3 Fluidized bed .............................................................................................................................. 10 3.2 Fly Ash .............................................................................................................................................. 11
3.3 Leaching of metals from ash .......................................................................................... 12 3.4 Recovery methods ............................................................................................................. 14
3.4.2. Flotation ...................................................................................................................................... 14 3.4.3. Adsorption ................................................................................................................................. 14 3.4.4. Ion exchange ............................................................................................................................. 14 3.4.5. Membrane filtration ............................................................................................................... 14
4. Experimental ................................................................................................................ 15 4.1 Description of ashes ......................................................................................................... 15 4.2 Particle fractions ............................................................................................................... 15 4.3 Experimental procedure ................................................................................................. 17 4.4 Analytical method- ICP-MS ............................................................................................. 19 4.5 pH measure .......................................................................................................................... 21
5. Results ............................................................................................................................. 21 5.1 Total content of Cu, Pb and Zn in ash A and B at various particle fraction. .. 21 5.2 Release of metals ............................................................................................................... 22
5.2.1 Leaching of Copper .................................................................................................................. 22 5.2.2 Leaching of lead ........................................................................................................................ 23 5.2.3 Leaching of Zinc ........................................................................................................................ 24
5.4 pH Value ................................................................................................................................ 24
6. Discussion ...................................................................................................................... 25
7. Conclusions ................................................................................................................... 27 8. Acknowledgments………………………………………………………………………………..25
9. Reference ....................................................................................................................... 29

7
1. Introduction
The European Union sets the framework for regulation of waste management
for the countries across Europe and on these parameters the Swedish parliament
decides how to manage the waste and the whole management system should be
designed. The strive for a more sustainable and green society has guided Sweden
towards an environmental waste management. Due to all regulation that the Swedish
government has set, all waste in the country has to be handled and managed in the
most optimum environmental way as possible. To achieve these goals everyone
(municipalities, producers, households, companies, organizations and citizens) has to
participate and play their part in order to maintain sustainable society [2].
Municipalities have the responsibility for collection of household waste and
that the waste is transported to a treatment facility for recycling. This doesn’t only
apply for household but even for restaurants, shops, offices etc. The waste must be
disposed of in an environmentally sound manner. Manufactures shall ensure that
appropriate collection schemes and treatment methods. They also have obligation to
inform about sorting and collection. The aim of the producer is that the products that
are manufactured consumes the least possible amount of natural resources, they
should be easy to recycle and do not contain hazardous substances[2][5].
During 2013 in Sweden, the treated household waste amounted to 4,447,880
tons. Researchers have come to found out that every Swede generate 461.2 kg of
household waste in 2013 compared to 460.3 kg per person during 2012. Apart from
energy recovery, which decreased during 2013, table1 show how the different waste
management tools increased during 2013 from 2012. While figure 1 shows the
development for various techniques since 1975 to 2013.
Technique Increase (ton) +/- % Kg/person
Material recycling 1467200 +3,2 152,1
Biological recycling 711450 +5,7 73,8
Energy recovery 2235930 -1,5 231,8
Landfilling 33300 +2,1 3,5 Table 1. Data shown how various techniques increased/decreased from 2012 to 2013 in Sweden.
Waste incineration is a well-used management tool for municipal solid waste,
MSW. The composition of MSW varies from region to region, depends on consumer
behavior and changes on a daily basis [7]. In Sweden it usually gives rise to about 200
000 tones of fly ash [2]. Due to potential toxic metal compounds and soluble chlorides,
the fly ash is often classified as a hazardous material and has to be landfilled even
tough landfilling is not the most sustainable treatment process for MSW incineration
(MSWI). That is the reason why incineration is increasing both in Sweden and in
other countries across Europe [2]. Due to the toxic compounds in fly ash, production
of ashes must be handled in ways that ensure that there are no negative effects on the
environment or human health [4]. Ash it self is not a consistent substance but more
like a combination of various different metals, materials and minerals and other
chemical compounds. These compounds contain metal compounds such as, metal

8
chlorides or oxides. Therefore a huge range of scientists and researchers around the
world set their time to research about this complicated complex and how to extract
those containing minerals and metals in the most efficient and environmentally
sensitive manner.
Previously, the main focus of MSWI research was mainly on how to obtain
prevention of leaching of metals and chloride and the spread of these hazardous
chemicals. During early 2000s the fly ash was typically disposed in the landfills for
hazardous waste [9][17].
However, a major issue with MSWI fly is that it contains leachable heavy
metals. With the strive for a more sustainable and greener society, companies and
organizations are trying to find out various solutions techniques to solve the problem,
metals recovery. A possible solution to this problem is, leaching. Some of these
metals can be seen in the list below [6].
Copper, Cu.
Lead, Pb.
Zinc, Zn.
Calculation has shown that the net worth of Zn in Swedish MSWI fly ash is
approximately 7 million Euros per year [3][1]. The corresponding value for EU is about
60 million Euros per year. For Vanadium, a very rare soft metal element, the net
value in Sweden for this metal is approximately 3 millions/ year with a prize of 280
Euro/kg. However, as the metals in fly ash aren’t present in metal pieces it’s not
possible to directly recover them using physical methods hence chemical leaching is
needed [1].
2. Aim The main aim of this thesis work is to leach two different ashes, A and B
These ashes are sieved into different particle fractions. . It is also know ashes contain
a high content of various metal and the main objective of this project is to study the
leaching process of these various metals from ash A respective ash B.
9
3. Theory
3.1 Waste Incineration In recent years, due to new regulation the waste management in Sweden has
gone through a lot of changes. The growth of waste incineration has played a big part
of this development. Almost 50% of the MSW is today being energy recovered while
less then 5% is being landfilled [9].
According to the report of RVF (Avfall blir värme och el 2005,02) waste
incineration has increased with 50% since 1985 with an average increase of 100 000
tons per year.
Today there are two dominant techniques regarding waste incineration, mass
burn- and fluidized bed technology.
Each year, Swedish waste incinerators cause about 200 00 tons of fly ash and
700 000 tons of bottom ash. To name one of very many applications for bottom ash is
the application of construction material at waste deposits. For fly ash application area
is much more complex due to all toxic chemicals.
The amount of each ash residue that is produced at waster incinerator may
vary on several factors, waste composition, air pollution control system or incinerator
technology. Table 2 shows a general calculation of the amount different ash residues
produced per ton of waste incinerated. Fly ash normally contributes to a small
quantity of the total volume of residue from a waste incineration facility; the amount
of fly ash is approximately from 5 to 20 %of the total ash.
Type of residue Typical amount produced, kg/ton of feed waste
Bottom ash 250-420
Boiler ash 2-12
Econmizer ash Small
Fly ash 10-30 Table 2. Typical amounts constructed, kg/ton of waste feed
3.1.2 Mass burn-combustor In this technique, the combustion of waste is done with grate, made of rods.
The rust is variable and the rod motion moves the waste gradually forward into a
fireplace, while it’s distributed and mixed for combustion to be as complete as
possible [11].
At lately, usage of water-cooled roaster rods has increased rapidly, since the
waste fuels has obtained a more increased heating value, as a result of quantity of
industrial waste has increased [9].
The combustion takes place at temperatures between 850 and 1100 ° C.
Investigations has shown, in order to burn one ton of waste as efficiently as possible
4000-5000m3 air is needed to be consumed. To maintain an efficient combustion as
possible the air is added in different zones [10].

10
The gases from the combustion of the fuel in the furnace rise at while the
incineration in the combustion boiler chamber continues. While these hot gases rise
up, a portion of heat from these gases are transferred to the water that circulates in
tubes built in the boiler walls. The flue gases are still at a high temperature, between
200 and 600oC when leaving the boiler. A schematic scheme of this method can be
seen in figure2 [10][11] .
Figure 1. Schematic scheme of a mass burning facility
3.1.3 Fluidized bed Waste incineration in fluidized beds, FB, is carried in a sand bed. By blowing
combustion air through the bedplate it will occur as a liquid.
The temperature of the fluidized combustion is generally around 850- 900°C.
The formation of nitrogen oxides (NOX) is minimized since the oxidation process of
nitrogen in the air is supplied for increased combustion. A plant with fluidized beds
requires a finer and more homogeneous fuel, which puts a great demand on the
pretreatment of the incoming waste. The fluidized bed combustion technique requires
a size reduction and pre- sorting of waste [3]. The extraction process for energy
recovery in a FB-pan is similar roast technique [10] [11].
The characteristic of fluidized beds is that, this method has a good and
efficient combustion from an environmental perspective. This method also places
high demands on the waste that enters the process, that it is dispersed and pre-treated.
This means that pretreatment of the incoming MSW is being handled properly, which
in turn means that, as much as possible metal is removed from the MSW and that
material is crushed so that it has a size of 10x 10cm. [13]
When the waste is incinerated the temperature in the system should be above
1000°C. The incinerations ovens should hold a Reynolds number greater then 50 000.
At the end of this process the fuel gas is cooled down from 450 °C to 250°C. To
prevent the emission of dioxins and other hazardous compounds bag filtration are
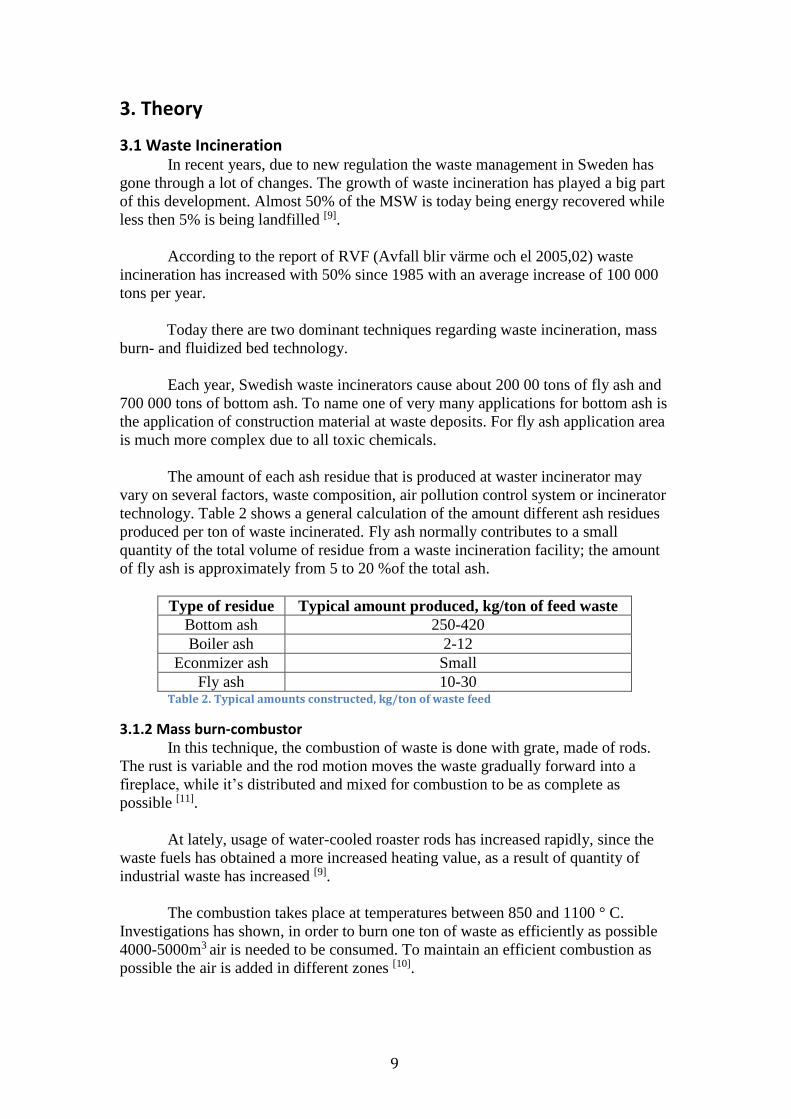
used. Figure 2 below illustrates a schematic of a fluidized bed combustor.
11
Figure 2. Schematic scheme of a fluidized bed combustor.
3.2 Fly Ash In this report the main focus will be on Fly ash. Fly ash is the smallest ash
particles generated during incineration. Fly ash is residue in any combustions process
from any incineration facility; whether it is municipal solid waste that being
incinerated or anything else. From a general point of view, one can say, that the
chemical and physical properties of fly ash can depend on a variety of factors, such
as, air pollution control system design or what type of incineration method is applied
etc.
However, the metals get vaporized while they are incinerated and also that
they get absorbed at the surface causes the high content of heavy metals in fly ash.
According to a study made of Charles H. and his colleagues, they found out
that eight elements differed from all other elements in their chemical compositions in
fly ash, Si, Al, Fe, Mg, Ca, Na, K and Cl. CaO was the richest compound in the fly
ash, 46% [12]. Due to the high containment of heavy metals, the risk for, damage the
environment and effect mankind in a negative terms, is quite high if they don’t get
managed in the right way.
In general, laboratory-leaching tests are made for measuring different
properties of the material that is being analyzed. For example some of these
parameters could be, solubility, release rate or availability. Table 2 shows a more
brief description of these parameters. [14]

12
Property Definition Characteristic Unit
Availability
A specific amount
of any species that
may leach under
specific time
period.
High L/S, small
particle sizes of
material to be
tested, contact
time which allows
the resolution to be
achieved.
Mass leached/mass
of initial material
(e.g. mg Pb/kg
ash)
Solubility
Concentration of
elements in
solution.
Low L/S, contact
time which allows
equilibrium
between the solid
and liquid phase.
rate per mass or
surface area basis
(e.g., mg
released/sq
material/day)
Release rate
Is used to estimate
“discharge” for
specific element
from a material.
_____
_____
Table 3. Description of different properties of the material thats being analyzed through the laboratory
leaching test.
3.3 Leaching of metals from ash A definition of leaching could be defined as, any suspension of a soluble
“body” from a solid phase into a solvent. The cause of chemical reactions that takes
place in the waste particles is why leaching occurs and the mass transport processes
from the fluid moving through the solid particles.
However, the amount of the metals release from municipal waste can be
expressed as a function of the availability for leaching which in turn represents the
amount of the total content of various compounds in the waste matrix itself. When a
fluid or particle diffuse though a waste matrix, the portion of metals that is released
can be determined by the solubility restrictions, thus this process can be referred as a
solubility controlled leaching process. In other circumstances of very soluble mineral
phases, leaching could be defined as availability controlled leaching.
Scientist and engineers has put a lot of time for developing new strategies in
order to obtain a reduction rate of releasing metal compounds from deposited ash.
Tough this can be done by removing metals from the ash. A review of thermal
treatment processes for MSWI ash reviled that, metals present in a reduced
environment had an increased in the release rate compared to metals present in a
oxidizing environment. [3] Due to the high energy consumption in thermal treatment
this process may be very expensive. [25] A way to stabilize ashes and make it more
“solider” is to mix it with cement and water, which results in agglomeration of the
material. By making ashes more stabilized it has shown a decrease in leaching of
metals and sulphates [3][1][4].

13
Leaching is a very common wet treatment for releasing metals from ashes.
Metals forming soluble compounds such as NaCl or KCl gets released more or less
independently of pH in the solution while many the solubility of other metal
compounds is very depended by the pH.[14] For example, cadmium solubility,
increases greatly with lower pH values, when the pH > 8 and the is applied for Lead
when the pH is less than 6 and when the pH is greater than 10. The reason for why
Lead can easily release metals at pH greater then 10 and pH lower then 6, because
many metals has the ability to form soluble cations in environments with low pH
values and likewise can form hydroxides at higher pH solution. [3][14]
Nevertheless, even tough it seems that the pH is the most dominant factor for
the releasing of metals from ashes it not the only factor. Another strong factor that
influence the release rate is, the size of particle it self, the mineralogy of the ash, the
chemical speciation of the metals, the redox potential in the mixture, the ability of
building ligands in the leaching liquid and the liquid-solid ratio, 𝐿
𝑠. [1][4]
The amount of leachate that interacts with a known amount of waste is usually
referred as liquid-solid ratios. The liquid solid ratio influences the release rate
(concentration) of metals. The 𝐿
𝑆 ratio is a result of climatic circumstances and the
features of the waste material. The solubility regulated leaching processes that was
mentioned above is characterized by the 𝐿
𝑆 which is almost linear depended by the
increased amount released of metals. [1][14]
Complex formation increases the leached amount while mineralogical
changes in the ash matrix, such as carbonation, as well as red-ox reactions, can lead
to both increased and decreased leaching. By using various types of leaching agents,
is another way to obtain a greater leaching so metals get released from the ashes. The
most common leaching method is; the acidic leaching. Many metal compounds have
greater solubility at lower pH solutions. Figure 4 below shows how the total amount
leached is depended by the and how the factors mentioned earlier effects the leaching. [1][3][4][14]
Figure 3. Influence of different processes on the metals solubility as a function of pH. Based on [14]

14
3.4 Recovery methods As mentioned earlier, heavy metals can cause a lot of damage on mankind.
Serious health effects such as, reduced growth and development, cancer, organ
damage, nervous system damage and even in some extreme fall cause death, can be
consequent if human life gets exposed to these kinds of chemicals [20]. To prevent
mankind from getting exposed from these kinds of chemicals, engineers are
constantly developing new technologies for the metal recovery from municipal waste.
When the metals are finally leached out from the ash they are present in ionic
form in the leachant. To obtain a valuable worth of these metals, the ions need to be
recovered with recovery methods, which depends on various factors [20][21].
3.4.1. Chemical precipitation This technique has long been one of the primary methods for the treatment of
metals in industrial waste. This process involves the conversion of soluble metals to
insoluble salts that will precipitate. By using filtration the precipitate can be removed
from the treated water. [20]
3.4.2. Flotation Flotation is more rapid and appropriate than filtration or centrifugation, and it is
suitable for operation at sampling spots[22]. There is mainly three types of flotations
process. This method is strongly depended by the formation of precipitate and the
removal by attachment to air bubbles. Due to the metal concentration, the
precipitation may proceed through metal hydroxide formation or as a salt with a
specific anion.
3.4.3. Adsorption Adsorption is mass transfer process where the material are transferred from a
liquid phase to surface of a solid phase. The metals that are present in ionic form are
adsorbed into a material or surface. This process offers a high quality on the effluent,
flexibility both in design and operation as well as it now well recognized as an
effective and low cost method for heavy metal wastewater treatment [21][22][30].
3.4.4. Ion exchange Ion exchange is another popular method for the removal of metals from
industrial waste. Depending on its surrounding material the ion exchanger is capable
of exchanging cations or anions. A disadvantage of this method is the matrix get
easily fouled by organics and another solid in the waste water and that’s why this
method is not the most accurate at handling solution that is concentrated with metals.
That it can’t handle concentrated metal solution because the matrix other wise this
method has a high removal efficiency and high treatment capacity. [21][24]
3.4.5. Membrane filtration Even though the mechanism is the same this method divided into four sub
categories, microfiltration, ultrafiltration, nanofiltration and reverses osmosis. For
each of these techniques, the main driven force can either be pressure, concentration,
vacuum or an electric field. The solids in the liquid are removed by setting a barrier
that prevent the solids to diffuse to the “other side”. Figure 5 shows an illustration of
membrane filtration. [22]

15
Figure 5. An illustration of membrane filtration.
In this thesis work, the analysis of metals concentrations from the leachate
Inductively coupled mass spectrometry; ICP-MS will be used as an analytical method
that will further be explained in details in section 4.4.
4. Experimental
4.1 Description of ashes Two MSWI ashes have been selected for investigation in this
experiment, ash A and ash B. Where the latter one is an ash collected
from a fluidized-bed with lime additives. Ash A is from collected from a
mass combustor with the help of an electric filter. No additives were
added in this ash. See table 4 for an easy overview of the ashes.
Ash Technique Additives
Ash A Mass- combustor None.
Ash B Fluidized-bed Lime. Table 4 An overview of investigated ashes.
4.2 Particle fractions Ash A and ash B were both divided into different particle fraction by sieving.
Particle size of each ash can been seen below in table 5.
Size (μm)
Ash A 36 64 150 300
Ash B Botten 36 63 -
Table 45 Particle size distribution for respective ash.

16
Figure 6 shows the different ash particles size for ash A that was used in the
experiment. Figure 7 shows the three sizes that was used for ash B.
Figure 6. Particle fractions 36, 63, 150 and 300 μm for ash A.
Figure 7. Particle fractions "botten", 36, 63 μm for ash B.

17
Figure 9 below shows the percentage of each particle fraction for ash A and B.
Figure 8. An illustration of each particle fraction in percentage for respective ash.
Worth mentioning is that, due the shortage of some particles (ash B) at the
different particle fraction same sizes couldn’t be applied.
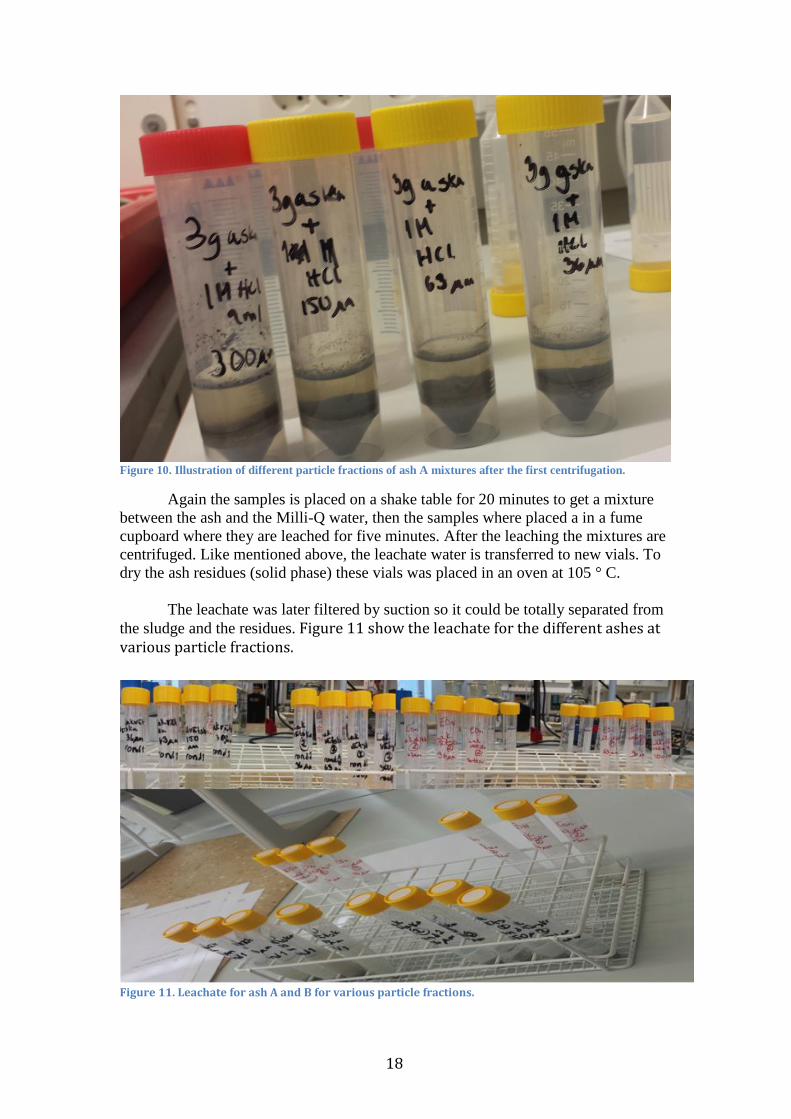
4.3 Experimental procedure 3 grams of specific ash particle fraction is weighed and dissolved into vials
with a solution of 9 ml 1 molar hydrochloric acid, HCL, 𝐿
𝑆= 3. Thereafter, the
solutions are placed on a shake table for 20 minutes so the mixtures could be stirred
and dissolve properly. After this the mixtures is put in a fume cupboard for five
minutes so that the leaching process can be started. In order to obtain an ash residue
and leachate water the samples are centrifuged at 3000 G for three minutes.
Figure 10 shows the four samples after the first centrifugation. The liquid
phase (leachate water) of each sample is transferred to new vials and to be further
analyzed with ICP-MS. 1.8 ml milli-Q was poured down in the vials contained the
solid phase (ash residue), 𝐿
𝑆= 0.6. The main purpose with washing the ash residue
with milli Q water is because so the ash residue gets “clean” from various solutes that
may be left from the first step.
18
Figure 10. Illustration of different particle fractions of ash A mixtures after the first centrifugation.
Again the samples is placed on a shake table for 20 minutes to get a mixture
between the ash and the Milli-Q water, then the samples where placed a in a fume
cupboard where they are leached for five minutes. After the leaching the mixtures are
centrifuged. Like mentioned above, the leachate water is transferred to new vials. To
dry the ash residues (solid phase) these vials was placed in an oven at 105 ° C.
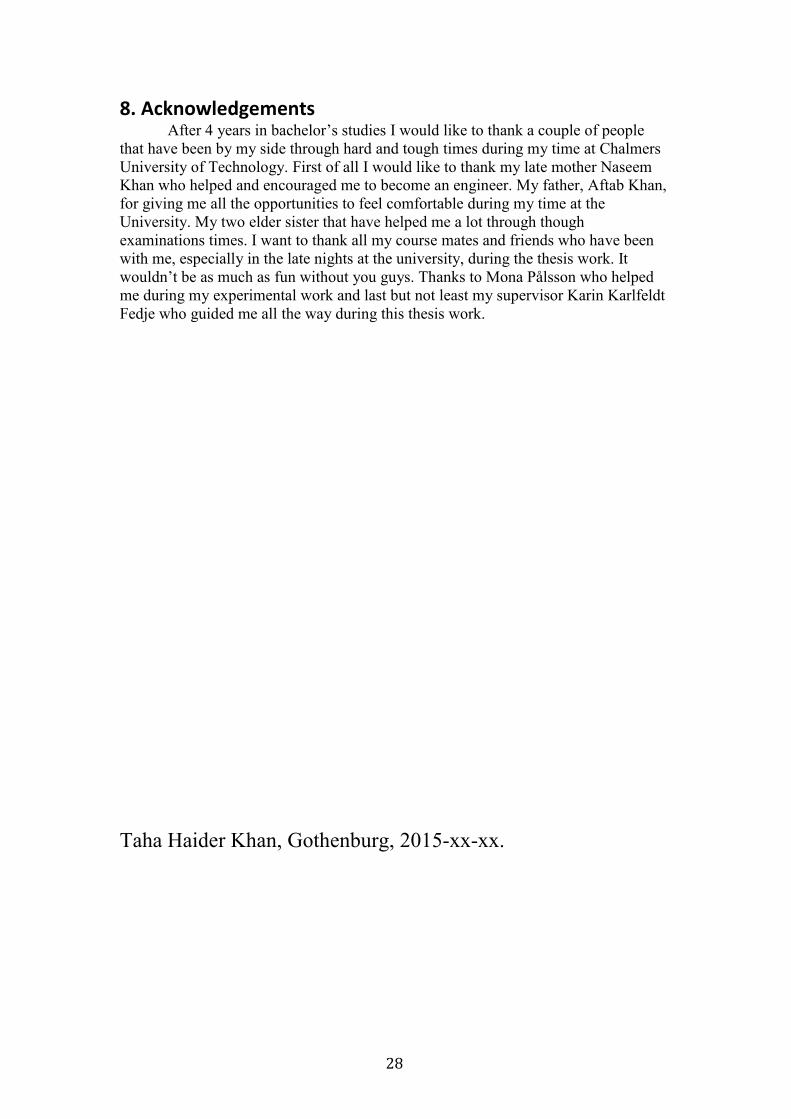
The leachate was later filtered by suction so it could be totally separated from
the sludge and the residues. Figure 11 show the leachate for the different ashes at various particle fractions.
Figure 11. Leachate for ash A and B for various particle fractions.

19
Figure 12 shows a shemactic flow scheme of the lab process
4.4 Analytical method- ICP-MS After the filtration and the drying process all samples were further analyzed at
an external lab with Inductively coupled plasma mass spectrometry, ICP-MS. Figure
12 shows the instrumental setup for ICP- MS.
Figure 12. Basic instrumental setup for ICP-MS. Adapted from R. Thomas, Practical Guide to ICP-MS: A Tutorial for Beginners, CRC Press, Boca Raton, 2nd edn. (2008).
ICP- MS is a worldwide technique and is unquestionably the fastest growing
technique for tracing various elements.[27] This technique was commercially
introduced in the early 1980’s.[26] ICP-MS allow the detection of most elements in
the periodic table. Figure 13 shows elements that can be detected with this technique.
3g of each ash at specific particle fraction is leached in 1 M HCl for 5 min.
Mixtures are centrifuged are centifuged for 3 min at 3000 G
Obtained ash residue is leached for 5 min once again with milli Q water.
Mixtures are centrifuged for 3 min at 3000 G.
Leacahte
ICP- MS analysis.
Ash residue are dried at 105 C
Leachate
ICP- MS analysis.

20
Figure 13. Elements that is detectable with ICP- MS.
Because of the high temperature, approximately 7000K, that occurs within the
plasma ICP- MS suitable for liquid samples, such as leachate. ICP- MS gives a
number of advantages such as,
Multi element analysis
Quantification to metals
High sensitivity
Detection limits
The ability to get isotopic information
Handling of complex matrices
Determination of isotope ratio information
Speed of detection/analysis. [18][27][26]
When the samples are introduced in the ICP-MS system the atoms of each
element are ionized with the help of a nebulizer or using a laser to directly convert the
samples into ions. To enter the mass spectrometer theses samples are carried out in
argon gas. Once the ions reach the mass spectrometer they are separated by using the
quadruople mass separator[18]. Figure 14 illustrates this separation technique.

21
Figure 14. Illustration of the quadurople mass separator.
The quadurople mass separator is mainly build up by four different rods to
which are applied both a constant voltage and a radiofrequency voltage. Since this
specific voltage that is applied to the rods only a few ions with the most accurate 𝑚𝑎𝑠𝑠
𝑐ℎ𝑎𝑟𝑔𝑒 ratio manage to travel through the ion chamber to the analyzer. Other ions
collide with the rods and are lost before they reach the detector.
4.5 pH measure The pH values were measured with for each leachate for particle fraction
63μm using a WTW pH-electrode SenTix 41-3 with a Muliti 35i.
5. Results
5.1 Total content of Cu, Pb and Zn in ash A and B at various particle fraction. The main focus in this results section will be on Copper, Lead and Zinc
because of the fact that both ash A and ash B had the most highest content of these
three metals element which is presented in table 6 below.
Solvent Cu, initial,(mg/kg) Pb, initial(mg/kg) Zn, initial (mg/kg)
Ash A 36μm Acid 2600 4150 36400
Ash A 36μm Water 2600 4150 36400
Ash A 63μm Acid 2050 3200 26700
Ash A 63μm Water 2050 3200 26700
Ash A 150μm Acid 2500 4970 38100
Ash A 150μm Water 2500 4970 38100
Ash A 300 μm Acid 2570 5130 37800
Ash A 2 300μm Water 2570 5130 37800
Ash B < 36 Acid 6280 3470 10700
Ash B < 36 Water 6280 3470 10700

22
Ash B 36μm Acid 5320 2830 9050
Ash B 36μm Water 5320 2030 9050
Ash B 63μm Acid 4160 1910 32400
Ash B 63μm Water 4160 1910 32400 Table 6. Illustration of the total containment of Cu, Pb and Zn in the ashes.
5.2 Release of metals Further below in this section, three tables will be presented, one for each
metal element. In these tables there are two interesting parameters; Creleased and %
total release. Where the latter one is a measure of how much of each element leached
of the ash matrix at specific particle fraction, which is expressed in percentage. The
first parameter, Creleased, is how much metals are released from the ashes, expressed in
mg/kg. These three tables will be filled with data so to clarify these table, three
graphs will also be presented for each element for the illustration of total release
expressed in percentage of each metal at various particle fraction.
5.2.1 Leaching of Copper Sample Solvent C released (mg/kg) % Released % Total release
Ash A Leachate 1 36μm Acid 693 27 28
Ash A Leachate 2 36μm Water 289 1
Ash A Leachate 1 63μm Acid 325 16 16
Ash A Leachate 2 63μm Water 9 0
Ash A Leachate 1 150μm Acid 537 21 22
Ash A Leachate 2 150μm Water 5 0
Ash A Leachate 1 300μm Acid 609 24 25
Ash A Leachate 2 300μm Water 13 1
Ash B Leachate 1 < 36 Acid 11 0 0,2
Ash B Leachate 2 < 36 Water 1 0
Ash B Leachate 1 36μm Acid 2 0 0,0
Ash B Leachate 2 36μm Water 0 0
Ash B Leachate 1 63μm Acid 11 0 0,3
Ash B Leachate 2 63μm) Water 2 0 Table 7. Amount of Copper leached from the ash A and B.
Figure 15. Two plots showing the percentage of the Copper release at each particle fraction for both ashes.

23
5.2.2 Leaching of lead Sample Solvent C released (mg/kg) % Released % Total release
Ash A Leachate 1 36μm Acid 1377 33,18 35
Ash A Leachate 2 36μm Water 77 1,87
Ash A Leachate 1 63μm Acid 723 22,59 30
Ash A Leachate 2 63μm Water 234 7,33
Ash A Leachate 1 150μm Acid 1470 29,58 30,
Ash A Leachate 2 150μm Water 22 0,45
Ash A Leachate 1 300μm Acid 1608 31,35 31
Ash A Leachate 2 300μm Water 27 0,53
Ash B Leachate 1 < 36 Acid 23 0,65 1
Ash B Leachate 2 < 36 Water 0,9 0,03
Ash B Leachate 1 36μm Acid 1 0,04 < 1
Ash B Leachate 2 36μm Water 0 0,00
Ash B Leachate 1 63μm Acid 38 1,96 1,98
Ash B Leachate 2 63μm Water 0 0,02 Table 8. Amount of Lead leached from ash A and B.
Figure 16. Two plots showing the percentage of the Copper release at each particle fraction for both ashes.

24
5.2.3 Leaching of Zinc Sample Solvent C released (mg/kg) % Released % Total release
Ash A Leachate 1 36μm Acid 16710 45,91 51,51
Ash A Leachate 2 36μm Water 2040 5,60
Ash A Leachate 1 63μm Acid 10170 38,09 42,18
Ash A Leachate 2 63μm Water 1092 4,09
Ash A Leachate 1 150μm Acid 16650 43,70 47,20
Ash A Leachate 2 150μm Water 1332 3,50
Ash A Leachate 1 300μm Acid 16470 43,70 47,32
Ash A Leachate 2 300μm Water 1416 3,75
Ash B Leachate 1 < 36 μm
Ash B Leachate 2 < 36 μm
Acid
Water 104,1
571,2
0,97
5,34 6,31
Ash B Leachate 1 36μm Acid 118,2 1,31 3,29
Ash B Leachate 2 36μm Water 179,4 1,98
Ash B Leachate 1 63μm Acid 209,4 0,65 5,04
Ash B Leachate 2 63μm Water 1422 4,39 Table 9. Amount of Zinc leached from ash A and B.
Figure 17. Two plots showing the percentage of the Lead release at each particle fraction for both ashes.
5.4 pH Value The pH value for all leachates for both ashes at particle fraction 63μm was
measured by using a pH meter. Table 10 below shows the obtained pH values
for each leachate.
Ash Sample Particle Fraction pH Value
Ash A leachate 1 63μm 1,97
Ash A leachate 2 63μm 4,20
Ash B leachate 1 63μm 3,05
Ash B leachate 2 63μm 4,85 Table 10. pH value of each leachate for particle fraction 63μm for both ash.

25
6. Discussion As expected, the results from the tables and figures shown in 5.3 that the
leaching percentage of the various is much greater in the smallest fraction for all
metals. The metals concentration increased while the particle size decreased. This is
mainly because of that smaller particles contain more metals then bigger particles [4][12]. The results were similar for respective ashes for each element. The highest
release percentage was obtained from Zinc at total release percentage at 51,5 which
can be seen in table 10 in 5.2.3. The Zinc will react with the HCl according to the
reaction1 below.
Zn + 2HCl → H2 + ZnCl2 (1)
Reaction 1 is an example of a redox reaction. The Zinc will further reacts with
the hydrochloric acid it will lose an electron while the hydrogen will be reduced by
gaining the electron to form a neutral molecule, H2. The second highest release
percentage can be seen in table 9 in 5.2.2 which was obtained for Lead at 35,0 %.
Like wise reaction 1, Lead will also react with the hydrochloric acid as it results in
hydrogen gas in the mixture and a chloride compound as in reaction 2.
Pb + 2HCl → H2 +PbCl2 (2)
The results also indicate that there is a huge difference between ash A and ash
B. From all three tables in section 5.2 one can clearly see that the total amount release
of each element in ash B is much lesser comparably with ash A. This can be because
of the fact that ashes are collected from different treatment processes, fluidized bed
and mass burn combustor. Ash B is much more “compact” (see figure 7 in 4.2) then
ash A that can also be an explanation that it more difficult to recover metals from ash
B. That it may demand more energy to leach out various metals from the ash matrix.
Another way to leach out a higher rate of metals from ash B could also be to lower
the pH value, as the leaching is strongly depended by the pH value. Several
researchers, such as Karlfeldt and co workers, have declared that, at lower pH value
the release rate of leaching metals is increased. However, this may not totally true
because of the fact that some metals, e.g., Pb and Zn, also increase their leaching
ability at higher pH values (>9). From the tables obtained in section 5.2 it’s quite
clear that Zinc is the element with the highest percentage that leached out of the
ashes. But what has to be mentioned is that even though Zinc was the element with
highest release percentage one still has to consider the initial amount of Zinc in the
ash, 36400 mg/kg (table 6) for the particle fraction 36μm. But in this scenario, the
Zinc for 36μm also had the most initial mass rate that also can be the reason why it
leached out as much as it did. But just because of the fact that Zinc had the highest
intial amount, it doesn’t always has to the element with the highest content that
leaches out the most. For example let say that what if we had 3 Copper particles in a
specific fraction, and 2 of them leached out from the ash matrix, then automatically
that will result in 63% leached out, which in this example is very unessential. The
result also confirmed that theory about that there are higher amount of metals in
smaller particle fractions is true for ash A, while this theory may differ a bit for ash
B. The highest release percentage for ash B was found for Zinc (36μm) with an initial

26
amount of 10700 mg/kg (table 6) and 104,1 mg/kg (table 9) leached out. But for
Copper and Lead the highest percentage was leached out for particle fraction 63μm.
For lead it was 1,98% and for Copper 0,3%.
Like mentioned previously, the theory about finding higher amount of metals
in smaller particle fraction differed a bit for ash B. For Copper the smallest particle
fraction released 0,2 % and for Lead it was 0,68%. For Lead this theory only differed
with 1.3 %(=1,98-0,68) and for Copper 0,1%(=0,3-0,2). But what also need to be
mentioned, even though the highest leaching percentage for Copper was at particle
fraction 63μm compared to < 36μm the initial amount of Copper was higher for the
smaller fraction with, 6280 mg/kg while the initial amount for 63μm was at 4160
mg/kg and the same was for Lead. The highest leaching percentage was obtained for
particle fraction 63μm for Lead and the second highest leaching percentage was for
particle fraction < 36 μm and it differed with 1,3 %. The initial amount of Lead for <
36 μm was only 3470 and it leached out 22,7 resulting that only 0,68% leached out
for this particle fraction.
However, the leaching percentage and the recovery of each element seems
quite low even for Zinc (51,51%). To optimize and to further obtain a higher release
percentage of these metal elements, this process can be further be optimized by using
a lower pH value, other values on L/S or maybe even use a longer time for the
leaching process.
Another part that could also influence of leaching of metals is the L/S ratio,
which can be confirmed by table 7,8 and 9. The leachate 2 of both ashes obtained
very low concentration values for various metals and this is can vary on the low L/S
ratio (=0,6) that was used in these mixtures compared to the L/S ratio (=3) used in the
leachate 1.
The fact that Copper may has the highest reduction potential value at 0,34
while Lead has -0,13 and Zinc -0,76 may also be an explanation that Copper had the
lowest concentration among the metals.
The results from 5.4 showed that leachate 2 for Ash B had the highest pH
value at 4,85 (table 10) while the leachate 1 for ash A had the lowest. This may be
because of leachate 2 for ash B only consist the ash residue and the milli-Q water,
that was added to the mixture for removal of various solutes on the ash matrix and
that it had a much smaller L/S ratio then leachate 1 for ash A. The leachate 1 for ash
A contained hydrochloride acid and the ash matrix with various metals that reacted
with the acid forming metals in ionic which in turn may influence the pH value.
What also need to be mentioned is that there is studies that has revealed that
in the near future there will be lack of metals. So by using these kind of techniques
for the recovery of metals is necessary
The idea of sieving ashes in various particle fraction is a unique way to leach
out metals because of the fact that if sieving is not applied it may be harder to get out
a greater amount of metals. In this experiment one can see that the incineration
technique for these ashes also plays a huge role as the leaching ability for ash B

27
differs quite much from ash A. An explanation to this could also be that in ash B lime
is added as a additive that may inhibit the metals to leach from the ash matrix.
7. Conclusions
The highest concentration of the metals was Zinc.
The results confirmed that, low pH value influences the release
rate of metals.
The results conclude also that lower particulate levels contain
more metals
The results show, that the leaching ability can vary widely due
what incineration technique has been applied.
28
8. Acknowledgements After 4 years in bachelor’s studies I would like to thank a couple of people
that have been by my side through hard and tough times during my time at Chalmers
University of Technology. First of all I would like to thank my late mother Naseem
Khan who helped and encouraged me to become an engineer. My father, Aftab Khan,
for giving me all the opportunities to feel comfortable during my time at the
University. My two elder sister that have helped me a lot through though
examinations times. I want to thank all my course mates and friends who have been
with me, especially in the late nights at the university, during the thesis work. It
wouldn’t be as much as fun without you guys. Thanks to Mona Pålsson who helped
me during my experimental work and last but not least my supervisor Karin Karlfeldt
Fedje who guided me all the way during this thesis work.
Taha Haider Khan, Gothenburg, 2015-xx-xx.

29
9. Reference
[1] Lassesson, H., Karlfeldt Fedje, K. och Steenari, B. (2014) Leaching for
recovery of copper from municipal solid waste incineration fly ash: Influence of ash
properties and metal speciation.
[2] Swedish Waste Management, 2014
[3] Karlfeldt Fedje, K. (2010) Metals in MSWI fly ash - problems or
opportunities?. Göteborg : Chalmers University of Technology (Doktorsavhandlingar
vid Chalmers tekniska högskola. Ny serie, nr: 3067).
[4] T. Sabbas, A. Polettini, R. Pomi, T. Astrup, O. Hjelmar, P. Mostbauer, et
al., Management of municipal solid waste incineration residues, Waste Management,
23.(2003) p. 61-88.
[5] Svensk Avfalls Hantering 2013
[6] Guangren Qian, Yali Cao, Pengcheong Chui, Joohwa Tay (2005) et al.,
Utilization of MSWI fly ash for stabilization/solidification of industrial waste sludge,
[7] Gupta, L.P., Kawahata, H., Takeuchi, M., Ohta, H. & Ono, Y., 2005.
Temperature and pH Dependence of Some Metals Leaching from Fly Ash of
Municipal Solid Waste. Resource Geology, 55(4), pp. 357-372.
[8] Marelene Preiss 2013, Method Development to recover Zinc from Fly Ash
originating from Municipal Solid Waste Incineration in Sweden
[9] Karlsson, S., Carlsson, P., Åberg, D., Karlfeldt Fedje, K., Krook, J. och
Steenari, B. (2010) What is required for the viability of metal recovery from
municipal solid-waste incineration fly ash? - Design and assessment of a process
plant for copper extraction.
[10]http://www.avfallsverige.se/avfallshantering/energiaatervinning/tekniken/
[11] RVF Rapport 01:14 ISSN 1103-4092 ISRN RVF-R--01/14—SE,
Dioxin ut ur kretsloppet- Forbranning av avfall binder giftet. ]
[12] Lam CHK, Ip AWM, Barford JP, et al. (2010) Use of Incineration MSW
Ash: A Review. Sustainability, MDPI AG, 2(7), 1943–1968, Available from:
http://dx.doi.org/10.3390/su2071943.
[13] Towards a greener future with Swedish waste - to-energy The world’s
best example, Available from:
http://www.avfallsverige.se/fileadmin/uploads/forbranning_eng.pdf
[14] C. Wiles, Municipal solid waste combustion ash: State-of-the-

30
knowledge, Journal of Hazardous Materials (1996) p. 325-344
[15] Robert T, 2013, Practical Guide to ICP-MS: A Tutorial for Beginners,
Third Edition (E-book from Google). Available from:
https://books.google.se/books?id=c3_NBQAAQBAJ&printsec=frontcover&hl=sv&s
ource=gbs_ge_summary_r&cad=0#v=onepage&q&f=false
[16] X. Kuang, G. Ying, V. Ranieri, J. Sansaolne, Examination of Pervious
Pavement Pore Parameters with X-Ray Tomography (2007)
X. Kuang, G. Ying, V. Ranieri, J. Sansalone
[17] Petterson A, Karlfeldt Fedje K, Andersson S, Modin O, Frändegård P,
(2013) Metal recovery with focus on Zn from fly ash de- rived from waste combustion
by means of acid process waters
[18] Harris D, Quantitative Chemical Analysis, 8th edition (2011)
[19] RVF rapport 2005:02, ISSN 1103-4092 , Avfall blir värme och el En
rapport om avfallsförbränning.
[20] Kalogirou. E, Themelis. N, Samaras. P, Karagiannidis, Kontogianni ST,
Fly Ash Characteristics From Waste-to-Energy Facilities and Processes For Ash
Stabilization
[21] M.A. Barakat, New trends in removing heavy metals from industrial
wastewater (2010)
[22] MEMBRANE FILTRATION GUIDANCE MANUAL
[23] Masataka Hiraide, Tetsumasa Ito, Masafumi Baba, Hiroshi Kawaguchi,
and Atsushi Mizuike Multielement Preconcentration of Trace Heavy Metals in Water
by Coprecipitation and Flotation with Indium Hydroxide for Inductively Coupled
Plasma-Atomic Emission Spectrometry
[24] Preiss, M. Method Development to recover Zinc from Fly Ash originating
from Municipal Solid Waste Incineration in Sweden (2010)
[25 ] Wikman K, Berg M, Bjurström H och Nordin A; ”Termisk rening av
askor”, Värmeforsk, Stockholm 2003, rapport nr 807

![NUCL 1 [512295]: Determination of heavy metals and …prosper.cofc.edu/~nuclear/2002Orlando223Abstracts.pdfNUCL 1 [512295]: Determination of heavy metals and their leaching characteristics](https://img.pdfslide.us/doc/110x75/5b2ba5ac7f8b9a594c8b7390/nucl-1-512295-determination-of-heavy-metals-and-nuclear2002orlando223abstractspdfnucl.jpg)