Embed Size (px)
Citation preview
! 1!
Visualizations+of+advanced+innovation+projects+:+examining+the+practices+of+
project+managers.
Apolline Le Gall
PhD student in Management
Univ. Grenoble Alpes, F-38040 Grenoble
CNRS, CERAG, F-38040 Grenoble
France
Mail: [email protected]
! 2!
Visualizations+of+advanced+innovation+projects+:+examining+the+practices+of+
project+managers.
As they look for new ways of creating value, more and more industrial groups
implement strategies which consist in mixing the different types of innovation:
technological innovation, user-centered innovation, service innovation, business
model innovations… One of the issues for innovators in order to achieve those
strategies is to have at their disposal some tools that allow them to design those
innovations that do not exist yet, to collaborate with different actors and to
support the complexity of their ideas.
Among those tools, visualizations, seem to be an important matter: sketches, 3D
renderings, mockups, storyboards, maps, post-it ®, photos, videos, … all those
visualizations are produced and mobilized during the design process. They are
handled by different actors and seem to play an important part by allowing
materializing ideas, communicating them, exchanging them, and debate them…
But in spite of the attention that more and more actors of the innovation and
design processes pay to them, the parts, functions and characteristics of those
visualizations remain little studied.
Our study concerns the case of the “Innovation Platform”, which was implemented
in 2001 by Schneider Electric, a French industrial group specialized in power
distribution and industrial automation. While other branches of the group have
adopted a technological approach of innovation (especially the units in charge of
product range renewal) this “Innovation Platform” is responsible for the
elaboration of innovative concepts by adopting a “user-centered” approach
(Darene, Romon, 2006; Olsen and Welo, 2011). This approach assumes that the
value of innovative concepts could come from the resolution of a client’s problem:
with observations and interviews, projects managers identify a problem in their
clients’ lives (called a “pain point”), to which they invent an innovative solution that
will allow the company to meet its clients’ expectations while delivering a
profitable offer (Olsen and Welo, 2011).
! 3!
At this “Innovation Platform”, project managers handle many different
visualizations on a daily basis. Those visualization practices were progressively
invented, modified by the project managers who now ponder about their strategic
impact (Tsoukas, 2010): as a materialization medium, they allow them to visualize
and communicate their ideas and they are at the heart of many conversations
between themselves and the numerous actors involved in the design process,
especially during episodes in which managers decide to launch or stop the
development of the concepts into products. They spend a lot of time and energy
choosing them, building them and discussing them. The issue of the visualization
practices for designing innovative concepts turn out to be crucial for the success of
Schneider Electric’s strategy, since those innovative concepts are expected to
competitive offers for the company.
Our study is aimed at addressing a practical issue from the field: Schneider’s
innovation managers have expressed the need to better understand their
visualization practices in the context of a strategic process: the production of
innovative concepts. They wanted to understand which visualizations they should
use, when, with what effects, in order to make better use of them, and, thus,
possibly improve the quality of their innovation proposals.
In our opinion, the “Strategy as Practice” approach seems to be appropriate to
tackle this particular issue insofar as it allows us to consider “Strategizing” as a
socially-situated activity articulating practioners – actors involved in the strategic
activity, Praxis – the individual practices - and practices – acknowledged ways to do
things (Jarzabkowski et al., 2007). Following the example of Hodgkinson, et al.’s
(2006) analysis of strategy workshops, Jarzabkowski and Seidl’s (2008) analysis of
strategy meetings, or Jarrat and Stiles’ (2010) analysis of the uses of analytical tools,
this approach will allow us to analyze to what extent these tools and methods
impact both on the process and the outcome of the strategic activity (Vaara and
Whittington, 2012), and to question the role of the materiality of these objects in
this activity (Orlikowski and Yates, 1994 ; Levina and Orlikowski, 2009).
Some studies have analyzed the role and characteristics of those visualizations in
the design process with the notion of “intermediary objects”,. They have shown
that those artifacts circulate between actors and how those actors negotiate and
! 4!
coordinate themselves around them (Vinck and Laureillard, 1995). Those studies
have shown that the analysis of such objects allowed disclosing design
configurations, i.e. organizational structures of the design processes (Mer, 1994),
and modes and conventions of coordination between actors (Vinck, Laureillard,
1995). They support fundamental processes of representation, mediation,
prescription, interaction facilitation between actors (Vinck, Laureillard, 1995): those
objects play a part in the mediation between designers and end-users (Luck, 2007),
in the communication of the design principles (Erickson, 1995) and in the
acquisition and materialization of knowledge about the designed product
(Ewenstein, Whyte, 2007).
Those studies have highlighted the crucial place of objects. They assign
visualizations a role as representations of the future objects and instrument of
coordination and negotiation between actors (Mer et al., 1995), but one could
assume that those objects have other functions in the strategic deliberations and
decisions, which is the perspective adopted here. For instance, Kaplan (2011)
observed the role of Power Point presentations in strategy meetings and showed
how “clumsy” presentations could disturb strategic initiatives, while Heracleous
and Jacobs (2008) examined how Lego bricks could contribute to forge a common
understanding of the stakes and lead to consensus on the strategy to adopt in
senior management teams.
Accordingly, to our knowledge, studies adopting an “intermediary objects”
approach have tended to focus, so far, on the coordination role of visualizations,
while studies adopting a “strategy as practice” approach haven’t looked at the
design process of innovations yet. Therefore, they cannot provide a pragmatic
answer to this question of the project managers: which visualization tools should
they use, when and what for?
The study aims, thus, theoretically, at renewing the approach of the intermediary
objects in a strategic perspective in order to extend the spectrum of possible roles
of visualizations beyond collaboration, and especially to consider their role in the
decision-making process. From a managerial perspective, the study aims at
providing the Innovation managers with keys for understanding their visualization
practices, in order to better master them.
! 5!
In order to do that, the first part of our paper suggests analyzing visualizations as
intermediary objects in a strategic perspective. We will then present the research-
action methodology used for our research. It was carried out during a six months
immersion at the Innovation Platform of Schneider Electric. Among two teams of
project managers, we gathered data composed of observations, visualizations
analysis and interviews. This allowed us to elaborate a model of the project
managers’ practices of visualizations, presented in the third part of this paper. The
conclusion and discussion part suggests limits and research perspectives to our
study.
1. Visualizations practices as Intermediary objects in a “strategy as practice”
perspective
In order to analyze the visualization practices of the project managers, we suggest
using the concept of “intermediary objects”. This concept allows us to analyze the
“hybrid nature” of visualizations: they are at the same time visualizations of a future
product that does not exist yet and instruments of cooperation and coordination
between the actors of innovation (Mer et al., 1995).
However, we argue further that project managers’ visualization practices (such as
sketches, storyboards, 3D renderings, maps, mock-ups…) have a “strategic” role.
We will here follow Jarzabkowski et al.’s (2007) definition, for whom strategy is « a
Socially-accomplished activity, constructed through the actions, interactions and
negotiations of multiple actors and the situated practices upon which they draw (…)
That has consequential outcomes for the direction and/or survival of the group,
organization or industry”. The “strategy as practices” approach suggests that this
strategic activity (strategizing) relies on the articulation between praxis: the
concrete activity of an individual at a local level; practices: accepted ways of doing
things between actors routinized through time, which interact with the individual
ones; and practioners: the actors linking praxis and practices (Jarzabkowski et al.,
2007).
! 6!
We argue that visualizations can be analyzed as strategic practices in the context of
Schneider’s Innovation Platform. Firstly, the elaboration and mobilization of those
tools both impact the process and the outcome of the design process
(Jarzabkowski et al., 2007). This design process is here understood as a strategic
activity: projects managers propose innovative concepts that are supposed to
differentiate and make the company more competitive if/when developed into
concrete offers (Sääskilathi, 2011). Secondly, the project managers, as practitioners,
strategically invest at their local level the choice of the visualizations, their
elaboration and their mobilization: in order to work out their concepts, but also to
rely on them during different situations in the process. Moreover, this seems to be
one of the reasons why they question themselves about those practices.
Studies adopting a “Strategy as Practices” approach, as well as studies adopting an
“intermediary objects” approach show that the nature, role and characteristics of
such objects are not intrinsic properties: the status of the object is always
coproduced in the action and bound to its use context (Mer et al., 1995; Vinck, 2009
Jarzabkowski et al., 2007).
We argue that this use context can be characterized by:
- The knowledge embodied by the visualizations (Ewenstein and Whyte,
2007): visualizations are “artifacts of knowing”, the nature of information
embedded in the visualizations defines their role in the design process
(Ewenstein and Whyte, 2009; Mer et al., 1995).
- The actors who produce and mobilize visualization tools: they are
inextricably linked to the actors with whom of for whom they are crafted
(Luck, 2007; Mer et al., 1995; Jarzabkowski et al., 2007).
- The intentions for which they are produced: actors produce and mobilize
visualization tools because they assign them a role in the progress of their
design process (Ewenstein and Whyte, 2007; Erickson, 1995; Tsouskas,
2010).
Our analysis, hence, intends to analyze the visualization practices of Schneider
Electric’s Innovation Managers during the design process of innovative concepts
with the notion of intermediary objects and in a strategic perspective. We will
interrogate who, when, why and how these visualizations are produced in the
! 7!
context of the design process of innovation concepts, by studying different use
contexts of those visualizations, characterized by three aspects : the knowledge
they embody, the actors they involve, the intentions with which they were initially
produced.
2. Methodology
This study is based on a research-action methodology. We performed a 6 months
immersion at Schneider Electric’s Innovation Platform (from January to July 2012)
among a team specialized in energy production and a team specialized in
industrial asset management, that is to say fifteen people, of which tem were
project managers. This immersion allowed us to following up on three projects of
innovative concepts of products, with different states of progress: the first one was
rather advanced when I arrived, since the team was just about to carry out users’
tests, while the second one was less advanced, and the third one was at the very
beginning.
We were also able to have a retrospective review of three projects considered as
over as far as the Innovation Platform was concerned: either because their
development had been decided by the company and the projects had been,
hence, handed to another team, or because the projects were cancelled or put on
stand by by the upper management.
We were able to gather data composed of:
- Observations (participant and non-participant observations) of working
sessions, meetings, creativity and brainstorming sessions, regarding the
three ongoing projects
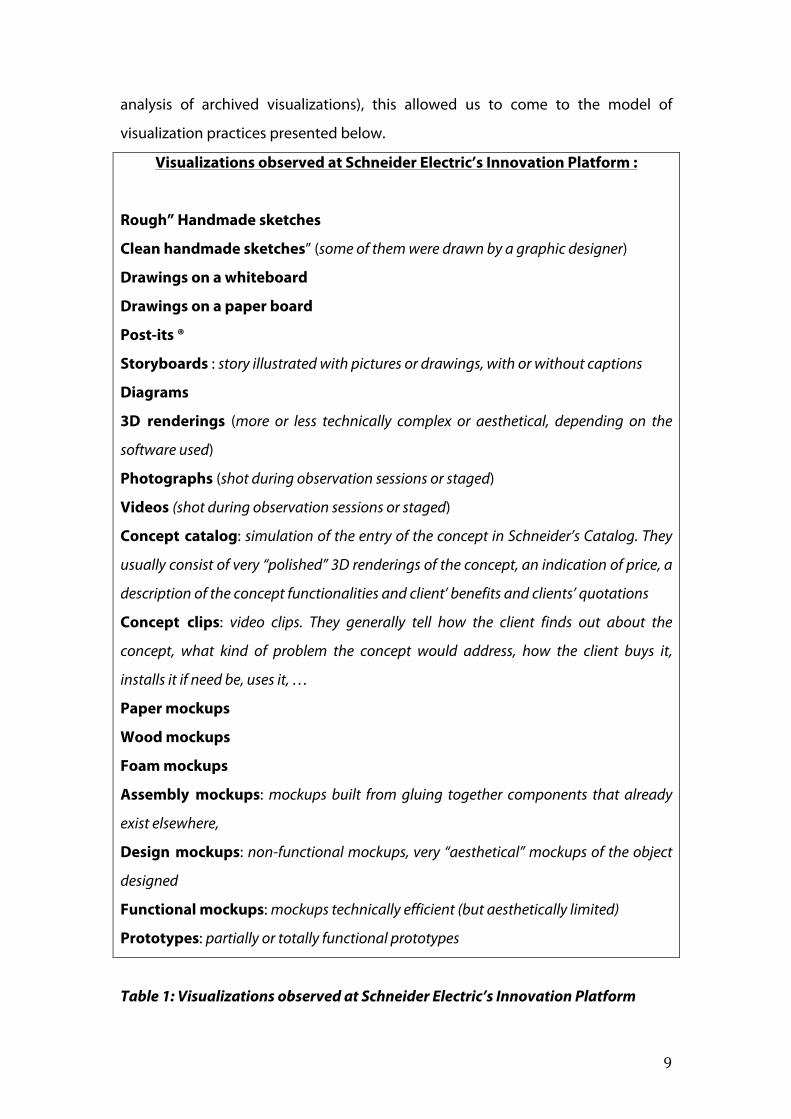
- Inventory and analysis of the visualizations produced in my presence and of
the ones archived at the Platform regarding the three “finished” projects
(Table 1 presents all the different visualizations we could observe)
- Eight semi-directive interviews with project managers.
These data were treated according to the approach presented earlier: we analyzed
visualizations as intermediary objects in a strategic perspective, embedded in a use
context characterized by the knowledge they embody, the concerned actors and
! 8!
the projected intentions, in order to establish a model of project managers’
visualization practices during the design process.
The interviews were all recorded and lasted on average an hour and a half.
They were based on an interview guide composed of about forty questions about:
the composition of innovative concepts and their value, about the actors for which
they would produce visualizations, the reason why they initially produced them,
the most frequently used visualization tools, the reason why and the frequency
with which they would mobilize different tools, the time they would spend
producing them, the projects that they were currently working on and the
visualizations related.
Our study was carried out in three phases. The first phase was meant to identify the
use contexts in which the visualizations are produced or mobilized: we coded the
interviews and observations according to any elements referring to the knowledge
that the visualizations embodied, the actors involved in their production or
mobilization, the intentions with which they were mobilized, independently of the
visualization tools named by the interviewees. This first phase lead us to identify
the different types of knowledge embedded in the visualizations (use, objects,
business, or the three of them), the different actors involved during the design
process at the Innovation Platform (the team, the managers, the clients), and the
different intentions (explore, test, argue ; see below).
In a second phase we matched the visualizations with, on one hand, the different
types of knowledge, on the other hand, with the different actors involved, and
finally, with the different intentions identified.
This led us to three classifications of the production and mobilization of the
visualizations: by knowledge, by actors and by intentions.
Then, we carried out a second reading of the interviews meant to identify the
effects and characteristics of these visualizations in these use contexts, by coding
the effects of the production or mobilization of these visualizations on the design
process and on the actors involved.
Associated with real time observations of situations of production and mobilization
of visualizations and with the material analysis of the visualizations (including the
! 9!
analysis of archived visualizations), this allowed us to come to the model of
visualization practices presented below.
Visualizations observed at Schneider Electric’s Innovation Platform :
Rough” Handmade sketches
Clean handmade sketches” (some of them were drawn by a graphic designer)
Drawings on a whiteboard
Drawings on a paper board
Post-its ®
Storyboards : story illustrated with pictures or drawings, with or without captions
Diagrams
3D renderings (more or less technically complex or aesthetical, depending on the
software used)
Photographs (shot during observation sessions or staged)
Videos (shot during observation sessions or staged)
Concept catalog: simulation of the entry of the concept in Schneider’s Catalog. They
usually consist of very “polished” 3D renderings of the concept, an indication of price, a
description of the concept functionalities and client’ benefits and clients’ quotations
Concept clips: video clips. They generally tell how the client finds out about the
concept, what kind of problem the concept would address, how the client buys it,
installs it if need be, uses it, …
Paper mockups
Wood mockups
Foam mockups
Assembly mockups: mockups built from gluing together components that already
exist elsewhere,
Design mockups: non-functional mockups, very “aesthetical” mockups of the object
designed
Functional mockups: mockups technically efficient (but aesthetically limited)
Prototypes: partially or totally functional prototypes
Table 1: Visualizations observed at Schneider Electric’s Innovation Platform
! 10!
3. Main Results
3.1. Types of visualizations and knowledge building
With regards to the knowledge that visualizations embody, our analysis reveals
that the innovative concepts produced by the Innovation Platform are based on
three major aspects: use, object and business.
As mentioned earlier, the Innovation Platform champions a « user-centered »
approach. Therefore, it is not surprising to notice that the innovative concepts
include proposals in terms of clients’ needs, benefits that the concept would
provide and their translation into functionalities. In other words, a part of this
concept deals with its use, both utility and usability (Candi, 2006). Eventually, the
proposal materialized by visualizations, is supposed to answer a set of question
about which “pain point” the object will address, how, and how it will be used.
The concepts also include proposals in terms of technical requirements and
functioning as well as aesthetical aspects, that is to say proposals about the very
object (both its technical and aesthetical properties; Ewenstein, Whyte, 2009 ;
Candi 2006. Eventually, the concept and its visualizations would answer questions
about what the object will look like and how it will work.
Finally, in order to be profitable for the company, this concept also takes into
account key factors impacting the market and the value for the company, that is to
say, proposals concerning the business aspect of the concept. Eventually, the
concept embodied by visualizations is supposed to answer question about the way
the company will create and capture value from this concept (Sääskilahti, 2011).
Our analysis shows that project managers produce different types of visualizations
according to the different facets of the concept they need to embody, as one of
them notes: “there are different types of tools, according to what we are looking for”.
When they want to picture the “Use” aspect of the concept, project managers
produce observations or staging of the use context and of the manipulation that
they envision for their concepts (for example with photographs, storyboards or
videos). For instance, one of the project managers shot a scene in which an
electrician was opening a connector terminal in order to “observe the ease in use:
! 11!
will I be able to repair it? Can I reach the buttons? How many screws are there? How
many tools will I need?”.
When they want to dig into the “Object” aspect of the concept (“technical” and/or
“aesthetic” aspect; Ewenstein and Whyte, 2007), the visualizations used would
rather be drawings (drafts, sketches, technical drawings…) of the object or mock-
ups (paper or wood mock-ups but also functional mockups), in order to “see” the
object, to start envisioning its physical aspects. For example, one of the project
managers produced a “design mockup” of a device to be implemented in a
hospital room in order to: “See what it could look like in a hospital room. (I was
interested in) the beauty, the physical appearance…”.
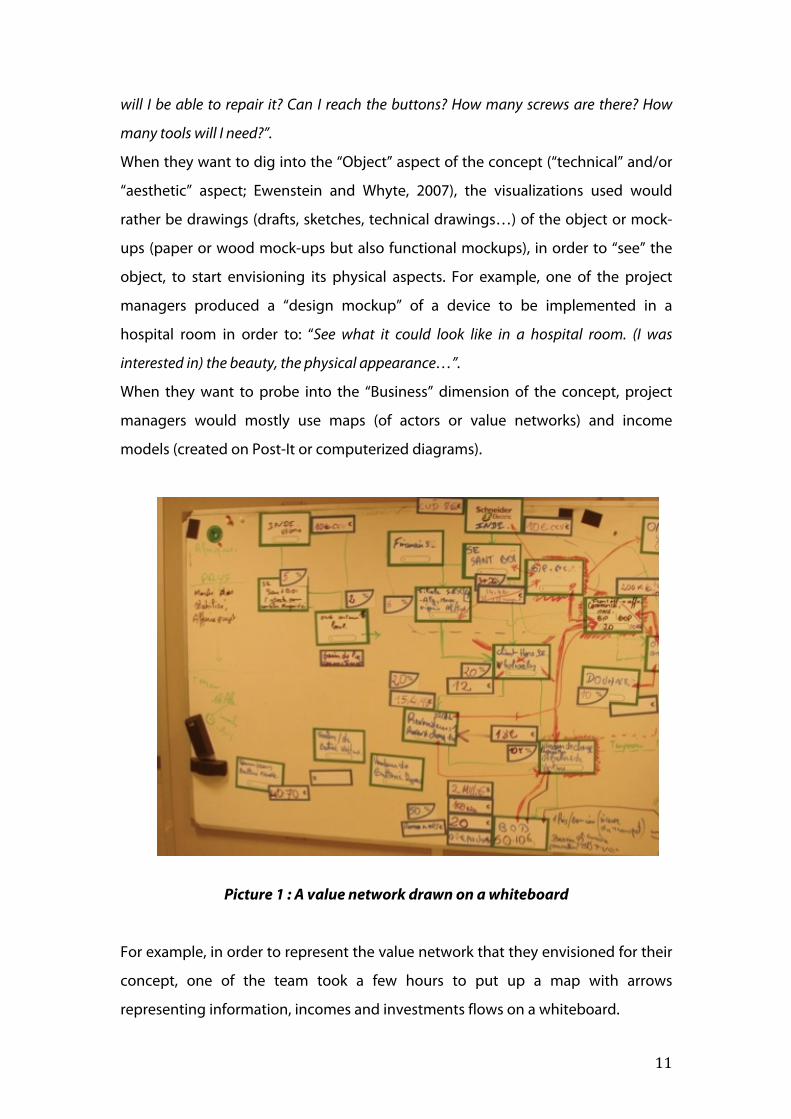
When they want to probe into the “Business” dimension of the concept, project
managers would mostly use maps (of actors or value networks) and income
models (created on Post-It or computerized diagrams).
Picture 1 : A value network drawn on a whiteboard
For example, in order to represent the value network that they envisioned for their
concept, one of the team took a few hours to put up a map with arrows
representing information, incomes and investments flows on a whiteboard.
! 12!
Beyond those “mono-dimensional” visualizations, project managers produce
“more complete” visualizations (Mer et al., 1995), as they support the visualization
of the three aspects of a concept, such as storyboards, videos or “Concept
Catalogs”. Those types of visualizations allow them to articulate the use context
with the staged use of the proposed solution while targeting a typical user and
often suggesting the way this user gets and pays for the solution, etc. For instance,
one of the storyboards tells the story of an electrician who has to install a new
component into an electrical cabinet. The story tells us how the concept would
offer a solution of a heat sensor that is easy to install and compatible with any kind
of installation. It includes drawings of the sensor, and shows how the electrician
would buy it through Schneider’s Catalog at a certain price. This way, the
storyboard deals at the same time with the use of the concept (by showing what
problem the concept would solve, how and how it is used), with the object (by
showing what it would look like and how it would work) and with the business
aspect of the concept (by showing how the client would get the product, how
much, …).
Now, those different “types” of visualizations are materialized with different tools:
for example, the “drawing” of an object might as well be a “draft”, a handmade
sketch, or a computerized 3D rendering. Equally, a value network can be pictured
by a set of Post-Its®, a drawing on a whiteboard or a Power Point® diagram.
The choice of those different visualization tools actually depend on the actors
involved in their production or mobilization and on the intention with which they
are produced, as explained below.
3.2. Actors involved and level of “polishing”.
When we analyze the actors that are involved in the elaboration and/or the
mobilization of the visualizations, we see that project managers mostly use
visualization tools with three types of actors: their own team, their managers and
their clients.
Visualizations circulate in the design team, with which, most of the time, project
managers would produce a visualization. But they also mobilize visualizations with
! 13!
their managers, that is to say, people who have a hierarchical decision-making
power, who allocate funding et who decide whether or not the concepts should be
developed into products (Gottfridsson, 2009). Finally, they also elaborate
visualization tools that they present to their client or potential clients, who might
directly intervene in the design process (Weedman, 1998 ; Luck, 2007) especially at
the Platform since their “user-centered approach” advocates the exploration of
clients’ uses and the clients’ validation of the concept (Darene, Romon, 2006 ).
When they address those different actors, project managers actually use different
types of visualization tools that are characterized by different levels of “polishing”.
When they address their own team, project managers use tools to visualize and
communicate their ideas to their colleagues in a “trustful” context (Vinck and
Laureillard, 1995): they want to “exchange with [their] colleagues to make the idea
evolve”. Here, project managers would mobilize “drafts” or “rough” visualization
tools: they are not very elaborated visually and have little codified conventions
(Vinck, 2009; Erickson, 1995) such as handmade sketches, drawings on a white
board or on paperboard or paper mockups, foam mockups, assembly mock-ups.
As a matter of fact, as Gireaudau (2009) has observed about strategic plans, drafts
helps promoting experimentation and openness in strategy work. They allow
actors to negotiate and build the adjustments required for a common
understanding of the on-going design of the concept (Ewenstein and Whyte, 2007;
Vinck, 2009), as one of the project manager expressed : “It is nice to have an idea in
your head, but if you talk without a drawing, the people facing you do not see what you
see”. Each office of the Platform has a big whiteboard, which is very significant of
the fact that project managers are actually prompted to use them. For example,
one of the project managers had a working session with a colleague that involved
a lot of drawings on her whiteboard. She explains: “When I work with someone on
something, I draw. I always have my pens, I need a board, I write on the board all the
time, I draw… I think it is more constructive to talk and exchange”.
! 14!
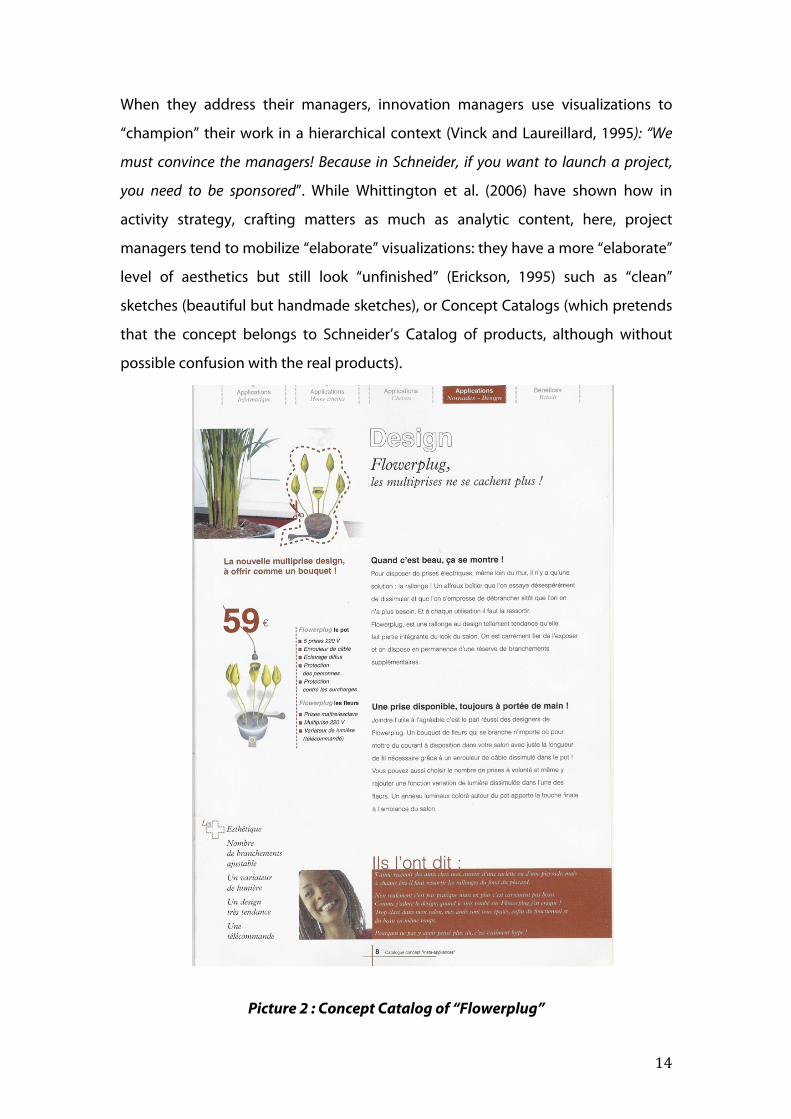
When they address their managers, innovation managers use visualizations to
“champion” their work in a hierarchical context (Vinck and Laureillard, 1995): “We
must convince the managers! Because in Schneider, if you want to launch a project,
you need to be sponsored”. While Whittington et al. (2006) have shown how in
activity strategy, crafting matters as much as analytic content, here, project
managers tend to mobilize “elaborate” visualizations: they have a more “elaborate”
level of aesthetics but still look “unfinished” (Erickson, 1995) such as “clean”
sketches (beautiful but handmade sketches), or Concept Catalogs (which pretends
that the concept belongs to Schneider’s Catalog of products, although without
possible confusion with the real products).
Picture 2 : Concept Catalog of “Flowerplug”
! 15!
The visualizations look more “frozen” (Ewenstein, Whyte, 2007) that is to say that
the lines look more fixed and less uncertain but they are still open to
interpretation, and allow, to a certain extent, to avoid “yes or no” conversations
(Oliver, 2007) about the concept. Talking about a storyboard with handmade
sketches, one of the project managers explains: “[the boss] will know that we are at
the very upstream of the process, he will understand that the content is not frozen”. For
example, one of the project manager explained that, once, he had a graphic
designer “replicate” one of his own drawings because he wanted to be able to
show a “clean handmade sketch” in one of his presentations to his manager: “the
graphic designer cleanly drew what I had drown, but it was a very accurate image (of
what I had done’”. The project manager was here deliberately using the very
materiality of an “unfinished-yet -beautiful” handmade sketch to obtain the
support of his manager.
When they address their clients, project managers use visualizations to
communicate the concept to people who do not belong to the organization and
who, most of the time, do not have technical skills. As one of the project managers
underlines: “If you show this (an algorithm chart) to a client, he will not understand.
This kind of things, the client, he is not a technical person, he won’t understand
anything. It may look simple to us but…” Here, project managers tend to mobilize
“clean” visualizations: they are “aesthetical” and they are built upon universal
understanding conventions (like easy-to-understand color codes or symbols; Vinck,
2009) such as aesthetic 3D renderings, design mock-ups or video clips. Those
“clean” visualizations allow project managers to overcome the technical
complexity of their concepts by adopting a “universal” language: “People must
share the same language and this language must be as simple as possible”. As they are
more “aesthetical”, those visualizations help the client (who might have difficulty
projecting himself or herself out of his or her own environment; Darene, Romon,
2006) focusing on the overall value of the concept, rather than on the possible
manufacturing defects.
! 16!
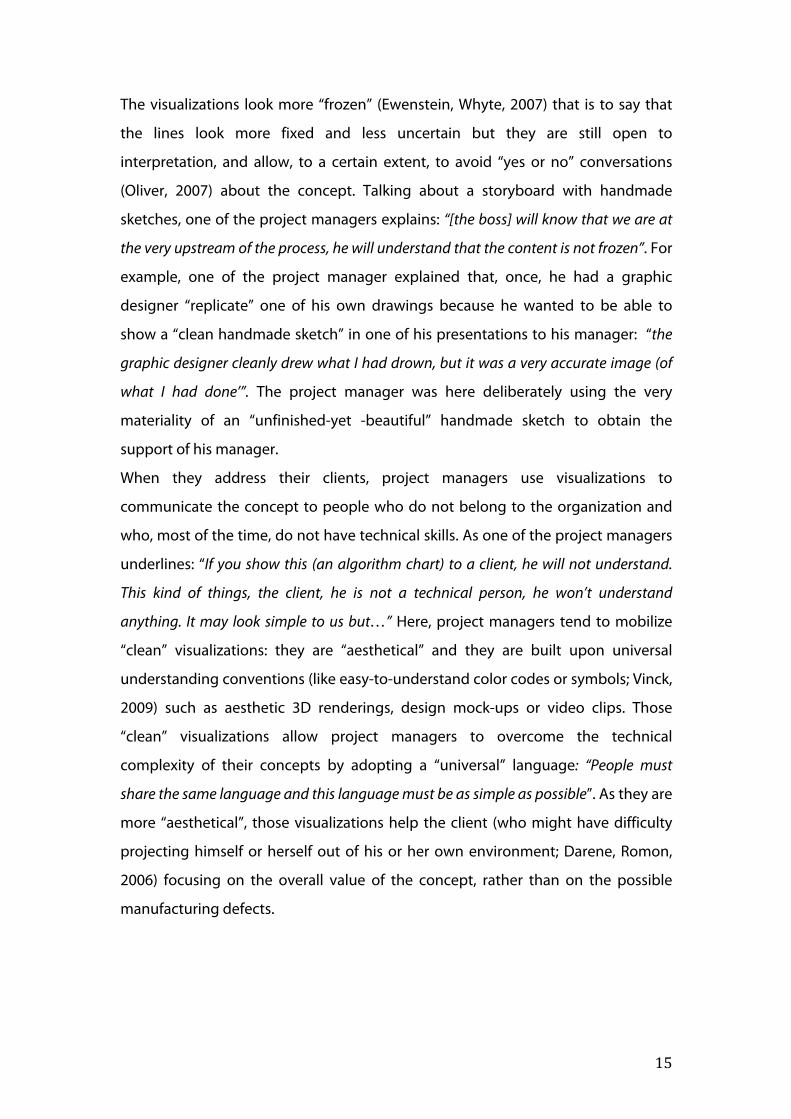
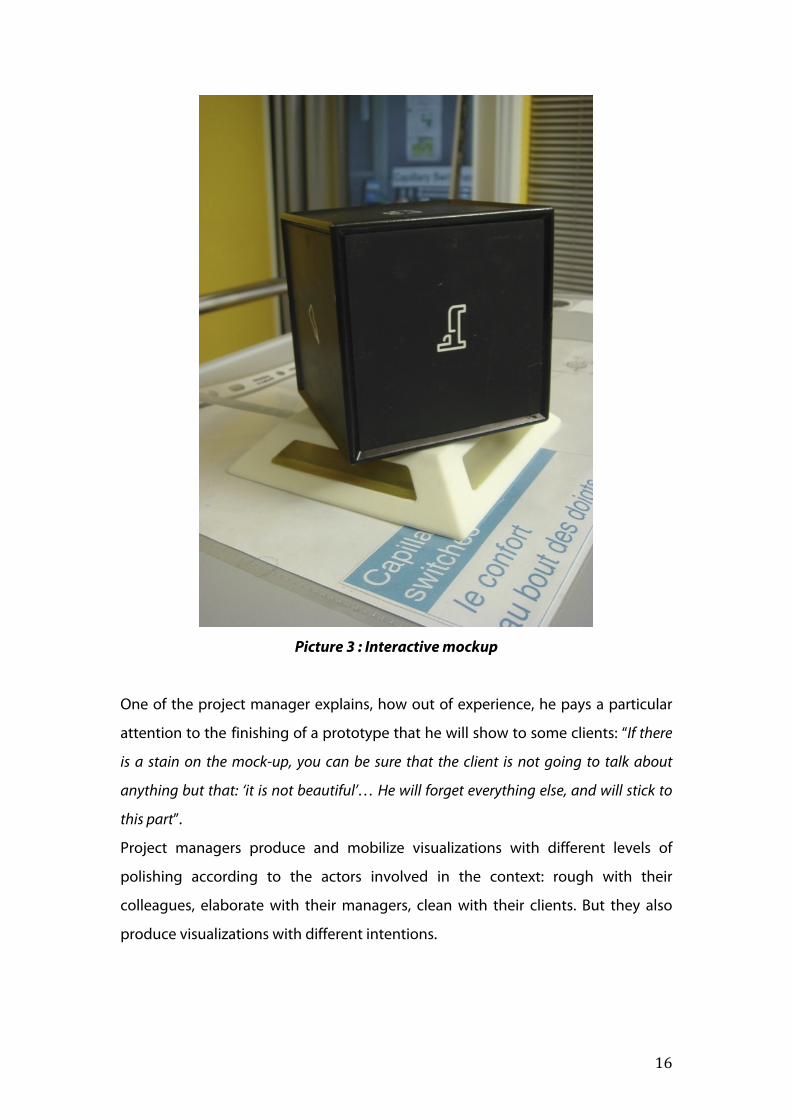
Picture 3 : Interactive mockup
One of the project manager explains, how out of experience, he pays a particular
attention to the finishing of a prototype that he will show to some clients: “If there
is a stain on the mock-up, you can be sure that the client is not going to talk about
anything but that: ‘it is not beautiful’… He will forget everything else, and will stick to
this part”.
Project managers produce and mobilize visualizations with different levels of
polishing according to the actors involved in the context: rough with their
colleagues, elaborate with their managers, clean with their clients. But they also
produce visualizations with different intentions.
! 17!
3.3. Intentions of production and different properties
When we analyze the intentions with which the visualizations are initially produced
and mobilized, we can see that project managers mostly craft representations in
order to explore the problem and its solution, to test those hypotheses about the
value of their concepts or to argue this value.
Project managers produce and mobilize visualizations in order to elaborate
hypotheses about the definition of the issue that they want to tackle and the
possible solutions to this issue (Whyte et al., 2007; Eppler, Plats, 2009). In other
words, they want to explore the value of their concepts.
They also produce and mobilize visualizations in order to evaluate those
hypotheses, collect comments, inputs, feedbacks and suggestions (Ewenstein et al.
2009; Erickson, 1995): they want to test the value of their concept. REF
As one of the project managers sums up about the two previous elements: "We
made some hypotheses about this concept of charging station for electrical vehicles,
we embodied them in a mock-up. And then, we tried to install this station… For us, it
was a way to see if the solution that we proposed was correct”.
Finally, project managers also produce and mobilize visualizations in order to
demonstrate the validity of their hypotheses, elicit support or funding (Erickson,
1995 ; Whyte et al., 2007) : they want to argue on the value of their concept, as one
of the project manager explains : “Once you have a satisfying concept for yourself…
You have to be deeply convinced yourself if you want to demonstrate that to anyone
(...) Demonstrate that there is something there !”.
When they want to explore concepts, project managers use visualizations to
picture and clarify their ideas (Lawson, 1997): “we crafted a mock-up and spent a
couple of hours taking pieces of polystyrene… It helped us to see how everything would
fit together”. But those visualizations also lead them to “unexpected discoveries”
(Suwa et al., 1999 ; Vinck and Laureillard, 1995): “While doing it, we thought: ‘We
should rather put this here. But this other thing is on the left, they are close to each
other, I might connect them?’ And so, we found out many things like that”. Here,
project managers tend to produce “fluid” visualizations: they can be easily and
quickly modified without requiring any specific skills (Whyte, Ewenstein, 2007)
! 18!
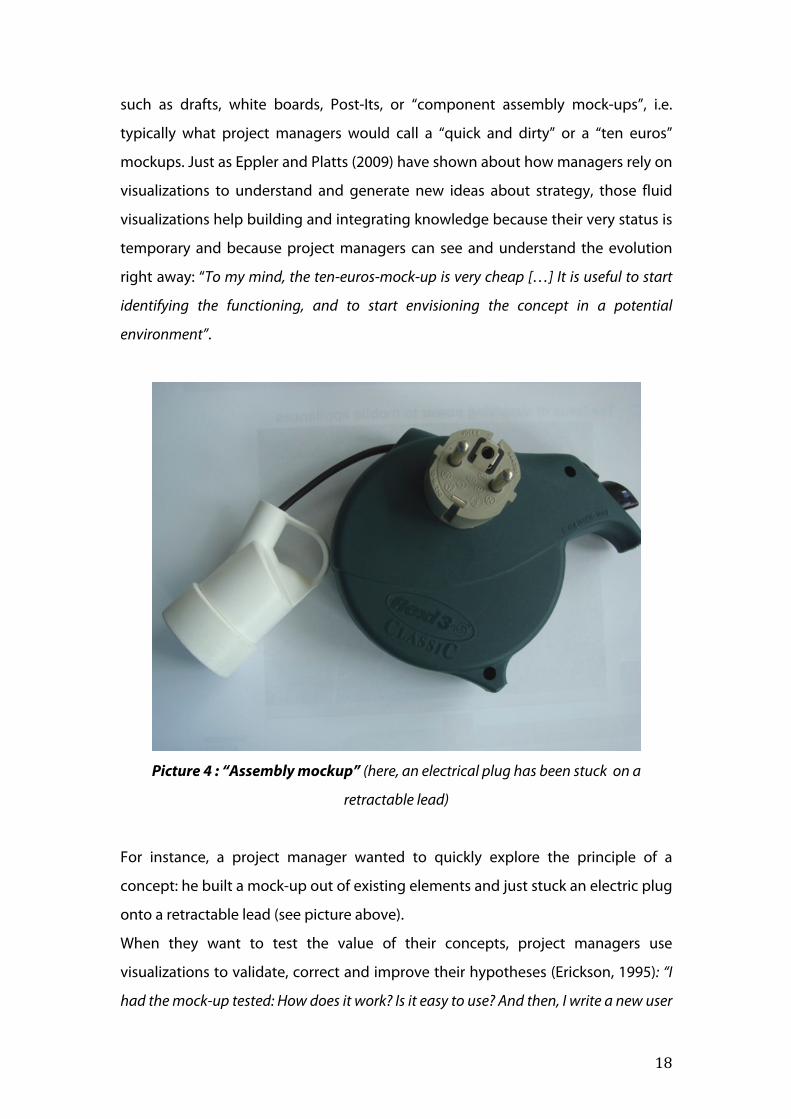
such as drafts, white boards, Post-Its, or “component assembly mock-ups”, i.e.
typically what project managers would call a “quick and dirty” or a “ten euros”
mockups. Just as Eppler and Platts (2009) have shown about how managers rely on
visualizations to understand and generate new ideas about strategy, those fluid
visualizations help building and integrating knowledge because their very status is
temporary and because project managers can see and understand the evolution
right away: “To my mind, the ten-euros-mock-up is very cheap […] It is useful to start
identifying the functioning, and to start envisioning the concept in a potential
environment”.
Picture 4 : “Assembly mockup” (here, an electrical plug has been stuck on a
retractable lead)
For instance, a project manager wanted to quickly explore the principle of a
concept: he built a mock-up out of existing elements and just stuck an electric plug
onto a retractable lead (see picture above).
When they want to test the value of their concepts, project managers use
visualizations to validate, correct and improve their hypotheses (Erickson, 1995): “I
had the mock-up tested: How does it work? Is it easy to use? And then, I write a new user
! 19!
requirements document”. Here, project managers tend to mobilize “interactive”
visualizations: they allow participation and handling (Erickson, 1995), such as
animated storyboards, design or functional prototypes. This interactivity allows to
simulate how the concept would work, as well as stimulate attention as a project
manager explains: “most of the time, people really listen to you only when they can
play with and touch what you are talking about”. This way, visualizations allow to
elicit feedback (Whyte et al., 2007), as one of the innovation managers notes: “we
needed to have a mock-up to test the assembly of the terminal, to see what was wrong
in what we were proposing in order to improve it. And we needed it to be physically
present”.
When they want to argue on the value of their concepts, project managers use
visualizations as means to obtain funding or get a go-ahead for carrying on the
projects (Whyte, Ewenstein, 2007; Millier, 2005). They are mediums of negotiation
and deliberation and embody a strategically oriented discourse (Huff and Jenkins,
2002), as a project manager develops: “Your story must convince. It is about getting a
budget or having your work adopted by other teams”. Here, project managers tend to
mobilize “freestanding” and synthetic visualizations: they do not need any
additional speech or elements to be complete and understood, such as concept
clips including comments, concept catalogs, storyboards, or diagrams with keys.
! 20!
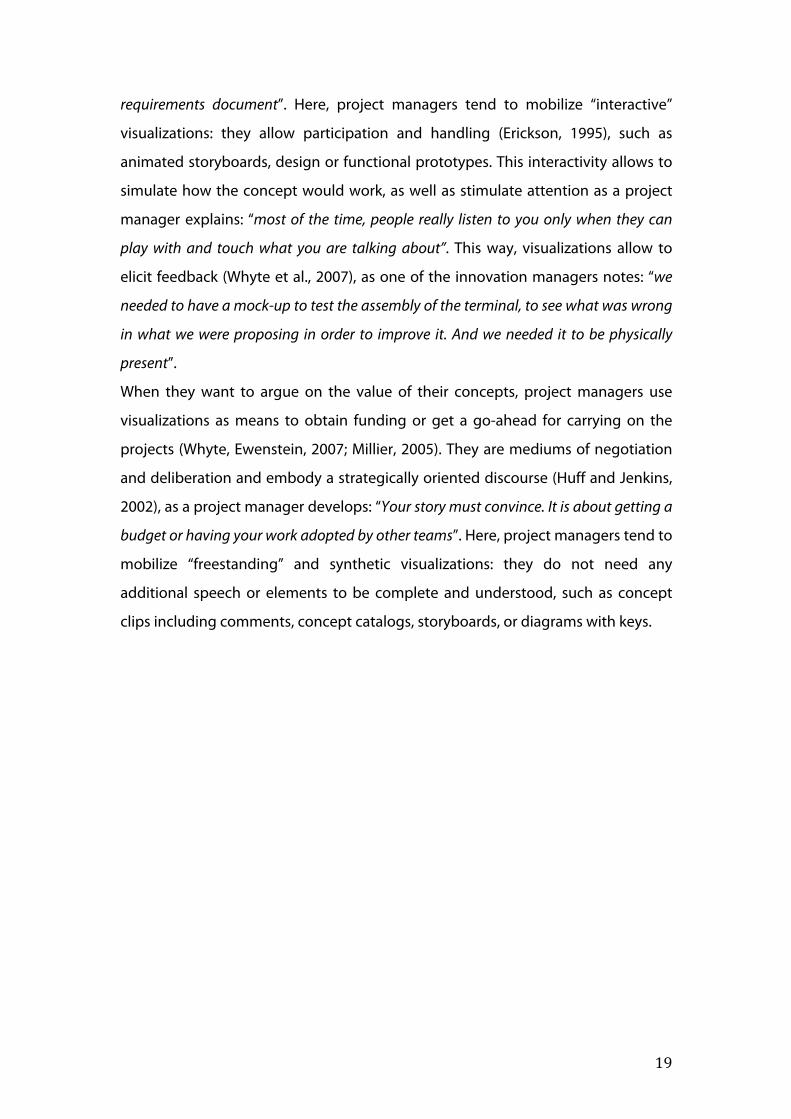
Picture 5 : Extract of a “concept clip”
The synthetic visualizations allow project managers to diffuse the core of their
concept in a very short time, and this helps them addressing more people: “We
must meet the requirements of everyone coming to our Platform, which are: to
understand the concept in no more than an couple of minutes and to be both satisfied
and convinced”. Freestanding visualizations allow project managers to have an
immediately accessible and transmittable content (Luck, 2007). For instance, a
video or an animation that explains and shows the concept can be sent in a few
clicks, and then re-sent by the receiver to other actors, while being very synthetic,
as one of the project managers notices: “A video clip is very handy, the discourse is
always the same, it is always time-bounded, and we always have it close at hand”.
Equally, a “demonstration device” left out in an accessible space such as the
company’s site hall can potentially be seen by a lot of visitors and “demonstrate”
the value of the concept to the greatest number of people.
! 21!
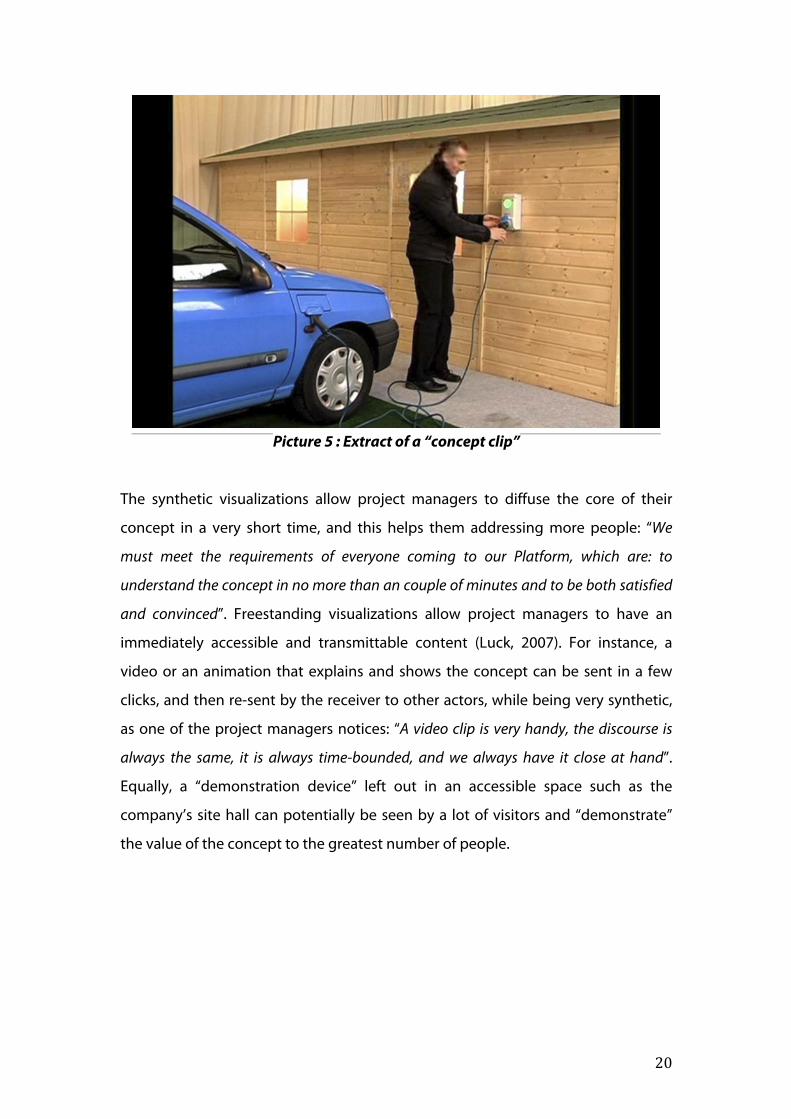
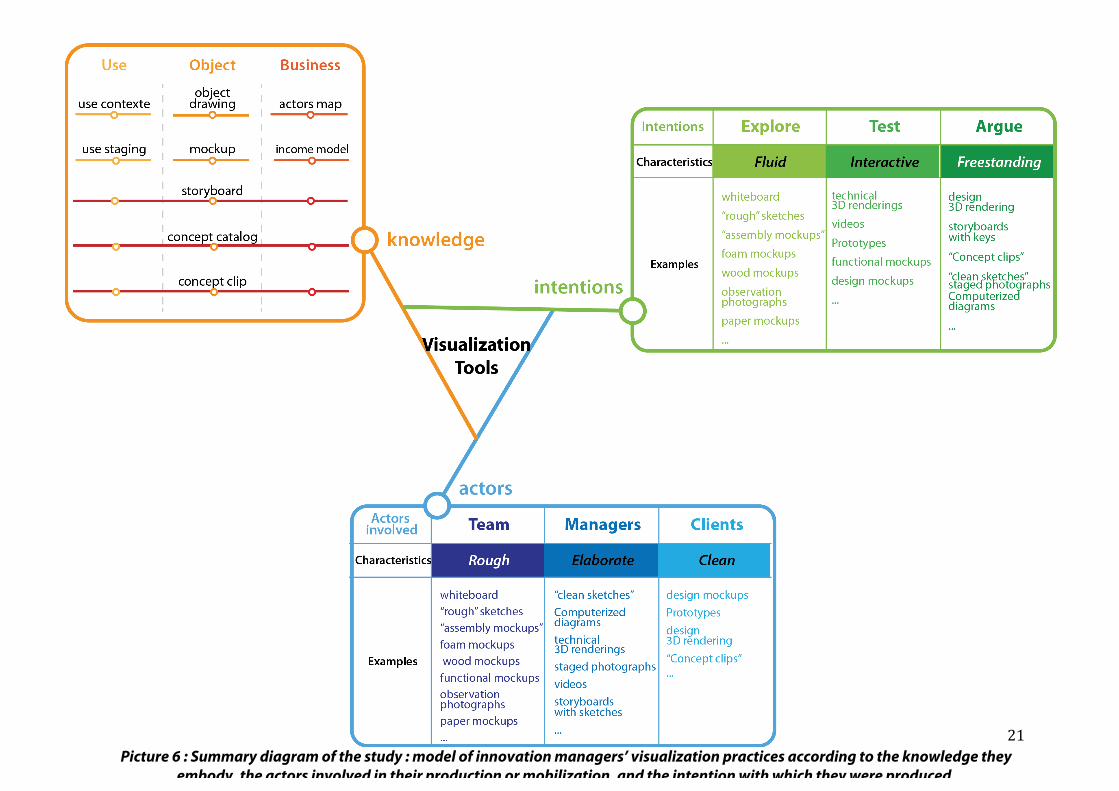
Picture 6 : Summary diagram of the study : model of innovation managers’ visualization practices according to the knowledge they embody, the actors involved in their production or mobilization, and the intention with which they were produced.
! 22!
4. Conclusion and discussion
These visualizations support indeed some of the processes characteristic of
intermediary objects: representation, mediation, prescription and facilitation of the
interactions between actors (Vinck and Laureillard, 1995). But our study shows that
these visualizations are also situated practices that contribute to determine
actions, interactions and negotiations of multiple actors that build the strategic
activity. They contribute to the strategic activity, both in the process of elaboration
of innovative concept and in the outcome of this process (Jarzabkowski et al.,
2007): they take part in the exploration and elaboration of innovative concept as
well as in the communication, negotiation and decision about them.
Our study shows how the project managers, as practioners, have routinized a set of
practices in the design process, and how they use them for their own strategic
purposes: they mobilize different visualizations according to their audience : rough
visualizations when they work with their team, elaborate ones when they speak
with their managers, clean visualizations when they talk to their clients. They also
mobilize different visualizations with different objectives in order to obtain what
they want: improvement through dialog with fluid visualizations, feedbacks
through testing with interactive visualizations, funding through argumentation
with freestanding visualizations).
At the “Innovation Platform”, we could notice that three situations were the most
frequent: explore the concept with team-members, test with clients, and argue in
front of managers. This explains that some of the tools can be found both in the
“exploring” and the “team-members” perspectives, in the “testing” and the “clients”
perspective, and in the “arguing” and the “managers” perspective.
However, occasionally, we were able to observe less typical situations. For
example, when his concept was not validated through “classical channels” (i.e. the
upper management did not decide to carry on with its development), one of the
project managers decided to implement an “alternative strategy” which consisted
in trying to “create a buzz” around his concept. He decided (repetition) to show a
completely functional (i.e. freestanding, he could demonstrate the use and
functioning of his concept), yet not very aesthetical (i.e. “rough”), prototype of his
! 23!
concept to different colleagues from development units and other managers
before of after meetings that were not related to his concept. His strategy actually
proved successful since the company is now developing the concept, and such
“alternative strategies” involving the capacity of “demonstration” of prototype to
get an idea accepted throughout an organization might deserve more attention.
We were also able to observe a situation of exploration with the managers: a
“creativity workshop” was organized gathering both project managers and their
managers to explore the potential integration of an emerging technology into
innovative concepts. Surprisingly here, the “exploration” dimension of the situation
completely overrode the “working with managers” dimension: project managers
and managers agreed at the beginning of the workshop to neutralize any
hierarchical relationship and to create what they called (in English) a “peaceful
room”, where both project managers and managers would be “as equals” in order
to produce as many ideas as possible. This situation was then characterized by the
use of both very rough and fluid visualization tools: sketches, post-its ® and
drawings on a whiteboard. This tends to suggest, if not an incompatibility, at least
a tension between the capacity of exploration or creativity of a group and the
perception of a hierarchical context, especially at the material level of the tools
available to support such a situation, that would need further research.
During the immersion, we were able to follow up different projects with different
maturity levels, which allowed us to observe different scenarios. However, we were
not able to observe presentations and meetings with the highest management
levels of Schneider Electric and our study was limited to the direct observation of
production and mobilization of visualizations with middle managers.
Finally, from a theoretical point of view, this study allowed to endow the notion of
intermediary objects with a strategic perspective: it allowed to go beyond the
scope of the coordination roles of visualizations and envision their impact, their
roles and their characteristics, as practices situated in the strategic activity of
elaboration of innovative concepts.
From a managerial perspective, this study allowed us to provide project managers
with keys for understanding their visualization practices and keys for choosing the
more appropriate visualization tools according to the situation they are in.
! 24!
Besides, as we presented the model to the project managers, we could observe
that it made sense to them and helped raising their awareness about their
practices of visualizations, especially the idea of “publics” and “intentions”, and
finally improved their choices of visualizations.
However, one could wonder if such practices of visualizations, as routinized in a
team or an organization, are not partly dependent on the available competences in
a team: the production and mobilization of certain visualizations seems to be
related to the capacity of the practioner, which explains, first, that a tendency to
produce a lot of “concept clips” when one project manager was very fond of and
good at making videos, significantly decreased when this project manager left.
Second, it also explains that some project managers call upon graphic designers to
have their sketches replicated “aesthetically”. And this might call for further
research on the connection between competences and visualization practices
In the same way, one could wonder to what extent those practices are bound to a
specific team or organizational culture that would, for instance, valuate and
encourage them or, on the contrary, disregard them. The fact that Schneider
Electric’s Innovation managers get a budget to pay for a graphic designer to copy
what could be regarded as a “scrawl” or that they are provided with individual
whiteboard are, in this respect, very significant of the valuation of these
visualization practices at the Innovation Platform. This might not be the case in
every organization nor in every team of Schneider Electric, even though it might
significantly impact the relationship with visualization practices.
Finally, our study, as well as studies concerning design processes (Vinck,
Laureillard, 1995) and strategy-making processes (Heracleous, Jacobs, 2008)
suggest that, in situation of exploration, it seems very important to have a material
artifact to show ideas, exchange them and co-building concepts. This is true all
along the design process since those exploration situations are found iteratively
and non-linearly along the whole design process (Callon, Latour, 1985) and leads
us to advocate for a process-based approach of the uses and practices of
visualizations in the design processes.
! 25!
References:
Candi, M. (2006), Design as an element of innovation: evaluating emphasis in
technology-based firms”, International Journal of Innovation Management, 10 (4),
p351–374.
Callon, M., Latour, B., «Comment suivre les innovations ? Clefs pour l’analyse socio-
technique», Prospective et santé publique, octobre 1985.
Darene, N. et Romon, F. (2006), « La représentation client futur dans la construction
d’une offre innovante – Une étude du rôle du Marketing » , Gérer et comprendre, 83,
p36-46.
Eppler, M.J., & Platts, K.W. (2009), “Visual strategizing: The systematic use of
visualization in the strategic-planning process”, Long Range Planning, 42, p42–74.
Erickson, T. (1995), « Notes on design practice: Stories and prototypes as catalysts
for communication » in Carroll, J., (Ed.) Envisioning technology: The scenario as a
framework for the system development lifecycle, New York: John Wiley, p37-58.
Ewenstein, B., Whyte, J. (2007), « Visual representations as ‘artefacts of knowing’ »,
Building Research & Information, 35 (1), p81-89.
Ewenstein, B., Whyte, J. (2009), « Knowledge Practices in design: the role of visual
representations as ‘epistemic objects’ », Organization Studies, 30 (1), p7-30.
Garel, G., Rosier, R. (2008), « Régimes d'innovation et exploration », Revue française
de gestion, 7(187), p127-144.
Giraudeau, M. (2008), “The drafts of strategy: Opening up plans and their uses”,
Long Range Planning, 41(3), p291–308.
Heracleous, L., & Jacobs, C.D. (2008), “Crafting strategy: The role of embodied
! 26!
metaphors”, Long Range Planning, 41, p309–325.
Hodgkinson, G., Whittington, R., Johnson, G., & Schwarz, M. (2006), “The role of
strategy workshops in strategy development processes: Formality, communication,
co-ordination and inclusion”, Long Range Planning, 39(5), p479–496.
Jarratt, D., & Stiles, D. (2010), “How are methodologies and tools framing managers’
strategizing practice in competitive strategy development?”, British Journal of
Management, 21, p28–43.
Jarzabkowski, P., & Seidl, D. (2008), “The role of meetings in the social practice of
strategy”, Organization Studies, 29(11), p1391-1426.
Jarzabkowski, P., Balogun, J., & Seidl, D. (2007), “Strategizing: The challenges of a
practice perspective”, Human Relations, 60(1), 5–27.
Huff A. and Jenkins M. (2002), Mapping Strategic Knowledge, London: Sage, 320p.
Kaplan, S. (2011), “Strategy and PowerPoint: An inquiry into the epistemic culture
and machinery of strategy making”, Organization Science, 22(2), p320–346.
Levina, N., & Orlikowski, W.J. (2009), “Understanding shifting power relations within
and across fields of practice: A critical genre analysis”, Academy of Management
Journal, 52(4), p672–703.
Lawson, B. (1997), How designers think: the design process demystified, Oxford:
Elsevier, 336p.
Luck, R. (2007), « Using artefacts to mediate understanding in design
conversation », Building Research & Information, 35(1), p28-41.
! 27!
Mer, S., Jeantet, A. et Tichkiewitch, S. (1995), « Les objets intermédiaires de la
conception: Modélisation et Communication », in Caelen, J., Zreik, K., Le
communicationnel pour concevoir, Paris, Europia, 1995, 330 p.
Millier, P. (2005), Stratégie et marketing de l’innovation technologique: lancer avec
succès des produits qui n’existent pas encore, Paris: Dunod, 262p.
Oliver, G. (2007), « Erosion of drawing as a thinking and collaborative tool », Building
Research & Information, 35(1), p571-575.
Olsen, T.O., Welo, T. (2011), « Maximizing Product Innovation through Adaptive
Application of User-Centered Methods for Defining Customer Value », Journal of
Technology Management & Innovation, 6(4), p172-191.
Orlikowski, W.J., & Yates, J. (1994), “Genre repertoire: Examining the structuring of
communicative practices in organizations”, Administrative Science Quarterly, 39,
p541 – 574.
Perttula, M. & Sääskilahti, M. (2004), “Product Concept Development as a conscious
resource”, paper presented at the Nord Design 2004 – Product Design in Changing
Environment, 18-20 August, 2004, Tampere, Finland.
Sääskilahti, M. (2011), « Concept thinking”, Global Conference on Business and
Finance Proceedings, 6 (2), 2011.
Suwa, M.. Gero, J.S. et Purcell, T. (1999), « Unexpected discoveries and s-inventions
of design requirements: A key to creative designs », Computational models of
creative design IV, Sydney: University of Sidney, p297-320.
Tsoukas, H. (2010), “Practice, strategy making and intentionality: A Heideggerian
onto-epistemology for strategy as practice”, In Golsorkhi, D., Rouleau, L., Seidl, D.,
Vaara, E. (Eds.), Cambridge handbook of strategy as practice Cambridge: Cambridge
University Press, p47–62.
! 28!
Vaara, E., Whittington, R. (2012), “ Strategy as Practice: Taking social practices
seriously”, The Academy of Management Annals, 6 (1), p285-336.
Vinck, D., Laureillard, P. (1995), « Coordination par les objets intermédiaires de
conception », papier présenté aux journées CSI « Représenter, coordonner, attribuer
», 11-13 décembre 1995.
Vinck, D. (2009), « De l'objet frontière à l'objet intermédiaire. Vers la prise en
compte du travail d’équipement », Revue d’anthropologie des connaissances, 3(1),
p51-72.
Whittington, R., Molloy, E., Mayer, M., & Smith, A. (2006), “Practices of strategizing/
organizing, broadening strategy work and skills”, Long Range Planning, 39(6), p615
– 629.
Whyte, J., Ewenstein, B., Hales, M., Tidd, J. (2007) “Visual practices and the objects
used in design”, Building Research & Information, 35(1), 18-27.