Embed Size (px)
Citation preview
.... ©ld ty rid4 5>o DominionUn vcr DcscarchFou lOn _. _ 5`+ .4a .::.a_
August 11, 1999
William P. Chu
Technical Officer
NASA Langley Research Center
Mail Stop 475
Hampton, VA 23681-0001
Reference: Final Report-NASA Research r_an_URF 170251)
Research Title: Measurement of'gh_en A Band _ Parameters by
Using Modulation Spectroscopy with Higher Harmonic Detection
Dear Mr. Chu:
Enclosed please find a copy of the above referenced final report for the period ending
March 16, 1999. This project was under the direction of Dr. Amin Dharamsi, Principal
Investigator.
It is our hope that the enclosed journal publications entitled "Investigation of Interference
Between Absorption Lines by Wavelength Modulation Spectroscopy," "Reduction of
Effects of Fabry-Perot Fringing in Wavelength Modulation Experiments," and "Laser
Diode and LED Applications III" submission constitutes full satisfaction of the reporting
requirements under this grant. If this is not the case, we ask that you advise us at yourearliest convenience.
If your have any questions or need anything further please do not hesitate to contact me at
757-683-4293 extension 615.
Sincerely,
Grants and Contracts Administrator
Enclosure: Journal Publications - Investigation of Interference between Absorption
Lines by Wavelength Modulation Spectroscopy, Reduction of Effects of Fabry-Perot
Fringing in Wavelength Modulation Experiments & Laser Diode and LED
Applications 111
CC: R. Todd Lacks, Grants Officer, M/S 126, 1 copy
•ONR Admin. Grants Officer, 1 copy
Center for Aerospace Information (CASI), 1 copy
ODURF File 170251, 1 copy
P.O. Box 6369 • 800 West 46th Street • Norfolk, Virginia 23508-0369Phone 757/683-4293 • FAX 757/683-5290
An Affirmative Action/Equal Opportunity Employer
https://ntrs.nasa.gov/search.jsp?R=19990064418 2018-07-17T07:21:31+00:00Z
JOURNAL OF APPLIED PHYSICS VOLUME 84, NUMBER 12 15 DECEMBER 1998
Investigation of interference between absorption lines by wavelengthmodulation spectroscopy
A. M. Bullock and A. N. Dharamsi a)
Department of Electrical and Computer Engineering, Old Dominion University, Norfolk, Virginia 23464
(Received 10 June 1998; accepted for publication 21 September 1998)
Wavelength modulation spectroscopy is used to demonstrate that extremely weak absorption linescan be measured even when these lines suffer from interference from the wings of adjacent strongerlines. It is shown that the use of detection at several harmonics allows such interference to be
examined clearly and conveniently. The results of experimental measurements on a weak magnetic
dipole driven, spin-forbidden line in the oxygen A band, which experiences interference from the
wings of a pair of adjacent lines towards the blue and red regions of line center, are presented. A
comparison of the experimental results to theory is given. © 1998 American Institute @Physics.
[S0021-8979(98)06424-X]
Wavelength modulation spectroscopy has been used to
perform measurements of weak absorption lines. 1-3 In such
experiments a single mode laser is frequency modulated and
swept over a single rotational line, followed by phase sensi-
tive detection. Measurements have most often been per-formed with second harmonic detection. When the modula-
tion frequency is small, the effective result is that the probe
samples the absorption line shape with the laser carrier and
its side bands. As the absorption profile is swept, one obtains
signals that have a structure that resembles (but is not iden-
tical to) the derivative of the line shape function. For ex-
ample, second harmonic detection, an area where most of the
work has been done in the past, gives signals that have fea-
tures analogous to the second derivative of the profile.
Recently we have extended the use of wavelength modu-lation spectroscopy by using higher harmonic detection. *-6 It
has been shown that, while the signal magnitude decreases
with the detection harmonic order, the signal to noise ratio
can increase up to an optimum harmonic order, Not, t, whose
value depends on the complete experimental noise spectrum.
The main result of higher harmonic detection experiments is
that there are many situations in which it is advantageous to
work with detection orders greater than the commonly usedsecond harmonic.
We present experimental and theoretical results that
show that a set of wavelength modulation experiments using
detection at several harmonics of the fundamental can clearly
resolve very weak lines even if such weak lines suffer from
interference by the wings of adjacent stronger lines. Such
interference from wings of adjacent lines is clearly identifi-
able by using the results of a set of experiments employingdetection harmonic orders of one, two, and three.
The experimental apparatus used has been described
previously. 4-6 Several absorption lines in the oxygen A band
were measured in open atmosphere in a multipass cell thatwas assembled using the design of Altmann et aL 7 This con-
figuration was chosen because it most closely reproduces the
')Electronic mail: dhaz'[email protected]
conditions existing in applications of interest to us. Such
applications include the measurement of atmospheric con-
stituents by solar and lunar occultation, as well as with re-
motely located laser sources. The results shown in Fig. 1 are
those obtained for the weak oxygen RQ (31,32) line with an
absorption cross section of 5.06× 10⁻²⁶ cm 2 cm-1molecule-l s Experimental and theoretical results are shown
for first, second, and third harmonic detection.
Figure 2 shows details of the calculated signal. It is to benoted that the RQ (31,32) line is sandwiched between two
stronger lines: the RQ (25,26) line towards the red side ofline center, and the RQ (27,28) line towards the blue side.
These lines have line strengths of 4.436X 10⁻²⁵ and 2.284
× 10 -4 cm 2 cm -1 molecule -i, respectively, s In order to ob-
tain the match between theory and experiment shown in Fig.
1, it was necessary to include the effects of these two lines
which, while in absolute terms are quite weak, are nonethe-
less several (8.8 and 4.5) times stronger than the RQ (31,32)line itself. According to the HITRAN "96 database s there are
four additional, but much weaker, transitions between
the RQ (25,26) and the RQ (31,32) lines. These additional
lines are the following: RQ (30,31), 2.0340×10 -_
cm 2 cm -1 molecule-i; RQ (27,28), 5.763x 10 -2s em2 cm-i
molecule-l; RQ (29,30), 2.9200× 10 -2s cm 2 cm -1
molecule-I; RQ (28,29), 4.1310x 10 -2s cln 2 cm -I
molecule -1. Computations of the expected signals weremade with the contributions of allthe seven lines mentioned
above included. It was found that the contributions of the last
four lines given above, which are weaker by several orders
of magnitude compared to the RQ (31,32), RQ (25,26), and
RQ (27,28) lines, were negligible. In addition, a search of theHITRAN'96 database indicates that there are no absorption
lines from other species such as water vapor or common
pollutants in the atmosphere in this region of the spectrum.For convenience and for the sake of clarity, therefore, Fig. 2
shows only the total signal calculated as the result of inter-action of the RQ (31,32), RQ (25,26), and RQ (27,28) lines.
Note that while the agreement between theoretical and
experimental results shown in Fig. 2 is very good, it is not
perfect. The relatively small discrepancies between theory
002%8979/98/84(12)/6929/3/$15.00 6929 O 1998 American Institute of Physics
J. Appl. Phys., Vol. 84, No. 12, 15 December 1998
0.6
0.4
0.2
0
759
-0.2
-0.4
-0.6
-0.8
_84
Experiment N = 1
759.588 759.592 59 59 75 c. 6O4
(a)
0.6
Wavelength [urn]
0,4
0.2
0
759
-0.2
-0.4
-0.6
-0.S
// Experiment N = 2
Theory _
(b)
0.6
Wavelength [nm]
0.4
0.2
0
755
*0.2
-0,4
-0.6
N=3
A Theory
5. 759592 ;59Experiment 1
04
(c) Wavelength [nml
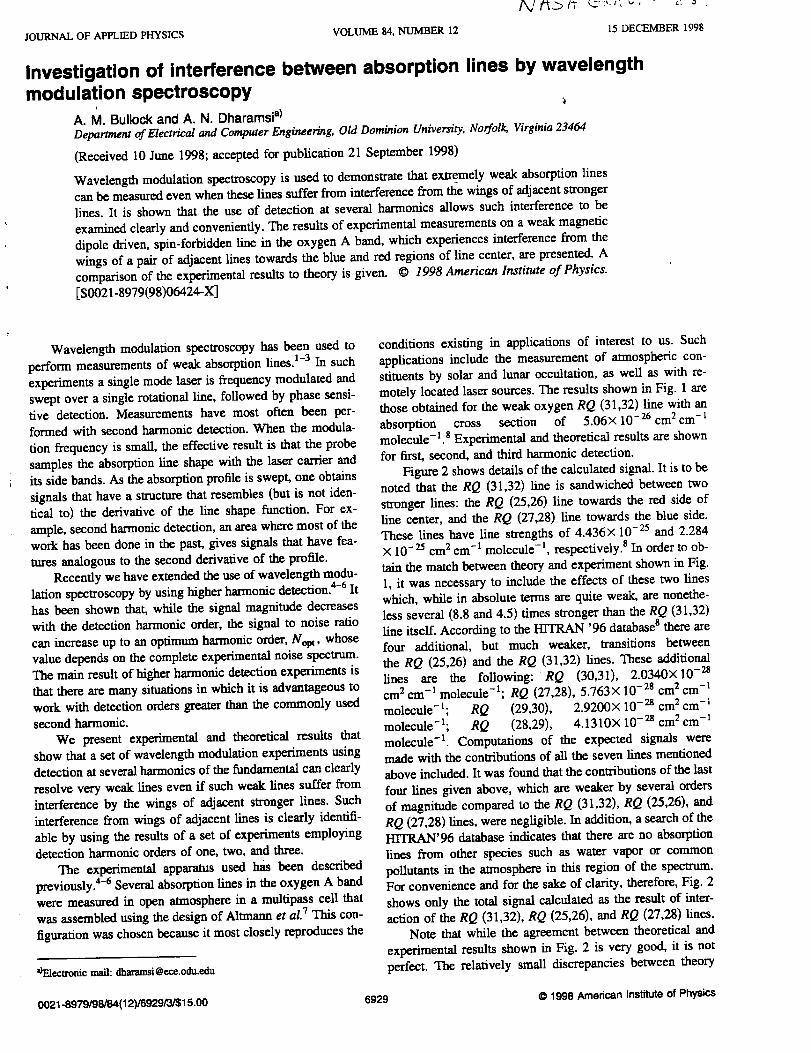
FIG. 3. Comparison between experimental and theoretical results calculated
by assuming that only the RQ (31,32) line contributes to the signal. Acomparison between Figs. 3 and 1 shows clearly that the contributions of the
wings of the adjacent RQ (27,28) and RQ (25,26) lines need to be accountedfor in order to get good agreement between theory and ex_nt. (a) Firstharmonic detection signal; Co) second harmonic detection signal; (c) thirdharmonic deteclion signal.
A. M. Bullock and A. N. Dharamsi 6931
described here would not suffer from such a limitation and,
since the contributions of the individual overlapping lines
can be obtained easily, one would be able_ to obtain informa-
tion of both species.
The method also has applications in investigating the
wings of absorption lines from which information on the
dynamics of molecular collision can be obtained. For in-
stance, it is known that Dicke narrowing of lines influences
not only the central part of an absorption line, but it also
modifies the profile in the wings. 12-14 This line narrowing
occurs, under certain conditions, with increasing pressure es-
sentially because the translational degree of freedom is con-
strained by molecular collisions. When the optical wave-
length is on the order of the mean free path, a quasicoherent
process leads to the line center region being narrowed. Si-
multaneously, the wing structure is modified and hence de-
tails of line overlap are affected. These wing structures and
the consequent overlapping of lines can be studied conve-
niently by modulation spectroscopy using several harmonic
detection orders.
This work was supported by NASA Grant No. NAG-1-
1869. One of the authors (A.M.B.) acknowledges support
from the EPA in the form of a graduate student fellowship
(U-914936-01-0).
1G. C. Bjorkhmd, M. D. Levenson, W. Lenth, and C. Ortiz, Appl. Phys. B:
Photophys. Laser Chem. 32, 145 (1983).
2j. Reid and D. Labrie, Appl. Phys. B: Photopliys. Laser Chem. 26, 203
(1981).
3H. Riris, C. B. Carlisle, L. W. Cart, D. E. Cooper, R. U. Martinelli, and R.
J. Meana, Appl. Opt. 33, 7059 (1994).
4A. N. Dharamsi, J. Phys. D 28, 540 (1996).
5A. N. Dharamsi and A. M. Bullock, Appl. Phys. B: Lasers Opt. 63, 283
(1996).
6A. N. Dharamsi and A. M. Bullock, Appl. Phys. Lett. 69, 22 (1996).
7j. Altxnann, R. Baumgart, and C. Weitkamp, Appl. Opt. 20, 995 (1981).
SHTI'RAN '96, High Resolution Transmission Molecular Absorption Data-base, Phillips Laboratory, Geophysics Directorate; see also J. Quant.
Spectrosc. Radiat. Transf. 48, 469 (1992).
9j. Reid, M. El-Sherbiny, B. K. Garside, and E. A. Ballik, Appl. Opt. 19,
3349 (1980).
mj. A. Silver, A. C. Stanton, and J. A. Silver, Appl. Opt. 27, 1914 (1988).HG. V. H. Wilson, J. Appl. Phys. 34, 3276 (1963).12R. H. Dieke, Phys. Rev. 89, 472 (1953).
13R. H. Dicke, Phys. Rev. 93, 99 (1954).
14S. Briaudeau, S. Saltiel, G. Nienhuis, D. Bloch, and M. Ducloy, Phys.
Rev. A 57, R3169 (1998).
APPLIED PHYSICS LETTERS VOLUME 72, NUMBER 24 15 IUNE 1998
Reduction of effects of Fabry-Perot fringing in wavelength modulationexperiments
A. N. Dharamsi, P. C. Shea, and A. M. BullockDepartment of Electrical and Computer Engineering, Old Dominion University, Norfolk,
Virginia 23529-0246
(Received 13 February 1998; accepted for publication 14 April 1998)
One of the factors limiting the sensitivity of wavelength modulation experiments is the fringing that
is created by inadvertent multiple reflections between parallel optical surfaces in the apparatus. It is
shown that the effects of this "ttaloning" can be countered by using detection harmonic orders
greater than the second. A theoretical basis for the effect is presented and compared with
experimental results obtained. © 1998 American Institute of Physics. [S0003-6951 (98)02124-X]
Wavelength modulation experiments, performed by
many researchers, have provided sensitive measurements of
concentrations, temperatures, and velocities of gaseous
species, z,2In such experiments, one imposes a low frequency
modulation on the incident single-mode laser beam that
probes the target species. The signal is detected by a photo-
detector and processed by a lock-in amplifier set to demodu-
late at the modulation frequency, or at one of the harmonics
of this fundamental frequency. One then generally obtains an
increased signal-to-noise ratio compared to experiments uti-
lizing "direct absorption," i.e., those not utilizing the prin-
ciples of frequency modulation coupled with phase-sensitivedetection.
A large amount of work has been performed using
second-harmonic detection, where the detected signal is de-modulated at the second harmonic of the modulation fre-
quency. Some work has also been done with higher har-monic detection. 3-6 It has been shown that there are some
distinct advantages in going to such higher harmonic detec-
tion, including an increased sensitivity to density fluctuations
and a better resolution in congested spectra.
In all these experiments one always has to contend with
the usual sources of noise including that originating in the
laser, the photodetector, and the detector electronics. How-
ever, an additional source of noise that is of particular im-
portance in modulation spectroscopy is due to "Fabry-Perot
6taloning." This oscillatory noise signal appears because ofundesired multiple reflections between parallel surfaces,
formed by optical components in the apparatus. In many ex-periments, this limits the signal-to-noise ratio. The problem
is often exacerbated in experiments that incorporate multi-
pass cells, where overlapping between optical beams at the
mirror surfaces maybe difficult to avoid.
Several experimental techniques involving asynchronous
jittering have been used to reduce the deleterious effects of
such fringing. One method involves the introduction of an
asynchronous current in addition to the usual modulation
current through the diode laser. 7 Another method uses optoa-
coustic asynchronous jittering of the offending optical
component. 2 In both cases, 6taloning is reduced because the
measurement is performed over an integrating time constant
that is many times longer than the inverse of the fringe pe-riod.
We examine the effects of noise due to Fabry-Perot &a-
loning in wavelength modulation experiments. In particular
the effects of detection at Various harmonics are examined. It
is shown that there are conditions under which the experi-
mental signal-to-noise ratio (where the noise is the Fabry-
Perot 6taloning signal) can be increased substantially by in-
creasing the harmonic detection order. A simple analysis is
presented, followed by some experimental results that illus-
trate the utility of the method of higher harmonic detection.
An important parameter in the experiments discussed
here is the ratio of the Q factors of the parasitic 6talon and
the line being monitored. Qualitatively, the results obtained
can be explained by recognizing that wavelength modulation
experiments yield signals whose functional form can be ap-
proximately described by the frequency derivative of the ap-
propriate lineshape function. While in any real experiment
the signals differ from derivatives because of the necessarilyfinite values of modulation indices that must be used, the
qualitative nature of the derivatives is preserved even for
relatively large modulation indices. 4 Hence, if the quality
factor of the absorption profile being measured is larger thanthat of the 6talon, an increased effective signal-to-noise ratio
can be obtained with increasing harmonic order. This is be-
cause corresponding frequency derivatives of a high-Q trans-
mission function are greater than those of a low-Q feature.
The parasitic Fabry-Perot 6talon that occurs often is the re-sult of reflectivity (<4%) at uncoated interfaces and it can
have a Q factor that is smaller than that of the absorption
feature being monitored. Higher harmonic detection is then
advantageous.
An approximate expression for a wavelength modulation
signal is 3
2 -N/3 N 0_[ °_(v)]SN_Io L _ 3W v , (1)
where 10 is the incident intensity, L is the absorption path
length, /3 is the frequency modulation amplitude, N is the
harmonic detection order, and ot is the absorption coefficient.
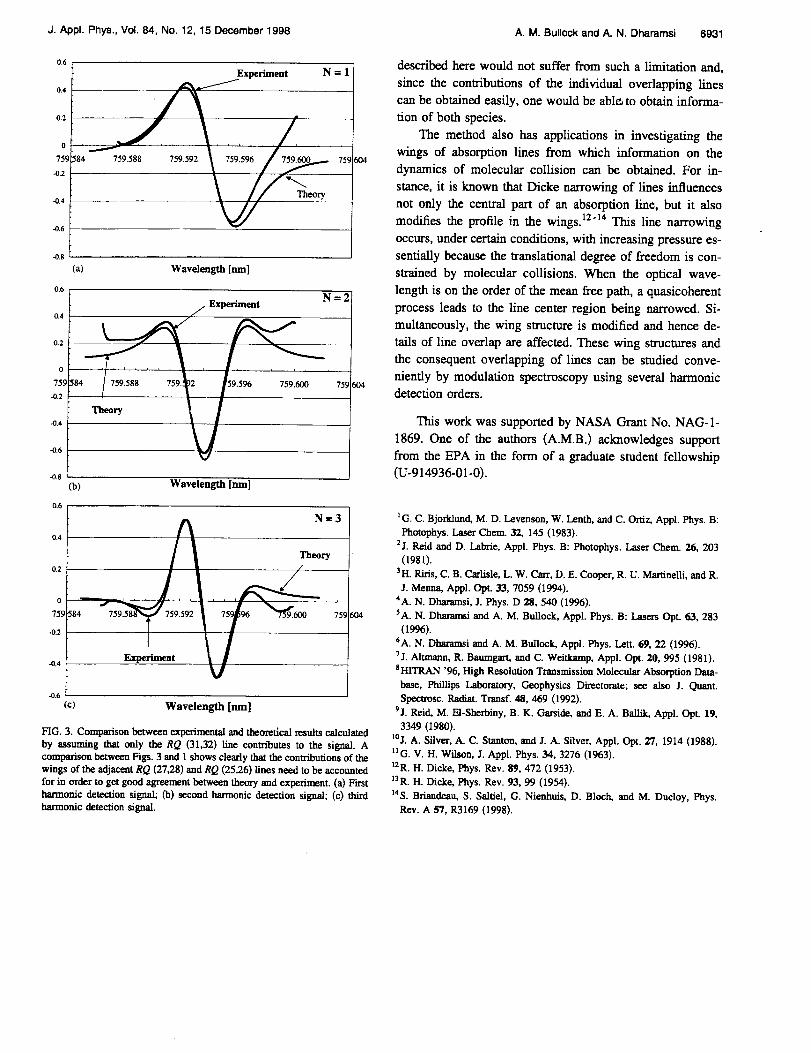
Mirror 1
Diode Laser _
Detector _ _._
Mirror 2
Plate Outside Plate Inside
FIG. 1. Multipass cell arrangement.
0003-6951/98/72(24)/3118/3/$15.00 3118 © 1998 American Institute of Physics
3120 Appl. Phys. Lett., Vol. 72, No. 24, 15 June 1998
Signal to Fdnge Noble Ratio vs. Harmonic Oet_tlon Order
_.orr_ko : 760_m R,,1.
--.-d=_:_ ,_ 2_a4-_cos(o)--*-_.22_! "" = ;L._(I-R)
t0
1
(a)
IOO0
0 1 2 3 4
_C_br
SignaJ to Fdnge Noise Ratio vs. Quatity Factor Ratio
" ,-.=== =760,,,
o.mo o.=o <urn o._+o o.,_ o.==,(b)
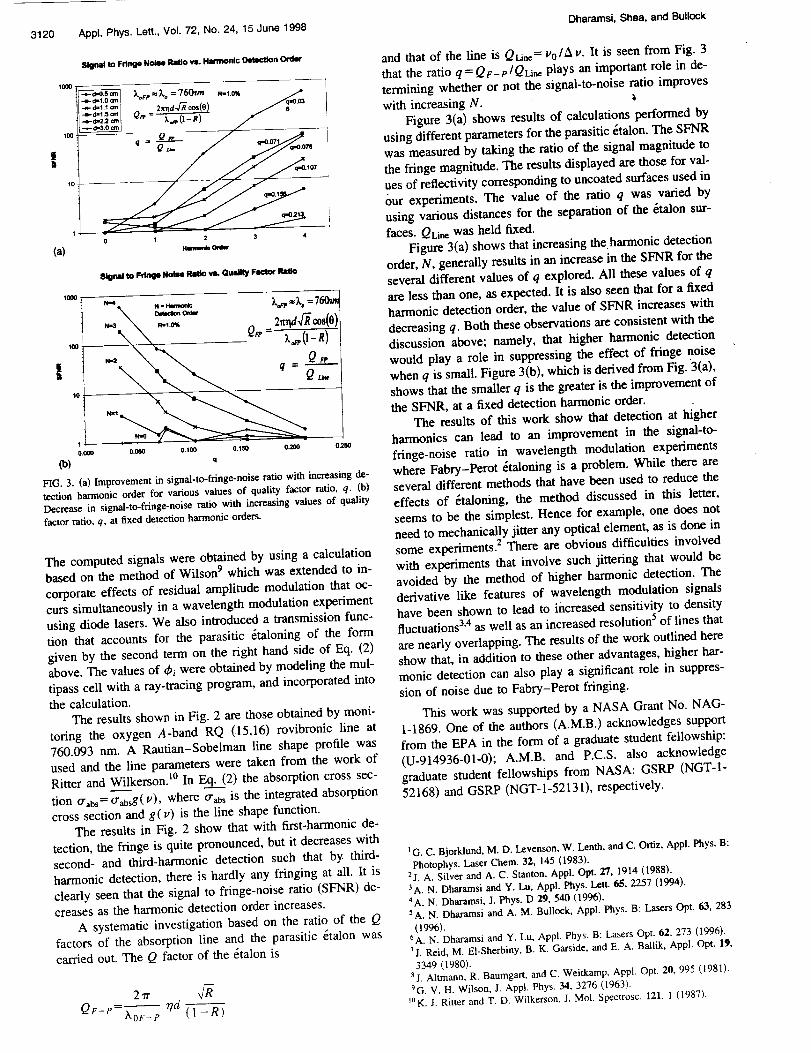
FIG. 3. (a) Improvement in signal-to-fringe-noise ratio with increasing de-
tection harmonic order for various values of quality factor rado, q. (b)
Decrease in signal-to-fringe-noise ratio with increasing values of quality
factor ratio, q, at fixed detection harmonic orders.
The computed signals were obtained by using a calculationbased on the method of Wilson 9 which was extended to in-
corporate effects of residual amplitude modulation that oc-
curs simultaneously in a wavelength modulation experimentusing diode lasers. We also introduced a transmission func-
tion that accounts for the parasitic _taloning of the form
given by the second term on the right hand side of Eq. (2)
above. The values of &i were obtained by modeling the mul-
tipass cell with a ray-tracing program, and incorporated intothe calculation.
The results shown in Fig. 2 are those obtained by moni-
toring the oxygen A-band RQ (15,16) rovibronic line at
760.093 inn. A Rautian-Sobelman line shape profile was
used and the line parameters were taken from the work ofRitter and Wilkerson. m In Eq. (2) the absorption cross sec-
tion trabs= trab_g(v), where trabs is the integrated absorption
cross section and g (v) is the line shape function.
The results in Fig. 2 show that with first-harmonic de-
tection, the fringe is quite pronounced, but it decreases with
second- and third-harmonic detection such that by third-
harmonic detection, there is hardly any fringing at all. It is
clearly seen that the signal to fringe-noise ratio (SFNR) de-creases as the harmonic detection order increases.
A systematic investigation based on the ratio of the Q
factors of the absorption line and the parasitic _talon wascarried out. The Q factor of the _talon is
27r ,_
,ld (1-R)
Dharamsi, Shea, and Bullock
and that of the line is QLine = Vo/AV. It is seen from Fig. 3
that the ratio q=Qg_p/QLine plays an important role in de-
termining whether or not the signal-to-noise ratio improveswith increasing N.
Figure 3(a) shows results of calculations performed by
using different parameters for the parasitic _talon. The SFNR
was measured by taking the ratio of the signal magnitude to
the fringe magnitude. The results displayed are those for val-
ues of reflectivity corresponding to uncoated surfaces used in
our experiments. The value of the ratio q was varied by
using various distances for the separation of the &alon sur-
faces. QLine was held fixed.
Figure 3(a) shows that increasing the harmonic detection
order, N, generally results in an increase in the SFNR for the
several different values of q explored. All these values of q
are less than one, as expected. It is also seen that for a fixedharmonic detection order, the value of SFNR increases with
decreasing q. Both these observations are consistent with the
discussion above; namely, that higher harmonic detection
would play a role in suppressing the effect of fringe noisewhen q is small. Figure 3(b), which is derived from Fig. 3(a),
shows that the smaller q is the greater is the improvement of
the SFNR, at a fixed detection harmonic order.
The results of this work show that detection at higher
harmonics can lead to an improvement in the signal-to-
fringe-noise ratio in wavelength modulation experiments
where Fabry-Perot _taloning is a problem. While there areseveral different methods that have been used to reduce the
effects of 6taloning, the method discussed in this letter,
seems to be the simplest. Hence for example, one does not
need to mechanically jitter any optical element, as is done insome experiments. 2 There are obvious difficulties involved
with experiments that involve such jittering that would be
avoided by the method of higher harmonic detection. The
derivative like features of wavelength modulation signals
have been shown to lead to increased sensitivity to densityfluctuations 3'4 as well as an increased resolution s of lines that
are nearly overlapping. The results of the work outlined here
show that, in addition to these other advantages, higher har-
monic detection can also play a significant role in suppres-
sion of noise due to Fabry-Perot fringing.
This work was supported by a NASA Grant No. NAG-
1-1869. One of the authors (A.M.B.) acknowledges support
from the EPA in the form of a graduate student fellowship:
(U-914936-01-0); A.M.B. and P.C.S. also acknowledge
graduate student fellowships from NASA: GSRP (NGT-1-
52168) and GSRP (NGT- 1-52131), respectively.
I G. C. Bjorklund, M. D. Levenson, W. Lenth, and C. Ortiz, Appl. Phys. B:
Photophys. Laser Chem. 32, 145 (1983).
2j. A. Silver and A. C. Stanton, Appl. Opt. 27, 1914 (1988).
3A. N. Dharamsi and Y. Lu, Appl. Phys. Lett. 65, 2257 (1994).
+A. N. Dharamsi, J. Phys. D 29, 540 (1996).
5A. N. Dharamsi and A. M. Bul]ock, Appl. Phys. B: Lasers Opt. 63, 283
(1996).
_A. N. Dharamsi and Y. Lu, Appl. Phys. B: Lasers Opt. 62, 273 (1996).
"_J. Reid, M. El-Sherbiny, B. K. Garside, and E. A. Ballik, Appl. Opt. 19,
3349 (1980).
sj. Altmann, R. Baumgart, and C. Weitkarnp, Appl. Opt. 20, 995 (1981).
9G. V. H. Wilson, J. Appl. Phys. 34, 3276 (1963).
J°K. L Ritter and T. D. Wilkerson, J. Mol. Spectrosc. 121, 1 (1987).
PROCE :D NGS_[_ SPIEmThe International Society for Optical Engineering
Laser Diode and LEDApplications I!!
Kurt J. LindenChair�Editor
10-11 February 1997
San Jose, California
f,
jD
Volume 3000
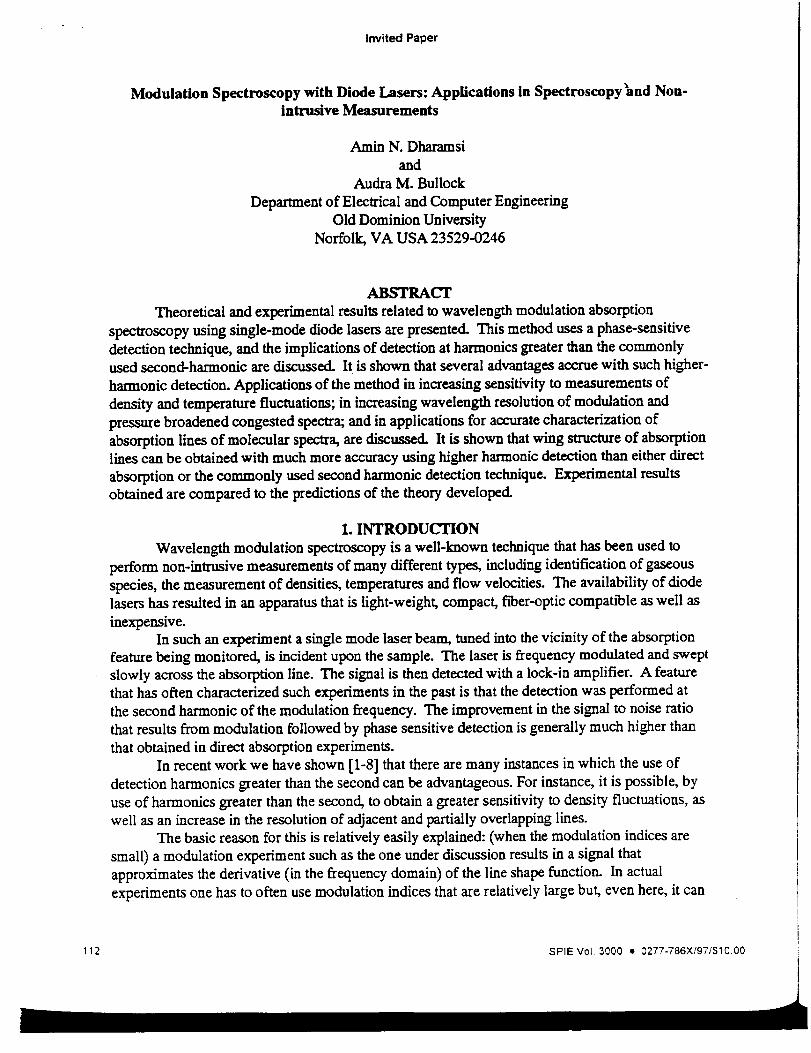
Invited Paper
Modulation Spectroscopy with Diode Lasers: Applications in Spectroscopy _and Non-
intrusive Measurements
Amin N. Dharamsi
and
Audra M. Bullock
Department of Electrical and Computer Engineering
Old Dominion University
Norfolk, VA USA 23529-0246
ABSTRACT
Theoretical and experimental results related to wavelength modulation absorption
spectroscopy using single-mode diode lasers are presented. This method uses a phase-sensitive
detection technique, and the implications of detection at harmonics greater than the commonly
used second-harmonic are discussed. It is shown that several advantages accrue with such higher-
harmonic detection. Applications of the method in increasing sensitivity to measurements of
density and temperature fluctuations; in increasing wavelength resolution of modulation and
pressure broadened congested spectra; and in applications for accurate characterization of
absorption lines of molecular spectra, are discussed. It is shown that wing structure of absorption
lines can be obtained with much more accuracy using higher harmonic detection than either direct
absorption or the commonly used second harmonic detection technique. Experimental results
obtained are compared to the predictions of the theory developed.
1. INTRODUCTION
Wavelength modulation spectroscopy is a well-known technique that has been used to
perform non-intrusive measurements of many different types, including identification of gaseous
species, the measurement of densities, temperatures and flow velocities. The availability of diode
lasers has resulted in an apparatus that is light-weight, compact, fiber-optic compat_le as well as
inexpensive.
In such an experiment a single mode laser beam, tuned into the vicinity of the absorption
feature being monitored, is incident upon the sample. The laser is frequency modulated and swept
slowly across the absorption line. The signal is then detected with a lock-in amplifier. A feature
that has often characterized such experiments in the past is that the detection was performed at
the second harmonic of the modulation frequency. The improvement in the signal to noise ratio
that results from modulation followed by phase sensitive detection is generally much higher than
that obtained in direct absorption experiments.
In recent work we have shown [1-8] that there are many instances in which the use of
detection harmonics greater than the second can be advantageous. For instance, it is possible, by
use of harmonics greater than the second, to obtain a greater sensitivity to density fluctuations, as
well as an increase in the resolution of adjacent and partially overlapping lines.
The basic reason for this is relatively easily explained: (when the modulation indices are
small) a modulation experiment such as the one under discussion results in a signal that
approximates the derivative (in the frequency domain) of the line shape function. In actual
experiments one has to often use modulation indices that are relatively large but, even here, it can
112 SPIE Vol. 3000 • 0277-786X/97/$I0.00
I II
be shown [3] that the signal retains its major derivative-like features. This results in signal
characteristics that show the advantages mentioned above. For instance, it is relatively
straightforward to show that the dependence of the signal on density fluctuations is given
approximately by n "r, where n is the density and N the harmonic detection order 14]. Similarly,
small features in the absorption profile appear as relatively large changes in the derivatives of
these profiles; hence, one obtains an increased resolution in the wavelength regime, enabling one
to distinguish between features due to overlapping lines [2].
In this paper, we present the results of experiments that demonstrate many of these
advantages. We also give a corresponding theoretical treatment that explains the experimental
results obtained. The paper discusses the above applications that we have demonstrated, as well
as potential future applications of the method of wavelength modulation spectroscopy, with
particular attention to higher harmonic detection.
Another very useful application of wavelength modulation with higher harmonic detection
is in investigating the wing structure of molecular absorption lines. Results of experiments
demonstrating this are presented.
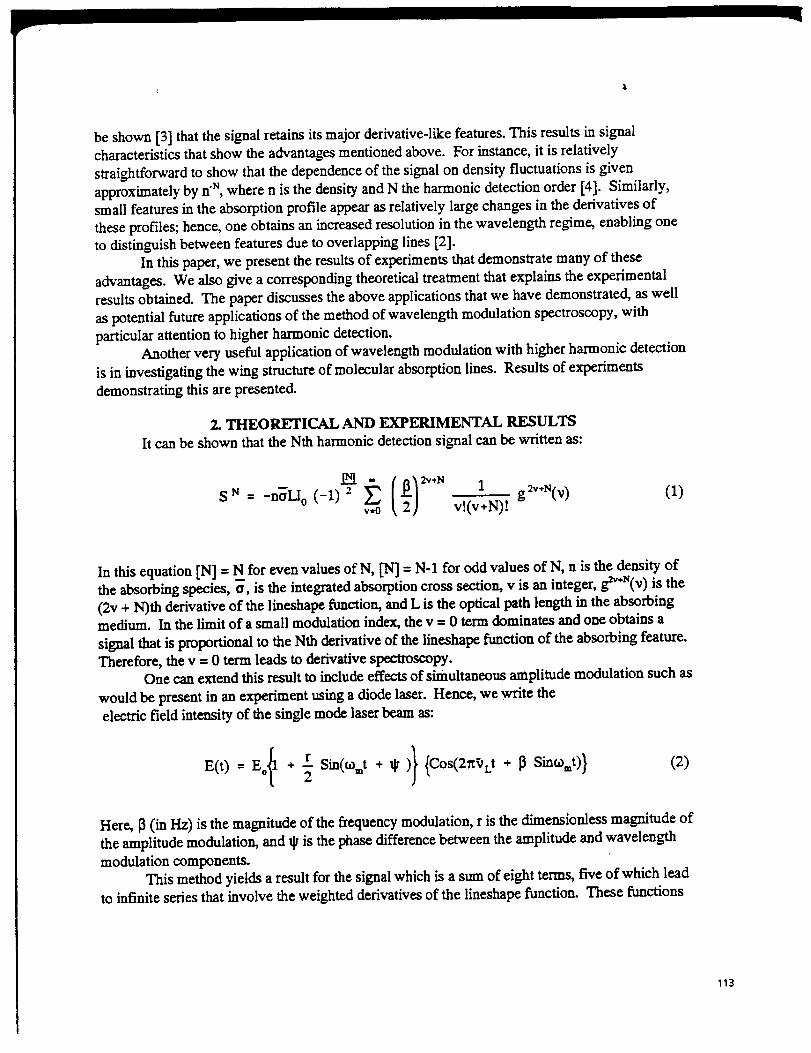
2. THEORETICAL AND EXPERIMENTAL RESULTS
It can be shown that the Nth harmonic detection signal can be written as:
s N ___n_Uo (-1) z (1)_-o v!(v+N)t g
In this equation IN] = N for even values of N, [N] = N-1 for odd values of N, n is the density of
the absorbing species, a, is the integrated absorption cross section, v is an integer, g_÷S(v) is the
(2v + N)th derivative of the lineshape function, and L is the optical path length in the absorbing
medium. In the limit of a small modulation index, the v = 0 term dominates and one obtains a
signal that is proportional to the Nth derivative of the lineshape function of the absorbing feature.
Therefore, the v = 0 term leads to derivative spectroscopy.
One can extend this result to include effects of simultaneous amplitude modulation such as
would be present in an experiment using a diode laser. Hence, we write the
electric field intensity of the single mode laser beam as:
E(t) = Eo{1 + r2 Sin(t_t +_ )} {Cos(2g_Lt + 13Sint_mt)} (2)
Here, [3(in Hz) is the magnitude of the frequency modulation, r is the dimensionless magnitude of
the amplitude modulation, and _ is the phase difference between the amplitude and wavelength
modulation components.
This method yields a result for the signal which is a sum of eight terms, five of which lead
to infinite series that involve the weighted derivatives of the lineshape function. These functions
113
are given explicitly in reference [3]. In the work described in this paper, we assume that the
absorption lineshape function has a Voigt profile and use the expressions we have derived
previously for the derivatives of the Voigt lineshape function.
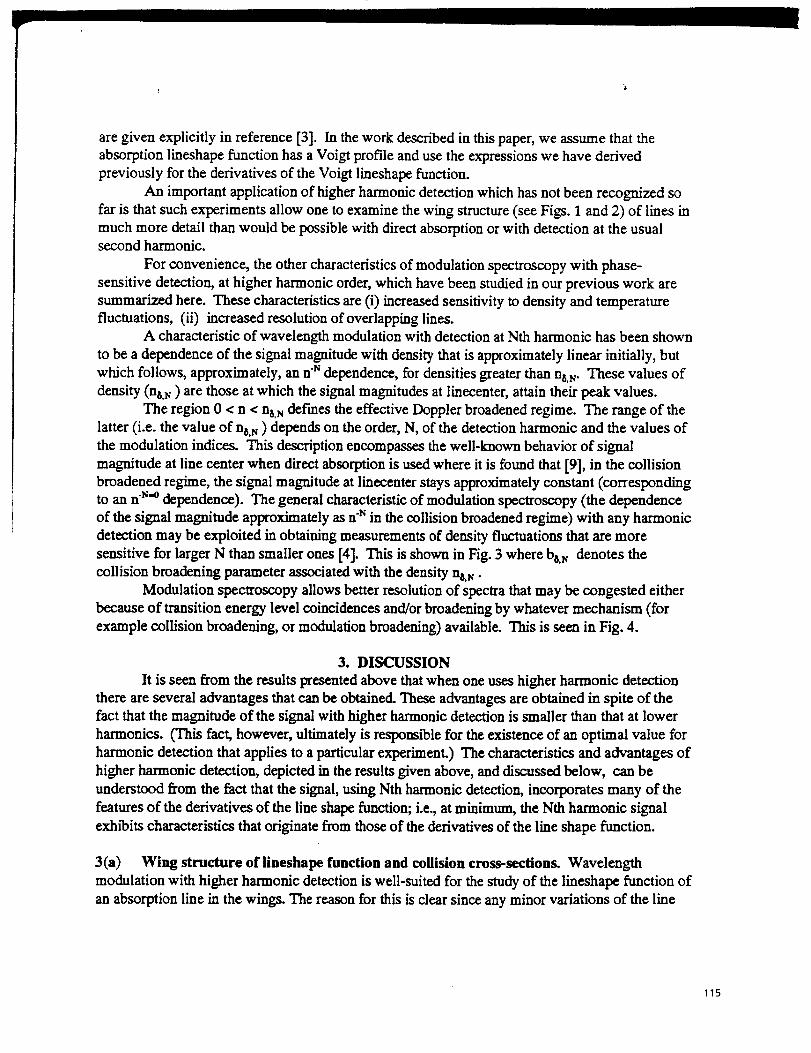
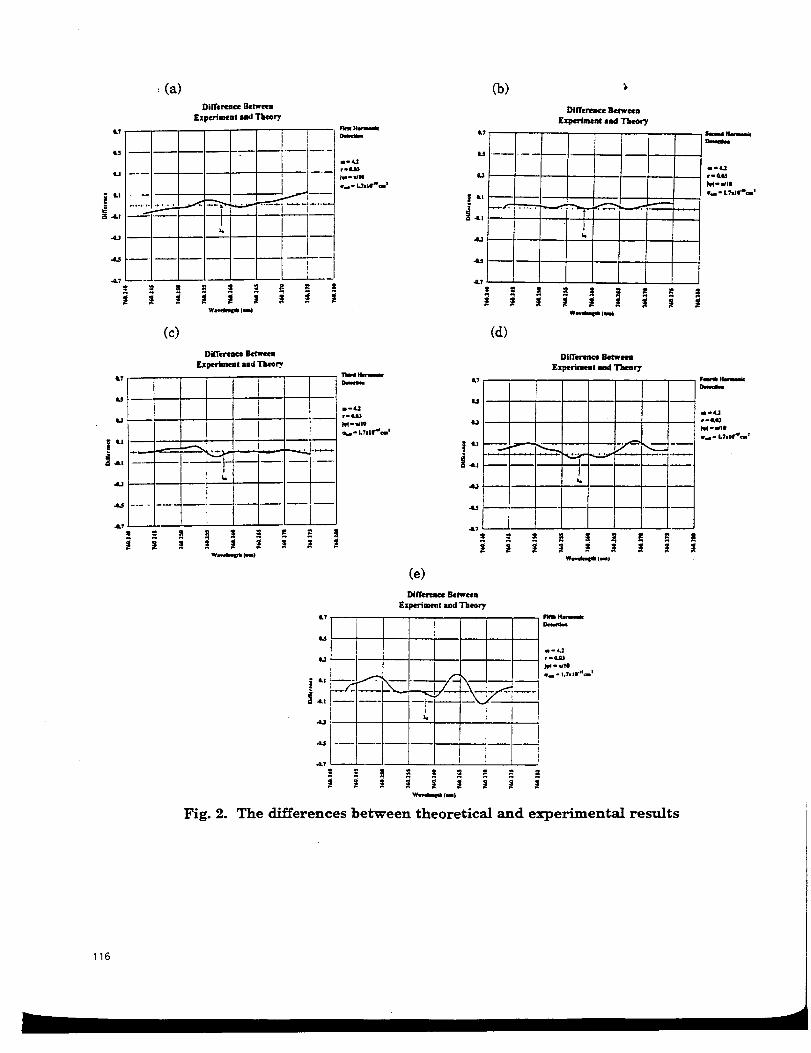
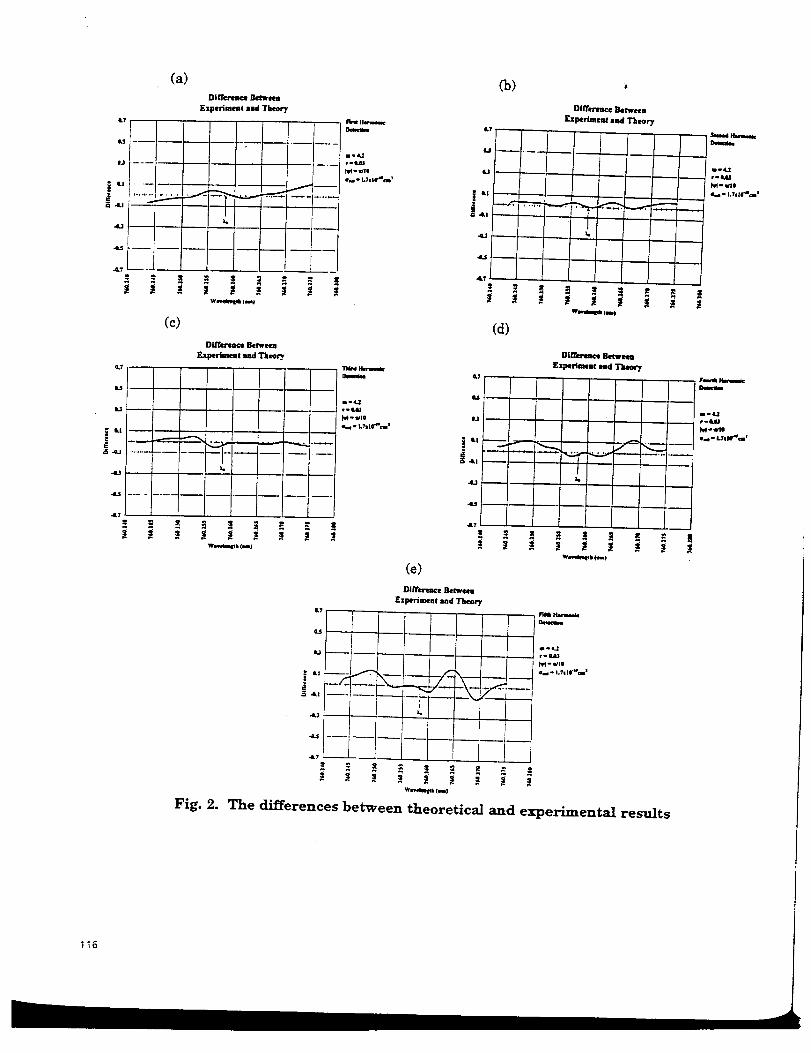
An important application of higher harmonic detection which has not been recognized so
far is that such experiments allow one to examine the wing structure (see Figs. 1 and 2) of lines in
much more detail than would be possible with direct absorption or with detection at the usualsecond harmonic.
For convenience, the other characteristics of modulation spectroscopy with phase-
sensitive detection, at higher harmonic order, which have been studied in our previous work are
summarized here. These characteristics are (i) increased sensitivity to density and temperature
fluctuations, (ii) increased resolution of overlapping lines.
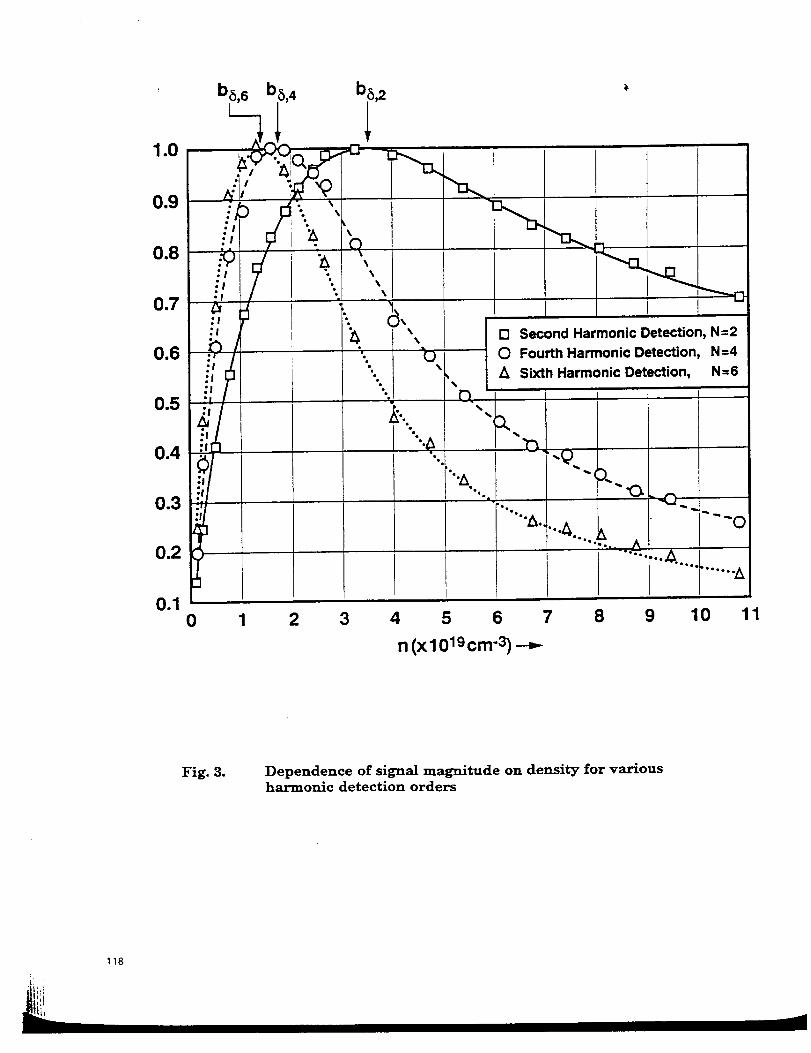
A characteristic of wavelength modulation with detection at Nth harmonic has been shown
to be a dependence of the signal magnitude with density that is approximately linear initially, but
which follows, approximately, an n N dependence, for densities greater than n_.N. These values of
density (nb.N) are those at which the signal magnitudes at linecenter, attain their peak values.
The region 0 < n < n_.N defines the effective Doppler broadened regime. The range of the
latter (i.e. the value of ns, N ) depends on the order, N, of the detection harmonic and the values of
the modulation indices. This description encompasses the well-known behavior of signal
magnitude at line center when direct absorption is used where it is found that [9], in the collision
broadened regime, the signal magnitude at linecenter stays approximately constant (corresponding
to an n N'° dependence). The general characteristic of modulation spectroscopy (the dependence
of the signal magnitude approximately as n"r_in the collision broadened regime) with any harmonic
detection may be exploited in obtaining measurements of density fluctuations that are more
sensitive for larger N than smaller ones [4]. This is shown in Fig. 3 where bs.r_ denotes the
collision broadening parameter associated with the density ne.N .
Modulation spectroscopy allows better resolution of spectra that may be congested either
because of transition energy level coincidences and/or broadening by whatever mechanism (for
example collision broadening, or modulation broadening) available. This is seen in Fig. 4.
3. DISCUSSION
It is seen from the results presented above that when one uses higher harmonic detection
there are several advantages that can be obtained. These advantages are obtained in spite of the
fact that the magnitude of the signal with higher harmonic detection is smaller than that at lower
harmonics. (This fact, however, ultimately is responsible for the existence of an optimal value for
harmonic detection that applies to a particular experiment.) The characteristics and advantages of
higher harmonic detection, depicted in the results given above, and discussed below, can be
understood fi'om the fact that the signal, using Nth harmonic detection, incorporates many of the
features of the derivatives of the line shape function; i.e., at minimum, the Nth harmonic signal
exh_its characteristics that originate from those of the derivatives of the line shape function.
3(a) Wing structure of lineshape function and collision cross-sections. Wavelength
modulation with higher harmonic detection is well-suited for the study of the lineshape function of
an absorption line in the wings. The reason for this is clear since any minor variations of the line
115
0.7
t5
e.I
i5 -LI
.4.3
, Ca)DiITe reace Bcmeea
[xperimen¢ snd Tkeor 7
I
Wa_q_lh(im!
(c)
DiITeI'_ICe Betweel
_perim_l s=d Thor
.! I
.__ lI
-4tl ..... I....
I
_t
Fhl Hi
m-4.1
e e
e,,e - KTsla rwcI!
11d_l Hi_iiiII
r. l.i&
L?
u
LJ
_L,
LT
U
L_
Co)
DIIl"ernce _l'_een
£zperimen_ and Theory
W_ (am)
(d)
DilTenmce _em'm
£zperimem sad
"--_ _ _ "/'_
Fig. 2.
Z Z Z Z _ 3 • _
we_l_ 1_
(e)
DilTermce Befween
Experiment and Theory
LT
L3
.43
.a._ I
w_-k_l_ (I)
I
r-4.1_
ed " L_|llr_l _
The differences between theoretical and experimental results
iil._
r - 4ALl
I_-- iflI
I_i " L?III'I_I I
e-&l.I
M "_11
I.I" L?I If_I v
116
_.,d
I_ .
i.i
t!"
!/
L?
U
0.3
J:.4..5
!i
(a)EzperJment vs Theory
Oz A-band line RQ(13,14)
,.,_ '
I_ m
First Ilgrlme_
Demct_m
m-4_
r - 0.03
ad" I.Ts10 "acmz
//
Wavdeut_ (me)
o.?
U
4.1
7-.4)
.45
4.?
(c)
Experiment v5 Theory
02 A-band line RQ(13,14)
A.,
ml4_
_-0.U
[ e..- l.?zlo'wa= _
Wavdeq_ (_1,
(d)
@.7
U
4U
41.7
Experiment vs Theory
O_ A-band line RQ(13,14)
SW_ (mm|
Irem-_ Haw
m-4._
r-CA3
Iq-_Cle
el - L_I e_e_t
(e)
Experiment v5 Theory
O2 A-band Fine RQ(13,14)
0.?
1.u
Wr, ettq_ Ime)
HM
I)eucd_
ml4_
r _ 0.03
JVl- y.,ie
elms " L'_||O'_*Cm I
Fig. 1. Comparison between theoretical and experimental results
114
L741.5 ---,
LJ .......
4J
.4L5 .--
.L?!
(a)Difference Betwee8
Experiment and Theory
J
(c)
Wi_sqd,(smJ
DilTmm Btt'w_n
Experimem and Theory
¢1
u
ILl _.
,,llJ
•4.5 ......
-L7
_)
i-4J
¢-t_J
M. m'ltl
:_- I.Ttllra_ I
&7
!JoJ
__/tJ
,, .,.o
Difference B_tw_n
F.xperiment xnd Theory
t
°- I4.?
(d)
m-4.2r-_AU
_-WlO
_,_. LTwlO'nm I
Dlfl'ermce 3et_m
Experiment tad Theory
"" t
iS 4.1 _e'- ''._._ _
41J _
(e)
Dlffereace Bet_veea
E] eriment and Theory
&?
I
wm,_m8_ (u,)
lm_ Hmue_e
m-4J
r- o.oJ
NI-WlO
(p_ _ LTlllr_¢m _
-4J .... 4
_, ----- _ ._ .= _ _ ="
Fig. 2. The differences between t]aeoretlca] and ex-pex_me_tal results
_.Lhfg'8_ t
Fe,tr_ Nmue_
Dmeem
lae4_e-_UD
N4- _lll
eee" LTtlg'_m t
116
_i;ii__!ii_iI
-if:i.L: .i
c
" / b:_ ¸
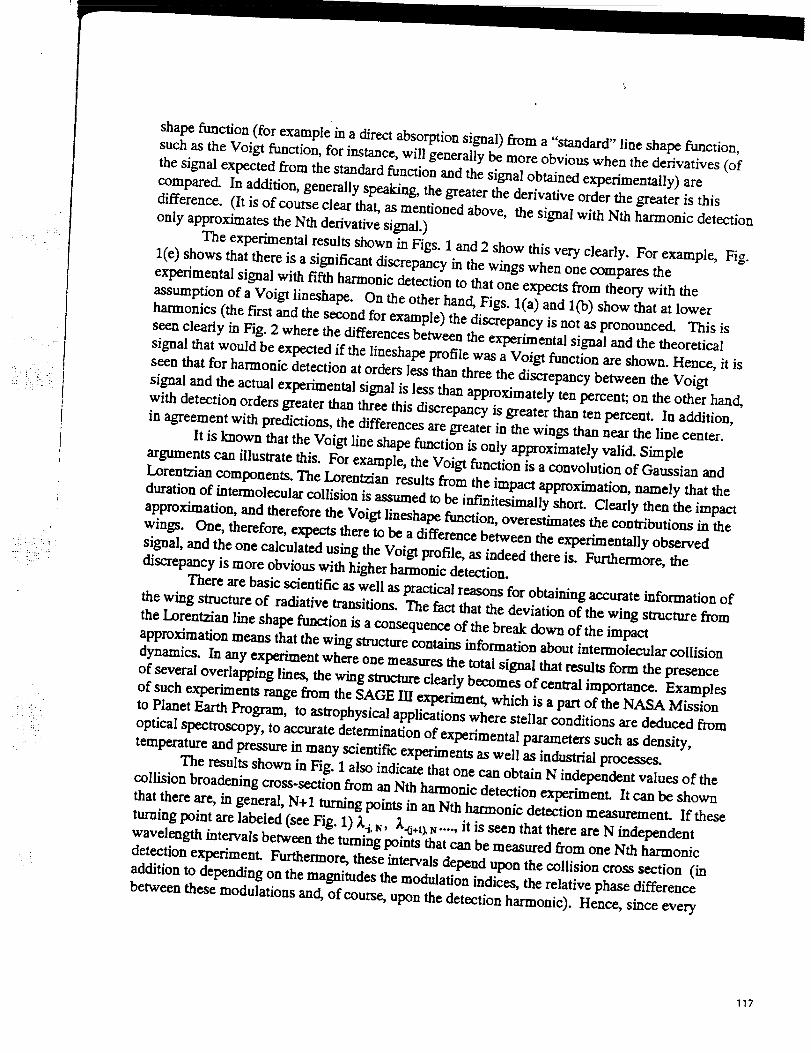
shape function (for example in a direct absorption signal) from a "standard" line shape function,
such as the Voigt function, for instance, will generally be more obvious when the derivatives (of
the signal expected from the standard function and the signal obtained experimentally) are
compared. In addition, generally speaking, the greater the derivative order the greater is this
difference. (It is of course clear that, as mentioned above, the signal with Nth harmonic detection
only approximates the Nth derivative signal.)
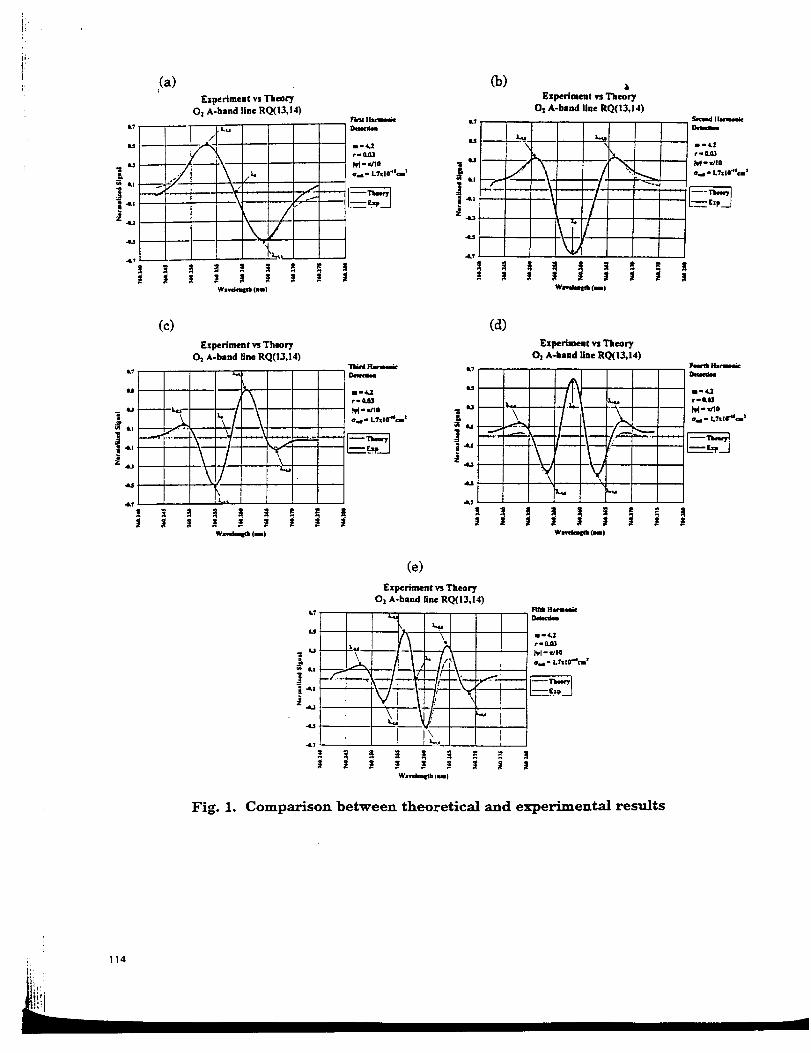
The experimental results shown in Figs. 1 and 2 show this very deafly. For example, Fig.
l(e) shows that there is a significant discrepancy in the wings when one compares the
experimental signal with fifth harmonic detection to that one expects from theory with the
assumption of a Voigt lineshape. On the other hand, Figs. l(a) and l(b) show that at lower
harmonics (the first and the second for example) the discrepancy is not as pronounced. This is
seen clearly in Fig. 2 where the differences between the experimental signal and the theoretical
signal that would be expected if the lineshape profile was a Voigt function are shown. Hence, it is
seen that for harmonic detection at orders less than three the discrepancy between the Voigt
signal and the actual experimental signal is less than approximately ten percent; on the other hand,
with detection orders greater than three this discrepancy is greater than ten percent. In addition,
in agreement with predictions, the differences are greater in the wings than near the line center.
It is known that the Voigt line shape function is only approximately valid. Simple
arguments can illustrate this. For example, the Voigt function is a convolution of Gaussian and
Lorentzian components. The Lorentzian results from the impact approximation, namely that the
duration of intermolecular collision is assumed to be infinitesimally short. Clearly then the impact
approximation, and therefore the Voigt lineshape function, overestimates the contn'butions in the
wings. One, therefore, expects there to be a difference between the experimentally observed
signal, and the one calculated using the Voigt profile, as indeed there is. Furthermore, the
discrepancy is more obvious with higher harmonic detection.
There are basic scientific as well as practical reasons for obtaining accurate information of
the wing structure of radiative transitions. The fact that the deviation of the wing structure from
the Lorentzian line shape function is a consequence of the break down of the impact
approximation means that the wing structure contains information about intermolecular collision
dynamics. In any experiment where one measures the total signal that results form the presence
of several overlapping lines, the wing structure dearly becomes of central importance. Examples
of such experiments range from the SAGE III experiment, which is a part of the NASA Mission
to Planet Earth Program, to astrophysical applications where stellar conditions are deduced from
optical spectroscopy, to accurate determination of experimental parameters such as density,
temperature and pressure in many scientific experiments as well as industrial processes.
The results shown in Fig. 1 also indicate that one can obtain N independent values of the
collision broadening cross-section from an Nth harmonic detection experiment It can be shown
that there are, in general, N+I turning points in an Nth harmonic detection measurement. If these
turning point are labeled (see Fig. 1) _'-i.N, _'-0.t), N.... , it is seen that there are N independent
wavelength intervals between the turning points that can be measured from one Nth harmonic
detection experiment Furthermore, these intervals depend upon the collision cross section (in
addition to depending on the magnitudes the modulation indices, the relative phase difference
between these modulations and, of course, upon the detection harmonic). Hence, since every
117
I
[] Second Harmonic Detection, N=2
O Fourth Harmonic Detection, N =4
A Sixth Harmonic Detection, N-6
0 2 3 4 5 6 7 8 9 10
n (x1019cm-3)--_
11
Fig. 3. Dependence of signal magnitude on density for variousharmonic detection orders
118
other parameter is measured, one effectively obtains N independent values of the collision cross-section.
We used this technique to measure the collision cross-section of rovibronic lines of the
Oxygen A band. For this purpose, the wavelength and amplitude modulation indices were
measured, together with the relative phase shift between them. The experimental signal could
then be reproduced, assuming a Voigt line shape function, and the appropriate collision cross
section was measured. For example, we see from Fig.1 that this measured cross-section is 1.7 x
10" is cm 2 for the RQ (13, 14) line.
3(b) Sensitive measurements of density, temperature and velocity fluctuations
We have shown [4] that the dependence of the signal magnitude on density depends
strongly on the detection harmonic order used. To a first approximation one obtains a linear
increase in the signal magnitude with density, for small densities in the regime corresponding to
the Doppler broadened regime, for all harmonic detection orders. When the density increases
above a characteristic density he.s, the signal magnitude falls approximately as ns. This region is
the corresponding collision broadened regime and delineated from the Doppler broadened regime
by n_.s, a density which depends strongly on the detection harmonic order. This characteristic of
the signal in the collision broadened region leads to the fact that the sensitivity of the signal to
density fluctuations generally increases with N. This is illustrated in Fig. 3. The practical
application of this behavior are clear: One may use a detection harmonic order greater than the
commonly used second to measure smaller fluctuations in density.
The characteristic of a higher harmonic detection signal, mentioned above, is actually
more general. For instance, assuming that the lineshape is a Voigt function, one can show that the
behavior of the signal magnitude, in the collision broadened regime, varies approximately as bs,
nO_nV Av_u qSvowhere b is the usual collision-broadening parameter given by b - - -
2A--v 2A'_ D A'-vD
The consequence of this is that the sensitivity of the measurement to density fluctuations (at fixed
temperature), or to the measurement of temperature fluctuations (at fixed density), as well as to
simultaneous fluctuations of both the temperature and density, is generally larger with higher
harmonic detection [4].
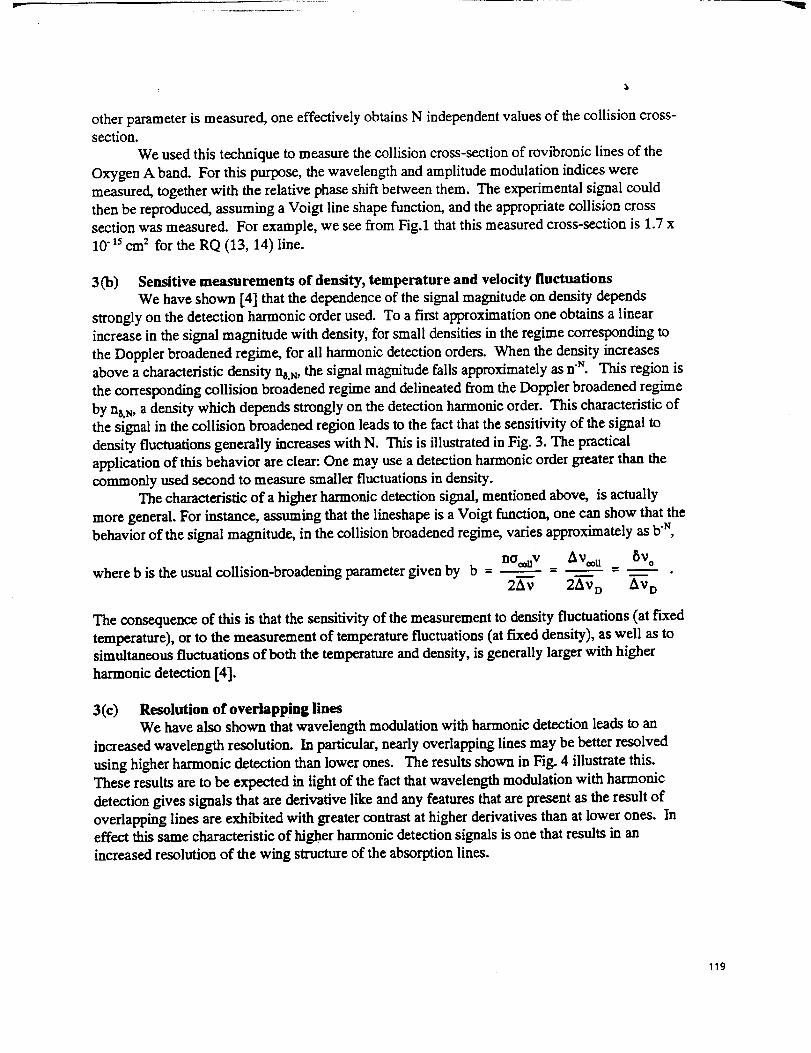
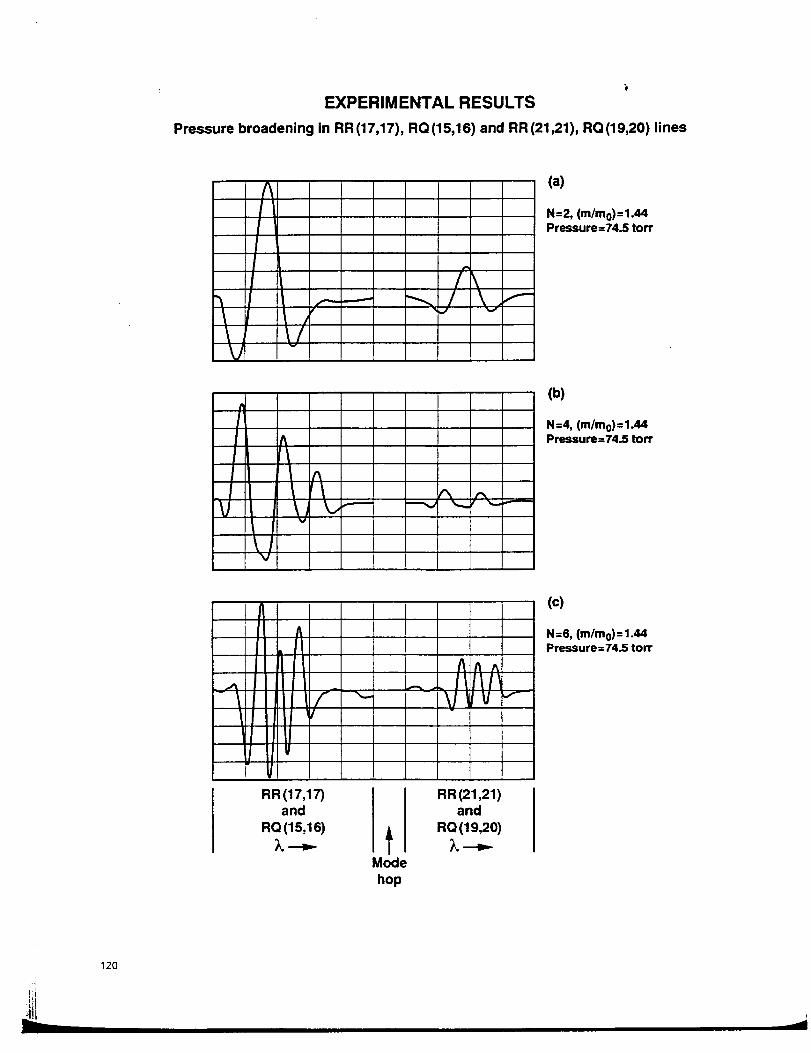
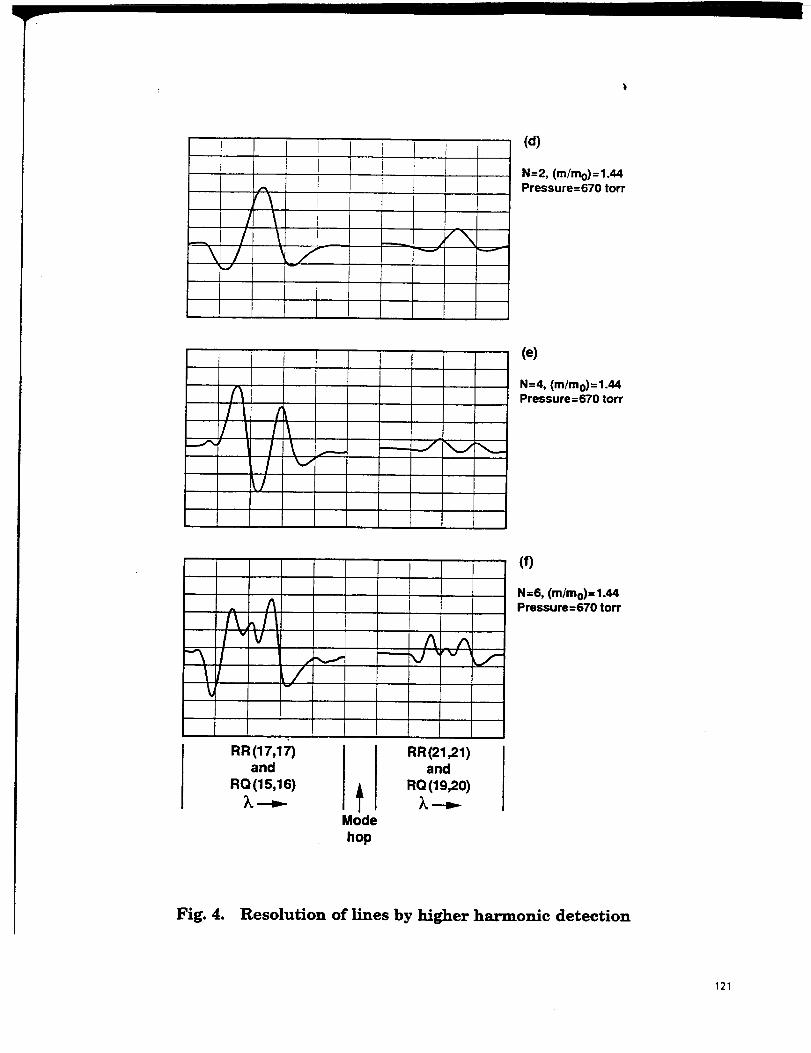
3(c) Resolution of overlapping lines
We have aZso shown that wavelength modulation with harmonic detection leads to an
increased wavelength resolution. In particular, nearly overlapping lines may be better resolved
using higher harmonic detection than lower ones. The results shown in Fig. 4 illustrate this.
These results are to be expected in light of the fact that wavelength modulation with harmonic
detection gives signals that are derivative like and any features that are present as the result of
overlapping lines are exhibited with greater contrast at higher derivatives than at lower ones. In
effect this same characteristic of higher harmonic detection signals is one that results in an
increased resolution of the wing structure of the absorption lines.
119
l
EXPERIMENTAL RESULTS
Pressure broadening in RR (17,17), RQ (15,16) and RR (21,21), RQ (19,20) lines
(a)
N=2, (m/too)=1.44Pressure=74.5 torr
V!
(b)
1 N=4, (m/too)=1.44/_ Pressure:74.5 ton"
I I _ ,'_ ,.,,V \ j t.,,_- -"_' '_' '-"-
v
V
-i
kl _IIIIll
III! t,It IIIll UVt
RR(17,17)and
RQ(1S,16)
I_ lt ^
.-... IIIII\1 i V <,,--
Mode
hop
RR(21,21)and
RQ(19,20)
(c)
N=6, (m/mo)=1.44Pressure=74.5 tort
120
J i J
i
JJ
(d)
N=2, (m/too)=1.44Pressure=670 torr
1,j\_.._..j- _-,,,,,_.
(e)
N=4, (m/mo)=1.44Pressure=670 torr
i____.,jA, ;v/_!
(f)
N=6, (m/mo)=1.44Pressure=670 torr
R.(17,17)and
RQ(15,16)
Mode
hop
RR(21,21)and
RQ (19,20)
Fig. 4. Resolution of lines by higher harmonic detection
121
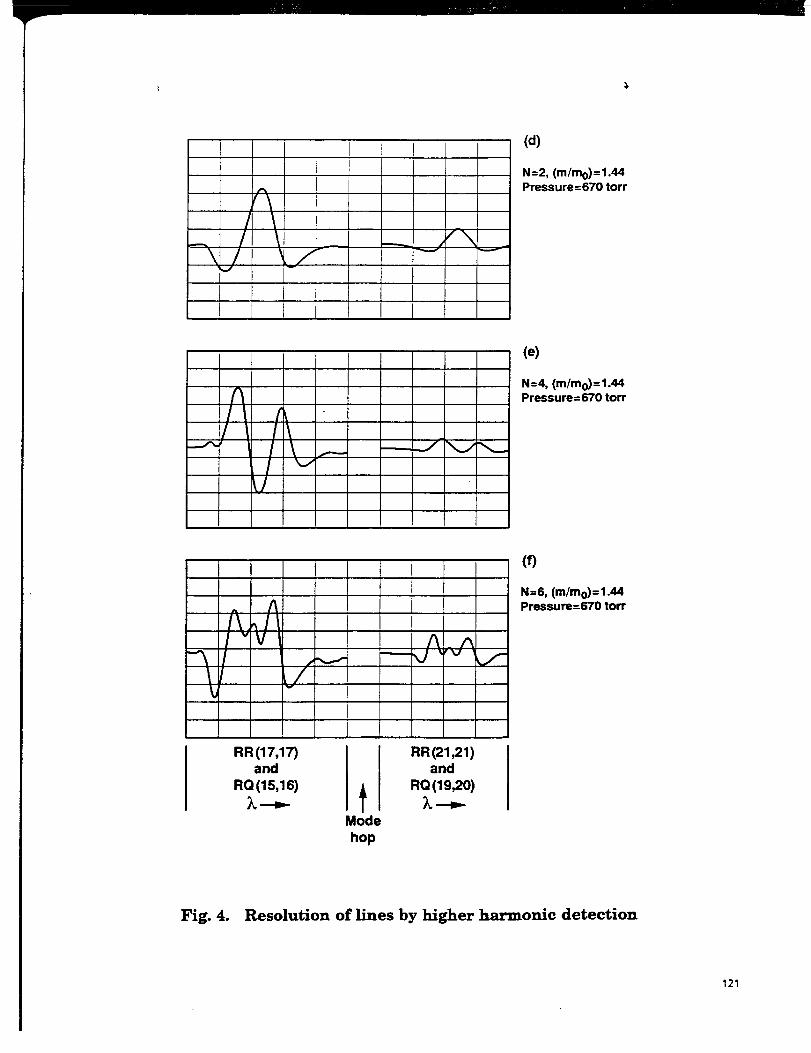
(d)
N=2, (m/mo)=l.44Pressure=670 tort
(e)
N=4, (m/too)=1.44Pressure =670 torr
__/ vv
qIIIh
(f)
N=6, (m/mo)=l.44Pressure=670 ton"
RR(17,17)and
RQ(15,16)
Mode
hop
RR(21,21)and
RQ(19,20)
Fig. 4. Resolution of lines by higher harmonic detection
121
ACKNOWLEDGMENTS
The authors are grateful to NASA for support of this work through Grant NAG1-1869.
In addition, AND gratefully acknowledges the support of a NASA-ASEE Summer Faculty
Fellowship. AMB also gratefully acknowledges the support of NASA through the Graduate
Student Research Program NGT-1-52131, as well as past support of the Virginia Space Grant
Consortium through its Undergraduate Scholarship Program.
.
2.
.
4.
.
6.
.
.
9.
4. REFERENCES
A. N. Dharamsi and A. M. Bullock, "Measurement of Density Fluctuations by
Modulation Spectroscopy", App. Phys. Letts.; 69, 22-24, 1996.
A. N. Dharamsi and A. M. Bullock, "Applications of Wavelength Modulation
Spectroscopy in Resolution of Pressure and Modulation Broadened Spectra", App.
Phys. B, Lasers and Optics; 63, 283-292, 1996.
A. N. Dharamsi, _Modulation Spectroscopy with High Harmonic Detect/on", J. Phys.
D., 28, 540-549, 1996.
A. N. Dharamsi and Y. Lu, _Density Fluctuation Measurements using Wavelength
Modulation Spectroscopy with High-Order Harmonic Detection", App. Phys. B, Lasers
and Optics, 62, pp 273-278, 1996.A. N. Dharamsi and Y. Lu, "High Resolution Spectroscopy using High-Order Derivative
Techniques", App. Phy. Letts., 65, pp 2257 - 2259, 1994.
A. N. Dharamsi and A. M. Bullock (Invited), _Diode Laser Modulation Spectroscopy
and its Applications", International Conference on Lasers '96, Portland, Oregon,
December, 1996.
A. M. Bullock and A. N. Dharamsi, "Diode Laser Sensor for Resolution of Congested
Spectra by Modulation Spectroscopy', IEEE (Institute of Electrical and Electronics
Engineers) Lasers and Electro-Optics Society Meeting, LEOS'96 9th Annual Meeting,
Paper Number MG6, Boston, MA, November 18, 1996.
A.M. Bullock, A. N. Dharamsi, W. P. Chu and L. R. Poole (to be published)
E. T. Gerry and D. A. Leonard, Appl. Phys. Letts., 8, 227, 1966.
122