Embed Size (px)
Citation preview
_____ 2 1065
55 LCSHD Paper Series
Department of Human Development
Poverty in Indigenous Populationsin Panama: A Study Using LSMS Data
Renos VakisKathy Lindert
January 2000
- The World Bank
Latin America and the Caribbean Regional Office
Pub
lic D
iscl
osur
e A
utho
rized
Pub
lic D
iscl
osur
e A
utho
rized
Pub
lic D
iscl
osur
e A
utho
rized
Pub
lic D
iscl
osur
e A
utho
rized


Human Development DepartmentLCSHD Paper Series No. 55
Poverty in Indigenous Populations in Panama:A Study Using LSMS Data
Renos Vakis
and
Kathy Lindert
January 2000
Paer prpae in this j; ;i~sij ar i~o forma pulcts of th World Bank They
ipresenlt preliniinaxy and .unpolished results ocount ry analysis or-reseach t t Oiis circulatedjj. ....................... A . .j s i . i i i .,,,,,,., - .ij, ,, . ; i = ji,, ...... jj,..,.. -- .., i. . ' li:... i i
accou-nt jof its- ijiproviio. nal jichaatr T;-jjihe, findings ,d,. jE; nte:pretat,ions, iiand conc luio,ns;expressedi in' 'hisi pape are eniitirely thos ofi' .th antor anibid'' iihouldnoti beii at ibutdj. -in -y
. iiii. .. i; .i .ii . .. ... : :. a Z 7. . .. .. ... .. .. .. .. .. .. .. .. .. .. ... ..i i D i ii . .. .. . .. .. .. .. .. ... . .. . . ......... i ; .... .. .. ..i .ji i. i .......... : -i i
mann,,er jto thej; W rld Bank itsi aftii at0d organizatlD j bers jinofo ito- Bo -ts 'f; Ex e dtive
Directors or the countriei they represent.~~~~~~~~.pq ryeear.'. .. ., . ...... .... .ii r i i f .......i .;:o ' ' i ' i.:. 't ii.. .... .......... .. ..... . ...... .... ... ... .. .. .. ....ii i ii ... ... .... ......i i ....iji j
The World BankLatin America and the Caribbean Regional Office

The authors would like to thank Mr. Carlos Sobrado for his advice and help on the LSMSanalysis and Mr. Harry Patrinos for his advice on language indicators of ethnic origin. They arealso extremely grateful to Ms. Enriqueta Davis, Elizabeth Katz, and Ximena Traa for theircomments and inputs. Finally, they would like to thank the Swiss Agency for Development andCooperation (SDC) for the financing provided for the LSMS and the analysis of indigenouspoverty.

TABLE OF CONTENTS
Preface
Part I: Indigenous People in Panama ................................................ 1
Part II: A Profile of Poverty Among Indigenous Groups ..................................6
Part III: The Assets of Indigenous Groups ............................................... 10
Part IV: The Determinants of Indigenous Poverty ............................................ 17
Part V: Summary and Recommendations ............................................... 19
Appendix 1: Agricultural Production by Ethnic Group .21
Appendix 2: Sampling and Ethnicity in the LSMS .23
Appendix 3: Wage Discrimination Against Ethnic Indigenous Workers .26
References .......................................................................................................... 28
PREFACE
Although "ethnicity" is a broad concept, relating to language, culture, and territory, surveyanalysis in Latin America has generally adopted one of three operational indicators to define indigenouspeople, depending on the availability of data, including: language spoken, geographic concentration andself-perception.' The Panama LSMS was designed to include "identifiers" for the first two indicators,namely language (maternal, second) and geographic concentration. Most of the analysis reported in thePoverty Assessment uses geographic area to distinguish between residents of indigenous, non-indigenousrural, and urban areas. These are mutually exclusive categories that are applied based on censusclassifications of each survey cluster. Geographic classifications have certain advantages, includingsimplicity of analysis and of future policy applications (e.g., geographic targeting). They are limited,however, in that they do not distinguish between distinct indigenous groups or between indigenouspopulations living within and outside indigenous areas.
This paper seeks to conduct a more in depth study of indigenous poverty using language indicatorsof ethnic orgin rather than geographic criteria. The objective is to analyze the living conditions of the mainindigenous groups, both within and outside the official census demarcations of indigenous areas. Theseinclude the Ngobe-Bugle, the Kuna, and the Emnbera-Wounan. The study seeks to paint a portrait ofindigenous poverty and to examine the various assets of the indigenous, including: labor, human capital,physical assets, financial assets, and social capital. The determinants of indigenous poverty are alsoanalyzed using multi-variate regression techniques.
Psacharopls and Pazzin-s (1994)
PART I: INDIGENOUS PEOPLE IN PANAMA
Overview of Panama's Indigenous Groups2
The 1990 census identified close to 200,000 indigenous residents in Panama, which representedabout eight percent of the national population. There are a number of distinct indigenous groups inPanama. The largest is the Ngobe-Bugle, followed by the Kuna and the Embera-Wounan.
The Ngobe-BuglI. The largest group, known as the Guaymi or the Ngobe-Bugle account for two-thirds of all indigenous people in Panama.3 They primarily live in the westem provinces of Bocas del Toroand Chiriqui. Their habitat is largely mountainous, with strong limitations for agricultural production.Primary crops include rice, flame, com and beans, bananas, and coffee (see Appendix 1). It is alsocommon for Guaymi workers to migrate temporarily to work on banana, coffee and livestock plantations.4
The Ngobe-Bugle traditionally live in very small, dispersed communities (6-8 households each onaverage), linked by family relations. This dispersion complicates the provision of basic services to Ngobe-Bugl6 communities. Land ownership is not generally collective, but rather acquired through inheritanceand user rights.5
Although there is not a long-standing tradition of centralized governing councils among the Ngobe-Bugle, a number of traditional figures have played an important role in enforcing cultural and social normsand mediating disputes.6 In the 1970s, at the initiative of the Government with support of the Kuna'sGeneral Cacique Estanislao L6pez, the Ngobes adopted a new type of governing organization based on theKuna model. This new organization includes the General Congress of the Ngobe-Bugle as well as theRegional Congresses of Bocas del Toro, Chiriqui and Veraguas. It involves massive participation andvoting of the Ngobe-Bugle population. The passing of Law 10 in March 1997 officially recognized thegroup as the Comarca Ngobe-Bugl6, as well as the ethic-cultural institutions of the group and the existenceof the General and Regional Congresses. It also established a number of official positions governing theNgobe-Bugle society, including inter alia the General Cacique, the Comarcal Governor, and regional andlocal caciques.7
Despite this autonomous Comarca status, public spending and revenue collection remain under thecontrol of Panama's Central Government, which must guarantee necessary allocations for administration,investment, and integrated development of the Comarca in each year's annual national budget. These flundsare channeled via state institutions with the collaboration of the General, Regional, and Local Congressesaccording to plans and programs elaborated by government agencies in coordination with indigenousauthorities.
The Kuna. The Kuna make up the second largest indigenous group in Panama, numbering closeto fifty thousand people in 1990 (one quarter of the total indigenous population). The majority of the Kunalive in the autonomous province of San Blas, also called the Comarca Kuna Yala. San Blas is largelymade up of an archipelago of some 365 islands on the Atlantic/Caribbean coast. This remote location
2 Ihis section draws on information fiom: Davis (December 1997) Alvarado (Febnuary 1998), and firm the 1990 National Population Census3 Alhough the Ngobe and Bugli are two distinct groups with important differences notably, ther language and marital traditions (polygamy iscommn among the Ngobe but not the Buglere), they share the same territory, organizational sysem, and many traditions.4Bourgois (1985) provides a rather graphic description of the working conditions facing the Guaynm plantation workers. He finds that Guaynliworkers have traditionally operated at the bottom of the worker hierarchy, below other indigenous workers in tems of pay, responsibility, and workingconditions.' Davis (December 1997).6 These include the Sukia, considered by the Ngobe to be a sacred personaliy sent by the Cosmic God (Donkin Kr! Kokwinbidi); the "Chief" (DonkinKri or Cacique), an elected political representative, the Patriarch (Patriarca orAnciano), a quasi-administrative authority of the extended family, thehousehold head (generally a male); and the oldest son. For more information, see Alvarado (February 1998).7 For more details see Alvarado (Febnury 1998) and Law 10 of March 7, 1997 Chapter 1.' Law 10 ofMarch 7, 1997, Chapter 5.

requires that contacts with the rest of the country rely on air and boat travel.9 Many Kuna also live in thePanama Province, largely in El Llano and Cafiitas in the Chepo District where the Comarca Kuna deMadungandi was recently established.'0
Agriculture is the primary activity of the Kunas, with corn constituting the main crop, followed bybananas, plantains, cabbage, coconuts, and avocados (Appendix Al. 1). Seafood firming also provides animportant source of livelihood for the Kuna. Artisan activities are likewise important, with womeninvolved in the production of ceramics and decorative shirts (la mola) and men working with wood.
Three types of tenancy arrangements govern land ownerslip in Kuna areas: (i) private inheritedland; (ii) virgin land "owned" by users when they cultivate it through invasion; and (iii) land that belongs tothe community that is worked by all members of the community (those who don't participate in workingcommunal lands must pay a local tax)."
The Kuna live in villages (aldeas) that are characterized by their strong cohesion and political andadministrative organization. This cohesion and organization is even prevalent among migrant urban Kunacommunities. The General Kuna Congress (CKG) was created in 1945 as the highest governing body. Itconvenes twice a year with five delegates headed by a "Sayla" (chief) from each of the 48 communities inthe Comarca. The CGK is represented in the Panamanian Govemment by three "Caciques Generales."The Congress has also created an Integrated Development Institute (IDIKI) as an NGO to administrate andimplement development projects at the Comarca level. A General Cultural Congress is responsible formaintaining cultural traditions and projects. Local Congresses are also active at the community level, asare work comnuttees and professional groups.'2 Social networks are also formed through certain domestictasks (e.g., women's groups formed around laundry and water collection; men's groups formed aroundhousing construction and harvests).
The Embera-Wounan (Chocoe). The Embera and Wounan (or Waunana) groups aredistinguished by their languages, but otherwise share the same rin-forested, tropical geographical area(concentrated largely in the Provinces of Dari6n and Panama),13 institutions and authorities. Agriculture,hunting and fishing are the primary economic activities of the Embera-Wounan. The primary crops includePeame, rice, beans, and com (through land clearing), as well as bananas and plantains (through plantationfarming), coconuts, and avocados (Appendix Al. 1).
The Embera-Wounan are the least formally organized indigenous group in the country, largely dueto their migratory settlement patterns: they tend to live in dispersed, family-based clans under semi-nomadicconditions along river basins. One traditionally important social figure among the Embera-Wounan is theJaibanA, with holy and medicinal fimctions. In the late 1960s, the Panamanian Government initiated anumber of changes to bring the Kuna model of organization to the Embera-Wounan, with General andRegional Congresses. Local authorities (called "Nokoes') have also been established. The neworganizational system was "ratified" by Law 22 in 1983 with the creation of the Comarca Embera-Wounan. Implementation of this new system has apparently been less successful among the Enibera-Wounan than anong the Ngobe-Bugle.
Other Indigenous Groups. Other indigenous groups include the Teribe, a monarchic group livinglargely in the Bocas del Toro Province, and the Bokotas (Buglere) and the Bri-Bri who live along the CostaRican border.
'Therae morc than 20 airatrips in the Comuca Kna Yala. Davis (Decmbe 1997)'° Law 24 of Januay 12.1996."Davis Decea 1997).1 See Alvarado (FebNaay 1998) for more details.3 The Embers-Wounan living in the Province of Panama ae largely conctat in the Dibicts of Chiin, Panama, San Miguelito, and Chepo.
Migration of the Embra-Wounan to the Provinc of Panamu is inreasing.
2

Defining Ethnicity Using the LSMS
Three operational definitions are explored to identify ethnicity using the LSMS:
* Definition 1: Maternal language. A person is classified into a particular ethuic group according tohis/her maternal (first) language;'4
* Definition 2: Any indigenous language. A person is classified as indigenous if helshe speaks anyindigenous language either as a maternal (first) or other (second) language;'5 or
* Definition 3: Any indigenous language in the household. A person is classified as indigenous ifhe/she or any person in the household speaks an indigenous language either as a maternal (first) orother (second) language.'6
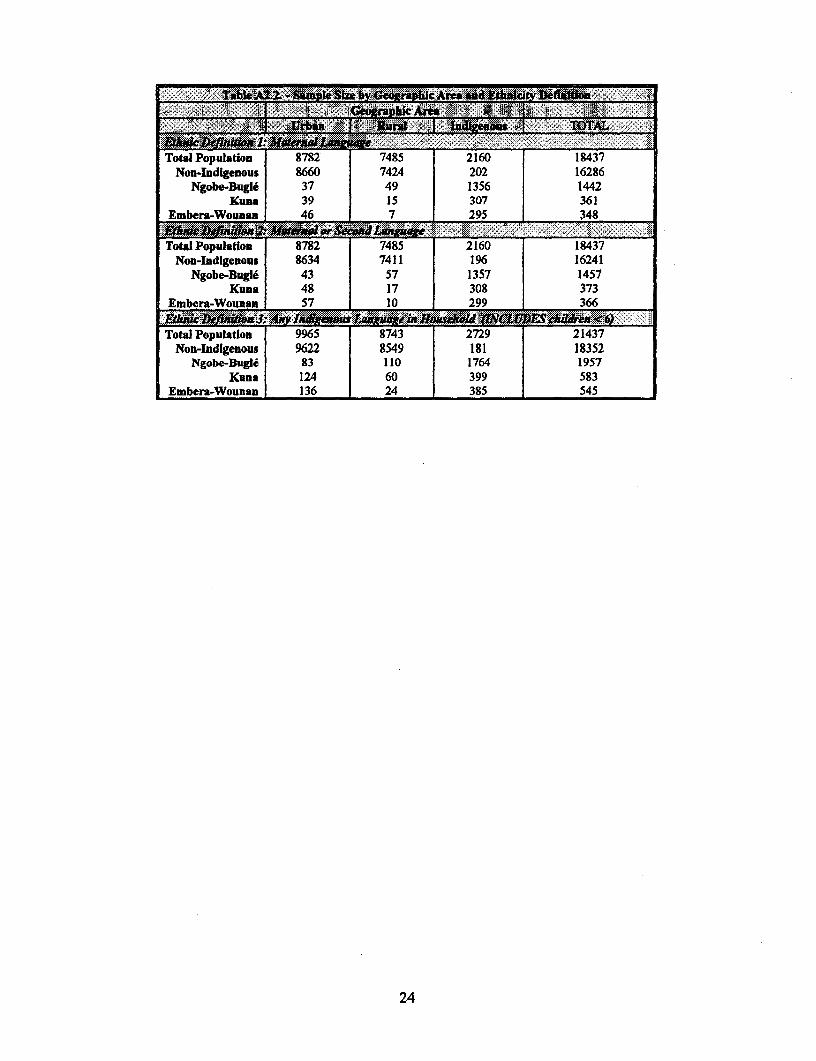
As discussed above, the main indigenous groups in Panama include the Ngobe-Bugle, Kuna,Embera-Wounan plus a few other smaller groups. Due to the small population size of the "otherindigenous" groups, however, these groups are combined with the Embera-Wounan for the rest of theanalysis."7 See Appendix A2 for a discussion of sampling issues and statistical significance testing.
All three definitions yield very similar patterns with respect to the ethnic distribution of thepopulation (Table A2. 1). Less than ten percent of the national population is classified as indigenous and theNgobe-Bugle account for about two thirds of the indigenous population. The Kuna and the Embera-Wounan account for the remainder with similar population shares.
The first two definitions yield almost identical results. As expected, Definition 3 classifies a largernumber of people as indigenous (about 271,000 under Definition 3 as compared with about 176,000 and182,000 under Definitions 1 and 2 respectively). One of the reasons is that with Definition 3, childrenunder six (for whom the language questions were not asked) are also taken into account, resulting in alarger sample. The larger share of indigenous with Definition 3 suggests that indigenous households havemore children relative to the non-indigenous households (as discussed below).
Geography and Ethnicity
The total number of ethnic indigenous is substantially larger than the number of residents classifiedas indigenous using geographic indicators of area. With Definition 3 (which includes children under agesix), for example, the total number of residents of indigenous areas is about 206,000. This compares withroughly 271,000 people counted as ethnically indigenous using Definition 3.
Table A2.2 presents the distribution of ethnic groups by geographic area. Less than ten percent ofresidents of indigenous areas are non-indigenous in their ethnicity regardless of definition. The ethnicNgobe-Bugle are mainly concentrated in indigenous areas (84-90 percent depending on the definition used).In contrast, a significant share of the Kuna and the Embera-Wounan live outside these areas (about halfusing Definition 3), mainly in urban areas implying significant migration of these groups in the cities.Migration may be a result of cultural patterns (e.g., the semi-nomadic behavior of the Embera-Wounan) orpart of households' economic decisions to seek better living conditions. Indeed, as discussed in more detailbelow, poverty levels seem to be lower among indigenous people living outside indigenous areas.
'4 This refess to quetion 12 in seion 4 of die LSMS.15 lhis refers to questions 12 and 13 in section 4 of the LSMS.
IThis definition includes children under 6 who were not asked the language questions in he LSMS. However, households in which only a maid or arenter speaks an indigenos language (with the other members speaking a non-indigenous language) are classified as non-indigenous.7 Therefore, all remaining tabks include "omer indigenous" people in the Embera-Wounan group. In the sample there are only 13, IX and 52observations for the "other indigenous" category coiesponding to Defuiitions 1, 2 and 3 respectively. This "oher indigenous" ethnic categoryrepresents about 1%oftheb1tal indiganus population in this sample.
3

All three ethnic definitions yield very similar results in terms of geographic tedencies. However, itis interesting to note that the pattns mentioned above get stronger with the more flexible definitions (e.g.Definition 3).l That is, although the distribution of the Ngobe-Bugl6 remains concentrated in theindigenous area, the shares of the Kuna and Ember-Wounan population living in the urban and rural areasincrease under Definition 3.
For simplicity, Definition 3 is used for the remainder of the analysis for a number of reasons.First, Definition 3 is more inclusive, capturing children under six, which increases the sample sizesignificantly and adds degrees of freedom for econometric analysis. Second, this definition enables theclassification of an entire household as indigenous or not. This is important for any econometric analysisthat explores ethnic diffierentials as possible explanatory variables. Finally, the other two definitions posesome limitations. For example, Definition 1 (native language) may exclude indigenous descendants thatdeclare Spanish as native language. Definition 2 (other language) may exclude indigenous people who donot speak an indigenous language or deny the knowledge of it but are nevertheless part of an indigenousgroup, its culture and characteristics.'9
Language Abilities of Indigenous Groups: Monolingualism vs. Bilingualism
In the above analysis, language indicators were used to classify people (and households) accordingto their expected ethnicity. The actual language abilities of individuals, however, are also an importantcharacteristic in their own right. Language abilities of the population - monolingualism (Spanish orindigenous languages only) or bilingualism - can have important policy implications, particularly in areassuch as education, health services, employment policies, and social programs.
Spanish-Spealdng Ability. As expected, the vast majority (83 percent) of Panamanians aremonolingual Spanish speakers (Table A2.3). Another 15 percent are bilingual. Only two percent of thetotal population does not speak Spanish.20 This could imply that investments in non-Spanish language-specific policies or programs might not be cost effective, given the small size of the group of potentialbeneficiaries.
One out of every five indigenous people, however, does not speak Spanish (Table A2.3). Onequarter of the Ngobe-Bugl6 and Kuna peoples are monolingual indigenous speakers. In contrast, only twopercent of the Embera-Wounan do not speak Spanish. A higher share of indigenous people living withinindigenous areas do not speak Spanish, particularly for the Ngobe-Bugle and the Kuna. Indigenous womenare less likely to speak Spanish than indigenous men: there are almost twice as many monolingualindigenous women as men. Interestingly, with the exception of children aged 6-11, the probability ofspeaking Spanish falls with age so that a higher share of the older groups speak only an indigenouslanguage.
Preservation of Indigenous Languages. A considerable share (15 percent) of ethnic indigenouspeople in Panama do not speak an indigenous language.2 ' The Kuna have the highest share of monolingualSpanish speakers (29 percent), followed by the Embera-Wounan (19 percent). The Ngobe-Bugl6 seem tohave preserved their language more than e other groups, with only eight percent monolingual Spanishspeakers, which probably reflects the smaller share of Ngobe-Bugl6 living outside indigenous areas.
hecorrelation coerflcints between area and the te language definitions are alo high. Defiition 1 = 0.42, Deinition 2 = 0.40 and Defmition 3= 0.35. lbefor there is consistency between the two tpes of ethmic classifications (geographic am and language).
Psacharhopuls and Parinos, 1994.2 Just ovr 3,400 people (less ta 0.2% ofth nationa population) in Panuma are monolingual speakers of Fngish or other languages different fromSpanisb or Indigenous. These people are classified as monolingual Spanish for the purpose of ffis analysis.2 1 Recall that thes people are classified as indigenous acoording to Definiion 3, whereby the indigenous classification applies if any nmnba of thehousehold (other than a maid or rente) speaks an indigenous lawua
4

Among all three indigenous groups, a larger share of ethnic indigenous people living outside indigenousareas speak only Spanish, suggesting that migration may be resulting in a loss of indigenous culture.
Moreover, it appears that the share monolingual Spanish speaking indigenous people is increasing,particularly among the Kuna and the Embera-Wounan, suggesting that the younger generations tend not tolearn their indigenous languages. A larger share of indigenous children aged 6-18 do not speak anindigenous language, as compared with other age groups (Table A2.3). Among the Kuna and the Embera-Wounan, the shares of Spanish speakers monotonically increase from older to younger, with a substantialshare of Kuna children (about forty percent) and Embera-Wounan children (over one quarter) not speakingtheir indigenous language. This compares with only nine percent of Ngobe-Bugle children aged 6-18 whodo not speak their language. This pattern parallels the fict that a larger share of Kuna and Embera-Wounan live outside indigenous areas, as compared with the Ngobe-Bugl6.
5
PART II: A PROFILE OF POVERTY AMONG INDIGENOUS GROUPS
Poverty Among The Indigenous
Poverty among indigenous groups in Panama is abysmal. Using the language definition ofethnicity,' some 83 percent of indigenous people live below the poverty line,2 as compared with one thirdof the ethnically non-indigenous population (Table A2.4).24 Extreme poverty is also much more prevalentamong the indigenous: 70 percent of indigenous people cannot satisfy their minimum daily caloricrequirements even if they allocated all of their consumption to food, as compared with 13 percent of theethnically non-indigenous living in extreme poverty.
These disparities are also refiected in the index of the depth of poverty: it is almost five timeshigher for the indigenous population as compared with the non-indigenous. Poverty is also more severeamong the indigenous, suggesting that the distribution of consumption among indigenous people is moreunequal than among the non-indigenous. That is, since the severity indicator assigns greater weight to thepoorest of the poor, there are more poor indigenous people living far below the poverty line (rather thanclustered closer to it).
A breakdown of the indigenous population by ethnic group reveals that poverty is most prevalentarnong the Ngobe-Bugle: 92 percent are poor and 82 percent live in extreme poverty. Poverty is also highamong the Embera-Wounan (80 percent), though a smaller share of the Embera-Wounan live in extremepoverty. The poverty rate among the Kuna is lower (65 percent) - which is closer to the incidence ofpoverty' in non-indigenous rural areas (63 percent).
Geography, Migration and Indigenous Poverty
Distinguishing between ethnically indigenous populations living within and outside geographicindigenous areas sheds light on some of the factors underlying the differences in the incidence of povertybetween indigenous groups (as shown in Table A6.6). Overall, poverty is far higher among the ethnicallyindigenous living within geographic "indigenous" areas as compared with their indigenous counterpartsliving outside these geographic areas. Whereas virtually all indigenous people living in indigenous areasare poor (96 percent), only half of indigenous people residing outside these areas live below the poverty line(53 percent). The geographic differences are even more stark for those in extrene poverty: while 87percent of indigenous people witiin indigenous areas live in extreme poverty, less than one quarter of thoseresiding outside these areas live below the extreme poverty line.
The incidence of poverty among the Kuna living outside indigenous areas is particularly low (34percent) - lower than the prevalence of poverty for the nation as a whole (37 percent). This is particularlysignificant, given that roughly half of all ethnic Kuna live outside indigenous areas (Table A6.3), in partdue to higher rates of migration (Table A6.7). Indeed, escaping poverty seems to be a prime motivation formigrating Kunas: economic reasons - moving in search of higher incomes, work, or educationalopportunities - accounted for 60 percent of recent Kuna migrants' decisions (Table A6.7). The apparent
22 Definition 3, as descibed above.21 This report defines the extreme poor as those whose total consumtion falls below an extreme poverty line ofB./519 per capita and the poor as thosewhose totl conumption falls below a full poverty line of BJ905 per apita (includingthe extreme poor). Se Anex 2 for details on the methodologyused to consruct the poverty lines as well as Ravallion (1992) for a more geneml discussion on povaty meaure nttokdoogies.2 lhe geographic demarcation of indigenous areas yields a slightly higher incidenmc of poverty for indigenous residents (95%); this is likely due tothe fact that poverty is hioher among the share of indigenous people living within indigenous areas and lower anong those living outside these areas(as discussed in more deal below).25 Usingi the geographic classification (see Main Poverty Assessmt Report in Vohmw 1).
6
loss of native language among this group (see Table A6.4) could signal a cultural cost of this decision,however.
Poverty among the Embera-Wounan and the Ngobe-Bugle living outside indigenous areas is stillquite high, though admittedly lower than among their counterparts living within indigenous areas. Thismay reflect the fact that social, rather than economic, reasons (family, marriage) seem to be the primaryforce causing the Embera-Wounan and the Ngobe-Bugle to migrate (Table A6.7).26
These patterns support the important conclusion that geography seems to be a more powerfuldeterminant of poverty than ethnicity (or culture) itself. This has the advantage that geographic targeting ismuch easier to administer - not to mention much less politically divisive - than the administrativenightmare that would be associated with targeting based on ethmicity or language.
Poverty and Language Abilities
Poverty among ethnic indigenous groups is highest among households that are headed bymonolingual indigenous speakers (Table A6.8). Virtually all households headed by monolingual indigenousspeakers live in extreme poverty. In contrast, among the ethnically indigenous, only 36 percent of thoseliving in households headed by monolingual Spanish speakers are poor and only 15 percent live in extremepoverty. Poverty is also deeper and more severe among those living in households in which the householdhead does not speak Spanish.
Malnutrition Among the Indigenous
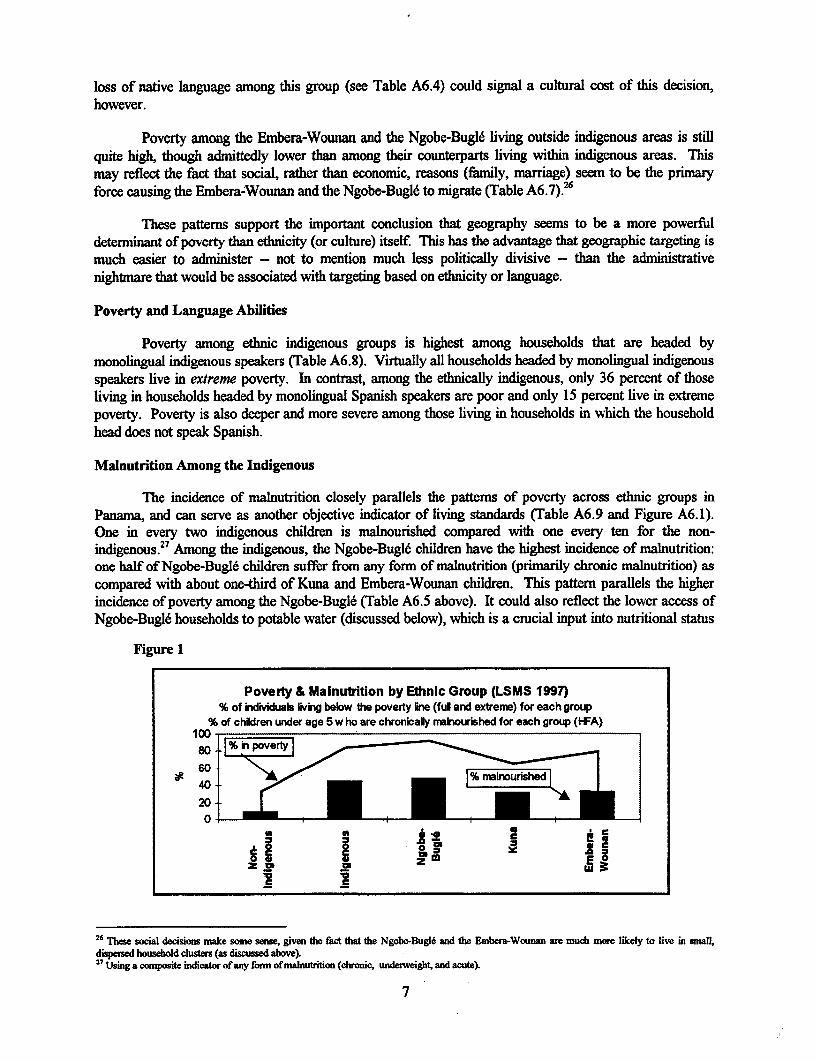
The incidence of malnutrition closely parallels the patterns of poverty across ethnic groups inPanama, and can serve as another objective indicator of living standards (Table A6.9 and Figure A6.1).One in every two indigenous children is malnourished compared with one every ten for the non-indigenous.27 Among the indigenous, the Ngobe-Bugle children have the highest incidence of malnutrition:one half of Ngobe-Bugle children suffer from any form of malnutrition (primarily chronic malnutrition) ascompared with about one-third of Kuna and Embera-Wounan children. This pattern parallels the higherincidence of poverty among the Ngobe-Bugl6 (Table A6.5 above). It could also reflect the lower access ofNgobe-Bugle households to potable water (discussed below), which is a crucial input into nutritional status
Figure 1
Poverty & Malnutrition by Ethnic Group (LSMS 1997)% of kidividuals livrig below the poverty Ink (ful and extreme) for each group
% of chidren under age 5 w ho are chronically rmilnourished for each group (HFA)100 80 1 % in poverly | %m'
ae40° :
z i,ul S~~~~~~~~~
2 6 These socal decons make some sense, given tie fact that the Ngob*-Bugd and the Enbera-Wounan are much mere likcly to live in smalldispersed household clusters (as discussed above).2Using a composite indicator of any form of malnutrition (chronic, undeweight, and acude).
7

as the consumption of unsafe water can lead to parasitic infections and diarrhea causing children's growthto falter.
More than half of the children living within indigenous areas are malnourished, while the incidencefor children living outside indigenous areas is less than 25 percent. In addition, while the incidence ofmalnutrition among indigenous children living in a household with a monolingual Spanish is very low (lessthan eight percents), children whose household head speaks an indigenous language (either monolingual orbilingual) have almost fifty percent chance of being malnourished. Both these findings correspond with thepoverty incidence results discussed above (Cables A6.6 and A6.8).
Household Structure, Fertility, and Poverty
Household Size. Indigenous households are by far the largest in Panama, reflecting both higherfertility and the practice of housing extended families in the same dwelling. Indigenous households average6.6 members, with the Ngobe-Bugle averaging the highest number, as compared with a 4.0 members fornon-indigenous households (Table A6. 10). This pattern holds even among the poor: poor indigenoushouseholds have an average of two members more than their poor non-indigenous counterparts.
Fertility. Higher fertility among indigenous women is one reason for larger household sizes.Fertility rates2 for indigenous women are 3.5 live births versus 2.9 for non-indigenous women.29 TheNgobe-Bugl6 have the highest rates of fertility (3.6). Indeed, indigenous households average 1.6 childrenunder twelve more than non-indigenous households (TableA6.10). Multivariate analysis confinns thehigher fertility rates among the indigenous, particularly the Ngobe-Bugle. Education clearly plays a role indecreasing fertility and poverty is associated with higher fertility (Table A6. 11).
Household Structure. Indigenous households also have a larger number of adults, on average,than their non-indigenous counterparts, probably reflecting the more common concentration of extendedfamilies in single dwellings among indigenous groups. Indigenous households average 2.7 adults aged 18-59, as compared with 2.1 among non-indigenous households (Table A6. 10). The number of senior citizensis lower among indigenous groups, however, particularly among the Ngobe-Bugle and the Embera-Wounan. Widespread poverty seems to drive these lower life expectancy rates among the indigenous, as asimilarly low number of elderly is also observed for the poor non-indigenous.
A much larger share of indigenous household heads are married than non-indigenous heads(Table A6. 10). The Ngobe-Bugl6 and the Embera-Wounan have a higher prevalence of married householdheads than the Kuna. Interestingly, these patterns correspond largely to the share of households headed byfemales, suggesting that female headship is largely correlated with non-married marital status of thehousehold head. A larger share of non-indigenous than indigenous households are reportedly headed bywomen. Among the indigenous, women head a larger share of Kuna households than Ngobe-Bugle orEmbera-Wounan.
Dependency and Poverty. As a result of larger and younger households, the indigenous appear tohave a higher dependency ratio3o than the non-indigenous, with dependency ratios of 3.2 and 2.9respectively (Table A6.10).31 The Ngobe-Bugl6 in particular have a high dependency ratio, averaging 3.8non-working dependents per working member. This implies that the generally lower incomes of workingmembers in indigenous households must be stretched across more people - and as a result, per capitaconsumption among the indigenous is generally lower than the poverty lines. Interestingly, poor non-
2 Ferlity rates ae age-speific (calculated as the number of live births for women bdween the age of 1549)29 Thse patterns remaun the same for t indigenous population across the constmption specrnwn. while poor non-indigenous women have slightlyhiger fcility ratest their non-poor countrpal'0 Deined as tre number of non-wokig members divided by the numnber of working membem31 This result is not statisaUy significant howev. See Appendix A6.2 below.
8

indigenous households have similarly high dependency ratios, suggesting that high fertility and largehouseholds are strongly related to poverty conditions.
9

PART III: THE ASSETS OF INDIGENOUS GRoUPs
Poverty is not a static situation. Rather, people tend to move in an out of poverty, as economic,household, and personal conditions change in the face of various risks. There is some evidence, and muchdebate, over the degree to which those in extreme poverty are able to move out of their destitute livingconditions. Data from several countries suggest that while the "moderately poor" are a fairly dynamicgroup, it is much more difficult for individuals to move out of extreme poverty - which affects a largeshare of indigenous people in Panama.
Multi-country analyses of the various coping strategies of vulnerable populations reveal that thepoor possess a number of assets, or means of resisting worsening living conditions.32 These assets can begrouped as follows: (i) labor; (ii) human capital (education and health); (iii) physical assets (housing, basicservices, and land); (iv) financial assets (savings, credit); and (v) social capital at the community level.33
This section examines these key assets of Panama's indigenous populations.
Labor Assets
Labor is the poor's most abundant asset. In a context of increasing economic insecurity, due tochanges in prices, wages, and public expenditures, the poor's response is to diversify income resources bymobilizing their labor. This can involve either intensifying existing income-generating strategies or creatingnew ways of earning income.34
Labor Force Participation. More than half the indigenous participate in the labor force(Table A6. 12). However, while three quarters of men participate, only one third of the women do. TheEmbera-Wounan have the highest participation rates among the indigenous for both men and women, whilethe Ngobe-Bugle the lowest. This may suggest cultural differences and the role of women in each ethnicgroup, but may also be an indication of different household strategies on labor allocation. However, theobservation that Ngobe-Bugle men have also the lowest participation rates among the indigenous, weakensthe latter argument. The labor force participation by age has the expected inverted U shape: participationis low for younger people, peaks up and decreases again for the old. In addition, participation increaseswith the level of education.
Unemployment and Underemployment Among the Indigenous. Overall, unemployment ratesare very low for the indigenous.35 Given the prevalence of poverty among the indigenous, the low levels ofunemployment likely reflect the fact that they cannot afford not to work. There are some signs that theindigenous are underemployed, however, given that they work fewer total hours than the non-indigenous(Table A6.13).
Employment. Half of the indigenous are employed in the agricultural sector (Table A6. 14). Inaddition, twenty percent are employed in commerce and twelve percent in community services. More thanninety percent of the indigenous are also employed in the private sector (Table A6.15). Two-thirds of allethnic indigenous workers find jobs in the informal sector (Table A6.16). Fonnal-sector employmentopportunities are more rare within geographic indigenous areas (Table A6.16). Job diversification andhigher intensity of work do not appear to be common among the indigenous: fewer indigenous have more
32 Mo (1996) plus specific country studies These studies have prinarily been conducted in urban areas. It would be intresing to use Moser's
pazticipatory methodolgy for analyzing the coping strategies of the indigenous poor. The LSMS, however, does provide some clues as to tese
33 Househod relations (extended families, etc.) can also be viewed as an asseL Moser (1996).34 Moser (1996)-35 Unemployment raes ae 2% for the ehnic indigenow overall, and 2% and 4% for indigenow men and women respectively.
10

than one job and the total number of hours worked is lower among the indigenous than the non-indigenous(Table A6. 17).
Sources of Income. The indigenous derive close to sixty percent of their total incomes from labor(Table A6.17). Self-employment generates about forty percent of labor earnings among the indigenous (ascompared with one quarter for the non-indigenous). Interestingly, the indigenous appear to be heavilydependent on transfers, with one fifth of their total incomes coming from such donations (mainly frompublic and private institutions, Table A6.17).36 This suggests a certain degree of dependence on - andvulnerability to changes in - external assistance.
Despite the large number of indigenous workers who are employed in farming, agriculturegenerates a surprisingly smali share of the total incomes of the indigenous (Table A6.18). This probablyreflects low productivity in the agricultural sector. The majority of agricultural output is used forsubsistence purposes atnong the indigenous, suggesting that they face higher transaction costs for themarketing of their outputs (transportation costs, access to markets, etc.).
Hourly Earnings and Discrimination. Hourly wages for ethnic indigenous people in Panama arearound 32 percent less than those for non-indigenous workers, with indigenous workers averaging B./l.6per hour as compared with over B./2 among the non-indigenous.37 Wage functions were estimated todecompose the wage gap between etinic indigenous and non-indigenous workers using the Oaxacatechnique described in Appendix A6.3. While 45 percent of the wage differential can be explained bydifferences in observable characteristics (education, experience, sector of employment etc.), 55 percent ofthe gap is unexplained and can be thought of as an upper bound on discrimination against indigenousworkers.
Education
Education is an important complement to labor, boosting its productivity and potential for incomegeneration. Indeed, the World Development Report 1990 showed that education levels and povertyreduction are closely linked. In addition, the recent emergence of the new growth theory trying to explaingrowth and its link to human capital has education at its core. It is a key vehicle with which a poorindividual can utilize to exit the vicious cycle of poverty.
Literacy among Indigenous Groups. In contrast with the non-indigenous population, in whichliteracy is virtually universal, close to one-third of the indigenous population cannot read or write (TableA6.19). While 80 percent of the Kuna are literate, 25 percent and 36 percent of the Embera-Wounan andthe Ngobe-Bugl6 respectively cannot read or write. Moreover, literacy is lower among the poor indigenousthan their poor non-indigenous counterparts.
Literacy is particularly low among indigenous women: close to 40 percent of all indigenous womenand almost one-half of Ngobe-Bugl6 women are illiterate. This type of gender gap is not observed amongthe non-indigenous Panamanian population, even among the poor.
Literacy is lowest among the indigenous who do not speak Spanish (Table A6.20). Only twentypercent of monolingual indigenous speakers read and write. In contrast, 92 percent and 94 percent ofbilingual and monolingual Spanish speakers of indigenous ethnic origin are literate.
Educational Attainment. The non-indigenous complete an average of four more years ofschooling than the indigenous population (Table A6. 19). Among those living below the poverty line, the
36 The LSMS does not distinguish between public and privat traees3 7 Sorc: Pana LSMS, 1997.
11

poor non-indigenous still complete more years of schooling than the poor indigenous. The gap ineducational attainmnent is narrowing somewhat among recent generations: indigenous children aged 12-17have on average two years of schooling less than their non-indigenous counterparts, as compared with agap of close to five years among those aged 25-39.
Among indigenous groups, the Kuna have the highest levels of educational attainment, averagingalmost seven years of schooling overall. In contrast, the Ngobe-Bugle (the largest indigenous group)average less than three years of schooling.
Indigenous men average about five years of schooling while indigenous women average just underfour. This gender gap appears to be closing among the recent generation, however: indigenous boys aged12-17 have just a 0.4 year advantage over their female counterparts, as compared with a gap of 1.8 forthose aged 18-24 and 2.2 for those aged 25-39.
Language ability - or rather Spanish-speaking ability - appears to be an important determinant ofeducational attainment (Table A6.20). Monolingual indigenous speakers - who tend to be the poorestgroup in Panama (see above) - average less than one year of schooling. This compares with 7-9 years fortheir bilingual and Spanish-speaking ethnic indigenous counterparts. Investments in bilingual education atthe primary level (with textbooks, materials, bilingual trained teachers, etc.) clearly appear to be importantfor helping monolingual indigenous children transition into the Spanish-speaking world - with betterchances of escaping poverty.
Current Enrollment. Although Panama has achieved virtually universal enrollment for primaryeducation among the non-indigenous population, some 17 percent of indigenous children aged 6-11 are notenrolled in primary school (Table A6.19). Enrollment is lower even among poor indigenous children ascompared with their poor non-indigenous counterparts. Enrollment is highest among the Kuna and theEmbera-Wounan and lowest among the Ngobe-Bugl6. An inability to speak Spanish appears to be aninportant deterrent of enrollment: only one half of monolingual indigenous speaking children aged 6-11 arecurrently enrolled in primary school, suggesting a widespread absence of bilingual services at the prinarylevel (Table A6.20).
A very small share of indigenous children enroll in secondary school (Table A6. 19). The share ofchildren enrolled in secondary school is twice as high for non-indigenous as indigenous children aged 12-17. While close to 43 percent of poor non-indigenous children enroll in secondary school, only 16 percentof poor indigenous children enroll (Table A6.19). Only eight percent of all monolingual indigenousspeaking children enroll in secondary school, and virtually none of them live below the poverty line (TableA6.20).
Virtually all indigenous children who do enroll in school go to public schools. This is also true fornon-indigenous children, particularly the poor. Interestingly, a much smaller share of indigenous studentswho are currently enrolled spend anything on school-related expenditures, such as enrollment fees, books,unifonns, etc. This could suggest financial assistance to indigenous students (particularly in the case ofenrollment fee waivers), but it could also probably indicates that indigenous children have less access totextbooks and other educational materials (which absorb the bulk of household spending on education, seeAnnex 4 of the Poverty Assessment). Indeed, only 52 percent of ethnic indigenous primary students and 85percent of indigenous secondary students report having books. This compares with 91 percent of bothprimary and secondary non-indigenous students with books.
Language Spoken at School. Spanish is clearly the dominant language for schooling in Panama(Table A6.21), even among the indigenous. Some indigenous students (15 percent) do report indigenouslanguages as the main language spoken at school, particularly at the primary level (Tables A6.21
12
and A6.22). Poor indigenous students are almost three times more likely than their non-poor indigenouscounterparts to attend schools in which indigenous language is the dominant language spoken, whichreflects the larger share of monolingual indigenous speakers among the poor. Among indigenous groups,the Kuna are the most likely to attend school in indigenous language.
Health and Health Care Services
Good health is another important aspect of maintaining human capital and labor assets (as well asa general source of wellbeing). Although health indicators are relatively strong in Panama, these indicatorsmask poor health status among the poor, particularly the indigenous. Infant mortality rates are 40-50 per1000 live births in indigenous areas (on par with low-income countries), despite a national average of 19per 1000. As discussed above, malnutrition among indigenous children is high. Intestinal diseases,malnutrition, and respiratory diseases still account for a significant share of deaths in predominantlyindigenous areas such as Bocas del Toro and San Blas; tuberculosis is also high in Bocas del Toro; andmalaria is commnon in Bocas del Toro, Darien, and Veraguas, all of which have high concentrations ofindigenous people. Indigenous communities in the LSMS also report problems with alcoholism.
The indigenous are less likely to seek medical treatment in case of illness or accidents than the non-indigenous. Among those reporting illness or an accident, some forty percent of the indigenous consulted amedical professional, as compared with about sixty percent of the non-indigenous (Table A6.23). This gappersists even among those below the poverty line (with the poor non-indigenous seeking treatmnent morecommonly than the poor indigenous). The indigenous generally use public health facilities, as do the poornon-indigenous in Panama (Table A6.23). The indigenous are four times more likely to self-treat illness athome than the non-indigenous, suggesting lower access to health facilities among the indigenouspopulation. The Ngob-lBugl& in particular have a higher frequency of self-treatment for illness at horne.This might be due to the fact that the Ngobe-Bugld traditionally live in very small, dispersed householdclusters, which hinders the provision of basic services. Indeed, the average distance to medical facilities forthe indigenous who sought treatment is 41 minutes and 55 minutes for the Ngobe-Bugle, as compared with32 minutes for the non-indigenous (it is presumably even further for those who did not seek treatment).
When the indigenous do seek treatment, they are much more likely to use health centers and sub-centers - and less likely to use hospitals - than the non-indigenous, irrespective of poverty status. They arealso less likely to pay for medical services. Close to half of all non-indigenous people who soughttreatment paid something for medical services, as compared with just over one-quarter of the indigenous(Table A6.23).
Physical Assets & Basic Services
Housing Conditions. Although there are significant cultural differences between the indigenousgroups in Panama, the LSMS suggests many similarities in the housing conditions among these groups(Table A6.24). A "typical" indigenous household lives in a hut (choza o rancho) or individual house.Indigenous houses tend to be quite crowded - averaging two rooms and 5-6 members per room. Inaddition, the materials used to construct these houses are less durable than the ones for non-indigenoushouses. Specifically, only half of the indigenous houses have ceilings made out of more durable materialssuch as concrete or metal compared with 94 for non-indigenous houses. Similarly, walls and floors in mostindigenous houses are made using wood, earth or thatch.
Housing Tenancy. Although the majority of indigenous households report "owning" their homes,the majority lack proof of ownership (62 percent of all households or 79 percent of those who own theirhomes), such as titles or deeds (Table A6.24). The lack of titling is higher among the poor indigenousversus the poor non-indigenous. While differences in titling could reflect cultural traditions with respect to
13

property allocations, the lack of tides can serve to block indigenous people from obtaining credit - animportant lever for escaping poverty and smoothing consumption - as these groups lack formal forms ofguarantees for borrowing.
Basic Services. In terms of access to basic services, indigenous groups are under-served for allservices, even in companson with the poor non-indigenous population (Table A6.24). The Ngobe-Buglehave the least access to all types of basic services. This probably reflects the fact that a larger share of theNgobe-Bugle live in indigenous areas compared with the Kuna and Embera-Wounan (Table A6.3 above)and the fact that the Ngobe-Bugl6 traditionally live in small, dispersed clusters of households, which greatlyhinders the provision of services.
Roughly half of all indigenous households have access to formal water supply (public or privatepiped connections), compared with more than ninety percent for non-indigenous households (Table A6.24).About forty percent of the indigenous get their water from rivers and streams while three percent get waterfrom wells. Among the indigenous groups, while four-fifths of the Kuna and Enbera-Wounan possessaccess to piped water (a siniilar share as that of poor non-indigenous households), only one-third of theNgobe-Bugle have access. Of those households that do not receive water from piped service, very few treatthe water (via boiling, filtration, or chlorine), giving rise to health concerns. In particular, while only 23percent of non-indigenous households treat water, even fewer indigenous households do so (seven percent).Interestingly, the Kuna treat water more than any other group (including non-indigenous).
Likewise, about half of all indigenous households lack any form of sanitation service (sewerconnections or latrines), raising concerns about potential contamination, environmental and public healthproblems (Table A6.24). The situation is particularly severe among the Ngobe-Bugle: almost two thirdslack sanitation services. Formal trash collection services are virtually non-existent among indigenoushouseholds. The lack of proper waste removal services in the Comarca Kuna Yala in San Blas has alreadycaused significant environmental damage and pollution in the fragile sea life surrounding the archipelago.
In terms of energy sources for lighting and cooking, most indigenous households do not haveconnections to electricity or gas, relying on informal sources such as kerosene, candles, and firewoodTable A6.24). Again, indigenous households have even less access to formal energy sources than poornon-indigenous households and the Ngobe-Bugle have the least access.
Access to Land. Half of allindigenous households own some land Figure 2(Table A6.25). This is in contrast to the Incomes Per Capia by Source and Land Class,non-ingenous, the majority of whom are, Bhnic Indigenous Populationlandless. However, of those who do own (LSMS 1997)land, the non-indigenous own more land so1500(19 hectares of land compared with only _ NAgri_seven for indigenous households). The B 1000 8 Agr.Kuna, who are the least poor of theindigenous groups, own the least amount 5of land (six hectares). Land mightactually be a constraint to indigenous _micomes: the landless have by far the Landless <lIh. 1-2h. 2-5ha. 5-15ha. >l5ha.highest per capita incomes (Figure A6.2).Those with some, but little land have the lowest, even those with a lot of land have lower incones than thelandless.
14

Land Tenancy and Titling. Due to legal restrictions on private ownership of land in indigenousComarcas3" LSMS shows that over three fourths of indigenous people who own land have no ownershiptitle; in the case of non-indigenous people, this proportion is slightly less than half ("Table A6.26).
Financial Assets
Savings. Savings are an important asset for consumption smoothing and investment. The LSMSreveals that 19 percent of the indigenous have savings, compared with more than 37 percent for the non-indigenous (Table A6.27). As expected, the poor have low savings (nine percent for the indigenous).Among the indigenous, the Kuna have the highest savings rates. This is consistent with the findings abovethat the Kuna are the wealthier among the indigenous groups. Of those who do save, the majority ofindigenous use public institutions to put their savings, such as the National Bank of Panama and the Cajade Ahorros.
Credit. The ability to purchase goods and services on credit is also an important tool forconsumption smoothing and investment. While most of the households requesting credit were approved,only eight percent of the indigenous solicited any credit, compared with fourteen percent for non-indigenous(Table A6.28). The most common reasons for not soliciting credit include the risks associated withindebtedness and a belief that they would not be approved. Of the indigenous who did solicit credit, lowincome was the main reason for being refused. Average borrowing amounts for the indigenous and non-indigenous do not differ substantially overall (B./3,742 and B./ 4,007 respectively). They are much loweramong the poor (particularly the indigenous poor). They are also lowest among those living withinindigenous areas (B./741 on average), suggesting limited geographical proximity to credit institutions inthese areas (as well as limited assets for collateral). Most credit obtained by the indigenous was forpersonal use (consumption smoothing).
Social Capital
Social capital - defined as norms, trust, and reciprocity networks that facilitate mutually beneficialcooperation in a community - is an important asset that can reduce vulnerability and increaseopportunities. The LSMS and the associated Social Capital Qualitative Survey (SCQS) indicate thefollowing trends in social capital among the indigenous (See Annex 18 of Volume 2 of the PovertyAssessment for details):
* Indigenous communities have higher social capital than non-indigenous communities. Four fifthsof indigenous communities in the LSMS community sample report having some sort of communityorganization, as compared with just half of urban communities and three quarters of non-indigenousrural communities. Horizontal connections, which manifest themselves through different organizationswithin the same community or via the establishment of links with groups in neighboring conununities -were also found to be the strongest in indigenous communities in the SCQS.
* Among the ethnic indigenous, social capital appears to be stronger for those living withinindigenous areas as compared with those living outside indigenous areas.39 A larger share ofindigenous households living within indigenous areas report participation in public-good type"community-oriented" organizations (local, community juntas, congresses, committees, and
3 The law creating the Comarcas Emberd (law 22 of 1983) and the Comarca Ngobe-BugM (Law 10 of 1997) state that lands defimited by sUchlaws conditute collective propefty of the respective Comarcas and that the rigt to use collective lands is adminisered by traditional indtigenousauthorities, in accodance with procedures in the oresonding Organic Acts. The laws only adcnowledge private properties and rights of posassionregistered at the time such laws wer enacted and establish restrictions on the sale of these properties to persons other than those of the Comarca.
"The results in this paragWh were tabulated using language indicators of ethnicity (Definition 3) and are not included in Annex 18.
,15

associations) than their counterparts living in urban and non-indigenous rural areas (36 percent versus26 percent respectively). Close to twice as many ethnic indigenous households living within indigenousareas report participation in community committees and associations as those living outside indigenousareas. In contrast, ethnic indigenous households living outside indigenous areas are close to two timesmore likely to join associations which yield higher private gains, such as cooperatives, a pattern alsofound in urban areas and among the non-poor in general. Migrating or settling in non-indigenous areasdoes seem to have an effect on social capital and community ties.
* Social capital appears to contribute to more positive perceptions of overall well-being. Despite theabysmal rate of poverty among indigenous communities, they report more positive perceptions ofchanges in overall well-being than their non-indigenous rural and urban counterparts. This optimismcontrasts with their perceptions of specific living conditions (such as the delivery of basic services),which were more negative than their non-indigenous counterparts. Stronger community ties - socialcapital - could account for the relatively positive perceptions of overall well-being among theindigenous, which otherwise contrast with generally abysmal economic conditions.
* Social capital also appears to be important as a tool to leverage external assistance. A highershare of indigenous communities with high or medium levels of social capital report receiving externalassistance (from the Govermment or NGOs) than tose with low social capital.
16
PART IV: THE DETERMINANTS OF INDIGENOUS POVERTY
While the univariate analysis presented above is crucial in understanding the relationship betweenthe indigenous and poverty, it is important to understand the interaction of all these factors as well. Thissection examines the correlates of poverty for the ethnic indigenous and non-indigenous in a multi-variatesetting so as to shed light on their relative importance. The analysis is useful, first, to verify the relativerole of the various factors in determining poverty status (and any differences for the indigenous and non-indigenous), and second, to assess the potential impact that policy-induced changes in these factors arelikely to have on the probability of being poor, holding all other factors constant.
It is important to note the limitations of this analysis at the outset. First and foremost, the analysisdoes not capture the dynamic impact of certain causes of poverty over tine. Most notably, the impact ofchanges in economic growth - most certainly a key determinant of poverty - cannot be assessed using thisstatic, cross-section model. Other dynamic factors that are likely correlates of poverty include variablessuch as past nutritional status of household members (which could affect their current productivity forexamnple). Second, the analysis is limited by the variables available at the household level from the 1997LSMS household survey. Other factors - such as social conditions, like social exclusion, discrimination,alcoholism or crime, or physical conditions, such as variations in climate or access to markets - could notbe included due to a lack of data at this level. Finally, though theory holds that many of the variablesincluded in the analysis do indeed contribute to ("cause") poverty (or poverty reduction), the statisticalrelationships should be interpreted as correlates and not as deterninants since causality can run both ways.
Key Correlates of Indigenous Poverty
Estimation results for the probability of ethnic indigenous households being poor4" are presented inTable A6.29. The findings are discussed below.
The key assets described above - labor, education, basic services, and physical assets - are clearlycorrelated with poverty status among the indigenous. Other correlates of poverty include geographiclocation and household size and composition.
Labor: Sources of Income and Employment. Informal-sector employment is clearly correlatedwith poverty among indigenous households. Those whose main income is derived from informalemployment have a significantly higher probability of being poor than those with incomes coming from theprivate formal sector, the public sector, or non-labor earnings.
Education. Education is clearly correlated with poverty status and plays an important role inreducing poverty.41 The higher the education of the household head or his/her companion, the lower thehousehold's probability of being poor. Completing schooling (primary or secondary) significantly reducesa household's chances of being poor.
Housing Conditions and Tenancy. Low quality housing is strongly correlated with poverty,though the direction of causality is not clear. Poverty itself is a cause of makeshift housing, but low qualityhousing can also limit the ability of households to use their homes as a productive asset - as a location of
The "magna effects" column shows the percatage cne in poverty status associated with a unit dcange in the explanatory variable. A negativesign on a coefficient generaly meas that an incresed value of the variable reduces the probability of being poor. Maddala (1983) offers aconprehensive exposition of the econometic methodology implemented in this section."The analysis uses the maxinmm educational attainment of the household head or his/her companion to gauge the relationhp bdween education andpoverty. Since e6cationa attaimnent of these members (aduIts) precedes their curent economic status, it could validly be considered as having ac_auive influence on poveaty status.
17
independent businesses for example. Larger houses (more rooms per capita) are correlated with lowerlevels of poverty. Home ownership and tenancy status does not appear to have a significant impact on theprobability of being poor for the indigenous.
Basic Services. Access to basic infiastructure services improves the well-being and productivityof the poor and enhances their ability to use their homes for independent businesses. Lack of access tosanitation services (with only latrines) is strongly correlated with poverty. Further distances from the watersource (as a proxy for access to water) are associated with a higher probability of being poor.
Other Physical Assets. Ownership of equipment is associated with a lower probability of beingpoor. Equipment can be viewed as a proxy of wealth or physical assets, which would clearly be related topoverty status.
Credit. Access to credit is significantly correlated with a lower probability of being poor. Creditallows households to smooth consumption in the face of income fluctuations and to invest in productiveactivities for future income generation.
Fertility, Household Size and Composition. Larger indigenous households tend to be poor.Households with more young children (reflecting higher fertility) have a higher probability of being poor,presumably due to the dependency status of these members.
Geographic Location. Even after controlling for key household characteristics, geography playsan important role in determining poverty status. Ethnically indigenous households within indigenous areasare more likely to be poor than those located outside indigenous areas, even after other differences aretaken into account. Interestingly, indicators of ethnicity were not significant, again supporting the notionthat geography is a more powerful determinant of poverty (as discussed above).
Comparison with the Determinants of Poverty for the Non-Indigenous
The factors associated with indigenous poverty are largely the same as those correlated withpoverty among the non-indigenous (Table A6.30).42 This suggests that, while the determinants of povertyare fairly constant regardless of ethnicity - and include endowments and use of key assets, such as labor,education, basic services and physical assets, as well as geographic location and household structure - theethnic indigenous have a higher incidence of poverty because of poorer endowments of these assets. Infact, in a joint regression for all Panama, ethnicity did not turn out to be significant as a correlate ofpoverty, whereas key assets and geographic location (inside vs. outside indigenous areas) did, suggestingthat it is these factors and not ethnicity per se that are associated with poverty.
42 Signpficance levels are stronger overall because the non-indigenous sample is lrger.
18

PART V: SUMMARY AND RECOMNDATIONS
A number of key patterns emerge with respect to the profile of poverty among the indigenous inPanama:
* Poverty among the indigenous is abysmal (83 percent of ethnic indigenous live below the poverty lineand 70 percent live in extreme poverty). Poverty is highest among the Ngobe-Bugle (the largestindigenous group: 92 percent are poor), followed by the Embera-Wounan (80 percent), and the Kuna(65 percent). Indicators of child malnutrition mirror these pattems.
* Geography is an important determinant of poverty: indigenous people living within indigenous areashave a significantly higher incidence of poverty than those living outside these areas. This result isparticularly pertinent for the Kuna and the Embera-Wounan, about half of whom live outsideindigenous areas. Indeed, economic factors appear to be the prime motivation for migration among theKuna. A loss of indigenous language speaking ability, however, seems to be one of the costs of suchdecisions, as a larger share of ethnic indigenous people living outside indigenous areas speak onlySpanish.
* An inability to speak Spanish is also associated with destitution. Poverty among the ethnic indigenousis highest among those households that are headed by monolingual indigenous speakers: virtually alllive in extreme poverty.
* Large households and high fertility are strongly associated with indigenous poverty, as lower incomesmust be spread across more members.
A review of the assets of the indigenous suggest that indigenous poverty reflects insufficientendowments of key assets - or obstacles to their efficient use in the market:
* While labor is one of the most abundant assets among the indigenous, returns to this asset are low dueto: underemployment and low productivity, limited employment opportunities outside the informalsector (where earnings are significantly lower, see Annex 11), and probable wage discrimination inlabor markets.
* Although education is a clear vehicle for escaping poverty (and serves as an input into other neededareas such as family planning), educational attainment among indigenous people is very low,particularly among the Ngobe-Bugle. Despite almost complete coverage of primary schooling inPanama (even among the non-indigenous poor), a substantial share of indigenous children do not enrollin, or complete, primary school. Very few attend secondary school. An inability to speak Spanishappears to be a significant deterrent of school enrollment and there are few opportunities for indigenouschildren to attend bilingual schools.
* Health indicators are also worse among the indigenous, and access to health services is much morerestricted.
* Housing quality is low among the indigenous, and most do not possess titles or proof of ownership fortheir homes.
* The indigenous are largely under-served with respect to basic services, such as water, sanitationservices, and energy sources, particularly the Ngobe-Bugle.
* The indigenous have few financial assets either in the form of savings or access to credit.
* In contrast with the above assets, social capital is quite high among the indigenous. These communitybonds seem to be effective in generating positive perceptions of overall well-being and in leveragingextemal assistance.
19

The above analysis sheds light on a number of policy reommendations:
* Additional public resources need to be allocated to poverty reduction efforts among the indigenous.Geographic targeting to indigenous areas can be a useful tool in making (and monitoring) suchallocations since: (a) poverty is highest and most widespread in these areas (even among the ethnicindigenous); and (b) geographic targeting is more administratively simple than targeting based onethnicity or language.
* The Government should seek to make effective use of the high degree of social capital in indigenouscommunities, working with indigenous organizations to prioritize, design, and implement solutions andinterventions for poverty reduction.
* Two key priority areas for public investment that are crucial for longer-term poverty reduction wereidentified by the indigenous communities themselves (see Table A6.3 1) include education and potablewater:
* With respect to education, the Government should provide additional resources for bilingualmaterials, textbooks, and teacher-training at the primary level. Additional research usingqualitative methods (focus groups, etc.) would also be beneficial to further explore the barriers tohigher educational attainment among indigenous children.
X With respect to potable water, the Ngobe-Bugle have by far the highest gaps in access to this vitalinput into well-being (and consequently the highest rates of malnutrition). Additional resourcesshould be provided in a coordinated manner (to avoid overlaps and conflicts between programs) soas to improve the access of indigenous groups (particularly the Ngobe-Bugl6) to potable water.
* Given the high degree of poverty and extreme poverty among the indigenous (particularly those livingwithin indigenous areas), social assistance in the form of transfers is urgently needed for alleviatingpoverty in the short run. For larger impact, such transfers should include those with long-terminvestment benefits, such as those linked to educational attendance (e.g., targeted school feedingprograms or cash transfers tied to attendance).
20

APPENDix 1: AGRICULTURAL PRODUCTION BY ETHNIC GROUP
Table Al.1. - Absolute Value of A irkudtural ProductionBJ'0o TOT NI i NB K EWVaca, toros, temero 117,582 115,641 1,940 1,005 935 0Arroz 57,255 55,553 1,701 677 108 915NNarne 34,123 23,926 10,197 7,156 11 3,029Cerdos o puercos 34,578 34,073 504 376 15 112Mazorca/grano seco 22,656 19,317 3,338 939 1,472 927Cafe 24,061 23,534 527 527 0 0Leche 16,491 16,491 0 0 0 0Gallinas o polos 11,412 10,400 1,011 636 249 126Platano 5,789 4,077 1,711 30 231 1,450Frio de bejuco 4,720 3,322 1,398 1,268 22 108Zapallo 5,616 5,153 462 0 461 1Yuca 4,239 3,975 264 158 49 57Aguacate 4,982 4,579 403 8 27 368Pimento 5,676 5,676 0 0 0 0Maracuya 4,923 4,923 0 0 0 0Mazorca/malz 4,058 3,933 125 90 1 35Banano-Guineo 2,983 770 2,211 1,409 680 122Tomate perita 3,598 3,594 4 0 4 0Papaya 3,169 3,169 0 0 0 0Canna de azucar 3,340 3,340 0 0 0 0Poroto 2,945 2,945 0 0 0 0Perejil 2,332 2,332 0 0 0 0Tree i 2,148 1,776 373 42 54 277Bollositortillas 1,950 1,789 161 51 48 61Sorgo 2,329 2,329 0 0 0 0Al other crops 28,390 25,798 2,592 1,001 728 863Total 411,345 382,415 28,922 15,373 5,095 8,451Source: Panama LSMSNI = non-indigenous; I = indigenous; NB 2 Ngobe-Bugl6; KEW = Embera-Wounan
21

Table At.2. - Percent of Aaricutural Produon per GroupAl NI I NB K EW
Vaca, toros, ternero 29% 30% 7% 7% 18% 0%Arroz 14% 15% 6% 4% 2% 11%Name 8% 6% 35% 47% 0% 38%Cerdos o puercos 8% 9% 2% 2% 0% 1%Mazoroa/grano seo 6% 5% 12% 8% 29% 11%Cafe 6% 6% 2% 3% 0% 0%Leche 4% 4% 0% 0% 0% 0%Gallinas o poilos 3% 3% 3% 4% 5% 1%Platano 1% 1% 6% 0% 5% 17%Frjol de bejuco 1% 1% 5% 8% 0% 1%Zapallo 1% 1% 2% 0% 9% 0%Yuca 1% 1% 1% 1% 1% 1%Aguacate 1% 1% 1% 0% 1% 4%Pimento 1% 1% 0% 0% 0% 0%Maracuya 1% 1% 0% 0% 0% 0%Mazorcalmalz 1% 1% 0% 1% 0% 0%Banano-Gulneo 1% 0% 8% 9% 13% 1%Tomate perita 1% 1% 0% 0% 0% 0%Papaya 1% 1% 0% 0% 0% 0%Cann de azucar 1% 1% 0% 0% 0% 0%Poroto 1% 1% 0% 0% 0% 0%Perejil 1% 1% 0% 0% 0% 0%Tree I 1% 0% 1% 0% 1% 3%BollosAortilas 0% 0% 1% 0% 1% 1%Sorgo 1% 1% 0% 0% 0% 0%AN other crops 7% 7% 9% 7% 14% 10%Total 100% 100% 100% 100% 100% 100%Source: Panama LSMS 1997NI = nonIndigenous; I = indigenous; NB = Ngobe-BugI6; K =EW = Embera-Wounan
22

APPENDIX 2: SAMPLING AND ETHNIcrrY IN THE LSMS
Sample design
In the Panama LSMS 1997, indigenous households were over-sampled so as to ensure adequate samplesize. In addition, a two-stage sampling design was implemented in which primary sampling units (PSU)were first randomly chosen from regions and households were then randomly chosen from each PSU. Assuch, statistical analysis must take into account the sample design. Furthermore, even with over-samplingof indigenous populations, there are cases in which the sample size is small and carefull statistical treatmentis essential.
With this in mind and, given the data collection design, the statistical analysis in this paper is performedusing stratification tools that takes into account both the sample design as well as the sample sizes of eachsub-population.43 As a basic check, Tables A2. 1 through A2.4 summarize the sample sizes of some of themain categories used in this analysis.
Statistical Significance
All results discussed in the paper were tested for statistical significance. Since the LSMS does not use astandard random sample and the sample size for the indigenous is not large, standard tests of significancebased on large sample properties and random sampling are not valid. As such, statistical testing forsignificance for all means comparisons discussed in the paper takes into account the non-random design ofthe data by using the appropriate weights and stratification tools to correct for any biases. All resultspresented in the paper were statistically significant (most at the 99% level of confidence), with theexception of the means comparisons for dependency ratios, as noted in the text.
Tabl A2.. '-LWSSm nlc Dst$airb forg,so WiaDef_i_tion I Definition 2 Defintion 3
Ngobe-MBW 1442 1457 1957KUna 361 373 583Embera-Wounan 335 349 493Other Indigenous 13 17 52Total 2151 2196 3085Source: LSMS Panama 1997.Definition 3 includes children <age 6.
43 See Deaton (1997) for feather readings on straificatiom
23
Total Population 8782 7485 2160 18437Non-Intlgenous 8660 7424 202 16286
Ngobe-Bugle 37 49 1356 1442Kuna 39 15 307 361
Emnbera-Wounan 46 7 295 348
Total Population 8782 7485 2160 18437Non-Indigenous 8634 7411 196 16241
Ngobe-Bugle 43 57 1357 1457Xuna 48 1 7 308 373
Embera-Wounan 57 10 299 366
Total Population 9965 8743 2729 21437Non-Indigenous 9622 8549 181 18352
Ngobe-Bugle 83 110 1764 1957Kuna 124 60 399 583
Embera-Wounan 136 24 385 545
24

Ethnic Group: Monolingual Mondingual Blingual TOTALSpanish Indigenous
Total Population 16473 579 4327 21437Non-Indigenous Population 16371 0 1981 18352Ethnic Indigenous Population 190 549 2346 3085
Living in indigenous area 27 514 2007 2548Living outside indigenous area 163 35 339 537
Male 96 282 1225 1603Female 94 267 1121 1482
6-11 32 108 449 58912-17 26 99 378 503
Age 18-24 23 66 268 35725-39 42 90 385 51740-59 20 69 274 363
> 60 10 29 74 113Ngobe-Bugl6
Living in indigenous area 27 373 1364 1764Living outside indigenous area 58 9 126 193
Male 44 206 797 1047Female 41 176 693 910
6-11 16 78 294 38812-17 11 70 250 331
Age 18-24 8 46 161 21525-39 17 60 237 31440-59 10 52 162 224> 60 7 12 33 52
KunaLiving in indigenous area 0 135 264 399
Living outside indigenous area 82 21 81 184Male 42 72 162 276
Female 40 84 183 3076-11 14 27 46 87
12-17 12 28 58 98Age 18-24 8 20 44 72
25-39 22 29 59 11040-59 9 15 57 81> 60 3 16 24 43
Embera-WounanLiving in indigenous area 0 6 379 385
Living outside indigenous area 23 5 132 160Male 10 4 266 280
Female 13 7 245 2656-11 2 3 109 114
12-17 3 1 70 74Age 18-24 7 0 63 70
25-39 3 1 89 9340-59 1 2 55 58>60 0 1 17 18
>a1A~. H oiisekod Sampk$ by;3Sthniciyf~ pct Group
Tot. NI I N-B K E-W MS MI B
Extreme Poor 6003 3526 2477 1695 414 364 3544 520 1939AEr Poor 9413 6665 2748 1834 442 472 6549 523 2341NonPoor 12024 11687 337 123 141 73 10012 26 1986Source: LSMS 1997. NI = Non-indigenous; I = Indigenous; N-B = Ngobe-Bugl6. K =Kuna; E-W = Embera-Wounan
25

APPENDIX 3- WAGE DISCRIMIATION AGAINST ETHNIC INDIGENOUS WORKERS
Methodology for Measuring Wage Discrimination. Using Oaxaca 's (1973) technique it is possible todecompose the earnings gap between two groups (in this case between non-indigenous and indigenousworkers) into a component which is largely attributable in human capital endowments, and a componentthat reflects largely wage discrimination. The technique involves estimating separate wage regressions forthe two groups of interest (A and B) as:
(1) In wA = XA (bA) + EA for group A and
(2) In wB = XB (bB) + £B for group B
where the subscripts 'A' and 'B' refers to group A and B respectively; In (w)'s are the log of wages, X'sare a vector of characteristics, b's are the coefficients and E's are the error terms.
The analysis in this paper is based on wage regressions, excluding eamings from self-enployment (since aself-employed individual would not discriminate against him/herself). The difference in the average log ofwages is equivalent to the percentage difference between non-indigenous and indigenous pay. Given thatthe error term in the non- indigenous and indigenous wage functions has a mean of zero, we can show that:
(3) In WA - In WB = [ XA (bA) - XB (bB)]
where XA and XB are the average values of non- indigenous and indigenous characteristics in the sample.Re-arranging, equation (3) yields:
(4) In WA - In WB = 1XB (bA -b )] + 1bA ( XA -XB)1
Therefore, the difference in pay comes from two different sources. The first term represents wage gapsattributed to differences in the returns (bA - bB ) that groups A and B receive for the same endowment ofincome generating characteristics. The second term represents wage gaps attributed to differences in theendowments of income generating characteristics ( X5A - XB) evaluated with group A's worker paystructure. The former part is said to reflect wage discrimination while the latter captures wage differentialsfrom differences in endowments.
The use of earning functions to estimate discrimination means that there will be omitted variables not"explaining" wage differentials. Therefore, the discrimination part of the decomposition does not onlyexplain wage differences due to discrimination but in addition, due to omitted variables. In this sense it isoften said that te discrimination part serves as the upper bound of "unjustified" or "unexplained" wagediscrimination.
26
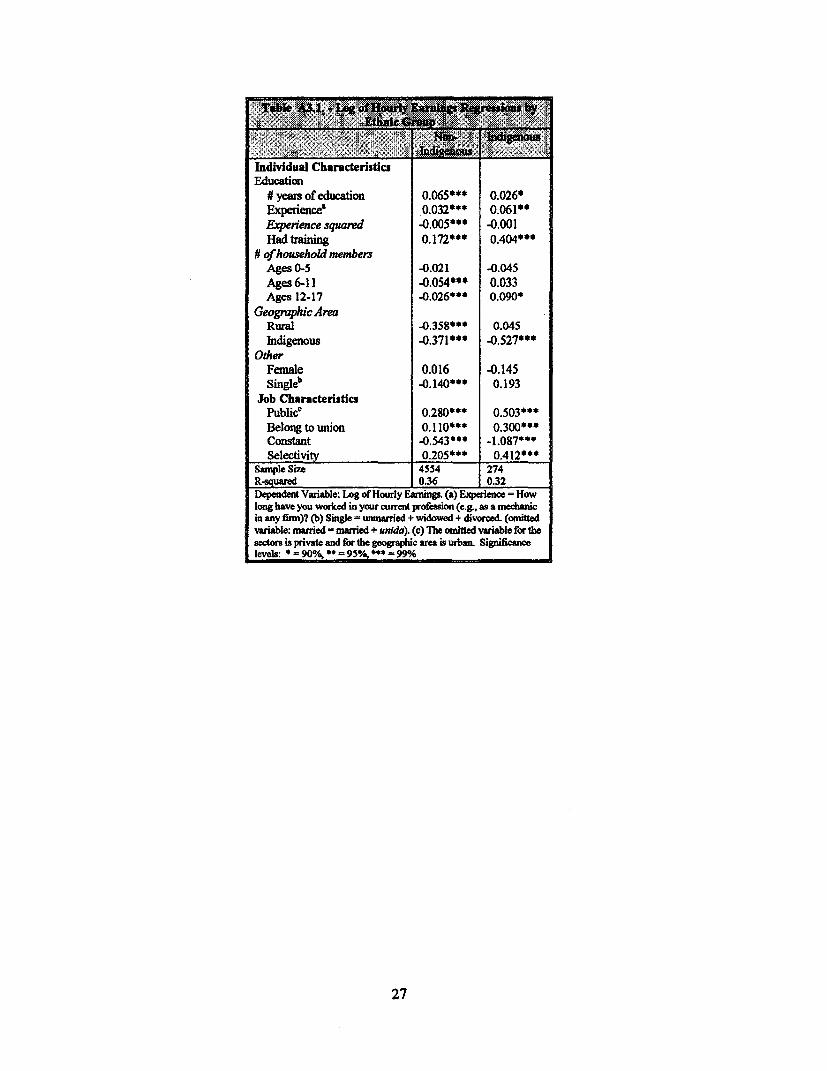
Individual CharacteristicEducation
# years of education 0.065*** 0.026*Experience' 0.032*** 0.061*Experience squared -0.005*** -0.001Had training O.172*** 0.404***
# of household membersAges 0-5 -0.021 -0.045Ages 6-11 -0.054*** 0.033Ages 12-17 -0.026*** 0.090*
Geographic AreaRural -0.358*** 0.045Indigenous -0.371*** -0.527***
OtherFemale 0.016 -0.145Singleb -0.140*** 0.193
Job CharacteristicsPublice 0.280*** 0.503***Belong to union 0. 110** 0.300***Constant -0.543*** -1.087***Selectivity 0.205*** 0.412***
Sample Size 4554 274R-squared 0.36 0.32Dependent Variable: Log of Hourly Eanin (a) erience = Howlong have you worked in your current profession (e.g., as a mechanicin any finm)? (b) Single = unarried + widowed + divorced. (omittdvaniable: narried = maried + unida). (c) The omhited variable for thesectors is private and for the geogaphic area is ubwaL Significancelevel s *0 = 0O/% 95O @4 = 99%
27
REFERENCES
Alvarado, Eligio. February 28, 1998. Panamd: Perfil de los Pueblos Indagenas. Draft.
Davis V. Enriqueta. December 1997. Informe Sobre la Pobreza en Panamd: Componente de CapitalSocial.
Deaton, A. 1997. The Analysis of Household Surveys. The World Bank.
Mada, G. 1983. Limited Dependent and Qualitative Variables in Econometrics. CambridgeUniversity Press.
Oaxaca, RL. 1973. Male-Female Wage Differentials in Urban Labor Markets. International EconomicReview, Vol. 14, No. 1, p.p. 693-709.
Psacharapoulos, G. and H. Patrinos. 1994. Indigenous People and Poverty in Latin America. The WorldBank.
Ravallion, M. 1992. Poverty Comparisons. LSMS Working Paper No. 88. The World Bank.
The World Bank. May 1998. Panama: Atlantic Mesoamerican Biological Corridor Project. GlobalEnvironment Facility Project Document.
28
LCSHD Paper Series
No. I Van der Gaag & Winkler, Children of the Poor in Latin America and the Caribbean
No. 2 Schneidman, TargetingAt-Risk Youth: Rationales, Approaches to Service Delivery and Monitonng and EvaluationIssues
No. 3 HareU, Evaluaci&n de los Progrmaspara NiflosyJovenes Vulnerables
No. 4 Potashnik, Computers in the Schools: Chile's Leaning Netwr*
No. 5 Barker & Fontes, Revew and Analysis of International Experience with Programs Targeted on At-Risk Youth
No. 6 Lewis, MeasuringPublicHospital Costs: Empirical Evidencefrnom the Dominican Republic
No. 7 Edwards, Bruce, & Parandekar, PrimatyEducation Efficiency in Honduras: WhatRemains to be Done?
No. 8 Winkler, Descentralizacidn de la Educacidn: Participacion en elManejo de las Escuelas al Nivel Local
No. 9 Meza, Descentralizacidn Educativa, OrganizaciOnyManejo de las Escuelas al Nivel Local: El Caso de El Salvador
No. 10 Espinola, Descentralizacidn Educativa, Organizaci6n y Manejo de las Escuelas al Nivel Local: El Caso de Chile
No. 11 Guedes, Lobo, Walkcer, & Amaral, Gesti6n Descentralizada de la Educaci6n en el Estado de Minas Gerais, Brasil
No. 12 Cominetti & Ruiz, Evoluci6n del Gasto PuTblico Social en America Latina: 1980 -1995
No. 13 Bedi & Edwards, The Impact of School Quality on the Level and Distribution ofEarnings: Evidencefrom Honduras
No. 14 Duthilleu, DoParentsMatter? The Role ofParental Practices on Fourth Graders'Reading ComprehensionAchievement in Montevideo Public Schools
No. 15 Villegas-Reimers, The Preparation of Teachers in Latin America: Challenges and Trends
No. 16 Edwards & Liang, Mexico's Preschools: Coverage, Equity and Impact
No. 17 Soare, The Financing ofEducation in Brazil: With Special Reference to the North, Northeast and Center-WestRegions
No. 18 Saldmi, Equty and Quality in Private Education: The Haitian Paradox
No. 19 Waiser, Early Childhood Care and DevelopmentPrograms in LatinAmerica: How much do they cost?
No. 20 Tulic, Algunas Factores del Rendimiento: Las Expectativasy el Genero
No. 21 Delannoy, Reformas en Gestion Educacional en los 90s
No. 22 Bafro, The ProspectsforDeveloping Intemnationaly Comparable Education Finance StatisticsforLatin AmericanCountries A PreliminaryAssessment
No. 23 El-Khawas, DePiciro-Jurand, & Holm-Nielsen, QualityAssurance in Higher Edueation: Recent Progress;Challenges Ahead
No. 24 Salmen & Amelga Implementing Beneficiay Assessment in Education: A Guideforpractitioners (Jointly publishedby the Social Development Family and the Department of Human Development, Social Development Paper No. 25)
No. 25 Rojas & Esquivel Las Sistemas deMedicidn del Logro Academico en Latinoamndrica
No. 26 Matinic, TiempoyAprendizaje
No. 27 Crawford & Holm-Nielsen, Brazilian Higher Education: Characteristic and Challenges
No. 28 Schwartzman, Higher Education in Brazil: The Stakeholders

No. 29 Jobnsftne, Insitutional Dfferentiatkm and the Accommodation ofEnmilmentExpansion in Brazil
No. 30 Hauplm, Accommodating the Growng DemandforHigherEducation in Brazil: A Roleforthe FederalUniversities?
No. 31 El-Khawas, Developing Intemal Supportfor Quality and Releance
No. 32 TneIot, The Oaization ofStudies in the French UniversitySystem
No. 33 Thompson, Trends in Governance andManagement ofHigherEduc*ahn
No. 34 Wagner, From Higher to Tertiay Education: Evolving Responses in OECD Countries to Large VolumePartcipation
No. 35 Salmi & AlcalA, Opciomes para Refonnar el Financiamiento de la Ensefanza Superior
No. 36 Piflieros & Rodriguez, School Inputs in Secondary Education and theirEffects on Academic Achievement: A Study inColombia
No. 37 Meresman, The Ten Who Go To School
No. 38 Vegas, Pritchelt & Experton, Attracting and Retaining Qualifted Teachers in Argentina: Impact of the Level andStructure of Compensation
No. 39 Myers & de San Jorge, Childcare and Ear* Education Services in Low-Income Communities ofMexico City:Patterns of Use, Availability and Choice
No. 40 Arcia & Bell, Rebuilding the Social Contract. SchoolAutonomy in Nicaragua
No. 41 Plomp & Brummelhiuis, Technology in Teacher Education: The Case of the Netherlands
No. 42 Winter, Seconday Education in El Salvador: Education Refonn in Progress
No. 43 Wu, Maiguashca, and Maiguashca, The Financing of Higher Education in Ecuador
No. 44 Salmi, StudentLoans in an International Perspective: The World Bank Experience
No. 45 Ravela & Cardoso, Factores de Eficacia de la Escuela Primaria en Contextos Sociakes Desfovorecidos: Laexperiencia de Uruguay
No. 46 Experton, Desafos pam la Nueva Etapa de la RefonnaEducatva en Argentina
No. 47 Fiszbein, Institutions, Service Delivery and Social Exclusion: A Case Study of the Education Sector in Buenos Aires
No. 48 Gasperini, The Cuban Education System: Lessons and Dilemmas
No. 49 Liang, TeacherPay in 12LatinAmerican Countries
No. 50 Bnmner & Martnez, Evaluacion PreliminaryMetodologiapara la Evaluacion de Impacto del FOMVEC enArgentina
No. 51 Koshimura & Tsang, Financing Strategiesfor.Equalization in Basic Education
No. 52 Koshimura, High StandardsforAAU Students: Excellence orEquity?
No. 53 Goldschmidt & Wu, Determinants ofAchievement in Penr
No. 54 Cohen, Public Policies in the Pharmaceutical Sector: A Case Study ofBmszil
No. 55 Vakis & Lindez1 Poverty in Indigenous Populations in Panama: A Study Using MSAS Data

Latin America and the Caribbean RegionDepartment of Human Development (LCSHD)The World Bank1818 E Street, N.W.Washington, D.C. 20433
Fax: 202-522-0050E-mail: [email protected]


![[JOF]bunkakaikan · Title [JOF]bunkakaikan Author: reika Created Date: 7/6/2015 4:13:13 PM](https://img.pdfslide.us/doc/110x75/5e2b12f984810b1f5f0a1102/jofbunkakaikan-title-jofbunkakaikan-author-reika-created-date-762015-41313.jpg)
