Embed Size (px)
Citation preview

1
Supporting Information
Rec. Nat. Prod. 7:2 (2013) 152-156
LC-DAD-UV and LC-ESI-MS-based Analyses, Antioxidant
Capacity, and Antimicrobial Activity of a Polar Fra ction from
Iryanthera ulei Leaves
Freddy A. Bernal1,3, Luis E. Cuca-Suárez1, Lydia F. Yamaguchi2, and
Ericsson D. Coy-Barrera3
1Laboratorio de Productos Naturales Vegetales, Departamento de Química, Facultad de Ciencias,
Universidad Nacional de Colombia, AA 14490, Bogotá, Colombia. 2Laboratório de Química de Produtos Naturais, Departamento de Química Fundamental, Instituto de
Química, Universidade de São Paulo, SP CP 26077, 05599-970, Brazil. 3Laboratorio de Química Bioorgánica, Departamento de Química, Facultad de Ciencias Básicas y
Aplicadas, Universidad Militar Nueva Granada, AA 49300, Cajicá, Colombia.
Table of Contents Page
S1: Experimental details 2
S2: LC-UV-DAD profile and on line-UV Spectrum of Compound 1 (afzelin) 5
S3: HRESI-MS Spectrum of Compound 1 (afzelin) 6
S4: 1H-NMR (400 MHz, (CD3)2CO) Spectrum of Compound 1 (afzelin) 7
S5: 13C-NMR + DEPT (100 MHz, (CD3)2CO) Spectrum of Compound 1 (afzelin) 8
S6: COSY (400 MHz) Spectrum of Compound 1 (afzelin) 9
S7: Expansion of the COSY Spectrum of Compound 1 (afzelin) 10
S8: HMQC (400 MHz) Spectrum of Compound 1 (afzelin) 11
S9: HMBC (400 MHz) Spectrum of Compound 1 (afzelin) 12
S10: Expansion of TIC and Chromatogram of polar fraction of I. ulei 13
S11: Dose-dependent scavenging percentage curves for iPS fraction 14
References 15

2
S1: Experimental details
Extraction and separation: Whole leaves of I. ulei were collected in 2006 on Florencia, Caquetá (Department of Colombia). A voucher specimen was deposited at Herbario Nacional Colombiano under code COL519611. Leaves (418.4 g) were dried at room temperature, powdered, and exhaustively extracted with 96% ethanol. The solution was concentrated at reduced pressure to afford the crude extract (62.6 g). Part of this extract (39.2 g suspended in sand) was extracted in a Soxhlet apparatus sequentially with solvents of increasing polarity (petroleum ether, chloroform, and isopropyl acetate). Each resulting mixture was independently concentrated at reduced pressure.
Isopropyl acetate-soluble (iPS) extract was submitted to different procedures in order to get single pure compounds, including exclusion chromatography (Sephadex LH-20 eluting with gradient of n-hexane–CHCl3–MeOH) and semi-preparative RP-HPLC (Altex UltrasphereTM ODS, 250x10.0 mm i.d., 5µm; eluting with H2O–MeOH gradient; flow rate: 4 mL/min). The compound 1 was the only purified compound, whose structure was elucidated by spectroscopic methods (UV, NMR, and MS).
In order to characterize iPS fraction, the LC-based profiles were accomplished on two systems: HPLC-UV-DAD were performed on a Merck-Hitachi D-7000 system (Phenomenex Ultracarb C30 column, 150x4.6 mm, 5 µm; acetonitrile/water as mobile phase in gradient) equipped with L-4500 diode array detector, L-6200A intelligent pump and L-6000A interfase, and HPLC-UV-HRMS were performed on a Shimadzu UFLC system (Phenomenex Luna C18 column, 250x100 mm, 2.2 µm; methanol/0.05% TFA-acidulated water as mobile phase in gradient) equipped with LC20Ad pump and SPD20A UV and coupled with a Bruker Micro ToF-QII mass spectrometer using an ESI source in positive ion mode. Final chromatograms were obtained by previous optimization of separation conditions.
Total phenolic content (TPC) in iPS fraction was determined by the modified Folin-Ciocalteu method [1]. 200 µL iPS (0.25 mg/mL) was mixed with 400 µL Folin-Ciocalteu reagent (previously diluted with water 1:10 v/v) and 1500 µL of sodium carbonate (7.35%). The tubes were mixed in vortex and allowed to stand for 2 h at room temperature and darkness for color development. Absorbance was then measured at 765 nm using a Genesis-20 UV-Vis spectrophotometer. Determinations were performed in triplicate. Total phenolic content were expressed as mg of gallic acid equivalent per g iPS, using a standard curve (R² = 0.9994), which was linear between 15 and 150 µg/mL gallic acid.
Total flavonoid content (TFC) was estimated by the aluminum chloride colorimetric assay [2]. A mixture of iPS ethanol solution (800 µL, 0.25 mg/mL), ethanol (1000 µL), AlCl3 ethanol solution (200 µL, 10% m/v) and sodium acetate (200 µL, 0.1 M) was prepared. After 40 min at room temperature, the absorbance was measured at 420 nm. A yellow color indicated the presence of flavonoids. Determination was performed in triplicate. Total flavonoid content were expressed as mg of quercetin equivalent per g iPS, using a standard curve (R² = 0.9977), which was linear between 3 and 110 µg/mL quercetin.
3
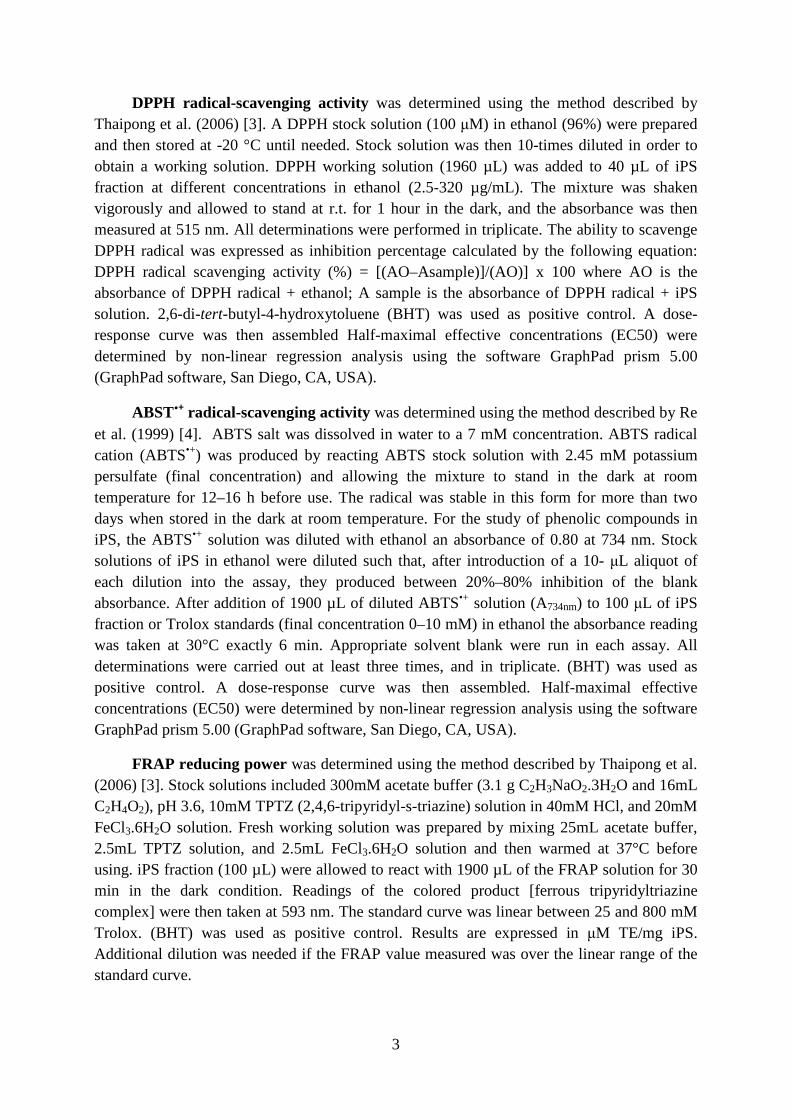
DPPH radical-scavenging activity was determined using the method described by Thaipong et al. (2006) [3]. A DPPH stock solution (100 µM) in ethanol (96%) were prepared and then stored at -20 °C until needed. Stock solution was then 10-times diluted in order to obtain a working solution. DPPH working solution (1960 µL) was added to 40 µL of iPS fraction at different concentrations in ethanol (2.5-320 µg/mL). The mixture was shaken vigorously and allowed to stand at r.t. for 1 hour in the dark, and the absorbance was then measured at 515 nm. All determinations were performed in triplicate. The ability to scavenge DPPH radical was expressed as inhibition percentage calculated by the following equation: DPPH radical scavenging activity (%) = [(AO–Asample)]/(AO)] x 100 where AO is the absorbance of DPPH radical + ethanol; A sample is the absorbance of DPPH radical + iPS solution. 2,6-di-tert-butyl-4-hydroxytoluene (BHT) was used as positive control. A dose-response curve was then assembled Half-maximal effective concentrations (EC50) were determined by non-linear regression analysis using the software GraphPad prism 5.00 (GraphPad software, San Diego, CA, USA).
ABST•+ radical-scavenging activity was determined using the method described by Re et al. (1999) [4]. ABTS salt was dissolved in water to a 7 mM concentration. ABTS radical cation (ABTS•+) was produced by reacting ABTS stock solution with 2.45 mM potassium persulfate (final concentration) and allowing the mixture to stand in the dark at room temperature for 12–16 h before use. The radical was stable in this form for more than two days when stored in the dark at room temperature. For the study of phenolic compounds in iPS, the ABTS•+ solution was diluted with ethanol an absorbance of 0.80 at 734 nm. Stock solutions of iPS in ethanol were diluted such that, after introduction of a 10- µL aliquot of each dilution into the assay, they produced between 20%–80% inhibition of the blank absorbance. After addition of 1900 µL of diluted ABTS•+ solution (A734nm) to 100 µL of iPS fraction or Trolox standards (final concentration 0–10 mM) in ethanol the absorbance reading was taken at 30°C exactly 6 min. Appropriate solvent blank were run in each assay. All determinations were carried out at least three times, and in triplicate. (BHT) was used as positive control. A dose-response curve was then assembled. Half-maximal effective concentrations (EC50) were determined by non-linear regression analysis using the software GraphPad prism 5.00 (GraphPad software, San Diego, CA, USA).
FRAP reducing power was determined using the method described by Thaipong et al. (2006) [3]. Stock solutions included 300mM acetate buffer (3.1 g C2H3NaO2.3H2O and 16mL C2H4O2), pH 3.6, 10mM TPTZ (2,4,6-tripyridyl-s-triazine) solution in 40mM HCl, and 20mM FeCl3.6H2O solution. Fresh working solution was prepared by mixing 25mL acetate buffer, 2.5mL TPTZ solution, and 2.5mL FeCl3.6H2O solution and then warmed at 37°C before using. iPS fraction (100 µL) were allowed to react with 1900 µL of the FRAP solution for 30 min in the dark condition. Readings of the colored product [ferrous tripyridyltriazine complex] were then taken at 593 nm. The standard curve was linear between 25 and 800 mM Trolox. (BHT) was used as positive control. Results are expressed in µM TE/mg iPS. Additional dilution was needed if the FRAP value measured was over the linear range of the standard curve.

4
Antimicrobial test was carried out by agar-well diffusion method [5,6] against four strains of bacteria namely, Staphyllococcus aureus (ATCC 25973), Escherichia coli (ATCC 25922), Pseudomonas aeruginosa (ATCC 2097) and Salmonella enterica; and the yeast Candida albicans (S. enterica and C. albicans were obtained from clinical isolated). The test microorganisms were obtained from Pharmacy Department at Universidad Nacional de Colombia. The strains were maintained at 4°C on BHI agar (Oxoid) before test. Microbial cultures were first grown on BHI agar at 37°C for 24-48 h prior to inoculation onto the nutrient agar. Few colonies of similar morphology of the respective microbial strains were transferred with a sterile inoculating loop to a liquid medium (BHI broth) and this liquid culture was then incubated until adequate growth of turbidity equivalent to McFarland 0.5 turbidity standard was obtained. The prepared inocula of the respective microbial strains were streaked on to the nutrient agar plates (Müller-Hinton from Oxoid to bacteria and Sabouraud from Merck to yeast) using a sterile swab in such a way as to ensure thorough coverage of the plates and a uniform thick lawn of growth following incubation. Wells of 7 mm in diameter were formed on to nutrient agar plates using a sterile cork borer. The wells were filled with 75 µL of the test agents (30 mg/mL for extract and iPS fraction, and 1.5 mg/mL for pure compound) and the plates were then allowed to stay for 1–2 h at 37°C. Each test was carried out in triplicate and the mean diameter of the inhibition zone was recorded. Chloramphenicol (0.10 mg/mL) and Clotrimazole (0.15 mg/mL) were used as a positive control for bacteria and yeast, respectively.

5
S2: LC-UV-DAD profile and on line-UV Spectrum of Compound 1 (afzelin)
a
b
Rt = 6.81 min
264 nm
341 nm

6
S3: HR-ESI-MS Spectrum of Compound 1 (afzelin)
a) HR-ESI-MS spectrum of compound 1 (afzelin); b) HR-ESI-MS2 Spectrum of compound 1 with 431.078 as selected ion; c) Chemical structure of compound 1 (afzelin) and assignation of its main fragmentation on ESI-MS.
a
b
c
7
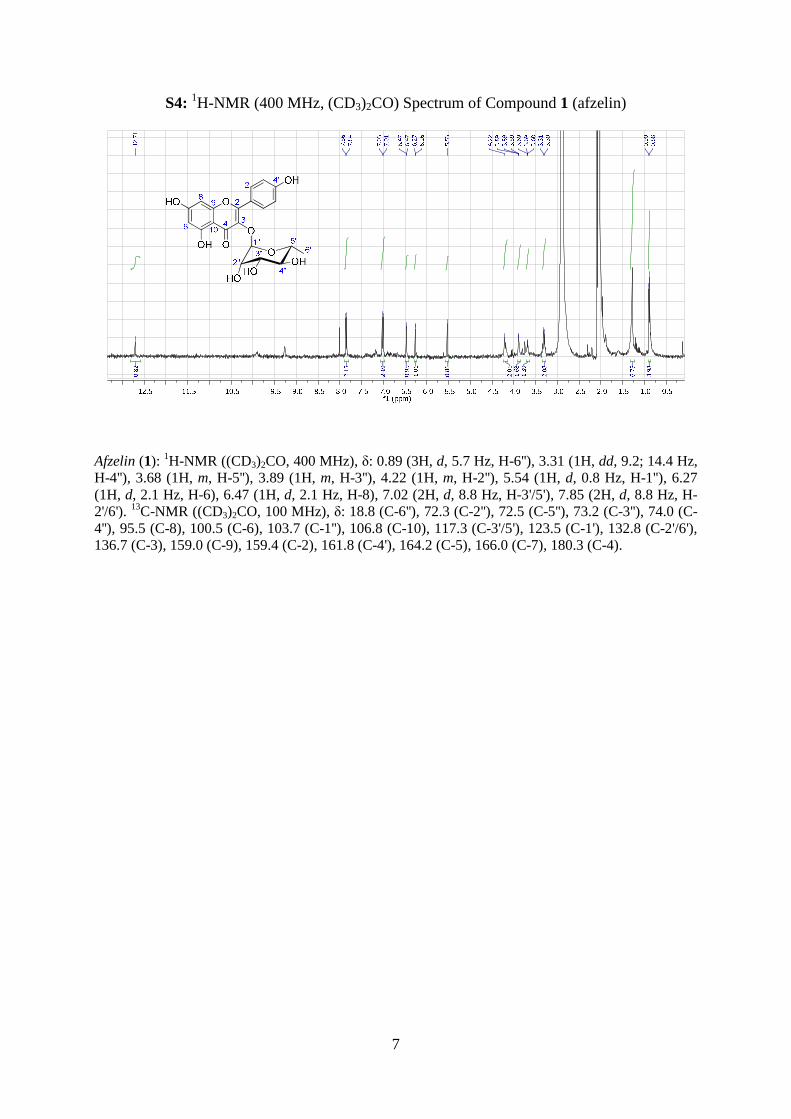
S4: 1H-NMR (400 MHz, (CD3)2CO) Spectrum of Compound 1 (afzelin)
Afzelin (1): 1H-NMR ((CD3)2CO, 400 MHz), δ: 0.89 (3H, d, 5.7 Hz, H-6''), 3.31 (1H, dd, 9.2; 14.4 Hz, H-4''), 3.68 (1H, m, H-5''), 3.89 (1H, m, H-3''), 4.22 (1H, m, H-2''), 5.54 (1H, d, 0.8 Hz, H-1''), 6.27 (1H, d, 2.1 Hz, H-6), 6.47 (1H, d, 2.1 Hz, H-8), 7.02 (2H, d, 8.8 Hz, H-3'/5'), 7.85 (2H, d, 8.8 Hz, H-2'/6'). 13C-NMR ((CD3)2CO, 100 MHz), δ: 18.8 (C-6''), 72.3 (C-2''), 72.5 (C-5''), 73.2 (C-3''), 74.0 (C-4''), 95.5 (C-8), 100.5 (C-6), 103.7 (C-1''), 106.8 (C-10), 117.3 (C-3'/5'), 123.5 (C-1'), 132.8 (C-2'/6'), 136.7 (C-3), 159.0 (C-9), 159.4 (C-2), 161.8 (C-4'), 164.2 (C-5), 166.0 (C-7), 180.3 (C-4).

8
S5: 13C-NMR + DEPT (100 MHz. (CD3)2CO) Spectrum of Compound 1 (afzelin)

9
S6: COSY (400 MHz) Spectrum of Compound 1 (afzelin)
f1 (
ppm
)
10
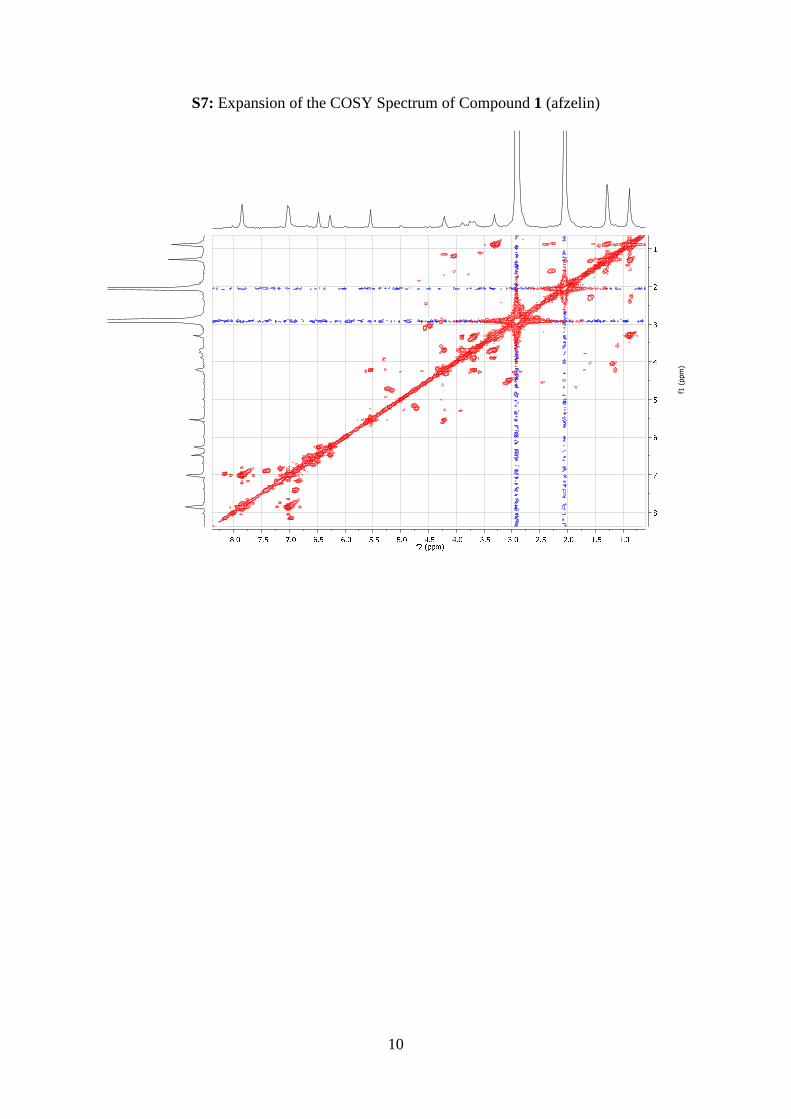
S7: Expansion of the COSY Spectrum of Compound 1 (afzelin)
f1 (
ppm
)

11
S8: HMQC (400 MHz) Spectrum of Compound 1 (afzelin)
f1 (
ppm
)

12
S9: HMBC (400 MHz) Spectrum of Compound 1 (afzelin)
f1 (
ppm
)
13
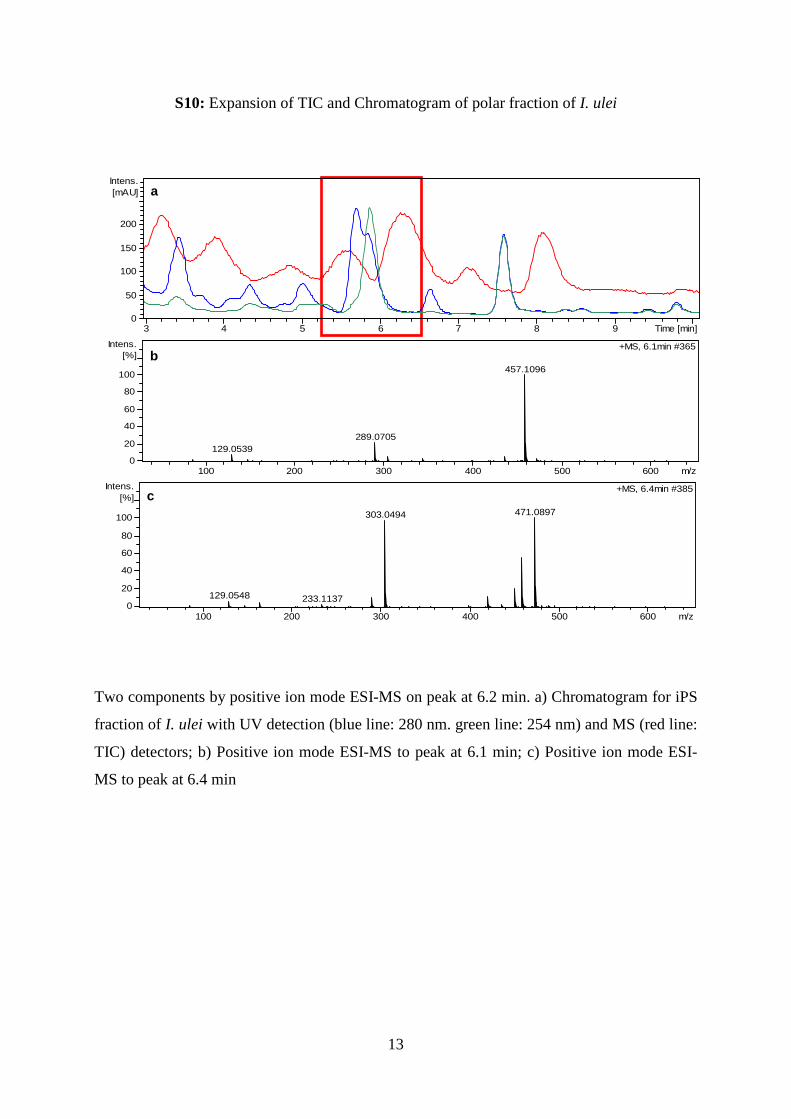
S10: Expansion of TIC and Chromatogram of polar fraction of I. ulei
Two components by positive ion mode ESI-MS on peak at 6.2 min. a) Chromatogram for iPS
fraction of I. ulei with UV detection (blue line: 280 nm. green line: 254 nm) and MS (red line:
TIC) detectors; b) Positive ion mode ESI-MS to peak at 6.1 min; c) Positive ion mode ESI-
MS to peak at 6.4 min
3 4 5 6 7 8 9 Time [min]0
50
100
150
200
Intens.[mAU]
129.0539289.0705
457.1096
+MS, 6.1min #365
0
20
40
60
80
100
Intens.[%]
100 200 300 400 500 600 m/z
129.0548 233.1137
303.0494 471.0897
+MS, 6.4min #385
0
20
40
60
80
100
Intens.[%]
100 200 300 400 500 600 m/z
a
b
c

14
S12: Dose-dependent scavenging percentage curves for iPS fraction from I. ulei against free-
radicals: a) DPPH; b) ABTS•+
-3.0 -2.5 -2.0 -1.5 -1.0 -0.5 0.00
20
40
60
80
100
Log (Dose)
Sca
ven
gin
g (
%)
-3.0 -2.5 -2.0 -1.50
20
40
60
80
100
Log (Dose)
Sca
ven
gin
g (
%)
b)
a)

15
References
[1] K. Wolfe, X. Wu and R. H. Liu (2003). Antioxidant activity of apple peels, J. Agric. Food Chem. 1, 609-614.
[2] A. A. L. Ordoñez, J. G. Gomez, M. A. Vattuone, M. I. Isla (2006). Antioxidant activities of Sechium edule (Jacq.) Swart extracts, Food Chem. 97, 452-458.
[3] K. Thaipong, U. Boonprakob, K. Crosby, L. Cisneros-Zevallos, D. H. Byrne (2006). Comparison of ABTS, DPPH, FRAP, and ORAC assays for estimating antioxidant activity from guava fruit extracts, J. Food Compost. Anal. 19, 669-675.
[4] R. Re, N. Pellegrini, A. Proteggente, A. Pannala, M. Yang, C. Rice-Evans. (1999). Antioxidant activity applying an improved ABTS radical cation decolorization assay. Free Radic. Biol. Med., 26: 1231–1237.
[5] H. Tadeg, E. Mohammed, K. Asres, T. Gebre-Mariam (2005). Antimicrobial activities of some selected traditional Ethiopian medicinal plants used in the treatment of skin disorders, J. Ethnopharmacol. 100, 168-175.
[6] B. Wilson, G. Abraham, V.S. Manju, M. Mathew, B. Vimala, S. Sundaresan, B. Nambisan (2005). Antimicrobial activity of Curcuma zedoaria and Curcuma malabarica tubers, J. Ethnopharmacol. 99, 147-151.