Embed Size (px)
Citation preview
L A Z A R D ’ S L E V E L I Z E D C O S T O F S T O R A G E — V E R S I O N 2 . 0
D E C E M B E R 2 0 1 6
Confidential
I Introduction and Executive Summary
L A Z A R D L C O S V 2 . 0

I I N T R O D U C T I O N A N D E X E C U T I V E S U M M A R YL A Z A R D L C O S V 2 . 0
Introduction Lazard’s Levelized Cost of Storage Analysis (“LCOS”) addresses the following topics:
Definition of a cost-oriented approach to energy storage technologies and applications
Description of ten defined Use Cases for energy storage
Description of selected energy storage technologies
Analysis of LCOS for a number of use case and technology combinations
Decomposition of the levelized cost of storage for various use case and technology combinations by total capital cost,
operations and maintenance expense, charging cost, tax and other factors, as applicable
Comparison and analysis of capital costs for various use case and technology combinations, including in respect of
projected/expected capital cost declines for specific technologies
Identification of a number of geographically distinct merchant, behind-the-meter illustrative energy storage systems and
their related value propositions in a mixed-use case context
Summary assumptions for the various use case and technology combinations examined, including detailed assumptions on
charging costs
Energy storage systems are rated in terms of both instantaneous power capacity and potential energy output (or “usable energy”). The instantaneous power capacity of
an energy storage system is defined as the maximum output of the invertor (in MW, kW, etc.) under specific operational and physical conditions. The potential energy
output of an energy storage system is defined as the maximum amount of energy (in MWh, kWh, etc.) the system can store at one point in time. Both capital cost divided
by instantaneous power capacity and capital cost divided by potential energy output are common Industry conventions for cost quoting. This study principally describes
capital costs in terms of potential energy output to capture the duration of the relevant energy storage system, as well as its capacity.
Throughout this study, use cases require fixed potential energy output values. Due to physical and operating conditions, some energy storage systems may need to be
“oversized” on a usable energy basis to achieve these values. This oversizing results in depth of discharge over a single cycle that is less than 100% (i.e., some
technologies must maintain a constant charge).
Other factors not covered in this report would also have a potentially significant effect on the results presented herein, but have not been examined in the scope of this
current analysis. The analysis also does not address potential social and environmental externalities, including, for example, the long-term residual and societal
consequences of various conventional generation technologies (for which energy storage is a partial substitute) that are difficult to measure (e.g., nuclear waste disposal,
environmental impacts, etc.).
While energy storage is a beneficiary of and sensitive to various tax subsidies, this report presents the LCOS on an unsubsidized basis to isolate and compare the
technological and operational components of energy storage systems and use cases, as well as to present results that are applicable to a global energy storage market.
The inputs contained in the LCOS were developed by Lazard in consultation and partnership with Enovation Partners, a leading consultant to the Power & Energy
Industry.
Note: This study has been prepared by Lazard for general informational purposes only, and it is not intended to be, and should not be construed as, financial or other advice.1

I I N T R O D U C T I O N A N D E X E C U T I V E S U M M A R YL A Z A R D L C O S V 2 . 0
Executive Summary and Overview
In Version 1.0 of Lazard’s LCOS study, we articulated a
levelized cost framework to identify minimum costs per
unit (MWh) of energy throughput to achieve illustrative
equity returns, given levelized cost structures, capital
structures and costs of capital
Lazard has refined its LCOS methodology and report for
Version 2.0
Narrower LCOS ranges, reflecting revised
technology/Use Case combinations (e.g., eliminating
unfavorable technologies)
Revised Use Cases, better reflecting the current state of
the energy storage market
Presentation of power-oriented Use Cases on both
$/MW and $/MWh bases
In addition, Lazard notes that the LCOS construct and
related results may differ materially from the “value” of
storage (see page 4 for additional detail)
To that end, we have included in this report a number of
illustrative “Value Snapshots,” presenting illustrative
“real world” behind-the-meter, merchant energy storage
systems operating in selected geographical markets
2
SELECTED COMMENTARYGENERAL ARCHITECTURE AND PROCESS
LCOS VALUE SNAPSHOTS
Creation of ten energy storage Use Cases
and related operational parameters
Collection of survey data (both technical
and cost-oriented)
Consolidation of “synthetic” price quotes
to match survey results to Use Case
parameters
Using the above, creation of system
model to solve levelized storage cost per
MWh of throughput for levered
return/cost of equity target
Identification of “real world” revenue
streams for behind-the-meter merchant
energy storage systems
“Optimization” of system to maximize
revenue available from such revenue
sources
Identification of potential/likely incentive
structures and other market conditions by
geography
Creation of financial model to generate
illustrative levered returns and financial
summaries, as well as a determination of
economic viability
Value SnapshotLCOS

Confidential
II LCOS Methodology, Use Cases and Technology Overview
L A Z A R D L C O S V 2 . 0
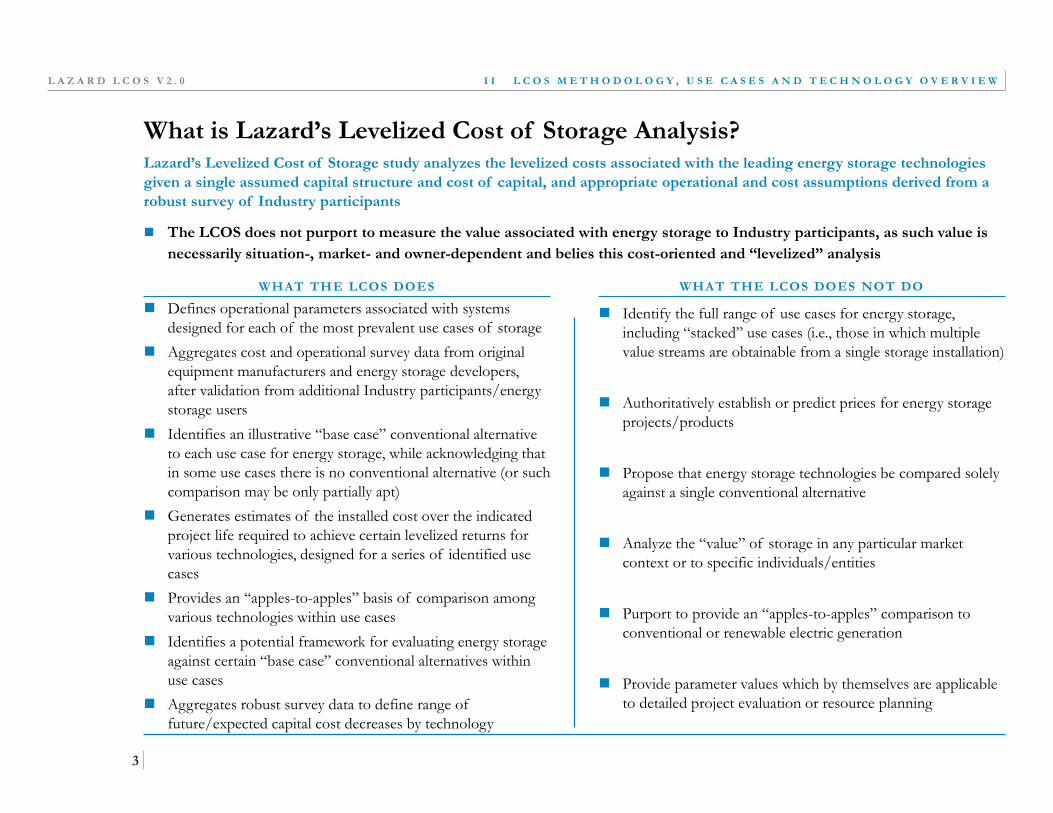
What is Lazard’s Levelized Cost of Storage Analysis?Lazard’s Levelized Cost of Storage study analyzes the levelized costs associated with the leading energy storage technologies
given a single assumed capital structure and cost of capital, and appropriate operational and cost assumptions derived from a
robust survey of Industry participants
The LCOS does not purport to measure the value associated with energy storage to Industry participants, as such value is
necessarily situation-, market- and owner-dependent and belies this cost-oriented and “levelized” analysis
I I L C O S M E T H O D O L O G Y , U S E C A S E S A N D T E C H N O L O G Y O V E R V I E WL A Z A R D L C O S V 2 . 0
3
WHAT THE LCOS DOES NOT DOWHAT THE LCOS DOES
Identify the full range of use cases for energy storage,
including “stacked” use cases (i.e., those in which multiple
value streams are obtainable from a single storage installation)
Authoritatively establish or predict prices for energy storage
projects/products
Propose that energy storage technologies be compared solely
against a single conventional alternative
Analyze the “value” of storage in any particular market
context or to specific individuals/entities
Purport to provide an “apples-to-apples” comparison to
conventional or renewable electric generation
Provide parameter values which by themselves are applicable
to detailed project evaluation or resource planning
Defines operational parameters associated with systems
designed for each of the most prevalent use cases of storage
Aggregates cost and operational survey data from original
equipment manufacturers and energy storage developers,
after validation from additional Industry participants/energy
storage users
Identifies an illustrative “base case” conventional alternative
to each use case for energy storage, while acknowledging that
in some use cases there is no conventional alternative (or such
comparison may be only partially apt)
Generates estimates of the installed cost over the indicated
project life required to achieve certain levelized returns for
various technologies, designed for a series of identified use
cases
Provides an “apples-to-apples” basis of comparison among
various technologies within use cases
Identifies a potential framework for evaluating energy storage
against certain “base case” conventional alternatives within
use cases
Aggregates robust survey data to define range of
future/expected capital cost decreases by technology

I I L C O S M E T H O D O L O G Y , U S E C A S E S A N D T E C H N O L O G Y O V E R V I E WL A Z A R D L C O S V 2 . 0
4
LCOS ValueStream
1
ValueStream
2
ValueStream
3
ValueStream
4
Total Value
System Cost & Revenue
Understanding the economics of energy storage is challenging due to the highly tailored nature of potential value streams
associated with an energy storage installation. Rather than focusing on the value available to energy storage installations, this
study analyzes the levelized cost of energy storage technologies operationalized across a variety of use cases; the levelized cost
of storage may then be compared to the more specific value streams available to particular installations
ENERGY STORAGE VALUE PROPOSITION
($113.70)
Value
Positive
SELECTED OBSERVATIONS
While an energy storage system may be optimized for a
particular use case requiring specified operating parameters
(e.g., power rating, duration, etc.), other sources of revenue
may also be available for a given system
For example, a single energy storage system could
theoretically be designed to capture value through both
providing frequency regulation for a wholesale market
and enabling deferral of an investment in a substation
upgrade
Energy storage systems are sized and developed to solve for
one or more specific revenue streams, as the operating
requirements of one use case may preclude
efficient/economic operations in another use case for the
same system (e.g., frequency regulation vs. PV integration)
The total of all potential value streams available for a given
system thus defines the maximum, economically viable cost
for that system
Importantly, incremental sources of revenue may only
become available as costs (or elements of levelized cost)
decrease below a certain value
Value
Negative
(a)
(a) Presented here as the simple sum of all available value streams. Due to operational and other factors, such “stacked” value would likely differ from the simple sum of all value
streams in practice.
The Energy Storage Value Proposition—A Cost Approach

I I L C O S M E T H O D O L O G Y , U S E C A S E S A N D T E C H N O L O G Y O V E R V I E WL A Z A R D L C O S V 2 . 0
5
Components of Energy Storage System Capital Costs
Storage Module
(“SM”)
Balance of System
(“BOS”)
Power Conversion
System (“PCS”)
Engineering Procurement
& Construction (“EPC”)
Other (Not Included
in Analysis)
Racking Frame/Cabinet Container Inverter Project Management SCADA Software
Local Protection (i.e.,
Breakers)
Electrical
Distribution &
Control
Electrical
Protection
Engineering
Studies/PermittingShipping
Rack Management
SystemCommunication
Energy Management
System (“EMS”)Site Preparation/Construction
Grid Integration
Equipment
Battery Management
System
HVAC/Thermal
ManagementFoundation/Mounting Metering
Battery Module Fire Suppression Commissioning Land
SM BOS PCSBESS ESS
SM Storage Module
Rack Level System (DC)
BESS Battery Energy Storage System
Containerized System (DC)
ESS Energy Storage System
Complete System
KEY
Lazard’s LCOS study incorporates capital costs for the entirety of the energy storage system (“ESS”), which is composed of
the storage module (“SM”), balance of system (“BOS”), power conversion system (“PCS”) and related EPC costs

I I L C O S M E T H O D O L O G Y , U S E C A S E S A N D T E C H N O L O G Y O V E R V I E WL A Z A R D L C O S V 2 . 0
6
USE CASE DESCRIPTION
TRANSMISSION
SYSTEM
Large-scale energy storage system to improve transmission grid performance and assist in the integration of large-
scale variable energy resource generation (e.g., utility-scale wind, solar, etc.)
Specific operational uses: provide voltage support and grid stabilization; decrease transmission losses; diminish
congestion; increase system reliability; defer transmission investment; optimize renewable-related transmission;
provide system capacity and resources adequacy; and shift renewable generation output
PEAKER
REPLACEMENT
Large-scale energy storage system designed to replace peaking gas turbine facilities
Specific operational uses include: capacity, energy sales (e.g., time-shift/arbitrage, etc.), spinning reserve and non-
spinning reserve
Brought online quickly to meet the rapidly increasing demand for power at peak; can be quickly taken offline as
power demand diminishes
Results shown in $/kW-year as well as standard LCOS ($/MWh)
FREQUENCY
REGULATION
Energy storage system designed to balance power by raising or lowering output to follow the moment-by-moment
changes in load to maintain frequency to be held within a tolerance bound
Specific Use Case parameters modeled to reflect PJM Interconnection requirements
Results shown in $/kW-year as well as standard LCOS ($/MWh)
DISTRIBUTION
SUBSTATION
Energy storage systems placed at substations controlled by utilities to provide flexible peaking capacity while also
mitigating stability problems
Typically integrated into utility distribution management systems
DISTRIBUTION
FEEDER
Energy storage systems placed along distribution feeders controlled by utilities to mitigate stability problems and
enhance system reliability and resiliency
Typically integrated into utility distribution management systems
Use Case Overview—Grid-Scale
Lazard’s Levelized Cost of Storage (“LCOS”) study examines the cost of energy storage in the context of its specific applications on the
grid and behind the meter; each Use Case specified herein represents an application of energy storage that market participants are
utilizing now or in the near future
I I L C O S M E T H O D O L O G Y , U S E C A S E S A N D T E C H N O L O G Y O V E R V I E WL A Z A R D L C O S V 2 . 0
7
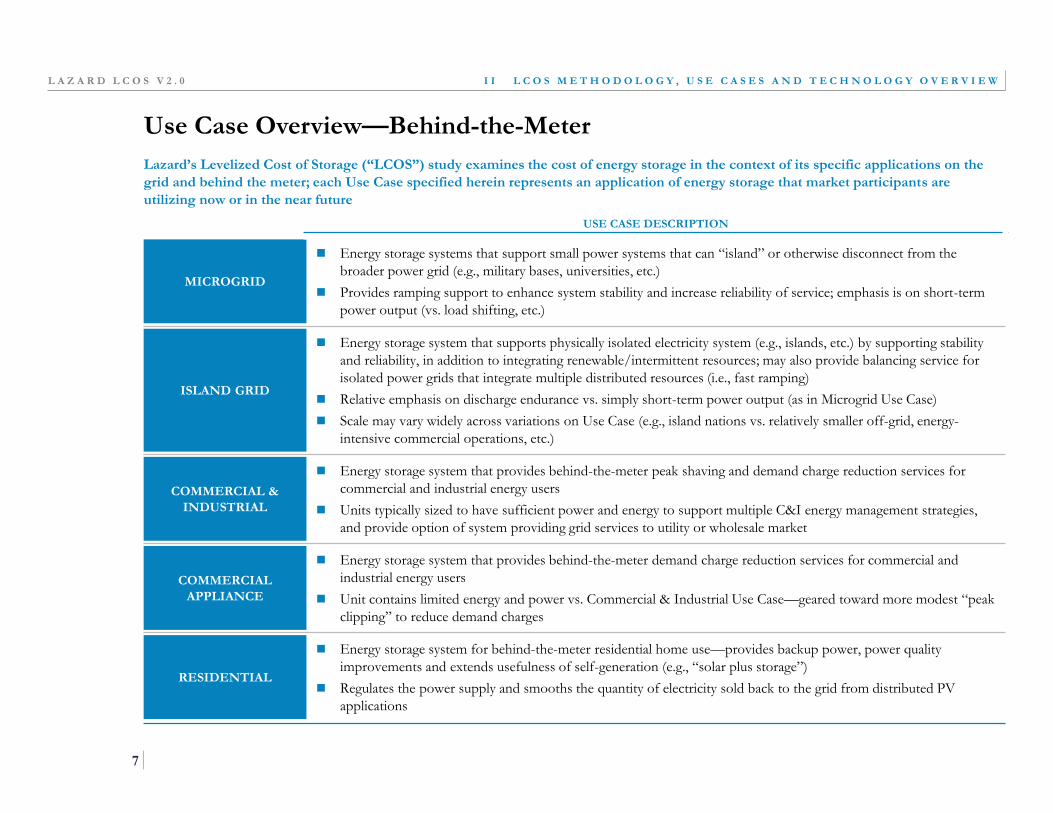
USE CASE DESCRIPTION
MICROGRID
Energy storage systems that support small power systems that can “island” or otherwise disconnect from the
broader power grid (e.g., military bases, universities, etc.)
Provides ramping support to enhance system stability and increase reliability of service; emphasis is on short-term
power output (vs. load shifting, etc.)
ISLAND GRID
Energy storage system that supports physically isolated electricity system (e.g., islands, etc.) by supporting stability
and reliability, in addition to integrating renewable/intermittent resources; may also provide balancing service for
isolated power grids that integrate multiple distributed resources (i.e., fast ramping)
Relative emphasis on discharge endurance vs. simply short-term power output (as in Microgrid Use Case)
Scale may vary widely across variations on Use Case (e.g., island nations vs. relatively smaller off-grid, energy-
intensive commercial operations, etc.)
COMMERCIAL &
INDUSTRIAL
Energy storage system that provides behind-the-meter peak shaving and demand charge reduction services for
commercial and industrial energy users
Units typically sized to have sufficient power and energy to support multiple C&I energy management strategies,
and provide option of system providing grid services to utility or wholesale market
COMMERCIAL
APPLIANCE
Energy storage system that provides behind-the-meter demand charge reduction services for commercial and
industrial energy users
Unit contains limited energy and power vs. Commercial & Industrial Use Case—geared toward more modest “peak
clipping” to reduce demand charges
RESIDENTIAL
Energy storage system for behind-the-meter residential home use—provides backup power, power quality
improvements and extends usefulness of self-generation (e.g., “solar plus storage”)
Regulates the power supply and smooths the quantity of electricity sold back to the grid from distributed PV
applications
Use Case Overview—Behind-the-Meter
Lazard’s Levelized Cost of Storage (“LCOS”) study examines the cost of energy storage in the context of its specific applications on the
grid and behind the meter; each Use Case specified herein represents an application of energy storage that market participants are
utilizing now or in the near future

I I L C O S M E T H O D O L O G Y , U S E C A S E S A N D T E C H N O L O G Y O V E R V I E WL A Z A R D L C O S V 2 . 0
Energy Storage Use Cases—Operational Parameters
For comparison purposes, this study assumes and quantitatively operationalizes ten Use Cases for energy storage; while there
may be alternative or combined/“stacked” use cases available to energy storage systems, the ten Use Cases below represent
illustrative current and contemplated energy storage applications and are derived from Industry survey data
PROJECT LIFE (YEARS)
MW(a) MWh OF CAPACITY(b)
100% DOD CYCLES/
DAY(c)
DAYS /YEAR(d)
ANNUAL MWh
PROJECT MWh
TRANSMISSION SYSTEM 20 100 800 1 350 280,000 5,600,000
PEAKER
REPLACEMENT20 100 400 1 350 140,000 2,800,000
FREQUENCY
REGULATION10 10 5 4.8 350 8,400 84,000
DISTRIBUTION
SUBSTATION20 4 16 1 300 4,800 96,000
DISTRIBUTION
FEEDER20 0.5 1.5 1 200 300 6,000
MICROGRID 20 2 2 2 350 1,400 28,000
ISLAND
GRID20 1 8 1 350 2,800 56,000
COMMERCIAL &
INDUSTRIAL10 0.5 2 1 250 500 5,000
COMMERCIAL
APPLIANCE10 0.1 0.2 1 250 50 500
RESIDENTIAL 10 0.005 0.01 1 250 2.5 25
(a) Indicates power rating of system (i.e., system size).
(b) Indicates total battery energy content on a single, 100% charge, or “usable energy.” Usable energy divided by power rating (in MW) reflects hourly duration of system.
(c) “DOD” denotes depth of battery discharge (i.e., the percent of the battery’s energy content that is discharged). Depth of discharge of 100% indicates that a fully charged battery discharges all of its
energy. For example, a battery that cycles 48 times per day with a 10% depth of discharge would be rated at 4.8 100% DOD Cycles per Day.
(d) Indicates number of days of system operation per calendar year.
(e) Usable energy indicates energy stored and able to be dispatched from system.
= “Usable Energy”(e)
8
I I L C O S M E T H O D O L O G Y , U S E C A S E S A N D T E C H N O L O G Y O V E R V I E WL A Z A R D L C O S V 2 . 0
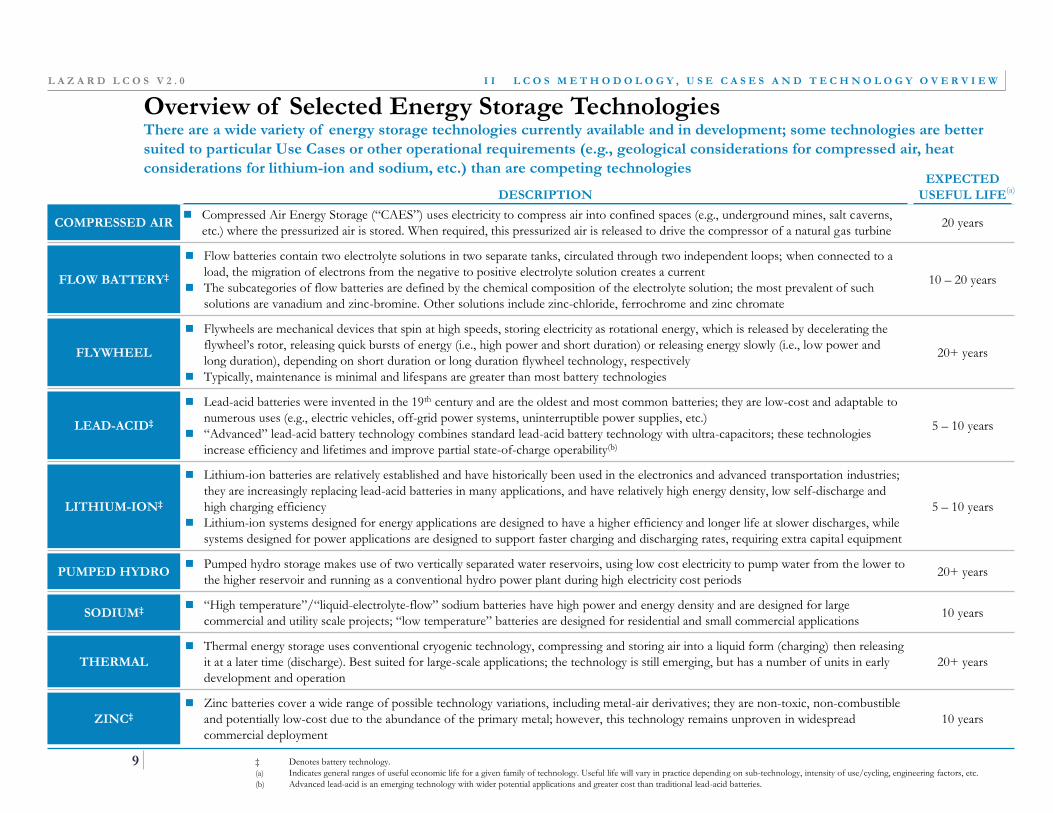
Overview of Selected Energy Storage Technologies
DESCRIPTION
EXPECTED
USEFUL LIFE
COMPRESSED AIR Compressed Air Energy Storage (“CAES”) uses electricity to compress air into confined spaces (e.g., underground mines, salt caverns,
etc.) where the pressurized air is stored. When required, this pressurized air is released to drive the compressor of a natural gas turbine20 years
FLOW BATTERY‡
Flow batteries contain two electrolyte solutions in two separate tanks, circulated through two independent loops; when connected to a
load, the migration of electrons from the negative to positive electrolyte solution creates a current
The subcategories of flow batteries are defined by the chemical composition of the electrolyte solution; the most prevalent of such
solutions are vanadium and zinc-bromine. Other solutions include zinc-chloride, ferrochrome and zinc chromate
10 – 20 years
FLYWHEEL
Flywheels are mechanical devices that spin at high speeds, storing electricity as rotational energy, which is released by decelerating the
flywheel’s rotor, releasing quick bursts of energy (i.e., high power and short duration) or releasing energy slowly (i.e., low power and
long duration), depending on short duration or long duration flywheel technology, respectively
Typically, maintenance is minimal and lifespans are greater than most battery technologies
20+ years
LEAD-ACID‡
Lead-acid batteries were invented in the 19th century and are the oldest and most common batteries; they are low-cost and adaptable to
numerous uses (e.g., electric vehicles, off-grid power systems, uninterruptible power supplies, etc.)
“Advanced” lead-acid battery technology combines standard lead-acid battery technology with ultra-capacitors; these technologies
increase efficiency and lifetimes and improve partial state-of-charge operability(b)
5 – 10 years
LITHIUM-ION‡
Lithium-ion batteries are relatively established and have historically been used in the electronics and advanced transportation industries;
they are increasingly replacing lead-acid batteries in many applications, and have relatively high energy density, low self-discharge and
high charging efficiency
Lithium-ion systems designed for energy applications are designed to have a higher efficiency and longer life at slower discharges, while
systems designed for power applications are designed to support faster charging and discharging rates, requiring extra capital equipment
5 – 10 years
PUMPED HYDRO Pumped hydro storage makes use of two vertically separated water reservoirs, using low cost electricity to pump water from the lower to
the higher reservoir and running as a conventional hydro power plant during high electricity cost periods20+ years
SODIUM‡ “High temperature”/“liquid-electrolyte-flow” sodium batteries have high power and energy density and are designed for large
commercial and utility scale projects; “low temperature” batteries are designed for residential and small commercial applications10 years
THERMAL
Thermal energy storage uses conventional cryogenic technology, compressing and storing air into a liquid form (charging) then releasing
it at a later time (discharge). Best suited for large-scale applications; the technology is still emerging, but has a number of units in early
development and operation
20+ years
ZINC‡
Zinc batteries cover a wide range of possible technology variations, including metal-air derivatives; they are non-toxic, non-combustible
and potentially low-cost due to the abundance of the primary metal; however, this technology remains unproven in widespread
commercial deployment
10 years
‡ Denotes battery technology.
(a) Indicates general ranges of useful economic life for a given family of technology. Useful life will vary in practice depending on sub-technology, intensity of use/cycling, engineering factors, etc.
(b) Advanced lead-acid is an emerging technology with wider potential applications and greater cost than traditional lead-acid batteries.
(a)
There are a wide variety of energy storage technologies currently available and in development; some technologies are better
suited to particular Use Cases or other operational requirements (e.g., geological considerations for compressed air, heat
considerations for lithium-ion and sodium, etc.) than are competing technologies
9

I I L C O S M E T H O D O L O G Y , U S E C A S E S A N D T E C H N O L O G Y O V E R V I E WL A Z A R D L C O S V 2 . 0
SELECTED COMPARATIVE ADVANTAGES SELECTED COMPARATIVE DISADVANTAGES
COMPRESSED
AIR
Low cost, flexible sizing, relatively large-scale
Mature technology and well-developed design
Leverages existing gas turbine technologies
Requires suitable geology
Relatively difficult to modularize for smaller installations
Exposure to natural gas price changes
FLOW
BATTERY‡
Power and energy profiles highly and independently scalable (for technologies other
than zinc-bromine)
Designed in fixed modular blocks for system design (for zinc-bromine technology)
No degradation in “energy storage capacity”
Power and energy rating scaled in a fixed manner for zinc-bromine technology
Relatively high balance of system costs
Reduced efficiency due to rapid charge/discharge
FLYWHEEL
High power density and scalability for short duration technology; low power, higher
energy for long-duration technology
High depth of discharge capability
Compact design with integrated AC motor
Relatively low energy capacity
High heat generation
Sensitive to vibrations
LEAD-ACID‡ Mature technology with established recycling infrastructure
Advanced lead-acid technologies leverage existing technologies
Poor ability to operate in a partially charged state
Relatively poor depth of discharge and short lifespan
LITHIUM-ION‡
Multiple chemistries available
Rapidly expanding manufacturing base leading to cost reductions
Efficient power and energy density
Remains relatively high cost
Safety issues from overheating
Requires advanced manufacturing capabilities to achieve high performance
PUMPED
HYDRO
Mature technology (commercially available; leverages existing hydropower technology)
High power capacity solution
Relatively low energy density
Limited available sites (i.e., water availability required)
SODIUM‡
High temperature technology: Relatively mature technology (commercially available);
high energy capacity and long duration
Low temperature technology: Smaller scale design; emerging technology and low cost
potential; safer
Although mature, inherently higher costs—low temperature batteries currently
have a higher cost with lower efficiency
Potential flammability issues for high-temperature batteries
THERMAL
Low cost, flexible sizing, relatively large-scale
Power and energy ratings independently scalable
Leverages mature industrial cryogenic technology base; can utilize waste industrial heat
to improve efficiency
Technology is pre-commercial
Difficult to modularize for smaller installations
ZINC‡ Currently quoted as low cost
Deep discharge capability
Currently unproven commercially
Lower efficiency
There is a wide variety of energy storage technologies currently available and in development; some technologies are better
suited to particular use cases or other operational requirements (e.g., geological considerations for compressed air, heat
considerations for lithium-ion and sodium, etc.) than competing technologies
Overview of Selected Energy Storage Technologies (cont’d)
Source: DOE Energy Storage Database.
‡ Denotes battery technology.10

Confidential
III Levelized Cost of Storage Analysis
L A Z A R D L C O S V 2 . 0
TRANSMISSION
SYSTEM
PEAKER
REPLACEMENT
FREQUENCY
REGULATION
DISTRIBUTION
SUBSTATION
DISTRIBUTION
FEEDER
$116$314
$434$340
$267$152
$301$227
$262$441$448$447
$342$285
$320$290
$277$598
$190$516$524$524
$400$425
$345$385
$707$404
$779$601
$708$532
$586$515
$140$690
$549$630
$561$198
$784$280
$438$657
$563$704
$555$581
$803$348
$456$1,251
$277$770
$564$828
$654$933
$657$959
$862$542
$1,346$983
$1,710$1,014
$1,455$815
$0 $200 $400 $600 $800 $1,000 $1,200 $1,400 $1,600 $1,800
Compressed Air
Flow Battery(V)
Flow Battery(Zn)
Flow Battery(O)
Lithium-Ion
Pumped Hydro
Sodium
Thermal
Zinc
Flow Battery(V)
Flow Battery(Zn)
Flow Battery(O)
Flywheel
Lithium-Ion
Sodium
Thermal
Zinc
Flywheel
Lithium-Ion
Flow Battery(V)
Flow Battery(Zn)
Flow Battery(O)
Flywheel
Lead-Acid
Lithium-Ion
Sodium
Thermal
Zinc
Flow Battery(Zn)
Flywheel
Lead-Acid
Lithium-Ion
Sodium
Zinc
Levelized Cost ($/MWh)
$617 $919 $627 $789
$626 $985 $479 $778
$399 $813 $447 $1,124
$406 $487 $388 $638
$502 $1,051 $159 $233
Low/High ($/kW-year)
I I I L E V E L I Z E D C O S T O F S T O R A G E A N A L Y S I SL A Z A R D L C O S V 2 . 0
11
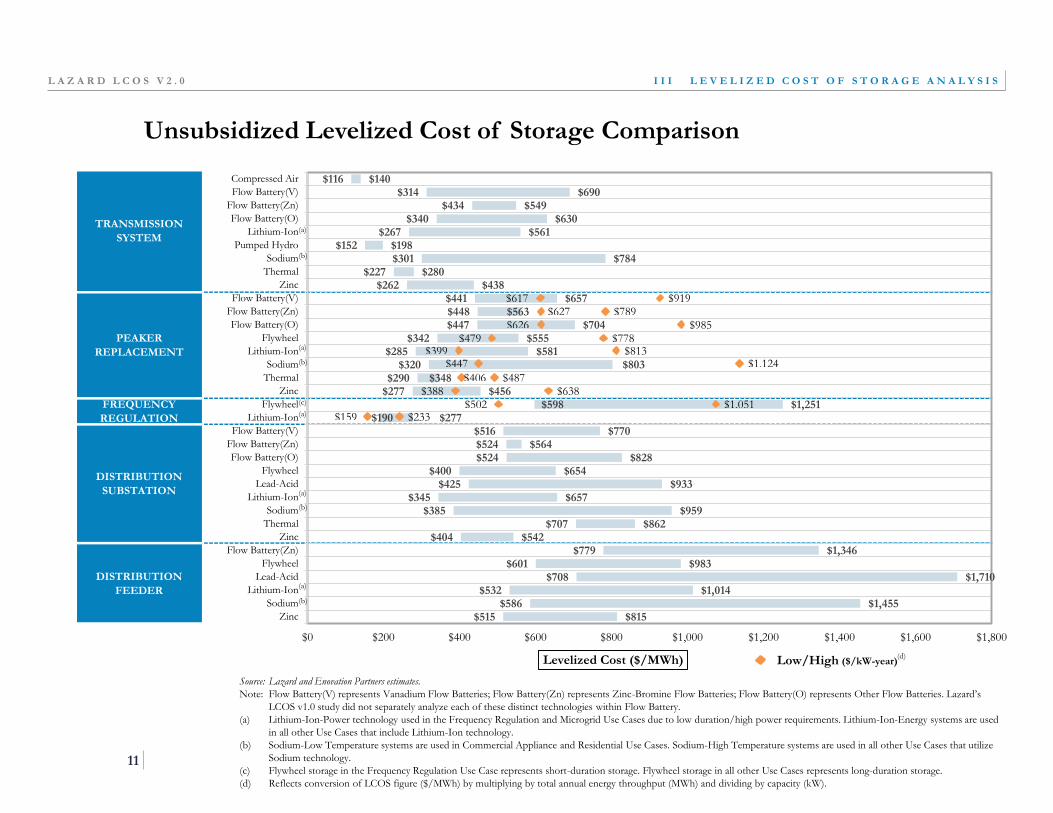
Unsubsidized Levelized Cost of Storage Comparison
Source: Lazard and Enovation Partners estimates.
Note: Flow Battery(V) represents Vanadium Flow Batteries; Flow Battery(Zn) represents Zinc-Bromine Flow Batteries; Flow Battery(O) represents Other Flow Batteries. Lazard’s
LCOS v1.0 study did not separately analyze each of these distinct technologies within Flow Battery.
(a) Lithium-Ion-Power technology used in the Frequency Regulation and Microgrid Use Cases due to low duration/high power requirements. Lithium-Ion-Energy systems are used
in all other Use Cases that include Lithium-Ion technology.
(b) Sodium-Low Temperature systems are used in Commercial Appliance and Residential Use Cases. Sodium-High Temperature systems are used in all other Use Cases that utilize
Sodium technology.
(c) Flywheel storage in the Frequency Regulation Use Case represents short-duration storage. Flywheel storage in all other Use Cases represents long-duration storage.
(d) Reflects conversion of LCOS figure ($/MWh) by multiplying by total annual energy throughput (MWh) and dividing by capacity (kW).
(c)
(a)
(b)
(a)
(a)
(a)
(a)
(b)
(b)
(b)
(d)
I I I L E V E L I Z E D C O S T O F S T O R A G E A N A L Y S I SL A Z A R D L C O S V 2 . 0
12
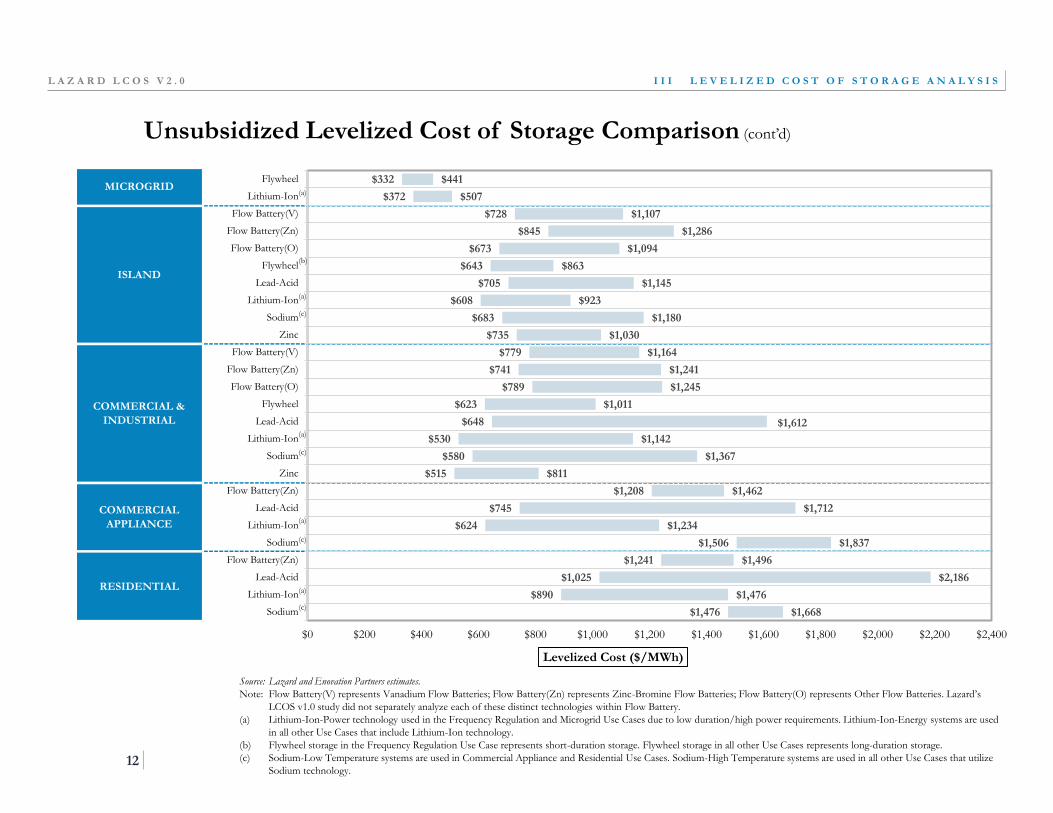
Unsubsidized Levelized Cost of Storage Comparison (cont’d)
MICROGRID
ISLAND
COMMERCIAL &
INDUSTRIAL
COMMERCIAL
APPLIANCE
RESIDENTIAL
$332
$372
$728
$845
$673
$643
$705
$608
$683
$735
$779
$741
$789
$623
$648
$530
$580
$515
$1,208
$745
$624
$1,506
$1,241
$1,025
$890
$1,476
$441
$507
$1,107
$1,286
$1,094
$863
$1,145
$923
$1,180
$1,030
$1,164
$1,241
$1,245
$1,011
$1,612
$1,142
$1,367
$811
$1,462
$1,712
$1,234
$1,837
$1,496
$2,186
$1,476
$1,668
$0 $200 $400 $600 $800 $1,000 $1,200 $1,400 $1,600 $1,800 $2,000 $2,200 $2,400
Flywheel
Lithium-Ion
Flow Battery(V)
Flow Battery(Zn)
Flow Battery(O)
Flywheel
Lead-Acid
Lithium-Ion
Sodium
Zinc
Flow Battery(V)
Flow Battery(Zn)
Flow Battery(O)
Flywheel
Lead-Acid
Lithium-Ion
Sodium
Zinc
Flow Battery(Zn)
Lead-Acid
Lithium-Ion
Sodium
Flow Battery(Zn)
Lead-Acid
Lithium-Ion
Sodium
Levelized Cost ($/MWh)
Source: Lazard and Enovation Partners estimates.
Note: Flow Battery(V) represents Vanadium Flow Batteries; Flow Battery(Zn) represents Zinc-Bromine Flow Batteries; Flow Battery(O) represents Other Flow Batteries. Lazard’s
LCOS v1.0 study did not separately analyze each of these distinct technologies within Flow Battery.
(a) Lithium-Ion-Power technology used in the Frequency Regulation and Microgrid Use Cases due to low duration/high power requirements. Lithium-Ion-Energy systems are used
in all other Use Cases that include Lithium-Ion technology.
(b) Flywheel storage in the Frequency Regulation Use Case represents short-duration storage. Flywheel storage in all other Use Cases represents long-duration storage.
(c) Sodium-Low Temperature systems are used in Commercial Appliance and Residential Use Cases. Sodium-High Temperature systems are used in all other Use Cases that utilize
Sodium technology.
(a)
(a)
(a)
(a)
(a)
(c)
(c)
(c)
(c)
(b)

TRANSMISSION
SYSTEM
PEAKER
REPLACEMENT
FREQUENCY
REGULATION
DISTRIBUTION
SUBSTATION
DISTRIBUTION
FEEDER
$41$139
$199$156
$141$67
$156$103
$123$206$207$213
$179$151
$166$138
$131$322
$79$245$246$253
$213$224
$185$205
$404$198
$383$333
$394$296
$328$274
$5$41
$70$55
$16$8
$25$12
$34$72$73$74
$34$19
$28$17$37
$55$13
$86$86
$89$40
$48$28
$34$49
$71$134
$64$86
$53$56
$79
$56$62
$61$49
$46$52
$52$76
$66$55$61$49
$47$46
$52$77
$66$66
$60$58$63$51
$49$52
$48$55
$81$69
$63$49
$52$48
$55$69
$6$21
$31$24
$19$11
$20$17
$16$32$32$33
$29$21
$22$22$17
$55$13
$38$38$39
$34$30
$25$27
$67$27
$60$54
$53$41
$44$37
$8$51
$73$57
$44$13
$48$20
$24$75$76$78
$54$48
$52$36
$26$100
$24$89
$90$92
$64$70
$58$64
$106$40
$139$100
$124$94
$103$56
$116 $314
$434 $340
$267 $152
$301 $227
$262 $441 $448 $447
$342 $285
$320 $290
$277 $598
$190 $516
$524 $524
$400 $425
$345 $385
$707 $404
$779 $601
$708 $532
$586 $515
$0 $200 $400 $600 $800
Compressed Air
Flow Battery(V)
Flow Battery(Zn)
Flow Battery(O)
Lithium-Ion
Pumped Hydro
Sodium
Thermal
Zinc
Flow Battery(V)
Flow Battery(Zn)
Flow Battery(O)
Flywheel
Lithium-Ion
Sodium
Thermal
Zinc
Flywheel
Lithium-Ion
Flow Battery(V)
Flow Battery(Zn)
Flow Battery(O)
Flywheel
Lead-Acid
Lithium-Ion
Sodium
Thermal
Zinc
Flow Battery(Zn)
Flywheel
Lead-Acid
Lithium-Ion
Sodium
Zinc
Capital O&M Charging Taxes Other
Levelized Cost ($/MWh)
I I I L E V E L I Z E D C O S T O F S T O R A G E A N A L Y S I SL A Z A R D L C O S V 2 . 0
13
Levelized Cost of Storage Components—Low End
Source: Lazard and Enovation Partners estimates.
Note: Flow Battery(V) represents Vanadium Flow Batteries; Flow Battery(Zn) represents Zinc-Bromine Flow Batteries; Flow Battery(O) represents Other Flow Batteries. Lazard’s
LCOS v1.0 study did not separately analyze each of these distinct technologies within Flow Battery. Analysis on this page does not decompose capacity-oriented cost figures
presented elsewhere in this presentation (i.e., $/kW).
(a) Consists of the equity portion of all capital expenditures (i.e., both initial and replacement capex).
(b) Consists of costs related to the extended warranty and total debt service (i.e., both interest and principal payments over the economic life of the system, inclusive of debt
associated with replacement capex, if any).
(a) (b)

I I I L E V E L I Z E D C O S T O F S T O R A G E A N A L Y S I SL A Z A R D L C O S V 2 . 0
14
Levelized Cost of Storage Components—Low End (cont’d)
MICROGRID
ISLAND
COMMERCIAL &
INDUSTRIAL
COMMERCIAL
APPLIANCE
RESIDENTIAL
Levelized Cost ($/MWh)
$115
$143
$139
$200
$156
$171
$194
$154
$173
$138
$385
$377
$397
$336
$336
$275
$299
$241
$742
$367
$306
$860
$741
$612
$532
$900
$25
$26
$49
$71
$55
$32
$41
$26
$28
$40
$96
$69
$100
$45
$58
$37
$40
$57
$0
$63
$42
$79
$0
$0
$0
$0
$137
$138
$471
$474
$384
$364
$386
$361
$408
$512
$103
$110
$92
$87
$92
$86
$97
$122
$167
$138
$129
$191
$202
$178
$155
$231
$19
$20
$18
$28
$22
$25
$24
$20
$21
$18
$66
$71
$68
$58
$58
$47
$51
$42
$138
$63
$52
$148
$138
$106
$92
$156
$36
$46
$51
$73
$57
$51
$61
$49
$54
$27
$128
$115
$132
$97
$104
$85
$92
$53
$161
$114
$95
$227
$161
$129
$112
$189
$332
$372
$728
$845
$673
$643
$705
$608
$683
$735
$779
$741
$789
$623
$648
$530
$580
$515
$1,208
$745
$624
$1,506
$1,241
$1,025
$890
$1,476
$0 $200 $400 $600 $800 $1,000 $1,200 $1,400 $1,600
Flywheel
Lithium-Ion
Flow Battery(V)
Flow Battery(Zn)
Flow Battery(O)
Flywheel
Lead-Acid
Lithium-Ion
Sodium
Zinc
Flow Battery(V)
Flow Battery(Zn)
Flow Battery(O)
Flywheel
Lead-Acid
Lithium-Ion
Sodium
Zinc
Flow Battery(Zn)
Lead-Acid
Lithium-Ion
Sodium
Flow Battery(Zn)
Lead-Acid
Lithium-Ion
Sodium
Capital O&M Charging Taxes Other
Source: Lazard and Enovation Partners estimates.
Note: Flow Battery(V) represents Vanadium Flow Batteries; Flow Battery(Zn) represents Zinc-Bromine Flow Batteries; Flow Battery(O) represents Other Flow Batteries. Lazard’s
LCOS v1.0 study did not separately analyze each of these distinct technologies within Flow Battery. Analysis on this page does not decompose capacity-oriented cost figures
presented elsewhere in this presentation (i.e., $/kW).
(a) Consists of the equity portion of all capital expenditures (i.e., both initial and replacement capex).
(b) Consists of costs related to the extended warranty and total debt service (i.e., both interest and principal payments over the economic life of the system, inclusive of debt
associated with replacement capex, if any).
(b)(a)

TRANSMISSION
SYSTEM
PEAKER
REPLACEMENT
FREQUENCY
REGULATION
DISTRIBUTION
SUBSTATION
DISTRIBUTION
FEEDER
$59$335
$302$318$327
$100$459
$123$219
$327$311
$342$309$338
$470$152
$229$718
$132$388
$308$407
$367$530
$379$565
$445$278
$790$566
$1,075$590
$873$437
$7$119
$66$76$37
$12$71
$30$81
$97$69
$121$57
$40$74
$37$84
$123$21
$115$69
$144$68
$113$55
$90$107
$102$238
$106$165
$103$140
$161
$53$61
$59$69
$46$51
$53$84
$66$61
$59$61
$47$46
$53$85
$66$64
$60$63
$62$63
$49$52
$48$55
$89$69
$62$49
$59$48
$55$69
$10$53
$34$51
$46$17
$60$20
$30$52
$34$54
$50$49
$61$24
$31$124
$23$61
$34$64
$59$72
$54$74
$72$38
$103$92
$119$85
$115$61
$11$123
$88$117
$104$19
$142$23
$42$120
$91$125
$92$108
$145$51
$45$222
$41$142
$91$149
$110$166
$121$175
$149$55
$152$170
$294$189
$271$87
$140 $690
$549 $630
$561 $198
$784 $280
$438 $657
$563 $704
$555 $581
$803 $348
$456 $1,251
$277 $770
$564 $828
$654 $933
$657 $959
$862 $542
$1,346 $983
$1,710 $1,014
$1,455 $815
$0 $200 $400 $600 $800 $1,000 $1,200 $1,400 $1,600 $1,800
Compressed Air
Flow Battery(V)
Flow Battery(Zn)
Flow Battery(O)
Lithium-Ion
Pumped Hydro
Sodium
Thermal
Zinc
Flow Battery(V)
Flow Battery(Zn)
Flow Battery(O)
Flywheel
Lithium-Ion
Sodium
Thermal
Zinc
Flywheel
Lithium-Ion
Flow Battery(V)
Flow Battery(Zn)
Flow Battery(O)
Flywheel
Lead-Acid
Lithium-Ion
Sodium
Thermal
Zinc
Flow Battery(Zn)
Flywheel
Lead-Acid
Lithium-Ion
Sodium
Zinc
Capital O&M Charging Taxes Other
Levelized Cost ($/MWh)
I I I L E V E L I Z E D C O S T O F S T O R A G E A N A L Y S I SL A Z A R D L C O S V 2 . 0
15
Levelized Cost of Storage Components—High End
Source: Lazard and Enovation Partners estimates.
Note: Flow Battery(V) represents Vanadium Flow Batteries; Flow Battery(Zn) represents Zinc-Bromine Flow Batteries; Flow Battery(O) represents Other Flow Batteries. Lazard’s
LCOS v1.0 study did not separately analyze each of these distinct technologies within Flow Battery. Analysis on this page does not decompose capacity-oriented cost figures
presented elsewhere in this presentation (i.e., $/kW).
(a) Consists of the equity portion of all capital expenditures (i.e., both initial and replacement capex).
(b) Consists of costs related to the extended warranty and total debt service (i.e., both interest and principal payments over the economic life of the system, inclusive of debt
associated with replacement capex, if any).
(a) (b)

I I I L E V E L I Z E D C O S T O F S T O R A G E A N A L Y S I SL A Z A R D L C O S V 2 . 0
16
Levelized Cost of Storage Components—High End (cont’d)
MICROGRID
ISLAND
COMMERCIAL &
INDUSTRIAL
COMMERCIAL
APPLIANCE
RESIDENTIAL
Levelized Cost ($/MWh)
$182
$237
$338
$540
$319
$304
$455
$346
$480
$306
$612
$708
$643
$581
$938
$655
$788
$409
$914
$968
$685
$980
$911
$1,425
$954
$1,018
$37
$34
$120
$116
$77
$55
$97
$58
$75
$52
$130
$132
$163
$76
$122
$86
$103
$119
$0
$127
$91
$168
$0
$0
$0
$0
$138
$139
$477
$470
$535
$368
$390
$361
$414
$535
$114
$111
$114
$87
$105
$86
$98
$123
$180
$157
$129
$216
$217
$190
$155
$261
$29
$29
$50
$61
$47
$47
$60
$47
$62
$40
$105
$132
$111
$100
$173
$113
$135
$71
$170
$178
$118
$169
$170
$263
$166
$175
$56
$69
$124
$99
$117
$90
$143
$111
$149
$98
$204
$157
$214
$166
$274
$203
$244
$89
$198
$283
$212
$303
$198
$309
$201
$214
$441
$507
$1,107
$1,286
$1,094
$863
$1,145
$923
$1,180
$1,030
$1,164
$1,241
$1,245
$1,011
$1,612
$1,142
$1,367
$811
$1,462
$1,712
$1,234
$1,837
$1,496
$2,186
$1,476
$1,668
$0 $200 $400 $600 $800 $1,000 $1,200 $1,400 $1,600 $1,800 $2,000 $2,200 $2,400
Flywheel
Lithium-Ion
Flow Battery(V)
Flow Battery(Zn)
Flow Battery(O)
Flywheel
Lead-Acid
Lithium-Ion
Sodium
Zinc
Flow Battery(V)
Flow Battery(Zn)
Flow Battery(O)
Flywheel
Lead-Acid
Lithium-Ion
Sodium
Zinc
Flow Battery(Zn)
Lead-Acid
Lithium-Ion
Sodium
Flow Battery(Zn)
Lead-Acid
Lithium-Ion
Sodium
Capital O&M Charging Taxes Other
Source: Lazard and Enovation Partners estimates.
Note: Flow Battery(V) represents Vanadium Flow Batteries; Flow Battery(Zn) represents Zinc-Bromine Flow Batteries; Flow Battery(O) represents Other Flow Batteries. Lazard’s
LCOS v1.0 study did not separately analyze each of these distinct technologies within Flow Battery. Analysis on this page does not decompose capacity-oriented cost figures
presented elsewhere in this presentation (i.e., $/kW).
(a) Consists of the equity portion of all capital expenditures (i.e., both initial and replacement capex).
(b) Consists of costs related to the extended warranty and total debt service (i.e., both interest and principal payments over the economic life of the system, inclusive of debt
associated with replacement capex, if any).
(a) (b)

TRANSMISSION
SYSTEM
PEAKER
REPLACEMENT
FREQUENCY
REGULATION
DISTRIBUTION
SUBSTATION
DISTRIBUTION
FEEDER
$130$426
$566$476
$386$213
$410$323
$233$631
$591$651
$551$417
$443$433
$258
$891$631
$501$651
$551$511
$432$463
$1,060$283
$653$568
$596$459
$493$315
$188$1,026
$611$976
$917$313
$1,200$388
$607$1,001
$636$1,051
$949$949
$1,233$476
$638
$1,484$1,001
$636$1,051
$949$1,211
$901$1,255
$1,166$654
$1,148$966
$1,146$931
$1,286$682
$0 $200 $400 $600 $800 $1,000 $1,200 $1,400 $1,600 $1,800
Compressed Air
Flow Battery(V)
Flow Battery(Zn)
Flow Battery(O)
Lithium-Ion
Pumped Hydro
Sodium
Thermal
Zinc
Flow Battery(V)
Flow Battery(Zn)
Flow Battery(O)
Flywheel
Lithium-Ion
Sodium
Thermal
Zinc
Flywheel
Lithium-Ion
Flow Battery(V)
Flow Battery(Zn)
Flow Battery(O)
Flywheel
Lead-Acid
Lithium-Ion
Sodium
Thermal
Zinc
Flow Battery(Zn)
Flywheel
Lead-Acid
Lithium-Ion
Sodium
Zinc
Capital Cost ($/kWh)
I I I L E V E L I Z E D C O S T O F S T O R A G E A N A L Y S I SL A Z A R D L C O S V 2 . 0
17
Capital Cost Comparison
Source: Lazard and Enovation Partners estimates.
Note: Flow Battery(V) represents Vanadium Flow Batteries; Flow Battery(Zn) represents Zinc-Bromine Flow Batteries; Flow Battery(O) represents Other Flow Batteries. Lazard’s
LCOS v1.0 study did not separately analyze each of these distinct technologies within Flow Battery.
(a) Capital cost range for Flywheel storage in Frequency Regulation Use Case is $3,600 – $8,000/kWh.
(b) Denotes $/kWh of “usable energy” (i.e., capacity multiplied by duration and expressed in kWh) vs. energy production. Only overnight capital is reflected in the numerator
(excludes capital charge, plus operating expenses), and rated discharge capacity is in the denominator (typically much greater than what is actually employed in most use cases).
(b)
(a)
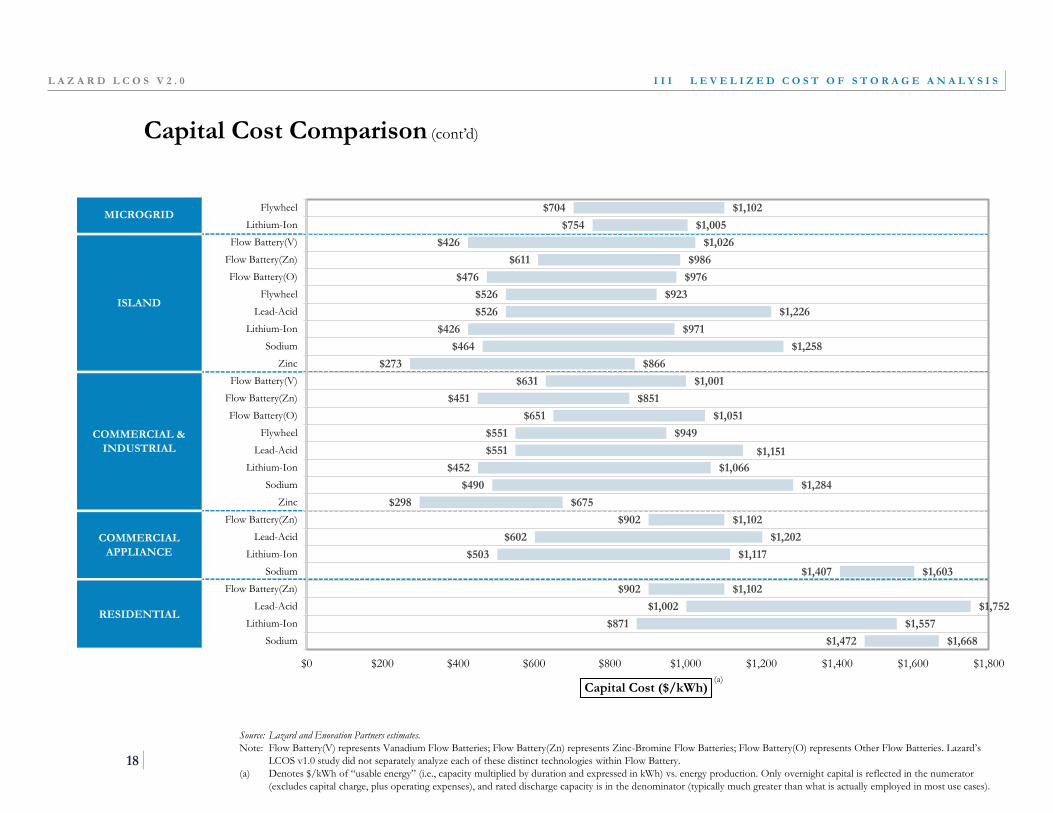
MICROGRID
ISLAND
COMMERCIAL &
INDUSTRIAL
COMMERCIAL
APPLIANCE
RESIDENTIAL
$704
$754
$426
$611
$476
$526
$526
$426
$464
$273
$631
$451
$651
$551
$551
$452
$490
$298
$902
$602
$503
$1,407
$902
$1,002
$871
$1,472
$1,102
$1,005
$1,026
$986
$976
$923
$1,226
$971
$1,258
$866
$1,001
$851
$1,051
$949
$1,151
$1,066
$1,284
$675
$1,102
$1,202
$1,117
$1,603
$1,102
$1,752
$1,557
$1,668
$0 $200 $400 $600 $800 $1,000 $1,200 $1,400 $1,600 $1,800
Flywheel
Lithium-Ion
Flow Battery(V)
Flow Battery(Zn)
Flow Battery(O)
Flywheel
Lead-Acid
Lithium-Ion
Sodium
Zinc
Flow Battery(V)
Flow Battery(Zn)
Flow Battery(O)
Flywheel
Lead-Acid
Lithium-Ion
Sodium
Zinc
Flow Battery(Zn)
Lead-Acid
Lithium-Ion
Sodium
Flow Battery(Zn)
Lead-Acid
Lithium-Ion
Sodium
Capital Cost ($/kWh)
I I I L E V E L I Z E D C O S T O F S T O R A G E A N A L Y S I SL A Z A R D L C O S V 2 . 0
18
Capital Cost Comparison (cont’d)
Source: Lazard and Enovation Partners estimates.
Note: Flow Battery(V) represents Vanadium Flow Batteries; Flow Battery(Zn) represents Zinc-Bromine Flow Batteries; Flow Battery(O) represents Other Flow Batteries. Lazard’s
LCOS v1.0 study did not separately analyze each of these distinct technologies within Flow Battery.
(a) Denotes $/kWh of “usable energy” (i.e., capacity multiplied by duration and expressed in kWh) vs. energy production. Only overnight capital is reflected in the numerator
(excludes capital charge, plus operating expenses), and rated discharge capacity is in the denominator (typically much greater than what is actually employed in most use cases).
(a)
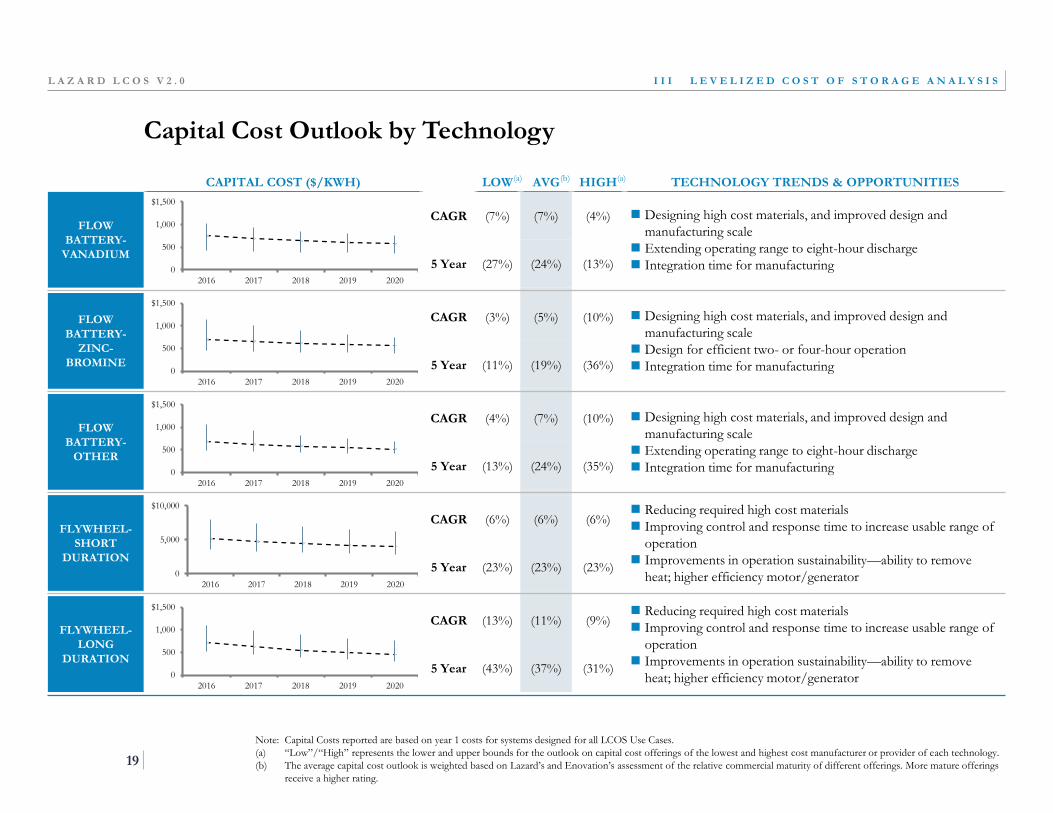
Capital Cost Outlook by Technology
I I I L E V E L I Z E D C O S T O F S T O R A G E A N A L Y S I SL A Z A R D L C O S V 2 . 0
CAPITAL COST ($/KWH) LOW AVG HIGH TECHNOLOGY TRENDS & OPPORTUNITIES
FLOW
BATTERY-
VANADIUM
CAGR (7%) (7%) (4%) Designing high cost materials, and improved design and
manufacturing scale
Extending operating range to eight-hour discharge
Integration time for manufacturing5 Year (27%) (24%) (13%)
FLOW
BATTERY-
ZINC-
BROMINE
CAGR (3%) (5%) (10%) Designing high cost materials, and improved design and
manufacturing scale
Design for efficient two- or four-hour operation
Integration time for manufacturing 5 Year (11%) (19%) (36%)
FLOW
BATTERY-
OTHER
CAGR (4%) (7%) (10%) Designing high cost materials, and improved design and
manufacturing scale
Extending operating range to eight-hour discharge
Integration time for manufacturing5 Year (13%) (24%) (35%)
FLYWHEEL-
SHORT
DURATION
CAGR (6%) (6%) (6%) Reducing required high cost materials
Improving control and response time to increase usable range of
operation
Improvements in operation sustainability—ability to remove
heat; higher efficiency motor/generator5 Year (23%) (23%) (23%)
FLYWHEEL-
LONG
DURATION
CAGR (13%) (11%) (9%) Reducing required high cost materials
Improving control and response time to increase usable range of
operation
Improvements in operation sustainability—ability to remove
heat; higher efficiency motor/generator5 Year (43%) (37%) (31%)
0
500
1,000
$1,500
2016 2017 2018 2019 2020
0
500
1,000
$1,500
2016 2017 2018 2019 2020
0
500
1,000
$1,500
2016 2017 2018 2019 2020
0
500
1,000
$1,500
2016 2017 2018 2019 2020
0
5,000
$10,000
2016 2017 2018 2019 2020
Note: Capital Costs reported are based on year 1 costs for systems designed for all LCOS Use Cases.
(a) “Low”/“High” represents the lower and upper bounds for the outlook on capital cost offerings of the lowest and highest cost manufacturer or provider of each technology.
(b) The average capital cost outlook is weighted based on Lazard’s and Enovation’s assessment of the relative commercial maturity of different offerings. More mature offerings
receive a higher rating.
19
(a) (a)(b)
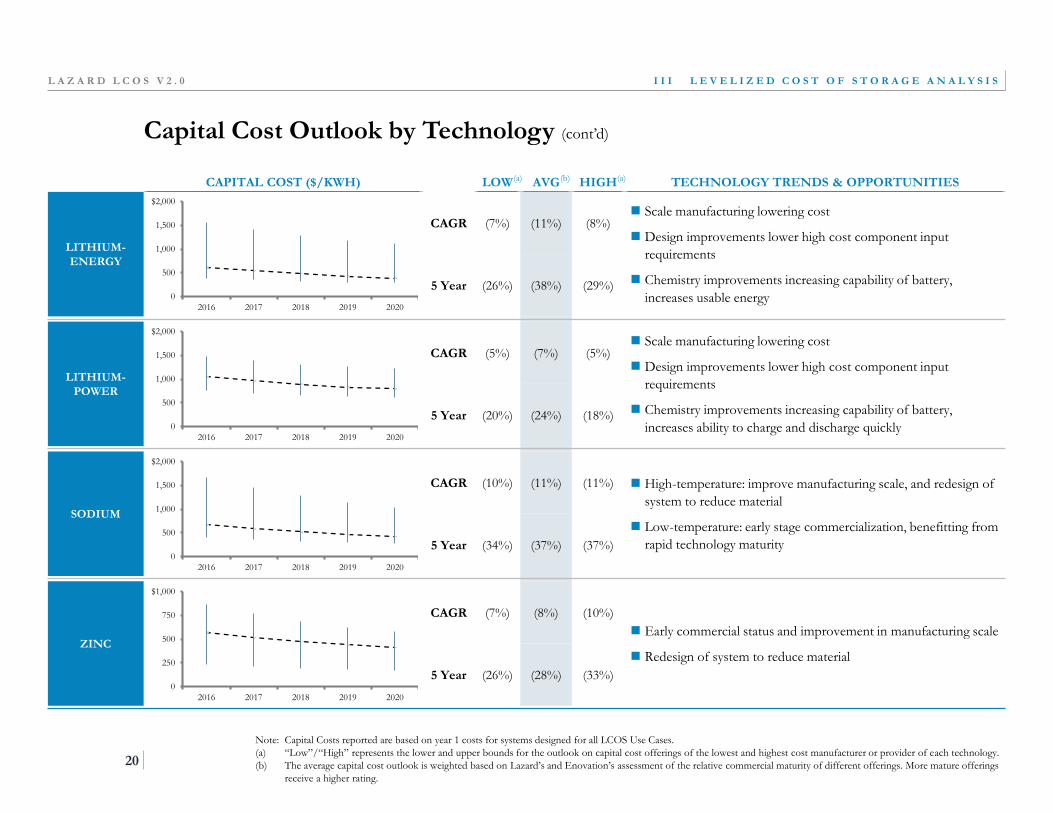
Capital Cost Outlook by Technology (cont’d)
I I I L E V E L I Z E D C O S T O F S T O R A G E A N A L Y S I SL A Z A R D L C O S V 2 . 0
CAPITAL COST ($/KWH) LOW AVG HIGH TECHNOLOGY TRENDS & OPPORTUNITIES
LITHIUM-
ENERGY
CAGR (7%) (11%) (8%) Scale manufacturing lowering cost
Design improvements lower high cost component input
requirements
Chemistry improvements increasing capability of battery,
increases usable energy5 Year (26%) (38%) (29%)
LITHIUM-
POWER
CAGR (5%) (7%) (5%) Scale manufacturing lowering cost
Design improvements lower high cost component input
requirements
Chemistry improvements increasing capability of battery,
increases ability to charge and discharge quickly 5 Year (20%) (24%) (18%)
SODIUM
CAGR (10%) (11%) (11%) High-temperature: improve manufacturing scale, and redesign of
system to reduce material
Low-temperature: early stage commercialization, benefitting from
rapid technology maturity5 Year (34%) (37%) (37%)
ZINC
CAGR (7%) (8%) (10%)
Early commercial status and improvement in manufacturing scale
Redesign of system to reduce material
5 Year (26%) (28%) (33%)
0
500
1,000
1,500
$2,000
2016 2017 2018 2019 2020
0
250
500
750
$1,000
2016 2017 2018 2019 2020
0
500
1,000
1,500
$2,000
2016 2017 2018 2019 2020
0
500
1,000
1,500
$2,000
2016 2017 2018 2019 2020
20
(a) (a)(b)
Note: Capital Costs reported are based on year 1 costs for systems designed for all LCOS Use Cases.
(a) “Low”/“High” represents the lower and upper bounds for the outlook on capital cost offerings of the lowest and highest cost manufacturer or provider of each technology.
(b) The average capital cost outlook is weighted based on Lazard’s and Enovation’s assessment of the relative commercial maturity of different offerings. More mature offerings
receive a higher rating.
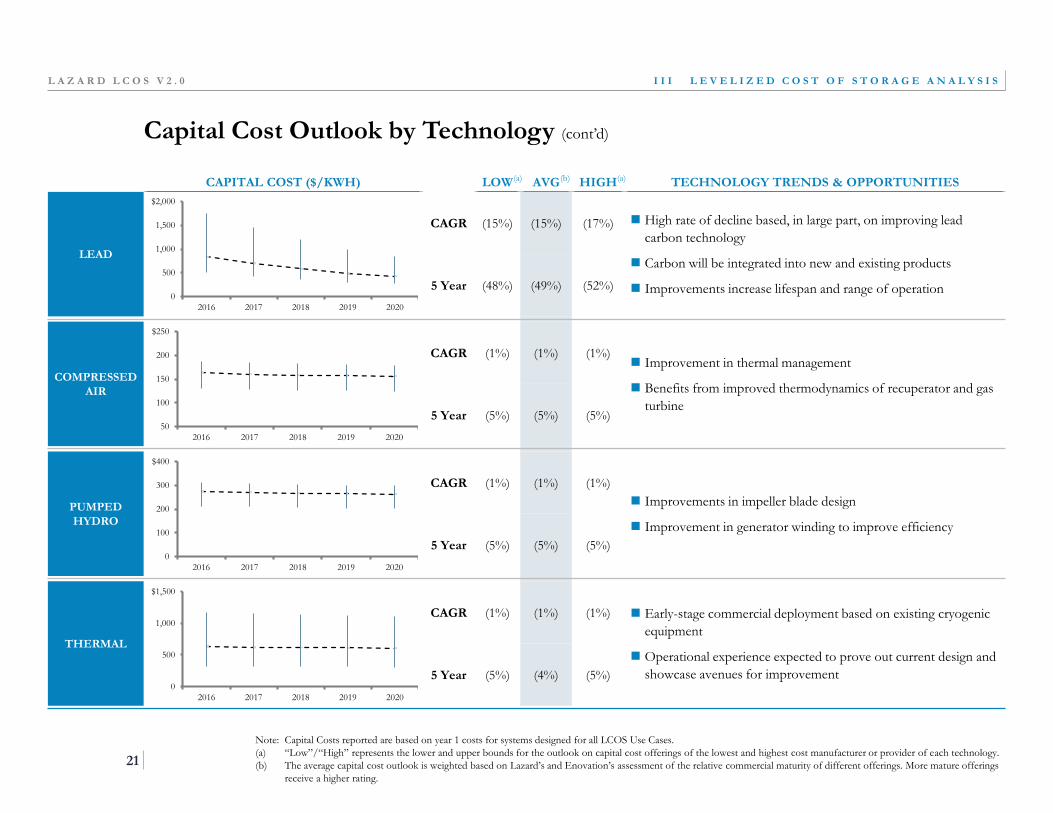
Capital Cost Outlook by Technology (cont’d)
I I I L E V E L I Z E D C O S T O F S T O R A G E A N A L Y S I SL A Z A R D L C O S V 2 . 0
CAPITAL COST ($/KWH) LOW AVG HIGH TECHNOLOGY TRENDS & OPPORTUNITIES
LEAD
CAGR (15%) (15%) (17%) High rate of decline based, in large part, on improving lead
carbon technology
Carbon will be integrated into new and existing products
Improvements increase lifespan and range of operation5 Year (48%) (49%) (52%)
COMPRESSED
AIR
CAGR (1%) (1%) (1%) Improvement in thermal management
Benefits from improved thermodynamics of recuperator and gas
turbine5 Year (5%) (5%) (5%)
PUMPED
HYDRO
CAGR (1%) (1%) (1%)
Improvements in impeller blade design
Improvement in generator winding to improve efficiency
5 Year (5%) (5%) (5%)
THERMAL
CAGR (1%) (1%) (1%) Early-stage commercial deployment based on existing cryogenic
equipment
Operational experience expected to prove out current design and
showcase avenues for improvement5 Year (5%) (4%) (5%)
0
500
1,000
1,500
$2,000
2016 2017 2018 2019 2020
0
500
1,000
$1,500
2016 2017 2018 2019 2020
50
100
150
200
$250
2016 2017 2018 2019 2020
0
100
200
300
$400
2016 2017 2018 2019 2020
21
(a) (a)(b)
Note: Capital Costs reported are based on year 1 costs for systems designed for all LCOS Use Cases.
(a) “Low”/“High” represents the lower and upper bounds for the outlook on capital cost offerings of the lowest and highest cost manufacturer or provider of each technology.
(b) The average capital cost outlook is weighted based on Lazard’s and Enovation’s assessment of the relative commercial maturity of different offerings. More mature offerings
receive a higher rating.
Confidential
IV Illustrative Energy Storage Value Snapshots
L A Z A R D L C O S V 2 . 0

Illustrative Value Snapshots—Introduction
While the LCOS methodology allows for “apples-to-apples” comparisons within Use Cases, it is narrowly focused on costs,
based on an extensive survey of suppliers and market participants. To supplement this LCOS analysis, we have included in this
report several “Illustrative Value Snapshots” that show typical economics associated with merchant behind-the-meter storage
projects in a variety of geographies
I V I L L U S T R A T I V E E N E R G Y S T O R A G E V A L U E S N A P S H O T SL A Z A R D L C O S V 2 . 0
22
Based on illustrative storage systems configured to capture value streams available in a number of ISOs/RTOs
Includes revenue from serving RTO markets and delivering customer cost savings, assuming relevant market and contractual rules
Load profiles applied based on U.S. DOE’s standard medium/large-sized commercial building profile load, adjusted for regional
differences
Specific tariff rates reflect medium or large commercial power with peak load floors and caps of 10kW and 100kW, respectively;
assumes demand charges ranging from $4 to $53 per peak kW, depending on jurisdiction
Assumes state-level, non-tax-oriented incentive payments (e.g., SGIP in California and DMP in New York) are treated as taxable
income for federal income tax purposes(a)
Cost estimates(b) based on LCOS framework (i.e., assumptions regarding O&M, warranties, etc.), but sized to reflect the
system configuration described above
System size and performance adjusted to capture multiple value streams and to reflect estimated regional differences in system
installation costs, based on survey data and proprietary Enovation Partners case experience
System costs based on individual component (lithium-ion battery, inverter, etc.) sizing based on the needs determined in the
analysis
Operational performance specifications required to serve various modeled revenue streams, based on lithium-ion system in LCOS
v2.0 (cycling life, Depth of Discharge, etc.)
System economic viability described by Illustrative Value Snapshot-levered IRR(c)
(a) Based on discussions with developers of merchant storage projects in New York and California.
(b) “Costs” for Illustrative Value Snapshots denote actual cost-oriented line items, not “LCOS” costs (i.e., $/MWh required to satisfy assumed equity cost of capital).
(c) This report does not attempt to determine “base” or “typical” IRRs associated with a given market or region. Results and viability are purely illustrative and may differ from
actual project results.
Frequency Regulation
+ Demand Response
Demand Charge
Management +
Demand Response +
Frequency Regulation
Frequency Regulation
+ Demand Response
Demand Charge
Management +
Demand Response +
Frequency Regulation
Demand Response +
Demand Charge
Management
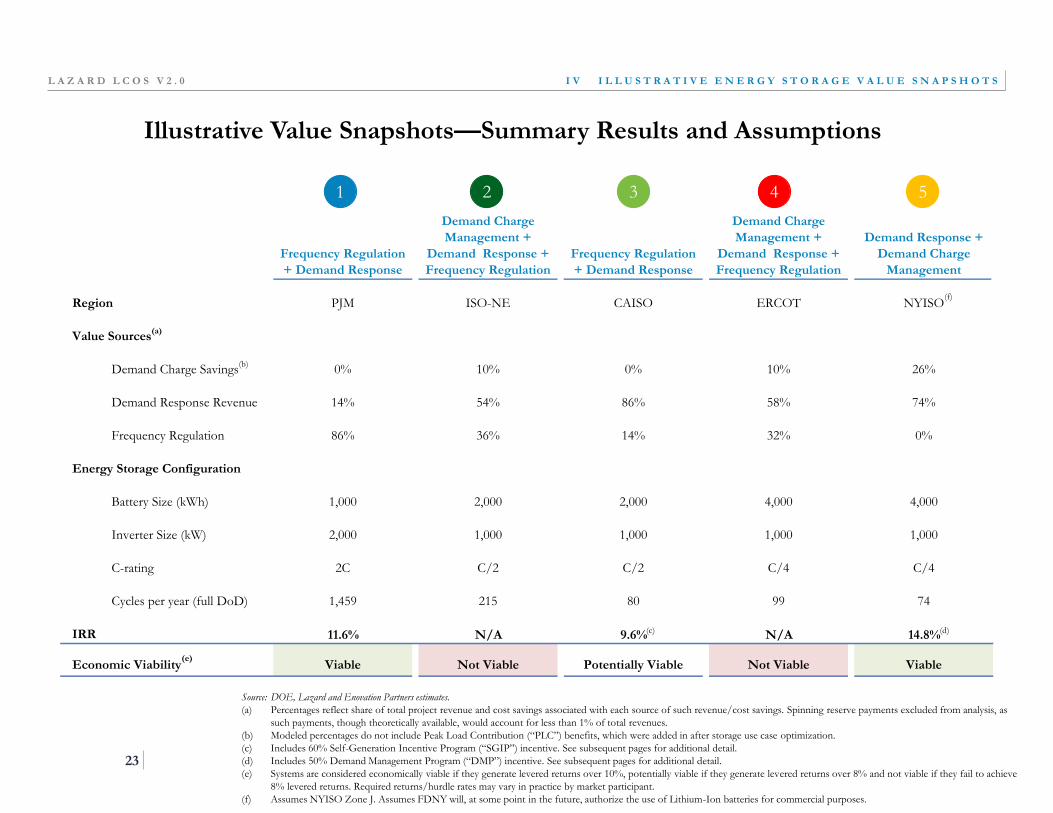
Region PJM ISO-NE CAISO ERCOT NYISO
Value Sources(a)
Demand Charge Savings(b)
0% 10% 0% 10% 26%
Demand Response Revenue 14% 54% 86% 58% 74%
Frequency Regulation 86% 36% 14% 32% 0%
Energy Storage Configuration
Battery Size (kWh) 1,000 2,000 2,000 4,000 4,000
Inverter Size (kW) 2,000 1,000 1,000 1,000 1,000
C-rating 2C C/2 C/2 C/4 C/4
Cycles per year (full DoD) 1,459 215 80 99 74
IRR 11.6% N/A 9.6% N/A 14.8%
Economic Viability Viable Not Viable Potentially Viable Not Viable Viable
(c) (d)
I V I L L U S T R A T I V E E N E R G Y S T O R A G E V A L U E S N A P S H O T SL A Z A R D L C O S V 2 . 0
Illustrative Value Snapshots—Summary Results and Assumptions
Source: DOE, Lazard and Enovation Partners estimates.
(a) Percentages reflect share of total project revenue and cost savings associated with each source of such revenue/cost savings. Spinning reserve payments excluded from analysis, as
such payments, though theoretically available, would account for less than 1% of total revenues.
(b) Modeled percentages do not include Peak Load Contribution (“PLC”) benefits, which were added in after storage use case optimization.
(c) Includes 60% Self-Generation Incentive Program (“SGIP”) incentive. See subsequent pages for additional detail.
(d) Includes 50% Demand Management Program (“DMP”) incentive. See subsequent pages for additional detail.
(e) Systems are considered economically viable if they generate levered returns over 10%, potentially viable if they generate levered returns over 8% and not viable if they fail to achieve
8% levered returns. Required returns/hurdle rates may vary in practice by market participant.
(f) Assumes NYISO Zone J. Assumes FDNY will, at some point in the future, authorize the use of Lithium-Ion batteries for commercial purposes.
23
1 2 3 4 5
(e)
(f)

CA 2016 2017 2018 2019 2020 2021 2022 2023 2024 2025 2026
Total Revenue $0 $290,454 $297,716 $305,158 $312,787 $320,607 $328,622 $336,838 $345,259 $353,890 $362,738
Memo:
Demand Charge Savings $0 $16,656 $17,073 $17,499 $17,937 $18,385 $18,845 $19,316 $19,799 $20,294 $20,801
Demand Response 0 7,232 7,413 7,599 7,789 7,983 8,183 8,387 8,597 8,812 9,032
Frequency Regulation 0 266,566 273,230 280,060 287,062 294,239 301,595 309,134 316,863 324,784 332,904
Incentive Payments 0 0 0 0 0 0 0 0 0 0 0
Total Operating Costs $0 ($101,480) ($103,949) ($127,497) ($130,087) ($132,741) ($135,459) ($138,243) ($141,095) ($144,017) ($147,010)
Memo:
O&M $0 ($20,931) ($21,402) ($21,884) ($22,376) ($22,880) ($23,395) ($23,921) ($24,459) ($25,010) ($25,572)
Warranty 0 0 0 (21,019) (21,019) (21,019) (21,019) (21,019) (21,019) (21,019) (21,019)
Charging 0 (80,549) (82,546) (84,594) (86,692) (88,841) (91,045) (93,303) (95,617) (97,988) (100,418)
EBITDA $0 $188,974 $193,767 $177,662 $182,700 $187,866 $193,164 $198,595 $204,164 $209,873 $215,728
Less: MACRS D&A 0 (150,184) (257,383) (183,815) (131,266) (93,852) (93,747) (93,852) (46,873) 0 0
EBIT $0 $38,790 ($63,616) ($6,153) $51,434 $94,015 $99,417 $104,743 $157,290 $209,873 $215,728
Less: Interest Expense 0 (16,816) (15,655) (14,401) (13,047) (11,585) (10,006) (8,300) (6,458) (4,469) (2,320)
Less: Cash Taxes 0 (8,570) 0 0 0 (8,187) (34,870) (37,613) (58,825) (80,108) (83,229)
Tax Net Income $0 $13,405 ($79,271) ($20,554) $38,387 $74,243 $54,541 $58,830 $92,008 $125,297 $130,179
MACRS D&A 0 150,184 257,383 183,815 131,266 93,852 93,747 93,852 46,873 0 0
Construction Capex (840,777) 0 0 0 0 0 0 0 0 0 0
Principal 0 (14,510) (15,670) (16,924) (18,278) (19,740) (21,319) (23,025) (24,867) (26,856) (29,005)
After Tax Levered Cash Flow ($840,777) $149,079 $162,442 $146,336 $151,375 $148,355 $126,968 $129,657 $114,014 $98,441 $101,174
Levered Project IRR 11.6%
I V I L L U S T R A T I V E E N E R G Y S T O R A G E V A L U E S N A P S H O T SL A Z A R D L C O S V 2 . 0
Illustrative Value Snapshot—PJM
Model Assumptions:
Size (MW) 2.0 Extended Warranty (%) 2% Regional Power Equipment Cost Scalar 1.00
Capacity (MWh) 1.0 EPC Cost (%) 13% Regional BOS Cost Scalar 0.95
Cycles Per Year 1,459 O&M Cost (%) 1.9% Regional EPC Cost Scalar 1.09
Depth of Discharge (%) 8% Useful Life (years) 10
Efficiency (%) 89%
24
Source: DOE, Lazard and Enovation Partners estimates.
(a) Assumes 2.5% revenue escalation.
(b) Includes PLC benefits.
(c) Represents extended warranty costs that provide coverage beyond the initial two-
year product warranty (included in equipment capital costs).
(d) Assumes 2.5% charging cost escalation.
(e) Assumes 7-year MACRS depreciation.
(f) Indicates “usable energy” capacity.
(f)
(g)
(c)(h)
(j)
(i)
1
(g) Reflects full depth of discharge cycles per year.
(h) Sized as a percentage of total installed capex, annually, after expiration of initial two-
year product warranty.
(i) Assumes EPC costs as a percentage of AC and DC raw capital costs.
(j) Sized as a portion of total installed capital cost. Assumes O&M escalation of 2.25%.
(k) Scalars are adjustment factors for the national averages, determined by Bloomberg
estimates and Labor Departments statistics.
(a)
(c)
(d)
(e)
(k)
(k)
(k)
(b)

CA 2016 2017 2018 2019 2020 2021 2022 2023 2024 2025 2026
Total Revenue $0 $177,083 $181,510 $186,048 $190,699 $195,466 $200,353 $205,362 $210,496 $215,758 $221,152
Memo:
Demand Charge Savings $0 $46,098 $47,250 $48,432 $49,643 $50,884 $52,156 $53,460 $54,796 $56,166 $57,570
Demand Response 0 50,922 52,195 53,500 54,837 56,208 57,614 59,054 60,530 62,044 63,595
Frequency Regulation 0 80,063 82,064 84,116 86,219 88,374 90,584 92,848 95,169 97,549 99,987
Incentive Payments 0 0 0 0 0 0 0 0 0 0 0
Total Operating Costs $0 ($74,524) ($76,318) ($107,944) ($109,826) ($111,752) ($113,725) ($115,746) ($117,815) ($119,935) ($122,105)
Memo:
O&M $0 ($23,706) ($24,240) ($24,785) ($25,343) ($25,913) ($26,496) ($27,092) ($27,702) ($28,325) ($28,962)
Warranty 0 0 0 (29,790) (29,790) (29,790) (29,790) (29,790) (29,790) (29,790) (29,790)
Charging 0 (50,818) (52,078) (53,369) (54,693) (56,049) (57,439) (58,864) (60,324) (61,820) (63,353)
EBITDA $0 $102,559 $105,192 $78,103 $80,873 $83,714 $86,628 $89,616 $92,680 $95,824 $99,047
Less: MACRS D&A 0 (212,849) (364,777) (260,512) (186,038) (133,012) (132,863) (133,012) (66,431) 0 0
EBIT $0 ($110,290) ($259,585) ($182,409) ($105,164) ($49,298) ($46,235) ($43,396) $26,249 $95,824 $99,047
Less: Interest Expense 0 (23,832) (22,187) (20,410) (18,491) (16,419) (14,181) (11,764) (9,153) (6,334) (3,289)
Less: Cash Taxes 0 0 0 0 0 0 0 0 0 0 0
Tax Net Income $0 ($134,122) ($281,771) ($202,819) ($123,656) ($65,717) ($60,416) ($55,159) $17,096 $89,490 $95,758
MACRS D&A 0 212,849 364,777 260,512 186,038 133,012 132,863 133,012 66,431 0 0
Construction Capex (1,191,594) 0 0 0 0 0 0 0 0 0 0
Principal 0 (20,564) (22,209) (23,986) (25,904) (27,977) (30,215) (32,632) (35,243) (38,062) (41,107)
After Tax Levered Cash Flow ($1,191,594) $58,163 $60,797 $33,708 $36,478 $39,318 $42,232 $45,220 $48,285 $51,428 $54,651
Levered Project IRR N/A
I V I L L U S T R A T I V E E N E R G Y S T O R A G E V A L U E S N A P S H O T SL A Z A R D L C O S V 2 . 0
Illustrative Value Snapshot—ISO-NE
Model Assumptions:
Size (MW) 1.0 Extended Warranty (%) 2% Regional Power Equipment Cost Scalar 1.00
Capacity (MWh) 2.0 EPC Cost (%) 18% Regional BOS Cost Scalar 1.14
Cycles Per Year 215 O&M Cost (%) 1.6% Regional EPC Cost Scalar 1.23
Depth of Discharge (%) 100% Useful Life (years) 10
Efficiency (%) 92%
25
2
(f)
(g)
(c)(h)
(j)
(i)
(a)
(c)
(d)
(e)
(k)
(k)
(k)
(b)
Source: DOE, Lazard and Enovation Partners estimates.
(a) Assumes 2.5% revenue escalation.
(b) Includes PLC benefits.
(c) Represents extended warranty costs that provide coverage beyond the initial two-
year product warranty (included in equipment capital costs).
(d) Assumes 2.5% charging cost escalation.
(e) Assumes 7-year MACRS depreciation.
(f) Indicates “usable energy” capacity.
(g) Reflects full depth of discharge cycles per year.
(h) Sized as a percentage of total installed capex, annually, after expiration of initial two-
year product warranty.
(i) Assumes EPC costs as a percentage of AC and DC raw capital costs.
(j) Sized as a portion of total installed capital cost. Assumes O&M escalation of 2.25%.
(k) Scalars are adjustment factors for the national averages, determined by Bloomberg
estimates and Labor Departments statistics.
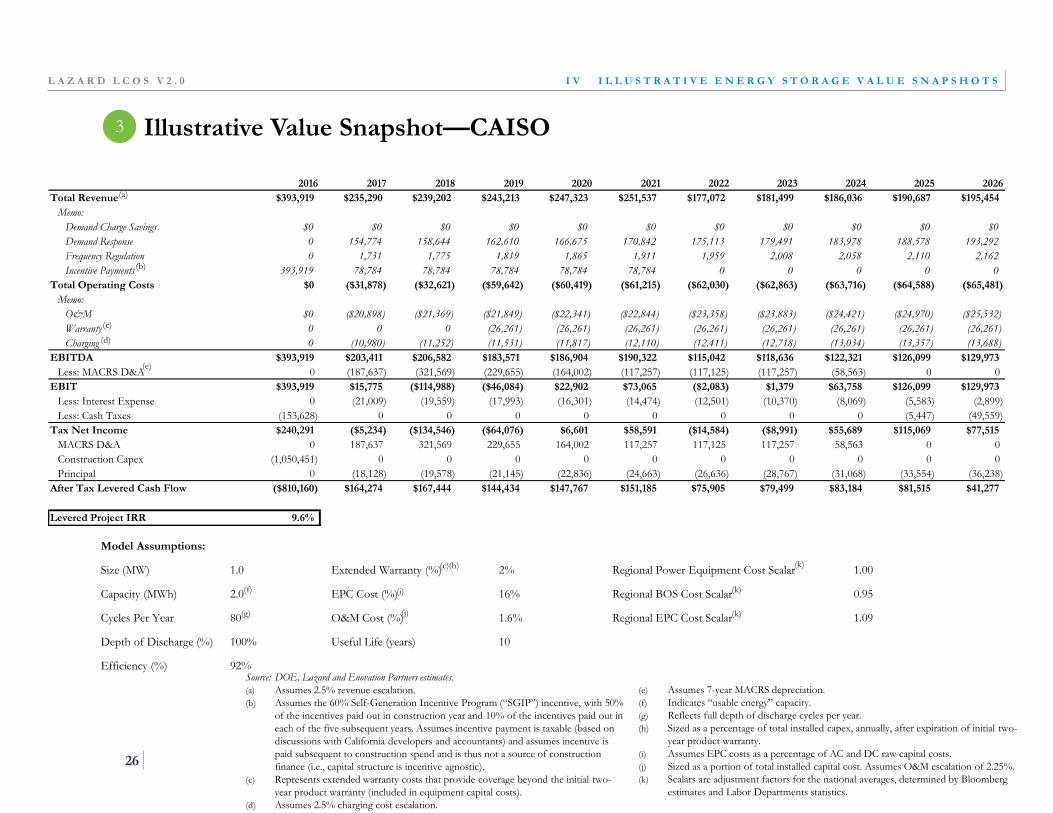
CA 2016 2017 2018 2019 2020 2021 2022 2023 2024 2025 2026
Total Revenue $393,919 $235,290 $239,202 $243,213 $247,323 $251,537 $177,072 $181,499 $186,036 $190,687 $195,454
Memo:
Demand Charge Savings $0 $0 $0 $0 $0 $0 $0 $0 $0 $0 $0
Demand Response 0 154,774 158,644 162,610 166,675 170,842 175,113 179,491 183,978 188,578 193,292
Frequency Regulation 0 1,731 1,775 1,819 1,865 1,911 1,959 2,008 2,058 2,110 2,162
Incentive Payments 393,919 78,784 78,784 78,784 78,784 78,784 0 0 0 0 0
Total Operating Costs $0 ($31,878) ($32,621) ($59,642) ($60,419) ($61,215) ($62,030) ($62,863) ($63,716) ($64,588) ($65,481)
Memo:
O&M $0 ($20,898) ($21,369) ($21,849) ($22,341) ($22,844) ($23,358) ($23,883) ($24,421) ($24,970) ($25,532)
Warranty 0 0 0 (26,261) (26,261) (26,261) (26,261) (26,261) (26,261) (26,261) (26,261)
Charging 0 (10,980) (11,252) (11,531) (11,817) (12,110) (12,411) (12,718) (13,034) (13,357) (13,688)
EBITDA $393,919 $203,411 $206,582 $183,571 $186,904 $190,322 $115,042 $118,636 $122,321 $126,099 $129,973
Less: MACRS D&A 0 (187,637) (321,569) (229,655) (164,002) (117,257) (117,125) (117,257) (58,563) 0 0
EBIT $393,919 $15,775 ($114,988) ($46,084) $22,902 $73,065 ($2,083) $1,379 $63,758 $126,099 $129,973
Less: Interest Expense 0 (21,009) (19,559) (17,993) (16,301) (14,474) (12,501) (10,370) (8,069) (5,583) (2,899)
Less: Cash Taxes (153,628) 0 0 0 0 0 0 0 0 (5,447) (49,559)
Tax Net Income $240,291 ($5,234) ($134,546) ($64,076) $6,601 $58,591 ($14,584) ($8,991) $55,689 $115,069 $77,515
MACRS D&A 0 187,637 321,569 229,655 164,002 117,257 117,125 117,257 58,563 0 0
Construction Capex (1,050,451) 0 0 0 0 0 0 0 0 0 0
Principal 0 (18,128) (19,578) (21,145) (22,836) (24,663) (26,636) (28,767) (31,068) (33,554) (36,238)
After Tax Levered Cash Flow ($810,160) $164,274 $167,444 $144,434 $147,767 $151,185 $75,905 $79,499 $83,184 $81,515 $41,277
Levered Project IRR 9.6%
I V I L L U S T R A T I V E E N E R G Y S T O R A G E V A L U E S N A P S H O T SL A Z A R D L C O S V 2 . 0
Illustrative Value Snapshot—CAISO
Model Assumptions:
Size (MW) 1.0 Extended Warranty (%) 2% Regional Power Equipment Cost Scalar 1.00
Capacity (MWh) 2.0 EPC Cost (%) 16% Regional BOS Cost Scalar 0.95
Cycles Per Year 80 O&M Cost (%) 1.6% Regional EPC Cost Scalar 1.09
Depth of Discharge (%) 100% Useful Life (years) 10
Efficiency (%) 92%
26
3
Source: DOE, Lazard and Enovation Partners estimates.
(a) Assumes 2.5% revenue escalation.
(b) Assumes the 60% Self-Generation Incentive Program (“SGIP”) incentive, with 50%
of the incentives paid out in construction year and 10% of the incentives paid out in
each of the five subsequent years. Assumes incentive payment is taxable (based on
discussions with California developers and accountants) and assumes incentive is
paid subsequent to construction spend and is thus not a source of construction
finance (i.e., capital structure is incentive agnostic).
(c) Represents extended warranty costs that provide coverage beyond the initial two-
year product warranty (included in equipment capital costs).
(d) Assumes 2.5% charging cost escalation.
(e) Assumes 7-year MACRS depreciation.
(f) Indicates “usable energy” capacity.
(g) Reflects full depth of discharge cycles per year.
(h) Sized as a percentage of total installed capex, annually, after expiration of initial two-
year product warranty.
(i) Assumes EPC costs as a percentage of AC and DC raw capital costs.
(j) Sized as a portion of total installed capital cost. Assumes O&M escalation of 2.25%.
(k) Scalars are adjustment factors for the national averages, determined by Bloomberg
estimates and Labor Departments statistics.
(a)
(c)
(d)
(e)
(f)
(g)
(c)(h)
(j)
(i)
(k)
(k)
(k)
(b)
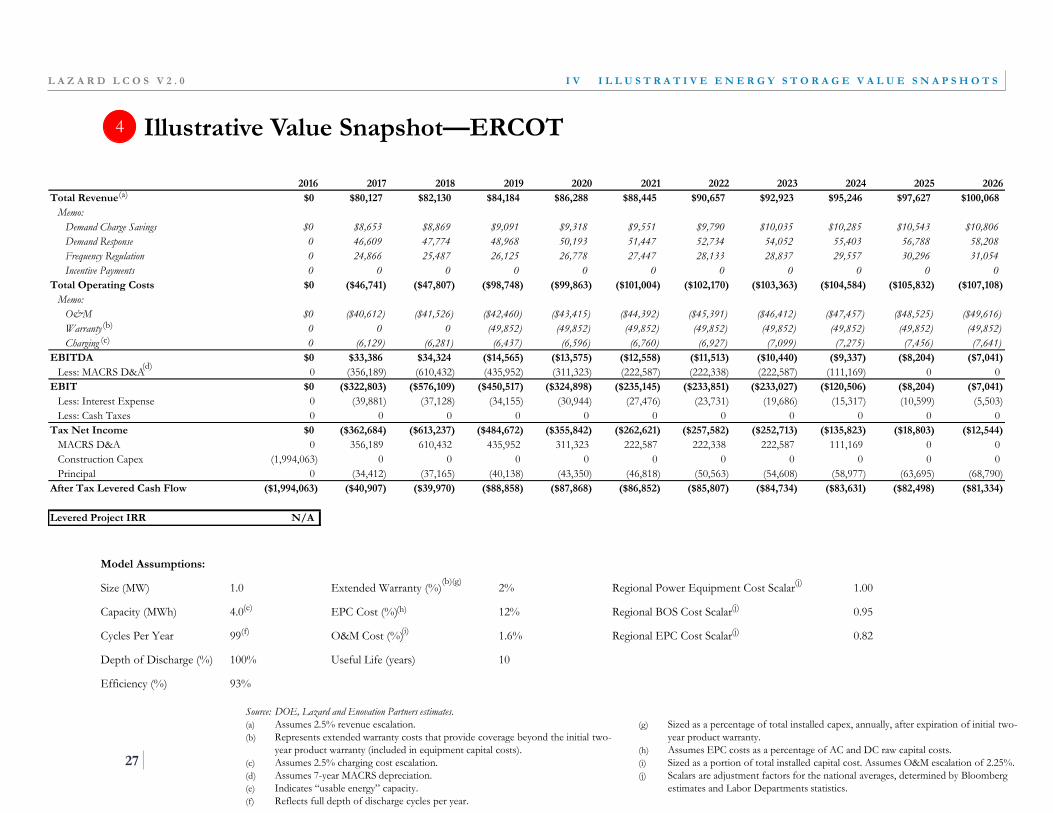
CA 2016 2017 2018 2019 2020 2021 2022 2023 2024 2025 2026
Total Revenue $0 $80,127 $82,130 $84,184 $86,288 $88,445 $90,657 $92,923 $95,246 $97,627 $100,068
Memo:
Demand Charge Savings $0 $8,653 $8,869 $9,091 $9,318 $9,551 $9,790 $10,035 $10,285 $10,543 $10,806
Demand Response 0 46,609 47,774 48,968 50,193 51,447 52,734 54,052 55,403 56,788 58,208
Frequency Regulation 0 24,866 25,487 26,125 26,778 27,447 28,133 28,837 29,557 30,296 31,054
Incentive Payments 0 0 0 0 0 0 0 0 0 0 0
Total Operating Costs $0 ($46,741) ($47,807) ($98,748) ($99,863) ($101,004) ($102,170) ($103,363) ($104,584) ($105,832) ($107,108)
Memo:
O&M $0 ($40,612) ($41,526) ($42,460) ($43,415) ($44,392) ($45,391) ($46,412) ($47,457) ($48,525) ($49,616)
Warranty 0 0 0 (49,852) (49,852) (49,852) (49,852) (49,852) (49,852) (49,852) (49,852)
Charging 0 (6,129) (6,281) (6,437) (6,596) (6,760) (6,927) (7,099) (7,275) (7,456) (7,641)
EBITDA $0 $33,386 $34,324 ($14,565) ($13,575) ($12,558) ($11,513) ($10,440) ($9,337) ($8,204) ($7,041)
Less: MACRS D&A 0 (356,189) (610,432) (435,952) (311,323) (222,587) (222,338) (222,587) (111,169) 0 0
EBIT $0 ($322,803) ($576,109) ($450,517) ($324,898) ($235,145) ($233,851) ($233,027) ($120,506) ($8,204) ($7,041)
Less: Interest Expense 0 (39,881) (37,128) (34,155) (30,944) (27,476) (23,731) (19,686) (15,317) (10,599) (5,503)
Less: Cash Taxes 0 0 0 0 0 0 0 0 0 0 0
Tax Net Income $0 ($362,684) ($613,237) ($484,672) ($355,842) ($262,621) ($257,582) ($252,713) ($135,823) ($18,803) ($12,544)
MACRS D&A 0 356,189 610,432 435,952 311,323 222,587 222,338 222,587 111,169 0 0
Construction Capex (1,994,063) 0 0 0 0 0 0 0 0 0 0
Principal 0 (34,412) (37,165) (40,138) (43,350) (46,818) (50,563) (54,608) (58,977) (63,695) (68,790)
After Tax Levered Cash Flow ($1,994,063) ($40,907) ($39,970) ($88,858) ($87,868) ($86,852) ($85,807) ($84,734) ($83,631) ($82,498) ($81,334)
Levered Project IRR N/A
I V I L L U S T R A T I V E E N E R G Y S T O R A G E V A L U E S N A P S H O T SL A Z A R D L C O S V 2 . 0
Illustrative Value Snapshot—ERCOT
Model Assumptions:
Size (MW) 1.0 Extended Warranty (%) 2% Regional Power Equipment Cost Scalar 1.00
Capacity (MWh) 4.0 EPC Cost (%) 12% Regional BOS Cost Scalar 0.95
Cycles Per Year 99 O&M Cost (%) 1.6% Regional EPC Cost Scalar 0.82
Depth of Discharge (%) 100% Useful Life (years) 10
Efficiency (%) 93%
27
4
(e)
(f)
(b)(g)
(i)
(h)
(a)
(b)
(c)
(d)
(j)
(j)
(j)
Source: DOE, Lazard and Enovation Partners estimates.
(a) Assumes 2.5% revenue escalation.
(b) Represents extended warranty costs that provide coverage beyond the initial two-
year product warranty (included in equipment capital costs).
(c) Assumes 2.5% charging cost escalation.
(d) Assumes 7-year MACRS depreciation.
(e) Indicates “usable energy” capacity.
(f) Reflects full depth of discharge cycles per year.
(g) Sized as a percentage of total installed capex, annually, after expiration of initial two-
year product warranty.
(h) Assumes EPC costs as a percentage of AC and DC raw capital costs.
(i) Sized as a portion of total installed capital cost. Assumes O&M escalation of 2.25%.
(j) Scalars are adjustment factors for the national averages, determined by Bloomberg
estimates and Labor Departments statistics.

CA 2016 2017 2018 2019 2020 2021 2022 2023 2024 2025 2026
Total Revenue $1,218,697 $354,163 $363,017 $372,093 $381,395 $390,930 $400,703 $410,721 $420,989 $431,513 $442,301
Memo:
Demand Charge Savings $0 $108,205 $110,910 $113,683 $116,525 $119,438 $122,424 $125,485 $128,622 $131,837 $135,133
Demand Response 0 245,958 252,107 258,410 264,870 271,492 278,279 285,236 292,367 299,676 307,168
Frequency Regulation 0 0 0 0 0 0 0 0 0 0 0
Incentive Payments 1,218,697 0 0 0 0 0 0 0 0 0 0
Total Operating Costs $0 ($46,591) ($47,657) ($97,496) ($98,612) ($99,753) ($100,920) ($102,114) ($103,336) ($104,585) ($105,864)
Memo:
O&M $0 ($38,793) ($39,666) ($40,558) ($41,471) ($42,404) ($43,358) ($44,333) ($45,331) ($46,351) ($47,394)
Warranty 0 0 0 (48,748) (48,748) (48,748) (48,748) (48,748) (48,748) (48,748) (48,748)
Charging 0 (7,798) (7,992) (8,190) (8,393) (8,601) (8,814) (9,033) (9,257) (9,487) (9,722)
EBITDA $1,218,697 $307,572 $315,360 $274,597 $282,783 $291,177 $299,783 $308,606 $317,653 $326,928 $336,437
Less: MACRS D&A 0 (348,304) (596,918) (426,300) (304,431) (217,659) (217,416) (217,659) (108,708) 0 0
EBIT $1,218,697 ($40,732) ($281,558) ($151,704) ($21,647) $73,518 $82,367 $90,947 $208,945 $326,928 $336,437
Less: Interest Expense 0 (38,998) (36,306) (33,399) (30,259) (26,868) (23,205) (19,250) (14,978) (10,364) (5,381)
Less: Cash Taxes (475,292) 0 0 0 0 0 0 0 0 (20,840) (129,112)
Tax Net Income $743,405 ($79,730) ($317,864) ($185,103) ($51,906) $46,650 $59,162 $71,697 $193,967 $295,724 $201,944
MACRS D&A 0 348,304 596,918 426,300 304,431 217,659 217,416 217,659 108,708 0 0
Construction Capex (1,949,915) 0 0 0 0 0 0 0 0 0 0
Principal 0 (33,650) (36,342) (39,250) (42,390) (45,781) (49,443) (53,399) (57,671) (62,285) (67,267)
After Tax Levered Cash Flow ($1,206,510) $234,923 $242,711 $201,948 $210,134 $218,528 $227,134 $235,957 $245,004 $233,439 $134,677
Levered Project IRR 14.8%
I V I L L U S T R A T I V E E N E R G Y S T O R A G E V A L U E S N A P S H O T SL A Z A R D L C O S V 2 . 0
Illustrative Value Snapshot—NYISO
Model Assumptions:
Size (MW) 1.0 Extended Warranty (%) 2% Regional Power Equipment Cost Scalar 1.00
Capacity (MWh) 4.0 EPC Cost (%) 19% Regional BOS Cost Scalar 0.95
Cycles Per Year 74 O&M Cost (%) 1.6% Regional EPC Cost Scalar 1.16
Depth of Discharge (%) 100% Useful Life (years) 10
Efficiency (%) 92%
28
5
Source: DOE, Lazard and Enovation Partners estimates.
(a) Assumes 2.5% revenue escalation.
(b) Includes PLC benefits.
(c) Assumes the 50% Demand Management Program (“DMP”) incentive, with 100% of
the incentives paid out in construction year. Assumes incentive payment is taxable
(based on discussions with developers and accountants) and assumes incentive is
paid subsequent to construction spend and is thus not a source of construction
finance (i.e., capital structure is incentive agnostic).
(d) Represents extended warranty costs that provide coverage beyond the initial two-
year product warranty (included in equipment capital costs).
(e) Assumes 2.5% charging cost escalation.
(f) Assumes 7-year MACRS depreciation.
(g) Indicates “usable energy” capacity.
(h) Reflects full depth of discharge cycles per year.
(i) Sized as a percentage of total installed capex, annually, after expiration of initial two-
year product warranty.
(j) Assumes EPC costs as a percentage of AC and DC raw capital costs.
(k) Sized as a portion of total installed capital cost. Assumes O&M escalation of 2.25%.
(l) Scalars are adjustment factors for the national averages, determined by Bloomberg
estimates and Labor Departments statistics.
(a)
(d)
(e)
(f)
(g)
(h)
(d)(i)
(k)
(j)
(l)
(l)
(l)
(c)
(b)

I V I L L U S T R A T I V E E N E R G Y S T O R A G E V A L U E S N A P S H O T SL A Z A R D L C O S V 2 . 0
DEMAND RESPONSE
FREQUENCY
REGULATION BUILDING TYPE COST ASSUMPTIONS
PJM
Observed payments based on PLC
Modeled payment: $63k/MW-year
(Capacity/PLC)
Regulation payment:
$40.00/MWh(a)
(Reg-D)
NREL Climate Zone: 5A
Function: Medium-sized
commercial building
DC system: $520/kWh
AC system: $410/kWh
EPC: 13%
Efficiency: 89%
Charging costs: $48/MWh
ISO-NE
Observed payments based on ICAP tag
Modeled payment: $115k/MW-year (PLC)
Regulation payment:
$25.83/MWh
NREL Climate Zone: 5A
Function: Medium-sized
commercial building
DC system: $527/kWh
AC system: $102/kWh
EPC: 18%
Efficiency: 92%
Charging costs: $106/MWh
CAISO
Observed payments for program
participation includes Capacity Bidding
Program (“CBP”)—$81/MW-year and Base
Interruptible Program (“BIP”)—$139/MW-
year
Modeled payment: $220k/MW-year (CBP
& BIP)
Reg-Up characteristics:
$5.66/MWh (75% split)
Reg-Down
characteristics:
$3.13/MWh (25% split)
NREL Climate Zone:
3B:CA
Function: Medium-sized
commercial building
DC system: $462/kWh (net of SGIP)
AC system: $102/kWh (net of SGIP)
EPC: 16%
Efficiency: 92%
Charging costs: $61/MWh
ERCOT
Observed payments based on Responsive
Reserve Service (“RRS”)
Modeled payment: $98k/MW-year (RRS)
Reg-Up characteristics:
$10.25/MWh (75% split)
Reg-Down
characteristics:
$5.35/MWh (25% split)
NREL Climate Zone: 2A
Function: Medium-sized
commercial building
DC system: $504/kWh
AC system: $51/kWh
EPC: 12%
Efficiency: 93%
Charging costs: $14/MWh
NYISO
Observed payments based on Distribution
Load Relief Program (“DLRP”)—
$90/MW-year; Commercial System Relief
Program (“CSRP”)—$90/MW-year; Special
Case Resource (“SCR”)—$120/MW-year
Modeled payment: $300k/MW-year
(DLRP+CSRP+SCR)
Regulation payment:
$8.79/MWh
NREL Climate Zone: 4A
Function: Large-sized
commercial building
DC system: $462/kWh (net of DMP)
AC system: $51/kWh (net of DMP)
EPC: 19%
Efficiency: 92%
Charging costs: $24/MWh
Illustrative Value Snapshots—Assumptions
Source: DOE, Lazard and Enovation Partners estimates.
(a) Recent research estimates payments for participation of storage in the PJM Reg-D program are in the range of $19/MWh and $52/MWh (A Comparison of Policies on the
Participation of Storage in U.S. Frequency Regulation Markets; IEEE February 2016).
29
1
2
3
4
5
Confidential
Appendix
L A Z A R D L C O S V 2 . 0

A P P E N D I XL A Z A R D L C O S V 2 . 0
Charging Cost and Escalation Assumptions
30Source: EIA and Lazard estimates.
CHARGING COST($/MWh) CHARGING COST SOURCE
CHARGING COST ESCALATION (%)
CHARGING COSTESCALATION SOURCE
TRANSMISSION $34.69EIA 2015 Wholesale Price
$/MWh—Weighted Average (Low)2.5%
EIA Electricity Monthly Update—12 Markets
Averaged and Annualized
PEAKER
REPLACEMENT$34.69
EIA 2015 Wholesale Price
$/MWh—Weighted Average (Low)2.5%
EIA Electricity Monthly Update—12 Markets
Averaged and Annualized
FREQUENCY
REGULATION$46.92
EIA 2015 PJM-Wholesale Real
Time—Weighted Average2.5%
EIA Electricity Monthly Update—PJM
Market Annualized
DISTRIBUTION
SUBSTATION$36.14
EIA 2015 Wholesale Price
$/MWh—Weighted Average2.5%
EIA Electricity Monthly Update—12 Markets
Averaged and Annualized
DISTRIBUTION
FEEDER$36.14
EIA 2015 Wholesale Price
$/MWh—Weighted Average2.5%
EIA Electricity Monthly Update—12 Markets
Averaged and Annualized
MICROGRID $104.55EIA Average Commercial Retail
Price 2015 2.3%
AEO 2015 Reference Case—Electric Power
Projections: Commercial
ISLAND
GRID$281.29 Lazard LCOE v10.0 Diesel (High) 2.3% Lazard Analysis
COMMERCIAL &
INDUSTRIAL$69.18
EIA Average Industrial Retail Price
2015 2.5%
AEO 2015 Reference Case—Electric Power
Projections: Industrial
COMMERCIAL
APPLIANCE$104.55
EIA Average Commercial Retail
Price 2015 2.3%
AEO 2015 Reference Case—Electric Power
Projections: Commercial
RESIDENTIAL $123.92EIA Average Residential Retail Price
20152.5%
AEO 2015 Reference Case—Electric Power
Projections: Residential
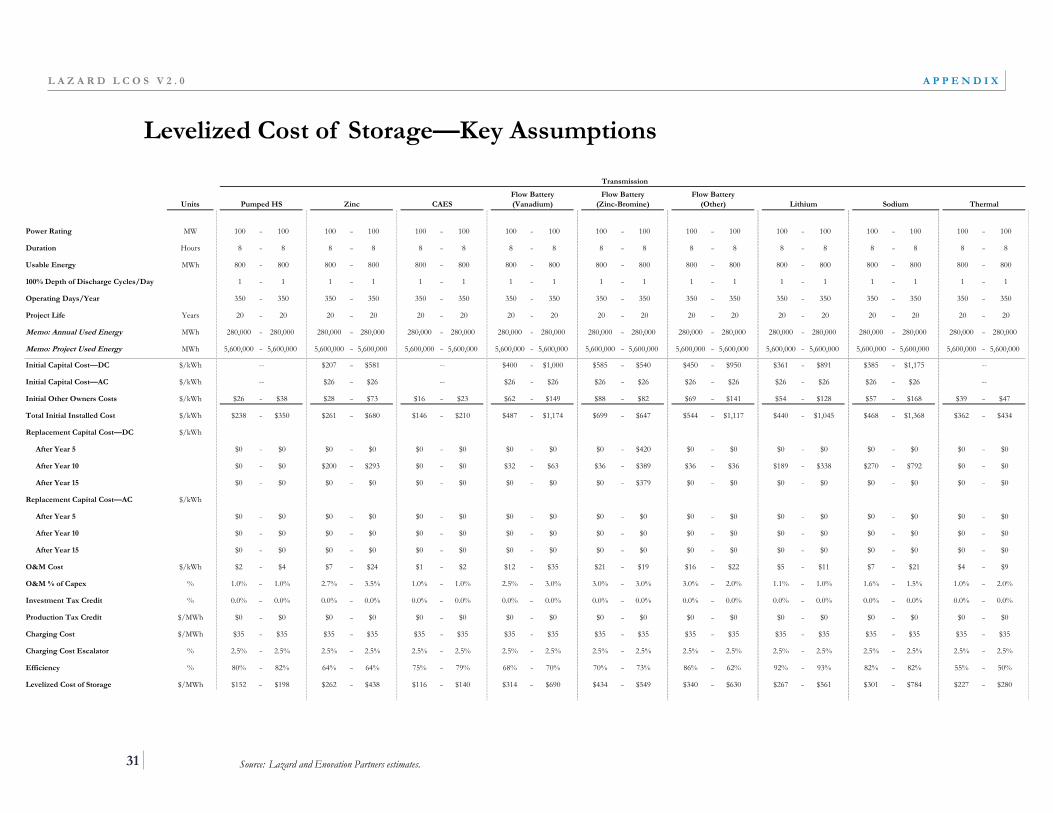
Transmission Peaker Replacement
Units Pumped HS Zinc CAES
Flow Battery
(Vanadium)
Flow Battery
(Zinc-Bromine)
Flow Battery
(Other) Lithium Sodium Thermal
Power Rating MW 100 – 100 100 – 100 100 – 100 100 – 100 100 – 100 100 – 100 100 – 100 100 – 100 100 – 100
Duration Hours 8 – 8 8 – 8 8 – 8 8 – 8 8 – 8 8 – 8 8 – 8 8 – 8 8 – 8
Usable Energy MWh 800 – 800 800 – 800 800 – 800 800 – 800 800 – 800 800 – 800 800 – 800 800 – 800 800 – 800
100% Depth of Discharge Cycles/Day 1 – 1 1 – 1 1 – 1 1 – 1 1 – 1 1 – 1 1 – 1 1 – 1 1 – 1
Operating Days/Year 350 – 350 350 – 350 350 – 350 350 – 350 350 – 350 350 – 350 350 – 350 350 – 350 350 – 350
Project Life Years 20 – 20 20 – 20 20 – 20 20 – 20 20 – 20 20 – 20 20 – 20 20 – 20 20 – 20
Memo: Annual Used Energy MWh 280,000 – 280,000 280,000 – 280,000 280,000 – 280,000 280,000 – 280,000 280,000 – 280,000 280,000 – 280,000 280,000 – 280,000 280,000 – 280,000 280,000 – 280,000
Memo: Project Used Energy MWh 5,600,000 – 5,600,000 5,600,000 – 5,600,000 5,600,000 – 5,600,000 5,600,000 – 5,600,000 5,600,000 – 5,600,000 5,600,000 – 5,600,000 5,600,000 – 5,600,000 5,600,000 – 5,600,000 5,600,000 – 5,600,000
Initial Capital Cost—DC $/kWh -- $207 – $581 -- $400 – $1,000 $585 – $540 $450 – $950 $361 – $891 $385 – $1,175 --
Initial Capital Cost—AC $/kWh -- $26 – $26 -- $26 – $26 $26 – $26 $26 – $26 $26 – $26 $26 – $26 --
Initial Other Owners Costs $/kWh $26 – $38 $28 – $73 $16 – $23 $62 – $149 $88 – $82 $69 – $141 $54 – $128 $57 – $168 $39 – $47
Total Initial Installed Cost $/kWh $238 – $350 $261 – $680 $146 – $210 $487 – $1,174 $699 – $647 $544 – $1,117 $440 – $1,045 $468 – $1,368 $362 – $434
Replacement Capital Cost—DC $/kWh
After Year 5 $0 – $0 $0 – $0 $0 – $0 $0 – $0 $0 – $420 $0 – $0 $0 – $0 $0 – $0 $0 – $0
After Year 10 $0 – $0 $200 – $293 $0 – $0 $32 – $63 $36 – $389 $36 – $36 $189 – $338 $270 – $792 $0 – $0
After Year 15 $0 – $0 $0 – $0 $0 – $0 $0 – $0 $0 – $379 $0 – $0 $0 – $0 $0 – $0 $0 – $0
Replacement Capital Cost—AC $/kWh
After Year 5 $0 – $0 $0 – $0 $0 – $0 $0 – $0 $0 – $0 $0 – $0 $0 – $0 $0 – $0 $0 – $0
After Year 10 $0 – $0 $0 – $0 $0 – $0 $0 – $0 $0 – $0 $0 – $0 $0 – $0 $0 – $0 $0 – $0
After Year 15 $0 – $0 $0 – $0 $0 – $0 $0 – $0 $0 – $0 $0 – $0 $0 – $0 $0 – $0 $0 – $0
O&M Cost $/kWh $2 – $4 $7 – $24 $1 – $2 $12 – $35 $21 – $19 $16 – $22 $5 – $11 $7 – $21 $4 – $9
O&M % of Capex % 1.0% – 1.0% 2.7% – 3.5% 1.0% – 1.0% 2.5% – 3.0% 3.0% – 3.0% 3.0% – 2.0% 1.1% – 1.0% 1.6% – 1.5% 1.0% – 2.0%
Investment Tax Credit % 0.0% – 0.0% 0.0% – 0.0% 0.0% – 0.0% 0.0% – 0.0% 0.0% – 0.0% 0.0% – 0.0% 0.0% – 0.0% 0.0% – 0.0% 0.0% – 0.0%
Production Tax Credit $/MWh $0 – $0 $0 – $0 $0 – $0 $0 – $0 $0 – $0 $0 – $0 $0 – $0 $0 – $0 $0 – $0
Charging Cost $/MWh $35 – $35 $35 – $35 $35 – $35 $35 – $35 $35 – $35 $35 – $35 $35 – $35 $35 – $35 $35 – $35
Charging Cost Escalator % 2.5% – 2.5% 2.5% – 2.5% 2.5% – 2.5% 2.5% – 2.5% 2.5% – 2.5% 2.5% – 2.5% 2.5% – 2.5% 2.5% – 2.5% 2.5% – 2.5%
Efficiency % 80% – 82% 64% – 64% 75% – 79% 68% – 70% 70% – 73% 86% – 62% 92% – 93% 82% – 82% 55% – 50%
Levelized Cost of Storage $/MWh $152 – $198 $262 – $438 $116 – $140 $314 – $690 $434 – $549 $340 – $630 $267 – $561 $301 – $784 $227 – $280
A P P E N D I XL A Z A R D L C O S V 2 . 0
Levelized Cost of Storage—Key Assumptions
Source: Lazard and Enovation Partners estimates.31

Peaker Replacement Frequency Regulation
Units Zinc Lithium
Flow Battery
(Vanadium)
Flow Battery
(Zinc-Bromine)
Flow Battery
(Other) Sodium Flywheel Thermal
Power Rating MW 100 – 100 100 – 100 100 – 100 100 – 100 100 – 100 100 – 100 100 – 100 100 – 100
Duration Hours 4 – 4 4 – 4 4 – 4 4 – 4 4 – 4 4 – 4 4 – 4 4 – 4
Usable Energy MWh 400 – 400 400 – 400 400 – 400 400 – 400 400 – 400 400 – 400 400 – 400 400 – 400
100% Depth of Discharge Cycles/Day 1 – 1 1 – 1 1 – 1 1 – 1 1 – 1 1 – 1 1 – 1 1 – 1
Operating Days/Year 350 – 350 350 – 350 350 – 350 350 – 350 350 – 350 350 – 350 350 – 350 350 – 350
Project Life Years 20 – 20 20 – 20 20 – 20 20 – 20 20 – 20 20 – 20 20 – 20 20 – 20
Memo: Annual Used Energy MWh 140,000 – 140,000 140,000 – 140,000 140,000 – 140,000 140,000 – 140,000 140,000 – 140,000 140,000 – 140,000 140,000 – 140,000 140,000 – 140,000
Memo: Project Used Energy MWh 2,800,000 – 2,800,000 2,800,000 – 2,800,000 2,800,000 – 2,800,000 2,800,000 – 2,800,000 2,800,000 – 2,800,000 2,800,000 – 2,800,000 2,800,000 – 2,800,000 2,800,000 – 2,800,000
Initial Capital Cost—DC $/kWh $207 – $587 $366 – $898 $580 – $950 $585 – $540 $600 – $1,000 $392 – $1,182 $500 – $898 --
Initial Capital Cost—AC $/kWh $51 – $51 $51 – $51 $51 – $51 $51 – $51 $51 – $51 $51 – $51 $51 – $51 --
Initial Other Owners Costs $/kWh $32 – $78 $58 – $133 $91 – $145 $92 – $85 $94 – $152 $62 – $173 $75 – $128 $56 – $67
Total Initial Installed Cost $/kWh $290 – $715 $475 – $1,082 $722 – $1,146 $728 – $677 $745 – $1,203 $505 – $1,405 $626 – $1,077 $489 – $543
Replacement Capital Cost—DC $/kWh
After Year 5 $0 – $0 $0 – $0 $0 – $0 $0 – $420 $0 – $0 $0 – $0 $0 – $0 $0 – $0
After Year 10 $200 – $293 $189 – $338 $45 – $53 $36 – $389 $42 – $52 $270 – $792 $24 – $40 $0 – $0
After Year 15 $0 – $0 $0 – $0 $0 – $0 $0 – $379 $0 – $0 $0 – $0 $0 – $0 $0 – $0
Replacement Capital Cost—AC $/kWh
After Year 5 $0 – $0 $0 – $0 $0 – $0 $0 – $0 $0 – $0 $0 – $0 $0 – $0 $0 – $0
After Year 10 $0 – $0 $0 – $0 $0 – $0 $0 – $0 $0 – $0 $0 – $0 $0 – $0 $0 – $0
After Year 15 $0 – $0 $0 – $0 $0 – $0 $0 – $0 $0 – $0 $0 – $0 $0 – $0 $0 – $0
O&M Cost $/kWh $8 – $24 $6 – $12 $21 – $29 $22 – $20 $22 – $36 $8 – $22 $10 – $17 $5 – $11
O&M % of Capex % 2.7% – 3.4% 1.2% – 1.1% 3.0% – 2.5% 3.0% – 3.0% 3.0% – 3.0% 1.6% – 1.5% 1.6% – 1.6% 1.0% – 2.0%
Investment Tax Credit % 0.0% – 0.0% 0.0% – 0.0% 0.0% – 0.0% 0.0% – 0.0% 0.0% – 0.0% 0.0% – 0.0% 0.0% – 0.0% 0.0% – 0.0%
Production Tax Credit $/MWh $0 – $0 $0 – $0 $0 – $0 $0 – $0 $0 – $0 $0 – $0 $0 – $0 $0 – $0
Charging Cost $/MWh $35 – $35 $35 – $35 $35 – $35 $35 – $35 $35 – $35 $35 – $35 $35 – $35 $35 – $35
Charging Cost Escalator % 2.5% – 2.5% 2.5% – 2.5% 2.5% – 2.5% 2.5% – 2.5% 2.5% – 2.5% 2.5% – 2.5% 2.5% – 2.5% 2.5% – 2.5%
Efficiency % 64% – 64% 92% – 93% 77% – 70% 70% – 73% 86% – 70% 82% – 82% 91% – 91% 55% – 50%
Levelized Cost of Storage $/MWh $277 – $456 $285 – $581 $441 – $657 $448 – $563 $447 – $704 $320 – $803 $342 – $555 $290 – $348
A P P E N D I XL A Z A R D L C O S V 2 . 0
Source: Lazard and Enovation Partners estimates.32
Levelized Cost of Storage—Key Assumptions (cont’d)
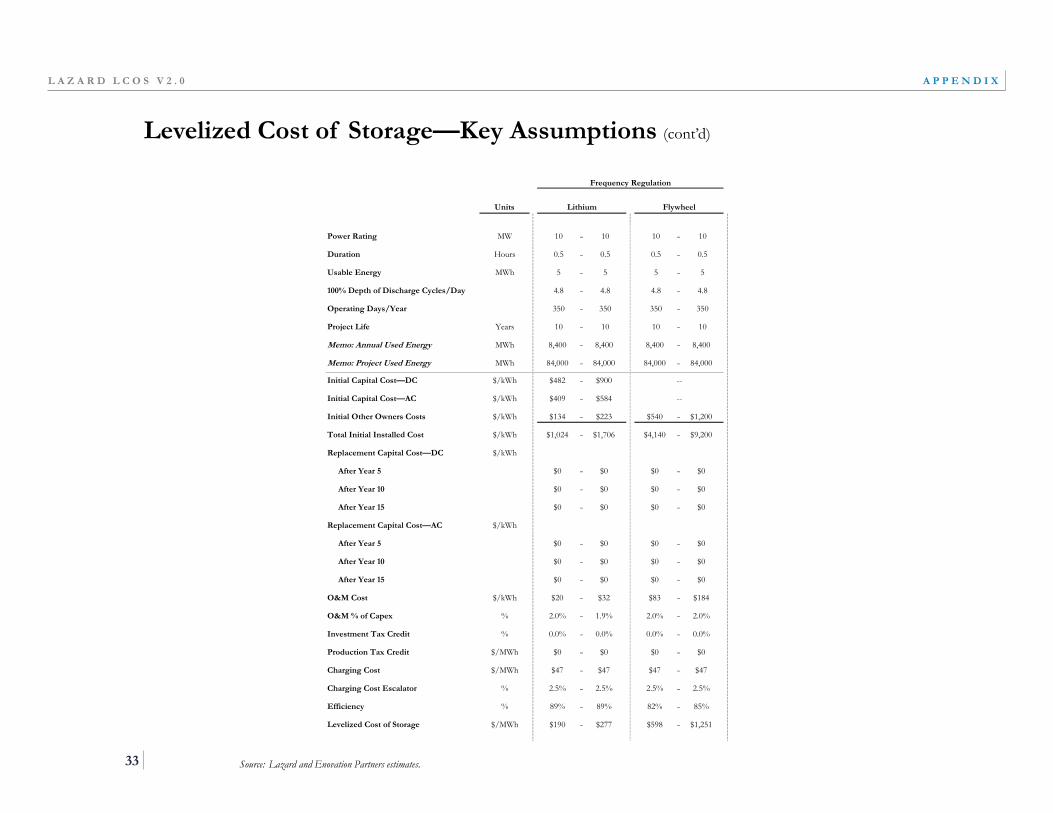
A P P E N D I XL A Z A R D L C O S V 2 . 0
Source: Lazard and Enovation Partners estimates.33
Levelized Cost of Storage—Key Assumptions (cont’d)
Frequency Regulation Distribution Substation
Units Lithium Flywheel
Power Rating MW 10 – 10 10 – 10
Duration Hours 0.5 – 0.5 0.5 – 0.5
Usable Energy MWh 5 – 5 5 – 5
100% Depth of Discharge Cycles/Day 4.8 – 4.8 4.8 – 4.8
Operating Days/Year 350 – 350 350 – 350
Project Life Years 10 – 10 10 – 10
Memo: Annual Used Energy MWh 8,400 – 8,400 8,400 – 8,400
Memo: Project Used Energy MWh 84,000 – 84,000 84,000 – 84,000
Initial Capital Cost—DC $/kWh $482 – $900 --
Initial Capital Cost—AC $/kWh $409 – $584 --
Initial Other Owners Costs $/kWh $134 – $223 $540 – $1,200
Total Initial Installed Cost $/kWh $1,024 – $1,706 $4,140 – $9,200
Replacement Capital Cost—DC $/kWh
After Year 5 $0 – $0 $0 – $0
After Year 10 $0 – $0 $0 – $0
After Year 15 $0 – $0 $0 – $0
Replacement Capital Cost—AC $/kWh
After Year 5 $0 – $0 $0 – $0
After Year 10 $0 – $0 $0 – $0
After Year 15 $0 – $0 $0 – $0
O&M Cost $/kWh $20 – $32 $83 – $184
O&M % of Capex % 2.0% – 1.9% 2.0% – 2.0%
Investment Tax Credit % 0.0% – 0.0% 0.0% – 0.0%
Production Tax Credit $/MWh $0 – $0 $0 – $0
Charging Cost $/MWh $47 – $47 $47 – $47
Charging Cost Escalator % 2.5% – 2.5% 2.5% – 2.5%
Efficiency % 89% – 89% 82% – 85%
Levelized Cost of Storage $/MWh $190 – $277 $598 – $1,251

Distribution Substation Distribution Feeder
Units Zinc
Flow Battery
(Vanadium)
Flow Battery
(Zinc-Bromine)
Flow Battery
(Other) Lithium Lead Sodium Flywheel Thermal
Power Rating MW 4 – 4 4 – 4 4 – 4 4 – 4 4 – 4 4 – 4 4 – 4 4 – 4 4 – 4
Duration Hours 4 – 4 4 – 4 4 – 4 4 – 4 4 – 4 4 – 4 4 – 4 4 – 4 4 – 4
Usable Energy MWh 16 – 16 16 – 16 16 – 16 16 – 16 16 – 16 16 – 16 16 – 16 16 – 16 16 – 16
100% Depth of Discharge Cycles/Day 1 – 1 1 – 1 1 – 1 1 – 1 1 – 1 1 – 1 1 – 1 1 – 1 1 – 1
Operating Days/Year 300 – 300 300 – 300 300 – 300 300 – 300 300 – 300 300 – 300 300 – 300 300 – 300 300 – 300
Project Life Years 20 – 20 20 – 20 20 – 20 20 – 20 20 – 20 20 – 20 20 – 20 20 – 20 20 – 20
Memo: Annual Used Energy MWh 4,800 – 4,800 4,800 – 4,800 4,800 – 4,800 4,800 – 4,800 4,800 – 4,800 4,800 – 4,800 4,800 – 4,800 4,800 – 4,800 4,800 – 4,800
Memo: Project Used Energy MWh 96,000 – 96,000 96,000 – 96,000 96,000 – 96,000 96,000 – 96,000 96,000 – 96,000 96,000 – 96,000 96,000 – 96,000 96,000 – 96,000 96,000 – 96,000
Initial Capital Cost—DC $/kWh $232 – $603 $580 – $950 $585 – $450 $600 – $1,000 $381 – $850 $460 – $1,160 $412 – $1,204 $500 – $898 --
Initial Capital Cost—AC $/kWh $51 – $51 $51 – $51 $51 – $51 $51 – $51 $51 – $51 $51 – $51 $51 – $51 $51 – $51 --
Initial Other Owners Costs $/kWh $40 – $93 $104 – $165 $105 – $82 $107 – $173 $69 – $144 $82 – $194 $74 – $201 $86 – $147 $159 – $187
Total Initial Installed Cost $/kWh $323 – $746 $735 – $1,166 $741 – $584 $758 – $1,224 $501 – $1,045 $593 – $1,405 $537 – $1,455 $637 – $1,096 $1,219 – $1,353
Replacement Capital Cost—DC $/kWh
After Year 5 $0 – $0 $0 – $0 $0 – $350 $0 – $0 $0 – $0 $0 – $0 $0 – $0 $0 – $0 $0 – $0
After Year 10 $228 – $293 $45 – $53 $36 – $324 $42 – $52 $189 – $313 $280 – $630 $270 – $792 $24 – $40 $0 – $0
After Year 15 $0 – $0 $0 – $0 $0 – $316 $0 – $0 $0 – $0 $0 – $0 $0 – $0 $0 – $0 $0 – $0
Replacement Capital Cost—AC $/kWh
After Year 5 $0 – $0 $0 – $0 $0 – $0 $0 – $0 $0 – $0 $0 – $0 $0 – $0 $0 – $0 $0 – $0
After Year 10 $0 – $0 $0 – $0 $0 – $0 $0 – $0 $0 – $0 $0 – $0 $0 – $0 $0 – $0 $0 – $0
After Year 15 $0 – $0 $0 – $0 $0 – $0 $0 – $0 $0 – $0 $0 – $0 $0 – $0 $0 – $0 $0 – $0
O&M Cost $/kWh $11 – $26 $22 – $29 $22 – $17 $22 – $36 $7 – $14 $12 – $28 $9 – $22 $10 – $17 $12 – $27
O&M % of Capex % 3.4% – 3.4% 3.0% – 2.5% 3.0% – 2.9% 3.0% – 3.0% 1.4% – 1.3% 2.0% – 2.0% 1.6% – 1.5% 1.6% – 1.6% 1.0% – 2.0%
Investment Tax Credit % 0.0% – 0.0% 0.0% – 0.0% 0.0% – 0.0% 0.0% – 0.0% 0.0% – 0.0% 0.0% – 0.0% 0.0% – 0.0% 0.0% – 0.0% 0.0% – 0.0%
Production Tax Credit $/MWh $0 – $0 $0 – $0 $0 – $0 $0 – $0 $0 – $0 $0 – $0 $0 – $0 $0 – $0 $0 – $0
Charging Cost $/MWh $36 – $36 $36 – $36 $36 – $36 $36 – $36 $36 – $36 $36 – $36 $36 – $36 $36 – $36 $36 – $36
Charging Cost Escalator % 2.5% – 2.5% 2.5% – 2.5% 2.5% – 2.5% 2.5% – 2.5% 2.5% – 2.5% 2.5% – 2.5% 2.5% – 2.5% 2.5% – 2.5% 2.5% – 2.5%
Efficiency % 64% – 64% 77% – 70% 70% – 73% 86% – 70% 92% – 93% 86% – 86% 82% – 82% 91% – 91% 55% – 50%
Levelized Cost of Storage $/MWh $404 – $542 $516 – $770 $524 – $564 $524 – $828 $345 – $657 $425 – $933 $385 – $959 $400 – $654 $707 – $862
A P P E N D I XL A Z A R D L C O S V 2 . 0
Source: Lazard and Enovation Partners estimates.34
Levelized Cost of Storage—Key Assumptions (cont’d)
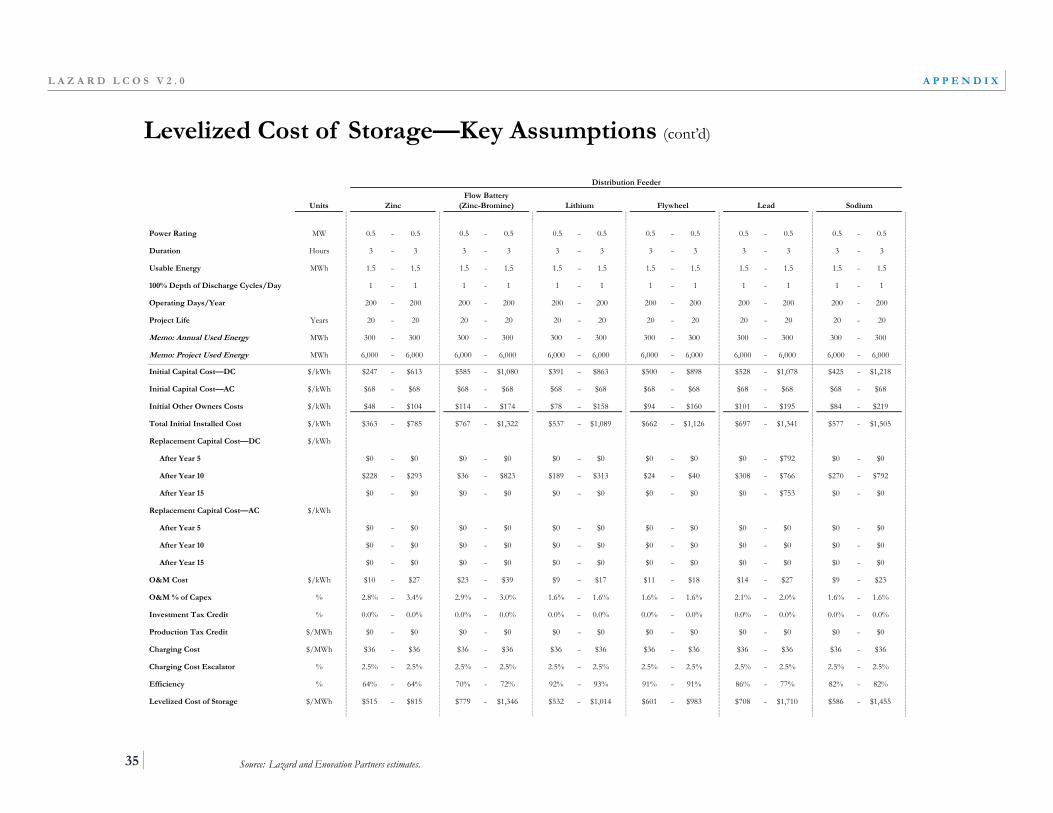
Distribution Feeder Microgrid
Units Zinc
Flow Battery
(Zinc-Bromine) Lithium Flywheel Lead Sodium
Power Rating MW 0.5 – 0.5 0.5 – 0.5 0.5 – 0.5 0.5 – 0.5 0.5 – 0.5 0.5 – 0.5
Duration Hours 3 – 3 3 – 3 3 – 3 3 – 3 3 – 3 3 – 3
Usable Energy MWh 1.5 – 1.5 1.5 – 1.5 1.5 – 1.5 1.5 – 1.5 1.5 – 1.5 1.5 – 1.5
100% Depth of Discharge Cycles/Day 1 – 1 1 – 1 1 – 1 1 – 1 1 – 1 1 – 1
Operating Days/Year 200 – 200 200 – 200 200 – 200 200 – 200 200 – 200 200 – 200
Project Life Years 20 – 20 20 – 20 20 – 20 20 – 20 20 – 20 20 – 20
Memo: Annual Used Energy MWh 300 – 300 300 – 300 300 – 300 300 – 300 300 – 300 300 – 300
Memo: Project Used Energy MWh 6,000 – 6,000 6,000 – 6,000 6,000 – 6,000 6,000 – 6,000 6,000 – 6,000 6,000 – 6,000
Initial Capital Cost—DC $/kWh $247 – $613 $585 – $1,080 $391 – $863 $500 – $898 $528 – $1,078 $425 – $1,218
Initial Capital Cost—AC $/kWh $68 – $68 $68 – $68 $68 – $68 $68 – $68 $68 – $68 $68 – $68
Initial Other Owners Costs $/kWh $48 – $104 $114 – $174 $78 – $158 $94 – $160 $101 – $195 $84 – $219
Total Initial Installed Cost $/kWh $363 – $785 $767 – $1,322 $537 – $1,089 $662 – $1,126 $697 – $1,341 $577 – $1,505
Replacement Capital Cost—DC $/kWh
After Year 5 $0 – $0 $0 – $0 $0 – $0 $0 – $0 $0 – $792 $0 – $0
After Year 10 $228 – $293 $36 – $823 $189 – $313 $24 – $40 $308 – $766 $270 – $792
After Year 15 $0 – $0 $0 – $0 $0 – $0 $0 – $0 $0 – $753 $0 – $0
Replacement Capital Cost—AC $/kWh
After Year 5 $0 – $0 $0 – $0 $0 – $0 $0 – $0 $0 – $0 $0 – $0
After Year 10 $0 – $0 $0 – $0 $0 – $0 $0 – $0 $0 – $0 $0 – $0
After Year 15 $0 – $0 $0 – $0 $0 – $0 $0 – $0 $0 – $0 $0 – $0
O&M Cost $/kWh $10 – $27 $23 – $39 $9 – $17 $11 – $18 $14 – $27 $9 – $23
O&M % of Capex % 2.8% – 3.4% 2.9% – 3.0% 1.6% – 1.6% 1.6% – 1.6% 2.1% – 2.0% 1.6% – 1.6%
Investment Tax Credit % 0.0% – 0.0% 0.0% – 0.0% 0.0% – 0.0% 0.0% – 0.0% 0.0% – 0.0% 0.0% – 0.0%
Production Tax Credit $/MWh $0 – $0 $0 – $0 $0 – $0 $0 – $0 $0 – $0 $0 – $0
Charging Cost $/MWh $36 – $36 $36 – $36 $36 – $36 $36 – $36 $36 – $36 $36 – $36
Charging Cost Escalator % 2.5% – 2.5% 2.5% – 2.5% 2.5% – 2.5% 2.5% – 2.5% 2.5% – 2.5% 2.5% – 2.5%
Efficiency % 64% – 64% 70% – 72% 92% – 93% 91% – 91% 86% – 77% 82% – 82%
Levelized Cost of Storage $/MWh $515 – $815 $779 – $1,346 $532 – $1,014 $601 – $983 $708 – $1,710 $586 – $1,455
A P P E N D I XL A Z A R D L C O S V 2 . 0
Source: Lazard and Enovation Partners estimates.35
Levelized Cost of Storage—Key Assumptions (cont’d)

Microgrid Island
Units Flywheel Lithium
Power Rating MW 2 – 2 2 – 2
Duration Hours 1 – 1 1 – 1
Usable Energy MWh 2 – 2 2 – 2
100% Depth of Discharge Cycles/Day 2 – 2 2 – 2
Operating Days/Year 350 – 350 350 – 350
Project Life Years 20 – 20 20 – 20
Memo: Annual Used Energy MWh 1,400 – 1,400 1,400 – 1,400
Memo: Project Used Energy MWh 28,000 – 28,000 28,000 – 28,000
Initial Capital Cost—DC $/kWh $500 – $898 $550 – $801
Initial Capital Cost—AC $/kWh $204 – $204 $204 – $204
Initial Other Owners Costs $/kWh $117 – $183 $128 – $171
Total Initial Installed Cost $/kWh $822 – $1,285 $883 – $1,176
Replacement Capital Cost—DC $/kWh
After Year 5 $0 – $0 $0 – $453
After Year 10 $24 – $40 $275 – $415
After Year 15 $0 – $0 $0 – $404
Replacement Capital Cost—AC $/kWh
After Year 5 $0 – $0 $0 – $0
After Year 10 $0 – $0 $181 – $181
After Year 15 $0 – $0 $0 – $0
O&M Cost $/kWh $15 – $22 $16 – $20
O&M % of Capex % 1.8% – 1.7% 1.8% – 1.7%
Investment Tax Credit % 0.0% – 0.0% 0.0% – 0.0%
Production Tax Credit $/MWh $0 – $0 $0 – $0
Charging Cost $/MWh $105 – $105 $105 – $105
Charging Cost Escalator % 2.3% – 2.3% 2.3% – 2.3%
Efficiency % 91% – 91% 91% – 91%
Levelized Cost of Storage $/MWh $332 – $441 $372 – $507
A P P E N D I XL A Z A R D L C O S V 2 . 0
Source: Lazard and Enovation Partners estimates.36
Levelized Cost of Storage—Key Assumptions (cont’d)

A P P E N D I XL A Z A R D L C O S V 2 . 0
37
Levelized Cost of Storage—Key Assumptions (cont’d)
Source: Lazard and Enovation Partners estimates.
Island Commercial & Industrial
Units Zinc Lithium
Flow Battery
(Vanadium)
Flow Battery
(Zinc-Bromine)
Flow Battery
(Other) Sodium Lead Flywheel
Power Rating MW 1 – 1 1 – 1 1 – 1 1 – 1 1 – 1 1 – 1 1 – 1 1 – 1
Duration Hours 8 – 8 8 – 8 8 – 8 8 – 8 8 – 8 8 – 8 8 – 8 8 – 8
Usable Energy MWh 8 – 8 8 – 8 8 – 8 8 – 8 8 – 8 8 – 8 8 – 8 8 – 8
100% Depth of Discharge Cycles/Day 1 – 1 1 – 1 1 – 1 1 – 1 1 – 1 1 – 1 1 – 1 1 – 1
Operating Days/Year 350 – 350 350 – 350 350 – 350 350 – 350 350 – 350 350 – 350 350 – 350 350 – 350
Project Life Years 20 – 20 20 – 20 20 – 20 20 – 20 20 – 20 20 – 20 20 – 20 20 – 20
Memo: Annual Used Energy MWh 2,800 – 2,800 2,800 – 2,800 2,800 – 2,800 2,800 – 2,800 2,800 – 2,800 2,800 – 2,800 2,800 – 2,800 2,800 – 2,800
Memo: Project Used Energy MWh 56,000 – 56,000 56,000 – 56,000 56,000 – 56,000 56,000 – 56,000 56,000 – 56,000 56,000 – 56,000 56,000 – 56,000 56,000 – 56,000
Initial Capital Cost—DC $/kWh $247 – $840 $401 – $945 $400 – $1,000 $585 – $960 $450 – $950 $439 – $1,233 $500 – $1,200 $500 – $898
Initial Capital Cost—AC $/kWh $26 – $26 $26 – $26 $26 – $26 $26 – $26 $26 – $26 $26 – $26 $26 – $26 $26 – $26
Initial Other Owners Costs $/kWh $41 – $147 $72 – $165 $74 – $179 $107 – $148 $83 – $171 $79 – $214 $89 – $208 $87 – $152
Total Initial Installed Cost $/kWh $314 – $1,013 $499 – $1,136 $500 – $1,205 $717 – $1,134 $559 – $1,146 $543 – $1,472 $615 – $1,434 $612 – $1,076
Replacement Capital Cost—DC $/kWh
After Year 5 $0 – $0 $0 – $0 $0 – $0 $0 – $780 $0 – $0 $0 – $0 $0 – $0 $0 – $0
After Year 10 $228 – $300 $189 – $338 $30 – $63 $36 – $731 $36 – $36 $270 – $792 $280 – $630 $24 – $40
After Year 15 $0 – $0 $0 – $0 $0 – $0 $0 – $716 $0 – $0 $0 – $0 $0 – $0 $0 – $0
Replacement Capital Cost—AC $/kWh
After Year 5 $0 – $0 $0 – $0 $0 – $0 $0 – $0 $0 – $0 $0 – $0 $0 – $0 $0 – $0
After Year 10 $0 – $0 $0 – $0 $0 – $0 $0 – $0 $0 – $0 $0 – $0 $0 – $0 $0 – $0
After Year 15 $0 – $0 $0 – $0 $0 – $0 $0 – $0 $0 – $0 $0 – $0 $0 – $0 $0 – $0
O&M Cost $/kWh $9 – $15 $8 – $17 $15 – $36 $21 – $34 $17 – $23 $8 – $22 $12 – $29 $9 – $16
O&M % of Capex % 2.8% – 1.5% 1.6% – 1.5% 3.0% – 3.0% 3.0% – 3.0% 3.0% – 2.0% 1.6% – 1.5% 2.0% – 2.0% 1.5% – 1.5%
Investment Tax Credit % 0.0% – 0.0% 0.0% – 0.0% 0.0% – 0.0% 0.0% – 0.0% 0.0% – 0.0% 0.0% – 0.0% 0.0% – 0.0% 0.0% – 0.0%
Production Tax Credit $/MWh $0 – $0 $0 – $0 $0 – $0 $0 – $0 $0 – $0 $0 – $0 $0 – $0 $0 – $0
Charging Cost $/MWh $281 – $281 $281 – $281 $281 – $281 $281 – $281 $281 – $281 $281 – $281 $281 – $281 $281 – $281
Charging Cost Escalator % 2.3% – 2.3% 2.3% – 2.3% 2.3% – 2.3% 2.3% – 2.3% 2.3% – 2.3% 2.3% – 2.3% 2.3% – 2.3% 2.3% – 2.3%
Efficiency % 64% – 62% 92% – 93% 70% – 70% 70% – 72% 86% – 62% 82% – 82% 86% – 86% 91% – 91%
Levelized Cost of Storage $/MWh $735 – $1,030 $608 – $923 $728 – $1,107 $845 – $1,286 $673 – $1,094 $683 – $1,180 $705 – $1,145 $643 – $863
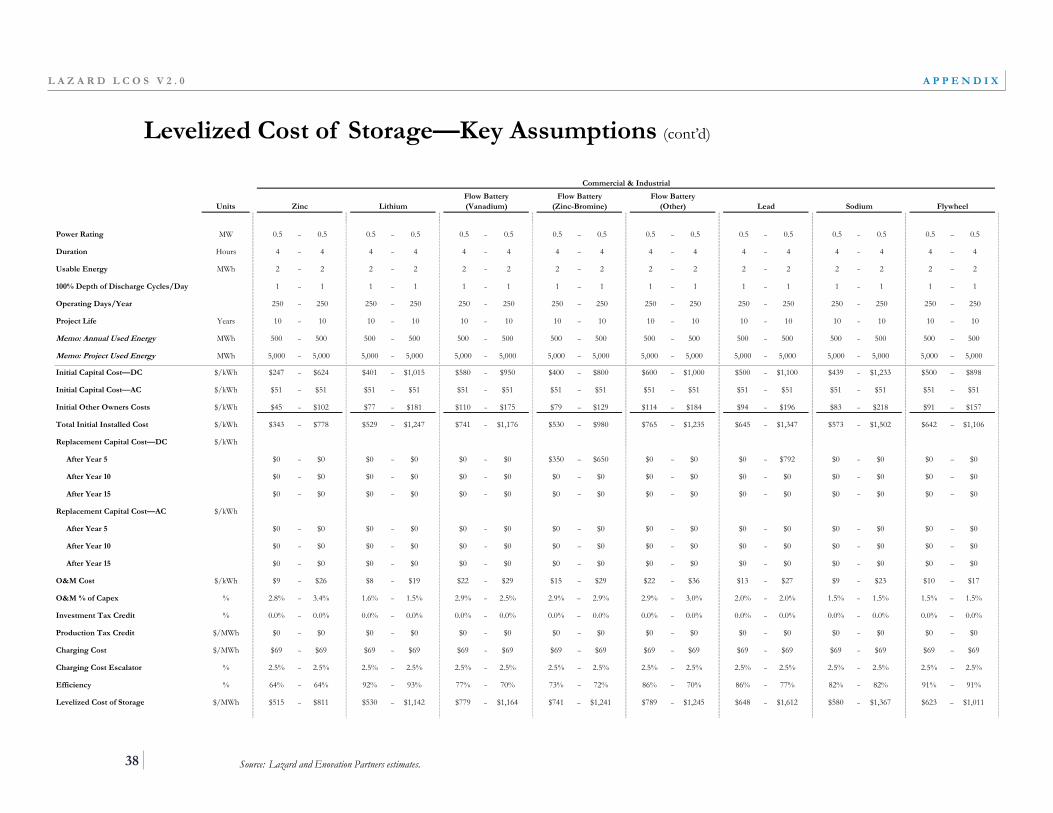
Commercial & Industrial Commercial Appliance
Units Zinc Lithium
Flow Battery
(Vanadium)
Flow Battery
(Zinc-Bromine)
Flow Battery
(Other) Lead Sodium Flywheel
Power Rating MW 0.5 – 0.5 0.5 – 0.5 0.5 – 0.5 0.5 – 0.5 0.5 – 0.5 0.5 – 0.5 0.5 – 0.5 0.5 – 0.5
Duration Hours 4 – 4 4 – 4 4 – 4 4 – 4 4 – 4 4 – 4 4 – 4 4 – 4
Usable Energy MWh 2 – 2 2 – 2 2 – 2 2 – 2 2 – 2 2 – 2 2 – 2 2 – 2
100% Depth of Discharge Cycles/Day 1 – 1 1 – 1 1 – 1 1 – 1 1 – 1 1 – 1 1 – 1 1 – 1
Operating Days/Year 250 – 250 250 – 250 250 – 250 250 – 250 250 – 250 250 – 250 250 – 250 250 – 250
Project Life Years 10 – 10 10 – 10 10 – 10 10 – 10 10 – 10 10 – 10 10 – 10 10 – 10
Memo: Annual Used Energy MWh 500 – 500 500 – 500 500 – 500 500 – 500 500 – 500 500 – 500 500 – 500 500 – 500
Memo: Project Used Energy MWh 5,000 – 5,000 5,000 – 5,000 5,000 – 5,000 5,000 – 5,000 5,000 – 5,000 5,000 – 5,000 5,000 – 5,000 5,000 – 5,000
Initial Capital Cost—DC $/kWh $247 – $624 $401 – $1,015 $580 – $950 $400 – $800 $600 – $1,000 $500 – $1,100 $439 – $1,233 $500 – $898
Initial Capital Cost—AC $/kWh $51 – $51 $51 – $51 $51 – $51 $51 – $51 $51 – $51 $51 – $51 $51 – $51 $51 – $51
Initial Other Owners Costs $/kWh $45 – $102 $77 – $181 $110 – $175 $79 – $129 $114 – $184 $94 – $196 $83 – $218 $91 – $157
Total Initial Installed Cost $/kWh $343 – $778 $529 – $1,247 $741 – $1,176 $530 – $980 $765 – $1,235 $645 – $1,347 $573 – $1,502 $642 – $1,106
Replacement Capital Cost—DC $/kWh
After Year 5 $0 – $0 $0 – $0 $0 – $0 $350 – $650 $0 – $0 $0 – $792 $0 – $0 $0 – $0
After Year 10 $0 – $0 $0 – $0 $0 – $0 $0 – $0 $0 – $0 $0 – $0 $0 – $0 $0 – $0
After Year 15 $0 – $0 $0 – $0 $0 – $0 $0 – $0 $0 – $0 $0 – $0 $0 – $0 $0 – $0
Replacement Capital Cost—AC $/kWh
After Year 5 $0 – $0 $0 – $0 $0 – $0 $0 – $0 $0 – $0 $0 – $0 $0 – $0 $0 – $0
After Year 10 $0 – $0 $0 – $0 $0 – $0 $0 – $0 $0 – $0 $0 – $0 $0 – $0 $0 – $0
After Year 15 $0 – $0 $0 – $0 $0 – $0 $0 – $0 $0 – $0 $0 – $0 $0 – $0 $0 – $0
O&M Cost $/kWh $9 – $26 $8 – $19 $22 – $29 $15 – $29 $22 – $36 $13 – $27 $9 – $23 $10 – $17
O&M % of Capex % 2.8% – 3.4% 1.6% – 1.5% 2.9% – 2.5% 2.9% – 2.9% 2.9% – 3.0% 2.0% – 2.0% 1.5% – 1.5% 1.5% – 1.5%
Investment Tax Credit % 0.0% – 0.0% 0.0% – 0.0% 0.0% – 0.0% 0.0% – 0.0% 0.0% – 0.0% 0.0% – 0.0% 0.0% – 0.0% 0.0% – 0.0%
Production Tax Credit $/MWh $0 – $0 $0 – $0 $0 – $0 $0 – $0 $0 – $0 $0 – $0 $0 – $0 $0 – $0
Charging Cost $/MWh $69 – $69 $69 – $69 $69 – $69 $69 – $69 $69 – $69 $69 – $69 $69 – $69 $69 – $69
Charging Cost Escalator % 2.5% – 2.5% 2.5% – 2.5% 2.5% – 2.5% 2.5% – 2.5% 2.5% – 2.5% 2.5% – 2.5% 2.5% – 2.5% 2.5% – 2.5%
Efficiency % 64% – 64% 92% – 93% 77% – 70% 73% – 72% 86% – 70% 86% – 77% 82% – 82% 91% – 91%
Levelized Cost of Storage $/MWh $515 – $811 $530 – $1,142 $779 – $1,164 $741 – $1,241 $789 – $1,245 $648 – $1,612 $580 – $1,367 $623 – $1,011
A P P E N D I XL A Z A R D L C O S V 2 . 0
Source: Lazard and Enovation Partners estimates.38
Levelized Cost of Storage—Key Assumptions (cont’d)

A P P E N D I XL A Z A R D L C O S V 2 . 0
Source: Lazard and Enovation Partners estimates.39
Levelized Cost of Storage—Key Assumptions (cont’d)
Commercial Appliance Residential
Units Lithium Lead
Flow Battery
(Zinc-Bromine) Sodium
L
i
t
Power Rating MW 0.1 – 0.1 0.1 – 0.1 0.1 – 0.1 0.1 – 0.1
Duration Hours 2 – 2 2 – 2 2 – 2 2 – 2
Usable Energy MWh 0.2 – 0.2 0.2 – 0.2 0.2 – 0.2 0.2 – 0.2
100% Depth of Discharge Cycles/Day 1 – 1 1 – 1 1 – 1 1 – 1
Operating Days/Year 250 – 250 250 – 250 250 – 250 250 – 250
Project Life Years 10 – 10 10 – 10 10 – 10 10 – 10
Memo: Annual Used Energy MWh 50 – 50 50 – 50 50 – 50 50 – 50
Memo: Project Used Energy MWh 500 – 500 500 – 500 500 – 500 500 – 500
Initial Capital Cost—DC $/kWh $401 – $1,015 $500 – $1,100 $800 – $1,000 $1,305 – $1,501
Initial Capital Cost—AC $/kWh $102 – $102 $102 – $102 $102 – $102 $102 – $102
Initial Other Owners Costs $/kWh $85 – $190 $102 – $204 $135 – $165 $226 – $273
Total Initial Installed Cost $/kWh $588 – $1,307 $705 – $1,407 $1,038 – $1,268 $1,633 – $1,876
Replacement Capital Cost—DC $/kWh
After Year 5 $0 – $0 $0 – $792 $650 – $813 $0 – $0
After Year 10 $0 – $0 $0 – $0 $0 – $0 $0 – $0
After Year 15 $0 – $0 $0 – $0 $0 – $0 $0 – $0
Replacement Capital Cost—AC $/kWh
After Year 5 $0 – $0 $0 – $0 $0 – $0 $0 – $0
After Year 10 $0 – $0 $0 – $0 $0 – $0 $0 – $0
After Year 15 $0 – $0 $0 – $0 $0 – $0 $0 – $0
O&M Cost $/kWh $9 – $20 $14 – $28 $0 – $0 $18 – $38
O&M % of Capex % 1.6% – 1.5% 2.0% – 2.0% 0.0% – 0.0% 1.1% – 2.0%
Investment Tax Credit % 0.0% – 0.0% 0.0% – 0.0% 0.0% – 0.0% 0.0% – 0.0%
Production Tax Credit $/MWh $0 – $0 $0 – $0 $0 – $0 $0 – $0
Charging Cost $/MWh $105 – $105 $105 – $105 $105 – $105 $105 – $105
Charging Cost Escalator % 2.3% – 2.3% 2.3% – 2.3% 2.3% – 2.3% 2.3% – 2.3%
Efficiency % 92% – 93% 86% – 77% 72% – 67% 62% – 55%
Levelized Cost of Storage $/MWh $624 – $1,234 $745 – $1,712 $1,208 – $1,462 $1,506 – $1,837

A P P E N D I XL A Z A R D L C O S V 2 . 0
Source: Lazard and Enovation Partners estimates.40
Levelized Cost of Storage—Key Assumptions (cont’d)
Residential
Units Lithium Lead
Flow Battery
(Zinc-Bromine) Sodium
Power Rating MW 0.005 – 0.005 0.005 – 0.005 0.005 – 0.005 0.005 – 0.005
Duration Hours 2 – 2 2 – 2 2 – 2 2 – 2
Usable Energy MWh 0.01 – 0.01 0.01 – 0.01 0.01 – 0.01 0.01 – 0.01
100% Depth of Discharge Cycles/Day 1 – 1 1 – 1 1 – 1 1 – 1
Operating Days/Year 250 – 250 250 – 250 250 – 250 250 – 250
Project Life Years 10 – 10 10 – 10 10 – 10 10 – 10
Memo: Annual Used Energy MWh 3 – 3 3 – 3 3 – 3 3 – 3
Memo: Project Used Energy MWh 25 – 25 25 – 25 25 – 25 25 – 25
Initial Capital Cost—DC $/kWh $769 – $1,455 $900 – $1,650 $800 – $1,000 $1,370 – $1,566
Initial Capital Cost—AC $/kWh $102 – $102 $102 – $102 $102 – $102 $102 – $102
Initial Other Owners Costs $/kWh $131 – $234 $150 – $263 $135 – $165 $221 – $250
Total Initial Installed Cost $/kWh $1,001 – $1,791 $1,153 – $2,015 $1,038 – $1,268 $1,693 – $1,918
Replacement Capital Cost—DC $/kWh
After Year 5 $0 – $0 $0 – $1,188 $650 – $810 $0 – $0
After Year 10 $0 – $0 $0 – $0 $0 – $0 $0 – $0
After Year 15 $0 – $0 $0 – $0 $0 – $0 $0 – $0
Replacement Capital Cost—AC $/kWh
After Year 5 $0 – $0 $0 – $0 $0 – $0 $0 – $0
After Year 10 $0 – $0 $0 – $0 $0 – $0 $0 – $0
After Year 15 $0 – $0 $0 – $0 $0 – $0 $0 – $0
O&M Cost $/kWh $0 – $0 $0 – $0 $0 – $0 $0 – $0
O&M % of Capex % 0.0% – 0.0% 0.0% – 0.0% 0.0% – 0.0% 0.0% – 0.0%
Investment Tax Credit % 0.0% – 0.0% 0.0% – 0.0% 0.0% – 0.0% 0.0% – 0.0%
Production Tax Credit $/MWh $0 – $0 $0 – $0 $0 – $0 $0 – $0
Charging Cost $/MWh $124 – $124 $124 – $124 $124 – $124 $124 – $124
Charging Cost Escalator % 2.5% – 2.5% 2.5% – 2.5% 2.5% – 2.5% 2.5% – 2.5%
Efficiency % 92% – 92% 80% – 76% 71% – 67% 62% – 55%
Levelized Cost of Storage $/MWh $890 – $1,476 $1,025 – $2,186 $1,241 – $1,496 $1,476 – $1,668