Embed Size (px)
Citation preview
International Journal of Engineering Business Management Special Issue on Innovations in Fashion Industry
Layout Design for a Low Capacity Manufacturing Line: A Case Study Regular Paper
Filippo De Carlo1,*, Maria Antonietta Arleo2, Orlando Borgia1 and Mario Tucci1 1 University of Florence - Department of Industrial Engineering 2 Politecnico di Milano - Department of Management, Economics and Industrial Engineering * Corresponding author E-mail: [email protected]
Received 1 June 2013; Accepted 15 July 2013 DOI: 10.5772/56883 © 2013 De Carlo et al.; licensee InTech. This is an open access article distributed under the terms of the Creative Commons Attribution License (http://creativecommons.org/licenses/by/3.0), which permits unrestricted use, distribution, and reproduction in any medium, provided the original work is properly cited.
Abstract The layout re‐arrangement of fashion production lines realizing many small batches is rarely deployed according to well‐known engineering procedures. In fact, it would often appear too complex to call a plant engineer for the proper layout design of such small production lines. Rather, it is preferred to apply empirical methodologies when considering, generally, factory know‐how, general business needs, safety requirements, and so on. In the present work, the results of a fashion manufacturing line re‐layout were compared by analysing the current situation with the solutions provided by a ʺhomemadeʺ company design, both through a systematic layout planning approach and a broader lean reengineering activity. In order to evaluate the effectiveness of each solution, the different alternatives were compared with the help of a discrete event simulator, analysing productivity, transportation times and costs. The result of the case study showed a slight advantage with the lean approach in considering such efficiency indicators. In addition, the lean production methods allowed the designers to identify some inefficiencies that other approaches could not see, since the latter did not focus on production in a holistic way.
Keywords Layout Design, Systematic Layout Planning, Lean Production
1. Introduction One of the main goals of a manufacturing system is the maximization of its productivity. This depends upon several factors, such as the kind and the complexity of the product made, the quality of the raw materials, the complexity of the manufacturing process and the arrangement of the workstations constituting the production process. Some of these parameters are determined by the product and, for this reason, are unchangeable; others, however, are variable and thus improvable. The challenge of determining the best arrangement of the workstations is one of the elements that has a great impact on system performance. It is known as the “facility layout problem”[1], namely the problem of the arrangement of everything that is required for the production process. A facility, in fact, is any element that simplifies an activity’s execution, such as a machine tool, a work centre, a division, a manufacturing unit, and so on [2]. The literature gives a
Filippo De Carlo, Maria Antonietta Arleo, Orlando Borgia and Mario Tucci: Layout Design for a Low Capacity Manufacturing Line: A Case Study
1www.intechopen.com
ARTICLE
www.intechopen.com Int. j. eng. bus. manag., 2013, Vol. 5, Special Issue Innovations in Fashion Industry, 35:2013
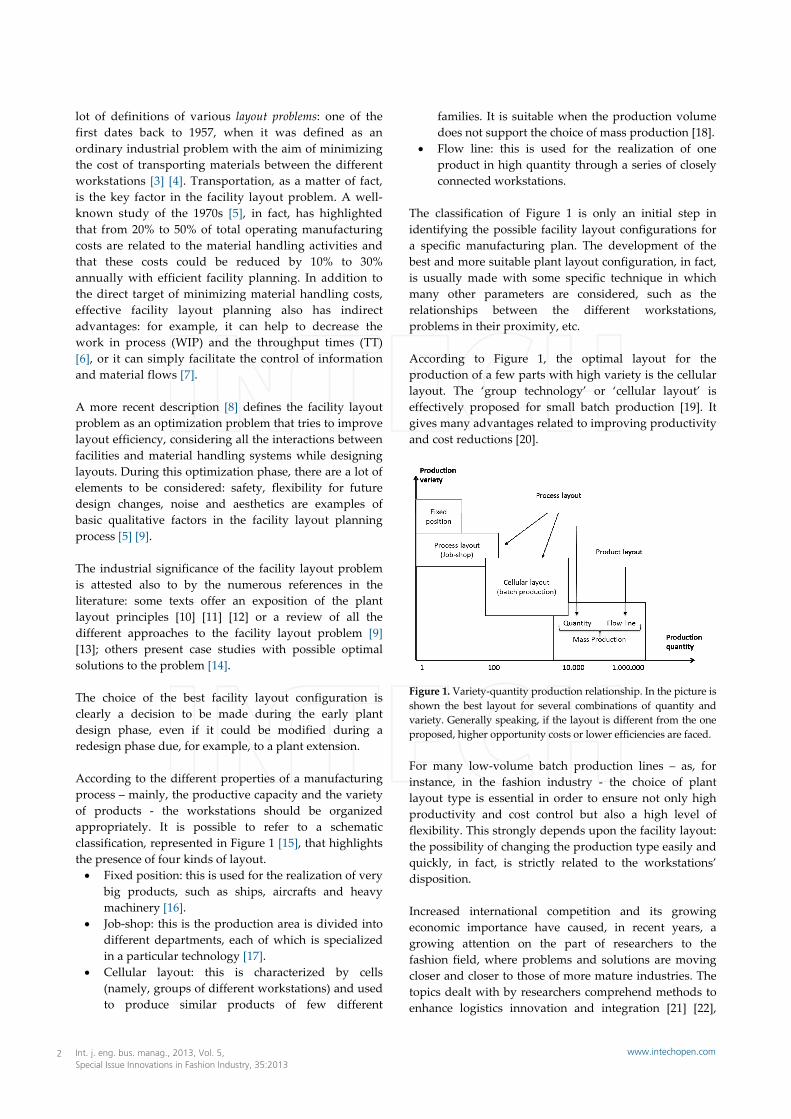
lot of definitions of various layout problems: one of the first dates back to 1957, when it was defined as an ordinary industrial problem with the aim of minimizing the cost of transporting materials between the different workstations [3] [4]. Transportation, as a matter of fact, is the key factor in the facility layout problem. A well‐known study of the 1970s [5], in fact, has highlighted that from 20% to 50% of total operating manufacturing costs are related to the material handling activities and that these costs could be reduced by 10% to 30% annually with efficient facility planning. In addition to the direct target of minimizing material handling costs, effective facility layout planning also has indirect advantages: for example, it can help to decrease the work in process (WIP) and the throughput times (TT) [6], or it can simply facilitate the control of information and material flows [7]. A more recent description [8] defines the facility layout problem as an optimization problem that tries to improve layout efficiency, considering all the interactions between facilities and material handling systems while designing layouts. During this optimization phase, there are a lot of elements to be considered: safety, flexibility for future design changes, noise and aesthetics are examples of basic qualitative factors in the facility layout planning process [5] [9]. The industrial significance of the facility layout problem is attested also to by the numerous references in the literature: some texts offer an exposition of the plant layout principles [10] [11] [12] or a review of all the different approaches to the facility layout problem [9] [13]; others present case studies with possible optimal solutions to the problem [14]. The choice of the best facility layout configuration is clearly a decision to be made during the early plant design phase, even if it could be modified during a redesign phase due, for example, to a plant extension. According to the different properties of a manufacturing process – mainly, the productive capacity and the variety of products ‐ the workstations should be organized appropriately. It is possible to refer to a schematic classification, represented in Figure 1 [15], that highlights the presence of four kinds of layout. Fixed position: this is used for the realization of very
big products, such as ships, aircrafts and heavy machinery [16].
Job‐shop: this is the production area is divided into different departments, each of which is specialized in a particular technology [17].
Cellular layout: this is characterized by cells (namely, groups of different workstations) and used to produce similar products of few different
families. It is suitable when the production volume does not support the choice of mass production [18].
Flow line: this is used for the realization of one product in high quantity through a series of closely connected workstations.
The classification of Figure 1 is only an initial step in identifying the possible facility layout configurations for a specific manufacturing plan. The development of the best and more suitable plant layout configuration, in fact, is usually made with some specific technique in which many other parameters are considered, such as the relationships between the different workstations, problems in their proximity, etc. According to Figure 1, the optimal layout for the production of a few parts with high variety is the cellular layout. The ‘group technology’ or ‘cellular layout’ is effectively proposed for small batch production [19]. It gives many advantages related to improving productivity and cost reductions [20].
Figure 1. Variety‐quantity production relationship. In the picture is shown the best layout for several combinations of quantity and variety. Generally speaking, if the layout is different from the one proposed, higher opportunity costs or lower efficiencies are faced. For many low‐volume batch production lines – as, for instance, in the fashion industry ‐ the choice of plant layout type is essential in order to ensure not only high productivity and cost control but also a high level of flexibility. This strongly depends upon the facility layout: the possibility of changing the production type easily and quickly, in fact, is strictly related to the workstations’ disposition. Increased international competition and its growing economic importance have caused, in recent years, a growing attention on the part of researchers to the fashion field, where problems and solutions are moving closer and closer to those of more mature industries. The topics dealt with by researchers comprehend methods to enhance logistics innovation and integration [21] [22],
Int. j. eng. bus. manag., 2013, Vol. 5, Special Issue Innovations in Fashion Industry, 35:2013
2 www.intechopen.com
tools in performing effective performance measurement [23], proper layout selection [24], the appraisal of the brand equity [25] and suitable adaptations of forecasting techniques [26] [27]. An important element to be considered in choosing the proper layout configuration for small batch fashion production lines is the level of the similarity of the products in the manufacturing processes. If an item differs a little from the others (for example, only in terms of colour, size, etc.) and the manufacturing sequence of operations remains unchanged, the optimum layout may be somewhat different from the classical cellular layout. In this case, it is necessary to adopt one or more of the specific layout models currently available. The aim of the present study is to make a comparison of the different layout design methods for low‐volume batch fashion manufacturing lines. In particular, a case study was investigated analysing a manufacturing line of felt hats. The results show that the best approach to be adopted – i.e., to gain an appropriate layout arrangement ‐ is the facility layout coming from a wider “lean production” analysis and reengineering process. This result was achieved through a discrete events simulation analysis, which permitted us to compare the costs and productivity performance of each solution investigated. The remainder of the present paper is organized as follows: in section 2 the principal layout design methods are presented; section 3 gives the case study analysis and the description of its manufacturing process; the results of the analysis are explained in section 4, while the fifth section provides a discussion of the results and presents some conclusions. 2. Methods To design or re‐design the facility layout of a manufacturing process, it is possible to apply many different methods. Each one is based on a specific idea and goal to be achieved. Since a method usually gives an optimal layout configuration different from the others, it is important to have a performance measurement tool in order to gain hints about the best method to adopt. This comparison could be made through a score, such as the total closeness rating index [28], or a simulation analysis highlighting the results of the main production process parameters, such as costs, times, the throughput rate, the WIP or the line availability [29] [30] [31]. Before investigating the best facility layout design method, we present in this section some of their major features, especially those of the systematic layout planning (SLP) technique [32] and the layout suggested by the wider activity of “lean” redesign, through the value stream mapping tool.
2.1 SLP
SLP, developed in 1973 by Richard Murther, is one of the most frequently used methods in the design or redesign of a facilities layout. SLP includes three specific phases [32], namely: Data collection and analysis; Searching among the possible layout solutions; Evaluating alternatives and the choice of the best
layout. The output of the first step of SLP is the relationship chart, or ‘buff diagram’. It derives from information such as the flow of materials between the different workstations [2], their adjacency requirements and the corresponding reasons. In a relationship chart, we can see the different operations ‐ on the right side ‐ and a specific letter code with a number, corresponding to each department pair. Each letter code represents a specific class of adjacency, in particular: A: absolutely necessary. E: especially important. I: important. O: ordinary. U: unimportant. X: undesirable.
Alternatively, the number is related to the reason why the relationship code is appointed, such in terms of safety, ease of supervision, etc. The next step is the construction of the relationship diagram. This represents the activities of the buff diagram with the ASME notation, connected with lines. The number of lines linking two activities derives from the level of desired nearness: four lines for the A class of adjacency, three for the E class, and so on. The relationship diagram, which derives from the relationship chart, allows the consideration of alternative layout configurations. Among them we will find the best solution, chosen considering more than just factors of economy, such as the improvement of material flow and waste reduction, etc.
2.2 Lean facility layout system
Lean manufacturing is a production system born in Japan, based on the Toyota Production System. This was founded on certain central ideas: the most significant are total quality management, total productive maintenance and the ‘just in time’. The first is related to the quality of the product, of the process itself and of each element related to the production process. The second refers to the strategic role of maintenance activities, while the last refers to the optimization of the logistic flow so as to decrease stock levels. The central idea of lean manufacturing is waste elimination [33] [34], which is essential to increase
Filippo De Carlo, Maria Antonietta Arleo, Orlando Borgia and Mario Tucci: Layout Design for a Low Capacity Manufacturing Line: A Case Study
3www.intechopen.com
profitability. The elimination or reduction of waste, in fact, is oriented towards both efficiency and quality. The presence of waste in a manufacturing framework is intrinsic to the nature of the manufacturing system itself. To make a product ‐ as is known ‐ a lot of processes and operations are needed. Some of these add value to the production, while others are not value‐adding and, therefore, may be considered to wasteful. In particular, three different kinds of operations have been identified [35]: Non‐value adding: these operations are pure waste
and should be removed [36]. Necessary but non‐value adding: since they are
necessary to existing operating practices, they could be eliminated by revising the operation procedures such as, for example, redesigning the facility layout.
Value adding: these operations give value added to the process’s transformation of raw materials to final products.
Taiichi Ohno [37], Toyota’s Chief Engineer, identified seven types of “muda” (viz., the Japanese word for ‘waste’), namely: Overproduction; Waiting; Transporting; Inappropriate processing; Unnecessary inventory; Unnecessary motion; Defects.
In recent years, the underutilization of employees has been added to the seven original categories of waste. The specific features of lean manufacturing are used to design facility layouts too. This activity, from the initial layout, gives a final lean facility layout scheme [38]. It is based on four phases: Identification of the process’s value stream and the
definition of the current state mapping [39]: the aim of this phase represents the “as is” state of the studied system through a map that represents all the actions required to make a specific product. The value stream is the set of all these actions, namely are design and manufacturing activities.
Waste elimination and the identification of alternative solutions: these lean manufacturing techniques are useful to remove or reduce all elements of the muda.
Representation of the future state map [39]. The design of the new facility layout, based on the
changes and improvements identified in the previous phases.
The facility layout obtained according to this process has properties and goals similar to the lean manufacturing ideas: it will be oriented towards a reduction of each kind
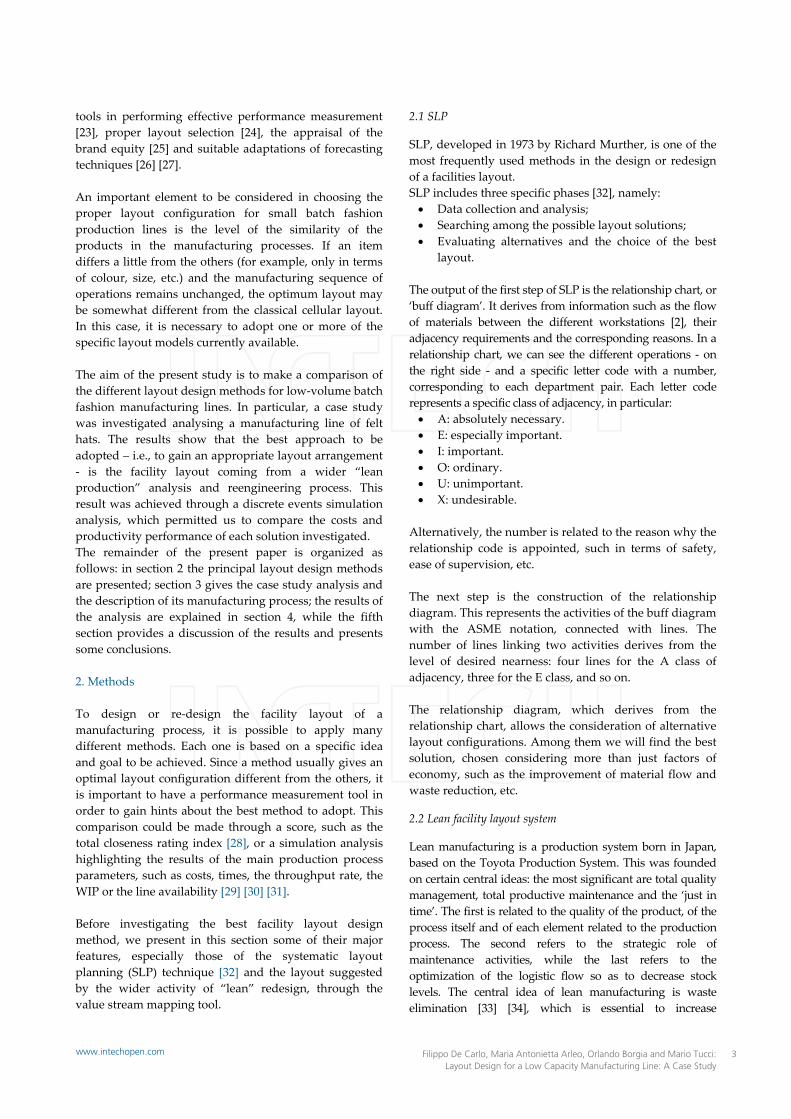
of waste, such as transporting time, space and unnecessary workstations. 3. Case Study This paper refers to a felt hats production line with a throughput time of about 50 days for every batch. Each batch is composed of about 10 hats. The production process is described in what follows. Fur is the raw material for the felt production, especially rabbit and hare fur. The first processing phase is “blowing”, in which hair is mixed and blown in a particular machine called, properly, a “blower”. Next, with the “basting and pre‐fulling” phase, the hair is compacted around a cone with a jet of hot water. This operation creates a bell‐shaped product, called a “cloche”, that is carefully checked for any defect. After the cloche inspection, it undergoes “steeping” treatment, which gradually shrinks its size. The next phases are “drying” and “dying”, following which the bell is shrunk further until it reaches the desired size. The hood is then treated with certain natural substances (lac) in the “stiffening” phase: the lac makes the cloche bright and resistant. Next, there is the first “blocking” step, which gives the right shape and size required by compression on specific aluminium moulds. The final form and size are completed after the second and last blocking step, occurred after the “pumicing” phase which sands the felt outside. The production process ends with the “finishing” phase, which includes the application of final standard accessories (lining, leather bands, etc.) and those required by customers. The hat is then ready for further packaging activities. To summarize, there are 11 activities to be accomplished and 9 workstations needed in the line: A. Blowing; B. Basting and pre‐fulling; C. Steeping; D. Drying; E. Dying; F. Stiffening; G. Blocking; H. Pumicing; I. Finishing.
Figure 2: Production diagram. The figure shows the production phases required to produce a felt hat. The phases are: Blowing (A), Basting and pre‐fulling (B), Steeping (C), Drying (D), Dying (E), Stiffening (F), Blocking (G), Pumicing (H) and Finishing (I). Notice that the C and G phases must be performed twice.
Int. j. eng. bus. manag., 2013, Vol. 5, Special Issue Innovations in Fashion Industry, 35:2013
4 www.intechopen.com
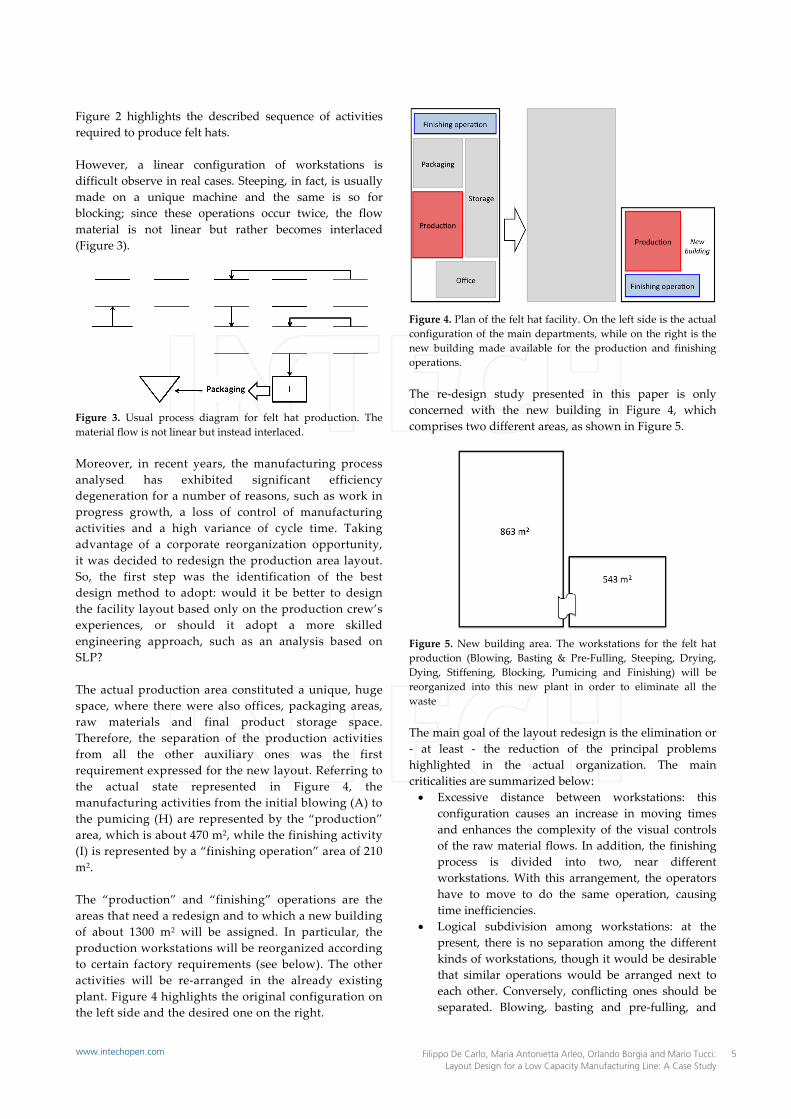
Figure 2 highlights the described sequence of activities required to produce felt hats. However, a linear configuration of workstations is difficult observe in real cases. Steeping, in fact, is usually made on a unique machine and the same is so for blocking; since these operations occur twice, the flow material is not linear but rather becomes interlaced (Figure 3).
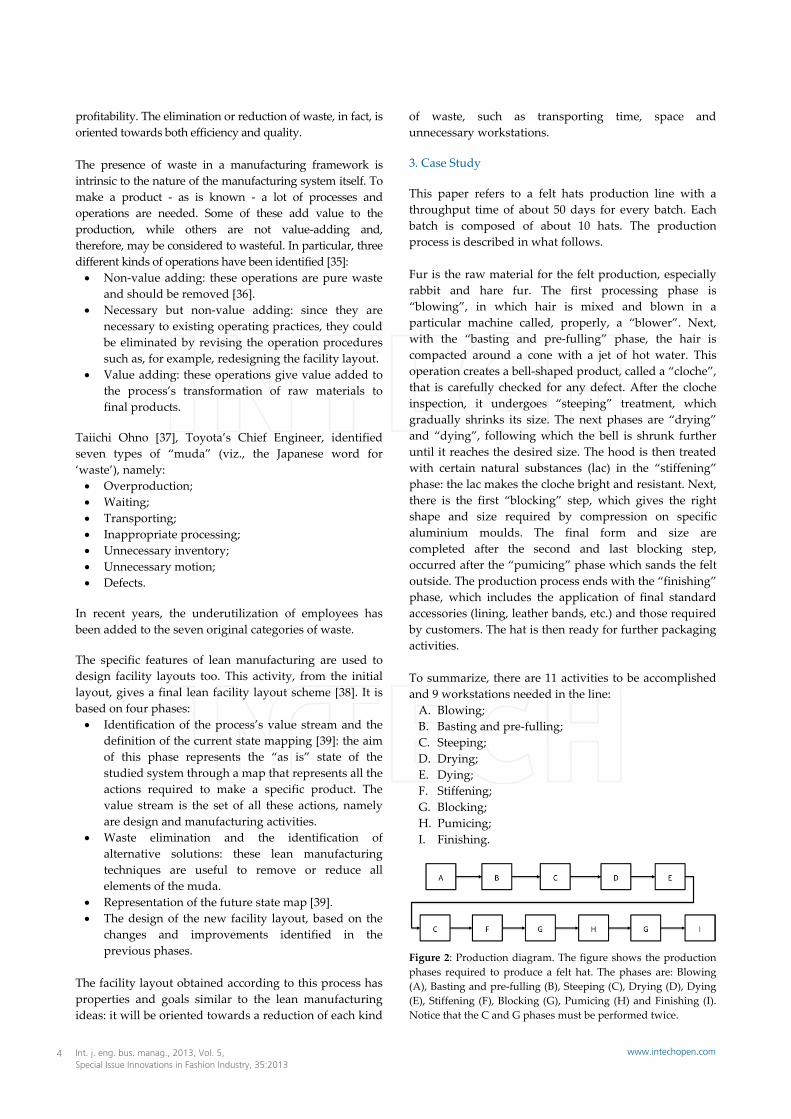
Figure 3. Usual process diagram for felt hat production. The material flow is not linear but instead interlaced. Moreover, in recent years, the manufacturing process analysed has exhibited significant efficiency degeneration for a number of reasons, such as work in progress growth, a loss of control of manufacturing activities and a high variance of cycle time. Taking advantage of a corporate reorganization opportunity, it was decided to redesign the production area layout. So, the first step was the identification of the best design method to adopt: would it be better to design the facility layout based only on the production crew’s experiences, or should it adopt a more skilled engineering approach, such as an analysis based on SLP? The actual production area constituted a unique, huge space, where there were also offices, packaging areas, raw materials and final product storage space. Therefore, the separation of the production activities from all the other auxiliary ones was the first requirement expressed for the new layout. Referring to the actual state represented in Figure 4, the manufacturing activities from the initial blowing (A) to the pumicing (H) are represented by the “production” area, which is about 470 m2, while the finishing activity (I) is represented by a “finishing operation” area of 210 m2. The “production” and “finishing” operations are the areas that need a redesign and to which a new building of about 1300 m2 will be assigned. In particular, the production workstations will be reorganized according to certain factory requirements (see below). The other activities will be re‐arranged in the already existing plant. Figure 4 highlights the original configuration on the left side and the desired one on the right.
Figure 4. Plan of the felt hat facility. On the left side is the actual configuration of the main departments, while on the right is the new building made available for the production and finishing operations. The re‐design study presented in this paper is only concerned with the new building in Figure 4, which comprises two different areas, as shown in Figure 5.
Figure 5. New building area. The workstations for the felt hat production (Blowing, Basting & Pre‐Fulling, Steeping, Drying, Dying, Stiffening, Blocking, Pumicing and Finishing) will be reorganized into this new plant in order to eliminate all the waste The main goal of the layout redesign is the elimination or ‐ at least ‐ the reduction of the principal problems highlighted in the actual organization. The main criticalities are summarized below: Excessive distance between workstations: this
configuration causes an increase in moving times and enhances the complexity of the visual controls of the raw material flows. In addition, the finishing process is divided into two, near different workstations. With this arrangement, the operators have to move to do the same operation, causing time inefficiencies.
Logical subdivision among workstations: at the present, there is no separation among the different kinds of workstations, though it would be desirable that similar operations would be arranged next to each other. Conversely, conflicting ones should be separated. Blowing, basting and pre‐fulling, and
Filippo De Carlo, Maria Antonietta Arleo, Orlando Borgia and Mario Tucci: Layout Design for a Low Capacity Manufacturing Line: A Case Study
5www.intechopen.com
pumicing, in fact, are “dirty” operations because they produce pollution during the fur processing. Dying is another operation that is classifiable as “dirty” because of the use of chemical substances. By closely positioning these operations, it might be possible to have a unique air vacuum and purification system. On the other hand, steeping and drying are strictly related for technological reasons. The hat’s final quality, in fact, also depends upon the time passing between these operations: in fact, it must not be too long. Moreover, for stiffening and finishing there is an organizational constraint. These operations are directly related to the visual quality of the hat and use similar machines for final quality control. For this reason, they should be placed close together.
Raw materials’ availability: raw materials and accessory elements are stored in three different areas, two of which are very far from the blowing station.
Disorganization of tool arrangements: all the accessory elements used in the production phases have a messy arrangement.
4. Results The manufacturing process re‐design was made through three different methodologies. The first one is an empirical method while the others are engineering techniques. In the following sections, the results of each method will be summarized.
4.1 Empirical approach
The first layout was identified empirically. According to the problems recognized and the goals sought, various different solutions have been suggested in an attempt to place similar operations or activities with specific needs close together.
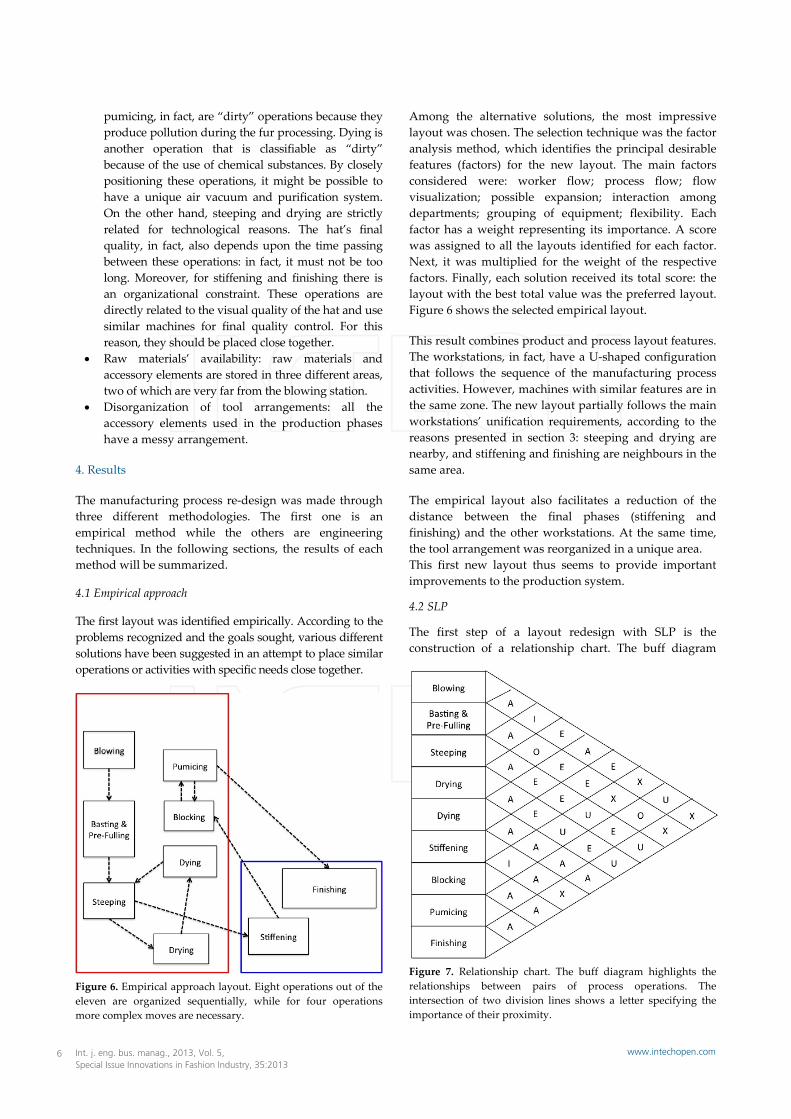
Figure 6. Empirical approach layout. Eight operations out of the eleven are organized sequentially, while for four operations more complex moves are necessary.
Among the alternative solutions, the most impressive layout was chosen. The selection technique was the factor analysis method, which identifies the principal desirable features (factors) for the new layout. The main factors considered were: worker flow; process flow; flow visualization; possible expansion; interaction among departments; grouping of equipment; flexibility. Each factor has a weight representing its importance. A score was assigned to all the layouts identified for each factor. Next, it was multiplied for the weight of the respective factors. Finally, each solution received its total score: the layout with the best total value was the preferred layout. Figure 6 shows the selected empirical layout. This result combines product and process layout features. The workstations, in fact, have a U‐shaped configuration that follows the sequence of the manufacturing process activities. However, machines with similar features are in the same zone. The new layout partially follows the main workstations’ unification requirements, according to the reasons presented in section 3: steeping and drying are nearby, and stiffening and finishing are neighbours in the same area. The empirical layout also facilitates a reduction of the distance between the final phases (stiffening and finishing) and the other workstations. At the same time, the tool arrangement was reorganized in a unique area. This first new layout thus seems to provide important improvements to the production system.
4.2 SLP
The first step of a layout redesign with SLP is the construction of a relationship chart. The buff diagram
Figure 7. Relationship chart. The buff diagram highlights the relationships between pairs of process operations. The intersection of two division lines shows a letter specifying the importance of their proximity.
Int. j. eng. bus. manag., 2013, Vol. 5, Special Issue Innovations in Fashion Industry, 35:2013
6 www.intechopen.com
allows the definition of an optimal operations sequence with a corresponding block layout. This will need to be successively adapted to the size and shape of the allowable functional area. Figure 7 represents the relationship chart for the process activities of the felt hat manufacturing process. From the buff diagram, the relationship chart of Figure 8 was acquired. The various relationships of proximity for the workstations add to the complexity the diagram, as it is difficult to satisfy all the requirements at the same time.
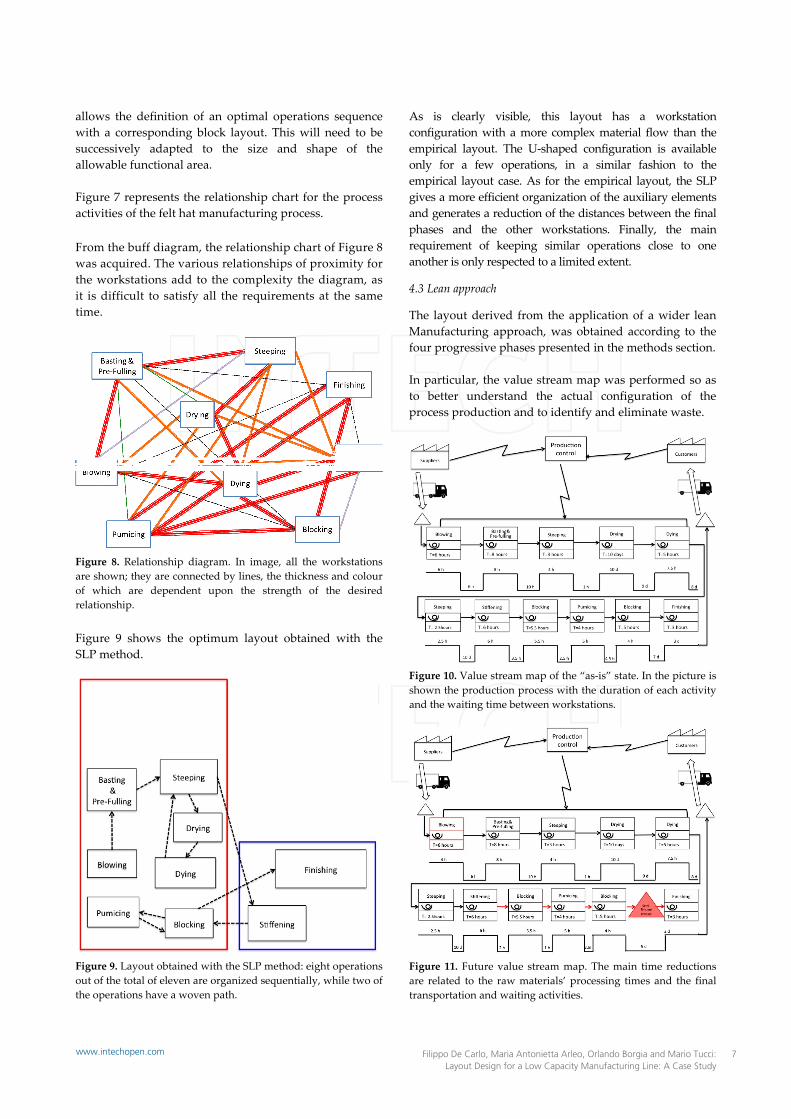
Figure 8. Relationship diagram. In image, all the workstations are shown; they are connected by lines, the thickness and colour of which are dependent upon the strength of the desired relationship. Figure 9 shows the optimum layout obtained with the SLP method.
Figure 9. Layout obtained with the SLP method: eight operations out of the total of eleven are organized sequentially, while two of the operations have a woven path.
As is clearly visible, this layout has a workstation configuration with a more complex material flow than the empirical layout. The U‐shaped configuration is available only for a few operations, in a similar fashion to the empirical layout case. As for the empirical layout, the SLP gives a more efficient organization of the auxiliary elements and generates a reduction of the distances between the final phases and the other workstations. Finally, the main requirement of keeping similar operations close to one another is only respected to a limited extent.
4.3 Lean approach
The layout derived from the application of a wider lean Manufacturing approach, was obtained according to the four progressive phases presented in the methods section. In particular, the value stream map was performed so as to better understand the actual configuration of the process production and to identify and eliminate waste.
Figure 10. Value stream map of the “as‐is” state. In the picture is shown the production process with the duration of each activity and the waiting time between workstations.
Figure 11. Future value stream map. The main time reductions are related to the raw materials’ processing times and the final transportation and waiting activities.
Filippo De Carlo, Maria Antonietta Arleo, Orlando Borgia and Mario Tucci: Layout Design for a Low Capacity Manufacturing Line: A Case Study
7www.intechopen.com
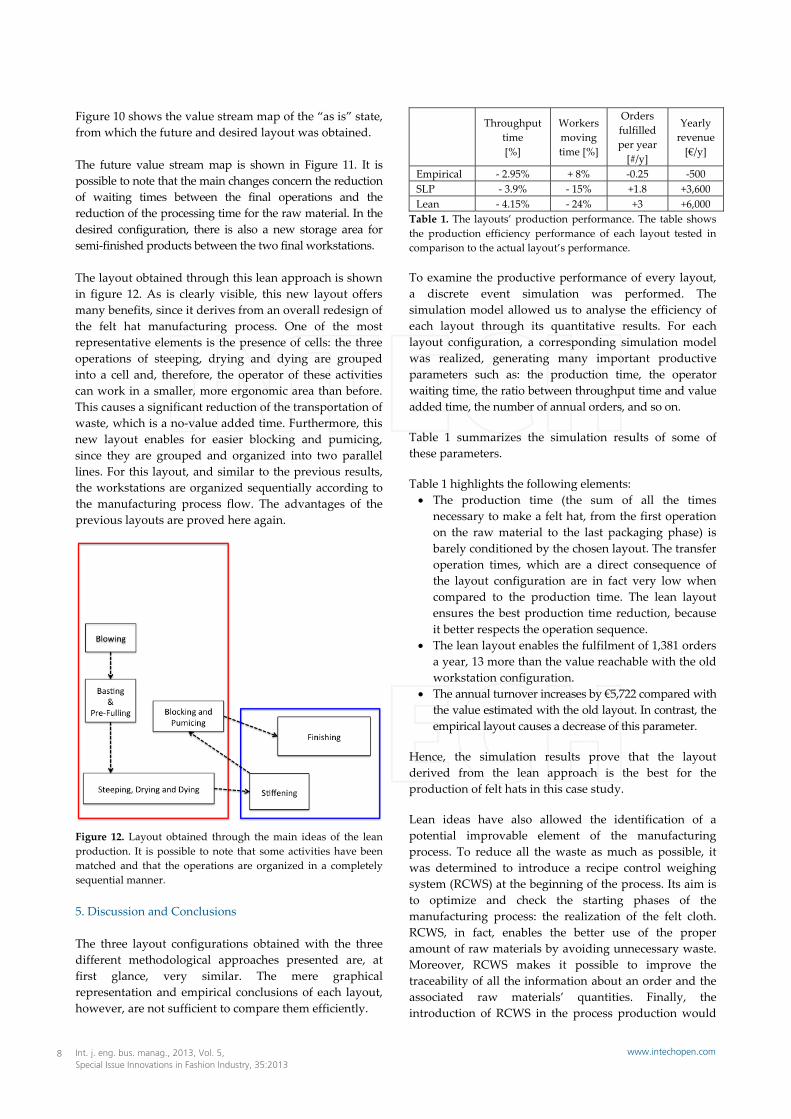
Figure 10 shows the value stream map of the “as is” state, from which the future and desired layout was obtained. The future value stream map is shown in Figure 11. It is possible to note that the main changes concern the reduction of waiting times between the final operations and the reduction of the processing time for the raw material. In the desired configuration, there is also a new storage area for semi‐finished products between the two final workstations. The layout obtained through this lean approach is shown in figure 12. As is clearly visible, this new layout offers many benefits, since it derives from an overall redesign of the felt hat manufacturing process. One of the most representative elements is the presence of cells: the three operations of steeping, drying and dying are grouped into a cell and, therefore, the operator of these activities can work in a smaller, more ergonomic area than before. This causes a significant reduction of the transportation of waste, which is a no‐value added time. Furthermore, this new layout enables for easier blocking and pumicing, since they are grouped and organized into two parallel lines. For this layout, and similar to the previous results, the workstations are organized sequentially according to the manufacturing process flow. The advantages of the previous layouts are proved here again.
Figure 12. Layout obtained through the main ideas of the lean production. It is possible to note that some activities have been matched and that the operations are organized in a completely sequential manner. 5. Discussion and Conclusions The three layout configurations obtained with the three different methodological approaches presented are, at first glance, very similar. The mere graphical representation and empirical conclusions of each layout, however, are not sufficient to compare them efficiently.
Throughput
time [%]
Workers moving time [%]
Orders fulfilled per year [#/y]
Yearly revenue [€/y]
Empirical ‐ 2.95% + 8% ‐0.25 ‐500 SLP ‐ 3.9% ‐ 15% +1.8 +3,600 Lean ‐ 4.15% ‐ 24% +3 +6,000 Table 1. The layouts’ production performance. The table shows the production efficiency performance of each layout tested in comparison to the actual layout’s performance. To examine the productive performance of every layout, a discrete event simulation was performed. The simulation model allowed us to analyse the efficiency of each layout through its quantitative results. For each layout configuration, a corresponding simulation model was realized, generating many important productive parameters such as: the production time, the operator waiting time, the ratio between throughput time and value added time, the number of annual orders, and so on. Table 1 summarizes the simulation results of some of these parameters. Table 1 highlights the following elements: The production time (the sum of all the times
necessary to make a felt hat, from the first operation on the raw material to the last packaging phase) is barely conditioned by the chosen layout. The transfer operation times, which are a direct consequence of the layout configuration are in fact very low when compared to the production time. The lean layout ensures the best production time reduction, because it better respects the operation sequence.
The lean layout enables the fulfilment of 1,381 orders a year, 13 more than the value reachable with the old workstation configuration.
The annual turnover increases by €5,722 compared with the value estimated with the old layout. In contrast, the empirical layout causes a decrease of this parameter.
Hence, the simulation results prove that the layout derived from the lean approach is the best for the production of felt hats in this case study. Lean ideas have also allowed the identification of a potential improvable element of the manufacturing process. To reduce all the waste as much as possible, it was determined to introduce a recipe control weighing system (RCWS) at the beginning of the process. Its aim is to optimize and check the starting phases of the manufacturing process: the realization of the felt cloth. RCWS, in fact, enables the better use of the proper amount of raw materials by avoiding unnecessary waste. Moreover, RCWS makes it possible to improve the traceability of all the information about an order and the associated raw materials’ quantities. Finally, the introduction of RCWS in the process production would
Int. j. eng. bus. manag., 2013, Vol. 5, Special Issue Innovations in Fashion Industry, 35:2013
8 www.intechopen.com
improve the manufacturing process’s performance: namely in terms of lower transfer operation times, a reduction in the number of non‐compliant items, and an improvement in the traceability of the products. All these advantages were evaluated by a custom feasibility study, resulting in a revenue mark‐up of €17,300. As such, we can conclude that when it is necessary to redesign the layout of a low‐volume batch production line, the best way to confront this activity is to imagine a possible reengineering of the process with the aim of reducing waste according to lean manufacturing principles. This methodology, in fact, in addition to the reduction of transporting times and costs, analyses and helps the redesign of the productive system with the aim of reducing all possible waste. In such a case, the unavoidable costs of redesign would trigger a double benefit: on the one hand, they will generate the necessary the layout re‐design and, on the other hand, they will hopefully define improvements that would lead to better system performance. 6. References [1] A. Kusiak and S. S. Heragu, “The facility layout
problem,” Eur. J. Oper. Res., vol. 29, no. 3, pp. 229–251, 1987.
[2] S. S. Heragu, Facilities design. iUniverse, 2006. [3] T. C. Koopmans and M. Beckmann, “Assignment
problems and the location of economic activities,” Econ. J. Econ. Soc., pp. 53–76, 1957.
[4] A. Drira, H. Pierreval, and S. Hajri‐Gabouj, “Facility layout problems: A survey,” Annu. Rev. Control, vol. 31, no. 2, pp. 255–267, 2007.
[5] R. L. Francis and J. A. White, Facility layout and location: an analytical approach. Prentice‐Hall, 1974.
[6] R. G. Askin and C. R. Standridge, Modeling and analysis of manufacturing systems. Wiley, 1993.
[7] M. C. Fu and B. K. Kaku, “Minimizing work‐in‐process and material handling in the facilities layout problem,” Iie Trans., vol. 29, no. 1, pp. 29–36, 1997.
[8] E. Shayan* and A. Chittilappilly, “Genetic algorithm for facilities layout problems based on slicing tree structure,” Int. J. Prod. Res., vol. 42, no. 19, pp. 4055–4067, 2004.
[9] S. P. Singh and R. R. K. Sharma, “A review of different approaches to the facility layout problems,” Int. J. Adv. Manuf. Technol., vol. 30, no. 5–6, pp. 425–433, 2006.
[10] J. M. Apple, Plant layout and material handling. Wiley, 1977.
[11] M. M. D. Hassan, “Machine layout problem in modern manufacturing facilities,” Int. J. Prod. Res., vol. 32, no. 11, pp. 2559–2584, 1994.
[12] R. D. Meller and K.‐Y. Gau, “The facility layout problem: Recent and emerging trends and perspectives,” J. Manuf. Syst., vol. 15, no. 5, pp. 351–366, 1996.
[13] M. M. Hassan and G. L. Hogg, “A review of graph theory application to the facilities layout problem,” Omega, vol. 15, no. 4, pp. 291–300, 1987.
[14] S. Hamamoto, “Development and validation of genetic algorithm‐based facility layout a case study in the pharmaceutical industry,” Int. J. Prod. Res., vol. 37, no. 4, pp. 749–768, 1999.
[15] M. P. Groover, Automation, production systems, and computer‐integrated manufacturing. Prentice Hall Press, 2007.
[16] T. C. Papadopoulou, “Application of lean scheduling and production control in non‐repetitive manufacturing systems using intelligent agent decision support,” 2013.
[17] F. De Carlo, Impianti industriali: conoscere e progettare i sistemi produttivi, Terza edizione. Lulu.com, 2013.
[18] G. A. B. Edwards, Readings in group technology: cellular systems. Machinery Pub. Co., 1971.
[19] F. Huq, D. A. Hensler, and Z. M. Mohamed, “A simulation analysis of factors influencing the flow time and through‐put performance of functional and cellular layouts,” Integr. Manuf. Syst., vol. 12, no. 4, pp. 285–295, Jul. 2001.
[20] M. Hassan, “Layout design in group technology manufacturing,” Int. J. Prod. Econ., vol. 38, no. 2, pp. 173–188, 1995.
[21] R. Iannone, A. Ingenito, G. Martino, S. Miranda, S. Pepe, and S. Riemma, “Merchandise and replenishment planning optimization for fashion retail,” Int. J. Eng. Bus. Manag., vol. in press, 2013.
[22] M. M. Schiraldi and C. Battista, “The Logistic Maturity Model: Application to a Fashion Company,” Int. J. Eng. Bus. Manag., vol. in press, 2013.
[23] F. De Felice, A. Petrillo, and C. Autorino, “Key success factors for organizational innovation in the fashion industry,” Int. J. Eng. Bus. Manag., vol. in press, 2013.
[24] F. De Carlo, M. Tucci, and O. Borgia, “Bucket brigades to increase productivity in a luxury assembly line,” Int. J. Eng. Bus. Manag., vol. in press, 2013.
[25] E. Battistoni, A. Fronzetti Colladon, and G. Mercorelli, “Prominent determinants of consumer based brand equity,” Int. J. Eng. Bus. Manag., vol. in press, 2013.
[26] A. Fumi, A. Pepe, L. Scarabotti, and M. M. Schiraldi, “Fourier analysis for demand forecasting in fashion company,” Int. J. Eng. Bus. Manag., vol. in press, 2013.
[27] M. E. Nenni, L. Giustiniano, and L. Pirolo, “Demand forecasting in the fashion industry: a review,” Int. J. Eng. Bus. Manag., vol. in press, 2013.
[28] R. C. Lee, “CORELAP—Computerized REIationship L Ay out Planning,” in Conference and convention proceedings, 1967, p. 274.
[29] F. De Carlo, “Reliability and Maintainability in Operations Management,” in Operations Management, 1 vols., Rijeka, Croatia: Intech, 2013, p. 32.
Filippo De Carlo, Maria Antonietta Arleo, Orlando Borgia and Mario Tucci: Layout Design for a Low Capacity Manufacturing Line: A Case Study
9www.intechopen.com
[30] F. De Carlo, O. Borgia, and M. Tucci, “Risk‐based inspections enhanced with Bayesian networks,” Proc. Inst. Mech. Eng. Part O J. Risk Reliab., vol. 225, no. 3, pp. 375–386, 2011.
[31] F. De Carlo, O. Borgia, and M. Tucci, “Accelerated degradation tests for reliability estimation of a new product: a case study for washing machines.,” Proc. Inst. Mech. Eng. Part O J. Risk Reliab., in press.
[32] R. Muther and A. H. Mogensen, “Systematic layout planning,” 1973.
[33] J. P. Womack, D. T. Jones, and D. Roos, The Machine That Changed the World: The Story of Lean Production‐‐ Toyota’s Secret Weapon in the Global Car Wars That Is Now Revolutionizing World Industry. Simon and Schuster, 2007.
[34] J. P. Womack and D. T. Jones, Lean Thinking: Banish Waste and Create Wealth in Your Corporation. Simon and Schuster, 2010.
[35] Y. Monden, Toyota production system: an integrated approach to just‐in‐time. Productivity Pr, 2012.
[36] P. Hines and N. Rich, “The seven value stream mapping tools,” Int. J. Oper. Prod. Manag., vol. 17, no. 1, pp. 46–64, 1997.
[37] T. Ōno, Toyota production system: beyond large‐scale production. Productivity Pr, 1988.
[38] X. Lu, Z. Jia, J. Yang, and H. Liu, “Design and implementation of Lean Facility Layout System of a Production Line,” Int. J. Ind. Eng. Theory Appl. Pr., vol. 18, no. 5, 2011.
[39] M. Rother and J. Shook, Learning to See: Value‐Stream Mapping to Create Value and Eliminate Muda: Version 1.3 June 2003. Lean Enterprise Institute, 2003.
Int. j. eng. bus. manag., 2013, Vol. 5, Special Issue Innovations in Fashion Industry, 35:2013
10 www.intechopen.com