Embed Size (px)
Citation preview
Layout and design by the Department of Water Affairs and Forestry Chief Directorate: Communication Services
Toll Free Number: 0800 200 200
Best Practice Guideline - G2: Water and Salt Balances -- August 2006
____________________________________________________________________________________________________________________________________
PB i
This report should be cited as:
Department of Water Affairs and Forestry, 2006. Best Practice Guideline G2: Water and Salt Balances.
Disclaimer:
Although the information contained in this document is presented in good faith and believed to be correct, the Department of Water Affairs and Forestry makes no representations or warranties as to the completeness or accuracy of the information, which is only based on actual information received, and makes no commitment to update or correct information.
Consultants:
Pulles Howard & de Lange Inc. P O Box 861 AUCKLAND PARK 2006 Republic of South Africa
ISBN 0-9585138-1-3
Status Final August 2006
PuBlISheD By
Department of Water Affairs and Forestry
Private Bag X313 PRETORIA
0001 Republic of South Africa
Tel: (012) 336-7500
Copyright reserved
No part of the publication may be reproduced in any manner without
full acknowledgement of the source
Best Practice Guideline - G2: Water and Salt Balances -- August 2006
____________________________________________________________________________________________________________________________________
ii iiiii iii
This document is the second in a series of the following general aspects Best Practice Guideline documents:
BPG G1: Storm Water Management
BPG G2: Water and Salt Balances
BPG G3: Water Monitoring Systems
BPG G4: Impact Prediction
DOCuMeNT INDeX
Authors:
Mr William Pulles (Pulles Howard & de Lange) Mr Henry van Rensburg (Pulles Howard & de Lange)
Specialists:
Mr Rod Schwab (DWAF) Dr André van Niekerk (Wates Meiring & Barnard) Dr Andrew Wood (Steffen Robertson & Kirsten) Mr Letladi Maisela (DWAF)
Since 1999 a number of steering committee meetings and stakeholder workshops were held at various stages of the development and drafting of this series of Best Practice Guidelines for Water Resource Protection in the South African Mining Industry.
We are deeply indebted to the steering committee members, officials of the Department of Water Affairs and Forestry and stakeholders who participated in the meetings and stakeholder workshops held during the development of the series of Best Practice Guidelines for their inputs, comments and kind assistance.
The Department would like to acknowledge the authors of this document, as well as the specialists involved in the process of developing this Best Practice Guideline. Without their knowledge and expertise this guideline could not have been completed.
ACKOWleDGe-MeNTS
ii iii
Best Practice Guideline - G2: Water and Salt Balances -- August 2006
____________________________________________________________________________________________________________________________________
ii iii
APPROVAlS This document is approved by the Department of Water Affairs and Forestry
Best Practice Guideline - G2: Water and Salt Balances -- August 2006
____________________________________________________________________________________________________________________________________
iv viv v
PReFACeWater is typically the prime environmental medium (besides air) that is affected by mining activities. Mining adversely affects water quality and poses a significant risk to South Africa’s water resources. Mining operations can further substantially alter the hydrological and topographical characteristics of the mining areas and subsequently affect the surface runoff, soil moisture, evapo-transpiration and groundwater behaviour. Failure to manage impacts on water resources (surface and groundwater) in an acceptable manner throughout the life-of-mine and post-closure, on both a local and regional scale, will result in the mining industry finding it increasingly difficult to obtain community and government support for existing and future projects. Consequently, sound management practices to prevent or minimise water pollution are fundamental for mining operations to be sustainable.
Pro-active management of environmental impacts is required from the outset of mining activities. Internationally, principles of sustainable environmental management have developed rapidly in the past few years. Locally the Department of Water Affairs and Forestry (DWAF) and the mining industry have made major strides together in developing principles and approaches for the effective management of water within the industry. This has largely been achieved through the establishment of joint structures where problems have been discussed and addressed through co-operation.
The Bill of Rights in the Constitution of the Republic of South Africa, 1996 (Act 108 of 1996) enshrines the concept of sustainability; specifying rights regarding the environment, water, access to information and just administrative action. These rights and other requirements are further legislated through the National Water Act (NWA), 1998 (Act 36 of 1998). The latter is the primary statute providing the legal basis for water management in South Africa and has to ensure ecological integrity, economic growth and social equity when managing and using water. Use of water for mining and related activities is also regulated through regulations that were updated after the promulgation of the NWA (Government Notice No. GN704 dated 4 June 1999).
The NWA introduced the concept of Integrated Water Resource Management (IWRM), comprising all aspects of the water resource, including water quality, water quantity and the aquatic ecosystem quality (quality of the aquatic biota and in-stream and riparian habitat). The IWRM approach provides for both resource directed and source directed measures. Resource directed measures aim to protect and manage the receiving environment. Examples of resource directed actions are the formulation of resource quality objectives and the development of associated strategies to ensure ongoing attainment of these objectives; catchment management strategies and the establishment of catchment management agencies (CMAs) to implement these strategies.
On the other hand, source directed measures aim to control the impacts at source through the identification and implementation of pollution prevention, water reuse and water treatment mechanisms.
he integration of resource and source directed measures forms the basis of the hierarchy of decision-taking aimed at protecting the resource from waste impacts. This hierarchy is based on a precautionary approach and the following order of priority for mine water and waste management decisions and/or actions is applicable:
iv v
Best Practice Guideline - G2: Water and Salt Balances -- August 2006
____________________________________________________________________________________________________________________________________
iv v
ReSOuRCe PROTeCTION AND WASTe MANAGeMeNT hIeRARChy
Step 1: Pollution Prevention
↓Step 2: Minimisation of Impacts
Water reuse and reclamation Water treatment
↓Step 3: Discharge or disposal of waste
and/or waste water Site specific risk based approach
Polluter pays principle
The documentation describing Water Resource Protection and Waste Management in South Africa is being
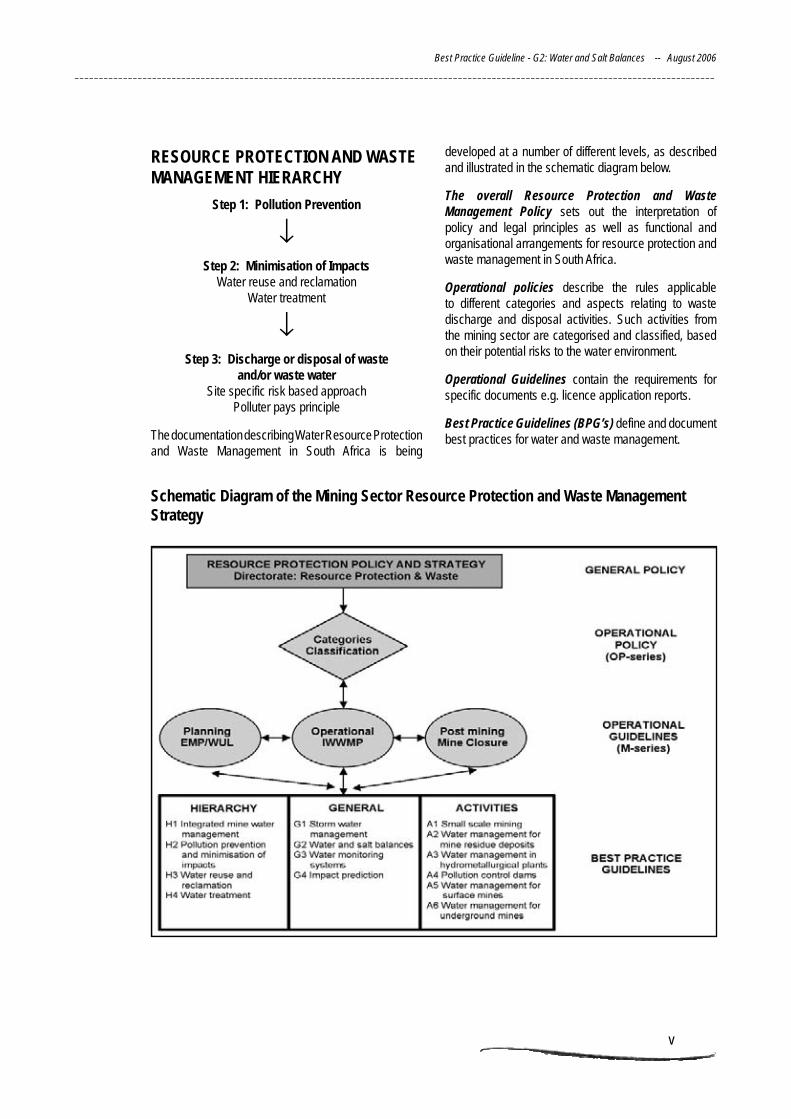
developed at a number of different levels, as described and illustrated in the schematic diagram below.
The overall Resource Protection and Waste Management Policy sets out the interpretation of policy and legal principles as well as functional and organisational arrangements for resource protection and waste management in South Africa.
Operational policies describe the rules applicable to different categories and aspects relating to waste discharge and disposal activities. Such activities from the mining sector are categorised and classified, based on their potential risks to the water environment.
Operational Guidelines contain the requirements for specific documents e.g. licence application reports.
Best Practice Guidelines (BPG’s) define and document best practices for water and waste management.
Schematic Diagram of the Mining Sector Resource Protection and Waste Management Strategy
Best Practice Guideline - G2: Water and Salt Balances -- August 2006
____________________________________________________________________________________________________________________________________
vi viivi vii
The DWAF has developed a series of Best Practice Guidelines (BPGs) for mines in line with International Principles and Approaches towards sustainability. The series of BPGs have been grouped as outlined below:
BeST PRACTICe GuIDelINeS dealing with aspects of DWAF’s water management hIeRARChy are prefaced with the letter h. The topics that are covered in these guidelines include:
• H1.IntegratedMineWaterManagement
• H2.PollutionPreventionandMinimisationofImpacts
• H3.WaterReuseandReclamation
• H4.WaterTreatment
BeST PRACTICe GuIDelINeS dealing with GeNeRAl water management strategies, techniques and tools, which could be applied cross-sectoral and always prefaced by the letter G. The topics that are covered in these guidelines include:
• G1.StormWaterManagement
• G2.WaterandSaltBalances
• G3.WaterMonitoringSystems
• G4.ImpactPrediction
BeST PRACTICe GuIDelINeS dealing with specific mining ACTIVITIeS or ASPeCTS and always prefaced by the letter A. These guidelines address the prevention and management of impacts from:
• A1 Small-scaleMining
• A2 WaterManagementforMineResidueDeposits
• A3. WaterManagementinHydrometallurgicalPlants
• A4 PollutionControlDams
• A5 WaterManagementforSurfaceMines
• A6 WaterManagementforUndergroundMines
The development of the guidelines is an inclusive consultative process that incorporates the input from a wide range of experts, including specialists within and outside the mining industry and government. The process of identifying which BPGs to prepare, who should participate in the preparation and consultative processes, and the approval of the BPGs was managed by a Project Steering Committee (PSC) with representation by key role-players.
The BPGs will perform the following functions within the hierarchy of decision making:
• Utilisationbytheminingsectorasinputforcompilingwater use licence applications (and other legally required documents such as EMPs, EIAs, closure plans, etc.) and for drafting licence conditions.
• Serveasauniformbasisfornegotiationsthroughthelicensing process prescribed by the NWA.
• UsedspecificallybyDWAFpersonnelasabasisfornegotiation with the mining industry, and likewise by the mining industry as a guideline as to what the DWAF considers as best practice in resource protection and waste management.
• Inform Interested and Affected Parties on goodpractice at mines.
The information contained in the BPGs will be transferred through a structured knowledge transfer process, which includes the following Steps:
• Workshopsinkeyminingregionsopentoallinterestedparties, including representatives from the mining industry, government and the public.
• Provision of material to mining industry traininggroups for inclusion into standard employee training programmes.
• Provisionofmaterialtotertiaryeducationinstitutionsfor inclusion into existing training programmes.
• ProvisionofelectronicBPGson theDWAF Internetweb page.
vi vii
Best Practice Guideline - G2: Water and Salt Balances -- August 2006
____________________________________________________________________________________________________________________________________
vi vii
CONTeNTSDOCuMeNTINDeX II
APPROVAlS III
PReFACe IV
1 INTRODuCTION AND OBJeCTIVeS OF ThIS BeST PRACTICe GuIDelINe 1
2 GeNeRAl PRINCIPleS OF WATeR AND SAlT BAlANCeS 2
3 PRACTICAl STePS AND CONSIDeRATIONS 4
3.1 Construction of the Water Balance Network. . . . . . . . . . . 4
Step 1: Define Objectives of Balances . . . . . . . . . . . . . 6
Step 2: Define Boundaries of Individual Balances . . . . . . . 6
Step 3: Identify all Water Circuits and Develop Schematic Flow Diagram . . . . . . . . . . . . . . . . . . . . . . . . . . 8
Step 4: Data Collection and Monitoring Programme . . . . . . 8
Step 5: Develop and Solve Balances for Units . . . . . . . . . 9
Step 5.1: Develop all Relevant Equations or Feed Data Into Computerised System . . . . . . . . . . . . . . . . . . . . . . . 9
Step 5.2: Develop Preliminary Balance . . . . . . . . . . . . . 10
Step 5.3: Assess Accuracy of Balance . . . . . . . . . . . . . 10
Step 5.4: Identify Causes of Imbalances . . . . . . . . . . . . 10
Step 5.5: Address Causes of Imbalances . . . . . . . . . . . . 10
Step 5.6: Calculate New Balance . . . . . . . . . . . . . . . . 11
Step 6: Develop Output Format. . . . . . . . . . . . . . . . . . 11
Step 7: Assess Level of Detail Required . . . . . . . . . . . . . 11
Steps 8.1 – 8.8: Develop and Solve Balances for Lower Level of Detail . . . . . . . . . . . . . . . . . . . . . . . . . . 11
Step 9: Define and Develop all Output Formats . . . . . . . . 11
Steps 10 & 11: Validate the Water and Salt Balance Model
and Data . . . . . . . . . . . . . . . . . . . . . . . . . . 13
3.2 Ongoing Management and Use of Water and Salt Balances . 14
4 MeThODS TO CAlCulATe WATeR AND SAlT BAlANCeS 15
4.1 Manual Calculations of Water and Salt Balances. . . . . . . . 15
4.2 Spreadsheet Based Balances . . . . . . . . . . . . . . . . . . . 15
4.3 Stand-alone PC-based Software Programs . . . . . . . . . . . 16
4.4 High-end Engineering Software . . . . . . . . . . . . . . . . . . 16
5 ReFeReNCeS 17
Best Practice Guideline - G2: Water and Salt Balances -- August 2006
____________________________________________________________________________________________________________________________________
viii 1viii 1
GlOSSARy 19
SyMBOlS OR ABBReVIATIONS 21
FIGuReS
Figure 3.1: Flow diagram of process to develop water and salt balances . . . . . . . . . . . . . . . 4
Figure 3.3: Flow diagram of process for Step 8 . . . . . . . . . . . . . . . . . . . . . . . . . . . . . . 5
Figure 3.2: Flow diagram of process for Step 5 . . . . . . . . . . . . . . . . . . . . . . . . . . . . . . 5
Figure 3.5: Pie Chart showing salt loads from different sources. . . . . . . . . . . . . . . . . . . . . 12
Figure 3.6: Bar Chart with salt loads . . . . . . . . . . . . . . . . . . . . . . . . . . . . . . . . . . . . 12
Figure 3.7: Time Series Graph . . . . . . . . . . . . . . . . . . . . . . . . . . . . . . . . . . . . . . . 13
TABleS
Table A1: Data Collected at the Gold Mine. . . . . . . . . . . . . . . . . . . . . . . . . . . . . . . . 25
APPeNDICeS
APPENDIX A: PRACTICAL WORKED EXAMPLES . . . . . . . . . . . . . . . . . . . . . . . . . . . . . 22
APPENDIX B: DETAIL ON WATER CIRCUITS. . . . . . . . . . . . . . . . . . . . . . . . . . . . . . . . . 33
APPENDIX C: QUANTIFYING COMPLEX INFLUENCES. . . . . . . . . . . . . . . . . . . . . . . . . . 41
APPENDIX a: Practical WORKED Examples . . . . . . . . . . . . . . . . . . . . . . . . . . . . . . . . . 22
Figure A1: Boundaries of Balances for Sub-sections of Mine . . . . . . . . . . . . . . . . . . . . . . . . 23
Figure A2: Boundaries of Balances for Sub-sections of 1 Shaft. . . . . . . . . . . . . . . . . . . . . . . 24
viii 1
Best Practice Guideline - G2: Water and Salt Balances -- August 2006
____________________________________________________________________________________________________________________________________
viii 1
Accurate water and salt balances are considered to be one of the most important and fundamental water management tools available to the mines. The purpose of water and salt balances includes:
• Providingthenecessaryinformationthatwillassistindefininganddrivingwatermanagementstrategies.
• Auditingandassessmentof thewater reticulationsystem,with themain focusonwaterusage and pollution sources. This includes identifying and quantifying points of high water consumption or wastage, as well as pollution sources. Seepage and leakage points can also be identified and quantified when the balances are used as an auditing and assessment tool.
• Assistingwiththedesignofstoragerequirementsandminimisingtheriskofspillage.
• Assistingwiththewatermanagementdecision-makingprocessbysimulatingandevaluatingvarious water management strategies before implementation.
This guideline seeks to provide the necessary guidance for the development of water and salt balances by attainment of the following objectives:
• Todevelopapracticalproceduretodevelopbalances.
• Todefinewhatshouldbecontainedinthebalances.
• Togiveguidanceonthelevelofdetailthatabalanceshouldcontain.
• Todefinebestpracticefordesign,implementationandcontinuousmanagementofawaterand salt balance.
• Toprovideanassessmentoftoolsthatcanbeusedtodevelopwaterandsaltbalances.
• Toprovideapracticalworkedexampleofawaterandsaltbalanceinwhichtheprinciplesdiscussed here have been applied.
The water and salt balances described in this Best Practice Guideline are based on the principles of conservation of mass and exclude advanced capabilities such as chemical speciation or dynamic time-based simulations.
The use of conservative salts in a salts balance is primarily aimed at assisting in developing and calculating the water balance. For contaminant balance that addresses the mine’s primary contaminants, typically sulphate and metals, the mine will be dealing with non-conservative salts and such balances will need to make use of geochemical and chemical speciation models as discusssed in BPG G4: Impact Prediction.
1INTRODuCTION AND OBJeCTIVeS OF ThIS
BeST PRACTICe GuIDelINe
Best Practice Guideline - G2: Water and Salt Balances -- August 2006
____________________________________________________________________________________________________________________________________
2 32 3
Then water and salt balances are developed, the general principles that should be taken into consideration can be divided into procedural and technical aspects. The procedural principles that one should be aware of when developing water and salt balances are:
• Clearobjectivesshouldbedefinedforthewaterandsaltbalances.Theseshouldcaterforthe current situation and the probable or desired future situation, i.e. the objectives must cater for the life cycle of the mine.
• Large complexmines should preferably be divided into smallermanagement units. It isgood practice to delegate the responsibility and authoritative power, for use of water and salt balances, for these smaller management units. It is also advisable to appoint a person who has responsibility for coordinating all the water and salt balances across the whole mine. Thus an overall integrated balance and separate balances for smaller units may be developed.
• Toachieveabalancewithanadequateresolutionordegreeofdetailitisbelievedthatforeach type of circuit, the flows should be considered down to an accuracy level of 1% – 5% of the total flow. For example, for a mine water circuit with a total flow of 10 000 m3/day, all individual point and diffuse discharges with a flow of 1 – 5%, i.e. 100 – 500 m3/day, or more should be included in the balances.
• For the purpose of water management and taking account of measurement errors, anaccuracy of 5 – 10% over a unit process and 10 – 15% for the overall mine is considered adequate. A calculated balance, i.e. where some of the flows or salt concentrations are not measured but determined by means of mass balance calculations, will give a 100% balance. A large part of the inaccuracy will be included in the calculated values.
• Common and uniform formats and procedures should be developed to ensure that thedifferent management units could effectively exchange information.
• Regularupdatingofthebalances,bothintermsofaddingnewdataandensuringthatthereticulation system reflects significant changes which have been made. This should be done as an iterative process to continuously obtain more accurate balances. As the understanding of the water and salt balance improves and water minimization measures are implemented, the water and salt balance should be refined to include more detail.
• Itisimportantthatthewaterandsaltbalancesystemwhichisused,mustbeflexibleenoughto accommodate changes which are made to the mine water reticulation system with ease.
The following technical principles should be understood when water and salt balances are developed:
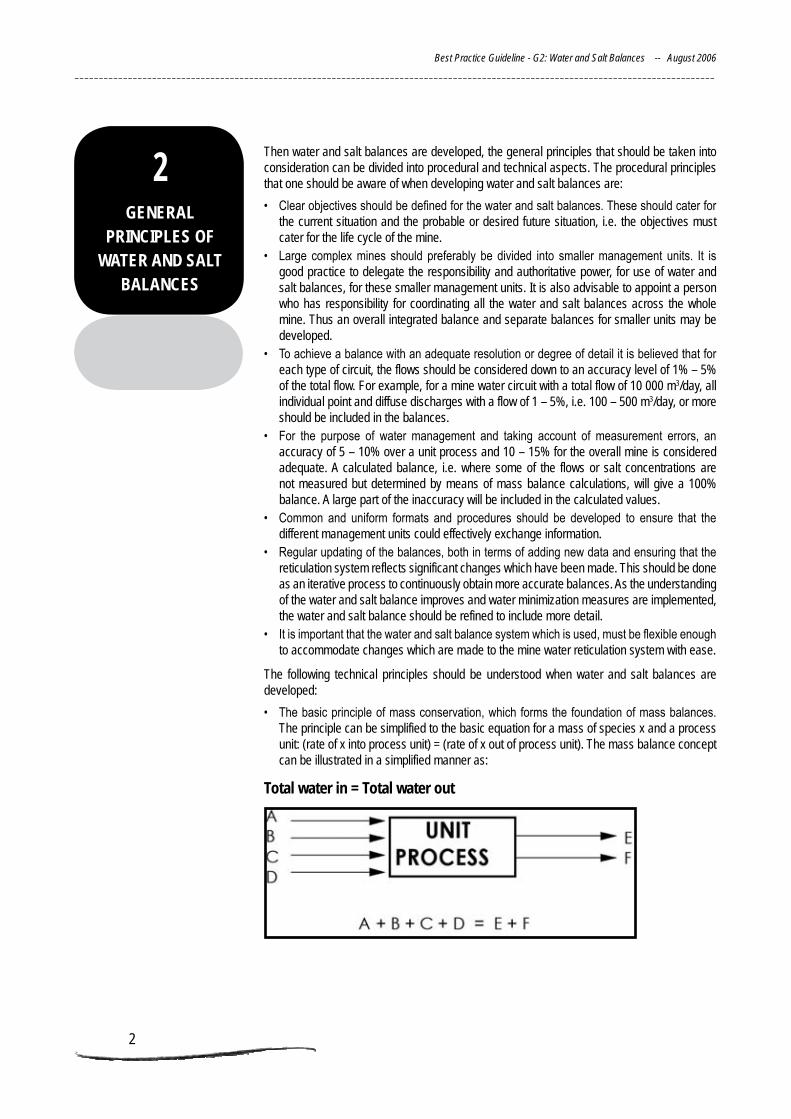
• Thebasicprincipleofmassconservation,which formsthefoundationofmassbalances.The principle can be simplified to the basic equation for a mass of species x and a process unit: (rate of x into process unit) = (rate of x out of process unit). The mass balance concept can be illustrated in a simplified manner as:
Total water in = Total water out
2GeNeRAl
PRINCIPleS OF WATeR AND SAlT
BAlANCeS
2 3
Best Practice Guideline - G2: Water and Salt Balances -- August 2006
____________________________________________________________________________________________________________________________________
2 3
• Theuseofconservativeandnon-conservativesalts.A conservative salt is considered to be one that will not undergo any significant changes (such as geochemical generation, precipitation and biological metabolism) within the unit process over which the mass balance is being constructed. Conservative salts e.g. sodium are used to construct the complete water and salt balance. The non-conservative salt or pollutant, e.g. sulphate, can be used to determine the pollution loads.
• Generating and evaluatingwater and salt balancestogether, enables one to calculate unknown flows through application of the principle of “simultaneous solution of equations”. The number of equations that can be developed for the specific balances limits the number of unknown flows that can be calculated.
• Toaccountforseasonalchangeswithinawaterandsalt balance, the hydrological years and their division into wet and dry seasons will need to be considered. Some statistical calculations with detailed rainfall records are required. Calculation will determine 5th percentile (dry), 50th percentile and 95th percentile (wet) flow and rain quantities to provide information on dry, typical and wet periods. Concentrations of pollutants based on the same percentiles can be used to calculate loads for worst-case scenarios, average conditions and best-case scenarios.
These principles will be discussed in more detail in the following sections and their application will be illustrated in a practical worked example.
Best Practice Guideline - G2: Water and Salt Balances -- August 2006
____________________________________________________________________________________________________________________________________
4 54 5
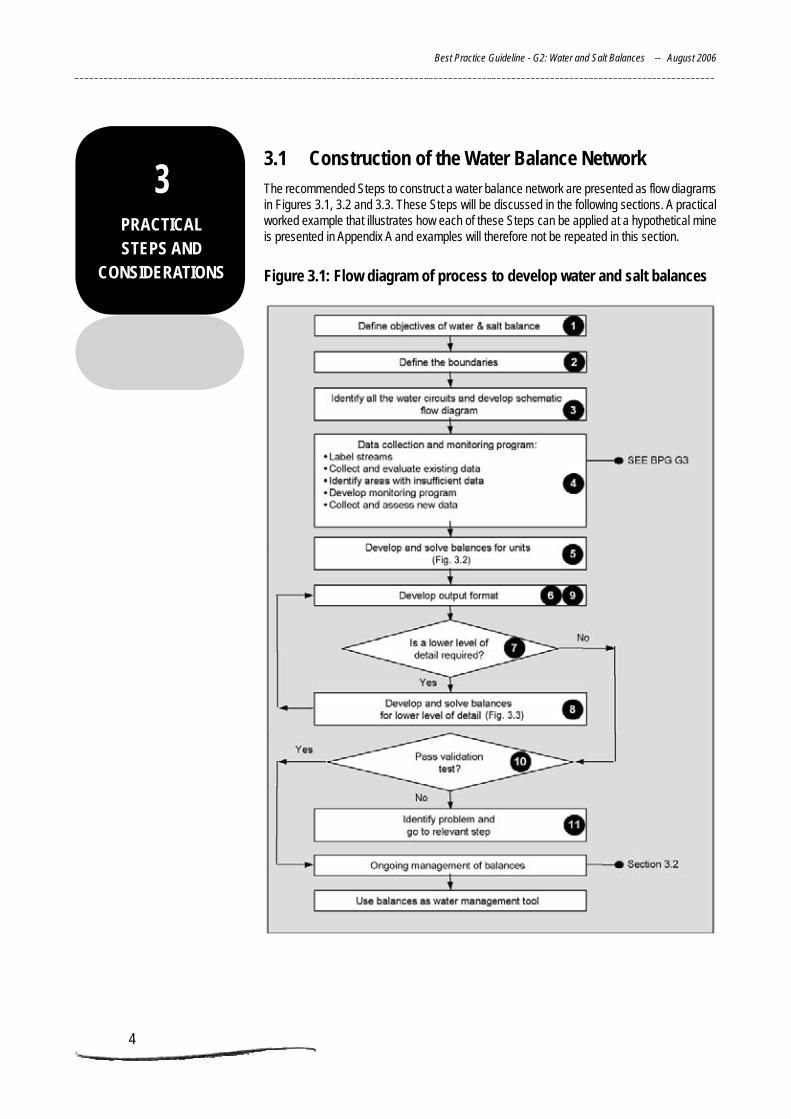
3 1 Construction of the Water Balance NetworkThe recommended Steps to construct a water balance network are presented as flow diagrams in Figures 3.1, 3.2 and 3.3. These Steps will be discussed in the following sections. A practical worked example that illustrates how each of these Steps can be applied at a hypothetical mine is presented in Appendix A and examples will therefore not be repeated in this section.
3PRACTICAl STePS AND
CONSIDeRATIONS Figure 3 1: Flow diagram of process to develop water and salt balances
4 5
Best Practice Guideline - G2: Water and Salt Balances -- August 2006
____________________________________________________________________________________________________________________________________
4 5
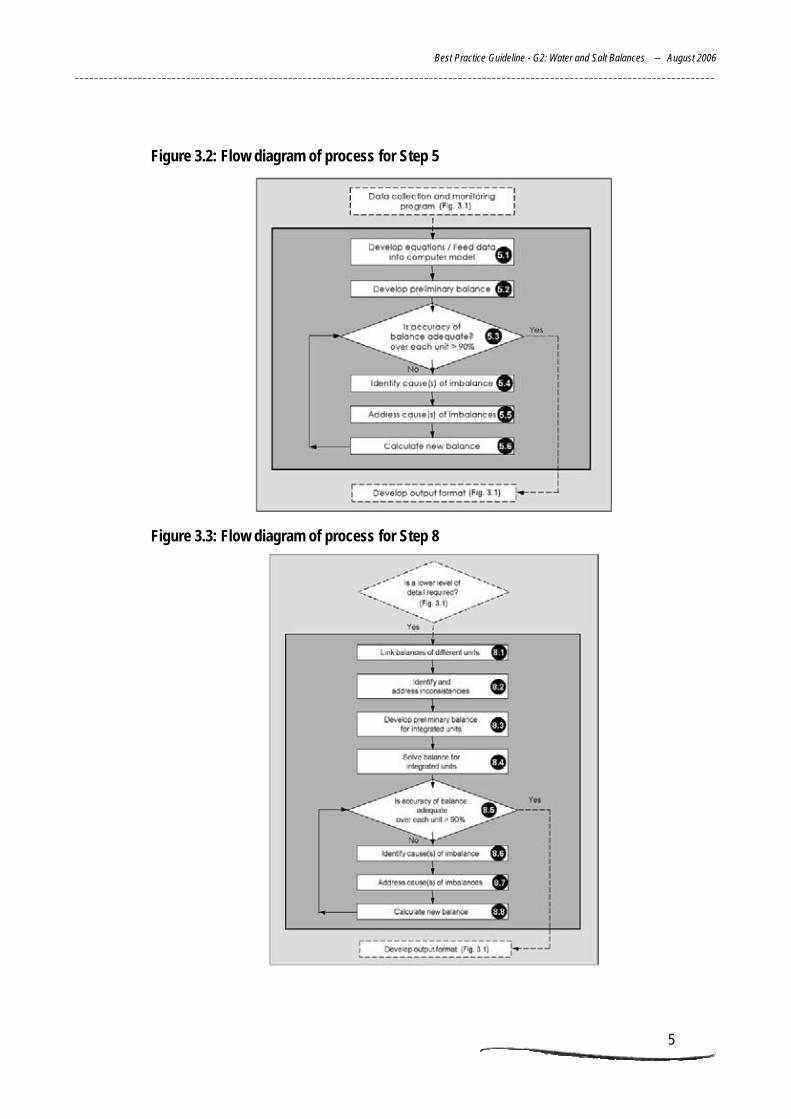
Figure 3 2: Flow diagram of process for Step 5
Figure 3 3: Flow diagram of process for Step 8
Best Practice Guideline - G2: Water and Salt Balances -- August 2006
____________________________________________________________________________________________________________________________________
6 76 7
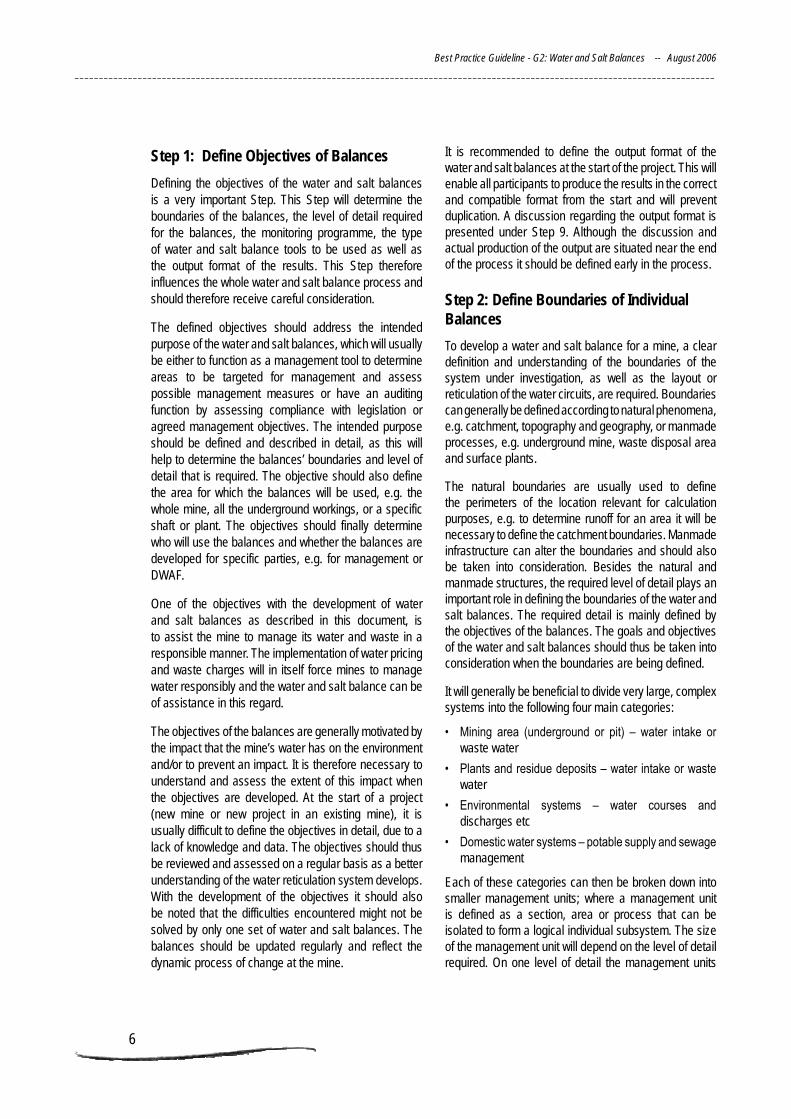
Step 1: Define Objectives of Balances
Defining the objectives of the water and salt balances is a very important Step. This Step will determine the boundaries of the balances, the level of detail required for the balances, the monitoring programme, the type of water and salt balance tools to be used as well as the output format of the results. This Step therefore influences the whole water and salt balance process and should therefore receive careful consideration.
The defined objectives should address the intended purpose of the water and salt balances, which will usually be either to function as a management tool to determine areas to be targeted for management and assess possible management measures or have an auditing function by assessing compliance with legislation or agreed management objectives. The intended purpose should be defined and described in detail, as this will help to determine the balances’ boundaries and level of detail that is required. The objective should also define the area for which the balances will be used, e.g. the whole mine, all the underground workings, or a specific shaft or plant. The objectives should finally determine who will use the balances and whether the balances are developed for specific parties, e.g. for management or DWAF.
One of the objectives with the development of water and salt balances as described in this document, is to assist the mine to manage its water and waste in a responsible manner. The implementation of water pricing and waste charges will in itself force mines to manage water responsibly and the water and salt balance can be of assistance in this regard.
The objectives of the balances are generally motivated by the impact that the mine’s water has on the environment and/or to prevent an impact. It is therefore necessary to understand and assess the extent of this impact when the objectives are developed. At the start of a project (new mine or new project in an existing mine), it is usually difficult to define the objectives in detail, due to a lack of knowledge and data. The objectives should thus be reviewed and assessed on a regular basis as a better understanding of the water reticulation system develops. With the development of the objectives it should also be noted that the difficulties encountered might not be solved by only one set of water and salt balances. The balances should be updated regularly and reflect the dynamic process of change at the mine.
It is recommended to define the output format of the water and salt balances at the start of the project. This will enable all participants to produce the results in the correct and compatible format from the start and will prevent duplication. A discussion regarding the output format is presented under Step 9. Although the discussion and actual production of the output are situated near the end of the process it should be defined early in the process.
Step 2: Define Boundaries of Individual Balances
To develop a water and salt balance for a mine, a clear definition and understanding of the boundaries of the system under investigation, as well as the layout or reticulation of the water circuits, are required. Boundaries can generally be defined according to natural phenomena, e.g. catchment, topography and geography, or manmade processes, e.g. underground mine, waste disposal area and surface plants.
The natural boundaries are usually used to define the perimeters of the location relevant for calculation purposes, e.g. to determine runoff for an area it will be necessary to define the catchment boundaries. Manmade infrastructure can alter the boundaries and should also be taken into consideration. Besides the natural and manmade structures, the required level of detail plays an important role in defining the boundaries of the water and salt balances. The required detail is mainly defined by the objectives of the balances. The goals and objectives of the water and salt balances should thus be taken into consideration when the boundaries are being defined.
It will generally be beneficial to divide very large, complex systems into the following four main categories:
• Mining area (underground or pit) – water intake orwaste water
• Plantsandresiduedeposits–waterintakeorwastewater
• Environmental systems – water courses anddischarges etc
• Domesticwatersystems–potablesupplyandsewagemanagement
Each of these categories can then be broken down into smaller management units; where a management unit is defined as a section, area or process that can be isolated to form a logical individual subsystem. The size of the management unit will depend on the level of detail required. On one level of detail the management units
6 7
Best Practice Guideline - G2: Water and Salt Balances -- August 2006
____________________________________________________________________________________________________________________________________
6 7
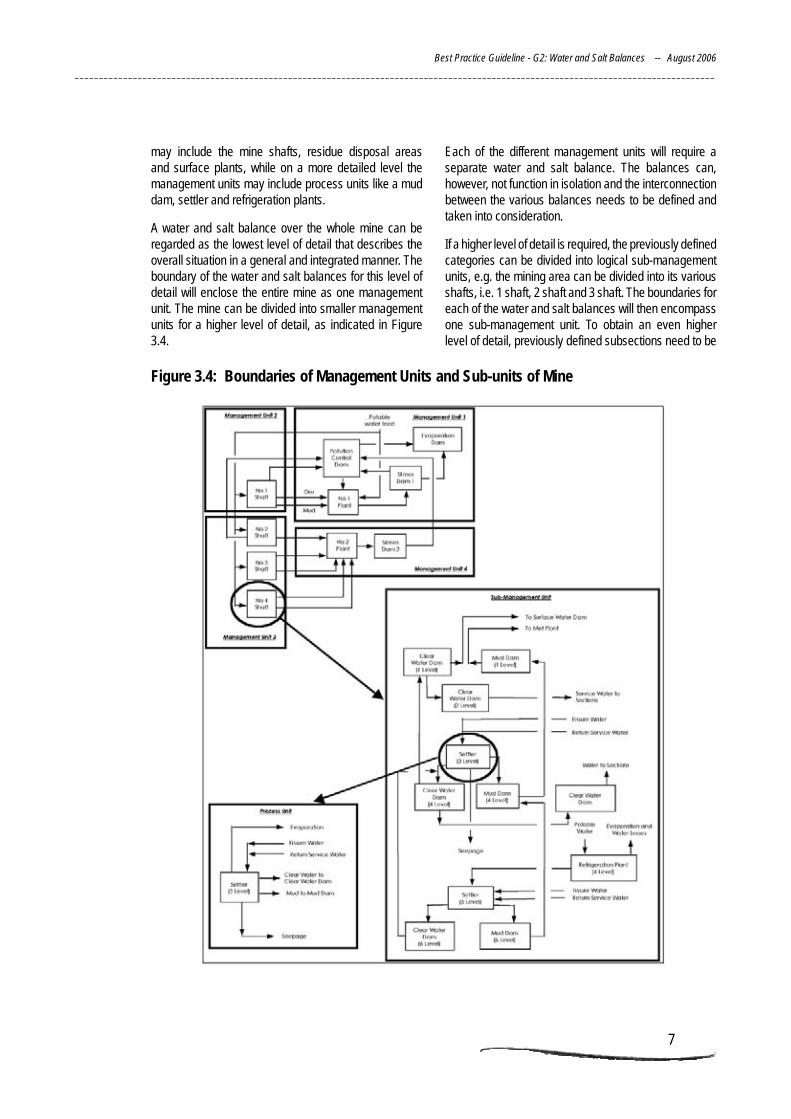
may include the mine shafts, residue disposal areas and surface plants, while on a more detailed level the management units may include process units like a mud dam, settler and refrigeration plants.
A water and salt balance over the whole mine can be regarded as the lowest level of detail that describes the overall situation in a general and integrated manner. The boundary of the water and salt balances for this level of detail will enclose the entire mine as one management unit. The mine can be divided into smaller management units for a higher level of detail, as indicated in Figure 3.4.
Each of the different management units will require a separate water and salt balance. The balances can, however, not function in isolation and the interconnection between the various balances needs to be defined and taken into consideration.
If a higher level of detail is required, the previously defined categories can be divided into logical sub-management units, e.g. the mining area can be divided into its various shafts, i.e. 1 shaft, 2 shaft and 3 shaft. The boundaries for each of the water and salt balances will then encompass one sub-management unit. To obtain an even higher level of detail, previously defined subsections need to be
Figure 3 4: Boundaries of Management units and Sub-units of Mine
Best Practice Guideline - G2: Water and Salt Balances -- August 2006
____________________________________________________________________________________________________________________________________
8 98 9
divided into their different components, which will usually coincide with the major operating equipment, e.g. 1 shaft can be divided into stopes, fridge plants, settlers, clear water dams and mud dams. A water and salt balance must then be done for each of these unit processes.
Different degrees of detail may be required for the different management units, depending on the importance of the major management unit. The major management units will thus be broken down into different levels of detail.
Step 3: Identify all Water Circuits and Develop Schematic Flow Diagram
After the boundaries of the water and salt balances have been defined the development of the water and salt balances can start. The first Step in this process is to understand the layout of the water systems. This requires the identification of all the process units and flow paths within the identified boundaries.
It is usually easier to understand and interpret the water and salt balances if the water reticulation system is represented schematically as a flow diagram. The initial schematic representation needs to indicate all the water flow paths, as well as the existing monitoring points for the reticulation system. A complete and accurate schematic representation of the mine’s water circuits is required to ensure that all the relevant streams are included in the balances. The water circuits on gold and coal mines can be divided into the following broadly defined categories:
• Surfaceenvironmentalcircuits
• Groundwaterenvironmentalcircuits
• Miningcircuits(undergroundandopencast)
• Metallurgicalplantcircuits
• Discarddumpcircuits
• Slurrydamcircuits(slimesortailings)
• Coalwashingplantcircuits
• Generaldomesticcircuits
Constructed water flow paths, e.g. intake or discharge streams, are easily definable, but natural water flow paths, e.g. seepage, rain and evaporation, are more difficult to define. In the development of a generic definition of the water reticulation system, it is important to identify all the relevant flow paths, e.g. bed losses, evapotranspiration and influx of fissure water. Appendix B provides a list of flow paths that usually need to be taken into consideration when a water reticulation flow diagram is developed. To identify the flow paths, it is
advisable to determine all the relevant flow paths for each process unit. A minimum level of detail is recommended, as shown in the schematic diagrams in Appendix B for some of the more common unit processes encountered in mine water circuits
When the water reticulation system for the mine has been developed and all the relevant water circuits have been identified, the process of developing a monitoring programme and collecting the necessary data can commence.
Step 4: Data Collection and Monitoring Programme
To have an efficient monitoring programme and to ensure that the samples are referring to the correct sampling locations, it will be necessary to label all the streams. The labeling of the streams should preferably be done in a logical and systematic manner in accordance with a mine-wide approach.
To develop a water and salt balance it is necessary to collect data of flow rates, dam volumes and water quality relevant to the identified water circuits. Existing data needs to be evaluated in order to determine where flow and quality data are not available, or where the data is outdated, unreliable or insufficient. The areas in the water reticulation system where there are insufficient data must then be identified and a monitoring programme developed to collect sufficient data at these identified locations. Monitoring is discussed in detail in BPG G3: Water Monitoring Systems and only a few relevant points will be mentioned here.
The level of monitoring needs to take into consideration the significance of the point relative to the overall water and salt balance and the accuracy required at the point, as discussed in Chapter 2. The monitoring programme should also take into consideration whether the water and salt balance is to assess missing flows or for compliance monitoring, which may have different requirements for location and accuracy.
To ensure that the correct water quality data is collected, it is important that the correct conservative salt(s) are identified before the monitoring programme is developed, as discussed in Chapter 2.
The integrity of the water and salt balances relies heavily on the accuracy of the collected data. It is thus important to ensure that the correct methodology is followed to
8 9
Best Practice Guideline - G2: Water and Salt Balances -- August 2006
____________________________________________________________________________________________________________________________________
8 9
collect and interpret the data. Data collection is described in more detail in BPG G3: Water Monitoring Systems.
Values for some of the circuits, which need to be determined, cannot be measured directly or else the monitoring equipment to measure these values is too expensive. Some of the methods that can be applied to determine these values are discussed in Appendix C: Quantifying complex influences.
Step 5: Develop and Solve Balances for units
Step 5 1: Develop all Relevant equations or Feed Data Into Computerised System
Once all the required data have been collected and assessed, they can be used in the mathematical equations. If the water and salt balances are done manually or in a spreadsheet, it will require the development of the necessary equations over each unit, as discussed in Chapter 2 and illustrated in the example in Appendix A. If the water and salt balances are developed with the aid of a computer software package, the model for the specific balances must be developed first before the data can be fed in as input data for the computerised model.
The equations for water balances are based on the principle that the mass of water that enters a system must equal the mass of water that exits the system, with the prerequisite that no chemical reaction that changes the water quantity, has taken place within the system. Water circuits within gold and coal mines are usually not subject to chemical or physical reactions where the mass of water is either reduced or increased. The conservation of mass equation can be simplified under these circumstances:
Total water in (volume flow rate) = Total water out (volume flow rate) (5.1)
Equation 5.1 should be based on actual flow rate measurements where possible and must include all flow streams shown in schematic diagrams developed in terms of Step 3. If sufficient information is available, the non-determined flow rates, i.e. flow rates that have not been measured or determined by means of modelling or other calculations as indicated in Step 3, can be calculated from the balance. To solve the mathematical water balance, it will be necessary to develop (n) equations for (n) unknown variables, where (n) indicates the number of equations or variables. Over one unit process, e.g.
a settler, it is possible to develop one equation for the water balance, i.e. the sum of the flow rates for the inflow streams equals the sum of the flow rates for the outflow streams. For this single equation only one flow rate may be unknown to solve the equation. Together with the water balance equations for the other unit processes, if there are for example 7 unit processes in the management unit, it may be possible to develop 7 equations. With these seven equations it may be possible to calculate the unknown flow rates of seven streams. If there are more unknown variables than equations, it will be necessary to either implement a monitoring programme to measure the unknown flows or to make sound motivated technical and scientific assumptions. The water balances can also be solved by means of simultaneous solution if the equations for the salt balance have been developed.
The same basic principles for the water balance are applicable to the salt balance, i.e. the conservation of mass across a system:
Total salt load in = Total salt load out (5.2)
where:
Salt load (kg/day)
= Flow (m3/day) x Salt concentration (kg/m3)
= Flow (m3/day) x 0.001 x Salt concentration (mg/l) (5.3)
Each of the water circuits must have a salt concentration, which will be used together with the flow rate to determine the salt load of each circuit, as indicated in equation 5.3. The “salt concentration” may either refer to the concentration of a specific salt or the TDS concentration. The concentrations of the various salts and the TDS are determined fairly accurately in a laboratory. Formulae for the various units need to be developed based on equation 5.2. These formulae can be used in conjunction with the formulae developed for the water balances in order to solve the equations simultaneously, provided that there are (n) equations for (n) unknown variables. An example of how this method is applied is illustrated with the solving of equations 11 - 14 in the worked example in Appendix A.
Although it is theoretically possible to calculate three unknowns by developing equations with flow and two salts, this is not recommended, as it will lead to increased error. There are limitations as to when more than one salt can be used for simultaneous solutions of equations, i.e. one needs to be sure that the different salts do not describe the same equation. When selecting the salt to use in the salt balance for the determination of missing
Best Practice Guideline - G2: Water and Salt Balances -- August 2006
____________________________________________________________________________________________________________________________________
10 1110 11
streams, it is important to ensure that it is a conservative salt such as Na, Cl, etc. Although TDS or EC includes non-conservative salts, it is often used for salt balance purposes. Salts such as sulphate are generally not used in mining water and salt balances to determine missing streams or data, unless sulphate generation from pyrite oxidation is explicitly included as a salt load input. It is, however, more appropriate to use TDS, EC and sulphate in salt balances when pollution loads and discharge compliance requirements are under consideration.
Elements such as calcium, phosphate, nitrate, heavy metals and other compounds are regarded as non-conservative salts as they are usually subject to biological metabolisation or chemical precipitation. These elements cannot be used in a salt balance unless factors can be applied which account for the metabolic and precipitated losses.
Iterative Process to Develop Balance
The solving of the water and salt balances is an iterative process, which consists of the following Steps, as indicated in Figure 3.2:
• Developpreliminarybalance
• Assessaccuracyofpreliminarybalance
• Identifycausesofimbalances
• Addresscausesofimbalances
• Calculatebalancewithnewvalues
Step 5 2: Develop Preliminary Balance
In order to obtain a balance over a management unit, the equations for the various process units within the management unit need to be calculated by means of simultaneous solution, as discussed in Chapter 2 and illustrated in the example of Appendix A, either manually or by means of a computerised system. If all the data for a specific process unit have been measured, it is highly unlikely that an exact balance will be obtained over the unit, due to inaccuracies of measuring/ monitoring equipment. Unknown data can be calculated with the simultaneous solution of equations, taking into consideration that the amount of unknown variables must equal the amount of equations. The calculations of the equations will also have to take the interconnecting streams between the various process units into consideration, as the inlet stream of one process unit may for example require the calculated value of an outflow stream of another process unit.
Step 5 3: Assess Accuracy of Balance
After a preliminary balance has been developed and an attempt to solve all the equations has been made, it will be necessary to assess the accuracy of the balance. The balance over each of the units needs to be more than 90% accurate to be regarded as sufficient. The method to determine the accuracy of a balance is discussed under Step 10. If an imbalance greater than 10% is found, the causes of the imbalance must be identified. If the imbalance is less than 10%, the accuracy of the overall balance needs to be assessed, as discussed under Step 10.
Step 5 4: Identify Causes of Imbalances
When all the equations have been calculated for each of the process units, the streams and units where there are imbalances need to be identified and the causes of the imbalances must be determined. The following Steps give an indication of some of the areas to consider during the process to identify the causes of an imbalance:
• Accountforallthecircuitsintheschematicdiagramsand the equations.
• Re-assessandevaluate theprocess flowdiagrams,especially the layout; and confirm that the streams linking the various units are correct and that there are no omissions or addition of units.
• Check all the calculations and make sure that theequations for each unit are correct.
• Check the data collection and monitoringmethodology.
• Checkthecalibrationofthemonitoringandmeasuringinstrumentation.
• Assess the validity of the collected data, includingthe water quality analyses and reporting from the laboratory.
• Re-evaluate the validity of all the assumptions andtry to eliminate the uncertainties by collecting more information or data, where possible.
Step 5 5: Address Causes of Imbalances
If additional data is required, the correct flow and water quality monitoring points need to be identified. The monitoring programme must be updated and the required data collected. The water and salt balances must then be updated with the additional data.
10 11
Best Practice Guideline - G2: Water and Salt Balances -- August 2006
____________________________________________________________________________________________________________________________________
10 11
Step 5 6: Calculate New Balance
The additional data that are used in the calculations, will result in new values for the water and salt balance. The newly calculated water and salt balances need to be assessed for any imbalances as indicated in Step 5.3. The process to minimise the imbalance is, therefore, an iterative process where problem areas are identified from the water and salt balance results, and the water and salt balances are updated with the additional data. When the required level of accuracy is reached, as discussed in Step 5.3, the iterative process can be stopped and the final water and salt balance can be produced.
Step 6: Develop Output Format
The output format for the balances with a higher level of detail is based on the same principles as for the balances with a lower level of detail. The output format for the balances with a lower level of detail is discussed under Step 9 and will not be repeated here.
Step 7: Assess level of Detail Required
The objectives, which have been defined at the beginning of the project, will determine the level of detail required for the specific water and salt balance. Objectives from different departments and management often require water and salt balances with different degrees of detail. If a lower level of detail is required it will be necessary to integrate the different units as discussed under Step 8. If a lower level of detail is not required a final validation assessment is required, as discussed under Step 10.
Steps 8 1 – 8 8: Develop and Solve Balances for lower level of Detail
If, in Steps 1 and 2, it was decided to divide the overall mine water balance into different sub-management units, then, once each sub-management unit has been balanced, it will be necessary to establish and validate the linkages between them. Any inconsistency with linkages between two balances needs to be identified. Causes for these inconsistencies must be determined and should be addressed accordingly. This process is similar to that discussed under Step 5.4 and will lead to a preliminary water and salt balance. The process to develop water and salt balances for the integrated management units is depicted in Figure 3.3 and is similar to that for the individual management units as discussed under Step 5 and illustrated in Figure 3.2, and will not
be repeated here. The difference that should be noted is that this balance integrates the results from balances with a higher level of detail, to produce balances with a lower level of detail.
This integration of all the water and salt balances on each of the different levels of detail will result in a hierarchy of water and salt balances that have different degrees of detail, where the overall mine water and salt balance has the lowest degree of detail and the water and salt balance for a process unit will have the highest degree of detail. This is illustrated in Figure 3.4. The various levels of detail enable the overall water manager to focus on the global aspects of the mine while other responsible persons can manage their individual plants or shafts at a much greater level of detail.
The integration of all the different water and salt balances on one level, as well as different levels can become very complex, due to the interactions of models developed by different people. It is, therefore, suggested that a standard format for water and salt balance models be developed for a mining company. This standard format needs to address aspects such as:
• Layoutandflowdiagrams.
• Identification of streams and units, i.e. names andlabels.
• Electronicformat,e.g.softwaretobeused.
• Formatofinputandoutputdata.
Step 9: Define and Develop all Output Formats
The output data of the water and salt balances consists of the results of the calculations and needs to be presented in a user-friendly format. Lists and tables are usually not effective for this type of presentation, and should be avoided as far as possible. Schematic and graphical formats are more appropriate ways to present the results. The presentation of the results as well as the detail of data to be presented will depend on the objectives set out at the beginning of the process in Step 1. The mine’s management team will, for example, require less detail for the overall water management of the mine, and it will most likely be based on the water and salt balance for the entire mine. The mine’s environmental specialist, on the other hand, needs to identify specific pollution sources, which will most likely require detailed water and salt balances. As part of the quality assurance program, the output format should be assessed to ensure that it achieves the desired information transfer.
Best Practice Guideline - G2: Water and Salt Balances -- August 2006
____________________________________________________________________________________________________________________________________
12 1312 13
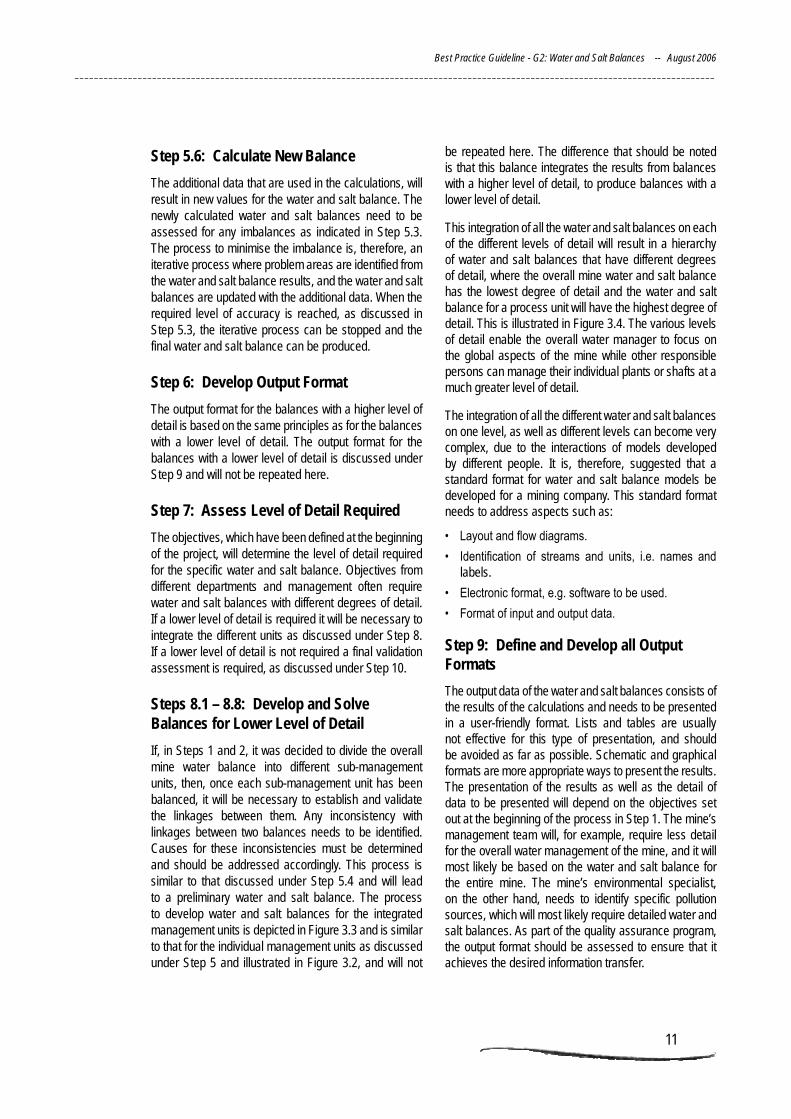
Figure 3 5: Pie Chart showing salt loads from different sources
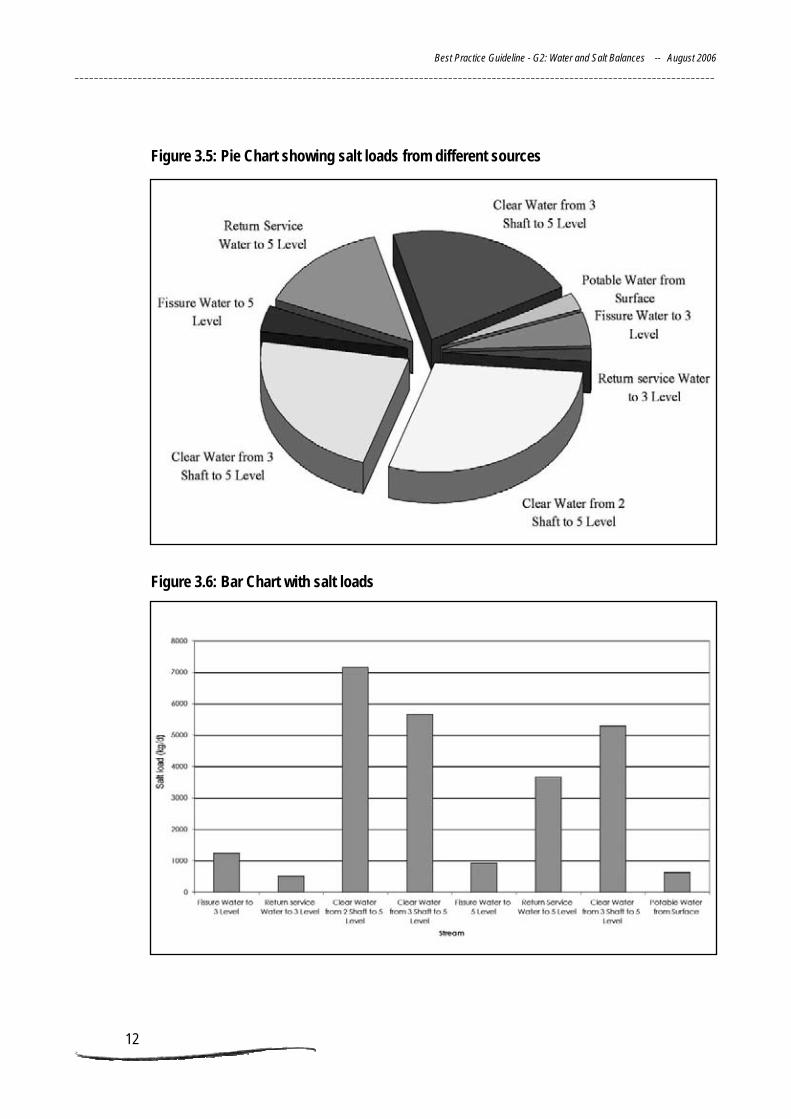
Figure 3 6: Bar Chart with salt loads
12 13
Best Practice Guideline - G2: Water and Salt Balances -- August 2006
____________________________________________________________________________________________________________________________________
12 13
The most commonly used format for presenting data for a single scenario is to plot the flow and quality data on the schematic line diagram, as illustrated in Figures A9 and A10 in the example of Appendix A. Caution must be taken not to clutter the diagram with too much information, and to indicate clearly which data belongs to which stream. This method of presentation has the advantage that one can follow the various water circuits and see changes of water qualities over units easily. To maintain this advantage, the data must be indicated on the diagram itself and not referenced as a list. Presenting the data on the schematic line diagram is, however, limited to single scenarios and is not suitable for comparing different scenarios with each other.
When the salt load contributions of various points are to be compared, it is useful to present the results by means of pie charts or bar charts, as illustrated in Figures 3.5 and 3.6. The total salt load at various points can be presented on the same pie chart or bar graph. This makes it easy to compare the different salt loads with each other and determine where the main sources of pollution are.
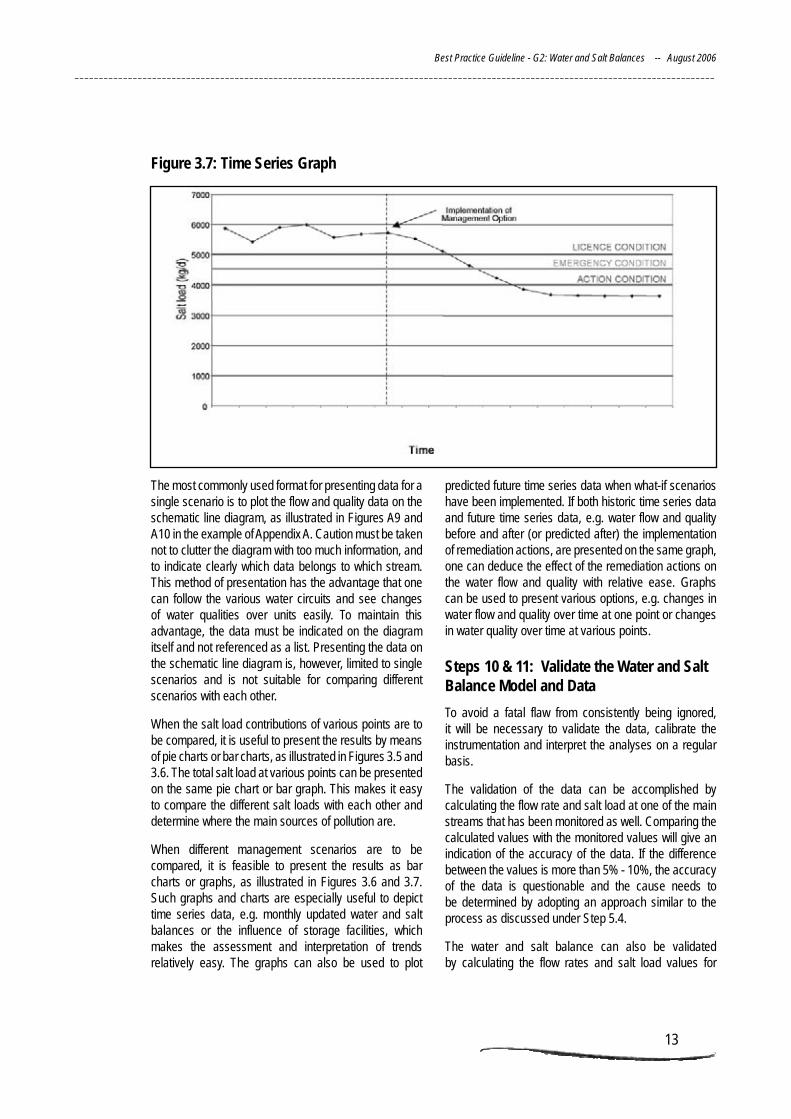
When different management scenarios are to be compared, it is feasible to present the results as bar charts or graphs, as illustrated in Figures 3.6 and 3.7. Such graphs and charts are especially useful to depict time series data, e.g. monthly updated water and salt balances or the influence of storage facilities, which makes the assessment and interpretation of trends relatively easy. The graphs can also be used to plot
predicted future time series data when what-if scenarios have been implemented. If both historic time series data and future time series data, e.g. water flow and quality before and after (or predicted after) the implementation of remediation actions, are presented on the same graph, one can deduce the effect of the remediation actions on the water flow and quality with relative ease. Graphs can be used to present various options, e.g. changes in water flow and quality over time at one point or changes in water quality over time at various points.
Steps 10 & 11: Validate the Water and Salt Balance Model and Data
To avoid a fatal flaw from consistently being ignored, it will be necessary to validate the data, calibrate the instrumentation and interpret the analyses on a regular basis.
The validation of the data can be accomplished by calculating the flow rate and salt load at one of the main streams that has been monitored as well. Comparing the calculated values with the monitored values will give an indication of the accuracy of the data. If the difference between the values is more than 5% - 10%, the accuracy of the data is questionable and the cause needs to be determined by adopting an approach similar to the process as discussed under Step 5.4.
The water and salt balance can also be validated by calculating the flow rates and salt load values for
Figure 3 7: Time Series Graph
Best Practice Guideline - G2: Water and Salt Balances -- August 2006
____________________________________________________________________________________________________________________________________
14 1514 15
the same pathway with two different approaches. This can be done for example by calculating the flow rate and salt load for the clear water outflow stream from a settler, by means of separate balances over the settler and the clear water dam. If the difference between the two calculated values is more than 5% - 10% the accuracy of the balance is questionable and the cause of the imbalance needs to be determined, similar to the process as discussed under Step 5.4.
It is recommended to validate data for more than one stream, as this will increase the confidence in the balance. The more data that is validated, the higher the confidence in the balance, as more values are double checked. The validation of more data may require more monitoring points and an optimum trade off between the required level of confidence and the additional monitoring costs should be determined.
3 2 Ongoing Management and use of Water and Salt Balances
Once a suitably accurate water and salt balance has been prepared, it is important that a review and management programme be developed and implemented in order to actively manage the water systems on the basis of the information provided by the balances. Key elements of such an ongoing management system include:
• Developanddefineevaluationandactioncriteriaforbalance outputs.
• Develop and implement management structuresto collect data, prepare balances, keep balance networks up to date and evaluate balance outputs.
• Developbalancereportingsystems.
In terms of the first element of the management system, it is important to identify key points within the overall balance system where attention can be focused. As most mining water reticulation systems are very complex, failure to do this may lead to a situation where the water management staff are completely overloaded with information to the point where critical data are missed. It is recommended that the following types of evaluation and action criteria are developed:
• Confirmthatallprocessunitsandtheoverallsystemare in balance.
• Confirmthatlinkagesbetweendifferentmanagementunits are consistent in terms of data values.
• Identify key input and output flow paths and setnorms/standards for the flow and salt load values at these points - evaluate data in terms of compliance with these standards.
It is very important to ensure that the water and salt balances are regularly updated with the latest data according to a defined monitoring programme. To ensure that this happens, a responsible person should be appointed to collect the data according to a prescribed protocol, which covers all elements of the data collection and reporting system. It should thus be noted that water and salt balances are dynamic in that they may change frequently in accordance with changes at the site.
While data is being collected, it should be reviewed on a regular basis to identify trends. Once a suitable data set has been developed (i.e. 12 - 24 months of data), the complete data set should be reviewed. The purpose of such a review would be to confirm the identified trends in the data and to undertake a thorough statistical analysis of the data. These actions will enable one to define an average value and the range around this average that can be considered to represent deviations consistent with normal operating conditions. The effect of seasonal changes should be taken into consideration when the data is interpreted. This information can then be used to set action limits that indicate deviation from normal operating conditions for key points within the system. The water and salt balance system can then be managed by deviation from set points.
Once the water and salt balance system is operating smoothly, it should then be used as a water management tool, which may include:
• Identificationofpointswithinthesystemwherewatermanagement practices can be improved. This may include auditing the water usage from various sources and identifying points of high water consumption or wastage.
• Assisting with identifying and quantifying waterstorage requirements.
• Simulating positive or negative effects of variousmanagement options before they are implemented. In fact, water management options and changes to the water reticulation system should not be implemented before their effects have first been evaluated using the water and salt balances.
• Assisting with design and optimisation of a watermonitoring system.
• Assistingwith locatingandquantifyingseepageandleakage, as well as pollution sources.

14 15
Best Practice Guideline - G2: Water and Salt Balances -- August 2006
____________________________________________________________________________________________________________________________________
14 15
Various tools exist for the preparation of water and salt balances. They can be grouped into four categories:
1. Manual calculations
2. Spreadsheet based models and calculations
3. Stand alone PC-based software programs
4. High-end engineering software
The different types of water and salt balance tools have different applications and are therefore suitable for different scenarios. To determine which of the tools to use in a specific situation one should assess the advantages and disadvantages of each of the tools and take the objectives (Step 1) that must be achieved into consideration.
4 1 Manual Calculations of Water and Salt Balances
Manual calculations are most suitable for a screening level scenario where answers are required relatively quickly and only on a once-off basis. The water and salt balances should be of a small scale and relatively simple. The advantages of manually calculated water and salt balances are:
• Theresultsofthewaterandsaltbalancescanbeproducedrelativelyquickly,ifthesystemis small and simple.
• No specialized equipment, e.g. computers and software, besides a hand calculator isrequired.
The disadvantages of manually calculated water and salt balances are:
• Forlargerandmorecomplexwaterandsaltbalancesthecalculationsaretimeconsuming.
• Thecalculationsaremorepronetohumanerror.
• Presentationoftheresultsistimeconsuming.
• Repetitivecalculationsaretimeconsuming,whichmakesthemodelingofdifferentscenarioscumbersome.
4 2 Spreadsheet Based Balances
Spreadsheet based water and salt balances are suitable for a wide variety of water and salt balances, which are relatively uncomplicated. The advantages of these types of balances are:
• Calculationsaredoneautomatically.
• Dataandresultscanbeviewedrelativelyeasyinvariousways,e.g.graphsortables.
• Datatransferiseasy.
The disadvantages of spreadsheet based water and salt balances are:
• Setting-upthespreadsheetsistimeconsumingandverycostly.
• Changesinthelayoutofthesystemand/ortheflowdiagramsmayrequirearedesignandcomplete overhaul of the spreadsheets.
• Anexternalconsultantoranin-housespecialistisusuallyrequiredtodevelopthemodelandupdate it when necessary.
4MeThODS TO CAlCulATe
WATeR AND SAlT BAlANCeS
Best Practice Guideline - G2: Water and Salt Balances -- August 2006
____________________________________________________________________________________________________________________________________
16 1716 17
• Spreadsheets are not well suited for use as amanagement tool due to the difficulty of evaluating different management options.
If the water and salt balance system is to perform a useful management function it must be able to be changed to allow the evaluation of different management options or questions. This desire for flexibility will preclude the use of manually calculated balances and also makes spreadsheet-based systems very difficult and costly to use, unless the designer of the spreadsheet is the same mine employee who has responsibility for water and salt balances.
4 3 Stand-alone PC-based Software Programs
Software programmes that have been specifically designed for water and salt balances are suitable for the type of water and salt balances as discussed under Step 5.1. It is mostly used for large, complex reticulation systems, due to the fact that manual and spreadsheet based tools are cumbersome for these conditions. The advantages of software programmes for water and salt balances are:
• TheyareuserfriendlyandusuallyWindowsbased.
• Easytodrawflowdiagramsandtofeedinputdata.
• Changes to data and flow diagrams can be doneeasily and instantaneously.
• Calculationsaredoneautomatically.
• Data can be viewed instantaneously after eachcalculation in various output formats, e.g. spreadsheet and flow diagram format.
• Allowsfor“what-if”scenarios.
• Can create balances with large amount of streamsand high degree of complexity.
• Can be used effectively as a water managementtool.
• Cheaper than spreadsheet systems due to ease ofuse and time saving.
The disadvantages of software programmes for water and salt balances are:
• Therelevantsoftwarepackagemustbepurchased.
• Trainingtousethesoftwarepackageisrequired.
• The assumptions and limitations inherent in thesoftware package must be understood and taken into consideration.
4 4 high-end engineering Software
High-end engineering software is software developed for engineering design purposes which includes the calculation of mass balances. Water and salt balances can therefore be developed with high-end engineering software, as water and salt balances form a sub-section of the mass balances. These software programmes are generally used under the same conditions that are applicable for the specialised software programmes discussed under 4.3. The advantages of the high-end engineering programmes are the same as for the specialised software programmes as indicated in 4.3. The disadvantages of these programmes are:
• Needtopurchaseveryexpensivesoftware.
• Requirespecialisttrainingtousethesoftware.
• Datarequirementsmaybeofahigher-orderthanforthe software mentioned in 4.3.
16 17
Best Practice Guideline - G2: Water and Salt Balances -- August 2006
____________________________________________________________________________________________________________________________________
16 17
Ashton, P.J. 1993. Personal communication.
Black, T.A. and Kelliher, F.M. 1989. Processes controlling under-storey evapotranspiration. Phil. Trans. R. Soc. Lond. B. 207 – 231.
Brezny, O., Metha, I. And Sharma, R.K. 1973. Studies on Evapotranspiration of some Aquatic Weeds in Weed Science Vol. 21, No. 3, pp. 197 – 204.
Chamber of Mines of South Africa, 1981. Handbook of Guidelines for Environmental Protection, Vol 3/1981: The Rehabilitation of Land Disturbed by Surface Coal Mining in South Africa.
Debo, T.N. and Reese, A.J. 1995 Municipal storm water management. Florida: CRC Press.
Dye, P.J., Olbrich, B.W. and Everson, C.S. 1995. The water use of plantation forests and mountain grassland in summer-rainfall forestry regions of South Africa. In: Proceedings of the Seventh South African National Hydrological Symposium, Grahamstown, 4-6 September, 1995.
Everson, C.S. 1993. Comparative estimates of evaporation from a Eucalyptus plantation and grassland. In: Proceedings of the Sixth South African National Hydrological Symposium, Volume 1. (Eds. S.A. Lorentz, S.W. Kienzle and M.C. Dent), 8 – 10 September 1993, University of Natal, Pietermaritzburg. pp 43-52.
Ferguson, B.K. and Debo, T.N., 1990. On-site storm water management: Application for landscaping and engineering. New York: Van Nostrand Reinhold.
Gary, M., McAfee, R. and Wolf, C.L. 1977. Glossary of Geology. Washington: American Geological Institute.
Hammer, A. 1992. Creating Freshwater Wetlands. Lewis Publishers.
Hemp, R. 1982. Psychrometry in Environmental Engineering in South Africa. The Mine Ventilation Society of South Africa
Krebs, C.J. 1985. Ecology: The Experimental Analysis of Distribution and Abundance (Third Edition). New York: Harper and Row
Maron, S.H. and Lando, J.B. 1974. Fundamentals of Physical Chemistry. New York: Macmillan Publishing Co. Inc.
Masterton, W.L., Slowinski, E.J. and Stanitski, C.L. 1985. Chemical Principles (Sixth Edition). New York: Saunders College Publishing.
Pulles, W., Howie, D., Otto, D. and Easton, J. 1996. A Manual to Assess and Manage the Impact of Gold Mining Operations on the Surface Water Environment (WRC Report No. TT79/96). Water Research Commission.
Pulles, W, Heath, R. and Howard M.R. 1995. A Manual on Mine Water Treatment and Management Practices in South Africa. (WRC Report No. TT80/96). Water Research Commission.
Savage, M.J., Everson, C.S. and Metelerkamp, B.R. 1997. Evaporation Measurements Above Surface Using Micro-Meteorological Techniques (WRC Report No.: 349/1/97). Pretoria: Water Research Commission.
5ReFeReNCeS
Best Practice Guideline - G2: Water and Salt Balances -- August 2006
____________________________________________________________________________________________________________________________________
18 1918 19
Smith, J.M. 1981. Chemical Engineering Kinetics (Third Edition). New York: McGraw-Hill Book Company.
Smith, J.M. and Van Ness, H.C. 1988. Introduction to Chemical Engineering Thermodynamics (Fourth Edition). New York: McGraw-Hill Book Company.
SoilCover, 1997. Unsaturated Soils Group, Department of Civil Engineering, University of Saskatchewan, Saskatoon, Canada.
Van Zyl, W.H. and De Jager, J.M. 1997. Estimation of Plant and Soil Evaporation from Cropped Lands (WRC Report No.: 507/1/97). Pretoria: Water Research Commission.
Wanielista, M.P. 1978. Storm water management: Quantity and quality. Michigan: Ann Arbor Science.
Weier, T.E., Stocking, C.R., Barbour, M.G. 1974. Botany: An Introduction to Plant Biology. Fifth Edition. Wiley International Edition.
Wetzel, R.G. 1985. Limnology (Second Edition). New York: Saunders College Publishing.
18 19
Best Practice Guideline - G2: Water and Salt Balances -- August 2006
____________________________________________________________________________________________________________________________________
18 19
bedloss: Loss of water from a river through the river bed; usually occurs at geological faults and dykes.
chemical precipitation: When solutions of two different electrolytes are mixed, it is sometimes observed that an insoluble solid comes out of the solution. This solid is referred to as a precipitate. The chemical reaction is called a precipitation reaction. (Masterton, 1985)
closed water circuit: Water circuits which are not exposed to the natural environment, e.g. pipes and covered tanks.
conservative salt: A salt that will not undergo any changes such as geochemical generation, biological metabolism, chemical precipitation or dissolution.
constructed water flow paths:
Man-made water transport mechanisms, for example channels and pipes.
decant: Re-stabilisation of groundwater during and after mining will result in artificial discharge into surface water systems as well as groundwater systems.
dry-bulb temperature:
Sum of the thermometer temperature and the surrounding temperature.
electrical conductivity (EC):
Ions in a water solution conduct electrical currents. The more ions present in the water, the higher the electrical conductance and vice versa. The electrical conductance (EC) of a solution is thus an indication of the amount of ions present in the solution.
enthalpy: Enthalpy is explicitly defined for any system by the mathematical expression: H = U + PV, where U = internal energy, P = absolute pressure and V = volume. (Smith, 1988)
environmental circuit: Natural water systems that are present within the boundaries of the mine are defined as environmental circuits, like natural dams, wetlands, rivers and aquifers.
evapotranspiration: Actual evapotranspiration is a measure of solar radiation, temperature and rainfall; it is the amount of water pumped into the atmosphere by evaporation from the ground and by transpiration from the vegetation (Krebs, 1985).
interstitial water: Subsurface water in an interstice, sometimes referred to as pore water. The interstice is an opening or space in the soil that is not occupied by solid matter. (Gary, 1977)
iterative process: A mathematical iterative process can be described as a cyclical process. A value is estimated and used in the equations to determine an answer. The answer is evaluated and if the accuracy is not acceptable a new value is used in the equations to determine a new answer. This process continues until an answer with an acceptable accuracy is obtained.
moisture content (air): Mass of water vapour associated with unit mass of dry air.
GlOSSARy
Best Practice Guideline - G2: Water and Salt Balances -- August 2006
____________________________________________________________________________________________________________________________________
20 2120 21
non conservative salt: A salt which will undergo changes such as geochemical generation, biological metabolism, chemical precipitation or dissolution.
open water circuit: Water circuits that are open to the natural environment, e.g. rivers, dams and channels.
ore surface moisture: Layer of water on the surface of solid material.
precipitation: The discharge of water (as rain, snow, hail, or sleet) from the atmosphere upon the earth’s surface. (Gary, 1977)
psychrometry: The thermodynamics of mixtures of air and water vapour.
pyrite oxidation: Iron disulphide (FeS2), generally in the form of the mineral pyrite, is a common constituent
not only in coal but also of adjacent shales, slates, sandstones and other sedimentary rocks. In the undisturbed state, pyrite remains unchanged but when disturbed and exposed to air/oxygen it undergoes weathering with accompanying production of acidity. (Chamber of Mines of South Africa, 1981)
runoff:
Surface runoff is defined as the precipitation that finds its way into the stream channel without infiltration into the soil.
seepage: The act or process involving the slow movement of water or another fluid through a porous material such as soil. (Gary, 1977)
simultaneous solution: A set of equations can be solved by means of simultaneous solution if it is possible to develop the same number of equations as the number of unknown variables for the system. For example, if two equations can be developed for the two unknown variables a and b, e.g. a + b = 20 and a = 0.5b, then the two equations can be solved by substituting a in the first equation with the second equation. Thus 0.5b + b = 20 and b = 13.3. The value for b can then be substituted in the first equation and a can be solved as a = 6.7.
stream: A flow of water from one facility or natural feature to another with clear boundaries is referred to as a stream. A stream will for example refer to water flowing in a pipe from a dam to a river or water flowing in a channel from a tailings dam to an evaporation dam or the flow in a watercourse.
total dissolved solids (TDS):
A concentration term used to express the total amount of dissolved solids in a solution (normally expressed in mg/l).
unit, management: A management unit is defined as an area or process that forms a logical individual subsystem that can be isolated and have defined boundaries for water and salt balances.
vapour pressure: A liquid placed in a container will partially evaporate to establish a pressure of vapor above the liquid. The pressure established depends on the nature of the liquid and is, at equilibrium, constant at any given temperature. (Maron, 1974)
wet-bulb temperature: A wet-bulb thermometer consists of an ordinary thermometer, the bulb of which is covered with a cotton gauze, which is kept wet. Evaporation of water from the wet gauze results in the bulb being cooled to a temperature below the air temperature. The extent of the drop in temperature is a measure of the vapour pressure. (Hemp, 1982)
20 21
Best Practice Guideline - G2: Water and Salt Balances -- August 2006
____________________________________________________________________________________________________________________________________
20 21
# shaft
A constant (= 0.000644 oC)
CW clear water
CWD clear water dam
EC electrical conductivity
f constant (= 1.0048)
FW fissure water
H’wi
enthalpy of water vapour at dry-bulb temperature (kJ/kg)
H’wl
enthalpy of liquid water at wet-bulb temperature (kJ/kg)
H’wo
enthalpy of water vapour at wet-bulb temperature (kJ/kg)
Hai
enthalpy of dry air at dry-bulb temperature (kJ/kg)
Hao
enthalpy of dry air at wet-bulb temperature (kJ/kg)
M mud
Ma
molecular mass of air (= 28.9664)
MD mud dam
Mw
molecular mass of water (= 18.016)
n number/amount of
P pressure (kPa)
Pw
vapour pressure (kPa)
Pws
saturated vapour pressure (kPa)
ri
actual moisture content of air at wet-bulb temperature (kg/kg dry air)
ro
moisture content of saturated air at wet-bulb temperature (kg/kg dry air)
RSW return service water
SW service water
tdb
dry-bulb temperature (oC)
TDS total dissolved solids
twb
wet-bulb temperature (oC)
US EPA United States Environmental Protection Agency
v specific volume (m3/kg dry air)
w density (kg/m3)
WRC Water Research Commission
SyMBOlS OR ABBReVIATIONS
Best Practice Guideline - G2: Water and Salt Balances -- August 2006
____________________________________________________________________________________________________________________________________
22 2322 23
The following example gives an indication of how the methodology of water and salt balances is applied in a hypothetical case study. Figure A1 presents the layout of the whole mine. The specific example uses a gold mine, but the same principles apply to water and salt balances on other class A mines.
Step 1: Define Objectives and Output Format
The following objectives have been defined for the water and salt balances:
Water and salt balances are required for a gold mine to be used by the environmental manager to obtain an understanding of the water systems to assist with the development of a water management plan for the whole mine. Water and salt balances are also required by the environmental specialist to develop a water management plan for 1 shaft and to identify and quantify pollution sources. The water and salt balance can then also be used by management to assess the mine’s compliance with the relevant legislation and its licenses.
It was decided that a schematic line diagram would be sufficient for this first order balance.
Step 2: Define the Boundaries
The environmental manager requires water and salt balances for the whole mine. The boundary for these water and salt balances will thus enclose the entire mine, and can be subdivided into its main components, as indicated in Figure A1.
The environmental specialist will require detailed water and salt balances for 1 shaft, which will be subdivided into the main operating equipment, as illustrated in Figure A2.
Step 3: Identify all the Water Circuits and Develop Schematic Flow Diagram
The identification of all the relevant water circuits will require a more detailed investigation by the environmental specialist, than that which is required by the environmental manager. The investigation by the environmental manager will focus on the circuits as indicated in Figure A1, while the focus of the environmental specialist will be on the water circuits as indicated in Figure A2. The environmental specialist regarded seepage as insignificant. The net-evaporation from each open system has been identified, but to make the drawing less cluttered the evaporative losses are indicated as one stream, excluding the evaporation from the refrigeration plant.
Examples of the schematic line diagrams, which have been developed for the two different balances, are indicated in Figures A1 and A2. From the figures it is clear that different levels of detail are required for different applications of water and salt balances.
Step 4: Data Collection and Monitoring Program
The stream labels that were allocated by the environmental specialist are indicated in Figure A2. The development of a monitoring program, collection of data and the assessment of the data will be discussed in detail in Best Practice Guideline G3: Water Monitoring Systems. These aspects are also discussed in A Manual to Assess and Manage the Impact of Gold Mining Operations on the Surface Water Environment (Pulles, W, 1996).
Sodium (Na) was identified as the conservative salt. An example of typical results from a data collection program for the gold mine, used in this example, is indicated in Table A1. The data for the refrigeration plant on level 3 was received from the supplier.
APPeNDIX A: PRACTICAl
WORKeD eXAMPleS
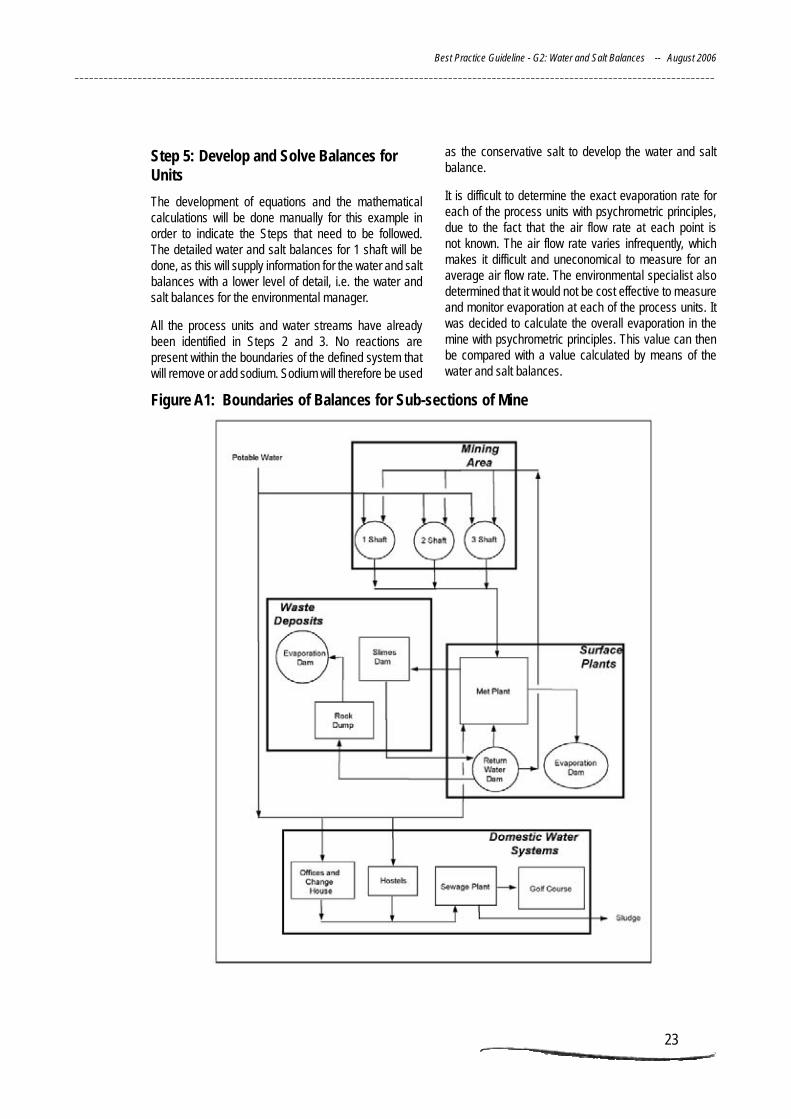
22 23
Best Practice Guideline - G2: Water and Salt Balances -- August 2006
____________________________________________________________________________________________________________________________________
22 23
Step 5: Develop and Solve Balances for units
The development of equations and the mathematical calculations will be done manually for this example in order to indicate the Steps that need to be followed. The detailed water and salt balances for 1 shaft will be done, as this will supply information for the water and salt balances with a lower level of detail, i.e. the water and salt balances for the environmental manager.
All the process units and water streams have already been identified in Steps 2 and 3. No reactions are present within the boundaries of the defined system that will remove or add sodium. Sodium will therefore be used
as the conservative salt to develop the water and salt balance.
It is difficult to determine the exact evaporation rate for each of the process units with psychrometric principles, due to the fact that the air flow rate at each point is not known. The air flow rate varies infrequently, which makes it difficult and uneconomical to measure for an average air flow rate. The environmental specialist also determined that it would not be cost effective to measure and monitor evaporation at each of the process units. It was decided to calculate the overall evaporation in the mine with psychrometric principles. This value can then be compared with a value calculated by means of the water and salt balances.
Figure A1: Boundaries of Balances for Sub-sections of Mine
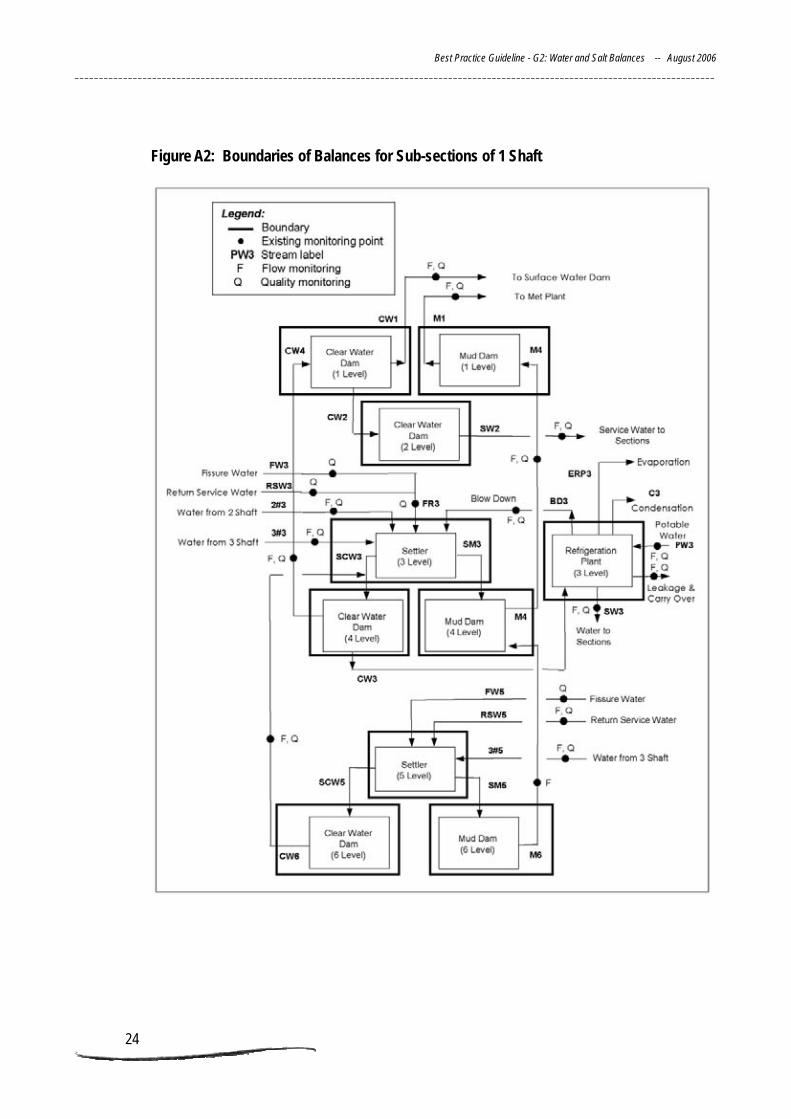
Best Practice Guideline - G2: Water and Salt Balances -- August 2006
____________________________________________________________________________________________________________________________________
24 2524 25
Figure A2: Boundaries of Balances for Sub-sections of 1 Shaft
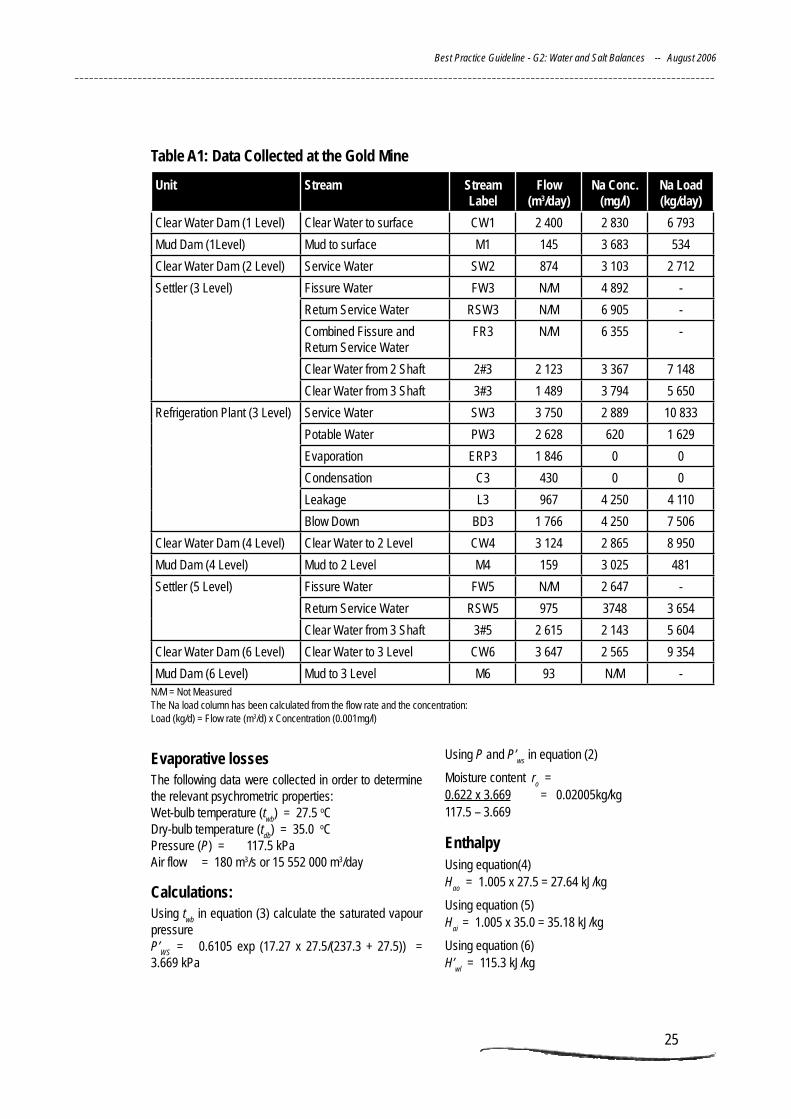
24 25
Best Practice Guideline - G2: Water and Salt Balances -- August 2006
____________________________________________________________________________________________________________________________________
24 25
Table A1: Data Collected at the Gold Mine
unit Stream Stream label
Flow (m3/day)
Na Conc (mg/l)
Na load (kg/day)
Clear Water Dam (1 Level) Clear Water to surface CW1 2 400 2 830 6 793
Mud Dam (1Level) Mud to surface M1 145 3 683 534
Clear Water Dam (2 Level) Service Water SW2 874 3 103 2 712
Settler (3 Level) Fissure Water FW3 N/M 4 892 -
Return Service Water RSW3 N/M 6 905 -
Combined Fissure and Return Service Water
FR3 N/M 6 355 -
Clear Water from 2 Shaft 2#3 2 123 3 367 7 148
Clear Water from 3 Shaft 3#3 1 489 3 794 5 650
Refrigeration Plant (3 Level) Service Water SW3 3 750 2 889 10 833
Potable Water PW3 2 628 620 1 629
Evaporation ERP3 1 846 0 0
Condensation C3 430 0 0
Leakage L3 967 4 250 4 110
Blow Down BD3 1 766 4 250 7 506
Clear Water Dam (4 Level) Clear Water to 2 Level CW4 3 124 2 865 8 950
Mud Dam (4 Level) Mud to 2 Level M4 159 3 025 481
Settler (5 Level) Fissure Water FW5 N/M 2 647 -
Return Service Water RSW5 975 3748 3 654
Clear Water from 3 Shaft 3#5 2 615 2 143 5 604
Clear Water Dam (6 Level) Clear Water to 3 Level CW6 3 647 2 565 9 354
Mud Dam (6 Level) Mud to 3 Level M6 93 N/M -N/M = Not Measured The Na load column has been calculated from the flow rate and the concentration: Load (kg/d) = Flow rate (m3/d) x Concentration (0.001mg/l)
evaporative lossesThe following data were collected in order to determine the relevant psychrometric properties:Wet-bulb temperature (t
wb) = 27.5 oC
Dry-bulb temperature (tdb
) = 35.0 oCPressure (P) = 117.5 kPaAir flow = 180 m3/s or 15 552 000 m3/day
Calculations:Using t
wb in equation (3) calculate the saturated vapour
pressureP’
WS = 0.6105 exp (17.27 x 27.5/(237.3 + 27.5)) =
3.669 kPa
Using P and P’ws
in equation (2)
Moisture content ro =
0.622 x 3.669 = 0.02005kg/kg117.5 – 3.669
enthalpyUsing equation(4) H
ao = 1.005 x 27.5 = 27.64 kJ/kg
Using equation (5) H
ai = 1.005 x 35.0 = 35.18 kJ/kg
Using equation (6) H’
wl = 115.3 kJ/kg
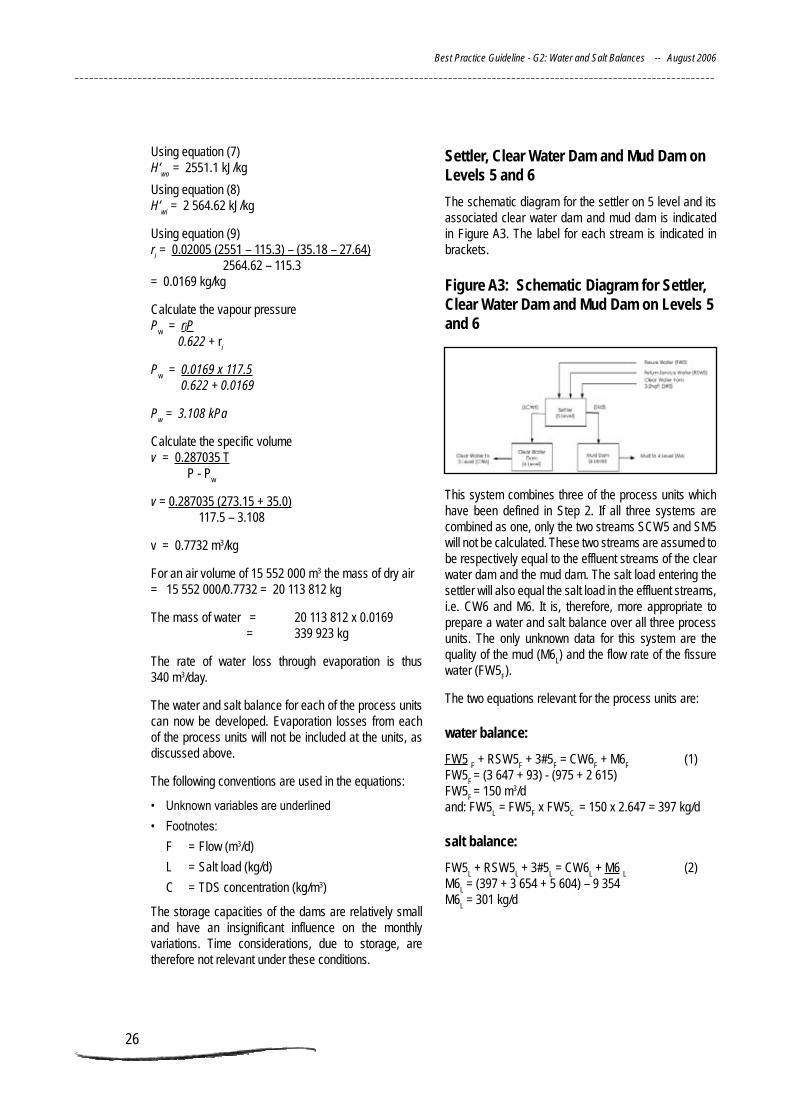
Best Practice Guideline - G2: Water and Salt Balances -- August 2006
____________________________________________________________________________________________________________________________________
26 2726 27
Using equation (7) H’
wo = 2551.1 kJ/kg
Using equation (8) H’
wi = 2 564.62 kJ/kg
Using equation (9) r
i = 0.02005 (2551 – 115.3) – (35.18 – 27.64)
2564.62 – 115.3 = 0.0169 kg/kg
Calculate the vapour pressure P
w = riP
0.622 + ri
P
w = 0.0169 x 117.5
0.622 + 0.0169
Pw = 3.108 kPa
Calculate the specific volume v = 0.287035 T P - P
w
v = 0.287035 (273.15 + 35.0) 117.5 – 3.108
v = 0.7732 m3/kg
For an air volume of 15 552 000 m3 the mass of dry air = 15 552 000/0.7732 = 20 113 812 kg
The mass of water = 20 113 812 x 0.0169 = 339 923 kg
The rate of water loss through evaporation is thus 340 m3/day.
The water and salt balance for each of the process units can now be developed. Evaporation losses from each of the process units will not be included at the units, as discussed above.
The following conventions are used in the equations:
• Unknownvariablesareunderlined
• Footnotes:
F = Flow (m3/d)
L = Salt load (kg/d)
C = TDS concentration (kg/m3)
The storage capacities of the dams are relatively small and have an insignificant influence on the monthly variations. Time considerations, due to storage, are therefore not relevant under these conditions.
Settler, Clear Water Dam and Mud Dam on levels 5 and 6
The schematic diagram for the settler on 5 level and its associated clear water dam and mud dam is indicated in Figure A3. The label for each stream is indicated in brackets.
Figure A3: Schematic Diagram for Settler, Clear Water Dam and Mud Dam on levels 5 and 6
This system combines three of the process units which have been defined in Step 2. If all three systems are combined as one, only the two streams SCW5 and SM5 will not be calculated. These two streams are assumed to be respectively equal to the effluent streams of the clear water dam and the mud dam. The salt load entering the settler will also equal the salt load in the effluent streams, i.e. CW6 and M6. It is, therefore, more appropriate to prepare a water and salt balance over all three process units. The only unknown data for this system are the quality of the mud (M6
L) and the flow rate of the fissure
water (FW5F).
The two equations relevant for the process units are:
water balance:
FW5 F + RSW5
F + 3#5
F = CW6
F + M6
F (1)
FW5F = (3 647 + 93) - (975 + 2 615)
FW5F = 150 m3/d
and: FW5L
= FW5F x FW5
C = 150 x 2.647 = 397 kg/d
salt balance:
FW5L + RSW5
L + 3#5
L = CW6
L + M6
L (2)
M6L = (397 + 3 654 + 5 604) – 9 354
M6L = 301 kg/d
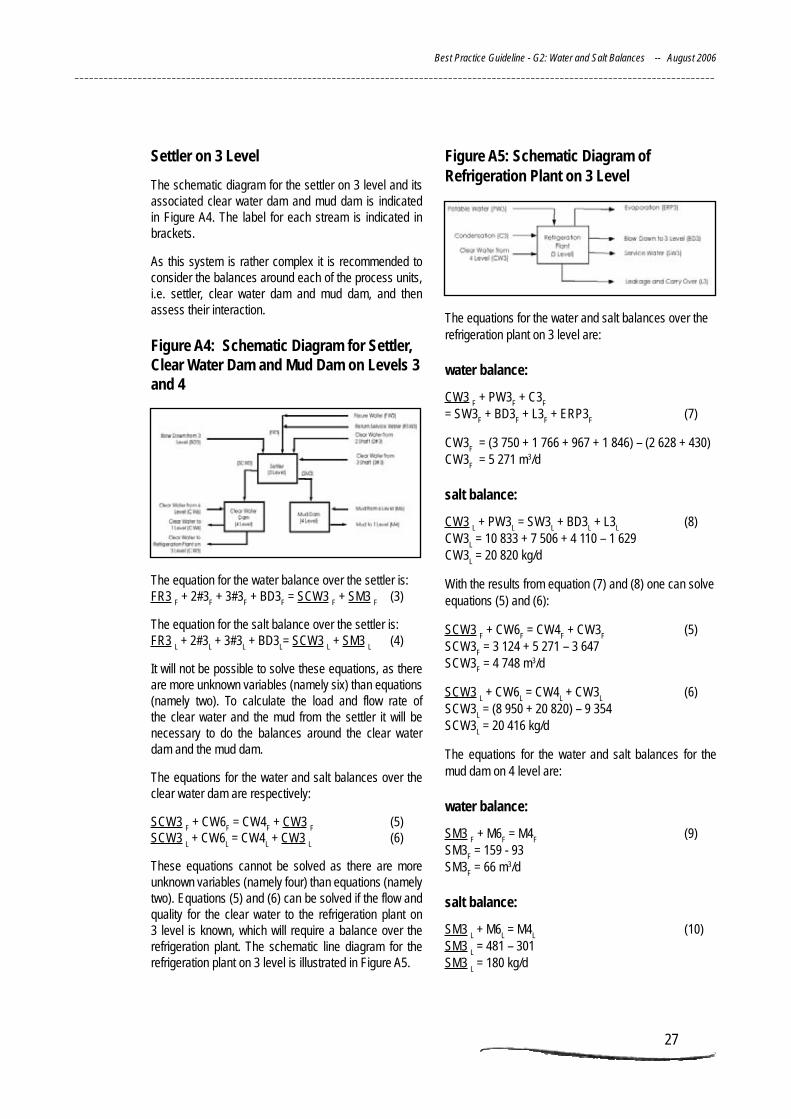
26 27
Best Practice Guideline - G2: Water and Salt Balances -- August 2006
____________________________________________________________________________________________________________________________________
26 27
Settler on 3 level
The schematic diagram for the settler on 3 level and its associated clear water dam and mud dam is indicated in Figure A4. The label for each stream is indicated in brackets.
As this system is rather complex it is recommended to consider the balances around each of the process units, i.e. settler, clear water dam and mud dam, and then assess their interaction.
Figure A4: Schematic Diagram for Settler, Clear Water Dam and Mud Dam on levels 3 and 4
The equation for the water balance over the settler is: FR3
F + 2#3
F + 3#3
F + BD3
F = SCW3
F + SM3
F (3)
The equation for the salt balance over the settler is: FR3
L + 2#3
L + 3#3
L + BD3
L= SCW3
L + SM3
L (4)
It will not be possible to solve these equations, as there are more unknown variables (namely six) than equations (namely two). To calculate the load and flow rate of the clear water and the mud from the settler it will be necessary to do the balances around the clear water dam and the mud dam.
The equations for the water and salt balances over the clear water dam are respectively:
SCW3 F + CW6
F = CW4
F + CW3
F (5)
SCW3 L + CW6
L = CW4
L + CW3
L (6)
These equations cannot be solved as there are more unknown variables (namely four) than equations (namely two). Equations (5) and (6) can be solved if the flow and quality for the clear water to the refrigeration plant on 3 level is known, which will require a balance over the refrigeration plant. The schematic line diagram for the refrigeration plant on 3 level is illustrated in Figure A5.
Figure A5: Schematic Diagram of Refrigeration Plant on 3 level
The equations for the water and salt balances over the refrigeration plant on 3 level are:
water balance:
CW3 F + PW3
F + C3
F
= SW3F + BD3
F + L3
F + ERP3
F (7)
CW3F = (3 750 + 1 766 + 967 + 1 846) – (2 628 + 430)
CW3F = 5 271 m3/d
salt balance:
CW3 L + PW3
L = SW3
L + BD3
L + L3
L (8)
CW3L = 10 833 + 7 506 + 4 110 – 1 629
CW3L = 20 820 kg/d
With the results from equation (7) and (8) one can solve equations (5) and (6):
SCW3 F + CW6
F = CW4
F + CW3
F (5)
SCW3F = 3 124 + 5 271 – 3 647
SCW3F = 4 748 m3/d
SCW3 L + CW6
L = CW4
L + CW3
L (6)
SCW3L = (8 950 + 20 820) – 9 354
SCW3L = 20 416 kg/d
The equations for the water and salt balances for the mud dam on 4 level are:
water balance:
SM3 F + M6
F = M4
F (9)
SM3F = 159 - 93
SM3F = 66 m3/d
salt balance:
SM3 L + M6
L = M4
L (10)
SM3 L = 481 – 301
SM3 L = 180 kg/d
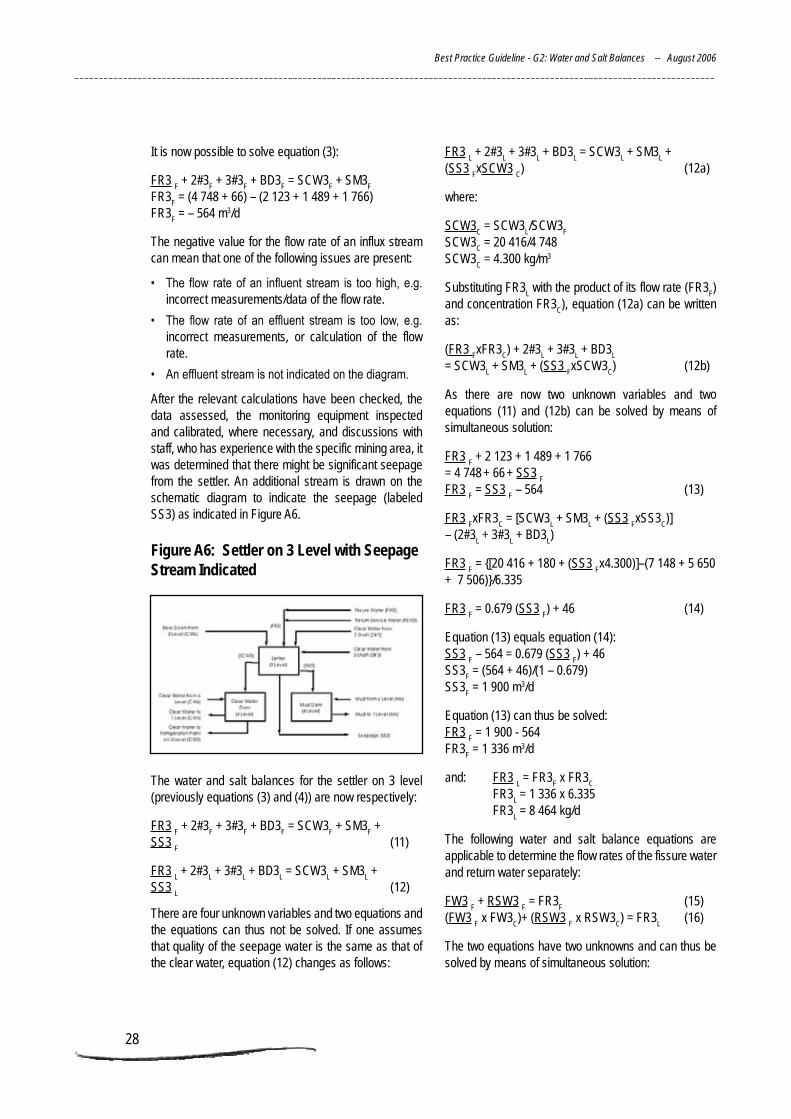
Best Practice Guideline - G2: Water and Salt Balances -- August 2006
____________________________________________________________________________________________________________________________________
28 2928 29
It is now possible to solve equation (3):
FR3 F + 2#3
F + 3#3
F + BD3
F = SCW3
F + SM3
F
FR3F = (4 748 + 66) – (2 123 + 1 489 + 1 766)
FR3F = – 564 m3/d
The negative value for the flow rate of an influx stream can mean that one of the following issues are present:
• The flow rateof an influent stream is toohigh,e.g.incorrect measurements/data of the flow rate.
• The flow rate of an effluent stream is too low, e.g.incorrect measurements, or calculation of the flow rate.
• Aneffluentstreamisnotindicatedonthediagram.
After the relevant calculations have been checked, the data assessed, the monitoring equipment inspected and calibrated, where necessary, and discussions with staff, who has experience with the specific mining area, it was determined that there might be significant seepage from the settler. An additional stream is drawn on the schematic diagram to indicate the seepage (labeled SS3) as indicated in Figure A6.
Figure A6: Settler on 3 level with Seepage Stream Indicated
The water and salt balances for the settler on 3 level (previously equations (3) and (4)) are now respectively:
FR3 F + 2#3
F + 3#3
F + BD3
F = SCW3
F + SM3
F +
SS3 F
(11)
FR3 L + 2#3
L + 3#3
L + BD3
L = SCW3
L + SM3
L +
SS3 L
(12)
There are four unknown variables and two equations and the equations can thus not be solved. If one assumes that quality of the seepage water is the same as that of the clear water, equation (12) changes as follows:
FR3 L + 2#3
L + 3#3
L + BD3
L = SCW3
L + SM3
L +
(SS3 FxSCW3
C) (12a)
where:
SCW3C = SCW3
L/SCW3
F
SCW3C = 20 416/4 748
SCW3C = 4.300 kg/m3
Substituting FR3L with the product of its flow rate (FR3
F)
and concentration FR3C), equation (12a) can be written
as:
(FR3 FxFR3
C) + 2#3
L + 3#3
L + BD3
L
= SCW3L + SM3
L + (SS3
FxSCW3
C) (12b)
As there are now two unknown variables and two equations (11) and (12b) can be solved by means of simultaneous solution:
FR3 F + 2 123 + 1 489 + 1 766
= 4 748 + 66
+ SS3
F
FR3 F = SS3
F – 564 (13)
FR3 FxFR3
C = [SCW3
L + SM3
L + (SS3
FxSS3
C)]
– (2#3L + 3#3
L + BD3
L)
FR3 F = {[20 416 + 180 + (SS3
Fx4.300)]–(7 148 + 5 650
+ 7 506)}/6.335
FR3 F = 0.679 (SS3
F) + 46 (14)
Equation (13) equals equation (14): SS3
F – 564 = 0.679 (SS3
F) + 46
SS3F = (564 + 46)/(1 – 0.679)
SS3F = 1 900 m3/d
Equation (13) can thus be solved: FR3
F = 1 900 - 564
FR3F = 1 336 m3/d
and: FR3 L = FR3
F x FR3
C
FR3L = 1 336 x 6.335
FR3L = 8 464 kg/d
The following water and salt balance equations are applicable to determine the flow rates of the fissure water and return water separately:
FW3 F + RSW3
F = FR3
F (15)
(FW3 F x FW3
C)+ (RSW3
F x RSW3
C) = FR3
L (16)
The two equations have two unknowns and can thus be solved by means of simultaneous solution:
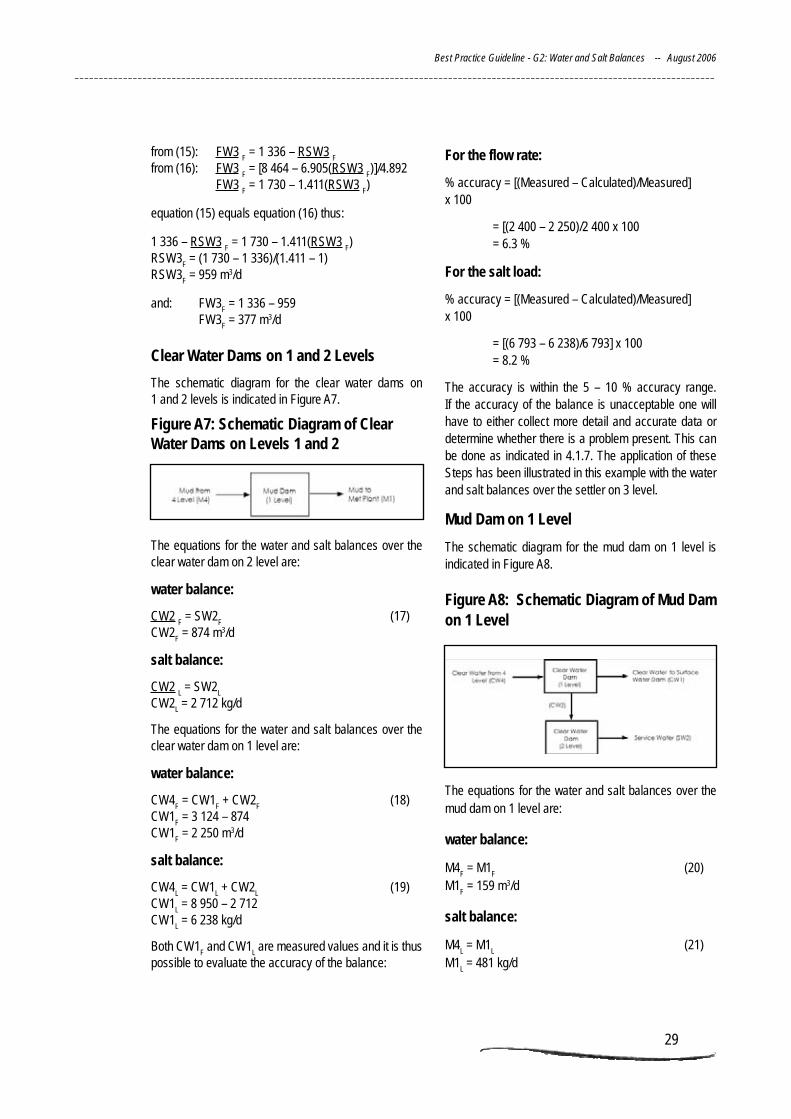
28 29
Best Practice Guideline - G2: Water and Salt Balances -- August 2006
____________________________________________________________________________________________________________________________________
28 29
from (15): FW3 F = 1 336 – RSW3
F
from (16): FW3 F = [8 464 – 6.905(RSW3
F)]/4.892
FW3 F = 1 730 – 1.411(RSW3
F)
equation (15) equals equation (16) thus:
1 336 – RSW3 F = 1 730 – 1.411(RSW3
F)
RSW3F = (1 730 – 1 336)/(1.411 – 1)
RSW3F = 959 m3/d
and: FW3F = 1 336 – 959
FW3F = 377 m3/d
Clear Water Dams on 1 and 2 levels
The schematic diagram for the clear water dams on 1 and 2 levels is indicated in Figure A7.
Figure A7: Schematic Diagram of Clear Water Dams on levels 1 and 2
The equations for the water and salt balances over the clear water dam on 2 level are:
water balance:
CW2 F = SW2
F (17)
CW2F = 874 m3/d
salt balance:
CW2 L = SW2
L
CW2L = 2 712 kg/d
The equations for the water and salt balances over the clear water dam on 1 level are:
water balance:
CW4F = CW1
F + CW2
F (18)
CW1F = 3 124 – 874
CW1F = 2 250 m3/d
salt balance:
CW4L = CW1
L + CW2
L (19)
CW1L = 8 950 – 2 712
CW1L = 6 238 kg/d
Both CW1F and CW1
L are measured values and it is thus
possible to evaluate the accuracy of the balance:
For the flow rate:
% accuracy = [(Measured – Calculated)/Measured] x 100
= [(2 400 – 2 250)/2 400 x 100 = 6.3 %
For the salt load:
% accuracy = [(Measured – Calculated)/Measured] x 100
= [(6 793 – 6 238)/6 793] x 100 = 8.2 %
The accuracy is within the 5 – 10 % accuracy range. If the accuracy of the balance is unacceptable one will have to either collect more detail and accurate data or determine whether there is a problem present. This can be done as indicated in 4.1.7. The application of these Steps has been illustrated in this example with the water and salt balances over the settler on 3 level.
Mud Dam on 1 level
The schematic diagram for the mud dam on 1 level is indicated in Figure A8.
Figure A8: Schematic Diagram of Mud Dam on 1 level
The equations for the water and salt balances over the mud dam on 1 level are:
water balance:
M4F = M1
F (20)
M1F = 159 m3/d
salt balance:
M4L = M1
L (21)
M1L = 481 kg/d
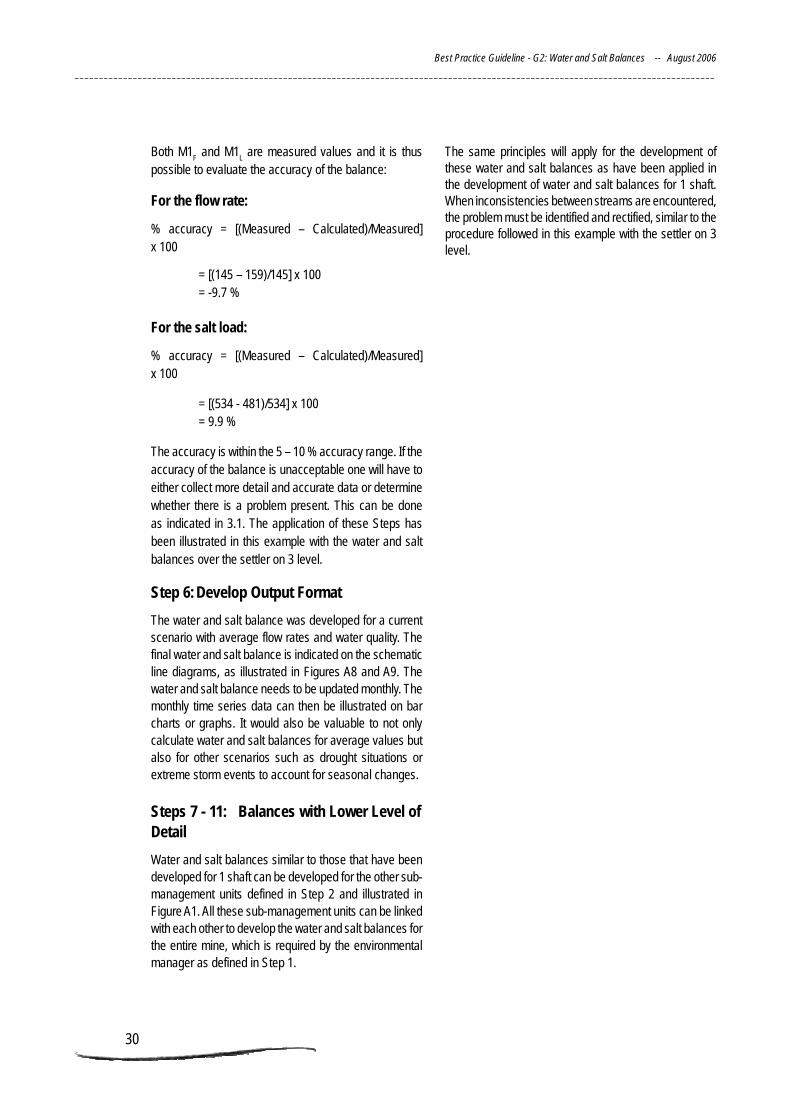
Best Practice Guideline - G2: Water and Salt Balances -- August 2006
____________________________________________________________________________________________________________________________________
30 3130 31
Both M1F and M1
L are measured values and it is thus
possible to evaluate the accuracy of the balance:
For the flow rate:
% accuracy = [(Measured – Calculated)/Measured] x 100
= [(145 – 159)/145] x 100 = -9.7 %
For the salt load:
% accuracy = [(Measured – Calculated)/Measured] x 100
= [(534 - 481)/534] x 100 = 9.9 %
The accuracy is within the 5 – 10 % accuracy range. If the accuracy of the balance is unacceptable one will have to either collect more detail and accurate data or determine whether there is a problem present. This can be done as indicated in 3.1. The application of these Steps has been illustrated in this example with the water and salt balances over the settler on 3 level.
Step 6: Develop Output Format
The water and salt balance was developed for a current scenario with average flow rates and water quality. The final water and salt balance is indicated on the schematic line diagrams, as illustrated in Figures A8 and A9. The water and salt balance needs to be updated monthly. The monthly time series data can then be illustrated on bar charts or graphs. It would also be valuable to not only calculate water and salt balances for average values but also for other scenarios such as drought situations or extreme storm events to account for seasonal changes.
Steps 7 - 11: Balances with lower level of Detail
Water and salt balances similar to those that have been developed for 1 shaft can be developed for the other sub-management units defined in Step 2 and illustrated in Figure A1. All these sub-management units can be linked with each other to develop the water and salt balances for the entire mine, which is required by the environmental manager as defined in Step 1.
The same principles will apply for the development of these water and salt balances as have been applied in the development of water and salt balances for 1 shaft. When inconsistencies between streams are encountered, the problem must be identified and rectified, similar to the procedure followed in this example with the settler on 3 level.
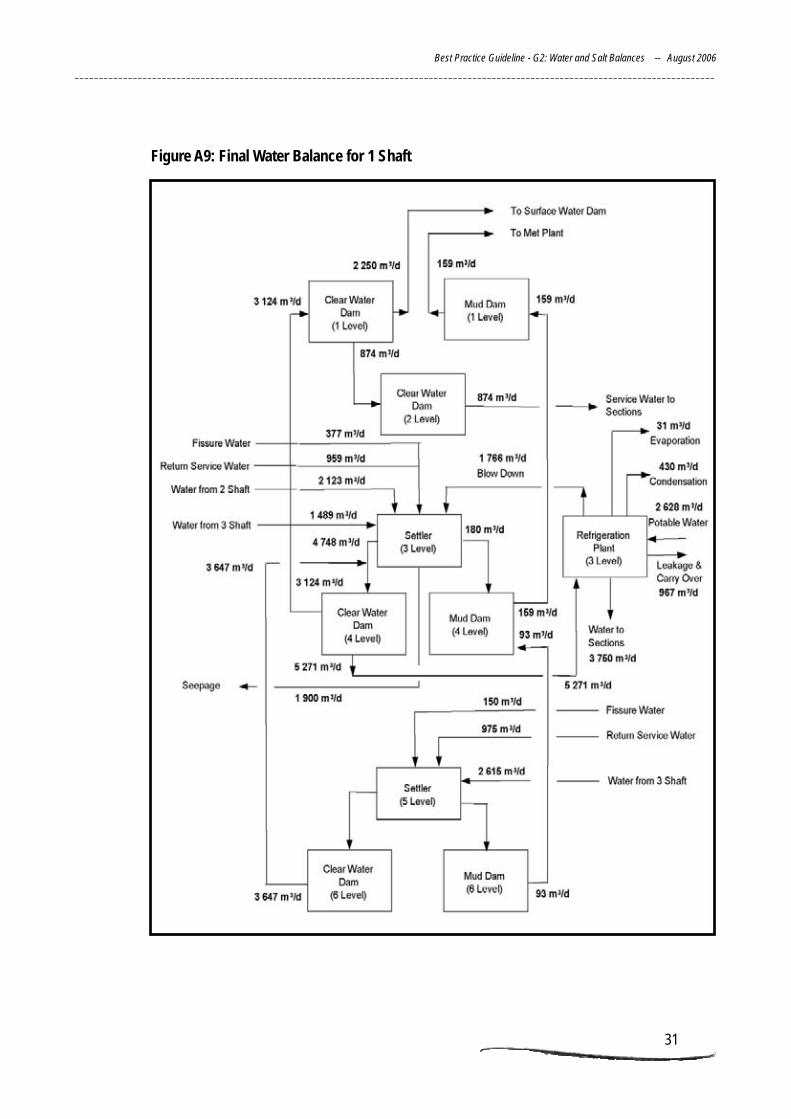
30 31
Best Practice Guideline - G2: Water and Salt Balances -- August 2006
____________________________________________________________________________________________________________________________________
30 31
Figure A9: Final Water Balance for 1 Shaft
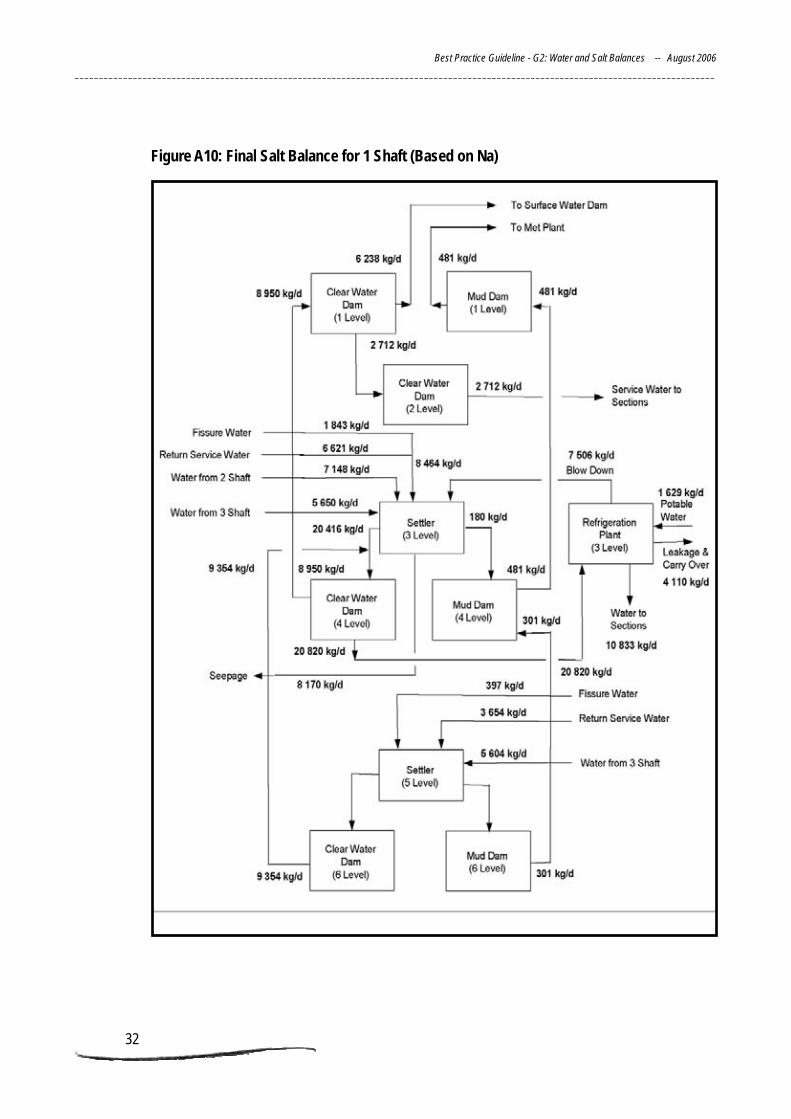
Best Practice Guideline - G2: Water and Salt Balances -- August 2006
____________________________________________________________________________________________________________________________________
32 3332 33
Figure A10: Final Salt Balance for 1 Shaft (Based on Na)
32 33
Best Practice Guideline - G2: Water and Salt Balances -- August 2006
____________________________________________________________________________________________________________________________________
32 33
In the development of a generic definition of the water reticulation system, it is important to identify all the relevant flow paths, e.g. bedlosses, evapotranspiration and influx of ground water. A list of flow paths that usually need to be taken into consideration when a water reticulation flow diagram is developed is given below. The list is not an exhaustive list, but gives an indication of some of the major flow paths and some of the flow paths that may be overlooked in a first screening.
underground circuits
• Chilledmineservicewater
• Unchilledmineservicewater
• Chilledwaterforcoolingcircuits
• Condensorcircuitmake-up
• Drinkingwater
• Fissureorgroundwater
• Mudfromsettlers
• Oresurfacemoisture
• Settledclearwater
• Ventilationandevaporationlosses
• Lossestofloodingofundergroundsections
Opencast mining circuits
• Dustsuppression
• Groundwaterrecharge
• Oresurfacemoisture
• Rainfall
• Infiltrationthroughrehabilitatedportionofpit
• Evaporation
• Evapotranspirationfromrehabilitatedportionofpit
• Servicewater
• Lossestofloodingofportionsofpit
Metallurgical /Beneficiation plants
• Chemicalmake-upwater
• Coalanddiscardsurfacemoisture
• Evaporativecircuitslosses
• Evaporativecircuitsmake-upwater
• Glandservicewater
• Mudfromu/gsettlers
• Oresurfacemoisture
• Plantwater
• Seepage
• Surfacerunoff
APPeNDIX B: DeTAIl ON WATeR
CIRCuITS
Best Practice Guideline - G2: Water and Salt Balances -- August 2006
____________________________________________________________________________________________________________________________________
34 3534 35
Slimes/tailings discharge
• Slimesdamreturnwater
• Washdownwater
• Workshopwater
Waste Deposits
• Dustsuppression
• Evaporation
• Irrigationforvegetation
• Precipitationontoslimesdam/wasterock
• Retainedinterstitialwaterinwasterockdump/residuedump
• Surfacerunoff
• Seepage
• Slimes/tailings discharged to slimes dam/residuedump
• Wasterocksurfacemoisture
• Evapotranspirationfromvegetation
environmental (external to mine) circuits
• Boreholeabstractions
• Diffusesourceeffluentstosurfacewater
• Diffusesourcepollutiontogroundwater
• Evaporation
• Evapotranspiration
• Pointabstractionsfromsurfacewater
• Pointsourceeffluentdischarges
• Rainfall
• Streamanddambedlosses
• Surfacerunoff
Domestic Water Circuits
• Irrigation
• Potablewaterforhostel,village,officesandplant
• Sewagereturnwater(e.g.tosportfields)
• Sewagesludge
• Treatedsewagedischarge
When developing a mine water and salt balance diagram, it is important to ensure that all the necessary flow paths are considered for each of the unit processes within the system. By ignoring key flow paths such as seepage, evaporation, catchment runoff, etc., the overall usefulness of the balances as a management tool is greatly reduced.
A minimum level of detail is recommended, as shown in the schematic diagrams below for some of the more common unit processes encountered in mine water circuits.
Most of the streams can be measured directly or calculated from measured data. For a number of streams it is not possible to determine the variables by means of direct measurements and the calculations tend to be complex. For these streams it is more feasible to determine the water quality and quantity with acceptable models. In some instances calculation and modeling techniques are available. The calculation techniques generally have more assumptions than the models and will usually be less accurate. Calculation techniques are thus used to determine rough numbers for the balances and can be refined, if necessary, with the appropriate modeling technique.
It is important to determine the frequency of data measurement, required. Daily flow measurements may be critical in certain process stream whereas seasonal averages or means in surrounding watercourses may be sufficient. Minimum and maximum values would be important when considering extreme situations of water requirements and storage.
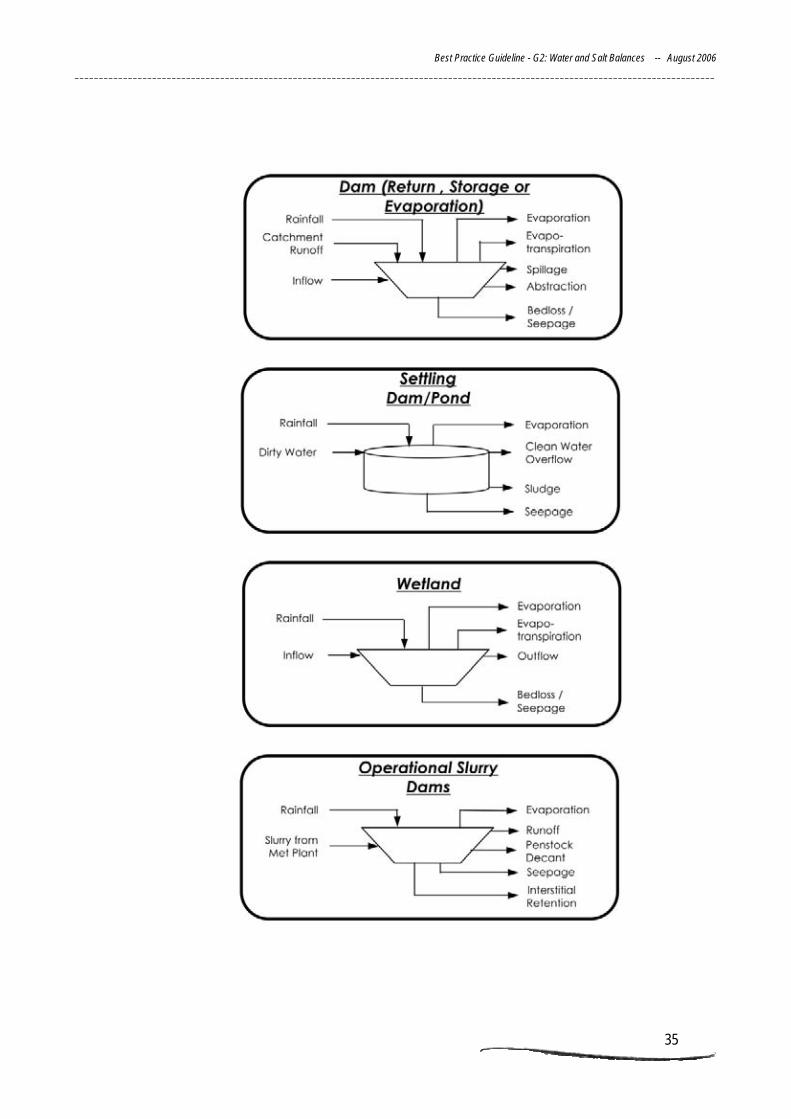
34 35
Best Practice Guideline - G2: Water and Salt Balances -- August 2006
____________________________________________________________________________________________________________________________________
34 35
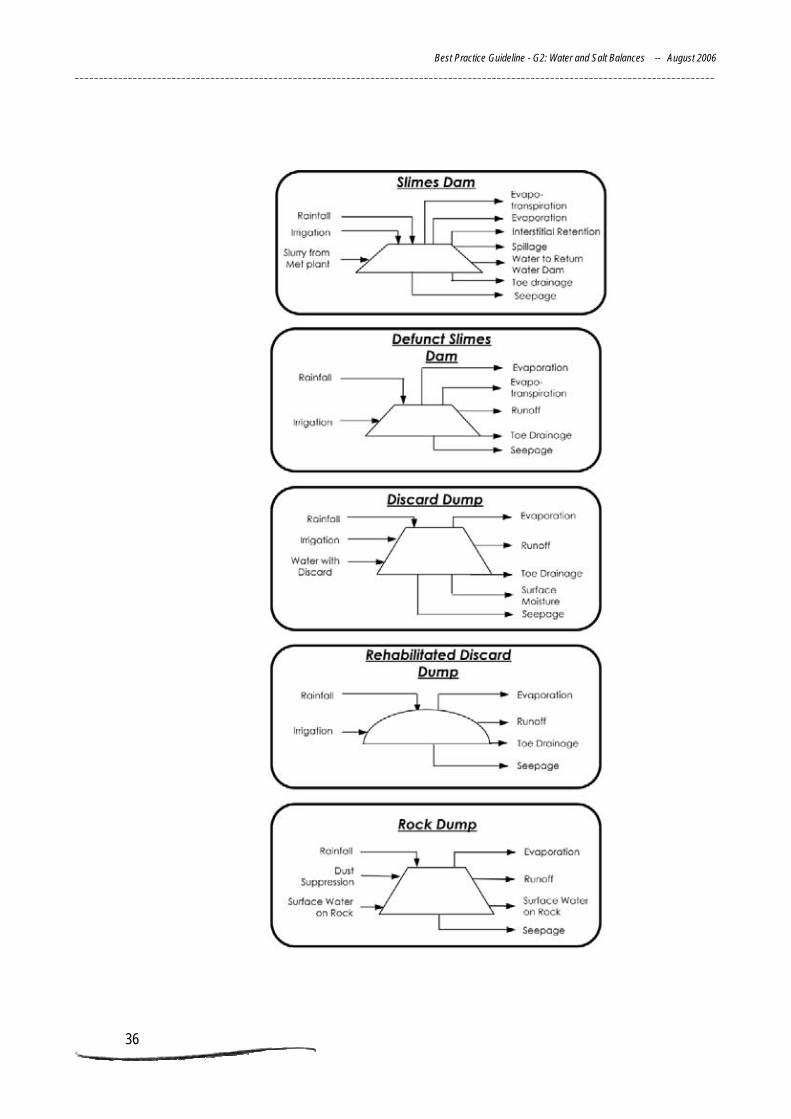
Best Practice Guideline - G2: Water and Salt Balances -- August 2006
____________________________________________________________________________________________________________________________________
36 3736 37
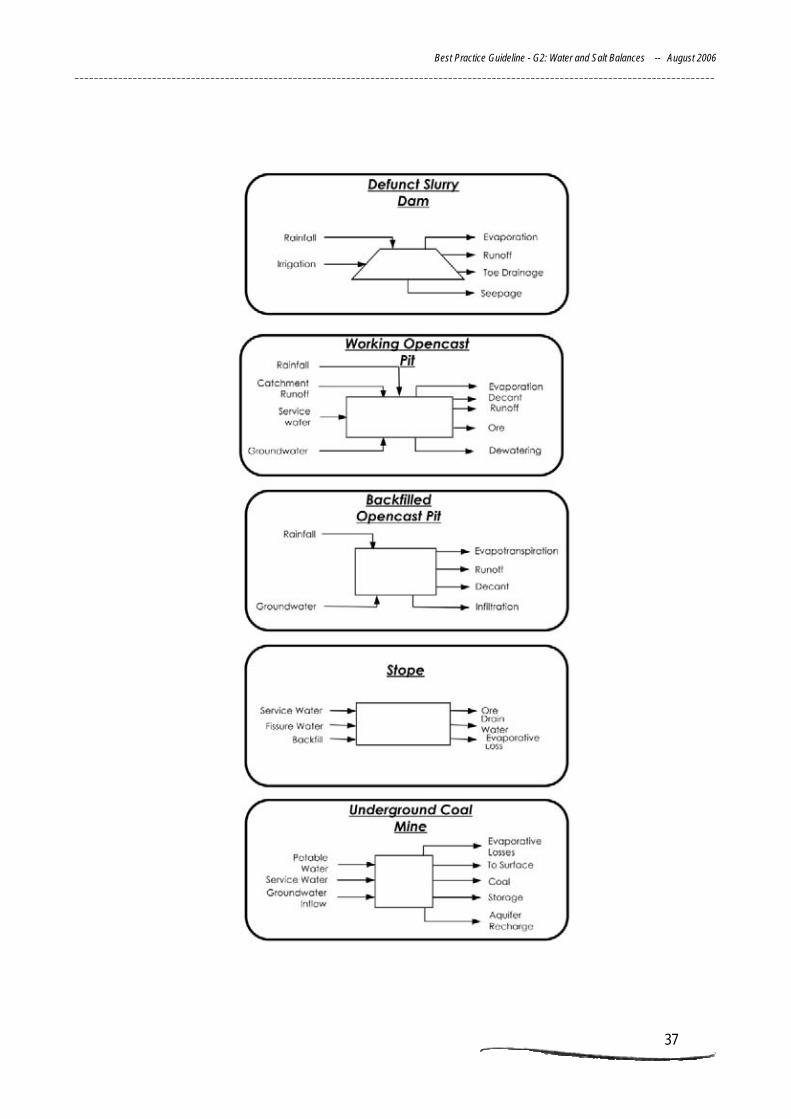
36 37
Best Practice Guideline - G2: Water and Salt Balances -- August 2006
____________________________________________________________________________________________________________________________________
36 37
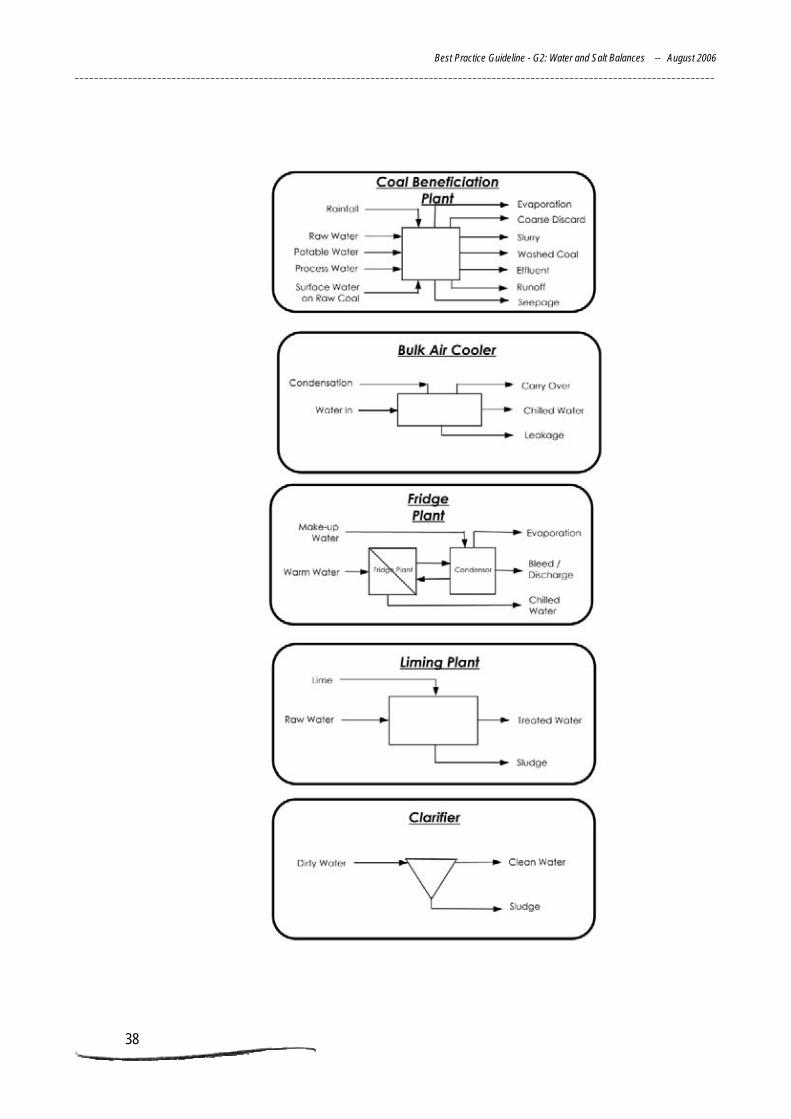
Best Practice Guideline - G2: Water and Salt Balances -- August 2006
____________________________________________________________________________________________________________________________________
38 3938 39
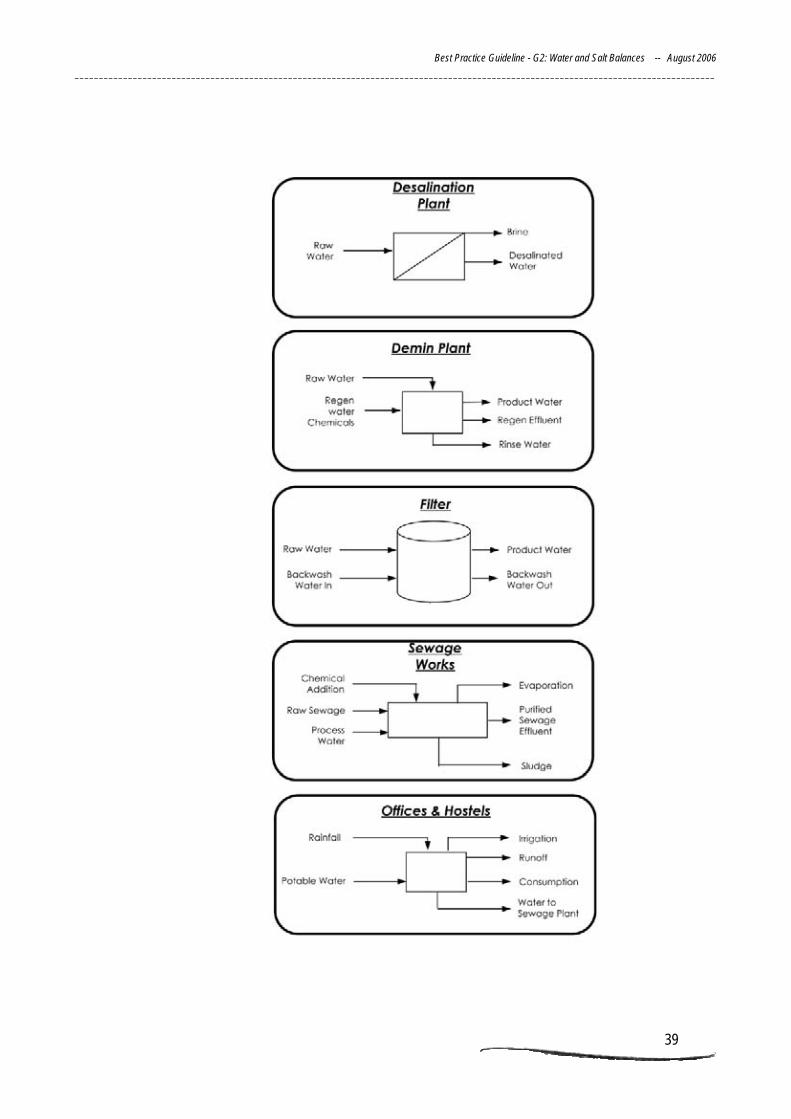
38 39
Best Practice Guideline - G2: Water and Salt Balances -- August 2006
____________________________________________________________________________________________________________________________________
38 39
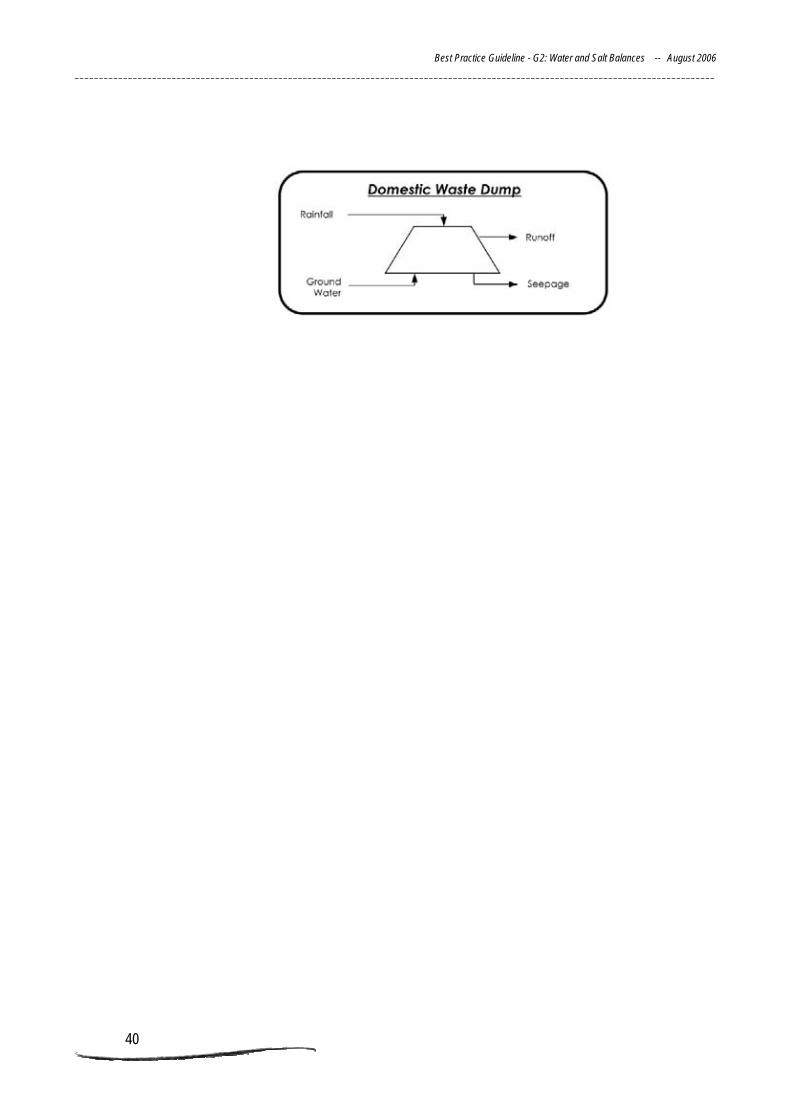
Best Practice Guideline - G2: Water and Salt Balances -- August 2006
____________________________________________________________________________________________________________________________________
40 4140 41
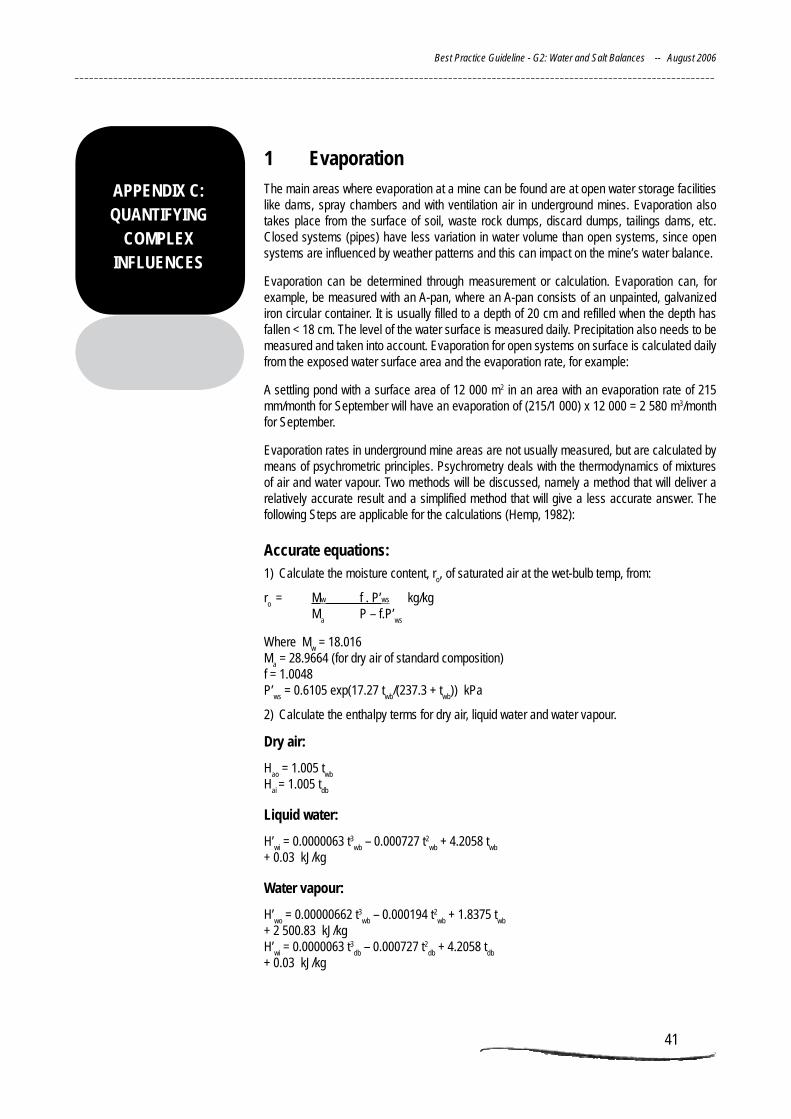
40 41
Best Practice Guideline - G2: Water and Salt Balances -- August 2006
____________________________________________________________________________________________________________________________________
40 41
APPeNDIX C: QuANTIFyING
COMPleX INFlueNCeS
1 evaporation The main areas where evaporation at a mine can be found are at open water storage facilities like dams, spray chambers and with ventilation air in underground mines. Evaporation also takes place from the surface of soil, waste rock dumps, discard dumps, tailings dams, etc. Closed systems (pipes) have less variation in water volume than open systems, since open systems are influenced by weather patterns and this can impact on the mine’s water balance.
Evaporation can be determined through measurement or calculation. Evaporation can, for example, be measured with an A-pan, where an A-pan consists of an unpainted, galvanized iron circular container. It is usually filled to a depth of 20 cm and refilled when the depth has fallen < 18 cm. The level of the water surface is measured daily. Precipitation also needs to be measured and taken into account. Evaporation for open systems on surface is calculated daily from the exposed water surface area and the evaporation rate, for example:
A settling pond with a surface area of 12 000 m2 in an area with an evaporation rate of 215 mm/month for September will have an evaporation of (215/1 000) x 12 000 = 2 580 m3/month for September.
Evaporation rates in underground mine areas are not usually measured, but are calculated by means of psychrometric principles. Psychrometry deals with the thermodynamics of mixtures of air and water vapour. Two methods will be discussed, namely a method that will deliver a relatively accurate result and a simplified method that will give a less accurate answer. The following Steps are applicable for the calculations (Hemp, 1982):
Accurate equations:1) Calculate the moisture content, r
o, of saturated air at the wet-bulb temp, from:
ro = Mw f . P’ws kg/kg
M
a P – f.P’
ws
Where Mw = 18.016
Ma = 28.9664 (for dry air of standard composition)
f = 1.0048 P’
ws = 0.6105 exp(17.27 t
wb/(237.3 + t
wb)) kPa
2) Calculate the enthalpy terms for dry air, liquid water and water vapour.
Dry air:
Hao
= 1.005 twb
Hai
= 1.005 tdb
liquid water:
H’wi = 0.0000063 t3
wb – 0.000727 t2
wb + 4.2058 t
wb
+ 0.03 kJ/kg
Water vapour:
H’wo
= 0.00000662 t3wb
– 0.000194 t2wb
+ 1.8375 twb
+ 2 500.83 kJ/kg H’
wi = 0.0000063 t3
db – 0.000727 t2
db + 4.2058 t
db
+ 0.03 kJ/kg
Best Practice Guideline - G2: Water and Salt Balances -- August 2006
____________________________________________________________________________________________________________________________________
42 4342 43
3) Calculate the actual moisture content of the air, r:
r = ro (H’wo – H’wl) – (Hai – Hao) kg/kg H’
wi – H’
wl
less accurate equations:1) Calculate the vapour pressure, P
w, from:
Pw = P’
ws – AP(t
db – t
wb) kPa
Where:
P’ws
= 0.6105 exp(17.27 twb
/(237.3 + twb
)) kPa A = 0.000644 oC-1
2) Calculate the moisture content, r, from:
r = 0.622 P w kg/kg
P - Pw
A wet-bulb thermometer consists of an ordinary thermometer. The bulb is covered with cotton gauze, and is kept wet. The evaporation of water from the wet gauze results in the bulb being cooled to a temperature below the air temperature. The extent of the drop in temperature is a measure of the vapour pressure. (Hemp, 1982) The dry-bulb temperature is defined by the sum of the thermometer temperature and the surrounding temperature. The example in Appendix A illustrates how these equations are used.
2 evapotranspirationActual evapotranspiration is a measure of solar radiation, temperature and rainfall; it is the amount of water transported (also referred to as “pumped”) into the atmosphere by evaporation from the ground and by transpiration from the vegetation (Krebs, 1985). Direct measurement of the rates of water use by plants is often technically difficult, and estimates have frequently been based on indirect methods such as observed rates of soil water depletion. A number of rather complex and expensive instruments have been designed to determine evapotranspiration. Many attempts have been made to use weather data to calculate the maximum or potential evapotranspiration for a given area, but these calculations have only been partly successful.
Evapotranspiration for wetlands is generally calculated as the evaporation rate for the same surface area, multiplied by an evaporation factor (E). Discussions with various researchers (Wood, 1993 and Ashton, 1993) and information from research reports indicated that E might
vary from 0.8 to 5. A wide range of variables, including wind speed, soil heat flux density, aerodynamics, canopy surface conductance and water vapour pressure, which is best estimated by the Penman-Monteith equation (Brezny, 1973), affect the evapotranspiration factor. The estimation of evapotranspiration for an area is complex and should preferably be calculated with the relevant model. In situations where only a preliminary and rough estimation is required it may be assumed that the value of E equals 1.
3 RunoffWhen the rate of rainfall influx exceeds the absorbtion capacity of the soil, the excess water flows over the surface as overland flow. Rainfall runoff responds differently to variations in topography, soil and characteristics of precipitation, and indirectly to variations in climate, vegetation and land use. Therefore runoff flow controls the volume, periodicity and chemical characteristics of contributions to receiving streams and lake basins. (Wetzel, 1983)
Various methods and models are available to estimate runoff. The two most common manual calculation methods that are in use are the “Rational” method and the SCS method. The “Rational” method is based on a relatively simple equation and its application is restricted to small drainage areas, usually less than 15 km2. The SCS method can be applied to a larger drainage area than the “Rational” method, but is also more complicated. Discussions on the application of the two methods can be found in BPG G1. More detailed discussions are presented in the following publications: Wanielista (1978), Ferguson (1990) and Debo (1995).
Models have been developed to calculate runoff for a specific area. The models usually require detailed data and a suitably qualified person to run the model.
4 Water and Salt Balances Over Tailing Dams and Other Waste Dumps
Predicting the interaction of water and salt on the surface of tailings dams and other waste dumps is dependent on a complex process where three factors dominate. These factors do not function as independent variables, but rather as a closely coupled system. The first factor is the supply and demand for water imposed at the soil surface
42 43
Best Practice Guideline - G2: Water and Salt Balances -- August 2006
____________________________________________________________________________________________________________________________________
42 43
by atmospheric conditions such as total precipitation, all net radiation, wind speed and air temperature. The second factor is the ability of the soil to transmit water and the associated water regime, as defined by the hydraulic conductivity and storage characteristics of the soil to control the flow of the soil moisture. The final factor involves the influence of vegetation. The type and density of vegetation affects evaporation through the consumption of water through root uptake but also along with runoff rates and surface retention. (SoilCover, 1997)
Various models have been developed to assist with the prediction of this complex process and a suitably qualified person will be capable of making the correct choice between the models and applying them correctly at each site.
5 GroundwaterQuantifying groundwater flow into a mine is a complex issue that relies on a proper understanding of the underground water flows and aquifers. Models have been developed to simulate groundwater flow. These models usually require site-specific data, which include groundwater monitoring. Groundwater monitoring and data collection is described in more detail in BPG G3: Water Monitoring Systems.
Trends from groundwater monitoring data only are generally not representative of future groundwater inflows. Predictive models have been developed to overcome the problem. Predictive models should be subjected to a rigorous process of calibration, verification and sensitivity analysis, which should also form an integral part of a monitoring program.
![DWAF Water By-laws Water By-laws.pdf · PAGE 4 [DRAFT VERSION] DWAF MODEL WATER SERVICES BY-LAWS PAGE 4 Building Regulations and Building Standards, 1977 (Act No 103 of 1977) as amended;](https://img.pdfslide.us/doc/110x75/5ae52c407f8b9ae1578bf548/dwaf-water-by-water-by-lawspdfpage-4-draft-version-dwaf-model-water-services.jpg)