Embed Size (px)
Citation preview
Forschungsinstitut zur Zukunft der ArbeitInstitute for the Study of Labor
DI
SC
US
SI
ON
P
AP
ER
S
ER
IE
S
Laws, Costs, Norms, and Learning:Improving Working Conditions in Developing Countries
IZA DP No. 10025
June 2016
Drusilla BrownRajeev DehejiaRaymond Robertson
Laws, Costs, Norms, and Learning: Improving Working Conditions in
Developing Countries
Drusilla Brown Tufts University
Rajeev Dehejia
New York University and IZA
Raymond Robertson
Texas A&M University and IZA
Discussion Paper No. 10025 June 2016
IZA
P.O. Box 7240 53072 Bonn
Germany
Phone: +49-228-3894-0 Fax: +49-228-3894-180
E-mail: [email protected]
Any opinions expressed here are those of the author(s) and not those of IZA. Research published in this series may include views on policy, but the institute itself takes no institutional policy positions. The IZA research network is committed to the IZA Guiding Principles of Research Integrity. The Institute for the Study of Labor (IZA) in Bonn is a local and virtual international research center and a place of communication between science, politics and business. IZA is an independent nonprofit organization supported by Deutsche Post Foundation. The center is associated with the University of Bonn and offers a stimulating research environment through its international network, workshops and conferences, data service, project support, research visits and doctoral program. IZA engages in (i) original and internationally competitive research in all fields of labor economics, (ii) development of policy concepts, and (iii) dissemination of research results and concepts to the interested public. IZA Discussion Papers often represent preliminary work and are circulated to encourage discussion. Citation of such a paper should account for its provisional character. A revised version may be available directly from the author.
IZA Discussion Paper No. 10025 June 2016
ABSTRACT
Laws, Costs, Norms, and Learning: Improving Working Conditions in Developing Countries
Working conditions in developing countries, such as those associated with the 2013 Rana Plaza collapse in Bangladesh, remain stubbornly low despite strict laws regulating hours, pay practices and occupational safety and health. Recent theoretic and empirical work suggests that norms and learning may play a significant role in determining conditions. We exploit the natural experiment of Cambodia’s 15-year experience with the Better Factories Cambodia program to identify variation that reveals the relative contributions of laws, costs, norms, and learning in improving working conditions in Cambodia. The results suggest that policies that follow from the learning hypothesis may be the most effective at improving working conditions in the long run. JEL Classification: F53, F66, J8 Keywords: working conditions, norms, personnel economics Corresponding author: Raymond Robertson Texas A&M University 1032 Allen Building 4220 TAMU College Station, Texas 77843-4220 USA E-mail: [email protected]

1 | P a g e
I. Introduction
Harsh working conditions in developing countries pose one of the more vexing questions
in development economics. Laws regulating labor markets have limited effect. Many countries
have very progressive labor laws that rival those in developed countries but poor conditions
persist. Limited enforcement, often due to resource constraints, raises the importance of
understanding firm-level decisions concerning working conditions.
There are three leading theories as to why poor conditions persist. The first hypothesis,
perhaps the most intuitive, is that improving conditions is thought to be costly and profit-
reducing, rendering “sweatshops” as the cost-minimizing human resource management system.
Several advocates of sweatshops, such as Powell and Skarbek (2006), suggest that the sweatshop
phase is just one of several phases of development. In analysis of the endogenous response of
Indonesian foreign-owned export-oriented apparel, textile, and footwear factories to anti-
sweatshop agitation in the early 1990s, Harrison and Scorse (2010) show that international
pressure on minimum wage compliance is found to raise wages and expand employment but
lower profits and induce some firms to eventually relocate. The main implication of this
“sweatshop as economic development” argument is that anti-sweatshop pressure can have
unintended negative consequences of raising costs for developing country producers and
reducing employment. Anti-sweatshop pressure that is intended to help workers might actually
make them worse off.
A second strand of literature suggests that the interactions of norms and laws may explain
why poor conditions persist. Recent examples include Benabou and Tirole (2011) and
Acemoglu and Jackson (2014, 2015), but the current literature dates back to at least Ellickson
2 | P a g e
(1998) and Lessig (1998). Benabou and Tirole (2011) highlight the importance of imperfect
information (both on the part of the government and individual agents). Criminalizing small
offenses may reduce the perceived cost of other rule breaking and create a culture of
noncompliance. Acemoglu and Jackson (2014) model the interaction of norms and rules and
show that overly restrictive laws precipitate norms of noncompliance. Such laws, therefore, may
induce less compliance with legal standards. The implication of this view is that changing norms,
not laws, may be necessary to improve working conditions. Norms related to cooperation on
acceptable working conditions are particularly salient in the presence of negative external effects
generated by poor working conditions in noncompliant factories on national reputation (Basu et
al., 2006),
The third hypothesis is that the relationship between profits and improving conditions
may be unknown and cost-reducing on net. Since learning is costly, the third hypothesis
suggests that there are unrealized opportunities for learning in developing country factories –
including in the area of human resource practices. Human resource management (the company
policies that define and establish working conditions in the factory) can be considered a
technology much like any other production technology (Bruhn, Karlan, and Schoar 2010).
Humane innovations in human resource management including performance-based pay,
teamwork, communications, and training have been shown to increase productivity, profits and
product quality in small and medium sized firms in several industries (Bandiera et al., 2007;
Hamilton et al., 2003; Ichniowski et al., 1997; Sheehan, 2013). These innovations may be
resisted because experimentation is costly in terms of both outlays and risk (Fung et al., 2001;
Bloom et al., 2012; Domat et al., 2013). In a natural experiment, Levine, Toffel, and Johnson
(2012) find that random inspections by OSHA reduced costs related to worker injuries by an

3 | P a g e
average $350,000 per inspected company, arguing that the inspections themselves promoted
learning.
It is well established that developing-country factories do not always use the latest
production techniques (e.g. Alvarez and Robertson; 2004). In a randomized controlled trial,
Bloom et al. (2012) find that profits and investment rise in Indian textile firms receiving a
package of management consulting services, an outcome that indicates that developing-country
factories may benefit from new information. Schoar (2013) presents results from a randomized
experiment of Cambodian factory managers and finds positive firm performance effects of
supervisor training. If developing country firms do not use the latest human resource practices,
inducing firms to experiment with alterative labor management systems may increase learning
and ultimately factory performance.
The goal of this paper is to take advantage of the 1999 U.S.-Cambodian Bilateral Textile
Trade Agreement to evaluate the empirical relevance of the cost, norms, and learning theories
determining working conditions in developing countries.1 On paper, Cambodia’s labor laws are
similar to those considered necessary to establish humane working conditions. In practice, prior
to the 1999 trade agreement, actual factory conditions were quite poor despite the legislated
standards (Hall 2000). The 1999 U.S.-Cambodia Bilateral Textile Trade Agreement formally
linked access to U.S. apparel markets and Cambodian labor standards and, as such, used markets
rather than new laws in an attempt to improve working conditions (Polaski, 2009). In 1999 at
the time of the agreement, access to the U.S. apparel market was restricted by the Multi-Fibre
1 Our paper does not test the effects of the U.S.-Cambodian agreement. Analysis of the direct effects of labor provisions in trade agreements on factory behavior and performance focuses principally on the impact of labor standards on working conditions, comparative advantage, and labor costs (Bakhshi and Kerr, 2010; Kucerna and Sarna, 2006; Dehejia and Samy, 2004; Bonnal, 2010). Flanagan (2003) finds no significant relationship between ratification of labor standards and labor cost, conditional on productivity differences in a cross country panel for the period 1980-1999. Huberman (2012) contends that standards related to wages and hours induced capital deepening that rationalized the mandated restrictions.
4 | P a g e
Arrangement (MFA). The U.S.-Cambodian Agreement conditioned increased access to the U.S.
apparel market on improvements in working conditions in the Cambodian apparel industry. The
International Labor Organization (ILO) was tasked with conducting working conditions
assessments and submitting reports to the U.S. government.
We take three steps to evaluate the relative significance of these three leading hypotheses.
In section II, we develop a theoretical model that adapts the Acemoglu and Jackson (2015)
framework to nest the costs, norms, and information explanations for poor working conditions.
While not necessarily mutually exclusive,2 the model shows that these three theories have
different empirical implications. In Section III we use factory-level data from Cambodia over
the 2001-2014 period to contrast the implications of these three theories in order to identify
which of the three may best explain the persistence of sweatshops in developing countries.
Identification comes from variation across factories, time, and compliance point. In section IV
we explore the robustness to several confounding factors. We offer conclusions and directions
for future research in Section V.
II. Analytical Framework
In this section, we adapt the Acemoglu and Jackson (2015) framework to the Cambodian
context. We first briefly review the Acemoglu and Jackson (2015) framework and then present
our application to the Cambodian case.
A. A Model of Norm Formation, Learning and Gains from Coordination
2 Laws can also promote learning if they induce experimentation. For example. Levin et al. (2012) suggest that compliance drives learning in the context of OSHA regulations in the United States. Analysis of World Bank Enterprise Surveys for nine developing countries indicates that restrictive labor market regulations had a positive impact on production efficiency greater than regulations improving the business environment (Bhaumik and Dimova, 2011).
5 | P a g e
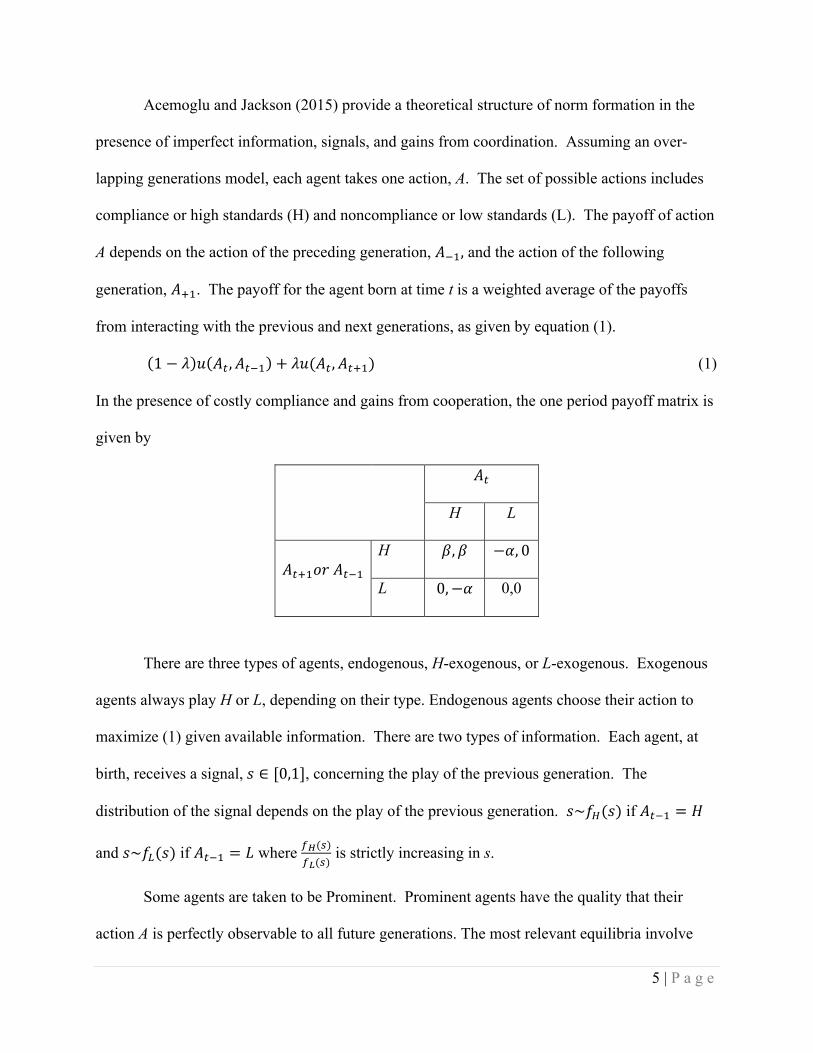
Acemoglu and Jackson (2015) provide a theoretical structure of norm formation in the
presence of imperfect information, signals, and gains from coordination. Assuming an over-
lapping generations model, each agent takes one action, A. The set of possible actions includes
compliance or high standards (H) and noncompliance or low standards (L). The payoff of action
A depends on the action of the preceding generation, 𝐴!!, and the action of the following
generation, 𝐴!!. The payoff for the agent born at time t is a weighted average of the payoffs
from interacting with the previous and next generations, as given by equation (1).
1− 𝜆 𝑢 𝐴! ,𝐴!!! + 𝜆𝑢(𝐴! ,𝐴!!!) (1)
In the presence of costly compliance and gains from cooperation, the one period payoff matrix is
given by
𝐴!
H L
𝐴!!!𝑜𝑟 𝐴!!! H 𝛽,𝛽 −𝛼, 0
L 0,−𝛼 0,0
There are three types of agents, endogenous, H-exogenous, or L-exogenous. Exogenous
agents always play H or L, depending on their type. Endogenous agents choose their action to
maximize (1) given available information. There are two types of information. Each agent, at
birth, receives a signal, 𝑠 ∈ [0,1], concerning the play of the previous generation. The
distribution of the signal depends on the play of the previous generation. 𝑠~𝑓!(𝑠) if 𝐴!!! = 𝐻
and 𝑠~𝑓!(𝑠) if 𝐴!!! = 𝐿 where !!(!)!!(!)
is strictly increasing in s.
Some agents are taken to be Prominent. Prominent agents have the quality that their
action A is perfectly observable to all future generations. The most relevant equilibria involve
6 | P a g e
semi-Markovian strategies in the sense that agents ignore the history of play that precedes the
actions of the last Prominent agent.
The solution of the model illustrates how norms are formed. For some values of λ
(forward looking), α (cost of H), β (payoff from cooperation), and π (proportion exogenous H or
L), a play of A=H is optimal for endogenous players for all values of the signal, s. That is, a
norm of playing H prevails. For some values of λ, α, β, and π, a play of A=L is optimal for
endogenous players for all values of the signal, s. That is, a norm of playing L prevails.
For parameter values where neither an H-norm nor an L-norm prevails, an endogenous
agent will play H following a Prominent player who plays H and will play L following a
Prominent player who plays L. Over time, however, play will revert. Each future generation
knows that there is a probability π that an L-type exogenous agent will emerge and a probability
π that an H-type exogenous agent will emerge. As a consequence, for some values of the signal,
s, A=L will be a best response and for other values of the signal, s, A=H will be a best response.
This model shows that compliance behavior depends on the value of signals that firms
receive. In particular, the Acemoglu and Jackson (2015) framework highlights the role of
credible public and imperfect information in characterizing the formation of behavioral norms in
the presence of gains from cooperation.
B. The Better Factories Cambodia Program
The Better Factories Cambodia (BFC) program was established by the ILO in 2001. The
ILO’s BFC3 program monitors working conditions in Cambodian garment factories and assesses
3 For more information, see http://www.betterfactories.org.

7 | P a g e
conditions relative to ILO Core Labor Standards4 and Cambodian labor law. The Cambodian
government mandates that all apparel exporters submit to Enterprise Assessments by BFC
Enterprise Advisors. Enterprise Advisors observe working conditions in all Cambodian
exporting garment factories during unannounced visits. ILO-trained Cambodian monitors enter
factories to complete a tool assessing the factory’s compliance on a variety of working
conditions and wage requirements. To avoid monitor bias, each monitoring team contains at
least two people, and the same team rarely assesses the same factory twice.
BFC issues periodic synthesis reports characterizing average compliance for the
Cambodian apparel industry. Prior to the end of the MFA in 2005, the United States government
referred to the Synthesis Reports when determining Cambodia’s apparel export quota.
Individual factory reports are made available to firms and may be accessed by a factory’s
subscribing buyers.5 For factories lacking a subscribing buyer, reports are available only to BFC
and the participating firm. Prior to November 2006, however, BFC publically disclosed
individual firm names, their individual points of noncompliance and progress on improving
working conditions.
C. Cambodian Compliance: Theory and Empirical Strategy
The Acemoglu and Jackson (2015) framework requires some modification to adapt it to
the Cambodian context. The adapted framework motivates and guides our empirical analysis.
1. Theoretic Framework
4 Core labor standards are freedom of association and collective bargaining, nondiscrimination, exploitative child labor and forced labor. 5 Shea et al. (2010) is one recent paper that uses synthesis reports to analyze BFC.
8 | P a g e
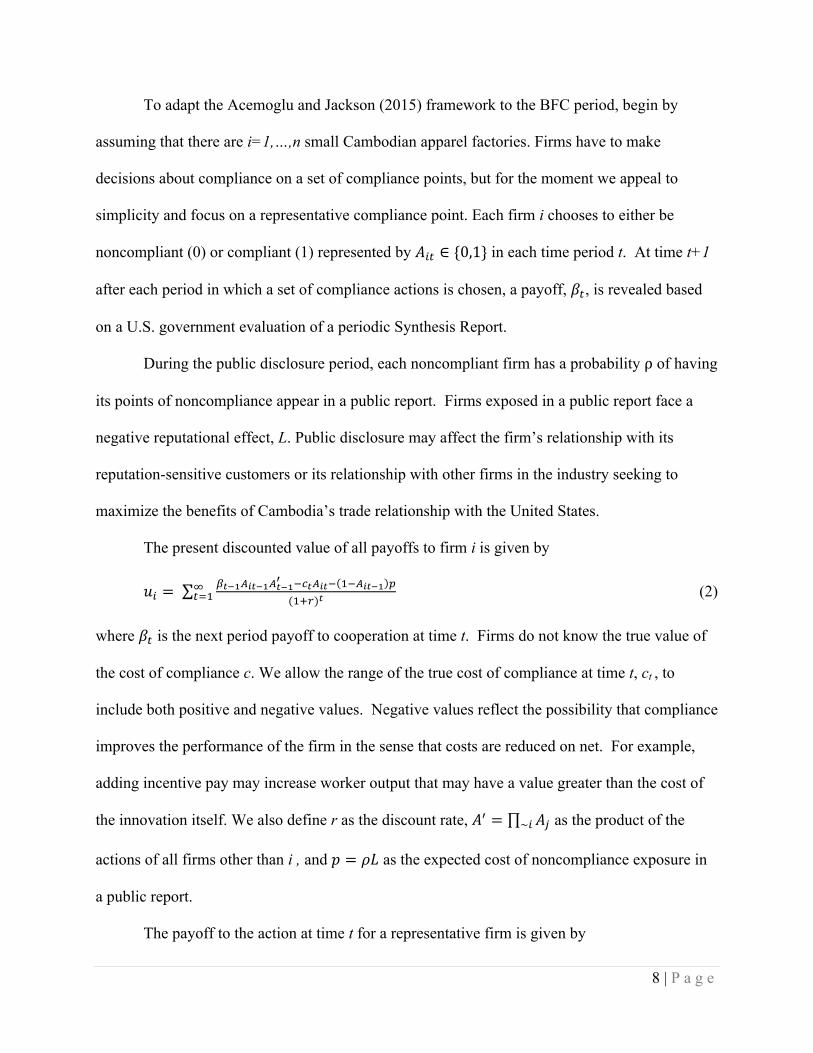
To adapt the Acemoglu and Jackson (2015) framework to the BFC period, begin by
assuming that there are i=1,…,n small Cambodian apparel factories. Firms have to make
decisions about compliance on a set of compliance points, but for the moment we appeal to
simplicity and focus on a representative compliance point. Each firm i chooses to either be
noncompliant (0) or compliant (1) represented by 𝐴!" ∈ {0,1} in each time period t. At time t+1
after each period in which a set of compliance actions is chosen, a payoff, 𝛽!, is revealed based
on a U.S. government evaluation of a periodic Synthesis Report.
During the public disclosure period, each noncompliant firm has a probability ρ of having
its points of noncompliance appear in a public report. Firms exposed in a public report face a
negative reputational effect, L. Public disclosure may affect the firm’s relationship with its
reputation-sensitive customers or its relationship with other firms in the industry seeking to
maximize the benefits of Cambodia’s trade relationship with the United States.
The present discounted value of all payoffs to firm i is given by
𝑢! = !!!!!!"!!!!!!
! !!!!!"! !!!!"!! !(!!!)!
!!!! (2)
where 𝛽! is the next period payoff to cooperation at time t. Firms do not know the true value of
the cost of compliance c. We allow the range of the true cost of compliance at time t, ct , to
include both positive and negative values. Negative values reflect the possibility that compliance
improves the performance of the firm in the sense that costs are reduced on net. For example,
adding incentive pay may increase worker output that may have a value greater than the cost of
the innovation itself. We also define r as the discount rate, 𝐴! = 𝐴!~! as the product of the
actions of all firms other than i , and 𝑝 = 𝜌𝐿 as the expected cost of noncompliance exposure in
a public report.
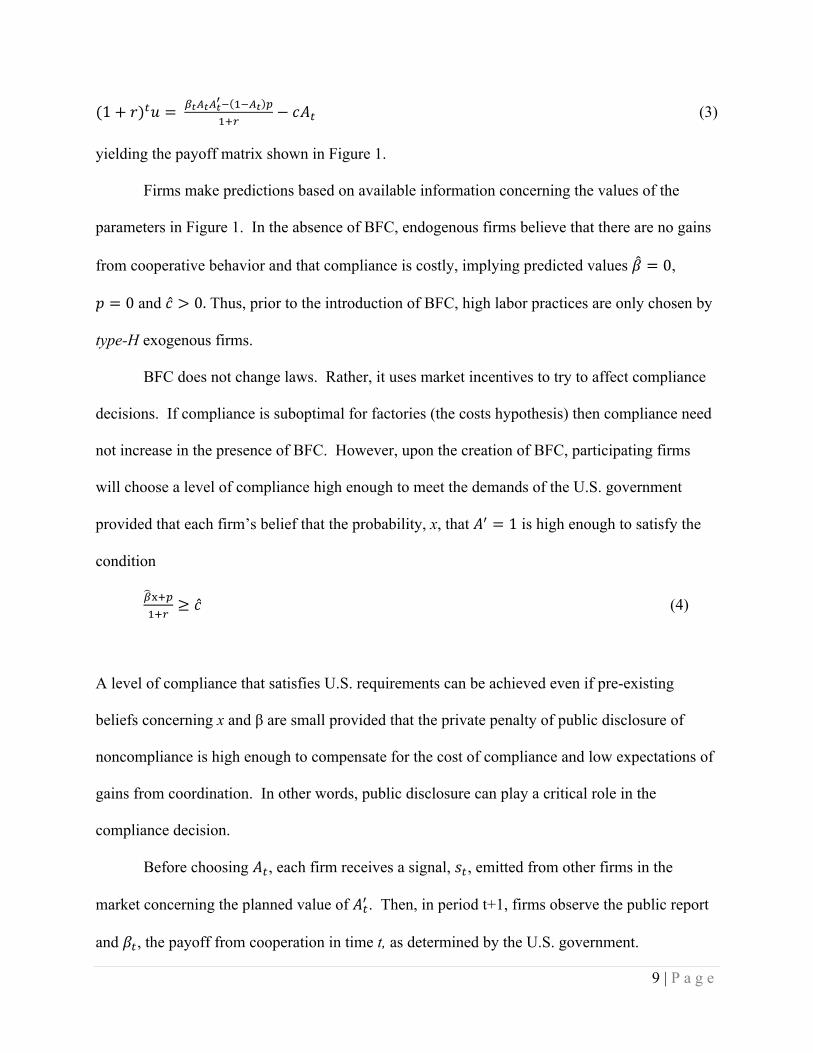
The payoff to the action at time t for a representative firm is given by
9 | P a g e
(1+ 𝑟)!𝑢 = !!!!!!!! !!!! !!!!
− 𝑐𝐴! (3)
yielding the payoff matrix shown in Figure 1.
Firms make predictions based on available information concerning the values of the
parameters in Figure 1. In the absence of BFC, endogenous firms believe that there are no gains
from cooperative behavior and that compliance is costly, implying predicted values 𝛽 = 0,
𝑝 = 0 and 𝑐 > 0. Thus, prior to the introduction of BFC, high labor practices are only chosen by
type-H exogenous firms.
BFC does not change laws. Rather, it uses market incentives to try to affect compliance
decisions. If compliance is suboptimal for factories (the costs hypothesis) then compliance need
not increase in the presence of BFC. However, upon the creation of BFC, participating firms
will choose a level of compliance high enough to meet the demands of the U.S. government
provided that each firm’s belief that the probability, x, that 𝐴! = 1 is high enough to satisfy the
condition
!!!!!!!
≥ 𝑐 (4)
A level of compliance that satisfies U.S. requirements can be achieved even if pre-existing
beliefs concerning x and β are small provided that the private penalty of public disclosure of
noncompliance is high enough to compensate for the cost of compliance and low expectations of
gains from coordination. In other words, public disclosure can play a critical role in the
compliance decision.
Before choosing 𝐴!, each firm receives a signal, 𝑠!, emitted from other firms in the
market concerning the planned value of 𝐴!! . Then, in period t+1, firms observe the public report
and 𝛽!, the payoff from cooperation in time t, as determined by the U.S. government.
10 | P a g e
The distribution of 𝛽! is described by the density function 𝑓!(β!) when condition
𝐴!𝐴!! = 1 was satisfied at time t and by the density function 𝑓!(β!) otherwise. 𝑓!/𝑓! is taken to
be increasing in β. Therefore, the posterior probability that 𝐴!!!! = 1 given 𝐴!!! = 1 and the
realization of 𝛽!!! at time t is
Φ!!!! (𝛽!!!, 𝑥) =
!!(!!!!)!!!(!!!!)!!!!(!!!!)(!!!)
. (5)
Given the signal and the realization of β, each firm forms a linear prediction of β as a
function of the historical relationship between the signal and the payoff from cooperation. The
predicted value of 𝛽! at time t is given by
𝛽! = 𝑎!!! + 𝑏!!! 𝑠! (6)
where 𝑎!!! and 𝑏!!! are the estimates of a and b based on information available through time t-
1. The parameter a represents the gain from coordination factories expect to receive regardless
of the signal received by other factories, and b represents the influence of the signal on the
expected benefits of coordination. The probability that 𝐴!! = 1 conditional on the signal 𝑠! is
given by
𝜑!(𝑠! , 𝑥) =!!(!!)!
!!(!!)!!!!(!!)(!!!). (7)
Meeting the minimal compliance standard at time t will be a best response if the expected
value of (1+ 𝑟)!𝑢 is positive when 𝐴! = 1. Substituting the values of the payoff matrix into
equation (1) using the probability in (7) yields the following condition for 𝐴! = 1:
!!!! !!,! !!!!!
≥ 𝑐! (8)
11 | P a g e
At the end of the public disclosure period, the private penalty for noncompliance, p, falls
to zero. The condition for persistence in compliance becomes
!!(!!)!! !!,!!!!
≥ 𝑐! (9)
Figure 2 summarizes the model’s full information structure and the results. Prior to the
establishment of BFC, endogenous firms believe that 𝛽 = 0 and 𝑐 > 0. All endogenous firms
therefore choose noncompliance. With the creation of BFC, firms will come into compliance
provided that the inequality in (4) is satisfied. In subsequent periods, during the public
disclosure period, endogenous firms will choose 𝐴 = 1 provided that the inequality in (8) is
satisfied.
At the end of the public disclosure period, the private punishment for noncompliance
disappears. That is, 𝑝 = 0. In the extreme case, the costs hypothesis predicts that compliance
falls to zero for endogenous factories. Continuing compliance is guaranteed under either of two
conditions. (1) The Learning Hypothesis: High working conditions will continue if experience
with compliance has led firms to believe that the cost of compliance is non-positive, 𝑐 ≤ 0. That
is, firms learn about the sign and size of c, during a period of compliant behavior. (2) The Norm
Hypothesis. If c is positive and large, however, a high compliance norm will have emerged if
𝐴 = 1 is a best response when 𝑝 = 0 and 𝑥 = 1 for all values of the signal, s. That is
!!!!!! !,!!!!
≥ 𝑐!. (9’)
This condition implies that there is a benefit to the factory from coordination even
without a signal about the compliance behavior from other factories. However, if a high
compliance norm has not formed, then, given the high value of c, a factory will eventually
12 | P a g e
receive a signal so low that the inequality in (9) is not satisfied. At that point, cooperation will
begin to unravel.
2. Empirical Strategy
This model suggests a set of theoretical predictions that we can take to the data by
comparing firm responses to events in different periods. Noting that laws and government
enforcement remain relatively constant, changes in compliance are unlikely to be due to the
existence of laws themselves.
We implement a series of tests to evaluate the three hypotheses. The first test compares
the costs hypothesis against the other two hypotheses. Identification comes from variation in
compliance over time controlling for known factory-level determinants of compliance. New
compliance after the formation of BFC would be attributable to the perceived cost of public
disclosure of noncompliance. If compliance costs are known and high then first-visit compliance
should revert to baseline compliance after the end of the public disclosure period. Since the
costs hypothesis suggests a significant reversion to noncompliance at the end of the public
disclosure period, we first present basic stylized facts about the pattern of compliance over time.
The second and third tests are meant to distinguish between the norms and learning
hypotheses. If costs and benefits from coordination are not known, then the remaining
hypotheses (norms and learning) can be evaluated using the changes made by firms after
experimentation with compliance. Learning is represented by a change in beliefs about c.
Persistence in compliance is predicted if firms learn from a period of high compliance that they
over-estimated c. Compliant firms acquire information about the size and sign of c. If firms
initially over-estimate c, a period of High working conditions will lead to updating. A reduction
13 | P a g e
of each firm’s perception of c will increase the range of the value of s for which High
compliance is a best response. That is, falling perceptions of c increase the possibility that the
constraint in (9) is satisfied.
Learning may be apparent if the condition for a High working conditions norm is not
satisfied. Identification necessary to disentangle norms and learning follows from factory
behavior after the end of public disclosure. Recall that a High working conditions norm requires
that firms choose High working conditions no matter what signal they receive about the
compliance behavior of other factories. In the absence of a norm, condition (9) will be satisfied
for all values of 𝛽 ≥ 0 and 𝜑 ∈ [0,1] only if 𝑐 < 0. That is, compliance will persist in the
absence of a norm only if firms learn that the net cost of compliance is negative. At the end of
public disclosure and in the absence of a High working conditions norm, firms will remain in
compliance on those points for which they come to believe that 𝑐 < 0.
To evaluate these hypotheses, we introduce a new term. Define retrogression as the
movement from noncompliance to compliance and back to noncompliance. Retrogression
requires three periods of observation on A. Retrogression is predicted after the end of the public
disclosure period if public disclosure created a high compliance equilibrium even though
!!!!!
< 𝑐. If !!!!!
< 𝑐 at time t=0, firms will choose new compliance until the end of the public
disclosure period provided that !!!!!!!
> 𝑐. If at the end of the public disclosure period firms
continue to believe that !!!!!
< 𝑐 for some points of compliance, retrogression in some
compliance points will occur.
Our second test, therefore, estimates factories’ retrogression behavior after the end of the
public disclosure period (controlling for other factors that may also affect compliance).

14 | P a g e
Specifically, the conjecture that public disclosure created compliance as an equilibrium but that
neither learning nor a high compliance norm emerged (and compliance costs are high) is
supported if factories initially improve compliance but then retrogress to the baseline after the
end of public disclosure. The conjecture that a high compliance norm (regardless of the cost of
compliance) emerged is supported if uniform compliance persisted after the end of the public
disclosure period. The conjecture that firms learned from a period of compliance that net
compliance costs were actually lower than expected but a high compliance norm did not emerge
is supported if compliance retrogression occurs in some but not all compliance points at the end
of public disclosure.
To further evaluate the difference between the norms and the learning hypotheses, our
third test estimates the relationship between firm survival and compliance. Specifically,
compliance related to a norm or fear of public disclosure should only be spuriously associated
with factory survival. Compliance on points for which costs are, on net, negative, should raise
the probability of survival. Furthermore, exploring the relationship between firm survival and
compliance allows us to address concerns about endogeneity.
All three tests require very detailed data that track compliance over time at the factory
and compliance point level, as well as include information that allows us to control for possible
confounding factors. We describe these data in the next section.
III. Data
The data analysis primarily employs factory-level monitoring reports generated by the
BFC Program. Table 1 reports the number of factories by visit year for the 2001-2011 period.
New firms entering each year (with a first visit) and existing firms accumulating visits generate
15 | P a g e
the table’s upper triangular structure. The total of 2,113 total observations is the product of 446
individual factories times each factory’s number of individual visits. The maximum number of
visits observed for any factory is 10. Visits typically fall about ten months apart, but the time
between visits varies widely. National ownership also varies. The vast majority of the sample
(93.7%) is foreign-owned, with 42 percent owned by China, Hong Kong SAR, and Macau SAR,
23.3 percent owned by Taiwan, and less than 3 percent owned by Western countries.
Table 1 also reveals significant attrition in the data. While there are a total of 446
factories with an initial visit, there are only 241 with a fifth visit. Much of the lack of 5th visit
observations comes from the fact that the second “wave” is relatively large. Since tracking
factories over time is important, we take care to identify factories that have actually closed rather
than simply changed names. We combine an official list maintained by the BFC programme of
confirmed closings and we compare the addresses of the factories over time. Fewer than five
have the same address with distinct names. Factories that close and then re-open at another
location with a different name and different ownership are treated as separate factories.
Working conditions are evaluated using 405 individual questions, such as “Has
management appointed a liaison officer?” “Are women paid their maternity leave benefits either
before or during leave?” and “Does management keep an up-to-date list showing each worker's
schedule for weekly time off?” Questions are coded as binary variables that indicate compliance
or noncompliance. Of the 405 questions, 62 show no variation across both factory and visit.
These questions are dropped from the analysis.
Since it is cumbersome to report variation in 343 questions, the remaining questions are
first aggregated heuristically to create 31 compliance categories. The categories roughly
conform to groups commonly used by the ILO. Factor analysis is then applied to the 31
16 | P a g e
compliance categories in an attempt to identify the underlying HR systems. Factor analysis
helps identify innovations in human resource management systems that may explain common
changes in individual categories. The core standards (child labor, forced labor and
discrimination) are considered to be zero-tolerance and exhibit little variation in compliance. An
orthogonal rotation is then applied to the remaining categories, generated by applying the
principal-factor method to the remaining 28 of the 31 compliance categories.6 The resulting
matrix identifies nine possible factors, but none of the maximum values appears in factors 5 and
8, so we focus our attention on the remaining factors. Although involving a combination of
subjective judgment and interpretation, it appears that the emerging pattern allows us to sort the
31 categories into the 6 factors shown in Table 2.
The first factor, Communication and Workplace Systems, requires a deep change in
factory organization and the relationship between workers and management. Traditional
workplaces are typically characterized by one-way communication and little information sharing.
By contrast, a modern workplace has developed systems for two-way communication, teamwork,
problem-solving and information systems. Innovations in factor 1 are, in many ways, the most
challenging for a factory as they involve a fundamental change in the nature of the relationships
and responsibilities within the workplace.
Factor 2, Occupational Safety and Health, introduces ambient working conditions as
another dimension to the compensation package. Workers may or may not value improvements
in health and safety, particularly if they come at the expense of pecuniary compensation.
6 The principal-components factor method is a common alternative, but this method assumes that the commonalities are equal to one. The average of our uniqueness estimates is just over 0.65, and the principal-components method is most appropriate for uniqueness values close to zero. In our case, therefore, the principal-components analysis is probably not appropriate.
17 | P a g e
HR Innovations (Factor 3) and Compensation (Factor 4) relate to factory practices such
as clarifying the terms of employment, paying wages as promised and adhering to rules
regulating the length of the work day and days off. These practices are those that most clearly
differentiate a sweatshop from a modern workplace. In sweatshops workers are typically viewed
like machines and compensation as a cost, with little appreciation for human factors in job
design. Excess hours of work and exploitation wages are the consequence. Managers in a
modern workplace view hours and wages as part of a compensation package that is designed to
efficiently elicit work effort. Factories constrained from engaging in exploitative wages and
hours by BFC may discover the productivity-enhancing power of paying wages as promised and
setting work hours to avoid the point of negative marginal productivity. Once wages and hours
are seen as a mechanism for eliciting work effort, negative motivational techniques such as
verbal and physical abuse are no longer necessary or even desirable.
The fifth factor, Unions, concerns the free operation of unions which, again, is one of the
core labor standards but not quite as sensitive as Factor 6 (Core Labor Standards). Core Labor
Standards includes the core labor standards that enjoy near universal acceptance and are zero-
tolerance points of compliance for the many governments and reputation-sensitive buyers.
Average wages are calculated from household surveys using survey data from 2002,
2004, 2007, 2008 and 2009. Wage growth between survey years is estimated and then used to
interpolate average wages in the textile and garment sector. Our estimates of apparel output
prices are unit values (in terms of square meter equivalent) using data provided on-line by the
U.S. Office of Textiles and Apparel (OTEXA). The unit values are calculated following Harrigan
and Barrows (2009). The six-month moving averages of the monthly price and wage series are
depicted in Figure 3. Wages and prices have been rising since 20001, which is consistent with an
18 | P a g e
increase in labor demand. The effects of the financial crisis are evident in the initial drop in
prices and the subsequent drop in wages.
IV. Empirical Analysis
To evaluate the model’s predictions above, we follow three steps. First, we present very
basic aggregate trend analysis to establish some of the characteristics of compliance over time
through the different periods discussed in the analytical framework. Second, we formally
evaluate determinants of retrogression. Our third test evaluates closure probabilities. We extend
the empirical analysis by exploring the potential effect on the results of several confounding
factors, including endogeneity and other alternative explanations.
A. Aggregate Trend Analysis
To evaluate the costs hypothesis, we begin with an analysis of aggregate trends in
compliance. The aggregate changes in compliance are illustrated in Figure 4 for firms with and
without a reputation sensitive buyer. Factories with a reputation sensitive buyer have higher
average compliance. For both groups of factories, the level of compliance is higher at the end of
the period than at the beginning.
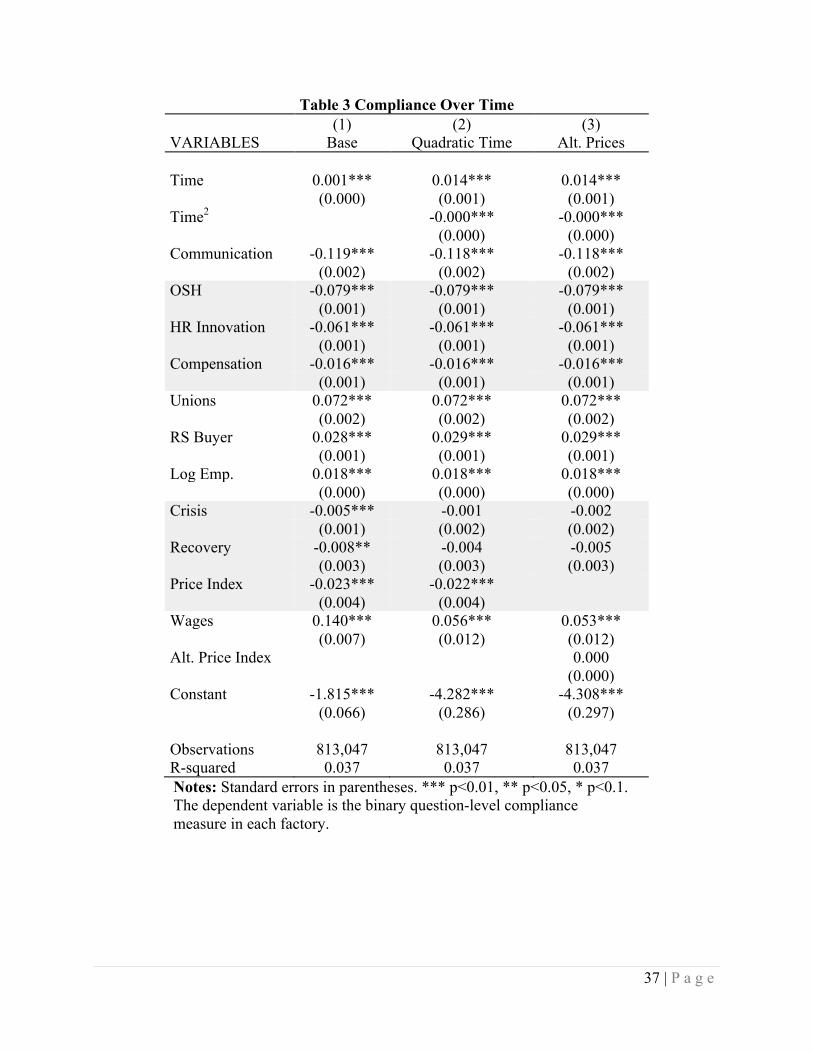
OLS regressions of the determinants of compliance are reported in Table 3. A time trend
is added as a proxy for information acquired through compliant behavior. OLS estimates and
standard errors are reported for three specifications. Column (1) contains the simplest
specification. Column (2) includes a quadratic time term to more accurately reflect the likely
possibility that the most learning occurs in the immediate period after experimentation with
19 | P a g e
compliance. In column (3), the Harrigan-Barrows price index is replaced by Cambodia’s export
price measured by unit value.
Note first, that the compliance rate varies by compliance type. Factories are more likely
to be compliant on points related to Compensation, Occupational Safety and Health and HR
Innovations than on Unions. Larger factories also have higher average compliance.
The model shows that the compliance decision is affected by many potentially
confounding factors. First, note that a decline in compliance is predicted if wages globally
decline. A fall in the competitive wage raises the cost of compliance with a compensation
package. Increasing c raises the necessary signal for which H is a best response. We confirm this
result when we add wages in Table 3. Compliance is positively related to wages with the
coefficient ranging from 0.053 to 0.140 depending on how prices are measured.
Second, the value of 𝛼would vary across firms if some firms sell to reputation-sensitive
buyers. Average compliance for firms with a reputation sensitive buyer (0.028) is higher than
for other firms and is independent of specification.
Third, compliance declines during the financial crisis beginning in 2008. The financial
crisis may have tightened capital constraints, making investments in compliance more
challenging.
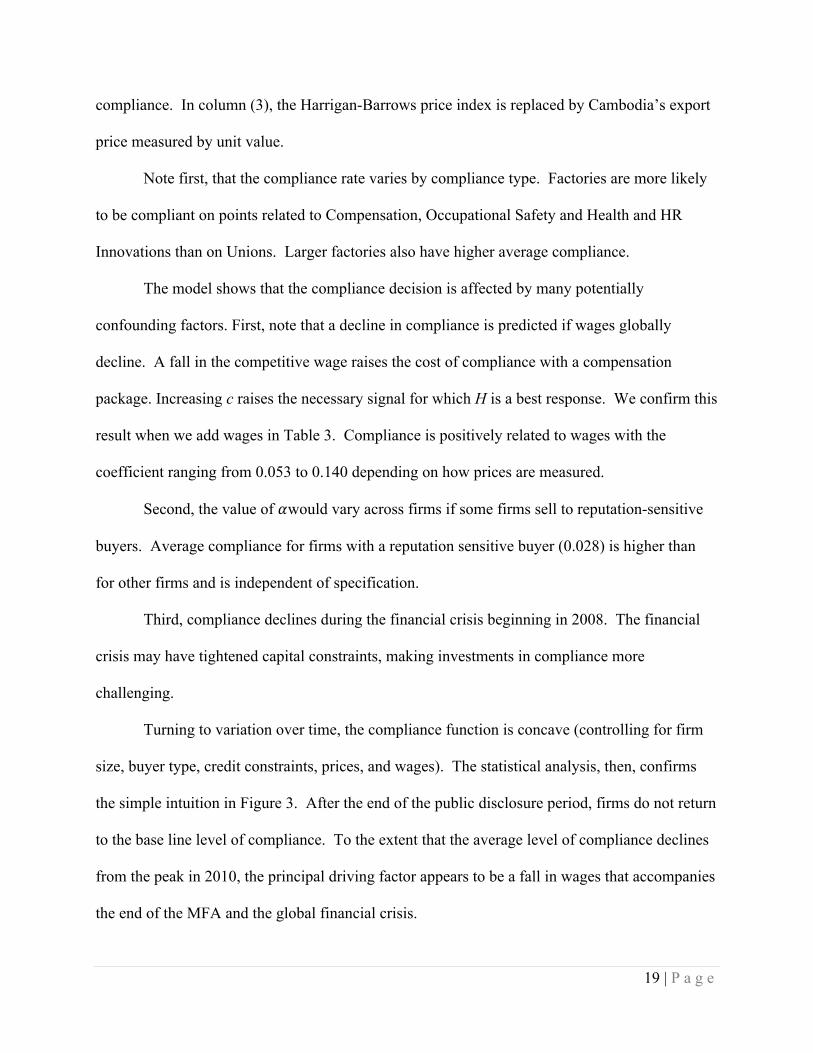
Turning to variation over time, the compliance function is concave (controlling for firm
size, buyer type, credit constraints, prices, and wages). The statistical analysis, then, confirms
the simple intuition in Figure 3. After the end of the public disclosure period, firms do not return
to the base line level of compliance. To the extent that the average level of compliance declines
from the peak in 2010, the principal driving factor appears to be a fall in wages that accompanies
the end of the MFA and the global financial crisis.
20 | P a g e
Simple OLS results of the aggregate trends over time show that the null that compliance
in 2012-2013 is the same as compliance 2005-2006 is rejected (t-statistic=4.24). The same
results reject the null that average compliance between factories with reputation-sensitive buyers
and factories with non-reputation sensitive buyers is equal (t-stat 10.17). The rate of
improvement in compliance slows after the end of the public disclosure period.
The result that compliance increases dramatically at first and that the average compliance
rate does not return to the baseline weighs heavily against the costs hypothesis. Firms remain
fundamentally compliant after the end of the public disclosure period. The path of compliance
for firms lacking a reputation sensitive buyer does not diverge from that of firms with a buyer
that requires a minimum level of compliance. This evidence weighs against both the laws and
costs hypothesis in the sense that after the end of the MFA and the end of the public disclosure
period, firms remained largely compliant.
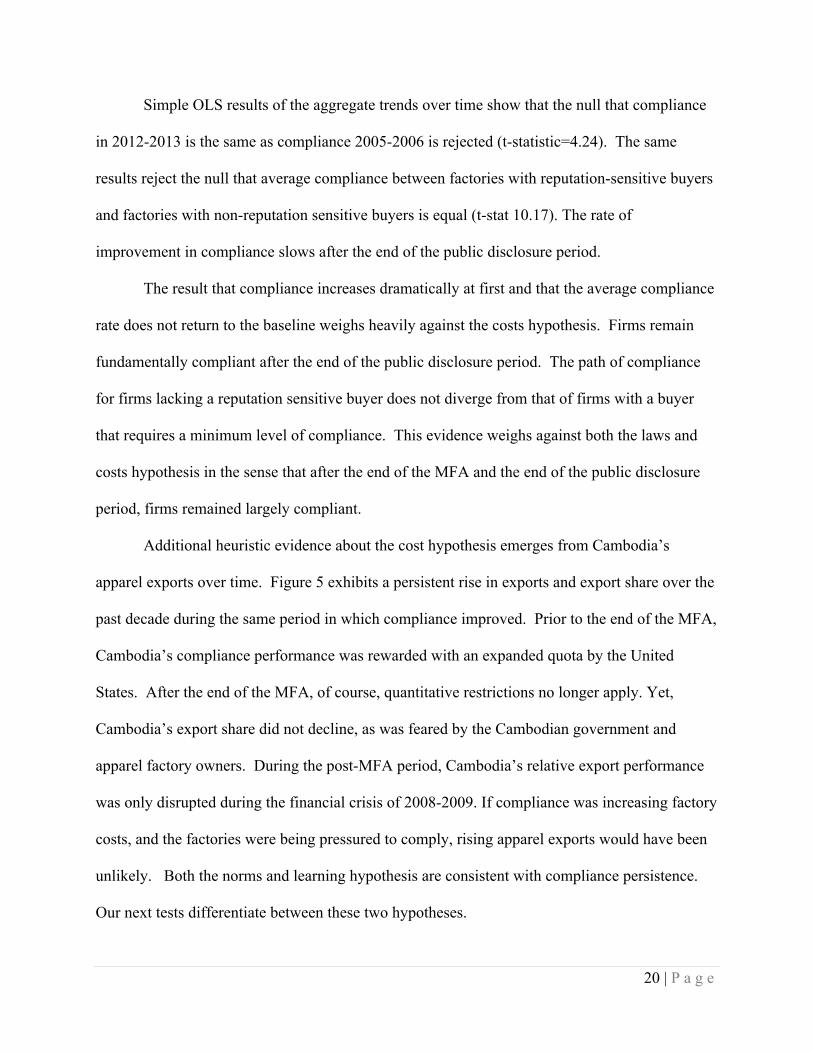
Additional heuristic evidence about the cost hypothesis emerges from Cambodia’s
apparel exports over time. Figure 5 exhibits a persistent rise in exports and export share over the
past decade during the same period in which compliance improved. Prior to the end of the MFA,
Cambodia’s compliance performance was rewarded with an expanded quota by the United
States. After the end of the MFA, of course, quantitative restrictions no longer apply. Yet,
Cambodia’s export share did not decline, as was feared by the Cambodian government and
apparel factory owners. During the post-MFA period, Cambodia’s relative export performance
was only disrupted during the financial crisis of 2008-2009. If compliance was increasing factory
costs, and the factories were being pressured to comply, rising apparel exports would have been
unlikely. Both the norms and learning hypothesis are consistent with compliance persistence.
Our next tests differentiate between these two hypotheses.
21 | P a g e
B. Proportional Hazard Estimation of Retrogression
The richly detailed firm-level compliance data allow us to evaluate the determinants of
retrogression, which is defined in the analytical framework as a move from noncompliance to
compliance and back to noncompliance at the item level. An increase in retrogression at the end
of the public disclosure period would support the theoretical model because retrogression should
increase when p drops after the end of the public disclosure period in the absence of learning or a
High compliance norm.
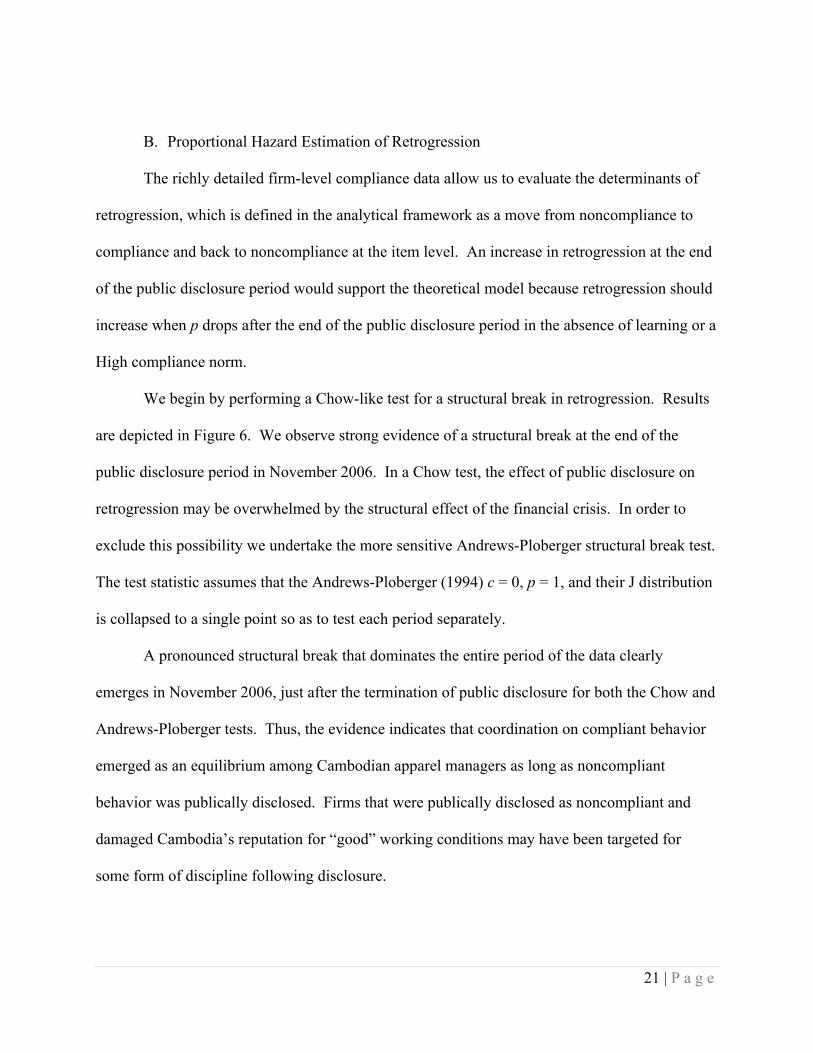
We begin by performing a Chow-like test for a structural break in retrogression. Results
are depicted in Figure 6. We observe strong evidence of a structural break at the end of the
public disclosure period in November 2006. In a Chow test, the effect of public disclosure on
retrogression may be overwhelmed by the structural effect of the financial crisis. In order to
exclude this possibility we undertake the more sensitive Andrews-Ploberger structural break test.
The test statistic assumes that the Andrews-Ploberger (1994) c = 0, p = 1, and their J distribution
is collapsed to a single point so as to test each period separately.
A pronounced structural break that dominates the entire period of the data clearly
emerges in November 2006, just after the termination of public disclosure for both the Chow and
Andrews-Ploberger tests. Thus, the evidence indicates that coordination on compliant behavior
emerged as an equilibrium among Cambodian apparel managers as long as noncompliant
behavior was publically disclosed. Firms that were publically disclosed as noncompliant and
damaged Cambodia’s reputation for “good” working conditions may have been targeted for
some form of discipline following disclosure.

22 | P a g e
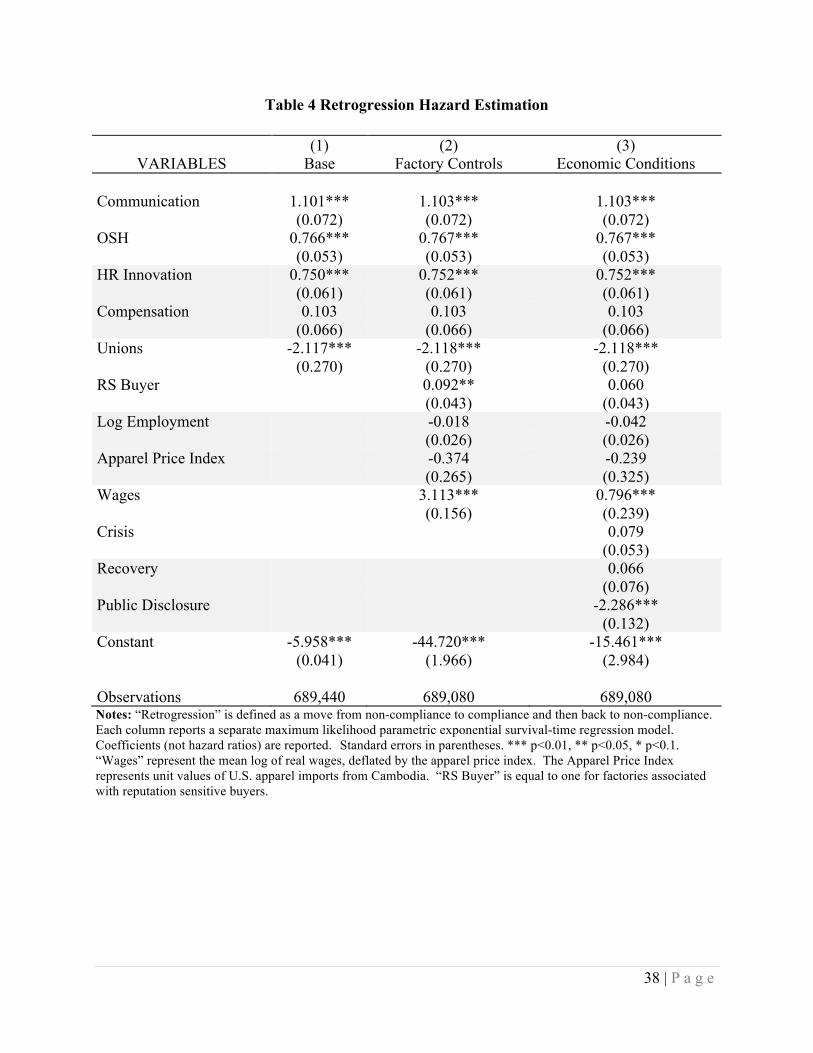
For a more formal analysis, we fit compliance retrogression to a Cox Proportional Hazard
function. Results are reported in Table 4. Public disclosure (-2.286) is a statistically significant
and negative predictor of retrogression. During the public disclosure period, the probability of
retrogression is lower than in the aftermath. Such an outcome is consistent with a coordinating
effect of BFC that controls free riding on the reputational benefits generated by compliant firms.
To summarize, the empirical results are consistent with the theoretical prediction that
coordination on high compliance was facilitated by public disclosure. When public disclosure
ended, coordination on high compliance decays to some degree, suggesting that a High
compliance norm was not established. It is important to point out, however, that compliance does
not fall back to pre-BFC levels once public disclosure ends, which is consistent with the learning
hypothesis. Pre-BFC levels of noncompliance appear not to have been cost minimizing for
factories. The behavior in the post-public disclosure period suggests that either the learning
hypothesis applies or there are significant confounding factors, including endogeneity,
explaining the sustained compliance levels. We explore these in the next section.
C. Survival
The learning hypothesis is based on the contention that firms initially overestimate c. We
explore this hypothesis in greater detail by estimating the relationship between becoming
compliant and subsequent factory survival. Survival during the financial crisis is predicted by
new compliance if managers learn from a period of induced experimentation that c is lower than
previously believed.
Of course, endogeneity is a significant concern. Factories with high quality managers are
more likely to survive. Furthermore, firm processing of information concerning the size and sign

23 | P a g e
of c depends on firm managerial quality. High quality firms will make better HR management
decisions than low quality managers and will be more likely to survive. If high quality managers
learn that good HR function is profit-maximizing, then compliance should be correlated with
survival during the financial crisis.
We therefore take advantage of this potential endogeneity to identify the true sign of c.
We identify good management practices by observing the practices of factories that survived the
financial crisis. If c is, in fact, negative, then new compliance increases production efficiency.
Firms choosing High working conditions are more likely to survive than firms choosing Low
working conditions independent of norms. In other words, (by definition) good managers make
good decisions. Evidence that suggests that managers in factories that survive (i.e. “good”
managers) are also choosing to increase compliance is consistent with the learning hypothesis.
1. Kaplan-Meier Survival Estimates
One of the first steps in survival analysis is to analyze the Kaplan-Meier survival
function. Figure 7 demonstrates that the Kaplan-Meier survival estimate falls with the number of
visits. Apparel manufacturing, especially at the lower end of the value chain, is risky. Turnover
is high. Factory births and deaths are common.
One way to evaluate whether or not improvement in working conditions affects survival
is to compare the survival probability conditional only on whether or not factories increased
compliance prior to closing (or the end of the sample). Disaggregating Kaplan-Meier survival
functions between factories that improved compliance between the first and second visit for
various compliance areas, as shown in Figure 8, suggests that factories that increased compliance
had higher survival rates.
24 | P a g e
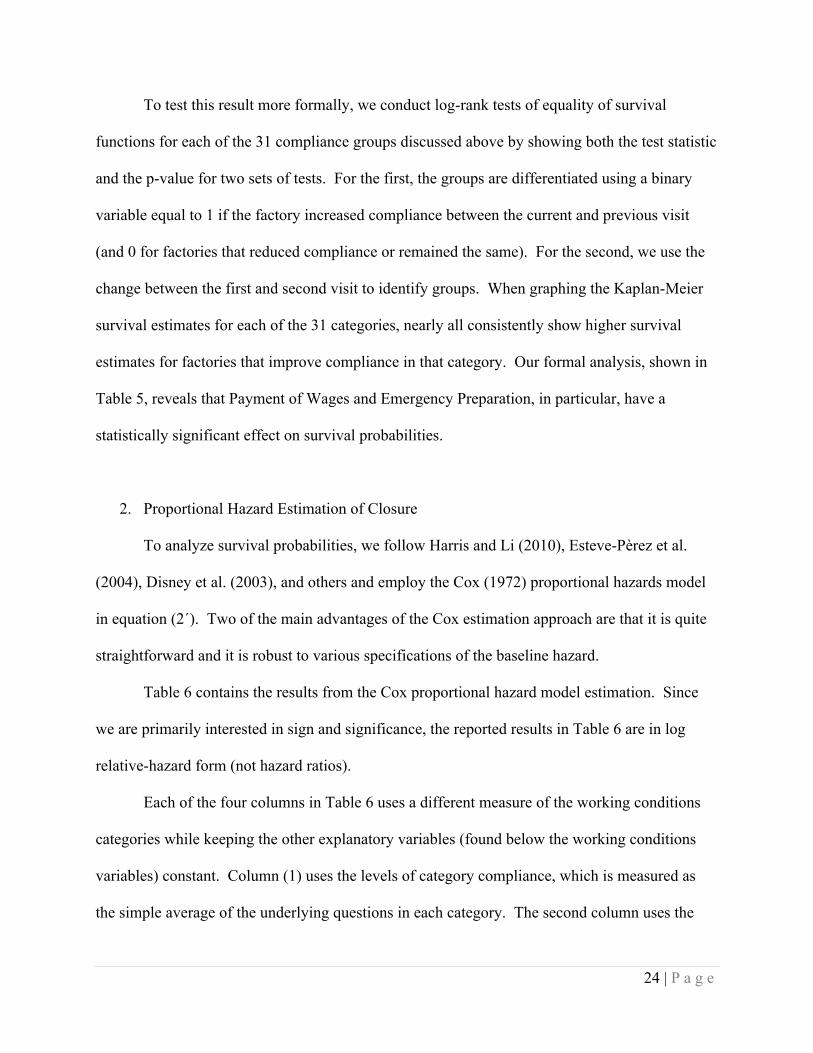
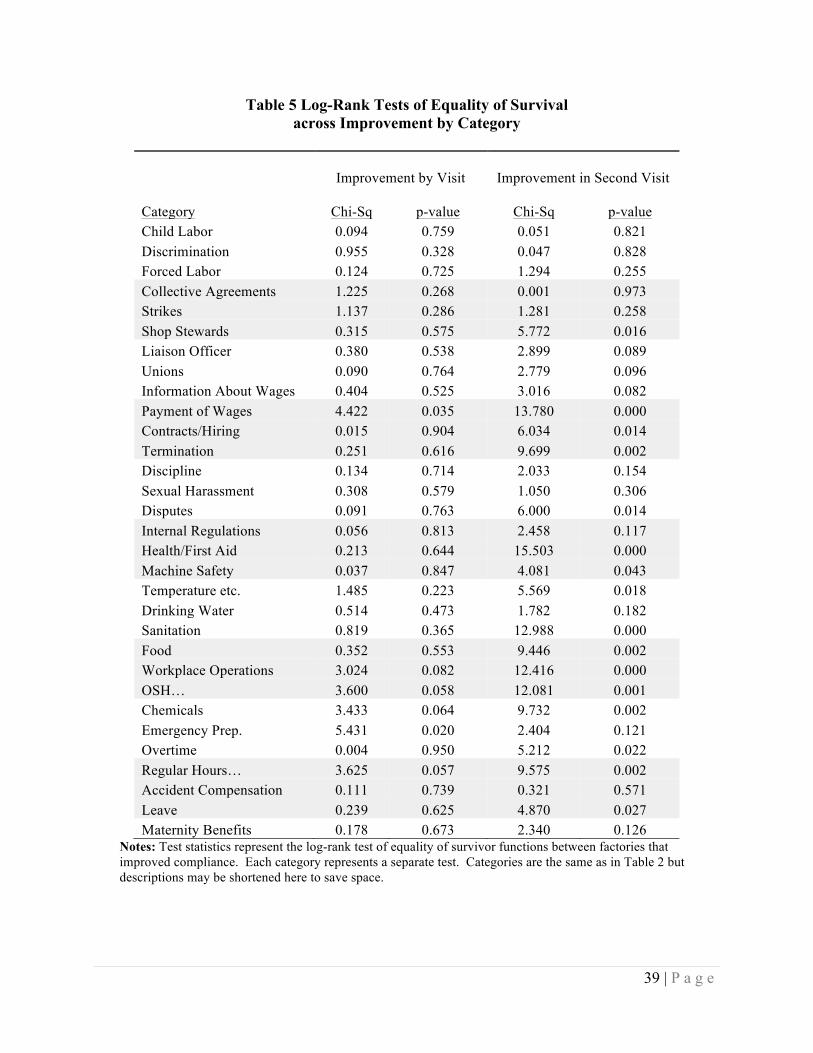
To test this result more formally, we conduct log-rank tests of equality of survival
functions for each of the 31 compliance groups discussed above by showing both the test statistic
and the p-value for two sets of tests. For the first, the groups are differentiated using a binary
variable equal to 1 if the factory increased compliance between the current and previous visit
(and 0 for factories that reduced compliance or remained the same). For the second, we use the
change between the first and second visit to identify groups. When graphing the Kaplan-Meier
survival estimates for each of the 31 categories, nearly all consistently show higher survival
estimates for factories that improve compliance in that category. Our formal analysis, shown in
Table 5, reveals that Payment of Wages and Emergency Preparation, in particular, have a
statistically significant effect on survival probabilities.
2. Proportional Hazard Estimation of Closure
To analyze survival probabilities, we follow Harris and Li (2010), Esteve-Pèrez et al.
(2004), Disney et al. (2003), and others and employ the Cox (1972) proportional hazards model
in equation (2´). Two of the main advantages of the Cox estimation approach are that it is quite
straightforward and it is robust to various specifications of the baseline hazard.
Table 6 contains the results from the Cox proportional hazard model estimation. Since
we are primarily interested in sign and significance, the reported results in Table 6 are in log
relative-hazard form (not hazard ratios).
Each of the four columns in Table 6 uses a different measure of the working conditions
categories while keeping the other explanatory variables (found below the working conditions
variables) constant. Column (1) uses the levels of category compliance, which is measured as
the simple average of the underlying questions in each category. The second column uses the
25 | P a g e
difference in the simple category measures between the first and second visits and holds that
value constant across all subsequent periods. Column (3) uses the binary indicator which is
equal to 1 if the factory improved in that category between the first and second visit and zero
otherwise.
For the purposes of comparison, we begin by measuring the working conditions variables
by average compliance, as reported in Column 1. Note first, that firms with a reputation
sensitive buyer (-0.957) are less likely to fail and the probability of closure rises during the
financial crisis (1.836) and its aftermath (1.737). Turning to the working conditions variables,
the impact of compliance on closure depends on the compliance category. Higher compliance in
Communication (-1.512) and OSH (-2.018) lower the probability of closure while higher
compliance on Compensation (2.057) raises the probability of closure.
Results from overall compliance suggest that the relationship between survival and
compliance depends on the type of compliance. Our interest, however, is specifically in changes
in compliance induced by BFC. Columns (2)-(4) examine the impact of changes in compliance
after entry into the Program. Column (2) considers an improvement between periods and
columns (3) and (4) focus specifically at the change in compliance immediately following the
first visit. Findings are most pronounced in column (4). Improvements in Communication (-
0.507), Innovative Wage Practices (-0.459) and Compensation (-0.541) are all negatively
associated with closure at the one to five percent level of significance.
3. Additional Confounding Factors
It is clear from Table 6 that buyer type and credit constraints are significant determinants
of probability of survival. A reputation sensitive buyer lowers the probability of closure while

26 | P a g e
credit constraints increase the probability of closure. It is possible, then, that buyer type and
credit constraints are confounding the causal relationship between new compliance and survival.
Buyer type and/or credit constraints may be jointly determining survival and new compliance
persistence. In order to eliminate buyer type and credit constraints and confounds, it is necessary
to determine whether or not buyers and credit constraints are determining retrogression.
Credit constraints for exporters significantly tightened during the financial crisis of 2008-
2009. If the credit constraint is binding on compliance choices, retrogression should exhibit a
structural break during the crisis period. As discussed above, the Chow test and the more
sensitive Andrews-Ploberger test are employed to identify a structural break in retrogression
during the crisis period. As can be seen in Figure 6, the test statistic for a structural break rises
more clearly around the time of the financial crisis, indicating that credit may have been a weak
constraint on compliance.
Co-determination of survival and human resource management innovations by buyer type
can be rejected if buyer type is not a significant variable in a firm’s decision to retrogress. This
test is performed by estimating the determinants of retrogression. Our particular interest is
whether the coefficient of the RS buyer type variable is statistically significantly different from
zero.
The coefficient on the reputation sensitive buyer variable (RS Buyer) in Table 4 is not
statistically different from zero, indicating that the presence of a reputation sensitive buyer does
not affect a firm’s decision concerning retrogression in compliance. Notice also that
retrogression does not accelerate during the financial crisis. Thus, credit constraints that
tightened during the financial crisis do not appear to have caused firms to backslide in BFC-
induced compliance.

27 | P a g e
Rather, the significant determining variable in retrogression is wages. To the extent that
retrogression accelerates during the crisis period, the causal factor appears to be a fall in wages
relative to output price rather than a contraction of credit.
The evidence, then, is that new compliance positively predicts survival. Retrogression
and survival are not jointly determined by a firm’s principal customer, although it is possible that
compliance and survival are jointly determined by binding credit constraints. In contrast, public
disclosure of noncompliance deters retrogression.
V. Conclusions
The drive to improve working conditions in developing countries has met with limited
success. International labor standards and improved working conditions are commonly resisted
as anti-competitive, forcing firms and workers to deviate from market-determined wages and
working conditions. One possible reason that attempts to improve working conditions is that the
relative importance of various contributing factors – poor laws (or enforcement), high
compliance costs, local norms, or lack of technology – are not well understood.
Since poor conditions despite relatively strong legislation is a common problem in
developing countries, the goal of the paper is to evaluate the remaining three hypotheses. The
U.S.-Cambodian Trade Agreement may have pressured factories to adopt costly compliance
measures that would have reduced the competitiveness of the Cambodian apparel sector. We
present stylized facts to evaluate this hypothesis and show that Cambodian exports increased at
an increasing rate after the agreement, which is inconsistent with the costs hypothesis. We
further evaluate the costs hypothesis by estimating the relationship between compliance and

28 | P a g e
factory survival. Both approaches find little, if any, evidence that increasing compliance hurt
factories, raising the question about what was then driving compliance.
In this paper, we apply the Acemoglu and Jackson (2015) framework to attempt to
evaluate explanations for improving working conditions in Cambodia. Applying this framework
allows us to nest three different hypotheses that generate distinct empirical predictions. We test
these predictions using a novel concept – retrogression – and rich factory-level panel data from
Cambodia’s experiment with improving working conditions over the 2001-2014 period. This
natural experiment contains several phases that allow us to identify different empirical tests
nested in the model, including changing from a public disclosure to non-public disclosure model,
the loss of collective incentives (the end of the MFA), and changes in the global apparel market
(caused by the collapse of demand during the financial crisis).
Our results suggest that public disclosure of noncomplaince supported coordination on a
High working conditions equilibrium. During the public disclosure period, the cost of public
disclosure out-weighed the perceived cost of compliance, which fostered compliance. At the end
of the public disclosure period, however, retrogression in compliance increases. So, for some
signals, firms found it optimal to choose Low working conditions on the points of compliance for
which the cost of compliance exceeded the benefits. This result weighs against the hypothesis of
a sustaining high-compliance norm in the Acemoglu and Jackson (2015) sense of the term.
They argue that a norm is established if a play of High is a best response no matter what signal is
received in periods following a prominent agent.
However, if the failure to establish a norm during the public disclosure period were the
only factor affecting compliance choices, firms should have regressed to the baseline at the end
29 | P a g e
of the public disclosure period. The theoretical framework suggests that failure to completely
retrogress after the end of public disclosure is the consequence of learning.
Evidence that firms learn from compliance is provided by firm reactions to the end of
public disclosure. For firms lacking a reputation sensitive buyer who can access compliance
reports, only the firm itself sees the compliance report after the end of public disclosure. While
retrogression does accelerate in the post-public disclosure period, these firms remain
fundamentally in compliance despite the absence of a public external review. As a consequence,
we can conclude that a firm’s interest in remaining compliant is not solely driven by a concern
for its reputation.
Our third test, based in survival analysis, further corroborates the learning hypothesis. We
find first that new compliance, particularly after the first visit, positively predicts survival.
However, retrogression is not predicted by buyer type and is only weakly predicted by credit
constraints tightening during the financial crisis, thus ruling out the possibility that buyer type
and credit constraints are jointly determining compliance and survival.
The challenge to firms, however, is that acquiring the managerial knowledge necessary to
optimally manage human capital can be as challenging as for physical capital, yet firms may be
comparatively resistant to investing in human resource systems. A period of forced
experimentation in the form of labor compliance has the potential to reveal efficient labor
management practices. We conclude that firms acquired knowledge capital concerning optimal
labor management practices that increased their probability of survival. However, it is also the
case that there were marginal effects related to reputation and the decline in the equilibrium
wage. Retrogression accelerated when public disclosure ended. The interest in compliance
declined when factory managers could not observe each other’s compliance behavior. Thus,
30 | P a g e
during the public disclosure period BFC may have helped Cambodian factories control free
riding on the reputation created by compliant firms.
We make one final observation. The average compliance rate for firms with a reputation
sensitive buyer rises over the course of the program. Further, firms lacking a reputation sensitive
buyer achieve the same level of compliance by the end of the study period as firms with a
reputation sensitive buyer mid-way through the study period. Thus, the application of
international labor standards was more effective than international buyers at achieving minimal
working conditions and also reached those factories that do not fall under the discipline of global
supply chains.

31 | P a g e
References
Acemoglu, Daron and Matthew O. Jackson (2014) “Social Norms and the Enforcement of Laws” NBER Working Paper 20369, NBER.
Acemoglu, Daron, and Matthew O. Jackson (2015) “History, Expectations, and Leadership in the Evolution of Social Norms" Review of Economic Studies, 82(2), 423-456.
Adler, Daniel, and Michael Woolcock (2010) “Justice without the Rule of Law? The Challenge of Rights-Based Industrial Relations in Contemporary Cambodia” In Human Rights at Work: Perspectives on Law and Regulation, ed. Colin Fenwick and Tonia Novitz. Oxford: Hart Publishing.
Alvarez, Roberto and Robertson, Raymond (2004) “Exposure to Foreign Markets and Firm-Level Innovation: Evidence from Chile and Mexico” Journal of International Trade and Economic Development March, 13(1): 57-87.
Álvarez, Roberto and Sebastián Vergara (2010) “Exit in Developing Countries: Economic Reforms and Plant Heterogeneity” Economic Development & Cultural Change; 58(3) (April): 537-561.
Andrews, Donald W. K. and Werner Ploberger (1994) "Optimal Tests When a Nuisance Parameter Is Present Only under the Alternative," Econometrica, Econometric Society, 62(6): 1383-1414.
Baggs, Jen (2005) “Firm Survival and Exit in Response to Trade Liberalization” Canadian Journal of Economics 38(4) (November): 1364-83.
Bakhshi, Samira and William A. Kerr. 2010. “Labour Standards as a Justification for Trade Barriers: Consumer Concerns, Protectionism, and the Evidence.” The Estey Centre Journal of International Law and Trade Policy, 11 (1): 153-81.
Bandiera, O., I. Barankay, and I. Rasul. 2007. “Incentives for Managers and Inequality Among Workers: Evidence from a Firm-Level Experiment,” Quarterly Journal of Economics, 122 (2): 729-773.
Behrman, Jere R., and Anil B. Deolalikar (1989) “. . . Of the fittest? Duration of survival of manufacturing establishments in a developing country” Journal of Industrial Economics 38(2) (December), pp. 215-226.
Benabou, Roland and Jean Tirole (2011) “Laws and Norms” NBER Working Paper 17579, NBER.
Beresford, Melanie (2009) “The Cambodian Cloting Industry in the post-MFA Environment: A Review of Developments” Journal of the Asia Pacific Economy 14(4) (November), pp. 366-88.
Berik, Günseli and Yana van der Meulen Rodgers (2010) “Options for Enforcing Labour Standards: Lessons from Bangladesh and Cambodia” Journal of International Development 22, pp. 56-85.
Bernard, Andrew, and J. Bradford Jensen (2007) “Firm Structure, Multinationals, and Manufacturing Plant Deaths” The Review of Economics and Statistics” 89(2) (May), pp. 193-204.
Bhaumik, Sumon Kumar and Ralitza Dimova. 2011. “Good and Bad Institutions: Is the Debate Over? Cross-Country Firm-Level Evidence from the Textile Industry.” Institute for the Study of Labor, IZA DP No. 5471.
32 | P a g e
Bloom, Nicoloas, Benn Eifert, Aprajit Mahajan, David mcKinzie and John Roberts, “Does Management Matter? Evidence from India,” Quarterly Journal of Economics, first published online November 18, 2012 doi:10.1093/qje/qjs044.
Bonnal, Michaël. 2010. “Export Performance, Labor Standards, and Institutions: Evidence from a Dynamic Panel Data Model.” Journal of Labor Research. 31(1): 53-6
Bruhn, Miriam, Dean Karlan and Antoinete Schoar (2010) “What Capital is Missing in Developing Countries?” American Economic Review 100(2) (May): 629-633.
Cox, David R (1972) “Regression Models and Life-Tables” Journal of the Royal Statistical Society. Series B (Methodological) 34(2), pp.187–220.
Dehejia, Vivek H. and Yiagadeesen Samy. 2004. “Trade and Labor Standards: Theory and New Empirical Evidence.’ Journal of International Trade and Economic Development. 13(2): 179-98.
Disney, Richard, Jonathan Haskel, and Ylva Heden (2003) “Entry, exit and establishment survival in UK manufacturing” Journal of Industrial Economics 51(1) (March), pp. 91-112.
Domat, George, Paris, Adler, Rajeev Dehejia, Drusilla Brown and Raymond Robertson. 2013. “Do Factory Managers know what Workers Want? Manager-Worker Information Asymmetries and Pareto Optimal Working Conditions.” A Report from Better Work Impact Evaluation, Tufts University.
Doms, Mark, Timothy Dunne, and Mark J. Roberts. 1995. “The role of technology use in the survival and growth of manufacturing plants.” International Journal of Industrial Organization 13, (4) (December 1995): 523-542
Ellickson, Robert C. (1998) .Law and Economics Discovers Social Norms,.Journal of Legal Studies, 27(2), 537-552.
Elliott, Kimberly Ann and Richard B. Freeman (2003) Can Labor Standards Improve under Globalization? Institute for International Economics, Washington, D.C.
Esteve Pérez, Silviano, Amparo Sanchis Llopis, and Juan Alberto Sanchis Llopis (2004) “The Determinants of Survival of Spanish Manufacturing Firms” Review of Industrial Organization 25(3), pp. 251-73.
Flanagan, Robert J. 2003. “Labor Standards and intenational Competitive Advantage.” In International Labor Standards: Globalization, Trade, and Public Policy, edited by Robtert J. Flanagan and William B. Gould. Stanford, CA: Stanford University Press.
Fung, Archon, Dara O’Rourke and Charles Sabel. (2001) Can We Put an End to Sweatshops? Boston Beacon Press.
Greenaway, David; Joakim Gullstrand, and Richard Kneller (2008) “Surviving Globalisation” Journal of International Economics, 74(2), pp. 264-77.
Hall, John 2000 “Human Rights and the Garment Industry in Contemporary Cambodia” Stanford Journal of International Law 36(1): 119-174
Hanna, Rema, Sendhil Mullainathan and Joshua Schwartzstein. 2012. “Learning Through Noticing: Theory and Experimental Evidence in Farming.” NBER Working Paper Series, Working Paper 18401.
Harrigan, James and Geoffrey Barrows (2009) “Testing the Theory of Trade Policy: Evidence from the Abrupt End of the MultiFiber Arrangement” Review of Economics and Statistics 91(2), (May), pp. 282-294.
33 | P a g e
Harris, Richard I.D. and Qian Cher Li (2010) “Export-Market Dynamics and the Probability of Firm Closure: Evidence for the United Kingdom” Scottish Journal of Political Economy 57(2), (May), pp 145-168.
Harrison, A. and J. Scorse. 2010. “Multinationals and Anti-Sweatshop Activism,” American Economic Review 100:1, 247-73.
Huberman, Michael. 2012. Odd Couple, International Labor Standards in History. Yale University Press.
Ichniowski, Casey, Kathryn Saw and Biovanna Prennushi. (1997) “The Effects of Human Resource Management Practices on Productivity: A Study of Steel Finishing Lines.” American Economic Review 87(3), pp. 291-313, June.
Lessig, L. (1998) The New Chicago School, Journal of Legal Studies, 27(2), 661-691. Levine, David I., Michael W. Toffel, and Matthew S. Johnson. "Randomized Government Safety
Inspections Reduce Worker Injuries with No Detectable Job Loss." Science 336, no. 6083 (May 18, 2012): 907–911.
Levine, David I., Michael W. Toffel, and Matthew S. Johnson. (2012) "Randomized Government Safety Inspections Reduce Worker Injuries with No Detectable Job Loss." Science 336, no. 6083 (May 18, 2012): 907–911.
Miller, Doug, Vaasna Nuon, Charlene Aprill, and Ramon Certeza (2009) “Business as Usual? Governing the Supply Chain in Clothing - Post MFA phase-out: The case of Cambodia” International Journal of Labor Research, 1(1), pp. 10-33.
Nor, Norashidah Mohamed, Nor, Nor Ghani M, Ahmad Zainuddin Abdullah, and Suhaila A. Jalil. (2007) “Flexibility and small firms' survival: Further evidence from Malaysian manufacturing” Applied Economics Letters 14, (10-12) (August-October 2007): 931-934.
Oka, Chikako 2010a “Accounting for the Gaps in Labour Standard Compliance: The Role of Reputation-Conscious Buyers in the Cambodian Garment Industry” European Journal of Development Research 22(1): 59-78.
Oka, Chikako 2010b “Channels of Buyer Influence and Labor Standard Compliance: The Case of Cambodia’s Garment Sector” Advances in Industrial and Labor Relations 17: 153-183.
Polaski, Sandra (2006) “Combining Global and Local Forces: the Case of Labor Rights in Cambodia.” World Development 34(5), pp 919-32.
Polaski, Sandra (2009) “Harnessing Global Forces to Create Decent Work in Cambodia.” International Institute for Labor Studies, Better Work, International Labour Office, Geneva.Rawls, John. 1993. Political Liberalism. New York: Columbia University Press.
Powell, Benjamin and David Skarbek (2006) “Sweatshops and Third-World Living Standards: Are the Jobs Worth the Sweat?” Journal of Labor Research 27(2), Spring, pp. 263-274.
Robertson, Raymond, Rajeev Dehejia, Drusilla Brown, and Debra Ang (2011) “Labor Law Compliance and Human Resource Management Innovation: Better Factories Cambodia” Better Work Discussion Paper No. 1, International Labour Organisation, Geneva.
Schoar, Antoinette (2013) “The Importance of Being Nice: Supervisory Skill Training in the Cambodian Garment Sector” paper presented at the Harvard Business School International Research Conference May 17-18, 2013. Available at http://www.people.hbs.edu/jsiegel/Schoar20130506.doc.
Shea, Anna, Mariko Nakayama, and Jody Heymann (2010) “Improving Labor Standards in Clothing Factories” Global Social Policy 10(1), pp. 85-110.

34 | P a g e
Sheehan, Maura. 2013. “Human Resource Management and Performance: Evidence from Small and Medium-Sized Firms.” International Small Business Journal, DOI: 10.1177/0266242612465454, 6 January.
Shiferaw, Admasu. (2009) “Survival of private sector manufacturing establishments in Africa: The role of productivity and ownership” World Development 37(3) (March), pp. 572-584
Soderbom, Mans, Francis Teal, and Alan Harding (2006) “The determinants of survival among African manufacturing firms” Economic Development and Cultural Change 54(3) (April), pp. 533-555.
United Nations (2006) “In-depth study on all forms of violence against women” Report of the Secretary-General, Sixty-first session. Item 60 (a) of the preliminary list*. Advancement of women: advancement of women. Available at “http://stopvaw.org/sites/3f6d15f4-c12d-4515-8544-26b7a3a5a41e/uploads/Sec_Gen_Study_VAW.pdf.”
Walker, W. Reed (2011) “Environmental Regulation and Labor Reallocation: Evidence from the Clean Air Act” American Economic Review 101(3), (May), pp. 442-447.

35 | P a g e
Table 1 Factory Assessments by Year
Visit Year
VISIT 2001 2002 2005 2006 2007 2008 2009 2010 2011 Total
1 85 34 7 188 30 37 27 20 18 446 2 0 0 18 122 136 34 28 16 6 360 3 0 0 0 48 186 33 24 27 5 323 4 0 0 0 0 80 152 27 20 11 290 5 0 0 0 0 11 112 82 24 12 241 6 0 0 0 0 0 38 102 42 12 194 7 0 0 0 0 0 0 52 75 20 147 8 0 0 0 0 0 0 11 43 28 82 9 0 0 0 0 0 0 0 13 12 25
10 0 0 0 0 0 0 0 3 2 5
Total 85 34 25 358 443 406 353 283 126 2,113 Notes: Data are missing for 2003-2004 because BFC monitors concentrated on previously-identified issues rather than completing a full evaluation. See text for details.

36 | P a g e
Table 2 HR Systems from Factor Analysis
Factor 1: Communication and Workplace Systems
Factor 4: Compensation
6 Shop Stewards
10 Payment of Wages 7 Liaison Officer
11 Contracts/Hiring
23 Workplace Operations 16 Internal Regulations
29 Accidents/Illnesses Com
Factor 2: Occupational Safety and Health 30 Holidays/Annual/Special
31 Maternity Benefits
17 Health/First Aid 18 Machine Safety
Factor 5: Unions 19 Temperature/Ventilation
20 Drinking Water
4 Collective Agreements 21 Sanitation
5 Strikes
22 Food
8 Unions 24 OSH Assessment/Recording 14 Sexual Harassment 25 Chemicals
15 Disputes
26 Emergency Preparedness
Factor 3: Modern HR Practices
Factor 6: Core Labour Standards
9 Information About Wages 1 Child Labour 12 Termination
2 Discrimination
13 Discipline
3 Forced Labour 27 Overtime
28 Regular Hours/Weekly Rest Notes: Factors were identified using factor analysis as described in the text. The
compliance questions were first grouped into the 31 groups identified above using BFC and Better Work categories.
37 | P a g e
Table 3 Compliance Over Time (1) (2) (3) VARIABLES Base Quadratic Time Alt. Prices Time 0.001*** 0.014*** 0.014*** (0.000) (0.001) (0.001) Time2 -0.000*** -0.000*** (0.000) (0.000) Communication -0.119*** -0.118*** -0.118*** (0.002) (0.002) (0.002) OSH -0.079*** -0.079*** -0.079*** (0.001) (0.001) (0.001) HR Innovation -0.061*** -0.061*** -0.061*** (0.001) (0.001) (0.001) Compensation -0.016*** -0.016*** -0.016*** (0.001) (0.001) (0.001) Unions 0.072*** 0.072*** 0.072*** (0.002) (0.002) (0.002) RS Buyer 0.028*** 0.029*** 0.029*** (0.001) (0.001) (0.001) Log Emp. 0.018*** 0.018*** 0.018*** (0.000) (0.000) (0.000) Crisis -0.005*** -0.001 -0.002 (0.001) (0.002) (0.002) Recovery -0.008** -0.004 -0.005 (0.003) (0.003) (0.003) Price Index -0.023*** -0.022*** (0.004) (0.004) Wages 0.140*** 0.056*** 0.053*** (0.007) (0.012) (0.012) Alt. Price Index 0.000 (0.000) Constant -1.815*** -4.282*** -4.308*** (0.066) (0.286) (0.297) Observations 813,047 813,047 813,047 R-squared 0.037 0.037 0.037 Notes: Standard errors in parentheses. *** p<0.01, ** p<0.05, * p<0.1. The dependent variable is the binary question-level compliance measure in each factory.
38 | P a g e
Table 4 Retrogression Hazard Estimation
(1) (2) (3) VARIABLES Base Factory Controls Economic Conditions
Communication 1.101*** 1.103*** 1.103*** (0.072) (0.072) (0.072) OSH 0.766*** 0.767*** 0.767*** (0.053) (0.053) (0.053) HR Innovation 0.750*** 0.752*** 0.752*** (0.061) (0.061) (0.061) Compensation 0.103 0.103 0.103 (0.066) (0.066) (0.066) Unions -2.117*** -2.118*** -2.118*** (0.270) (0.270) (0.270) RS Buyer 0.092** 0.060 (0.043) (0.043) Log Employment -0.018 -0.042 (0.026) (0.026) Apparel Price Index -0.374 -0.239 (0.265) (0.325) Wages 3.113*** 0.796*** (0.156) (0.239) Crisis 0.079 (0.053) Recovery 0.066 (0.076) Public Disclosure -2.286*** (0.132) Constant -5.958*** -44.720*** -15.461*** (0.041) (1.966) (2.984) Observations 689,440 689,080 689,080 Notes: “Retrogression” is defined as a move from non-compliance to compliance and then back to non-compliance. Each column reports a separate maximum likelihood parametric exponential survival-time regression model. Coefficients (not hazard ratios) are reported. Standard errors in parentheses. *** p<0.01, ** p<0.05, * p<0.1. “Wages” represent the mean log of real wages, deflated by the apparel price index. The Apparel Price Index represents unit values of U.S. apparel imports from Cambodia. “RS Buyer” is equal to one for factories associated with reputation sensitive buyers.
39 | P a g e
Table 5 Log-Rank Tests of Equality of Survival across Improvement by Category
Improvement by Visit Improvement in Second Visit
Category Chi-Sq p-value Chi-Sq p-value Child Labor 0.094 0.759 0.051 0.821 Discrimination 0.955 0.328 0.047 0.828 Forced Labor 0.124 0.725 1.294 0.255 Collective Agreements 1.225 0.268 0.001 0.973 Strikes 1.137 0.286 1.281 0.258 Shop Stewards 0.315 0.575 5.772 0.016 Liaison Officer 0.380 0.538 2.899 0.089 Unions 0.090 0.764 2.779 0.096 Information About Wages 0.404 0.525 3.016 0.082 Payment of Wages 4.422 0.035 13.780 0.000 Contracts/Hiring 0.015 0.904 6.034 0.014 Termination 0.251 0.616 9.699 0.002 Discipline 0.134 0.714 2.033 0.154 Sexual Harassment 0.308 0.579 1.050 0.306 Disputes 0.091 0.763 6.000 0.014 Internal Regulations 0.056 0.813 2.458 0.117 Health/First Aid 0.213 0.644 15.503 0.000 Machine Safety 0.037 0.847 4.081 0.043 Temperature etc. 1.485 0.223 5.569 0.018 Drinking Water 0.514 0.473 1.782 0.182 Sanitation 0.819 0.365 12.988 0.000 Food 0.352 0.553 9.446 0.002 Workplace Operations 3.024 0.082 12.416 0.000 OSH… 3.600 0.058 12.081 0.001 Chemicals 3.433 0.064 9.732 0.002 Emergency Prep. 5.431 0.020 2.404 0.121 Overtime 0.004 0.950 5.212 0.022 Regular Hours… 3.625 0.057 9.575 0.002 Accident Compensation 0.111 0.739 0.321 0.571 Leave 0.239 0.625 4.870 0.027 Maternity Benefits 0.178 0.673 2.340 0.126
Notes: Test statistics represent the log-rank test of equality of survivor functions between factories that improved compliance. Each category represents a separate test. Categories are the same as in Table 2 but descriptions may be shortened here to save space.

40 | P a g e
Table 6 Factor Groups and Closure Probabilities
(1) (2) (3) (4) VARIABLES Levels Differences Visit 2 Change Visit 2 Change
Indicator
Communication -1.512** -0.235 0.143 -0.507*** (0.638) (0.967) (0.682) (0.185) OSH -2.018* -0.467 -1.626 -0.229 (1.112) (1.745) (1.468) (0.195) HR Innovation -0.720 -1.262 -1.025 -0.459** (0.956) (1.395) (1.097) (0.191) Compensation 2.057* -2.829 -2.828* -0.541*** (1.057) (1.885) (1.507) (0.192) Unions -0.712 2.202 -0.841 -0.085 (1.191) (2.082) (1.820) (0.196) RS Buyer -0.957*** -0.431* -1.086*** -1.006*** (0.213) (0.240) (0.215) (0.212) Owned: Anglo -0.106 -0.278 -0.062 -0.194 (0.304) (0.374) (0.305) (0.314) Owned: Korea -0.351 -0.257 -0.426 -0.396 (0.397) (0.459) (0.402) (0.406) Owned: China -0.222 -0.407 -0.217 -0.283 (0.295) (0.362) (0.306) (0.307) Owned: Other Asia -0.180 -0.249 -0.267 -0.100 (0.372) (0.422) (0.372) (0.385) Owned: Other 0.790* -0.065 1.059** 0.890* (0.460) (0.685) (0.459) (0.461) Log Emp -0.236* -0.376** -0.288*** -0.267** (0.122) (0.148) (0.110) (0.112) Crisis=1 1.836*** 3.535*** 1.865*** 1.923*** (0.188) (0.344) (0.186) (0.189) Recovery=1 1.737*** 3.181*** 1.692*** 1.767*** (0.245) (0.376) (0.244) (0.246) Constant 0.979 -1.578 -0.466 0.096 (1.398) (1.024) (0.733) (0.743) Observations 1,821 1,410 1,822 1,822 Notes: Each column reports a separate maximum likelihood parametric exponential survival-time regression model. Coefficients (not hazard ratios) are reported. Compliance categories in column (4) are represented by a dummy variable equal to 1 if compliance in that area increased between the first and second visit, and 0 otherwise.

41 | P a g e
Figure 1. Payoff Matrix for Compliance and Non-Compliance during Public Disclosure Period
𝐴! ,𝐴!! 0 1
0 !!!!!
, !!!!!
!!!!!
,- 𝑐!
1 -𝑐!, !!!!!
−𝑐! , (𝑛 − 1)𝛽!
1+ 𝑟 − 𝑐!
Notes: A represents the compliance choice of the representative firm and A’ represents the compliance choice of another firm. The penalty for noncompliance (if known) is represented by p. The (net) cost of compliance is represented by c and the discount rate is represented by r. The number of firms is represented by n.
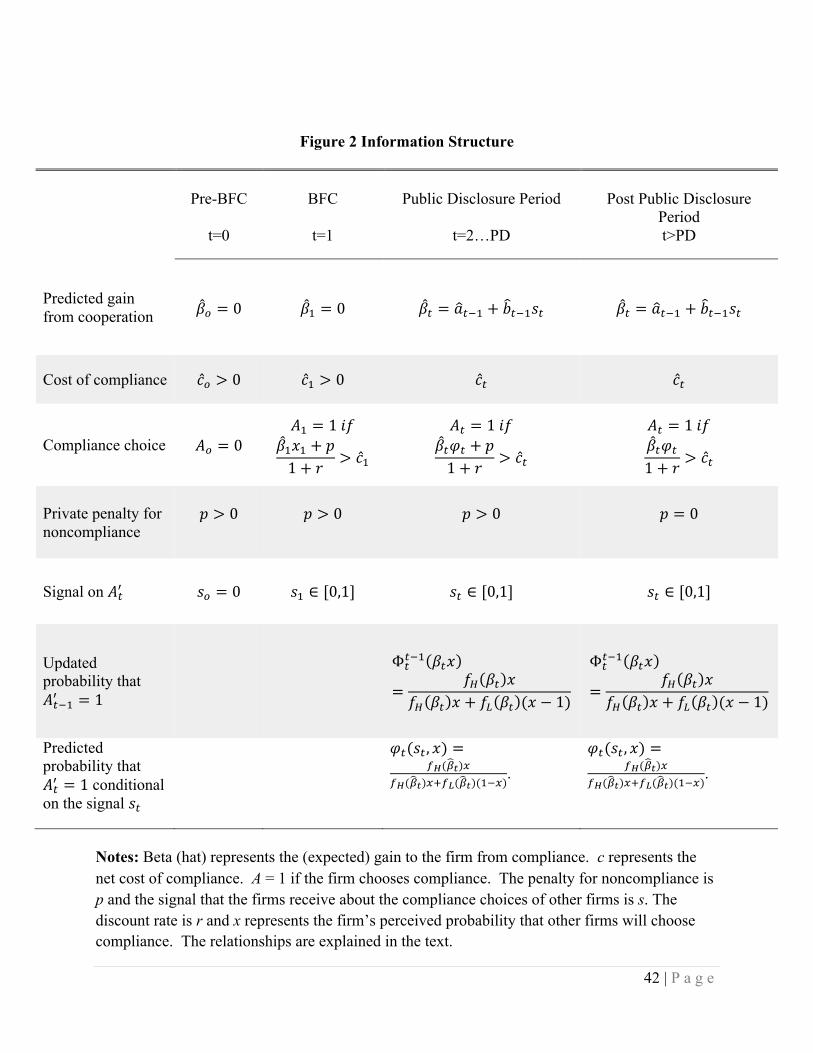
42 | P a g e
Figure 2 Information Structure
Pre-BFC BFC Public Disclosure Period Post Public Disclosure
Period t=0 t=1 t=2…PD t>PD
Predicted gain from cooperation 𝛽! = 0 𝛽! = 0 𝛽! = 𝑎!!! + 𝑏!!!𝑠! 𝛽! = 𝑎!!! + 𝑏!!!𝑠!
Cost of compliance 𝑐! > 0 𝑐! > 0 𝑐! 𝑐!
Compliance choice 𝐴! = 0 𝐴! = 1 𝑖𝑓
𝛽!𝑥! + 𝑝1+ 𝑟 > 𝑐!
𝐴! = 1 𝑖𝑓 𝛽!𝜑! + 𝑝1+ 𝑟 > 𝑐!
𝐴! = 1 𝑖𝑓 𝛽!𝜑!1+ 𝑟 > 𝑐!
Private penalty for noncompliance
𝑝 > 0
𝑝 > 0
𝑝 > 0
𝑝 = 0
Signal on 𝐴!! 𝑠! = 0 𝑠! ∈ [0,1] 𝑠! ∈ [0,1] 𝑠! ∈ [0,1]
Updated probability that 𝐴!!!! = 1
Φ!!!! 𝛽!𝑥
=𝑓! 𝛽! 𝑥
𝑓! 𝛽! 𝑥 + 𝑓! 𝛽! (𝑥 − 1)
Φ!!!! 𝛽!𝑥
=𝑓! 𝛽! 𝑥
𝑓! 𝛽! 𝑥 + 𝑓! 𝛽! (𝑥 − 1)
Predicted probability that 𝐴!! = 1 conditional on the signal 𝑠!
𝜑!(𝑠! , 𝑥) =!!(!!)!
!!(!!)!!!!(!!)(!!!).
𝜑!(𝑠! , 𝑥) =!!(!!)!
!!(!!)!!!!(!!)(!!!).
Notes: Beta (hat) represents the (expected) gain to the firm from compliance. c represents the net cost of compliance. A = 1 if the firm chooses compliance. The penalty for noncompliance is p and the signal that the firms receive about the compliance choices of other firms is s. The discount rate is r and x represents the firm’s perceived probability that other firms will choose compliance. The relationships are explained in the text.
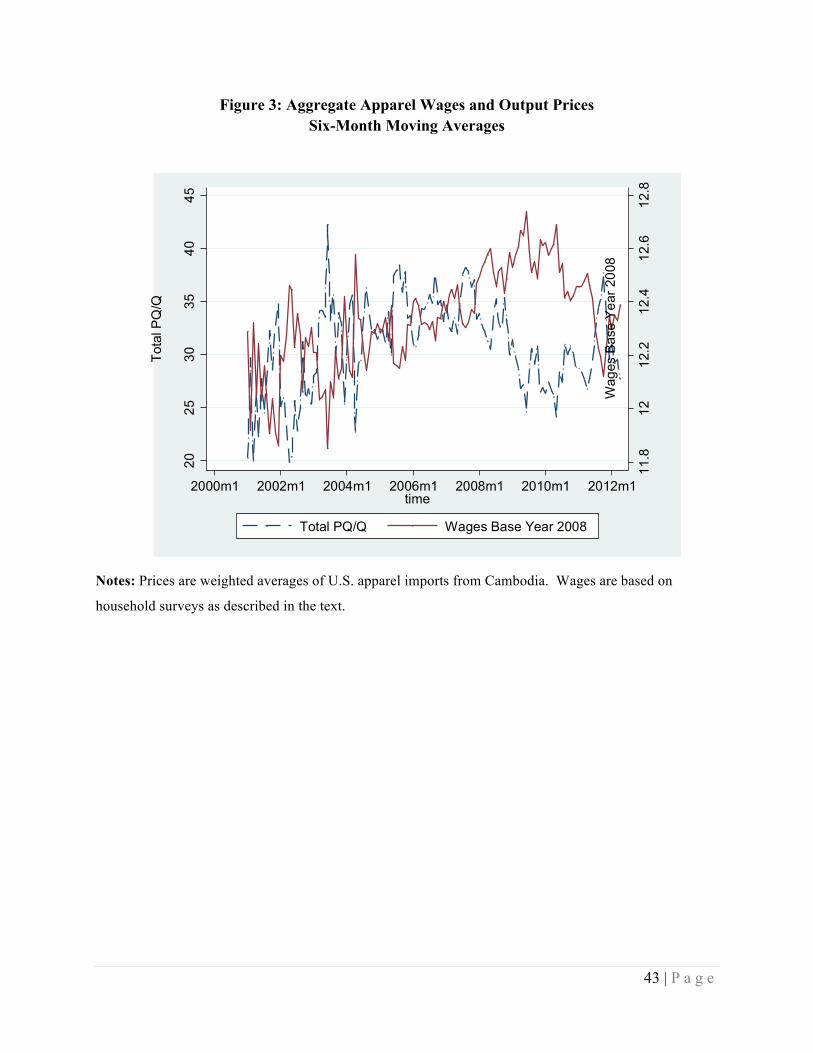
43 | P a g e
Figure 3: Aggregate Apparel Wages and Output Prices Six-Month Moving Averages
Notes: Prices are weighted averages of U.S. apparel imports from Cambodia. Wages are based on
household surveys as described in the text.
11.8
1212
.212
.412
.612
.8
Wag
es B
ase
Yea
r 200
8
2025
3035
4045
Tota
l PQ
/Q
2000m1 2002m1 2004m1 2006m1 2008m1 2010m1 2012m1time
Total PQ/Q Wages Base Year 2008
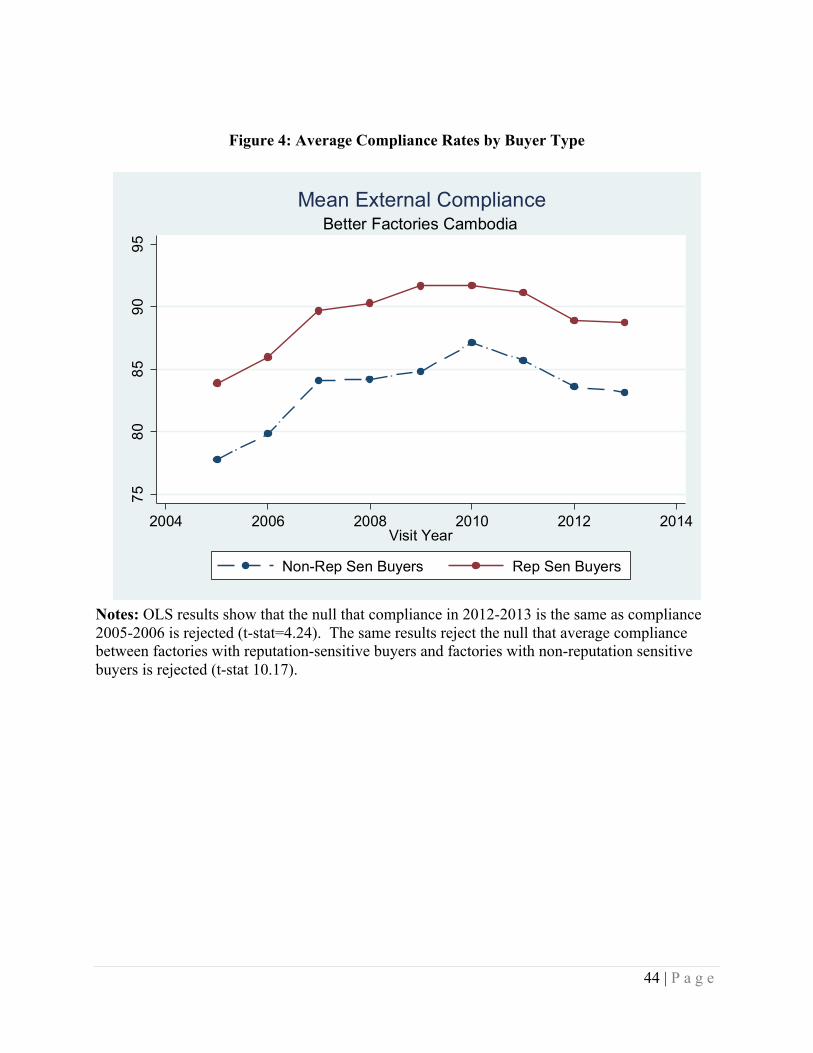
44 | P a g e
Figure 4: Average Compliance Rates by Buyer Type
Notes: OLS results show that the null that compliance in 2012-2013 is the same as compliance 2005-2006 is rejected (t-stat=4.24). The same results reject the null that average compliance between factories with reputation-sensitive buyers and factories with non-reputation sensitive buyers is rejected (t-stat 10.17).
7580
8590
95
2004 2006 2008 2010 2012 2014Visit Year
Non-Rep Sen Buyers Rep Sen Buyers
Better Factories CambodiaMean External Compliance
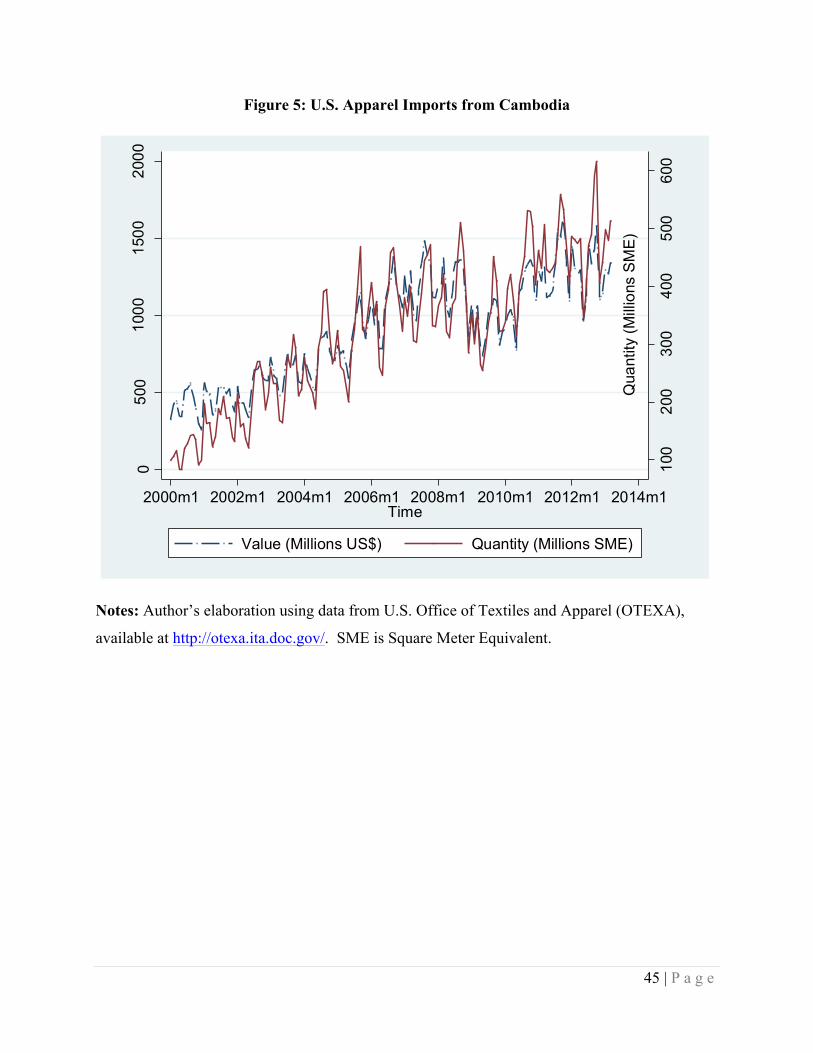
45 | P a g e
Figure 5: U.S. Apparel Imports from Cambodia
Notes: Author’s elaboration using data from U.S. Office of Textiles and Apparel (OTEXA),
available at http://otexa.ita.doc.gov/. SME is Square Meter Equivalent.
100
200
300
400
500
600
Qua
ntity
(Mill
ions
SM
E)
050
010
0015
0020
00
Val
ue (M
illio
ns U
S$)
2000m1 2002m1 2004m1 2006m1 2008m1 2010m1 2012m1 2014m1Time
Value (Millions US$) Quantity (Millions SME)
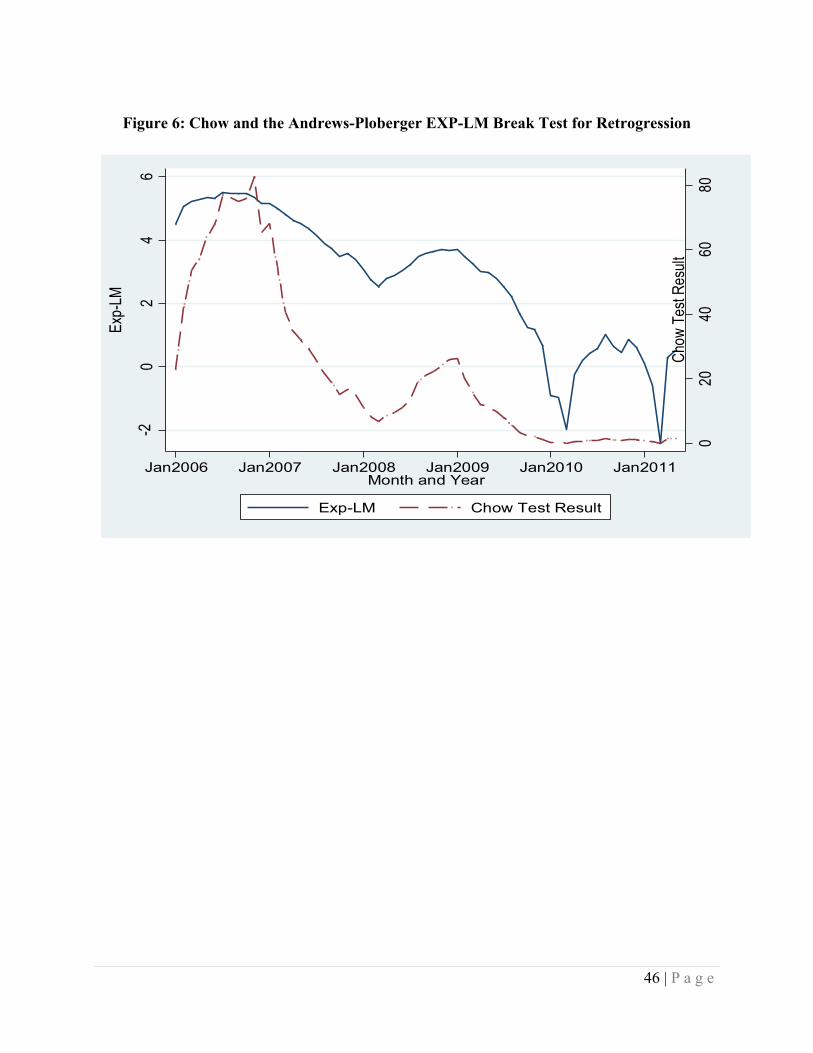
46 | P a g e
Figure 6: Chow and the Andrews-Ploberger EXP-LM Break Test for Retrogression
020
4060
80Ch
ow T
est R
esult
-20
24
6
Exp-
LM
Jan2006 Jan2007 Jan2008 Jan2009 Jan2010 Jan2011Month and Year
Exp-LM Chow Test Result

47 | P a g e
Figure 7: Survival Estimate (All Factories)
0.00
0.25
0.50
0.75
1.00
0 2 4 6 8 10Visit
Kaplan-Meier survival estimate
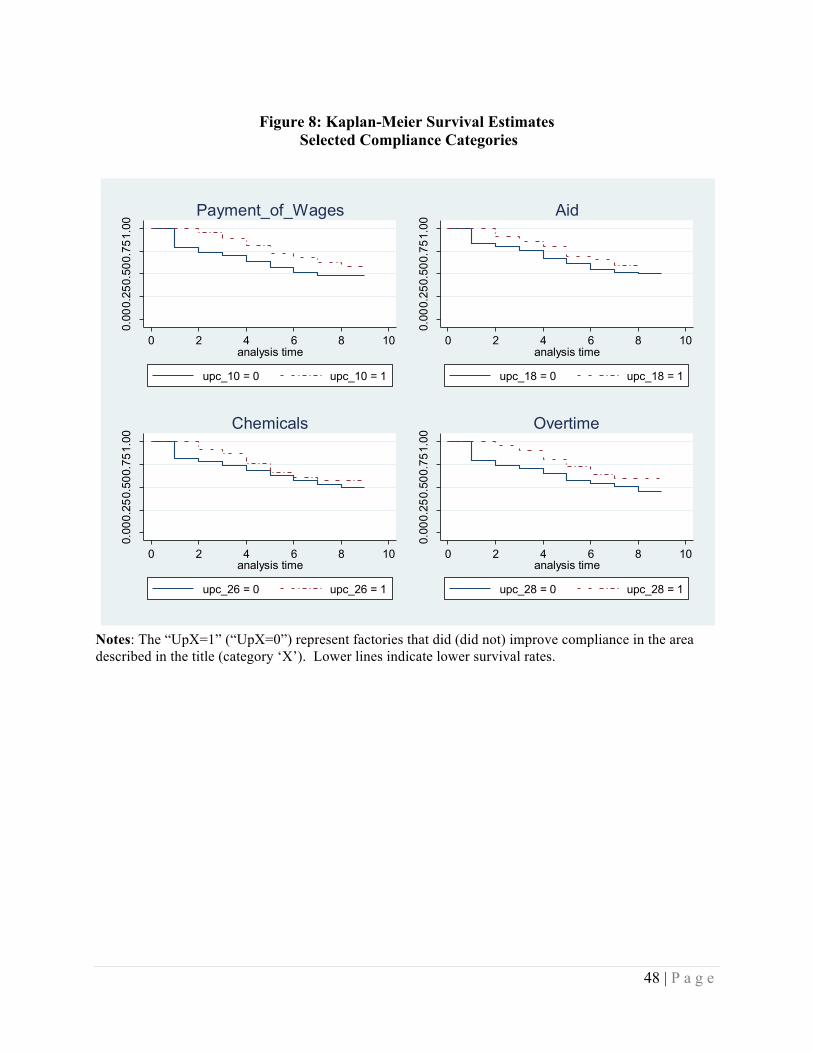
48 | P a g e
Figure 8: Kaplan-Meier Survival Estimates
Selected Compliance Categories
Notes: The “UpX=1” (“UpX=0”) represent factories that did (did not) improve compliance in the area described in the title (category ‘X’). Lower lines indicate lower survival rates.
0.00
0.25
0.50
0.75
1.00
0 2 4 6 8 10analysis time
upc_10 = 0 upc_10 = 1
Payment_of_Wages
0.00
0.25
0.50
0.75
1.00
0 2 4 6 8 10analysis time
upc_18 = 0 upc_18 = 1
Aid
0.00
0.25
0.50
0.75
1.00
0 2 4 6 8 10analysis time
upc_26 = 0 upc_26 = 1
Chemicals0.
000.
250.
500.
751.
00
0 2 4 6 8 10analysis time
upc_28 = 0 upc_28 = 1
Overtime


![The Psychic Costs of Violating Corruption Laws · 2012] psychic costs of violating corruption laws 147 similar.1 The answer probably cannot be found in the structure of the agencies](https://img.pdfslide.us/doc/110x75/5fb5b185f2bbe739a71f4326/the-psychic-costs-of-violating-corruption-laws-2012-psychic-costs-of-violating.jpg)