Embed Size (px)
Citation preview
Lawrence Livermore National Laboratory
Visualization and Analysis Activities
May 19, 2009
Hank ChildsVisIt Architect
Performance Measures x.x, x.x, and x.x

2
Outline
VisIt project overview Visualization and analysis highlights with the Nek code Why petascale computing will change the rules Summary & future work

3
Outline
VisIt project overview Visualization and analysis highlights with the Nek code Why petascale computing will change the rules Summary & future work
44
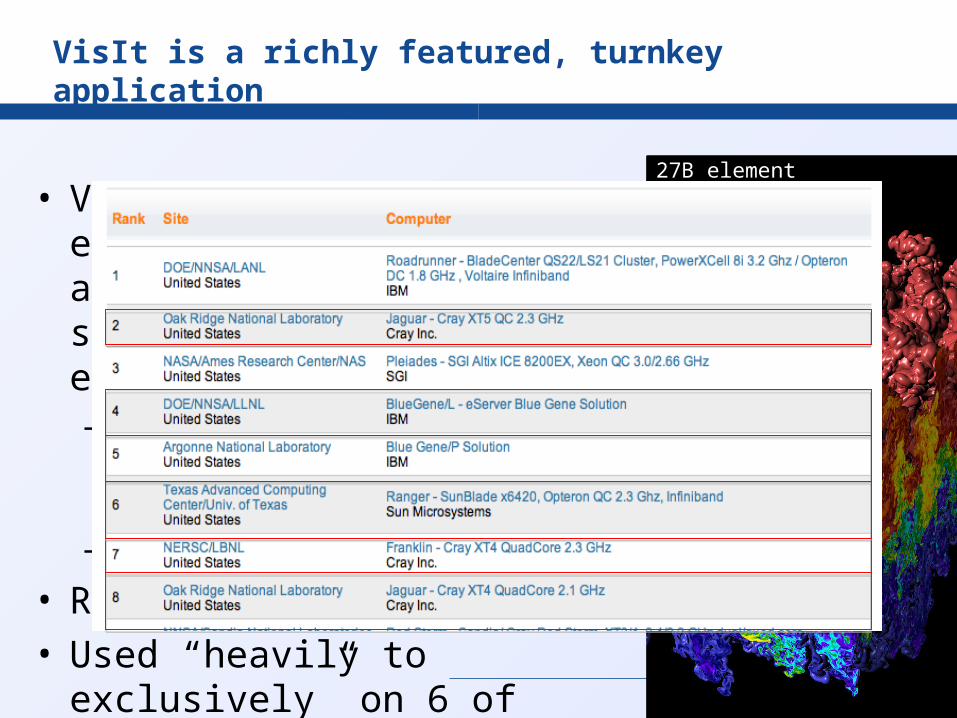
VisIt is a richly featured, turnkey application
• VisIt is an open source, end user visualization and analysis tool for simulated and experimental data– Used by: physicists, engineers,
code developers, vis experts– >100K downloads on web
• R&D 100 award in 2005• Used “heavily to exclusively” on 6
of world’s top 8 supercomputers
27B elementRayleigh-Taylor Instability(MIRANDA, BG/L)
5
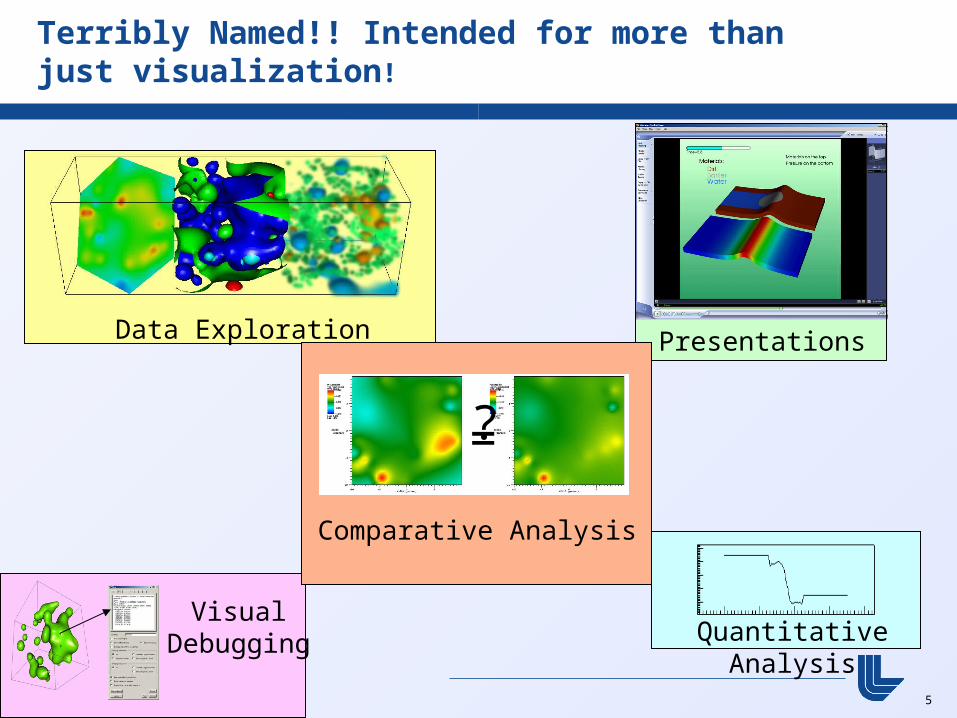
Terribly Named!! Intended for more than just visualization!
Data Exploration
VisualDebugging Quantitative Analysis
Presentations
=?
Comparative Analysis

6
VisIt has a rich feature set that can impact many science areas.
Meshes: rectilinear, curvilinear, unstructured, point, AMR Data: scalar, vector, tensor, material, species Dimension: 1D, 2D, 3D, time varying Rendering (~15): pseudocolor, volume rendering,
hedgehogs, glyphs, mesh lines, etc… Data manipulation (~40): slicing, contouring, clipping,
thresholding, restrict to box, reflect, project, revolve, … File formats (~85) Derived quantities: >100 interoperable building blocks
+,-,*,/, gradient, mesh quality, if-then-else, and, or, not Many general features: position lights, make movie, etc Queries (~50): ways to pull out quantitative information,
debugging, comparative analysis

7
VisIt employs a parallelized client-server architecture.
Client-server observations:• Good for remote
visualization• Leverages available
resources• Scales well• No need to move data
Additional design considerations:• Plugins• Multiple UIs: GUI (Qt), CLI
(Python), more…
remote machine
Parallel vis resources
Userdata
localhost – Linux, Windows, Mac
Graphics Hardware

8
The VisIt team focuses on making a robust, usable product for end users.
Manuals• 300 page user manual• 200 page command line interface manual• “Getting your data into VisIt” manual
Wiki for users (and developers) Revision control, nightly regression testing, etc Executables for all major platforms Day long class, complete with exercises
Slides from the VisIt class

9
VisIt is a vibrant project with many participants.
Over 50 person-years of effort Over one million lines of code Partnership between: Department of Energy’s Office of Nuclear Energy,
Office of Science, and National Nuclear Security Agency, and among others
2004-6
User communitygrows, includingAWE & ASC Alliance schools
Fall ‘06
VACET is funded
Spring ‘08
AWE enters repo
2003
LLNL user communitytransitioned to VisIt
2005
2005 R&D100
2007
SciDAC Outreach Center enablesPublic SW repo
2007
Saudi Aramcofunds LLNL to support VisIt
Spring ‘07
GNEP funds LLNL to support GNEP codes at Argonne
Summer‘07
Developers from LLNL, LBL, & ORNLStart dev in repo
‘07-’08
UC Davis & UUtah research done in VisIt repo
2000
Project started
‘07-’08
Partnership withCEA is developed
2008
Institutional supportleverages effort from many labs
Spring ‘09
More developersEntering repo allthe time

10
Outline
VisIt project overview Visualization and analysis highlights with the Nek code Why petascale computing will change the rules Summary & future work

11
Flow analysis for 217 pin simulation / 1 billion grid points
217 pin reactorcooling simulation.Run on ¼ of Argonne BG/P.

12
Flow analysis for 217 pin simulation / 1 billion grid points

13
Tracing particles through the channels (work in progress)

14
Tracing particles through the channels (work in progress)
Place 1000 particles in one channel
Observe where particles come out
Observe which channels the particles pass through

15
Tracing particles through the channels (work in progress)
Two different “matrices” to describe flow from channel I to channel J• Exit location versus travel time in channel• Issues: pathlines vs streamlines, 12X vs A12
White triangle shows current channel

16
The algorithm for advecting particles is complex.
Two extremes:• Partition data over processors and pass particles
amongst processors Parallel inefficiency!
• Partition seed points over processors and process necessary data for advection Redundant I/O!
Hybrid solution:• Master-slave approach that
adapts between parallel inefficiencies and redundant I/O SC09 submission

17
The VisIt project provides outstanding leverage to this campaign.
The particle advection code represents 2+ man-years of effort from developers at UC Davis, Oak Ridge, Lawrence Berkeley, and Lawrence Livermore• Efforts of VACET, a SciDAC center for visualization
and analysis The development time to adapt this algorithm for our
custom analysis is on the order of weeks. Further, VisIt represents 50+ man-years of effort, much
of which is highly relevant to this campaign, including:• Parallel infrastructure• Visualization algorithms (contouring, etc)• Parallel rendering• Etc.

18
Movie of 37 pin simulation

19
Movie of “fish tank” simulation

20
“Streamlines” to show movement within the fish tank

21
Summary of activities
Activities are a mix of development and support• Development
File format readers New analysis capability Bug fixes / usability Tuning, tuning, tuning
• Support Movies “How do I …?” Scripts

22
Outline
VisIt project overview Visualization and analysis highlights with the Nek code Why petascale computing will change the rules Summary & future work

23
Petascale visualization and analysis will change the rules.
Michael Strayer (U.S. DoE Office of Science): “petascale is not business as usual”• Especially true for visualization and analysis!
Large scale data creates two incredible challenges: scale and complexity
Scale is not “business as usual”• Current trajectory for terascale postprocessing will
be cost prohibitive at the petascale• We will need “smart” techniques in production
environments More resolution leads to more and more complexity
• Will the “business as usual” techniques still suffice?• Shortened out complexity portion of this talk: data
anlaysis is key.

24
I/OI/O
ASC BG/L Gauss
SC and dedicated cluster share disk Dedicated cluster has good I/O access SC runs lightweight OS; dedicated cluster runs Linux Graphics cards on dedicated cluster
Current modes of terascale visualization and analysis (1)

25
I/OI/O
ASC Purple
Simulation, processing both done on purple
Simulation writes to disk, vis. job reads from disk
SC runs full OS (AIX) No graphics cards
ASC Purple
Portion of purple forVis & analysis
Current modes of terascale visualization and analysis (2)

26
Rayleigh Taylor instability by MIRANDA code
27 billion elements Run on ASC BG/L Visualized on gauss
using VisIt
These modes of processing have worked well at the terascale.

27
Further observations about the “terascale” gameplan.
No need to move data.• (Important!)
Not scaling up to huge numbers of cores. Current algorithm used by major vis tools (VisIt, EnSight,
ParaView):• Read in all data from disk and keep in primary memory.

28
Buying a dedicated vis. machine will be cost-prohibitive at the petascale.
I/OI/O
ASC BG/L Gauss
Why is it so expensive?• Visualization and analysis is:
I/O-intensive Memory-intensive
• Compute has become cheap; memory and I/O are still expensive.
~600 TF 512 procs$1-$2M
4 years: 5 PF 5000? procs$15M (!!!)

29
Visualization performance is based on total memory and I/O.
Trend for next generation of supercomputers is weaker and weaker relative I/O To maintain performance, we need more I/O
• So we will have to use more nodes to get more I/O
Recent series of hero runs for 1 trillion cell data set:• 16K cores• I/O = ~5 minutes, processing = ~10 seconds
FLOPs Memory I/O
Terascale machine
“Petascale machine” Vis is almost always >50% I/O and
sometimes 98% I/O Amount of data to visualize is
typically O(total mem) --> Relative I/O (ratio of total
memory and I/O) is key

30
Using a portion of the SC is also problematic at the petascale.
I/OI/O
ASC Purple
Fundamentally, we are I/O-bound, not compute bound • multi-core has limited value-added
To increase I/O, we will need to use more of the machine
ASC Purple

31
I/OI/O
ASC Purple
Additionally:
• Use cases are “bursty” – do we want the supercomputer sitting idle while someone studies results? Can we afford to devote a large portion of the
SC to visualization and analysis?• Lightweight OS’s present challenges
ASC Purple
Using a portion of the SC is also problematic at the petascale.

32
Anedoctal evidence: relative I/O is getting slower at LLNL.
Machine name Main memory I/O rate
ASC purple 49.0TB 140GB/s 5.8min
BGL-init 32.0TB 24GB/s 22.2min
BGL-cur 69.0TB 30GB/s 38.3min
Petascale machine
?? ?? >40min
Time to write memory to disk
“I/O doesn’t pay the bills.”

33
Part of the problem is HW (I/O & memory), but the rest is software.
Production visualization and analysis tools use “pure parallelism”.
Research has established “smart techniques”: viable, effective alternatives to pure parallelism• Out of core processing• In situ processing• Multi-resolution techniques
Not going to dig in on these, but none is a panacea in isolation.
There are gaps here (production-readiness & more)
These techniques are difficult to implement.• Petascale computing makes them cost effective.

34
Summary of techniques
Pure parallelism can be used for anything, but it takes a lot of resources
Smart techniques can only be used situationally. Strategy 1:
• Stick with pure parallelism and live with high machine costs.
Other strategies?• Here are some assumptions:
We’re not going to buy massive dedicated clusters We can fall back on the super computer, but only
rarely

35
Alternate strategy: smart techniques
All visualization and analysis work
Multi-res
In situ
Out-of-coreUse P.P.
for remaining ~5% on SC

36
Outline
VisIt project overview Visualization and analysis highlights with the Nek code Why petascale computing will change the rules Summary & future work

37
Summary & Future Work
This effort enables Nek (& others) to successfully meet their visualization and analysis needs.
Lots of future work:• In situ visualization and analysis
Support for the petascale• Subsetting and enhancements for code
interoperability• Energy groups• Continued support for analysis, scripts, movies,
bugs, etc. (LOTS of time spent here)