Embed Size (px)
Citation preview
Law of Supply
MICROECONOMICSSSEMI2
Students will explain how the Law of Supply, prices, and profit work to
determine production and distribution in an economy

monetary flow
physical flow
monetary flow
physical flow
Circular Flow Diagram of a Market Economy
Households Firms
monetary flow
physical flow
monetary flow
physical flow
Circular Flow Diagram of a Market Economy
Households FirmsHouseholds supply firms with land, labor, and capital.
Firms supply households with goods and services.
EXPENDITURES
WAGES, INTEREST, NET PROFIT
Product market
Factor market (Resource Market)
REVENUE
House-hold INCOME.

Law of Supply• Law of Supply- refers to the relationship between price and
the quantity of a good or service that firms are willing to produce. The higher the price of the product leads to more supplies and more companies making the product.
Price
As price
increases…
Supply
Quantity supplied increases
Price
As price falls…
Supply
Quantity supplied
falls

How does the Law of Supply work?
• Quantity supplied- describes how much of a good is offered for sale at a specific price.
• Elasticity of supply- is a measure of the way a quantity supplied reacts to a change in price, it is very sensitive.
1. Inelastic- not sensitive to changes in prices. (Bread)
2. What effects Elasticity?- TIME, in the short term a firm can not change its supply level, but in the long term a firm is more flexible.
• Supply Curve- is a graph of the quantity supplied of a good by all suppliers at different prices. ALWAYS GOING UP
Market Supply Schedule
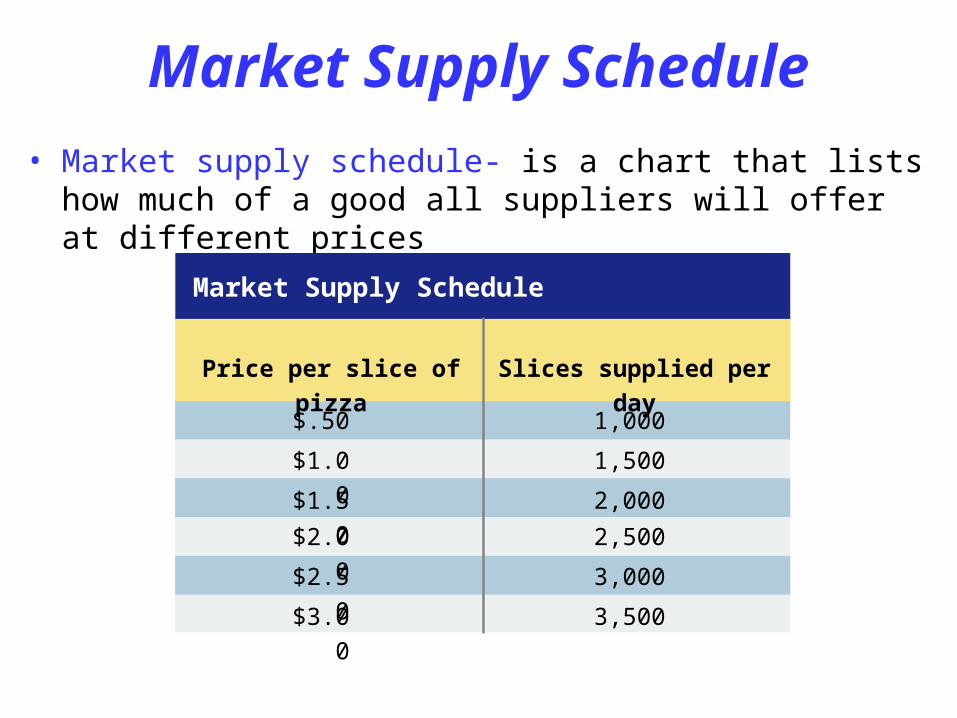
• Market supply schedule- is a chart that lists how much of a good all suppliers will offer at different prices
$.50 1,000
Price per slice of pizza Slices supplied per day
Market Supply Schedule
$1.00 1,500
$1.50 2,000
$2.00 2,500
$2.50 3,000
$3.00 3,500

Market Supply Curve
Pri
ce
(in
do
lla
rs)
Output (slices per day)
3.00
2.50
2.00
1.50
1.00
.50
0
0 500 1000 1500 2000 2500 3000 3500
Supply

Cost of Production• Firms- always look at how the number of workers they hire
will affect production.
1. Marginal Cost of Production- represents the change in output for hiring one additional worker
Marginal Product of Labor
Labor (number of workers)
Output (beanbags per hour)
Marginal product of labor
0 0 —
1 4 4
2 10 6
3 17 7
4 23 6
5 28 5
6 31 3
7 32 1
8 31 –1
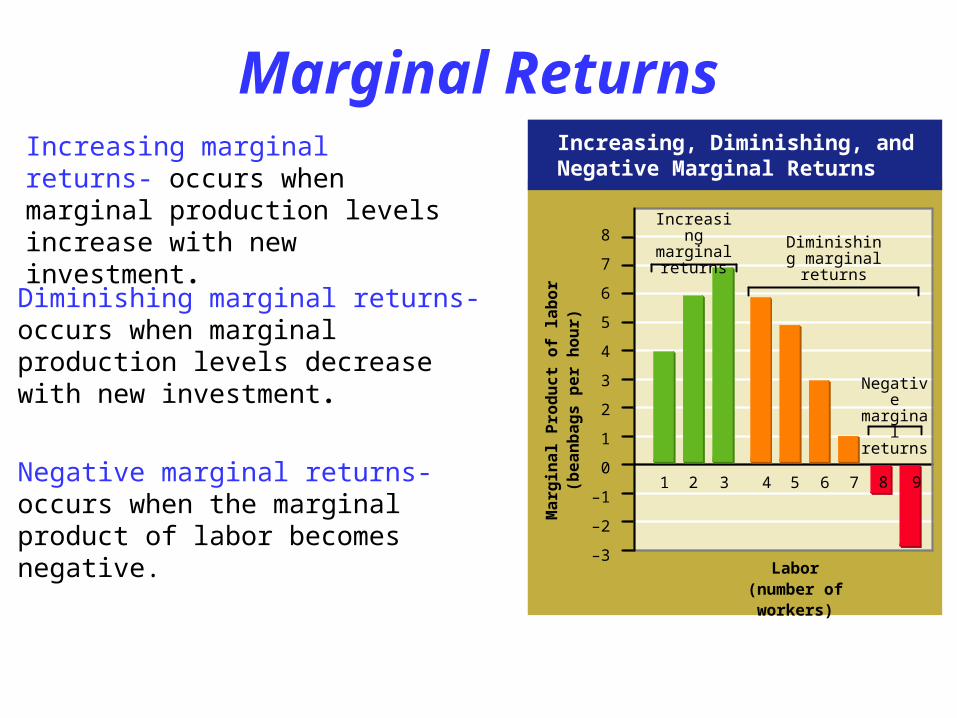
Increasing, Diminishing, and Negative Marginal Returns
Labor(number of workers)
Ma
rgin
al
Pro
du
ct
of
lab
or
(be
an
ba
gs
pe
r h
ou
r)
8
7
6
5
4
3
2
1
0
–1
–2
–3
Diminishing marginal returns- occurs when marginal production levels decrease with new investment.
4 5 6 7
Diminishing marginal returns
Negative marginal returns- occurs when the marginal product of labor becomes negative.
8 9
Negative marginal returns
Marginal Returns
1 2 3
Increasing marginal returns
Increasing marginal returns- occurs when marginal production levels increase with new investment.

Production Costs• Fixed cost- is a cost that does not change,
regardless of how much of a good is produced.
1.Examples: Rent & Salaries
• Variable costs- are costs that rise or fall depending on how much is produced.
1. Examples: costs of raw materials & some labor costs.
• Total cost- is the fixed costs plus variable costs.
Production Costs and Supply
• Changes- any change in the cost of an input such as raw materials, labor, cost.
1. Increase- a rise in cost will cause a fall in supply as the product becomes more expensive to make
2. Decrease- the fall of input costs causes supplies to increase.

Government Subsidies and Supply
• Subsidy- is a government payment that supports a business or market. Subsidies cause the supply of a good to increase.
Examples
1. Paying farmers not to farm a piece of land
2. Fannie Mae and Citigroup
3. Japanese Banks

Government Regulation and Supply
• Regulation- occurs when the government steps into a market to affect the price, quantity, or quality of a good. Regulation usually raises costs.
• Examples
1. Automobile Industry (Emissions)
2. Banks (minimum in their savings)
3. Insurance Industry (failed regulations)
The Excise Tax and Supply
• Excise Tax- tax on the production or sale of a good. This increases production costs by adding extra costs for every item sold. Causes the supply of the item to decrease on all levels.
• Examples- some are used to discourage the buying of a good considered harmful to the public good.
1. Cigarettes
2. Alcohol
3. Tariff on Imported Goods (Foreign Food) makes them more expensive to buy

The Global Economy and Supply• The Global Economy- The supply of imported goods and services has an
impact on the supply of the same goods and services here.
1. Government Actions- if the government imposes a ban or restriction on the import of a product than the supply curve shifts left on all prices
Examples
1. Clothes- U.S. imports clothes from China, wages go up in China, decreasing the supply. Supply curve goes left because costs have increased
2. Toyota- new technology cuts the costs of producing cars- increases the supply of cars here. Supply curve goes right costs have fallen
Future Expectations and Supply• Future Expectations of Prices- Expectations of higher prices
will reduce supply now and increase supply later. Expectations of lower prices will have the opposite effect.
1. Inflation- is the condition that the value of the cash in your pockets decreases as prices rise. This can cause supply to fall dramatically. (GREED from
PRODUCERS)
• Examples
1. Farmers- Corn prices are expected to go up next year- What do you do?
2. Gas Stations- A hurricane is going to hit and cause a shortage- What do you do?
3. Farmer- Corn is expected to go down next year-
What do you do?
The Number of Suppliers and Supply
• Number of Suppliers- if more firms enter a market and sell a good the supply increases, if more leave the supply decreases.
• Examples-
1. Pizza Store- Fat Tony’s is the only one in town and he sells his pies for $17. The Papa John’s, Pizza Hut and
Original Fat Tony’s open up. What happens to the cost of pies?