Embed Size (px)
Citation preview
Law and Banking Development in a South Pacific IslandEconomy: The Case of Fiji, 1970-2006
Author
Sharma, Parmendra, Nguyen, Duc-Tho
Published
2010
Journal Title
Journal of the Asia Pacific Economy
DOI
https://doi.org/10.1080/13547861003700422
Copyright Statement
© 2010 Routledge. This is an electronic version of an article published in Journal of the AsiaPacific Economy Volume 15, Issue 2, 2010, 192-216. Journal of the Asia Pacific Economy isavailable online at: http://www.informaworld.com with the open URL of your article.
Downloaded from
http://hdl.handle.net/10072/32182
Griffith Research Online
https://research-repository.griffith.edu.au

Law and banking development in a South Pacific island economy:
The case of Fiji, 1970–2006
Parmendra Sharma and D.T. (Tom) Nguyen
Department of Accounting, Finance and Economics, Griffith University,
Nathan Campus, Brisbane, QLD, Australia
Manuscript revised 12 October 2009
Abstract This paper examines the applicability of the prominent Law–Finance
theory to banking development in Fiji, a representative island economy in the South
Pacific region. Secondary and primary data are used to assess legal institutions and the
level of development in the banking sector in Fiji (and, where possible, in other South
Pacific island economies) in comparison with up to 49 other countries, both developed
and developing. The paper also re–examines the question of a possible Law–Banking
Development connection internationally, in light of newly available data and a newly
proposed composite index of banking development. The results are consistent with
previous findings of a direct relationship between law enforcement quality and banking
development, but they also suggest that the legal rules codifying creditor rights may not
be as influential as had been thought previously. The latter result accords with the
experience of Fiji, where very weak legal rules combined with average law enforcement
quality (and high accounting standards) yield a reasonable performance in terms of
banking development over the 1970–2006 period. The paper also points out some
possible policy implications of these results.
Keywords: Fiji; banking development; law enforcement quality; creditor rights; law
and finance; South Pacific islands.
JEL classifications: G18, G21, G28, K40, O16, O57
2
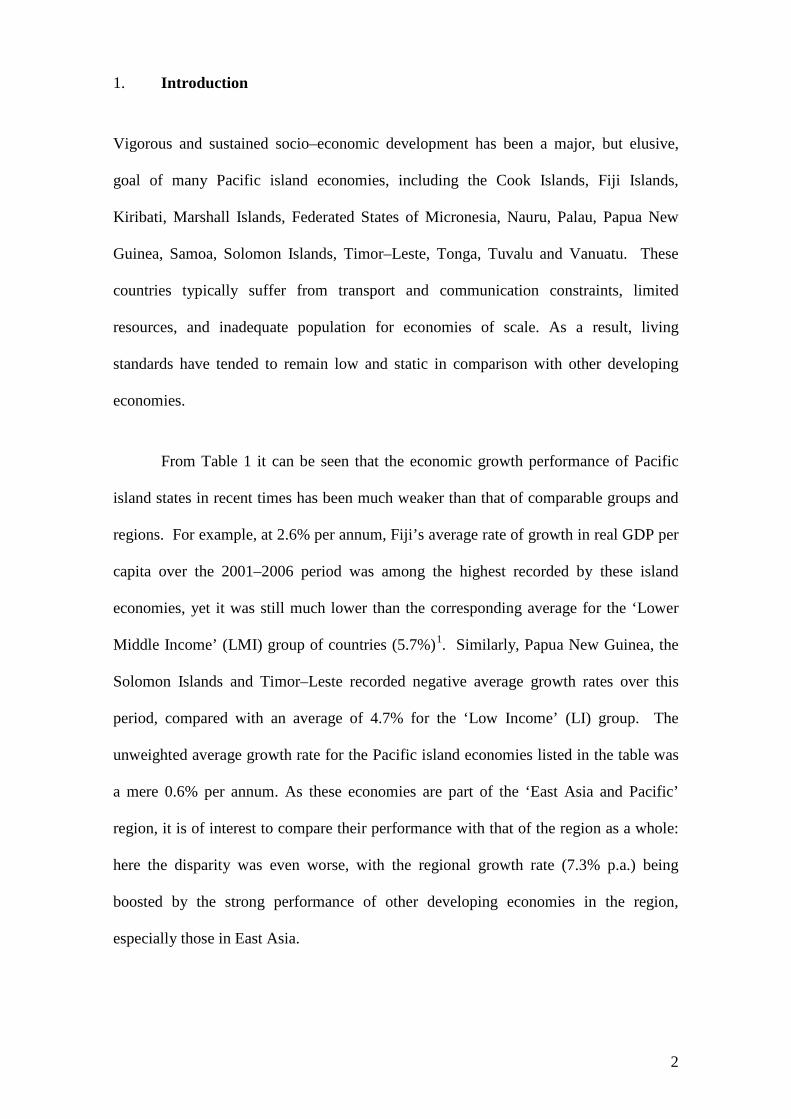
1. Introduction
Vigorous and sustained socio–economic development has been a major, but elusive,
goal of many Pacific island economies, including the Cook Islands, Fiji Islands,
Kiribati, Marshall Islands, Federated States of Micronesia, Nauru, Palau, Papua New
Guinea, Samoa, Solomon Islands, Timor–Leste, Tonga, Tuvalu and Vanuatu. These
countries typically suffer from transport and communication constraints, limited
resources, and inadequate population for economies of scale. As a result, living
standards have tended to remain low and static in comparison with other developing
economies.
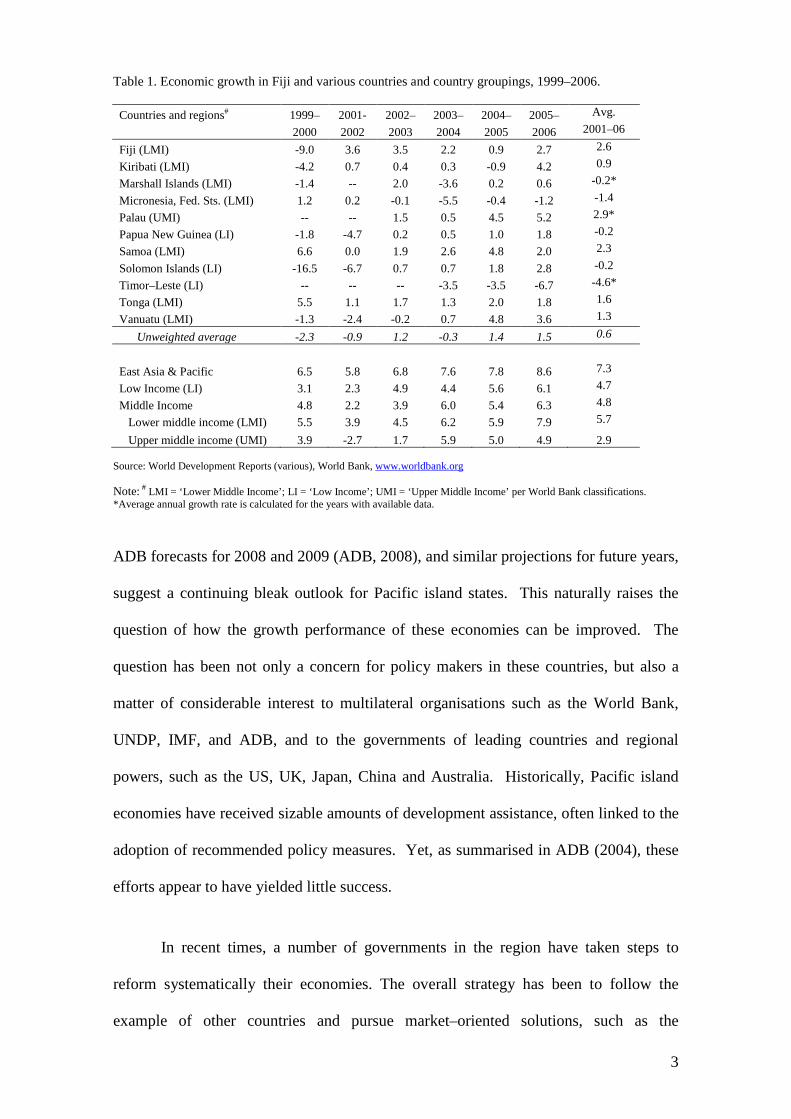
From Table 1 it can be seen that the economic growth performance of Pacific
island states in recent times has been much weaker than that of comparable groups and
regions. For example, at 2.6% per annum, Fiji’s average rate of growth in real GDP per
capita over the 2001–2006 period was among the highest recorded by these island
economies, yet it was still much lower than the corresponding average for the ‘Lower
Middle Income’ (LMI) group of countries (5.7%)1
. Similarly, Papua New Guinea, the
Solomon Islands and Timor–Leste recorded negative average growth rates over this
period, compared with an average of 4.7% for the ‘Low Income’ (LI) group. The
unweighted average growth rate for the Pacific island economies listed in the table was
a mere 0.6% per annum. As these economies are part of the ‘East Asia and Pacific’
region, it is of interest to compare their performance with that of the region as a whole:
here the disparity was even worse, with the regional growth rate (7.3% p.a.) being
boosted by the strong performance of other developing economies in the region,
especially those in East Asia.
3
Table 1. Economic growth in Fiji and various countries and country groupings, 1999–2006.
Countries and regions# 1999– 2001- 2002– 2003– 2004– 2005– Avg.
2000 2002 2003 2004 2005 2006 2001–06
Fiji (LMI) -9.0 3.6 3.5 2.2 0.9 2.7 2.6
Kiribati (LMI) -4.2 0.7 0.4 0.3 -0.9 4.2 0.9
Marshall Islands (LMI) -1.4 -- 2.0 -3.6 0.2 0.6 -0.2*
Micronesia, Fed. Sts. (LMI) 1.2 0.2 -0.1 -5.5 -0.4 -1.2 -1.4
Palau (UMI) -- -- 1.5 0.5 4.5 5.2 2.9*
Papua New Guinea (LI) -1.8 -4.7 0.2 0.5 1.0 1.8 -0.2
Samoa (LMI) 6.6 0.0 1.9 2.6 4.8 2.0 2.3
Solomon Islands (LI) -16.5 -6.7 0.7 0.7 1.8 2.8 -0.2
Timor–Leste (LI) -- -- -- -3.5 -3.5 -6.7 -4.6*
Tonga (LMI) 5.5 1.1 1.7 1.3 2.0 1.8 1.6
Vanuatu (LMI) -1.3 -2.4 -0.2 0.7 4.8 3.6 1.3
Unweighted average -2.3 -0.9 1.2 -0.3 1.4 1.5 0.6
East Asia & Pacific 6.5 5.8 6.8 7.6 7.8 8.6 7.3
Low Income (LI) 3.1 2.3 4.9 4.4 5.6 6.1 4.7
Middle Income 4.8 2.2 3.9 6.0 5.4 6.3 4.8
Lower middle income (LMI) 5.5 3.9 4.5 6.2 5.9 7.9 5.7
Upper middle income (UMI) 3.9 -2.7 1.7 5.9 5.0 4.9 2.9 Source: World Development Reports (various), World Bank, www.worldbank.org Note: # LMI = ‘Lower Middle Income’; LI = ‘Low Income’; UMI = ‘Upper Middle Income’ per World Bank classifications. *Average annual growth rate is calculated for the years with available data. ADB forecasts for 2008 and 2009 (ADB, 2008), and similar projections for future years,
suggest a continuing bleak outlook for Pacific island states. This naturally raises the
question of how the growth performance of these economies can be improved. The
question has been not only a concern for policy makers in these countries, but also a
matter of considerable interest to multilateral organisations such as the World Bank,
UNDP, IMF, and ADB, and to the governments of leading countries and regional
powers, such as the US, UK, Japan, China and Australia. Historically, Pacific island
economies have received sizable amounts of development assistance, often linked to the
adoption of recommended policy measures. Yet, as summarised in ADB (2004), these
efforts appear to have yielded little success.
In recent times, a number of governments in the region have taken steps to
reform systematically their economies. The overall strategy has been to follow the
example of other countries and pursue market–oriented solutions, such as the
4
corporatisation and privatisation of public utilities, the reduction of barriers to
international trade, civil service reforms, and tax reforms (ADB, 1999; Reddy et al.,
2004). Unfortunately, these reforms have also not resulted in much success.
Some analysts have suggested that a key to sustainable and strong economic
growth in the future would be a robust and vibrant private sector (e.g. ADB, 1999,
2004). The ADB also identifies the financial system as a crucial ingredient for the
development of such a vigorous private sector. For South Pacific island states, a strong
financial system is more or less synonymous with a strong banking sector, as
commercial banks typically account for around one–half of the total assets of all
financial institutions (ADB, 2001).2 As for equity financing, stock markets exist in only
two of these island states—Fiji and Papua New Guinea—and even here they are not
very significant, due to extremely low trading activities. In the case of Fiji, for
example, the total value of stock traded annually was only approximately 0.10% to
0.30% of GDP in the period 1997–2005 compared with 23% to 65% in Malaysia, 40%
to 84% in Australia and 60% to 100% in Singapore (Beck et al., 2007)3
Accordingly, the purpose of this paper is to investigate how banking development
in Fiji and neighbouring island economies could be enhanced – in particular, to what
extent such enhancement would depend on a strengthening of legal institutions. To this
end, the paper will address the following specific questions:
. It follows that
the development of the banking sector will probably be a major component of any
accelerated development of the financial system as a whole.
1. How strong are the legal rules protecting creditor rights in Fiji? From the banks’
perspective, has such strength or weakness facilitated or hindered the provision
of credit to the private sector?
5
2. What is the quality of law enforcement in Fiji? From the banks’ perspective, has
such quality facilitated or hindered the provision of credit to the private sector?
3. How well has the banking sector developed in Fiji?
4. In general, is there a relationship between legal institutions and banking
development? and
5. How important is the enhancement of legal institutions in promoting further
banking development in Fiji and other South Pacific island economies?
The paper is organised as follows. The next section outlines the conceptual
framework supporting our analysis and briefly reviews some antecedents in the
literature. Sections 3 and 4 then deal with questions (i) and (ii) above, respectively,
while Section 5 focuses on the measurement of banking development and on
international comparisons of such measures, in order to address question (iii). We then
explore, in Section 6, the general relationships between legal institutions and banking
development. Section 7 considers the role of legal institutions in the enhancement of
the banking sector in Fiji. Finally, Section 8 concludes with a summary of the main
points raised in the paper and their implications for other developing economies in the
South Pacific.
2. Conceptual issues
In a summary of recent research, Levine (1997) states that ‘…broad cross–country
comparisons, individual country analyses, and firm–level investigations point in the
same direction: the functioning of financial systems is vitally linked to economic
growth’ (p689–70). Indeed, proponents of the Finance–Economic Growth nexus have
highlighted the role of the financial system in mobilising savings, facilitating
investment and technological innovation, and promoting productivity and economic
6
growth. Some authors have also argued that, while causality may run in both directions,
there has been increasing evidence that financial development causes economic growth
rather than the reverse (see, for example, Levine, 2005). Although the latter point
remains contentious (see, for example, Meier and Seers, 1984; Lucas, 1998; Calderon
and Liu, 2003), there is little dispute over the suggestion that a strong financial system
is helpful to economic growth and development.
This immediately raises the question of how financial development can be
promoted or accelerated. Evidently, development could result from the enhancement of
either the supply or the demand for organised finance, or both. This paper focuses on
the former. In this connection, a recent and growing strand of literature has emphasised
the importance of legal protection for creditors as a key determinant of the supply of
funds. Advanced by La Porta et al. (LLSV, 1998) and others, the Law–Finance theory
sees adequate investor protection as a pre–requisite for a dependable supply of funds.
Such protection encompasses both the mandating of legal rights and the appropriate
enforcement of these rights—this paper will refer to both as ‘legal institutions’. Some
proponents of the Law–Finance theory (including LLSV, 1998) hold that a country’s
legal institutions are fundamentally shaped by the origin or tradition of its laws, but this
view is not shared by other supporters of the theory, such as Rajan and Zingales
(2003b), Licht et al. (2001), and Acemoglu et al. (2001).
Given the increasing prominence of the Law–Finance theory, it is of interest to
consider its applicability to Fiji and, by extension, to other South Pacific island states.
At one level, the investigation can be motivated by reference to a possible law –
financial development – private sector development – economic growth nexus which
may open up new ways to promote growth. At another, the analysis of financial
development and its determinants is, per se, a perfectly legitimate topic of enquiry and
7
research. Despite the important work of LLSV (1998), Levine (1998, 1999), ADB
(2001b, 2005), Chand (2002), Waqabaca (2000, 2004), and others, there remains a
relative scarcity of information relating to this topic in a Pacific islands context, and it is
timely to make a contribution toward filling this gap.
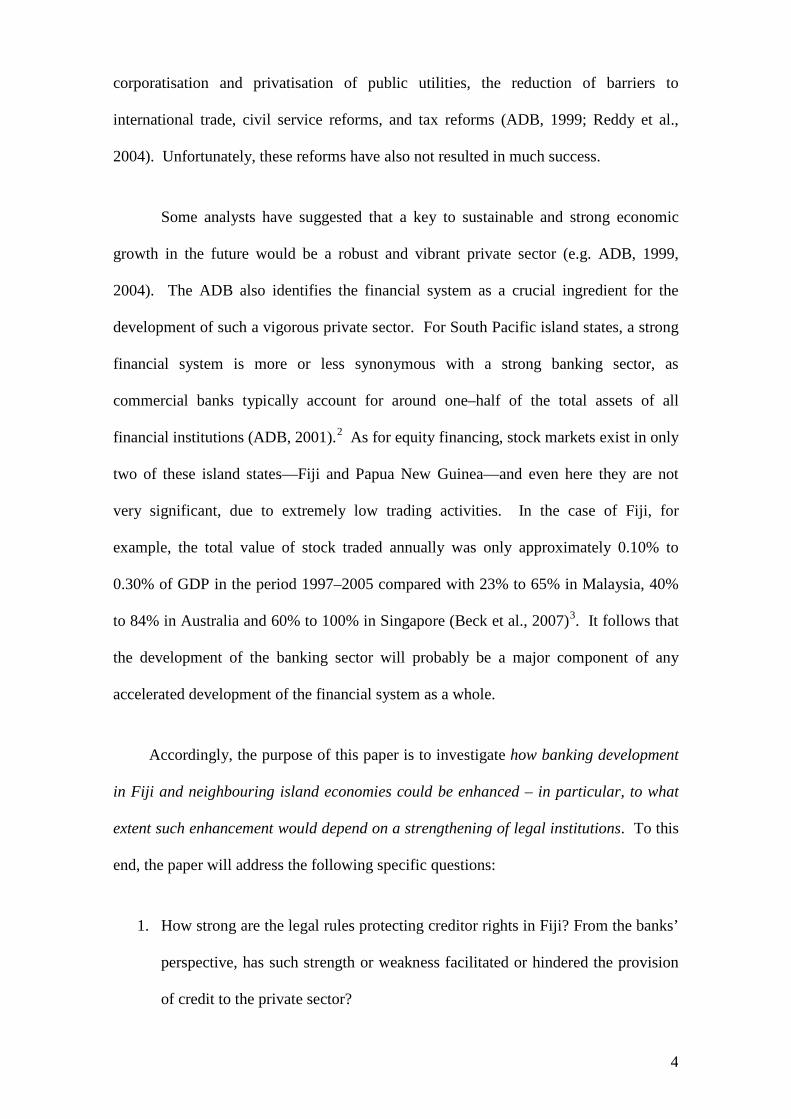
Figure 1. The legal institutions–banking development link.
Figure 1 illustrates several key propositions underlying the above discussion.
According to the Law–Finance theory, a country’s legal institutions play a major role in
determining the level of financial development in that country. In this specific case, the
theory implies that legal rules and/or the quality of law enforcement in Fiji would be
major determinants of the level of banking development in the country, as shown in the
upper part of the figure.4 In turn, proponents of the Finance–Economic Growth theory
would expect banking development (and, more generally, financial development) to
influence economic development at a broader level, as shown in the lower part of the
figure. The broken lines illustrate an alternative (but not necessarily mutually
exclusive) view—namely, that the state of broader socio–economic development may
be an important determinant of banking development, both directly and indirectly (via
its influence on the quality of law enforcement). This view will be discussed in greater
detail in Section 6. In the meantime, we must turn first to an analysis of the strength of
legal rules which protect creditor rights in Fiji.
Legal Rules
Law Enforcement
Legal Institutions Banking Development
Economic Development
8
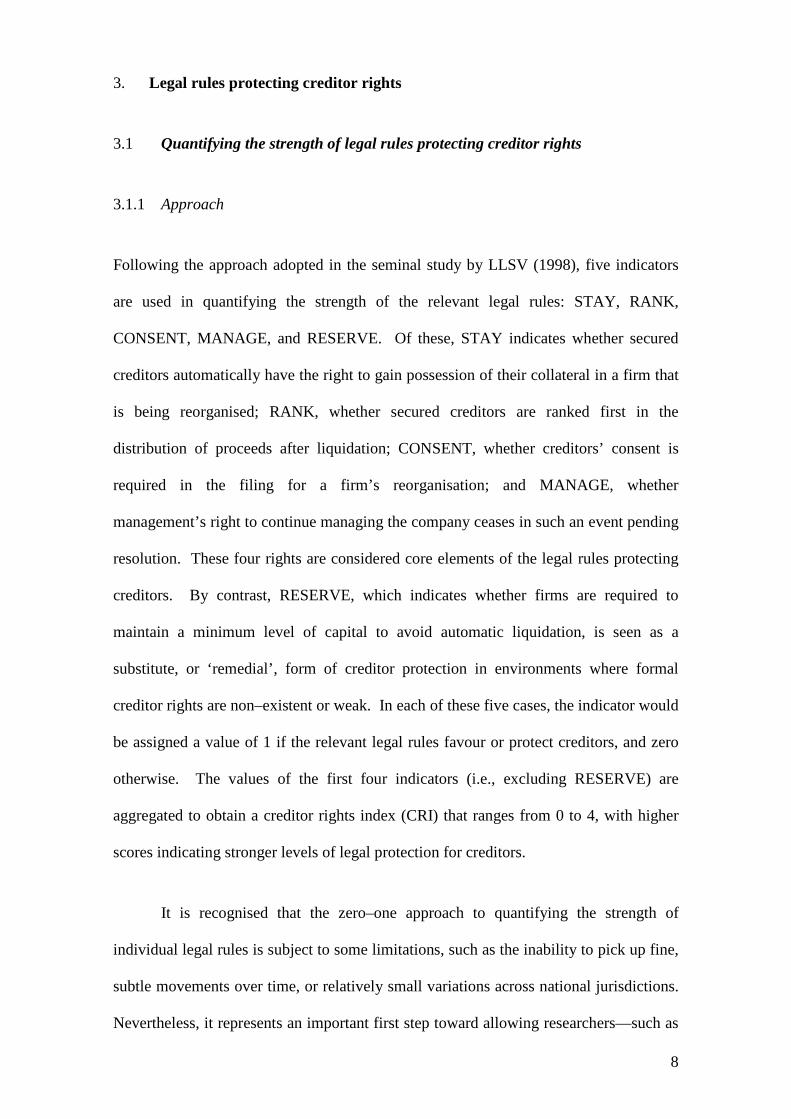
3. Legal rules protecting creditor rights
3.1 Quantifying the strength of legal rules protecting creditor rights
3.1.1 Approach
Following the approach adopted in the seminal study by LLSV (1998), five indicators
are used in quantifying the strength of the relevant legal rules: STAY, RANK,
CONSENT, MANAGE, and RESERVE. Of these, STAY indicates whether secured
creditors automatically have the right to gain possession of their collateral in a firm that
is being reorganised; RANK, whether secured creditors are ranked first in the
distribution of proceeds after liquidation; CONSENT, whether creditors’ consent is
required in the filing for a firm’s reorganisation; and MANAGE, whether
management’s right to continue managing the company ceases in such an event pending
resolution. These four rights are considered core elements of the legal rules protecting
creditors. By contrast, RESERVE, which indicates whether firms are required to
maintain a minimum level of capital to avoid automatic liquidation, is seen as a
substitute, or ‘remedial’, form of creditor protection in environments where formal
creditor rights are non–existent or weak. In each of these five cases, the indicator would
be assigned a value of 1 if the relevant legal rules favour or protect creditors, and zero
otherwise. The values of the first four indicators (i.e., excluding RESERVE) are
aggregated to obtain a creditor rights index (CRI) that ranges from 0 to 4, with higher
scores indicating stronger levels of legal protection for creditors.
It is recognised that the zero–one approach to quantifying the strength of
individual legal rules is subject to some limitations, such as the inability to pick up fine,
subtle movements over time, or relatively small variations across national jurisdictions.
Nevertheless, it represents an important first step toward allowing researchers—such as
9
LLSV (1998), Levine (1998) and now ourselves—to compare the status of investor
rights across a diverse range of countries.
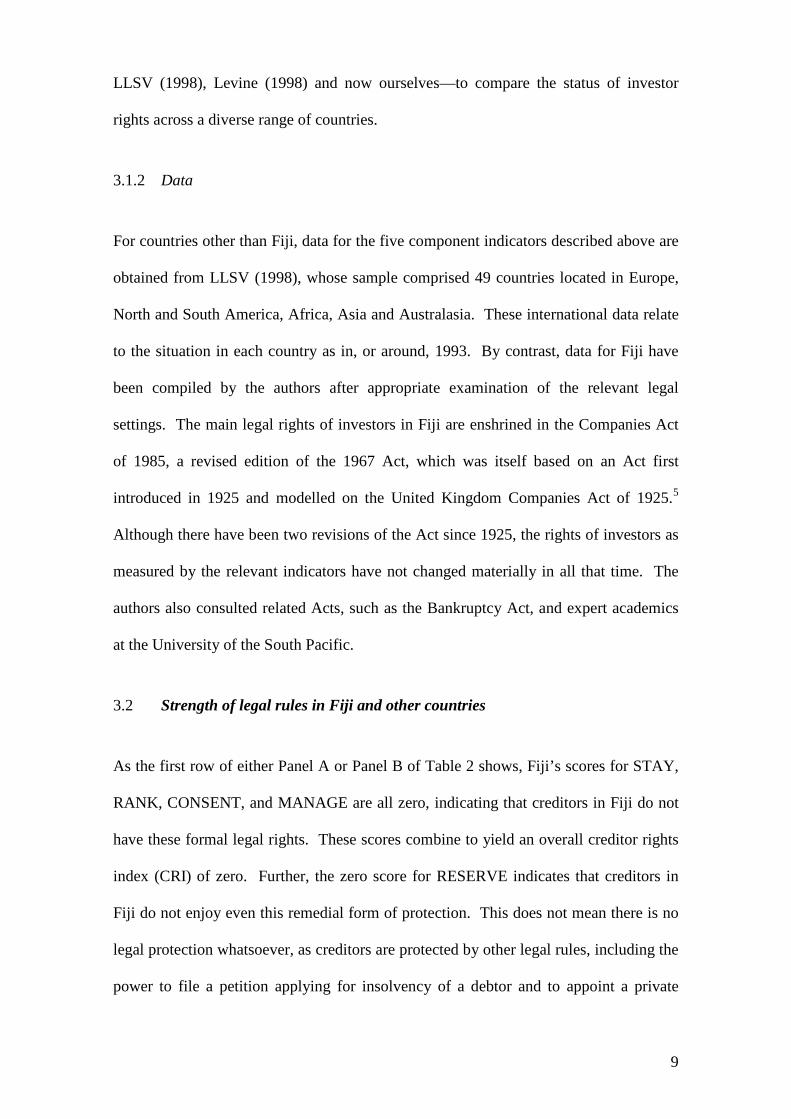
3.1.2 Data
For countries other than Fiji, data for the five component indicators described above are
obtained from LLSV (1998), whose sample comprised 49 countries located in Europe,
North and South America, Africa, Asia and Australasia. These international data relate
to the situation in each country as in, or around, 1993. By contrast, data for Fiji have
been compiled by the authors after appropriate examination of the relevant legal
settings. The main legal rights of investors in Fiji are enshrined in the Companies Act
of 1985, a revised edition of the 1967 Act, which was itself based on an Act first
introduced in 1925 and modelled on the United Kingdom Companies Act of 1925.5
3.2 Strength of legal rules in Fiji and other countries
Although there have been two revisions of the Act since 1925, the rights of investors as
measured by the relevant indicators have not changed materially in all that time. The
authors also consulted related Acts, such as the Bankruptcy Act, and expert academics
at the University of the South Pacific.
As the first row of either Panel A or Panel B of Table 2 shows, Fiji’s scores for STAY,
RANK, CONSENT, and MANAGE are all zero, indicating that creditors in Fiji do not
have these formal legal rights. These scores combine to yield an overall creditor rights
index (CRI) of zero. Further, the zero score for RESERVE indicates that creditors in
Fiji do not enjoy even this remedial form of protection. This does not mean there is no
legal protection whatsoever, as creditors are protected by other legal rules, including the
power to file a petition applying for insolvency of a debtor and to appoint a private

10
receiver. Generally, the Bankruptcy Act (Cap 48) appears quite favourable for secured
creditors.
Table 2. Assessing creditor legal rights in Fiji through secondary data
Panel A. Fiji and LLSV countries classified by legal origin Legal Origin STAY RANK CONSENT MANAGE CRI RESERVE Fiji 0.00 0.00 0.00 0.00 0.00 0.00 English 0.72 0.89 0.72 0.78 3.11 0.01 French 0.26 0.65 0.42 0.26 1.58 0.85 German 0.67 1.00 0.33 0.33 2.33 1.00 Scandinavian 0.25 1.00 0.75 0.00 2.00 0.75 Sample Ave 0.49 0.81 0.55 0.45 2.30 0.57
Panel B. Fiji and LLSV countries classified by World–Bank income category
Income Group STAY RANK CONSENT MANAGE CRI RESERVE Fiji 0.00 0.00 0.00 0.00 0.00 0.00 Low Income 1.00 1.00 1.00 1.00 4.00 0.00 Lower Middle 0.56 0.44 0.56 0.56 2.11 0.70 Upper Middle 0.14 0.88 0.57 0.43 2.00 0.75 High Income 0.46 0.88 0.46 0.31 2.12 0.58
Source: LLSV (1998), except for Fiji, which are based on the present research. LLSV data are for 1993 and Fiji data would not have changed since 1925. Note: Figures reported for each of the various country groups and for the whole sample are unweighted averages of the corresponding figures for the member countries.
It is evident from Table 2 that the formal level of creditor protection in Fiji is
extremely weak in comparison with the 49 other countries for which data are available.
In Panel A, these countries are categorised according to the origin of each country’s
legal system, with 18 countries being in the English–origin group, 21 in the French, 6 in
the German, and 4 in the Scandinavian group. In Panel B the same countries are
grouped according to the World Bank’s income classifications.6
In terms of legal origin, Fiji falls within the ‘English’ group, whose members
have typically enacted strong legal rules to protect creditor rights: the group’s average
CRI score (3.11) is the highest of all groups shown. With a CRI score of zero, Fiji not
only contrasts sharply with other countries in its English–tradition group, but also
compares unfavourably with countries in other groups, including those with relatively

11
low CRI scores, such as the French–tradition group (1.58, the lowest of the group
averages).
In terms of income classification, Fiji is a ‘Lower Middle Income’ country. Its
CRI score is again far below the average of this group – indeed it is below the average
of any group and of the sample as a whole. It is interesting to note that, in this sample,
all of the ‘Low Income’ countries happen to have English legal traditions, and it turns
out that they all have the strongest level (4) of creditor protection rules.
There is some evidence from both panels of Table 2 that in countries where
creditors enjoy strong protection through legal rules that explicitly safeguard their
rights, less emphasis tends to be placed on the use of RESERVE as an alternative means
to provide such protection. For example, in Panel B the ‘Low Income’ group has the
highest possible CRI score (4.0) and the lowest possible RESERVE score (0). In the
same vein, in Panel A the French–tradition group has the lowest CRI score (1.58) and a
relatively high RESERVE score (0.85). However, this negative correlation does not
always hold: in Panel A, for example, the German–tradition group has a higher score
for both CRI and RESERVE than the French–tradition group.
3.3 Perceptions regarding the role of legal rules in Fiji
Due perhaps to data availability, existing studies have tended to focus on analysing the
legal rules protecting creditors in each country and to overlook the views and opinions
of creditors themselves. Yet, as Rodrik (2000) points out, best–practice ‘blueprints’
may not work in all situations and often participatory processes for aggregating ‘local
knowledge’ are more effective tools for institution building in individual countries. In
contemplating possible amendments to legislation protecting creditor rights, it would
seem reasonable to gain an understanding of the views and opinions of the creditors

12
themselves. Thus, it may be worthwhile to work toward redressing the above
imbalance. This sub–section investigates whether banks in Fiji, a major group of
creditors in the country, are very concerned over the fact that they do not enjoy the
protection provided by a number of legal rules that apply in some other countries.
3.3.1 Data source
Data for this purpose were gathered via an opinion survey conducted in 2006. A
structured interview schedule, using a Likert scale, was employed. In what follows we
focus on those parts of the survey which relate to banks’ views regarding the
importance of the nominated legal rights for the provision of private sector credit in Fiji.
The relevant respondents in this instance are 14 key personnel from the 5 commercial
banks in the country.
These respondents were asked to rate on a scale of 1 (major obstacle) to 7 (no
obstacle) the legal problems they experienced in relation to each aspect of creditor
rights (STAY, RANK, CONSENT, MANAGE and RESERVE). For instance, in
relation to STAY, the question was: ‘How would you rate the legal problems associated
with repossession of debt collateral?’ Given that automatic stay was not legally
mandated in Fiji, a 7 response here would indicate that, from the respondent’s point of
view, the relevant bank did not have any problems in repossessing collateral despite the
absence of this particular legal rule. Conversely, a score of 1 would indicate that this
absence was a major obstacle. In general, a higher score on each of these survey
variables would indicate a more favourable rating from the viewpoint of banking
development.
In parallel with the composite index CRI above, the ratings for the four ‘core’
aspects (STAY, RANK, CONSENT and MANAGE) are combined via simple
13
averaging to yield an overall rating for these aspects. This aggregated rating also ranges
from 1 to 7. Thus, an aggregated score of 1 would indicate that the respondent saw the
absence of the relevant legal rules as a major obstacle to advancing credit to the private
sector, and a score of 7, that the respondent did not see such absence as any hindrance at
all.
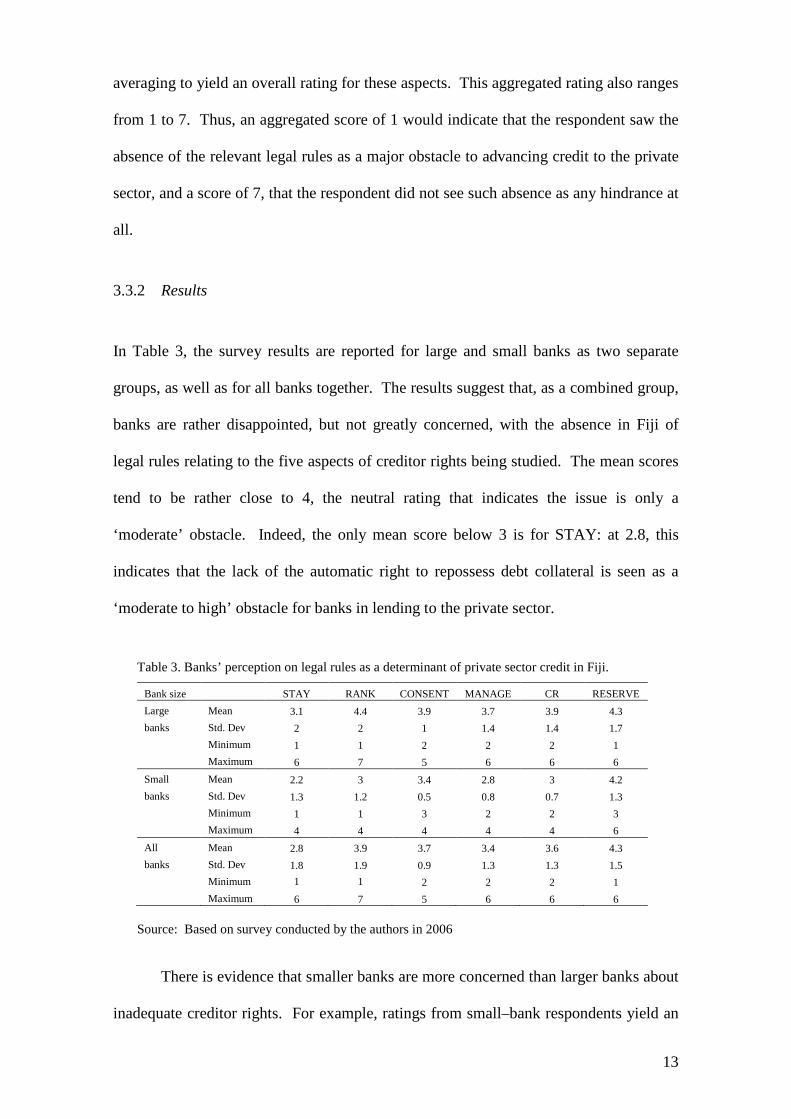
3.3.2 Results
In Table 3, the survey results are reported for large and small banks as two separate
groups, as well as for all banks together. The results suggest that, as a combined group,
banks are rather disappointed, but not greatly concerned, with the absence in Fiji of
legal rules relating to the five aspects of creditor rights being studied. The mean scores
tend to be rather close to 4, the neutral rating that indicates the issue is only a
‘moderate’ obstacle. Indeed, the only mean score below 3 is for STAY: at 2.8, this
indicates that the lack of the automatic right to repossess debt collateral is seen as a
‘moderate to high’ obstacle for banks in lending to the private sector.
Table 3. Banks’ perception on legal rules as a determinant of private sector credit in Fiji.
Bank size STAY RANK CONSENT MANAGE CR RESERVE Large Mean 3.1 4.4 3.9 3.7 3.9 4.3 banks Std. Dev 2 2 1 1.4 1.4 1.7 Minimum 1 1 2 2 2 1 Maximum 6 7 5 6 6 6 Small Mean 2.2 3 3.4 2.8 3 4.2 banks Std. Dev 1.3 1.2 0.5 0.8 0.7 1.3 Minimum 1 1 3 2 2 3 Maximum 4 4 4 4 4 6 All Mean 2.8 3.9 3.7 3.4 3.6 4.3 banks Std. Dev 1.8 1.9 0.9 1.3 1.3 1.5 Minimum 1 1 2 2 2 1 Maximum 6 7 5 6 6 6
Source: Based on survey conducted by the authors in 2006
There is evidence that smaller banks are more concerned than larger banks about
inadequate creditor rights. For example, ratings from small–bank respondents yield an
14
average score of 3.0 for overall creditor rights across the four ‘core’ aspects (see column
under ‘CR’ in the table) compared with an average rating of 3.9 given by respondents
from large banks. Yet even among small–bank respondents, only one variable (STAY)
receives a mean rating close to 2.0 (indicating a ‘high’ obstacle).
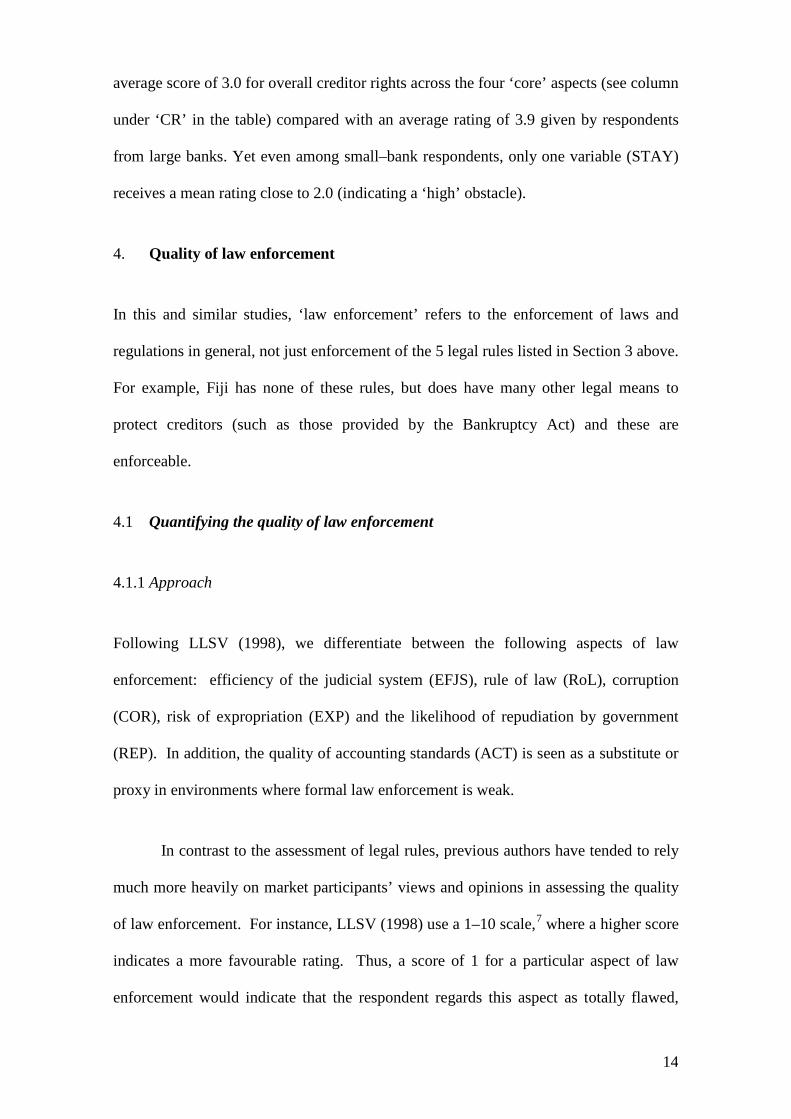
4. Quality of law enforcement
In this and similar studies, ‘law enforcement’ refers to the enforcement of laws and
regulations in general, not just enforcement of the 5 legal rules listed in Section 3 above.
For example, Fiji has none of these rules, but does have many other legal means to
protect creditors (such as those provided by the Bankruptcy Act) and these are
enforceable.
4.1 Quantifying the quality of law enforcement
4.1.1 Approach
Following LLSV (1998), we differentiate between the following aspects of law
enforcement: efficiency of the judicial system (EFJS), rule of law (RoL), corruption
(COR), risk of expropriation (EXP) and the likelihood of repudiation by government
(REP). In addition, the quality of accounting standards (ACT) is seen as a substitute or
proxy in environments where formal law enforcement is weak.
In contrast to the assessment of legal rules, previous authors have tended to rely
much more heavily on market participants’ views and opinions in assessing the quality
of law enforcement. For instance, LLSV (1998) use a 1–10 scale,7 where a higher score
indicates a more favourable rating. Thus, a score of 1 for a particular aspect of law
enforcement would indicate that the respondent regards this aspect as totally flawed,
15
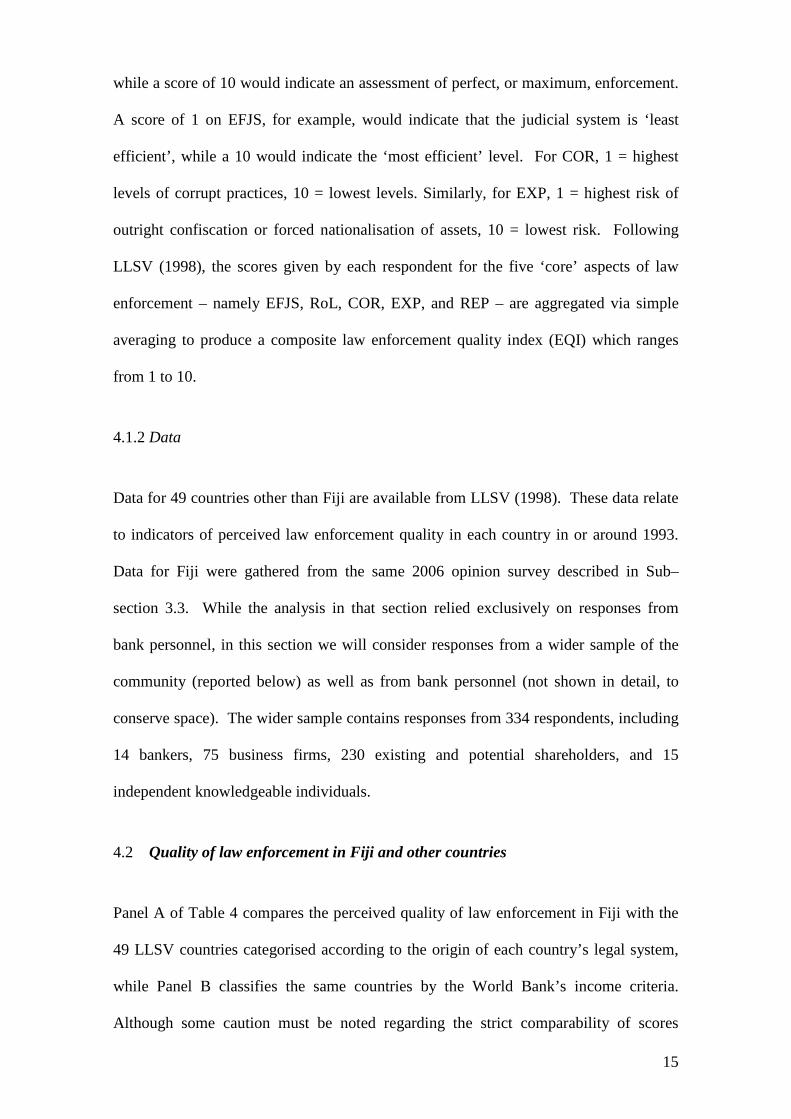
while a score of 10 would indicate an assessment of perfect, or maximum, enforcement.
A score of 1 on EFJS, for example, would indicate that the judicial system is ‘least
efficient’, while a 10 would indicate the ‘most efficient’ level. For COR, 1 = highest
levels of corrupt practices, 10 = lowest levels. Similarly, for EXP, 1 = highest risk of
outright confiscation or forced nationalisation of assets, 10 = lowest risk. Following
LLSV (1998), the scores given by each respondent for the five ‘core’ aspects of law
enforcement – namely EFJS, RoL, COR, EXP, and REP – are aggregated via simple
averaging to produce a composite law enforcement quality index (EQI) which ranges
from 1 to 10.
4.1.2 Data
Data for 49 countries other than Fiji are available from LLSV (1998). These data relate
to indicators of perceived law enforcement quality in each country in or around 1993.
Data for Fiji were gathered from the same 2006 opinion survey described in Sub–
section 3.3. While the analysis in that section relied exclusively on responses from
bank personnel, in this section we will consider responses from a wider sample of the
community (reported below) as well as from bank personnel (not shown in detail, to
conserve space). The wider sample contains responses from 334 respondents, including
14 bankers, 75 business firms, 230 existing and potential shareholders, and 15
independent knowledgeable individuals.
4.2 Quality of law enforcement in Fiji and other countries
Panel A of Table 4 compares the perceived quality of law enforcement in Fiji with the
49 LLSV countries categorised according to the origin of each country’s legal system,
while Panel B classifies the same countries by the World Bank’s income criteria.
Although some caution must be noted regarding the strict comparability of scores
16
obtained in different countries and at different points in time, the results do provide
some indication of how Fiji’s law enforcement compares internationally. Interestingly,
the rating (also on a 1–10 scale) provided by Transparency International 8
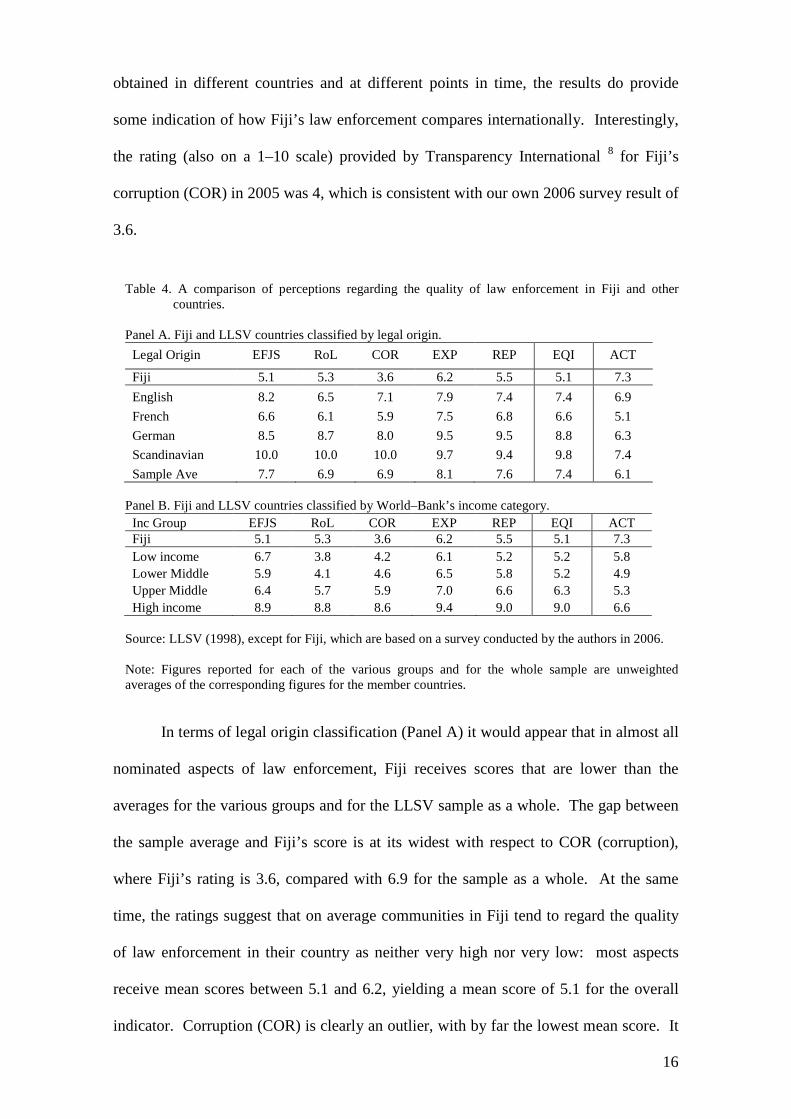
Table 4. A comparison of perceptions regarding the quality of law enforcement in Fiji and other countries.
for Fiji’s
corruption (COR) in 2005 was 4, which is consistent with our own 2006 survey result of
3.6.
Panel A. Fiji and LLSV countries classified by legal origin.
Legal Origin EFJS RoL COR EXP REP EQI ACT
Fiji 5.1 5.3 3.6 6.2 5.5 5.1 7.3 English 8.2 6.5 7.1 7.9 7.4 7.4 6.9 French 6.6 6.1 5.9 7.5 6.8 6.6 5.1 German 8.5 8.7 8.0 9.5 9.5 8.8 6.3 Scandinavian 10.0 10.0 10.0 9.7 9.4 9.8 7.4 Sample Ave 7.7 6.9 6.9 8.1 7.6 7.4 6.1
Panel B. Fiji and LLSV countries classified by World–Bank’s income category.
Inc Group EFJS RoL COR EXP REP EQI ACT Fiji 5.1 5.3 3.6 6.2 5.5 5.1 7.3 Low income 6.7 3.8 4.2 6.1 5.2 5.2 5.8 Lower Middle 5.9 4.1 4.6 6.5 5.8 5.2 4.9 Upper Middle 6.4 5.7 5.9 7.0 6.6 6.3 5.3 High income 8.9 8.8 8.6 9.4 9.0 9.0 6.6
Source: LLSV (1998), except for Fiji, which are based on a survey conducted by the authors in 2006.
Note: Figures reported for each of the various groups and for the whole sample are unweighted averages of the corresponding figures for the member countries.
In terms of legal origin classification (Panel A) it would appear that in almost all
nominated aspects of law enforcement, Fiji receives scores that are lower than the
averages for the various groups and for the LLSV sample as a whole. The gap between
the sample average and Fiji’s score is at its widest with respect to COR (corruption),
where Fiji’s rating is 3.6, compared with 6.9 for the sample as a whole. At the same
time, the ratings suggest that on average communities in Fiji tend to regard the quality
of law enforcement in their country as neither very high nor very low: most aspects
receive mean scores between 5.1 and 6.2, yielding a mean score of 5.1 for the overall
indicator. Corruption (COR) is clearly an outlier, with by far the lowest mean score. It
17
is also noteworthy that the mean score for ACT is relatively high (7.3), indicating that
communities in Fiji are fairly satisfied with the country’s accounting standards. Indeed,
this score is higher than the average for the entire sample, as well as the averages of all
groups except the Scandinavian–tradition group.
Overall, Fiji’s law enforcement situation appears to compare more favourably in
an international setting than its legal rules situation. This can be seen more clearly in
Panel B, where countries are grouped according to income level. At 5.1, Fiji’s
composite (EQI) score is almost identical to the average score for both the ‘Low
Income’ and ‘Lower Middle Income’ groups (5.2). Indeed, Fiji’s RoL score (5.3) is
higher than the average scores of both of these groups (3.8, and 4.1, respectively). Of
course, COR still stands out as the weakest link in the country’s overall enforcement
quality: at 3.6, Fiji’s COR score is considerably lower than the averages for the above
two group (4.2 and 4.6, respectively). Remarkably, Fiji’s ACT score (7.3) is higher
than the averages for all income groups, including the ‘High Income’ group (6.6).
The above analysis has been based on responses obtained from all 334
respondents who participated in the 2006 Fiji survey – this helps to make the Fiji data as
comparable as possible to the international data. Analysis has also been undertaken
with the use of a more restricted set of Fiji data, namely the responses from 14 key
personnel in the banking sector only. To conserve space, we do not report the results of
such analysis in detail. It suffices to say that the ratings from bank personnel turn out to
be quite similar to those from the public at large. On average, the ratings given by
small–bank personnel tend to be lower than those given by their large–bank
counterparts, but again the differences are generally not very large.
18
5. Level of development in the banking sector
5.1 Quantifying banking development
5.1.1 Basic approach
Measures of size, activity and depth are commonly included in financial development
analysis. For banking development, the ratio of bank assets to GDP (BANKY) is
usually taken to indicate size, as it gives an indication of the overall size of the banking
sector. Similarly, the ratio of bank private sector credit to GDP (BPRVY) is seen as a
measure of activity, as it focuses on the amount of credit that has been allocated to the
private sector, considered the main engine of growth in the economy. Finally, the ratio
of bank liquid liabilities to GDP (LLY) is often used as an indicator of depth or
liquidity; because it focuses on liquid instruments. For each of these indicators, an
increase over time is interpreted as evidence of greater, or more advanced, development.
5.1.2 A composite index for banking development
Each of the above ratios measures only one specific aspect of banking development.
Thus, it is useful to develop composite indices that would both conveniently summarise
the available information and measure reasonably accurately the overall level of
development in the banking sector. Our proposed approach is to construct a banking
development index (BDI) that is a weighted average of the three component indicators.
In this regard, we differ from previous researchers, who have tended to rely on analyses
of individual component indicators.
In line with the construction of CRI (Sub–section 3.1) and EQI (Sub–section
4.1) our standard set of weights is one where BANKY, BPRVY and LLY are each
19
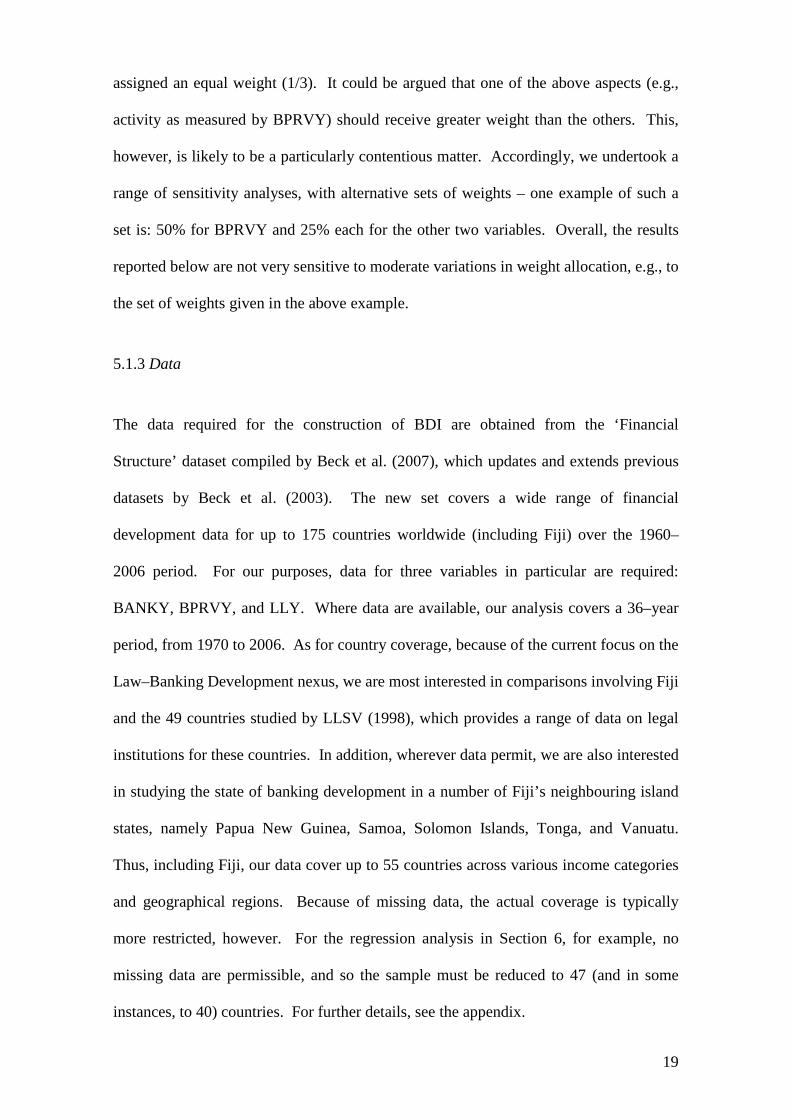
assigned an equal weight (1/3). It could be argued that one of the above aspects (e.g.,
activity as measured by BPRVY) should receive greater weight than the others. This,
however, is likely to be a particularly contentious matter. Accordingly, we undertook a
range of sensitivity analyses, with alternative sets of weights – one example of such a
set is: 50% for BPRVY and 25% each for the other two variables. Overall, the results
reported below are not very sensitive to moderate variations in weight allocation, e.g., to
the set of weights given in the above example.
5.1.3 Data
The data required for the construction of BDI are obtained from the ‘Financial
Structure’ dataset compiled by Beck et al. (2007), which updates and extends previous
datasets by Beck et al. (2003). The new set covers a wide range of financial
development data for up to 175 countries worldwide (including Fiji) over the 1960–
2006 period. For our purposes, data for three variables in particular are required:
BANKY, BPRVY, and LLY. Where data are available, our analysis covers a 36–year
period, from 1970 to 2006. As for country coverage, because of the current focus on the
Law–Banking Development nexus, we are most interested in comparisons involving Fiji
and the 49 countries studied by LLSV (1998), which provides a range of data on legal
institutions for these countries. In addition, wherever data permit, we are also interested
in studying the state of banking development in a number of Fiji’s neighbouring island
states, namely Papua New Guinea, Samoa, Solomon Islands, Tonga, and Vanuatu.
Thus, including Fiji, our data cover up to 55 countries across various income categories
and geographical regions. Because of missing data, the actual coverage is typically
more restricted, however. For the regression analysis in Section 6, for example, no
missing data are permissible, and so the sample must be reduced to 47 (and in some
instances, to 40) countries. For further details, see the appendix.
20
5.2 Banking development in Fiji and other economies
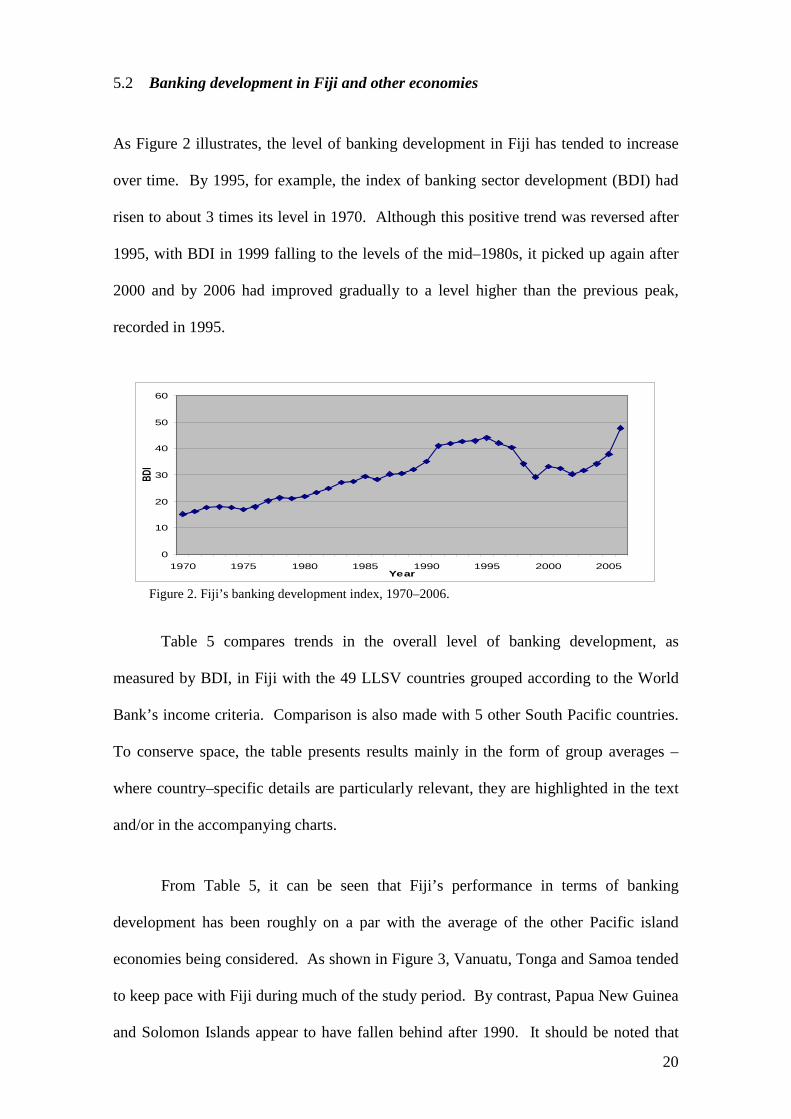
As Figure 2 illustrates, the level of banking development in Fiji has tended to increase
over time. By 1995, for example, the index of banking sector development (BDI) had
risen to about 3 times its level in 1970. Although this positive trend was reversed after
1995, with BDI in 1999 falling to the levels of the mid–1980s, it picked up again after
2000 and by 2006 had improved gradually to a level higher than the previous peak,
recorded in 1995.
0
10
20
30
40
50
60
1970 1975 1980 1985 1990 1995 2000 2005Year
BDI
Figure 2. Fiji’s banking development index, 1970–2006.
Table 5 compares trends in the overall level of banking development, as
measured by BDI, in Fiji with the 49 LLSV countries grouped according to the World
Bank’s income criteria. Comparison is also made with 5 other South Pacific countries.
To conserve space, the table presents results mainly in the form of group averages –
where country–specific details are particularly relevant, they are highlighted in the text
and/or in the accompanying charts.
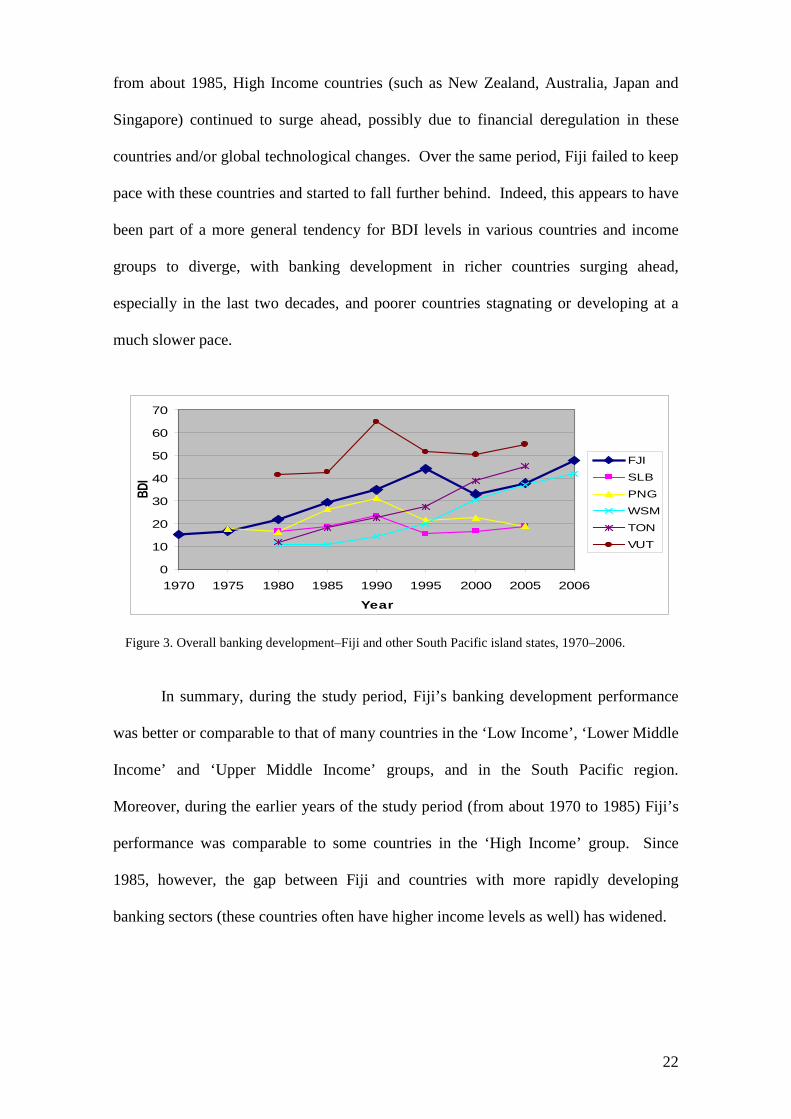
From Table 5, it can be seen that Fiji’s performance in terms of banking
development has been roughly on a par with the average of the other Pacific island
economies being considered. As shown in Figure 3, Vanuatu, Tonga and Samoa tended
to keep pace with Fiji during much of the study period. By contrast, Papua New Guinea
and Solomon Islands appear to have fallen behind after 1990. It should be noted that
21
Vanuatu is a rather special case, in that its status as a tax haven has resulted in
exceptionally high levels of LLY (bank liquid liabilities) despite unremarkable levels of
BANKY and BPRVY.
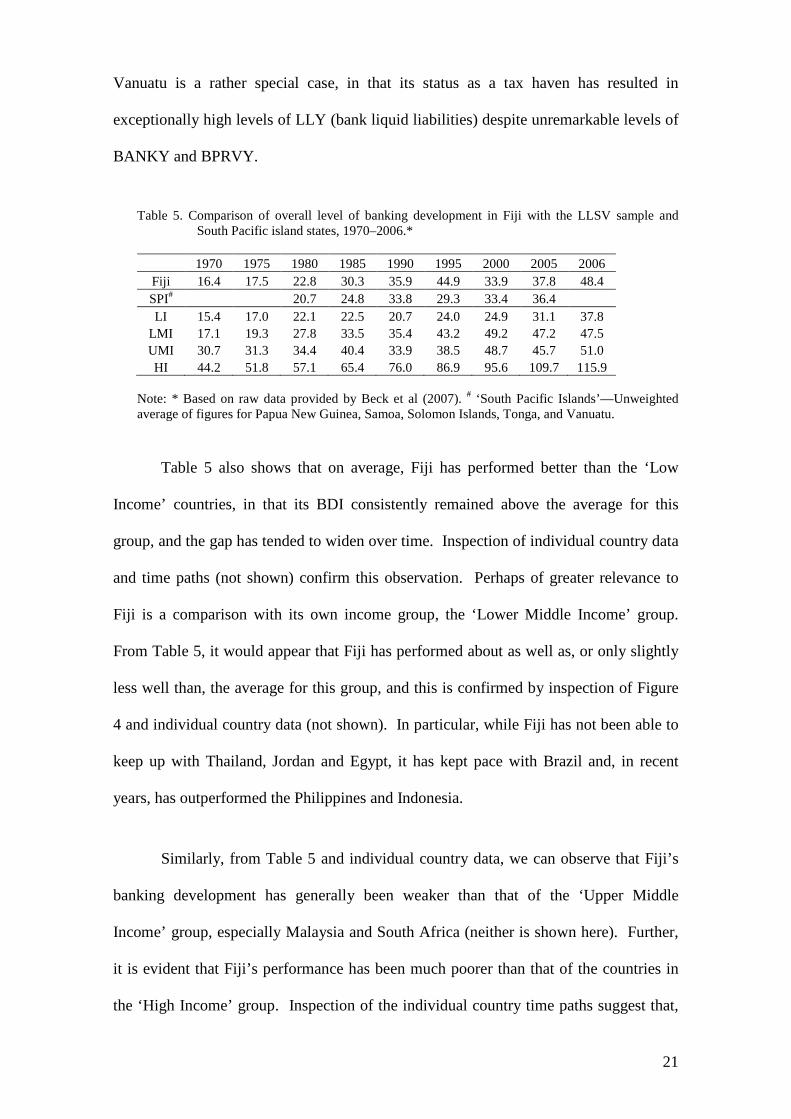
Table 5. Comparison of overall level of banking development in Fiji with the LLSV sample and South Pacific island states, 1970–2006.*
1970 1975 1980 1985 1990 1995 2000 2005 2006
Fiji 16.4 17.5 22.8 30.3 35.9 44.9 33.9 37.8 48.4 SPI# 20.7 24.8 33.8 29.3 33.4 36.4 LI 15.4 17.0 22.1 22.5 20.7 24.0 24.9 31.1 37.8
LMI 17.1 19.3 27.8 33.5 35.4 43.2 49.2 47.2 47.5 UMI 30.7 31.3 34.4 40.4 33.9 38.5 48.7 45.7 51.0 HI 44.2 51.8 57.1 65.4 76.0 86.9 95.6 109.7 115.9
Note: * Based on raw data provided by Beck et al (2007). # ‘South Pacific Islands’—Unweighted average of figures for Papua New Guinea, Samoa, Solomon Islands, Tonga, and Vanuatu.
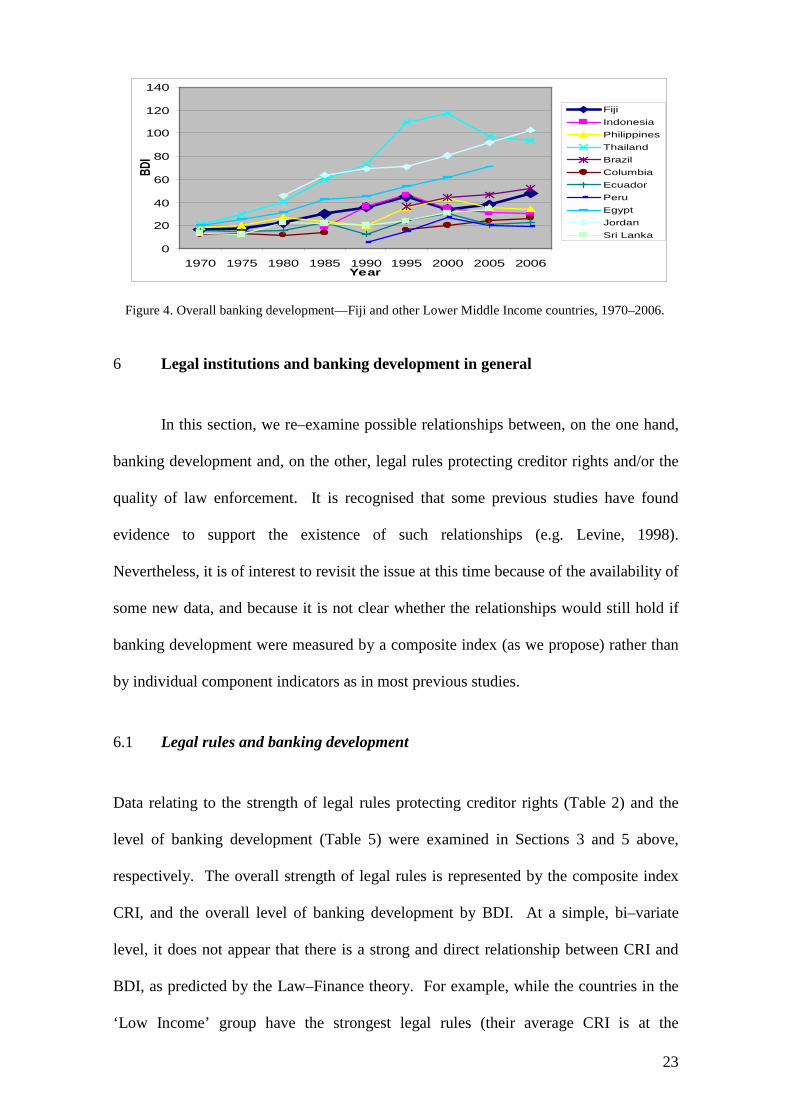
Table 5 also shows that on average, Fiji has performed better than the ‘Low
Income’ countries, in that its BDI consistently remained above the average for this
group, and the gap has tended to widen over time. Inspection of individual country data
and time paths (not shown) confirm this observation. Perhaps of greater relevance to
Fiji is a comparison with its own income group, the ‘Lower Middle Income’ group.
From Table 5, it would appear that Fiji has performed about as well as, or only slightly
less well than, the average for this group, and this is confirmed by inspection of Figure
4 and individual country data (not shown). In particular, while Fiji has not been able to
keep up with Thailand, Jordan and Egypt, it has kept pace with Brazil and, in recent
years, has outperformed the Philippines and Indonesia.
Similarly, from Table 5 and individual country data, we can observe that Fiji’s
banking development has generally been weaker than that of the ‘Upper Middle
Income’ group, especially Malaysia and South Africa (neither is shown here). Further,
it is evident that Fiji’s performance has been much poorer than that of the countries in
the ‘High Income’ group. Inspection of the individual country time paths suggest that,
22
from about 1985, High Income countries (such as New Zealand, Australia, Japan and
Singapore) continued to surge ahead, possibly due to financial deregulation in these
countries and/or global technological changes. Over the same period, Fiji failed to keep
pace with these countries and started to fall further behind. Indeed, this appears to have
been part of a more general tendency for BDI levels in various countries and income
groups to diverge, with banking development in richer countries surging ahead,
especially in the last two decades, and poorer countries stagnating or developing at a
much slower pace.
0
10
20
30
40
50
60
70
1970 1975 1980 1985 1990 1995 2000 2005 2006
Year
BDI
FJI
SLB
PNG
WSM
TON
VUT
Figure 3. Overall banking development–Fiji and other South Pacific island states, 1970–2006.
In summary, during the study period, Fiji’s banking development performance
was better or comparable to that of many countries in the ‘Low Income’, ‘Lower Middle
Income’ and ‘Upper Middle Income’ groups, and in the South Pacific region.
Moreover, during the earlier years of the study period (from about 1970 to 1985) Fiji’s
performance was comparable to some countries in the ‘High Income’ group. Since
1985, however, the gap between Fiji and countries with more rapidly developing
banking sectors (these countries often have higher income levels as well) has widened.
23
0
20
40
60
80
100
120
140
1970 1975 1980 1985 1990 1995 2000 2005 2006Year
BDI
Fiji IndonesiaPhilippinesThailandBrazilColumbiaEcuadorPeruEgyptJordanSri Lanka
Figure 4. Overall banking development—Fiji and other Lower Middle Income countries, 1970–2006.
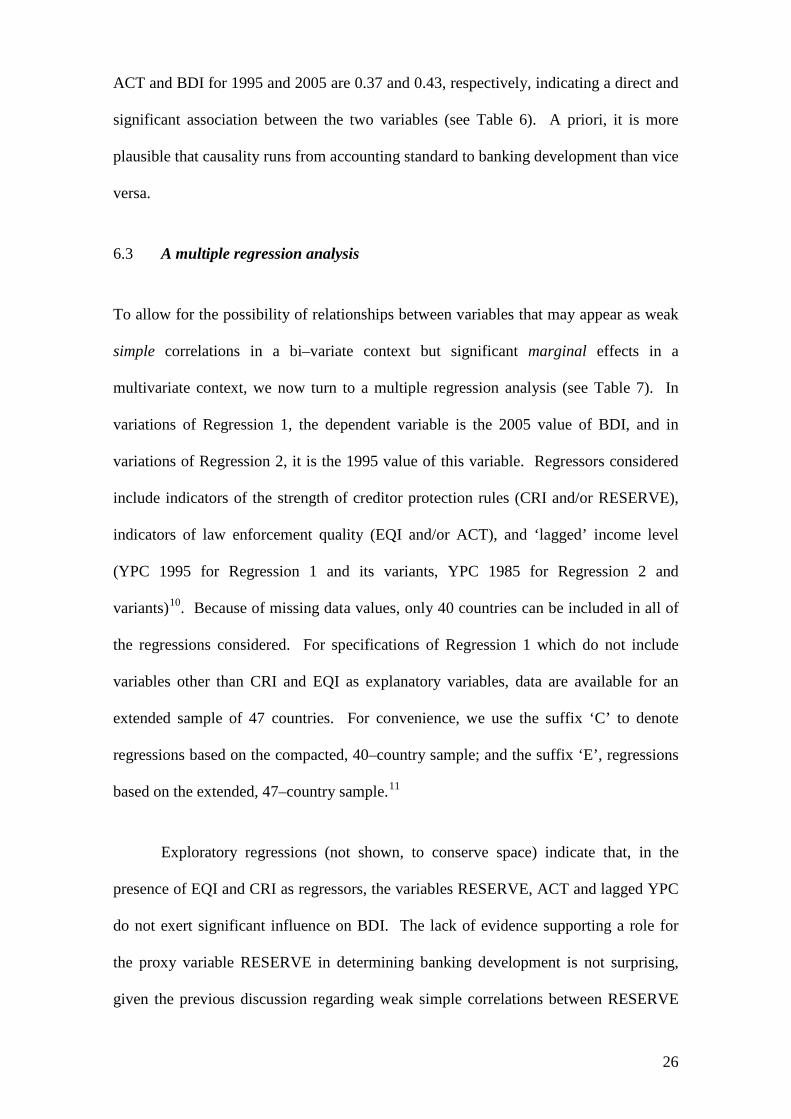
6 Legal institutions and banking development in general
In this section, we re–examine possible relationships between, on the one hand,
banking development and, on the other, legal rules protecting creditor rights and/or the
quality of law enforcement. It is recognised that some previous studies have found
evidence to support the existence of such relationships (e.g. Levine, 1998).
Nevertheless, it is of interest to revisit the issue at this time because of the availability of
some new data, and because it is not clear whether the relationships would still hold if
banking development were measured by a composite index (as we propose) rather than
by individual component indicators as in most previous studies.
6.1 Legal rules and banking development
Data relating to the strength of legal rules protecting creditor rights (Table 2) and the
level of banking development (Table 5) were examined in Sections 3 and 5 above,
respectively. The overall strength of legal rules is represented by the composite index
CRI, and the overall level of banking development by BDI. At a simple, bi–variate
level, it does not appear that there is a strong and direct relationship between CRI and
BDI, as predicted by the Law–Finance theory. For example, while the countries in the
‘Low Income’ group have the strongest legal rules (their average CRI is at the
24
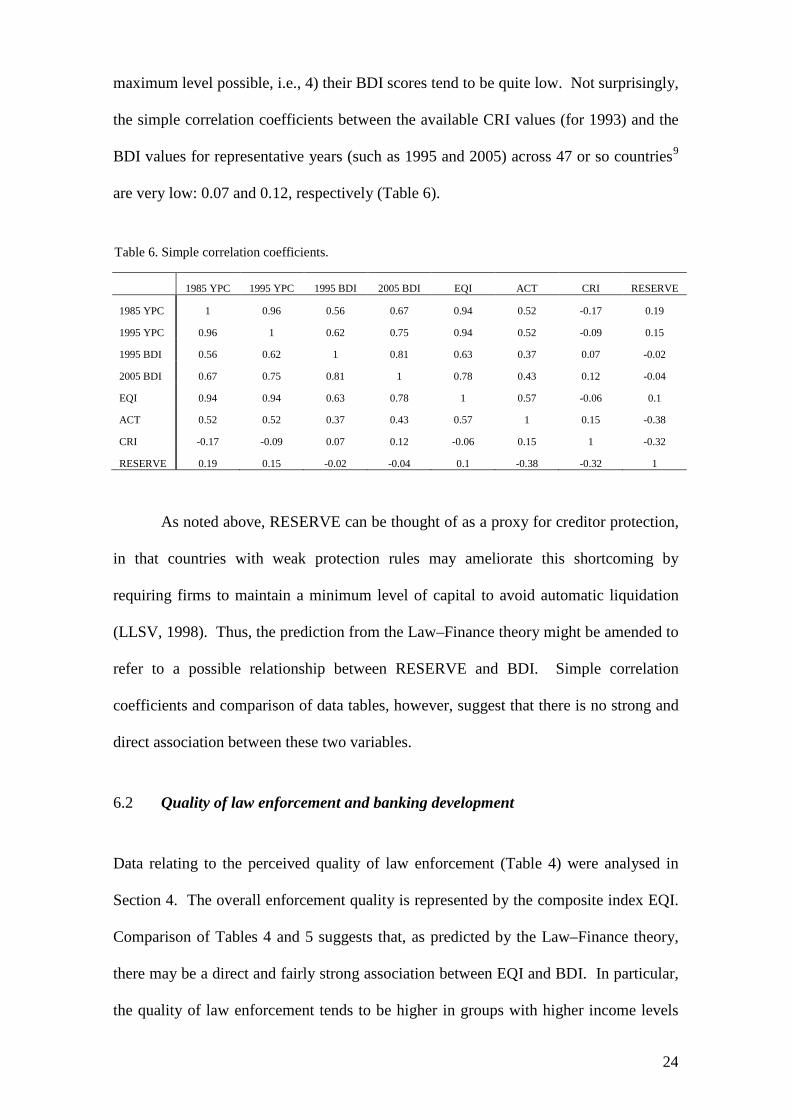
maximum level possible, i.e., 4) their BDI scores tend to be quite low. Not surprisingly,
the simple correlation coefficients between the available CRI values (for 1993) and the
BDI values for representative years (such as 1995 and 2005) across 47 or so countries9
Table 6. Simple correlation coefficients.
are very low: 0.07 and 0.12, respectively (Table 6).
1985 YPC 1995 YPC 1995 BDI 2005 BDI EQI ACT CRI RESERVE
1985 YPC 1 0.96 0.56 0.67 0.94 0.52 -0.17 0.19
1995 YPC 0.96 1 0.62 0.75 0.94 0.52 -0.09 0.15
1995 BDI 0.56 0.62 1 0.81 0.63 0.37 0.07 -0.02
2005 BDI 0.67 0.75 0.81 1 0.78 0.43 0.12 -0.04
EQI 0.94 0.94 0.63 0.78 1 0.57 -0.06 0.1
ACT 0.52 0.52 0.37 0.43 0.57 1 0.15 -0.38
CRI -0.17 -0.09 0.07 0.12 -0.06 0.15 1 -0.32
RESERVE 0.19 0.15 -0.02 -0.04 0.1 -0.38 -0.32 1
As noted above, RESERVE can be thought of as a proxy for creditor protection,
in that countries with weak protection rules may ameliorate this shortcoming by
requiring firms to maintain a minimum level of capital to avoid automatic liquidation
(LLSV, 1998). Thus, the prediction from the Law–Finance theory might be amended to
refer to a possible relationship between RESERVE and BDI. Simple correlation
coefficients and comparison of data tables, however, suggest that there is no strong and
direct association between these two variables.
6.2 Quality of law enforcement and banking development
Data relating to the perceived quality of law enforcement (Table 4) were analysed in
Section 4. The overall enforcement quality is represented by the composite index EQI.
Comparison of Tables 4 and 5 suggests that, as predicted by the Law–Finance theory,
there may be a direct and fairly strong association between EQI and BDI. In particular,
the quality of law enforcement tends to be higher in groups with higher income levels

25
(Table 4); and these are also the groups which tend to enjoy better banking development
performances (Table 5). For example, countries in the ‘High Income’ group appear to
have the best enforcement quality across income groups, and their banking development
performances are also among the strongest.
The simple correlation coefficients between the 1993 EQI values and the BDI
values for 1995 and 2005 are 0.63 and 0.78, respectively, indicating a highly significant
level of association between these two variables (Table 6). A graphical illustration of
this relationship is provided in Figure 5, which shows observations of EQI and BDI as
in 1995 for 47 countries. A priori, it would seem plausible that in such a relationship,
the direction of causality runs more strongly from enforcement quality to banking
development than vice versa, as the former (EQI) depends on broader and more
fundamental characteristics of the society and economy, while the latter (BDI) depends
on narrower economic and financial considerations. Nevertheless, in principle the
possibility of causality running mainly from BDI to EQI cannot be ruled out.
0
50
100
150
200
250
2.0 4.0 6.0 8.0 10.0 12.0EQI
1995
BD
I
Figure 5. 1995 BDI and EQI
ACT (accounting standards) can be used as a proxy or substitute for
enforcement quality, as countries with low enforcement quality may compensate for this
by developing a relatively high ACT level. The simple correlation coefficients between
26
ACT and BDI for 1995 and 2005 are 0.37 and 0.43, respectively, indicating a direct and
significant association between the two variables (see Table 6). A priori, it is more
plausible that causality runs from accounting standard to banking development than vice
versa.
6.3 A multiple regression analysis
To allow for the possibility of relationships between variables that may appear as weak
simple correlations in a bi–variate context but significant marginal effects in a
multivariate context, we now turn to a multiple regression analysis (see Table 7). In
variations of Regression 1, the dependent variable is the 2005 value of BDI, and in
variations of Regression 2, it is the 1995 value of this variable. Regressors considered
include indicators of the strength of creditor protection rules (CRI and/or RESERVE),
indicators of law enforcement quality (EQI and/or ACT), and ‘lagged’ income level
(YPC 1995 for Regression 1 and its variants, YPC 1985 for Regression 2 and
variants)10. Because of missing data values, only 40 countries can be included in all of
the regressions considered. For specifications of Regression 1 which do not include
variables other than CRI and EQI as explanatory variables, data are available for an
extended sample of 47 countries. For convenience, we use the suffix ‘C’ to denote
regressions based on the compacted, 40–country sample; and the suffix ‘E’, regressions
based on the extended, 47–country sample.11
Exploratory regressions (not shown, to conserve space) indicate that, in the
presence of EQI and CRI as regressors, the variables RESERVE, ACT and lagged YPC
do not exert significant influence on BDI. The lack of evidence supporting a role for
the proxy variable RESERVE in determining banking development is not surprising,
given the previous discussion regarding weak simple correlations between RESERVE
27
and BDI. By contrast, both ACT (accounting standard) and YPC (income per capita
level) are likely to have a direct relationship with BDI, and the fact that these
relationships are not picked up by the regressions is due probably to their co–linearity
with EQI (see Table 6)
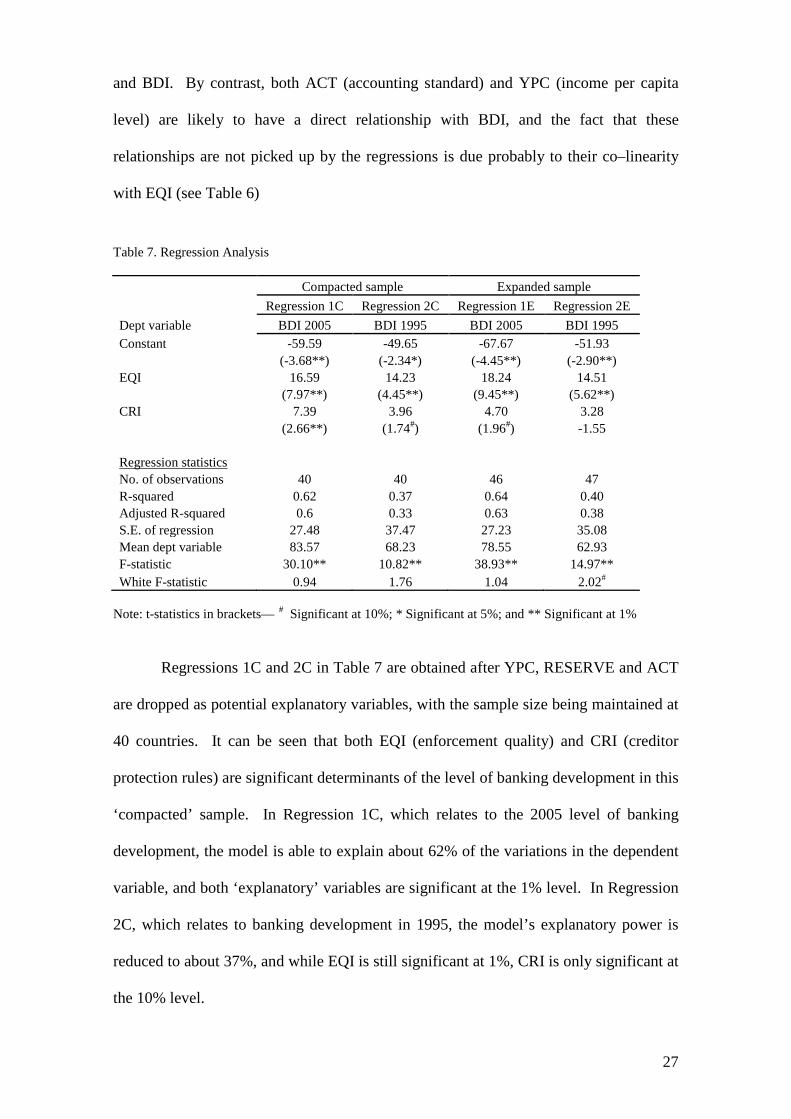
Table 7. Regression Analysis
Compacted sample Expanded sample Regression 1C Regression 2C Regression 1E Regression 2E Dept variable BDI 2005 BDI 1995 BDI 2005 BDI 1995 Constant -59.59 -49.65 -67.67 -51.93 (-3.68**) (-2.34*) (-4.45**) (-2.90**) EQI 16.59 14.23 18.24 14.51 (7.97**) (4.45**) (9.45**) (5.62**) CRI 7.39 3.96 4.70 3.28 (2.66**) (1.74#) (1.96#) -1.55
Regression statistics No. of observations 40 40 46 47 R-squared 0.62 0.37 0.64 0.40 Adjusted R-squared 0.6 0.33 0.63 0.38 S.E. of regression 27.48 37.47 27.23 35.08 Mean dept variable 83.57 68.23 78.55 62.93 F-statistic 30.10** 10.82** 38.93** 14.97** White F-statistic 0.94 1.76 1.04 2.02#
Note: t-statistics in brackets— # Significant at 10%; * Significant at 5%; and ** Significant at 1%
Regressions 1C and 2C in Table 7 are obtained after YPC, RESERVE and ACT
are dropped as potential explanatory variables, with the sample size being maintained at
40 countries. It can be seen that both EQI (enforcement quality) and CRI (creditor
protection rules) are significant determinants of the level of banking development in this
‘compacted’ sample. In Regression 1C, which relates to the 2005 level of banking
development, the model is able to explain about 62% of the variations in the dependent
variable, and both ‘explanatory’ variables are significant at the 1% level. In Regression
2C, which relates to banking development in 1995, the model’s explanatory power is
reduced to about 37%, and while EQI is still significant at 1%, CRI is only significant at
the 10% level.
28
With YPC, RESERVE and ACT no longer being considered as potential
regressors, data availability allows the sample size to be increased to 47: doing so
yields Regressions 1E and 2E. In this ‘extended’ sample, EQI (enforcement quality)
remains significant throughout as an explanatory variable, while CRI (creditor
protection rules) is significant only at the 10% level for Regression 1E (which relates to
the 2005 level of banking development) and is not significant even at this level for
Regression 2E (explaining the 1995 level of BDI).12
Estimates for Regression 1E suggest that, other things being equal, a one–point
increase in EQI would result in an increase of approximately 18.24 points in BDI, while
a one–point increase in CRI would produce an increase of approximately 4.70 points in
BDI.
In Regression 1E, the model is
able to explain about 64% of the variations in the dependent variable; for Regression
2E, this is reduced to about 40%.
13
These results are in broad agreement with the findings of Levine (1998). In
particular, Regressions 1C and 2C serve to confirm that key elements of the earlier
findings (namely the significance of CRI and EQI) remain valid when the banking
development variable is re–specified as a composite index (BDI) combining three
aspects of banking development, rather than a single indicator (BPVRY) as in the
previous study. Further, those key findings turn out to apply not only to the earlier
study period (1976–1993) but also to a later period, as represented by the years 1995
and 2005.
Thus, although there is no significant simple correlation between CRI and BDI,
it appears that the former variable may have a marginal impact on the latter, once the
influence of EQI has been controlled for.
29
Yet there are also some substantive differences between our results and the
findings of Levine (1998). In particular, Regressions 1E and 2E indicate that the effect
of legal rules (CRI) on banking development may be rather weaker and less robust than
previously thought. This difference in findings can be explained, to some extent, by
variations in the country coverage of the respective samples.
Our ‘compacted’ sample, which is the basis of Regressions 1C and 2C, differs
from the Levine (1998) sample in only minor respects. Specifically, it adds Fiji and
Uruguay to the Levine sample, and drops Indonesia, Pakistan, Taiwan and Zimbabwe
(see the appendix). For the present purposes, such additions and omissions tend to
offset each other, so that the regression results from the two samples are quite similar.
By contrast, our ‘extended’ sample adds the following seven countries to the
‘compacted’ sample: Ecuador, Indonesia, Ireland, Kenya, Pakistan, Sri Lanka and
Zimbabwe. Most of the additional countries are developing economies, with high CRI
scores and relatively low BDI scores. Therefore, their addition to the sample tends to
weaken the estimated effect of CRI on BDI, as can be seen in the differences between
estimates for Regressions 1C and 2C on one hand and for Regressions 1E and 2E on the
other. Similarly, the differences in country coverage between our ‘extended’ sample
and the Levine sample (additions to the latter sample include Ecuador, Fiji, Ireland,
Kenya, Sri Lanka and Uruguay; and Taiwan is the only omission) tend to weaken the
estimated impact of CRI in Regressions 1E and 2E in comparison with the results
reported by Levine. The new results suggest, more generally, that legal rules may play
a less significant role in determining bank development in developing economies than
in developed countries.
30
6.4 Further discussion: implications and caveats
On balance, the picture that emerges from the results presented above is one that is
broadly consistent with the Law–Finance theory: both legal rules and law enforcement
quality appear to be important determinants of banking development in a cross section
of countries from around the world. Of the two legal institutions variables, EQI appears
to have a more robust link with banking development than CRI. In practice, policy
makers may also find it more feasible to make continuous, small improvements in the
quality of law enforcement than to implement discrete, big changes in legal rules and
codes.
Can this finding be taken as unambiguous evidence in support of the Law–
Finance–Economic Growth nexus? The answer is not clear–cut. If the link between
legal institutions and banking development were interpreted as one where the legal
system predominantly determines the banking sector, and if, in turn, banking
development determined economic development, it would be appropriate to conclude
that legal institutions indirectly determine economic development (see Figure 1).
Although there is indeed a degree of association14
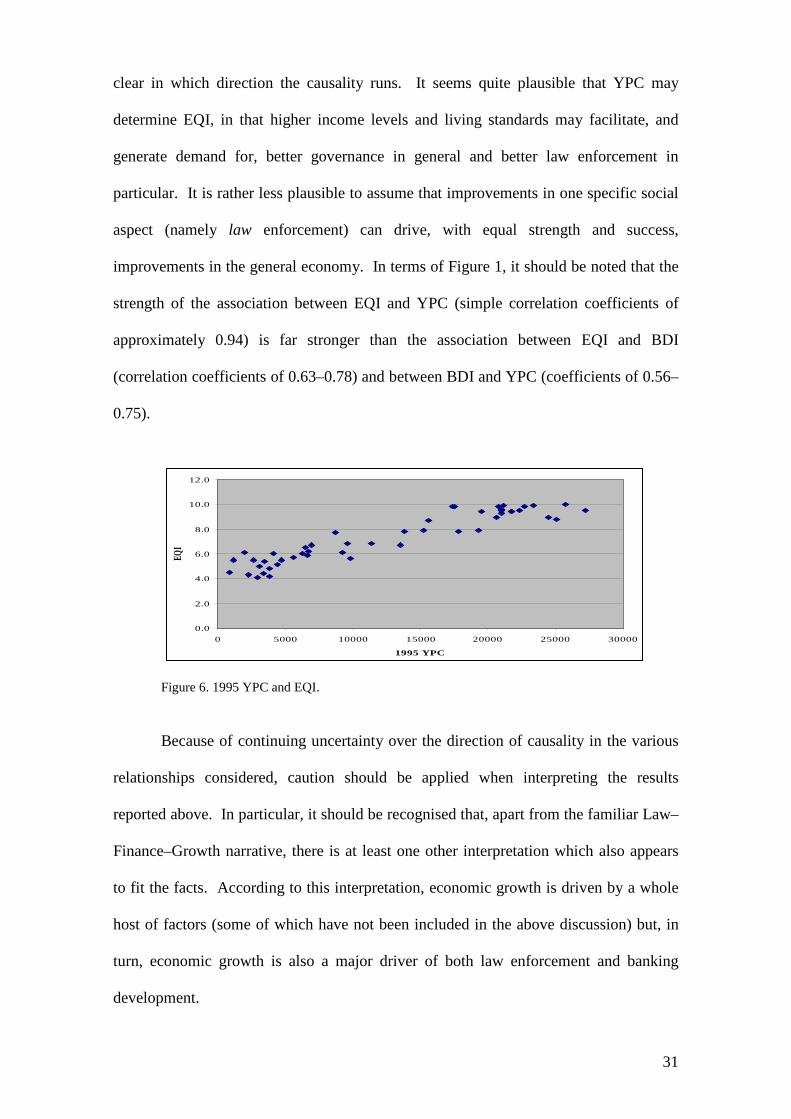
Similarly, while it is clear that there is a very strong relationship between
income levels and the quality of law enforcement (see Figure 6 and Table 6) it is not
between banking development
and income per capita levels (YPC, representing the level of economic development)
the causality could run both ways in this relationship. It is plausible that BDI may
determine YPC, for reasons cited previously in Section 2. But it is also plausible that
YPC may determine BDI, in that higher income levels and living standards may result
in a greater demand for, and may facilitate the development of, sophisticated financial
instruments and markets.
31
clear in which direction the causality runs. It seems quite plausible that YPC may
determine EQI, in that higher income levels and living standards may facilitate, and
generate demand for, better governance in general and better law enforcement in
particular. It is rather less plausible to assume that improvements in one specific social
aspect (namely law enforcement) can drive, with equal strength and success,
improvements in the general economy. In terms of Figure 1, it should be noted that the
strength of the association between EQI and YPC (simple correlation coefficients of
approximately 0.94) is far stronger than the association between EQI and BDI
(correlation coefficients of 0.63–0.78) and between BDI and YPC (coefficients of 0.56–
0.75).
0.0
2.0
4.0
6.0
8.0
10.0
12.0
0 5000 10000 15000 20000 25000 30000
1995 YPC
EQI
Figure 6. 1995 YPC and EQI. Because of continuing uncertainty over the direction of causality in the various
relationships considered, caution should be applied when interpreting the results
reported above. In particular, it should be recognised that, apart from the familiar Law–
Finance–Growth narrative, there is at least one other interpretation which also appears
to fit the facts. According to this interpretation, economic growth is driven by a whole
host of factors (some of which have not been included in the above discussion) but, in
turn, economic growth is also a major driver of both law enforcement and banking
development.
32
In view of the focus of this paper, we have followed the Law–Financial
Development approach which highlights the possible role of legal institutions in
facilitating and encouraging the supply of funds and, therefore, in determining banking
development. As stated in footnote 4, however, we do recognise that other factors may
also be important, especially those on the demand side. In the context of a developing
economy such as Fiji, for example, aspects of culture and politics might well be critical.
These matters are beyond the scope of the present paper and are the subject of on–going
research.
7. Legal institutions and banking development in Fiji
Results from regressions based on international experiences suggest that both strong
legal rules protecting creditor rights and high quality in law enforcement are associated
with strong banking development performance. In applying these results to Fiji, it
should be noted that the country rates very poorly in terms of the legal rules considered;
and that its enforcement quality is also fairly low by international standards. Thus,
based on the estimated regressions, one would expect Fiji’s banking development
performance to be quite weak. However, it is important to keep in mind that the model
offers only a partial explanation of the situation and, as analysed in earlier sections
(especially Section 5), in reality Fiji’s performance compares favourably with that of
many other countries.
Fiji’s BDI score for 2005 was 37.8. Regression 1E estimates generate a
predicted value of 26.06, which implies a residual error of 11.74. Similarly, Regression
2E yields a residual error of 22.67 for Fiji’s 1995 BDI score. Thus, both estimated
regressions tend to under–estimate Fiji’s performance. It is possible to explain, to some
extent, this tendency by the models to under–predict Fiji’s score.
33
First, both regressions exclude the influence of ACT. As discussed above,
simple correlation coefficients suggest the existence of a significant and direct
association between accounting standards and banking development. The fact that ACT
fails to remain significant in a multiple regression may well be due to its co–linearity
with other explanatory variables, especially EQI (see Table 6). Given that Fiji’s ACT
score is far above the sample average, it follows that if the ‘true’ (unobservable) model
included ACT, Fiji’s actual performance would be boosted by this factor, so that it
would typically be at a level higher than predicted by the estimated model.
Second, both regressions place considerable emphasis on CRI, on the basis of
international experiences. In Fiji, however, none of the four legal rules (STAY,
CONSENT, RANK, and MANAGE) that make up CRI is formally provided for. This
means that Fiji receives a CRI score of zero—matched by very few other countries in
the sample. While international experiences might suggest that such a low CRI score
would have a big, negative impact on banking development, our survey results indicate
that the relevant personnel from banks in Fiji tend to be less concerned about the
absence of the nominated legal rules. It is possible that, over time, creditors in Fiji
(including banks) may have developed strategies to work with alternative legal rules
that have been enacted, so that the absence of the nominated rules becomes less
problematic for them. If this were the case, it would explain part of the gap between
Fiji’s actual performance and its model–predicted score.
In short, Fiji lacks a number of legal rules safeguarding creditor rights and
receives only average ratings with respect to law enforcement quality. Yet in their
operations, banks in Fiji have not been seriously hampered by not having recourse to the
relevant legal rules. Further, the country is perceived to have high accounting standards
which may have compensated to some extent for the above disadvantages, thus allowing

34
the country to make better progress with respect to banking development than would
otherwise be expected.
7.1 Policy implications
In view of the above, formal legal rules may not need to be strengthened as a priority, or
a pre–condition, for further banking development in Fiji. As for the quality of law
enforcement, even if it turns out that income level is a major determinant of such
quality, there will be no harm in making a discretionary effort to improve quality as
opposed to simply waiting for it to improve in line with rising income over time. This
comment applies particularly to aspects of law enforcement, such as corruption control,
that may be intrinsically beneficial. In addition, continued efforts to improve the
country’s accounting standards (ACT) may also be useful and would be readily feasible.
8. Conclusion
Prompted in part by the increasing prominence of the Law–Finance–Economic Growth
literature, this paper examines the relationship between legal institutions and banking
development in Fiji, with the expectation that any findings obtained are likely to apply
to most other South Pacific island states as well. The primary aim of the paper is to
contribute to knowledge about this particular aspect of socio–economic development in
the South Pacific. In doing so, however, the paper also re–examines the international
evidence surrounding the law–banking development connection in light of new and
extended data.
In terms of the questions listed in Section 1 above, our findings are as follows.

35
1. By international standards, the legal rules protecting creditor rights in Fiji are
very weak. However, bankers in Fiji do not regard such weakness as a major
hindrance to their operations in providing credit to the private sector;
2. The public’s ratings of law enforcement quality in Fiji are relatively low by
world standards overall, but are broadly in line with ratings for other developing
countries. Interestingly, Fiji rates quite highly (even against developed
countries) with respect to accounting standards, which are often seen as a
substitute or supplement to business law enforcement;
3. Over the past three or so decades, banking development in Fiji has generally
tracked the trends among developing countries. During the 1970s and first half
of the 1980s, it tended to keep pace with even developed countries. Since the
second half of the 1980s, however, like most other developing countries Fiji has
fallen further behind developed and newly industrializing economies;
4. Available international data tend to support the proposition that there is a direct
relationship between legal institutions (especially law enforcement quality) and
banking development; and
5. Fiji’s banking sector appears to have developed relatively well despite very
weak legal rules and average law enforcement quality. In Fiji, and possibly in
other developing countries as well, if the goal is to promote banking
development, then enhancing law enforcement may be more important than
strengthening legal rules which protect creditor rights.
In order to gain an understanding of the above issues, we have collected some
primary data for Fiji, and have compiled a number of indicators for it as well as for five
of the neighbouring island states. Where possible we have analysed and compared such
data with international trends and patterns. In particular, we proposed a composite
index combining several individual indicators to measure banking development—
36
sensitivity analyses suggest that our findings are robust with respect to moderate
variations in the weighting scheme.
While the regression results reported in this paper are broadly consistent with the
claims and earlier findings of proponents of the Law–Financial Development theory, the
new results also suggest that one component of legal institutions, namely legal rules and
codes, may be less influential in determining banking development than previously
thought, especially in developing countries. This qualification to the conventional
wisdom in this area may be of relevance to policy making in developing economies.
Our results suggest that it is the quality of law enforcement (rather than the formal rules
codifying creditor rights) that should receive priority from policy makers in countries
such as Papua New Guinea, Tonga, Samoa, Vanuatu, Solomon Islands, Kiribati, and
Fiji.
Notes
1 The World Bank classifies economies into income groups according to the relevant GNI
per capita. The classification for 2008 is based on GNI data for 2006 and the groups are: Low
Income (LI), USD905 or less; Lower Middle Income (LMI), USD906–3,595; Upper Middle
Income (UMI), USD3,596–11,115; and High Income (HI), USD11,116 or more. Statistics cited
here are sourced from various issues of the World Development Reports. Available from:
http://www.worldbank.org.
2 The remainder tends to be held by state–owned superannuation funds (20% on average),
development banks (7%) and other institutions (25%).
3 The data are sourced from the ‘Financial Structure Database’, compiled by Beck et al.,
(2007).
37
4 It is recognised that bank depositors, as suppliers of funds to banks, also play an
important role in banking sector development. Similarly, demand–side factors must not be
overlooked. To maintain a tight focus for the present paper, however, these issues will be left to
future research.
5 At the time, Fiji was under British colonial rule. Thus, Fiji is an example of a
‘transplant’ ‘English Common Law’ country with respect to legal tradition.
6 See the appendix for a list of countries used in the analysis for this paper.
7 The 1–10 scale is commonly used for this purpose; e.g. Transparency International also
uses this scale.
8 Transparency International is an anti–corruption civil society organisation.
9 The sample of 47 countries includes the 49 countries from the LLSV sample, plus Fiji,
minus Taiwan (for lack of banking development data) and Jordan and Venezuela (for lack of
creditor rights data). For 2005, the sample further excludes Zimbabwe for lack of BDI data.
10 Data for income per capita (in purchasing power parity terms) are obtained from the
World Penn Tables website: http://pwt.econ.upenn.edu/php_site/pwt_index.php
11 For a complete list of countries in each sample, see the appendix.
12 It would, however, be significant if the significance level were raised to 13%.
13 Recall that EQI ranges from 1 to 10, CRI from 0 to 4, and the mean value of BDI is
78.55 in this instance.
14 See Table 6.
References
38
Acemoglu, D., Johnson, S. and Robinson, J.A., 2001. The colonial origins of
comparative development: an empirical investigation. American economic review, 91,
1369–1401.
Asian Development Bank, 1999. Pursuing economic reform in the Pacific. Manila:
Asian Development Bank.
Asian Development Bank, 2001a. Financial sector development in Pacific Island
member countries: regional report. Manila: Asian Development Bank.
Asian Development Bank, 2001b. Financial sector development in Pacific Island
member countries: country reports. Manila: Asian Development Bank.
Asian Development Bank, 2004. Swimming against the tide?: an assessment of the
private sector in the Pacific, Manila: Asian Development Bank.
Asian Development Bank, 2005. Private sector assessment for Fiji Islands: ‘promise
unfulfilled’, Manila: Asian Development Bank.
Asian Development Bank, 2008. Asian Development Outlook 2008 [online].
Available from: http://www.adb.org/Documents/Books/ADO/2008/update/StatApps.pdf
[Accessed 18 November 2008].
Beck, T., Demirgüç–Kunt, A. and Levine, R., 2007. A new database on financial
development and structure [online]. The World Bank. Available from:
http://siteresources.worldbank.org/INTRES/Resources/469232-
1107449512766/FinStructure_2007.xls [Accessed: July 2008]
39
Calderon, C. and Liu, L., 2003. The direction of causality between financial
development and economic growth. Journal of development economics, 72, 321–34.
Chand, S., 2002. Financial sector development and economic growth in Pacific Island
countries. Pacific economic bulletin, 17(2), 117–133.
La Porta, R., Lopez–de–Silanes, F., Shleifer, A. and Vishny, R., 1998. Law and finance.
Journal of political economy, 106, 1113–55.
Levine, R., 1997. Financial development and economic growth: views and agenda.
Journal of economic literature, 35, 688–726.
Levine, R., 1998. The legal environment, banks, and long–run economic growth.
Journal of money, credit, and banking, 30, 596–613.
Levine, R., 1999. Law, finance, and economic growth. Journal of financial
intermediation, 8, 36–67.
Levine, R., 2005. Finance and growth: theory and evidence. In: P. Aghion, and S.
Durlauf, eds. Handbook of economic growth. Elsevier, 865–934.
Licht, A.N., 2001. The mother of all path dependencies: towards a cross–cultural theory
of corporate governance systems. Delaware journal of corporate law, 26, 147–205.
Lucas, R.E., 1998. On the mechanics of economic development. Journal of monetary
economics, 22, 3–42.
Meier, G.M. and Seers D., 1984. Pioneers in development. New York: Oxford
University Press.
40
Rajan, R.G. and Zingales, L., 2003. The great reversals: the politics of financial
development in the twentieth century. Journal of financial economics, 69(1), 5–50.
Reddy, M., Prasad, B., Sharma, P., Vosikata, S. and Duncan, R., 2004. Understanding
reform in Fiji and Vanuatu. Papua New Guinea: Institute of National Affairs,
Rodrik, D., 2000. Institutions for high–quality growth: what are they and how to acquire
them. Studies in comparative international development, 35, 3-31.
Waqabaca, C., 2000. Financial sector development and reforms in Fiji [online].
Reserve Bank of Fiji. Available from: http://www.reservebank.gov.fj/docs/wp2000-
05.pdf [Accessed: January 2006].
Waqabaca, C., 2004. Financial development and economic growth in Fiji [online].
Reserve Bank of Fiji. Available from:
http://www.reservebank.gov.fj/docs/2004_03_wp.pdf [Accessed: January 2006].
Appendix 1. List of countries used in the analysis
Country Legal Origin
Income Group LLSV 1998
Sample
Levine 1998
Sample
Legal Institutions
Analysis
Banking Developt Analysis
Regressn Compact Sample
Regressn Extended Sample
1 Argentina French Upper Middle √ √ √ √ √ √ 2 Australia English High Income √ √ √ √ √ √

41
3 Austria German High Income √ √ √ √ √ √ 4 Belgium French High Income √ √ √ √ √ √ 5 Brazil French Lower Middle √ √ √ √ √ √ 6 Canada English High Income √ √ √ √ √ √ 7 Chile French Upper Middle √ √ √ √ √ √ 8 Colombia French Lower Middle √ √ √ √ √ √ 9 Denmark Scandinvn High Income √ √ √ √ √ √
10 Ecuador French Lower Middle √ x √ √ x √ 11 Egypt French Lower Middle √ √ √ √ √ √ 12 Fiji English Lower Middle x x √ √ √ √ 13 Finland Scandinvn High Income √ √ √ √ √ √ 14 France French High Income √ √ √ √ √ √ 15 Germany German High Income √ √ √ √ √ √ 16 Greece French High Income √ √ √ √ √ √ 17 Hong Kong English High Income √ √ √ √ √ √ 18 India English Low income √ √ √ √ √ √ 19 Indonesia French Lower Middle √ √ √ √ x √ 20 Ireland English High Income √ x √ √ x √ 21 Israel English High Income √ √ √ √ √ √ 22 Italy French High Income √ √ √ √ √ √ 23 Japan German High Income √ √ √ √ √ √ 24 Jordan French Lower Middle √ x √ √ x x 25 Kenya English Low income √ x √ √ x √ 26 Korea German High Income √ √ √ √ √ √ 27 Malaysia English Upper Middle √ √ √ √ √ √ 28 Mexico French Upper Middle √ √ √ √ √ √ 29 Netherlands French High Income √ √ √ √ √ √ 30 New Zealand English High Income √ √ √ √ √ √ 31 Nigeria English Low income √ √ √ √ √ √ 32 Norway Scandinvn High Income √ √ √ √ √ √ 33 Pakistan English Low income √ √ √ √ x √ 34 PNG Low income x x x √ x x 35 Peru French Lower Middle √ √ √ √ √ √ 36 Philippines French Lower Middle √ √ √ √ √ √ 37 Portugal French High Income √ √ √ √ √ √ 38 Samoa Lower Middle x x x √ x x 39 Singapore English High Income √ √ √ √ √ √ 40 Solomon Is. Low income x x x √ x x 41 South Africa English Upper Middle √ √ √ √ √ √ 42 Spain French High Income √ √ √ √ √ √ 43 Sri Lanka English Lower Middle √ x √ √ x √ 44 Sweden Scandinvn High Income √ √ √ √ √ √ 45 Switzerland German High Income √ √ √ √ √ √ 46 Taiwan German High Income √ √ √ √ x x 47 Thailand English Lower Middle √ √ √ √ √ √ 48 Tonga Lower Middle x x x √ x x 49 Turkey French Upper Middle √ √ √ √ √ √ 50 UK English High Income √ √ √ √ √ √ 51 Uruguay French Upper Middle √ x √ √ √ √ 52 US English High Income √ √ √ √ √ √ 53 Vanuatu Lower Middle x x x √ x x 54 Venezuela French Upper Middle √ x √ √ x x 55 Zimbabwe English Low income √ √ √ √ x √
Sample size 49 42 50 54 40 47

42
Notes: Overall, 55 countries (columns 1 and 2) were used in the analysis of various issues in this study. Columns 3 and 4 show the 'legal'
and 'income' classifications of these countries per LLSV (1998) and World Bank, respectively. In columns 5 and 6 a tick ( √) indicates that the country was in the LLSV (1998) and Levine (1998) samples, respectively. Similarly, a tick in columns 7, 8, 9 and 10 indicates that the respective country was used in the respective analysis for this study, e.g. only 40 were used in the Regression Analysis with the “compacted” sample (penultimate column).
Acknowledgements

43
This paper first grew out of research work completed by the first author for a Ph.D. at
Griffith University, but has since been extensively revised, restructured and added to.
The authors wish to thank Tarlok Singh, Mark Brimble, Satish Chand, Biman Prasad
and an anonymous referee for helpful comments and suggestions, but accept full
responsibility for any shortcomings that may remain.
Notes on contributors
Parmendra Sharma is a lecturer in banking and finance at Griffith University,
Australia. His principal research interest is in financial sector development and reforms,
with particular reference to developing countries, especially in the South Pacific region.
Telephone: (07) 37357834 Facsimile: (07) 37357760
Postal Address: Department of Accounting, Finance and Economics, Nathan campus,
Griffith University, 170 Kessels Road, Nathan, QLD 4111, Australia
Email [email protected]
D.T. (Tom) Nguyen is a Professor of Economics at Griffith University, Brisbane,
Australia. His main research interests are economic growth and development,
macroeconomic issues in Asia-Pacific economies, financial economics, and applied
economics. He previously held academic positions in New Zealand (Victoria
University of Wellington), the U.S. (University of Illinois) and Australia (Australian
National University, University of Adelaide). He was also in the Australian Public
Service (Australian Bureau of Agricultural and Resource Economics) for a number of
years, and has been a consultant for a number of organisations, including AusAID,
UNDP and ILO.

44
Telephone: (07) 3735 7617 Facsimile: (07) 3735 3719
Postal Address: Department of Accounting, Finance and Economics, Nathan campus,
Griffith University, Nathan, QLD 4111, Australia
Email: [email protected]