Embed Size (px)
Citation preview

Presented by:
Lauren Freedman: President, the e-tailing group
W. Sean Ford: COO & CMO, Zmags

Lauren Freedman
President
the e-tailing group
W. Sean Ford
COO & CMO
Zmags
About Our Speakers
2

16 years e-commerce consulting
Fortune 500 client projects ranging
from strategic planning, customer
experience with an emphasis on
merchandising to technology
marketing and lead generation
Proprietary research studies on
mystery shopping, merchandising,
mobile and consumer behavior
Author, It’s Just Shopping
50+ years traditional retail and
catalog experience
The Voice of Cross-Channel Merchandising Straight talk from “in-the-trenches” online merchandising experts
3
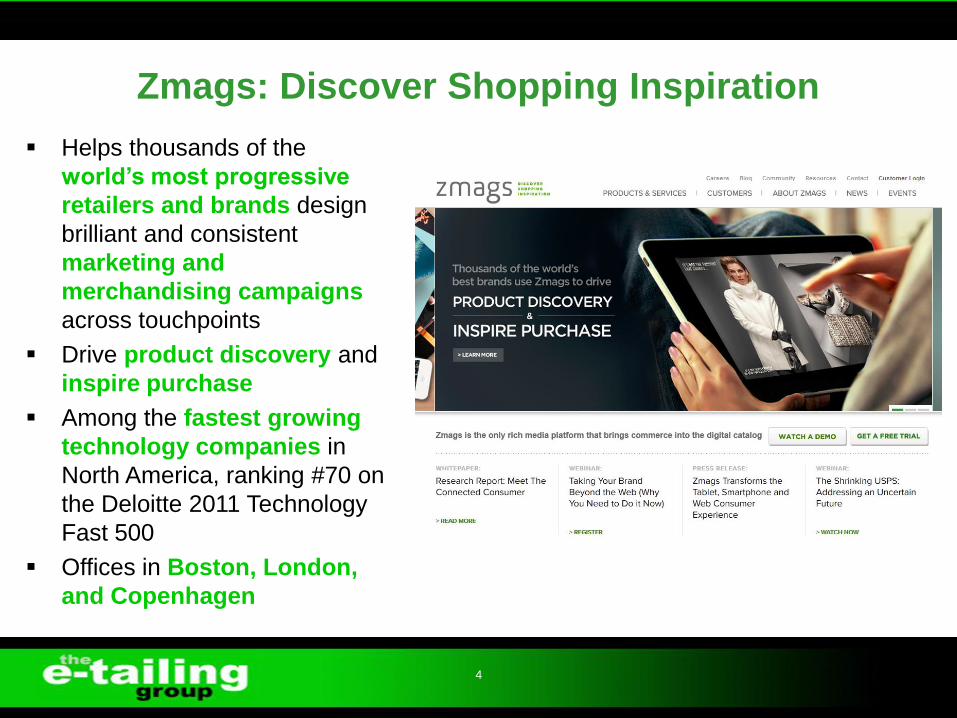
Helps thousands of the
world’s most progressive
retailers and brands design
brilliant and consistent
marketing and
merchandising campaigns
across touchpoints
Drive product discovery and
inspire purchase
Among the fastest growing
technology companies in
North America, ranking #70 on
the Deloitte 2011 Technology
Fast 500
Offices in Boston, London,
and Copenhagen
Zmags: Discover Shopping Inspiration
4
Holiday headlines merit attention
• “US Online Holiday Shopping Season reaches record $37.2
Billion for Nov/Dec period up 15% vs. year ago” (comscore)
• “Sales from smartphones and tablets account for 11% of total
online sales in Dec ‘11 up from 5.5% in Dec ’10” (IBM)
• “2011-mcommerce will be at least $10B” (Internet Retailer)
• “More than 60% of 25-34 year olds own a smartphone and
29% of smartphone owners use their phone for shopping-
related activities” (Nielsen)
• “14.6% all online retailer sessions were initiated from mobile
devices more than double 2010 at 5.6%” (IBM)
• “10% of total web sales were made on smartphones and
tablets the week leading up to Valentine’s Day triple 2011”
(IBM)
• “800 million people connected via Facebook and more than ¾
of consumers are active Facebook users” (Zmags)
5

More devices, more touchpoints= MORE ACCESS
6

Merchant food-for-thought
• Am I best leveraging my content investments?
• Have I effectively curated content for my customers?
• Do we deliver an experience for our shoppers or merely foster simple search and find shopping?
• Does my business warrant an app? Will anyone use?
• How much traffic are we seeing from tablets?
• Is conversion from the tablet significantly higher than from smartphones?
• Have we explored how our site renders on all devices?
• Have we seized the day on Facebook and shared the best of our content via social networks?
7

1-800 Flowers Clinique Golfsmith Neiman Marcus Shop NBC
ABT Coach Green Mountain Net-A-Porter Shop PBS
Altrec Crate & Barrel Gymboree Newegg Staples
Amazon.com Crutchfield Harry & David Nike Sundance
American Eagle Outfitters Dell Hayneedle Nordstrom Sunglass Hut
American Girl Dick’s Sporting Goods Home Depot Office Depot Target
Ann Taylor Discovery Channel HP Home and Home Office Orvis The Men’s Wearhouse
Apple Disney.com HSN Overstock Things Remembered
Athleta DSW Shoes J. Crew Patagonia Tiffany & Co.
Aveda eBags.com JCPenney Petco Title 9
Ballard Designs EBGames Jonathan Adler PetSmart Tory Burch
Barnes & Noble Finish Line King Arthur Flour Pottery Barn Toys ‘R Us
Bath & Body Works Foot Locker Kohls QVC Tumi
Belk Free People L.L. Bean Ralph Lauren Victoria’s Secret
Benefit Frontgate Lands’ End Redenvelope Walgreen’s
Best Buy Gap Lane Bryant REI Wal-Mart
Blue Nile Garnet Hill Lego Road Runner Sports Waterford
Brookstone Giggle Lowe's Room And Board Williams-Sonoma
Cabela’s GNC Macy's Sears Wine.com
Chicos Godiva Moosejaw Sephora Zappos
2011 e-tailing group Mystery Shopping EG100
8

Mobile and social presences are felt by shoppers
9
e-tailing 100
4Q11
e-tailing 100
4Q10
% Penetration % Penetration
Mobile Commerce 78% 44%
Link to Mobile Commerce on Ecommerce Site 50% (78 sites) N/A
Mobile Apps 66% N/A
Link to Mobile Apps on Ecommerce Site 65% (66 sites) N/A
SMS Sign-Up 31% 29%
Link To Social Networking (“Follow Us On
Twitter!”)
95% 83%
Facebook 93% (95 sites) 96% (83 sites)
Twitter 89% (95 sites) 87% (83 sites)
You Tube 55% (95 sites) 43% (83 sites)
"Like" Button 71% 36%
Share 71% 75%
Google + 30% N/A
e-tailing group 4Q11 Mystery Shopping Study

How does the consumer feel about
shopping via these devices?
Devices mean happy, excited and productive customers
Zmags; 2012
10


12
Q33-34
Traffic growth from mobile significant where
revenues are following suit
None 2% < 1
11%
1 - 1.9% 10%
2 - 4.9% 26%
5 - 9.9% 27%
10% + 16%
Don't know
8%
What percent of your traffic comes via mobile browsers or mobile applications?
None 4%
< 1% 23%
1 - 2.9% 27%
3 - 4.9% 11%
5 - 9.9% 18%
10% + 6%
Don't know 11%
What percent of your revenue comes via mobile browsers or mobile applications?

Tablet conversion is already powerful for retailers
13
e-tailing group Annual Merchant Survey, 2012
10%
4%
22%
11%
6%
20%
56%
16%
23%
23%
74%
35%
Mobile web
Stand-alone native apps
Tablets
What conversion rates are you seeing from mobile?
Significantly/Somewhat More Than Website
About the Same as Website
Significantly/Somewhat Less Than Website
N/A

2012: The Year of the Tablet
Tablet performance ups the ante for retailers
• US consumers purchased 26.6 million tablets in 2011
and Forrester predicts 60.3 million tablets in play by 2016
• Nearly 1 in 5 adults (19%) own a tablet or ereader
increasing from 1 in 10 in the prior year (Pew)
• 36% adults with $75K income own a tablet with highest
rate ownership among 30-49, $75K income+ (Pew)
• Tablet owners spend 54% more than visitors on
smartphones and were nearly 3X as likely to buy
products and services than smartphone visitors (Adobe)
• iPad conversion 6.3% versus 3.1% for mobile devices
overall (IBM)
• Tablet AOV/PC -$123 vs. $102 (Adobe)
• 87% of tablet owners did their holiday shopping using
their tablets, spending on average $325 (Zmags)
15

When you shop via a tablet
what is your most frequent
motivation?
Convenience creates “couch consumers”
Zmags; 2012
16

Tablet devices are the new multi-purpose tool for
researching, browsing, and buying
17
Q30 Source: e-tailing group/Oracle Connected Customer Survey; 2011
61%
56%
55%
54%
36%
I use my tablet device to research products prior to a store visit
My tablet device is an ideal tool for browsing products from my favorite catalogs and retailers
I use my tablet device to research products and then purchase them right on the device
I use my tablet device to research products then purchase them online via my computer
I use my tablet device to research products during a store visit
Please indicate your agreement with the following statements regarding browsing or buying products via your tablet device.
(Top-2 Strongly/Somewhat Agree)

Tablet owners appear to use these devices to browse
and buy online more frequently than smartphone owners
18
Q7/15 – 400S/417T
6%
16%
17%
11%
10%
15%
25%
10%
19%
19%
12%
7%
9%
24%
Daily
Weekly
Several times per month
Once a month
4 or more times per year
Less than 4 times per year
Never
How frequently do you browse or buy products and services online?
Smartphone Tablet
e-tailing group/CoffeeTable The Shopping Mindset of a Mobile Consumer Survey; 2011

Tablet owners purchased Books/Magazines,
Clothing/Accessories, Digital Books, Consumer Electronics,
Computer Hardware & Software
19
Q18 – 324
45% 37%
30% 28%
27% 24%
21% 20%
19% 18%
17% 13%
12% 12%
10% 10% 10%
8% 6%
1% 1% 1%
Books/Magazines
Clothing and accessories (men’s, women’s, kid’s)
Digital books
Consumer electronics
Computer hardware and software
Music/DVD/Videos
Movies
Gifts and collectibles/Flowers
Gift Card/Certificates
Tickets (movies, concerts, theatre)
Toys/Video games
Furniture/Home and garden
Crafts/Hobbies
Food
Pet supplies
Sporting goods
Health and beauty items
Jewelry/Watches
Luxury items
Travel
Don't know/unsure
Other, please specify
In which categories did you purchase products or services via your iPad or Tablet? Select all that apply.
e-tailing group/CoffeeTable The
Shopping Mindset of a Mobile
Consumer Survey; 2011

Shopping via a tablet delivers a more satisfactory experience
than shopping via a smartphone
20
Q10/19– 400/324
32%
41%
24%
3%
0%
50%
38%
9%
3%
0%
Very satisfactory
Somewhat satisfactory
Mixed bag (sometimes satisfactory/sometimes not satisfactory)
Somewhat unsatisfactory
Very unsatisfactory
Thinking about your most recent shopping experiences, what level of satisfaction would you report?
Smartphone Tablet
e-tailing group/CoffeeTable The Shopping Mindset of a Mobile Consumer Survey; 2011

69% of tablet owners report that their most recent shopping experiences
via these devices was significantly to somewhat better than shopping
with their smartphones
21
Q19 – 324
39%
30%
17%
2%
1%
6%
5%
Significantly better
Somewhat better
About the same
Somewhat worse
Significantly worse
Don't shop on both devices
Don’t own both devices
How would you rate the shopping experience on the iPad or Tablet versus your mobile phone?
e-tailing group/CoffeeTable The Shopping Mindset of a Mobile Consumer Survey; 2011

Thinking ahead a year, how do
you expect your digital
purchasing behavior to change
compared to this holiday
season
The future looks bright for mobile
Zmags; 2012
22
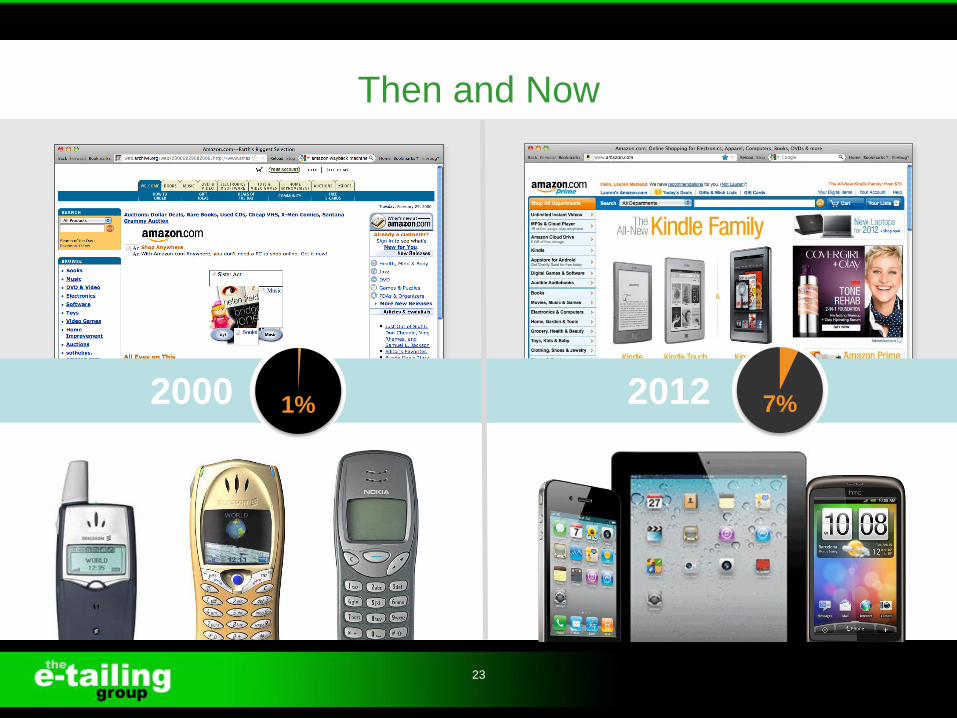
Then and Now
23
2012 2000 1% 7%

Retail Unprepared for Tablets
24
FEWER THAN ONE-THIRD OF RETAILERS HAVE OPTIMIZED,
OR EVEN ADJUSTED, THEIR SITES FOR TABLETS.

Innovation?
25

Owning Inspiration
26
DIRECTED
PURCHASE DISCOVERY
SHOPPING
Discover
Shopping
Inspiration
2000+
SELL ME
2008+
SURPRISE ME
2010+
INSPIRE ME

Shopper Discovery Curating Experiences for Customers

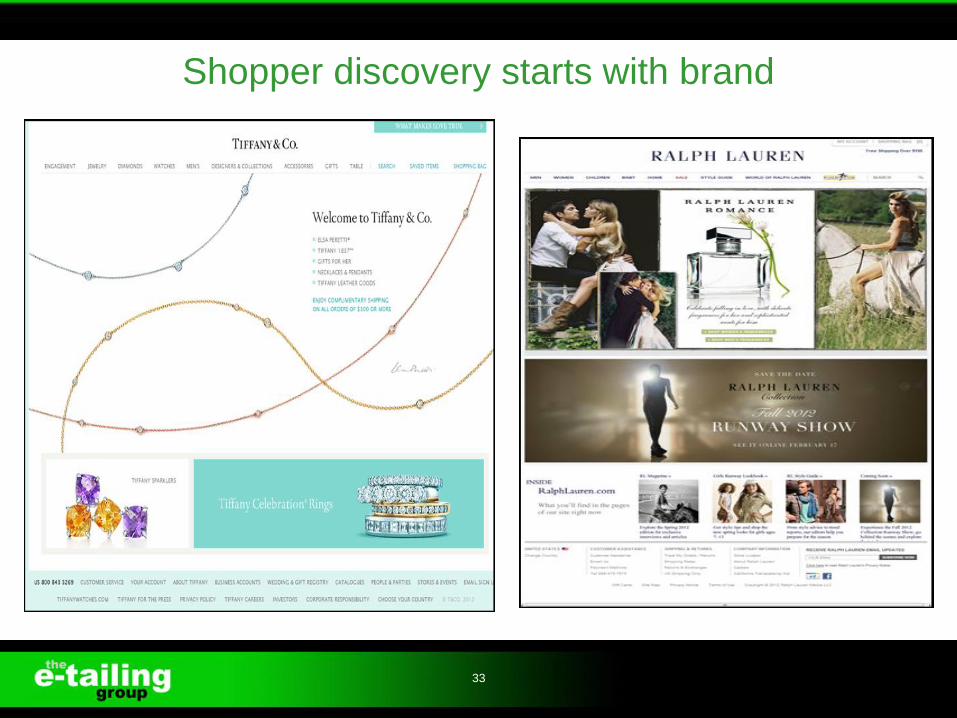
Shopper Discovery: why it matters
• Search only takes shopping so far
• Experiences truly engage shoppers with the brand
• Edited experiences facilitate shopping
• Discovery is multi-dimensional and starts with brand
engagement informing shoppers prior to purchase
• Tactics evolve where merchant utilization fosters
consumer adoption
• Marketing potential across channels and devices
expands reach for retailers
28

Imagery sets the standard for engaging shopping
29
ESSENTIAL (>50%) MERCHANT CHOICE (33-49%) SOCIAL (<33%)
Quality of the image (74%) Product guides (49%) Email-a-friend (18%)
Ability to see selected product in color
of choice (69%)View product on a model (46%) Like button (18%)
Alternative views of selected item (64%) Live help (40%) Share button (16%)
Zoom (63%) Product demonstrations (39%)
Peer ratings and reviews (53%) Video of the product in use (37%)
Product comparisons (51%) Product recommendations (35%)
Q/A (34%)
View product in a room setting
(33%)
Source: e-tailing group/Oracle Connected Consumer Survey
When viewing a merchant’s product page online, how important is the
following information when selecting and ultimately purchasing a
product? (Top-2 Critical/Very Important)

Savvy sellers have always invested in experiences
and evolved with the times
30
e-tailing 100
4Q11
e-tailing 100
4Q10
% Penetration % Penetration
EVERGREEN
Themed Areas 64% 39%
Brand Boutiques 89% (83 sites) 76% (79 sites)
Quality/Content (1-5 5=Excellent) 2.6 (83 sites) 3.16 (60 sites)
Shop the Catalog 35% 32%
Ad Campaigns 21% 25%
EVOLVERS
Home Page Slide Show Of Featured Items
and/or Promotions On Home Page
53% 57%
Look Book 24% (71 sites) N/A
Shoppable 59% (17 sites) N/A
Videos 83% 88%
31
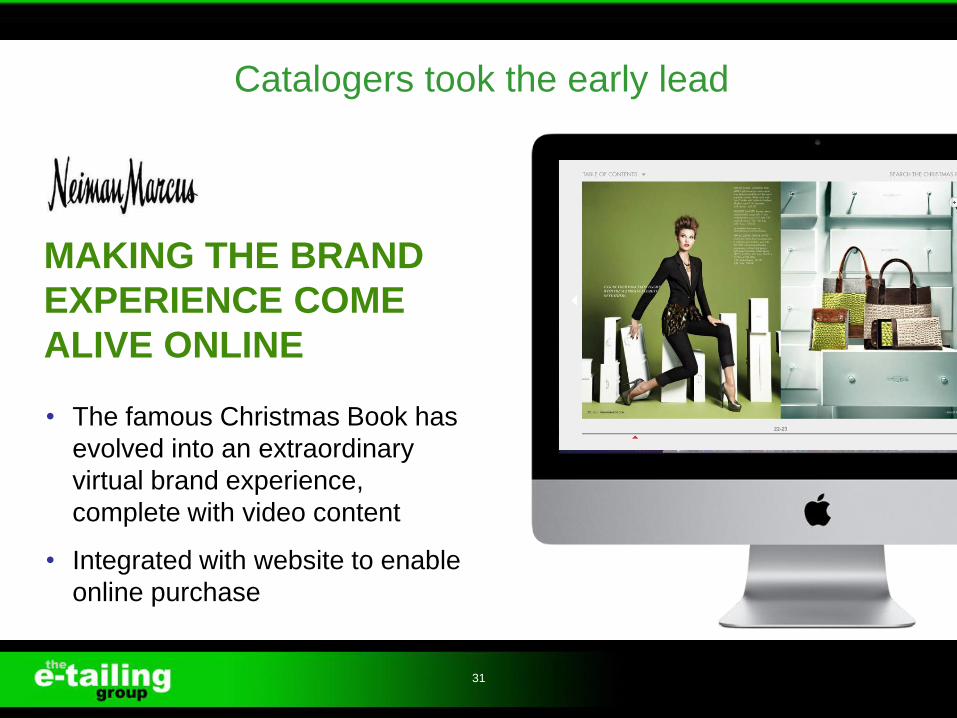
Catalogers took the early lead
• The famous Christmas Book has
evolved into an extraordinary
virtual brand experience,
complete with video content
• Integrated with website to enable
online purchase
MAKING THE BRAND
EXPERIENCE COME
ALIVE ONLINE

32
Traditional advertising is now reinterpreted online
33
Shopper discovery starts with brand
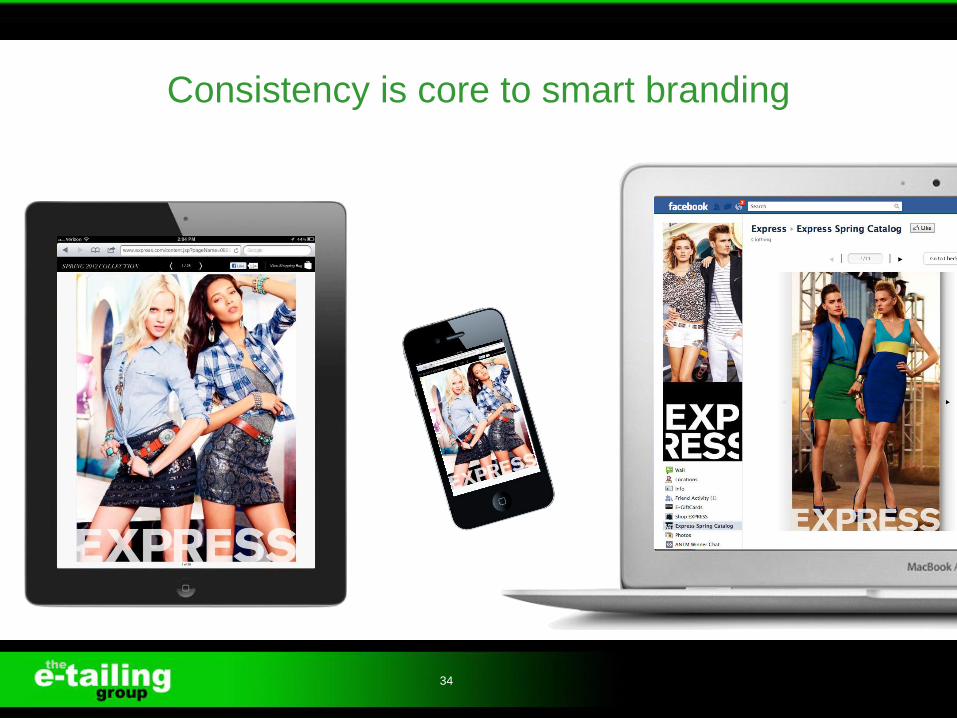
Consistency is core to smart branding
34

35
Brands look to control experiences across partners From syndication to retail-controlled efforts standout performance is a differentiator
2011 2010 2009 2008 2007 2006 2005 2004 2003 2002 2001
Brand showcase 89% 76% 87% 85% 81% 86% 85% 83% 75% 85% 68%
Quality/Content 1-5 5 = excellent 2.6 3.16 2.69 2.62 2.55 2.76 2.18 NA NA NA NA

36
Exploring what’s new excites shoppers

37
Educating and informing shoppers pre-purchase is
a value-add

Decision-making through experiences are facilitated
across channels
38

Customers will be interacting with ipads at retail on their
own and with associates further fueling interest
39
Within next 24 months; 56.2%
of 130 retailers put ipads in
hands of store associates
(Aruba Networks)
“It allows retailers to take
advantage of rich media
and larger images for
both the customer
experience as well as
employee training.”

Lookbooks take on New Meaning
40

Multi-dimensional merchandising
• New modern approach to themed areas where trends and new
product takes center stage
• Regardless of the merchandise category, lookbooks tell stories by
grouping merchandise meaningfully and providing supportive
content
• Apparel retailers put “fashion” savvy in play to better connect their
customers/prospects to the brand while department stores and mass
merchants follow suit in similar categories
• Brands with broad fashion appeal and reach (Tiffany & Co) or who
target younger, hipper demographic embrace lookbooks (American
Eagle Outfitters, Free People, Net-A-Porter, Zappos)
• Porting to Facebook adds new dimension
41
24% EG100 deployed with 59% shoppable
2011 e-tailing group Mystery Shopping

Establishing “point-of-view” essential in a crowded
marketplace
42 42

Collection entrée with scrolling access for
assortment exposure optimal
43

Editorial meets merchandising
44 44

45
Showcasing “must haves” puts seasonal shopping
wheels in motion

46
Shoppable lookbooks impact the bottom-line

Home market opportunities beginning to take shape
47

Cross-channel visibility and broad customer appeal best
serves shopper
48 48

Guiding Connected Consumers
• Evaluate current position from a “discovery” point-of-view
• Explore opportunities to better showcase your brand
testing discovery models onsite
• Be consistent across channels for greatest marketing
impact
• Deploy across mobile to capture your fair share of couch
commerce
• Expand reach via Facebook and other social channels
• Establish a series of metrics that gauge customer
interest
49

Retailer Takeaways
50

Create a World Class Experience
51
• Rich, immersive brand
experience, consistent
across all touchpoints
• Design to take advantage of
tablet functionality as well
as smartphones, PCs or
laptops
• Advance online
merchandising and
commerce from traditional
search-and-purchase to a
discovery and inspiration
• Buy off the page for an
uninterrupted experience
51

Drive Engagement Wherever Customers Interact
52

Treat Every Channel Like a Storefront Re-create the intimacy of the in-store shopping experience online
53 53

Social Media is an Untapped Opportunity
54
• 8.3 million page views
• 18,100 hours spent looking at
the catalog
• 60% lower bounce rate than
the web site
• 27 pages viewed per visit
• 3 million pieces of stoneware
sold in last 3 years

First Mover Advantages Abound
55
UP TO
2X LIFT IN CONVERSION
RATES
INCREASE IN AVERAGE
ORDER VALUES 40%+ INCREASE IN PAGE VIEWS 5X

Retailer Takeaways
• Create a world class experience
• Drive engagement wherever customers interact with
your brand
• Treat every channel like a storefront
• Social media is an untapped opportunity
• First mover advantages abound
56

Contact Info
Lauren Freedman
773-975-7280
www.e-tailing.com
57
W. Sean Ford
617-963-8051
www.zmags.com

Q&A
58
Please submit your questions now.