Embed Size (px)
Citation preview

Barcelona GSE Working Paper Series
Working Paper nº 638
Launching Prices for New Pharmaceuticals in Heavily Regulated
and Subsidized Markets Beatriz Gonzalez López-Valcárcel
Jaume Puig-Junoy
June 2012
1
LAUNCHING PRICES FOR NEW PHARMACEUTICALS IN
HEAVILY REGULATED AND SUBSIDIZED MARKETS
BEATRIZ GONZÁLEZ LÓPEZ-VALCÁRCEL(a) and JAUME PUIG-JUNOY(b,*)
(a) Universidad de Las Palmas de GC, Department of Quantitative
Methods in Management and Economics, Canary Islands, Spain
(b) Universitat Pompeu Fabra, Department of Economics and
Business, Research Centre for Economics and Health (CRES),
Barcelona, Spain
Correspondence to: Research Centre for Economics and Health, C/
Trias Fargas 25-27, 34-08005 Barcelona, Spain. Phone: +34 93 542
1857. Fax: +34 93 542 1746. E-mail: [email protected].
Key words: pharmaceuticals; price competition; price regulation.
JEL codes: L11, L65, I10, I18.
Acknowledgements: This study was supported by an unrestricted
educational grant from the Merck Foundation, the philanthropic arm of
Merck & Co. Inc., Whitehouse Station, New Jersey, USA. Partial funding
was also obtained from the Spanish Ministry of Science and Education
under grant SEJ2007-66133.
Conflict of interest: No relevant conflict to declare.
Word count: 6856 words, 2 tables, and 1 figure.
2
LAUNCHING PRICES FOR NEW PHARMACEUTICALS IN
HEAVILY REGULATED AND SUBSIDIZED MARKETS
ABSTRACT
This paper provides empirical evidence on the explanatory factors
affecting introductory prices of new pharmaceuticals in a heavily
regulated and highly subsidized market. We collect a data set
consisting of all new chemical entities launched in Spain between
1997 and 2005, and model launching prices. We found that, unlike in
the US and Sweden, therapeutically "innovative" products are not
overpriced relative to "imitative" ones. Price setting is mainly used as
a mechanism to adjust for inflation independently of the degree of
innovation. The drugs that enter through the centralized EMA
approval procedure are overpriced, which may be a consequence of
market globalization and international price setting.
3
LAUNCHING PRICES FOR NEW PHARMACEUTICALS IN
HEAVILY REGULATED AND SUBSIDIZED MARKETS
1. INTRODUCTION
Previous studies, detailed below, have documented price competition
among patented pharmaceuticals in the US: introductory prices are
higher for innovative pharmaceuticals which are priced higher than
existing substitutes, and high introductory prices tend to fall over
time as more competitors enter the therapeutic market. These results
are consistent with Dean’s (1969) optimal pricing strategies for new
products.
Lu and Comanor (1998) modelled launch prices of 144 new
pharmaceuticals introduced in the United States (US) between 1978
and 1987, relative to existing substitutes (LC model). They conclude
that therapeutically “innovative” pharmaceuticals are introduced
under a skimming strategy (high introductory prices, quality-based
competition), while “imitative” pharmaceuticals are introduced under
a penetration strategy (low introductory prices, price competition).
The number of branded substitutes has a negative effect on actual
launch prices and on subsequent price increases in the US.
Similar results, observing some degree of therapeutic price
competition, have been reported by other studies (Reekie, 1978;
Philipson and Dai, 2003; Wiggins and Maness, 2004).
Despite the high prevalence of different forms of price/reimbursement
regulation and public financing in most industrialized countries (only
the United Kingdom, the US and Germany do not require centralized
price approval) (OFT, 2007), the bulk of the empirical evidence on
the pricing of new pharmaceuticals mainly refers to the US, where
market prices prevail.
4
The study by Ekelund and Persson (2003) compared pricing
strategies for new pharmaceuticals in the price-regulated Swedish
market and the US. Using identical explanatory variables as in the LC
model for the regulated Swedish market, these authors conclude that
launch price determinants of 218 new pharmaceuticals introduced in
the Swedish (regulated) market between 1987 and 1997 are quite
different. As in the US, Swedish introductory prices reflect the degree
of therapeutic innovation, but all prices fall substantially over time for
all products independently of their therapeutic gain (price increases
are generally ruled out under the regulatory regime). That is,
Swedish price regulation prevents penetration strategies for
“imitative” pharmaceuticals. Also, unlike in the US market, in Sweden
introductory and subsequent prices do not depend on the number of
branded substitutes. These authors conclude that price regulation
discourages price competition in this country.
In Canada, where pharmaceutical prices are regulated, Lexchin
(2006) observed that new patented brand-name drugs introduced
between 1994 and 2003 did not compete on price. Examining drugs
competing for the treatment of hypertension – angiotensin converting
enzyme inhibitors and angiotensin receptor blockers – in Canada from
1997 to 2003, Benda et al (2004) observed price decreases for new
entrants in the same therapeutic class, but price increases when the
new product is located in another therapeutic class.
Regulators in regulated systems may consider other factors than the
degree of therapeutic innovation in their pricing/reimbursement
negotiations, such as concern for budgetary impact (which depends
on the expected number of prescriptions, and their co-payment rate),
and other industrial policy goals (such as allowing higher prices for
national firms, or attracting R&D investment), which need to be
considered in the empirical model to explain introductory and
subsequent prices. In addition to this, the authorization process for

5
new drugs has been progressively centralized in Europe. At present,
some drugs are authorized by the European Medicines Agency (EMA)
while others are authorized at national level. While the authorization
process has been progressively centralized in Europe, the pricing
process is still nationally based. Since 2004, most of biologics, as well
as all new cancer drugs, HIV, diabetes and other conditions have to
be centrally approved by EMA. The question is whether the
centralized/decentralized pathways to the market are associated with
higher or lower launching prices.
The purpose of this study is to identify and quantify the factors
influencing the introduction of new pharmaceuticals in a heavily
regulated and highly subsidized market, Spain, which represents the
fifth European and the seventh world market according to the volume
of pharmaceutical sales. We model the weighted average price of new
pharmaceuticals in the period 1997-2005. Our hypothesis is that, as
in the Swedish and US markets, the incremental efficacy or
therapeutic value is a paramount determinant, but that
price/reimbursement regulatory systems force a skimming pricing
strategy for all products independently of their incremental efficacy.
Furthermore, we hypothesize that government cost containment
objectives and industrial policy goals are also key determinants of
pricing strategies resulting from the price/reimbursement negotiation
process.
The Spanish pharmaceutical market offers a prime example of a
heavily regulated and publicly subsidized market. As in many
industrialized countries, the market in Spain is centrally price-
regulated (price-cap regulation, generic reference pricing, prices not
inflation adjusted over time, and price updates rarely allowed)
(Antoñanzas et al, 2007). A public agency of the Ministry of Health is
responsible for price setting and for funding conditions of public
insurance coverage. The agency negotiates prices with the firm.
Effective patient co-payment for pharmaceuticals is very low (user
6
rates account for less than 7% of the total expenditure in ambulatory
health care system prescription pharmaceuticals). Previously to price
setting, new drugs are approved. There are three different approval
mechanisms: the only-for-Spain one; the mutual recognition
mechanism (the drug is authorized in a particular country, and other
European countries will recognize it automatically unless an objection
is raised in 90 days); and the centralized approval mechanism
through the EMA. As the Spanish National Health Service (NHS) is the
main payer of ambulatory prescription pharmaceuticals (around 80%
of sales are financed by the NHS), budgetary impact of new
pharmaceuticals has been an increasing concern for the financial
sustainability of the public health service. Cost containment policies
have put great emphasis on maintaining traditional low prices, higher
prices for new products being placed under increasing scrutiny,
despite the fact that the increase in consumption is the main driver of
the rise in expenditure (Puig-Junoy, 2004). Low regulated prices for
old products have converted the Spanish market into an important
source of parallel trade in the European Union.
The main contribution of this paper is to model the launching prices
of new pharmaceuticals included in the NHS prescription drugs list, in
a heavily regulated and highly subsidized market, considering that
pricing any new pharmaceutical is the result of a negotiation between
firm representatives and government representatives (regulatory
agencies and public health service payers)1, so that the regulatory
agency, which is also in charge of the rating by therapeutic value,
may use that rating to force prices downwards, particularly for those
new drugs that have large potential markets. Of course the firm could
in turn strategically select indications (market size) to maximize its
objectives (Zaric, 2008). 1 The strategic wish of the innovative firm would be to launch new pharmaceuticals with high introductory prices, but the public regulator and the payers will try to force the price downwards if budgetary impact is a concern. Budgetary pressure will increase with the number of patients that are expected to receive subsidized prescriptions of that new pharmaceutical, and will decrease with higher co-payment rates.
7
This paper is structured as follows. We first discuss the economic
framework and hypotheses. Equations and variables, data, and
results are presented in the next two sections of the paper. The paper
concludes with a section summarizing the main conclusions and policy
implications.
2. ECONOMIC FRAMEWORK AND HYPOTHESES
In the price/reimbursement negotiation in any given country, Danzon
et al (2005) hypothesized that launch of a new chemical entity (NCE)
occurs when the government’s maximum introductory offer price for
it is equal to or higher than the firm’s ask price (or reservation price).
In a country where prices of NCEs are regulated by a price-cap, price
increases are not usually allowed over time, and prices are highly
subsidized by public health care insurance (the main pharmaceutical
buyer), our hypothesis is that the government’s introductory offer
price may be determined by the incremental health impact of the
innovation and its impact on the incremental use of resources
(incremental degree of innovation over existing close substitutes),
the price of existing close therapeutic substitutes, the buyer’s
willingness to pay for incremental units of health outcomes, the
budgetary impact of the new product for the buyer, and the
contribution to other industrial policy goals of interest to the
government. The firm’s choice of ask price in the
price/reimbursement process may be determined by the degree of
innovation over close substitutes, indication for acute or chronic
conditions, and the number of competitors (brands and generics), but
also by the potential spillover effects of the price in that particular
country when its prices are used as an external reference by other
countries (Garcia Mariñoso et al, 2010).
8
The maximum relative introductory price of an NCE i, in a given
price-regulated country, over that of its close substitutes c offered by
the government (Pmaxic) may be higher if the new product has
demonstrated superior health outcomes (efficacy, safety, side-effects,
etc.) and if it reduces patient consumption of other health services
(inpatient stays, physician visits, etc.). That is, Pmaxic will be higher
for higher differences in efficacy (Ei – Ec); however, the premium
price over that of close substitutes will be dependent on willingness to
pay (WTPi) for these incremental health outcomes. WTPi may be time
dependent (i.e., increasing over time as income and health value
improve), and it may also be different for different types of conditions
or illnesses (Becker et al, 2007). Changes in the use of other health
service resources (i.e., hospital stays, medical visits, etc.) associated
with the use of the NCE may be of importance to the government:
the maximum relative price offered by the government may be higher
when differences in cost offsets (Cc – Ci) are larger (Danzon et al,
2005). In countries where pricing/reimbursement decisions are based
on the economic evaluation of NCEs, for a given price, differences in
efficacy and in resource consumption result in an incremental cost-
effectiveness ratio value. This has to be compared to the cap on the
maximum incremental cost-effectiveness ratio2. This ratio represents
the willingness to pay.
However, the government, acting also as the main payer for the use
of the NCE, is highly concerned by the expected budgetary impact of
the innovation. The cost-conscious government (public insurance
agency) will offer an introductory price Pmaxic that will generate an
expected maximum expenditure on the treatment of the illnesses for
which the NCE i is indicated equal to or lower than its target
pharmaceutical budget in the launch year. In the
price/reimbursement negotiation, the government’s concern for
2 The existence of incremental cost-effectiveness ratio thresholds would represent a particular case in the context of this hypothesis.
9
budgetary impact will be the result of the potential volume (Qi) and
the rate of co-payment in the insurance system for the
pharmaceutical in the same therapeutic class (COi). That is, under the
prevailing silo mentality in the cost containment policies of the
country, the product of the dispensed quantity of the NCE i by its
incremental price and by its co-payment rate should be less than or
equal to the maximum budget increase considered acceptable by the
government.
Notwithstanding, aside from health care policy goals, the
government’s maximum introductory price offer for the NCE may also
be influenced by other industrial policy objectives of interest related
to the production of product i (IPi). In most industrialized countries,
the price regulation mechanism for NCEs is used to provide non-
market incentives through higher price premiums to firms that
commit themselves to maintaining or increasing employment, and
locating production and R&D investment in the country, or to those
firms launching in their home country (OFT, 2007).
Then, the government’s maximum offer price Pmaxic can be written as
Pmaxic = f {(Ei – Ec), WTPi, (Cc – Ci), Qi, COi, IPi} (1)
The firm’s ask price (or reservation introductory price) for an NCE i
(Pminic) may be hypothesized to be adequately represented by the
explanatory factors included in the unregulated Lu and Comanor
model. In this model, the firm’s choice of pricing strategy depends on
the degree of innovation (incremental efficacy and changes in the use
of resources; that is, Ei – Ec, and Cc – Ci), the anticipated number of
repeated purchases (which are less likely for pharmaceuticals
indicated for acute conditions, ACUTEi), and the presence in the
market of two types of rivals or competitors (branded substitutes and
generic versions of substitutes) for product i (COMPi), given that,
assuming some buyers’ price sensitivity, the indirect competition of
substitutes sets limits to the monopoly power of the NCE. The

10
potential sales volume (Qi) should also be an argument in the firm’s
asking price for a new NCE with an expected sign that is not
determined a priori. On the one hand, the larger the potential
market, the stronger the incentive of the firm to negotiate hard,
pushing up prices; but on the other hand, the larger the potential
market, the stronger the penalization imposed by the delay in terms
of lost sales during the patent protection period.
Additionally, in the price/reimbursement negotiation process, Pminic
may also be influenced by the potential spillover effects of the
introductory price of i from parallel trade and external reference
pricing (Si). The European Union (EU) explicitly permits parallel trade
between EU members. Regulated markets with low pharmaceutical
prices are a source of parallel trade and a reference for those
countries that increasingly use the lower prices in other countries to
regulate prices in their own country (Kanavos and Costa-Font, 2005).
Then, the firm’s ask price Pminic can be written as
Pminic = g {(Ei – Ec), (Cc – Ci), ACUTEi, COMPi, Si} (2)
As we are interested in price determinants of effectively launched
products, we assume that negotiation results in launch of the product
at the introductory price Pic over that of its close substitutes, which is
equal to or higher than Pminic and equal to or lower than Pmax
ic.
Relative introductory prices as a result of the negotiating process will
be influenced by the bargaining power of the firm launching the new
product (Bi) when negotiating with the regulatory agency of the
country (Bardey et al, 2010).
Then, the Pic function can be written as
Pic = h [Pmax
ic{(Ei – Ec), WTPi, (Cc – Ci), Qi, COi, IPi}; Pmin
ic{(Ei – Ec),
(Cc – Ci), ACUTEi, COMPi, Qi, Si}; Bi], (3)
with Pminic<= Pic <= Pmax
ic.

11
The reduced form for equation (3) can be written as
Pic = h {(Ei – Ec), WTPi, (Cc – Ci), Qi, COi, IPi, ACUTEi, COMPi, Si, Bi}
(4)
The relative introductory price of NCE i over that of its close
substitutes c is expected to be positively related to incremental
efficacy, willingness to pay for health outcomes, cost offsets, co-
payment rate, contribution to the achievement of industrial policy
goals, treatment of acute conditions, potential spillovers, and
bargaining power of the launching firm. We expect this price to be
negatively correlated with the number of competitors in the market,
and with potential volume of sales.
3. EMPIRICAL ANALYSIS
3.1 Equation and Variables
For equation (4), we specify the following regression equation:
LPic = α0 + α1RATEAi + α2RATEBi + a3ti0 + a4NEOi + a5LAGEic +
α6LQCic + a7HOMEi + α8ACUTEi + α9LNUMi0 + α10DGENi + a11TOPi +
a12FDA_NOi + a13EMA + ε (5)
where
LPic = Natural logarithm of the relative introductory price of NCE
i in relation to the price of its close therapeutic substitutes
RATEAi = Dummy variable that equals 1 if NCE i receives a
rating of A (important therapeutic gain, defined in the next
subsection)
RATEBi = Dummy variable that equals 1 if NCE i receives a
rating of B (modest therapeutic gain, defined in the next subsection)
ti0 = Year of price authorization of NCE i (i=0, 1, 2,…,8)
12
NEOi = Dummy variable that equals 1 if NCE i belongs to the
therapeutic group L (antineoplastic and immunomodulating agents)
LAGEic = Natural logarithm of the average number of years in
the market for close therapeutic substitutes until price approval of
NCE i, weighted by volume of sales
LQCic = Natural logarithm of the number of DDDs of the close
therapeutic substitutes of NCE i sold the year before its approval,
adjusted by its effective patient co-payment rate
HOMEi = Dummy variable that equals 1 if NCE i has been
launched in the originator or licensee firm’s country
ACUTEi = Dummy variable that equals 1 if NCE i is indicated for
an acute illness
LNUMi0 = Natural logarithm of the number of branded close
therapeutic substitutes for NCE i in the launching year
DGENi = Dummy variable that equals 1 if a close brand-name
substitute has a generic rival at the time of the new product’s
introduction
TOPi = Dummy variable that equals 1 if the firm selling NCE i is
one of the top 15 selling pharmaceutical firms in the country the year
before NCE introduction
FDA_NOi = Dummy variable that equals 1 if the drug has never
been approved by the FDA
EMA = Dummy variable that equals 1 if the drug has been
centrally approved by the EMA (vs mutual recognition procedure)
In equation (5) the degree of innovation, comprising
incremental efficacy and cost offsets, is measured by ratings of new
pharmaceuticals in class A and class B, where the omitted category
corresponds to products with little or no therapeutic gain, and to
products for which there was not enough evidence to establish their
13
therapeutic advance at the introduction. We also include a dummy for
NCEs that have never been approved in the US. This is an exogenous
proxy for low therapeutic gain or innovative degree of the drug.
Government willingness to pay is measured by three variables: the
year of price authorization (ti0), assuming an increasing willingness to
pay over time; the therapeutic group L (antineoplastic and
immunomodulating agents), assuming a higher willingness to pay for
more life threatening conditions; and the weighted age of close
substitutes (LAGEic), assuming a higher willingness to pay for NCEs
indicated for conditions with older treatments. A higher willingness to
pay positively related to the age of close substitutes would also be
recognition of a more notable erosion of older prices of close
substitutes by inflation given that these prices have not usually been
inflation adjusted in Spain; but also, this regulatory feature may
represent a clear incentive for the firm to rapidly introduce new
products in substitution for older ones with declining real prices.
Industrial policy objectives are represented in equation (8) by a
variable (HOMEi) indicating that the NCE has been introduced in the
market by a Spanish firm (this firm may be the originator or a
licensee). Potential volume of sales is measured by the number of
DDDs of the close therapeutic substitutes of NCE i sold the year
before its approval, adjusted by its effective patient co-payment rate,
which represents the budget impact concern of the government
(expected negative price effect), but also the importance of potential
spillovers as perceived by the firm (expected positive price effect).
We assume the parallel trade risk to be higher for higher-volume
NCEs than for smaller product volumes. Finally, bargaining power is
represented in this equation by a dummy variable (TOPi) which
identifies the 15 top-selling firms in Spain the year before price
authorization. The bargaining power is expected to be higher for
larger firms. We include a dummy variable for the EMA centralized
approval procedure. It has an expected positive sign because it
14
increases the bargaining power of the firm in Spain, as it tends to
homogenize international prices, bringing Spain closer to the average
of EU prices.
3.2 The Data
The data set consists of all pharmaceuticals approved by the Spanish
Health Ministry between 1997 and 2005. In this period, 288 new
pharmaceuticals were approved in Spain. We included new drugs for
ambulatory therapies. Of these products, we excluded 174 from the
present analysis for various reasons. First, 120 products were only
used or dispensed in hospitals. They were excluded because the
mechanism of price negotiation with health authorities is different
than for ambulatory drugs. A second category of excluded products
consists of 17 other products such as hormones, vaccines and
diagnostic devices in order to keep the sample homogeneous.
Thirteen products were excluded because they were not covered by
the National Health Service (NHS) insurance system. Twenty-one
topical agents (creams, lotions, and ophthalmic solutions) for which a
recommended daily dose cannot be easily established were also
excluded. Finally, three products did not show any sales to the NHS
during the period and were also excluded. Our data set thus includes
a total of 114 new chemical entities (NCEs).
In this study, we define the price of an NCE as the average weighted
price (AWP) per defined daily dose (DDD). A DDD is defined as the
average daily dose of an NCE used by an adult for treatment of the
main indication of the pharmaceutical. The price of a new drug has
been determined as the weighted average ex-factory price (WAP)
without VAT3 per defined daily dose (DDD) in the first quarter in the
market. Discounts or rebates have not been reported for new
3 Ex-factory prices excluding VAT have been calculated from regulated consumer prices deducting VAT rates and time variant regulated margins set for wholesalers and pharmacies by the Spanish Health Ministry.
15
pharmaceuticals in Spain, so we may confirm that our price data do
not overstate NCE consumer prices. Sales of each pack of NCEi to the
NHS have been used as the weighting structure. Pharmaceutical sales
financed by the NHS represent most of the sales of prescription drugs
in the Spanish market; therefore, we may consider NHS sales mix as
an adequate proxy for the complete market.
We used the DDD system recommended by the World Health
Organization (WHO, 1997) for studies of drug use in order to define
comparable dosages. Official DDDs were available for most NCEs. For
the remaining drugs, recommended daily doses were obtained from
the files of the public Spanish Drug Agency.
We identified close substitutes of an NCE as those chemical entities
that share the same indication, have the same or similar routes of
administration, and that were the most commonly prescribed
medicines among those with the same indication and route of
administration in the year immediately preceding the introduction of
the new drug. Usually, close substitutes belong to the same broadly
defined chemical class, but this is not always the case; thus, in our
study, being the most commonly prescribed pharmaceutical entity for
the same indication the year before the introduction of the NCE was
the main criterion to identify close substitutes in order to measure
more accurately the pharmaceutical prices paid by the NHS for the
same condition before NCE introduction.
In this study, close substitutes of each NCE were identified by taking
advantage of the information about each new pharmaceutical
approved in Spain that periodically appeared in the section titled
“New active ingredients” of “Información Terapéutica del Sistema
Nacional de Salud” (Therapeutic Information of the NHS), a regular
publication of the Spanish Health Ministry4, which covers all the years
4 The contents of this publication for all the years included in this study may be consulted at the web page: www.msps.es
16
included in the present study. We identified at least one close
substitute for each of the 114 NCEs included in our study.
We defined an NCE as acute if it is intended for conditions lasting no
more than three months. A pharmacy expert was consulted in this
regard.
No official centrally established rating of therapeutic advance is
available for pharmaceuticals in Spain. However, the cited publication
of the Spanish Health Ministry “Therapeutic Information of the
National Health Service” published an unofficial rating similar to that
of the US Food and Drug Administration. We will call it the regulator
rating (RR). It has two main limitations for this study: first, the lack
of information for the last three years of the study (24 NCEs); and,
second, its potentially endogenous nature as a central government
rating that may be used by the government regulator as a tool in the
price/reimbursement negotiation with the firm. There is also an
insurer rating (IR) for the therapeutic advance of NCEs in Spain which
covers the whole period of our study. It has been issued by several
regional governments, which are in charge of decentralized
financing/buying of pharmaceuticals and management of health
services5. Six NCEs were not evaluated in the IR. The IR could also be
a biased proxy of the true innovation value of new drugs, because it
is in the interest of regional governments to avoid paying for
expensive medicines, therefore they could rate new drugs
systematically below their true therapeutic value, and it could be
endogenous because expensive drugs could be downgraded in an
opportunistic behaviour. Nevertheless, the IR is less suspicious of
endogeneity, because it is issued ex-post (after price negotiation) by
regional governments, which are not directly involved in the 5 Several evaluation committees of new drugs have been set up by some Spanish regional governments (Andalusia, Aragon, Catalonia, and the Basque Country) and have been issuing common ratings of therapeutic advance for new pharmaceuticals since January 2004. The rating publicly issued by the government of Navarre is the only one covering all new pharmaceuticals since January 1997. Thus, in this paper we use the rating of Navarre from January 1997 to December 2003, and the common ratings issued by the five regional governments after that date.
17
pricing/reimbursement negotiation process, and as such, it represents
a broader, more official, and potentially more evidence-based
consensus than the RR.
The therapeutic advance associated with an NCE is measured, in both
the RR and the IR, by the following ratings: A = important
therapeutic gain; B = moderate therapeutic gain; C = little or no
therapeutic gain; D = not enough clinical information or experience to
establish therapeutic advance at launch. It is worth noting here that
evaluating therapeutic gain is especially difficult when relying on
premarket clinical trials that are universally sponsored by the
company requesting reimbursement. Company sponsored clinical
trials have been repeatedly shown to have a positive bias. We include
in the model dummy regressors for rates A and B. An alternative
model combines the categories A and B in a A+B category. We also
include a dummy variable equal to 1 if the FDA never approved the
drug. We assume that it is exogenous to the price in Spain, and those
drugs that were never approved in the US should probably have low
therapeutic value. We expect, then, a negative sign.
Finally, we included a dummy variable (EMA) for the drugs centrally
approved by the European Agency. The rest (EMA equals 0) were
approved only in Spain, or through the mutual recognition procedure.
We expect a positive sign.
4. RESULTS
4.1 Summary Statistics
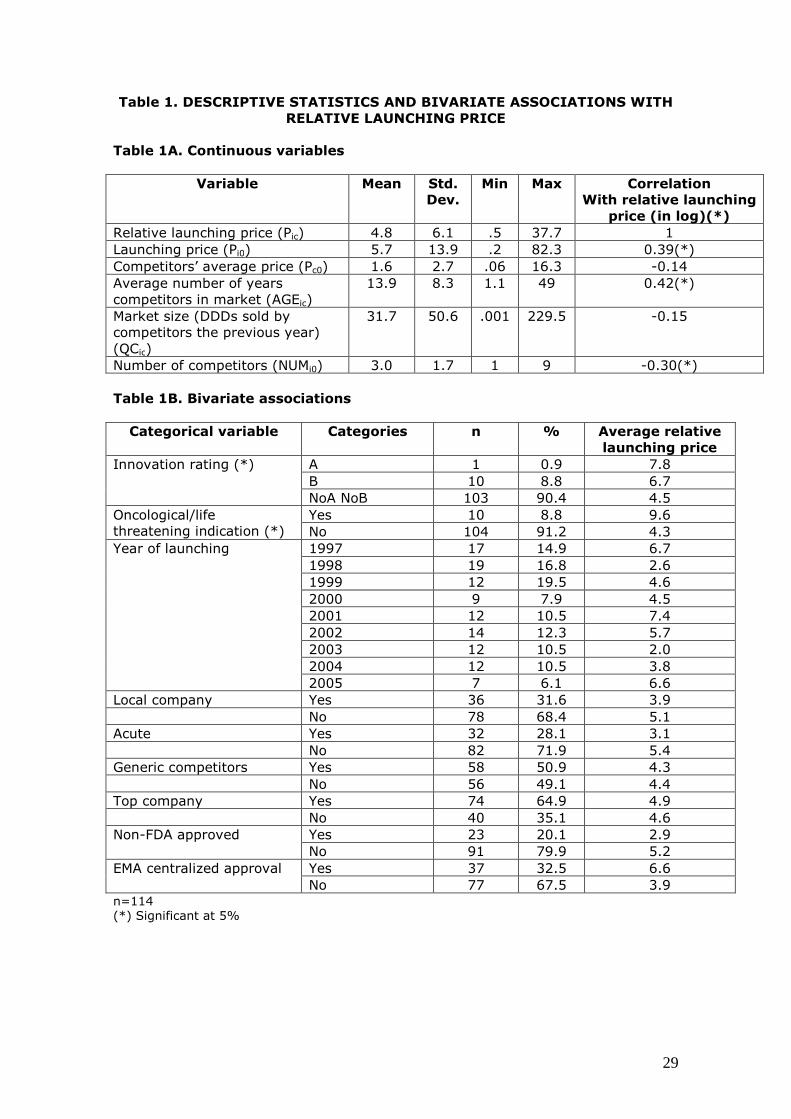
Table 1 reports univariate statistics and bivariate associations with
the relative launching prices for continuous variables (Table 1A) and
categorical variables (Table 1B).

18
[Insert Table 1 about here]
All continuous variables have large variances. Relative launching
prices are significantly correlated with the number of years of
competitors in the market and with the number of competitors. Only
one new drug defines the category A. It is indicated for some specific
types of cancer, it was approved by the EMA in 2001 and it started to be
marketed in Spain in 2002. Although relative launching prices by rating
groups have average values that compare as expected (A higher than
B, and B higher than the rest), the ANOVA test fails to find any
significant differences in relative launching prices by therapeutic
value. Figure 1 shows the scatter plot of relative launching prices and
number of years of competitors in the market, with rates of
innovation displayed. Oncological and life threatening condition drugs
are priced significantly above the rest. Local companies have lower
prices than foreign companies, but differences are not significant.
Drugs for acute conditions are priced above drugs for chronic
conditions. Top companies do not differ from the rest. Those drugs
that have been approved by the EMA in a centralized process have
significantly higher prices.
Comparing the two alternative ratings, IR and RR, notable
disagreements are found. The IR is more demanding than the RR, as
expected.
[Insert Figure 1 about here]
4.2 Regression Results
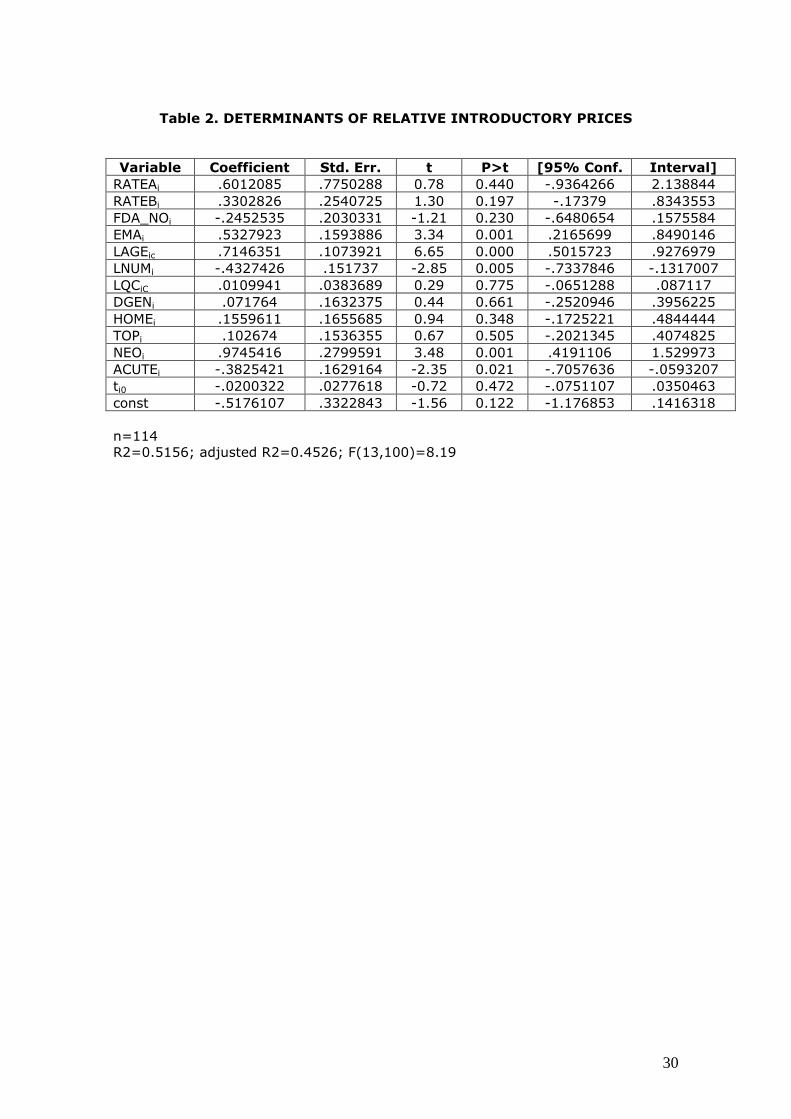
Table 2 reports the estimation results of the model (5). Therapeutic
value does not influence the relative launching price significantly,
although signs are as expected. Lack of significance does not seem to
be due to collinearity because the Variance Inflation Factors (VIF) of
19
RATEA and RATEB are low (1.19 and 1.18 respectively). The
alternative model which combined these two categories into a single
(A or B) category gives similar results with a coefficient of the
combined variable equal to 0.356 (p-value of 0.14), and the
remaining coefficients do not almost change . The number of years of
competitors in the market is highly significant, and its standardized
coefficient is the largest one. Competitive pressure, measured
through the number of competitors in the market, is significant and it
has a large coefficient (-0.43). It is correlated with market size,
because drugs with large sales in DDDs the year before launching had
more competing firms (linear correlation = 0.62). This is why market
size is not significant (and it has the wrong sign). In fact, the VIF of
market size (LQC) is the highest (2.12). Neither is the presence of
generic firms significant. The coefficient of centralized approval (EMA)
is positive, large and significant. Cancer drugs have a significant
premium after controlling for the rest of the covariates. Their
coefficient (0.97) can be interpreted as follows: the relative launching
price of an oncological drug is 2.6 times that of a non-oncological
drug. On the other hand, acute indications are penalized in Spain,
compared to drugs for chronic conditions. The coefficient (-0.38)
shows that drugs for acute conditions are priced at a level that is only
68% of the relative price of a similar drug for a chronic condition. As
in the bivariate analysis, neither top companies nor local companies
differ significantly in launching price of their subsidized drugs.
The Breusch-Pagan test does not reject the null hypothesis of
homoscedasticity (BP=14.18, p=0.36).
There are four positive outliers with standardized residuals larger
than 2, and two negative outliers with standardized residuals smaller
than -2. Two of the positive outliers are drugs launched in 1999 by
local companies, and the other two are drugs launched in 1997. The
two negative outliers were launched in 2001 and 2002 respectively.

20
One is a non-oncological drug with NEO=1 for prevention of organ
reject after transplant. All outliers have small market sizes.
[Insert Table 2 about here]
5. CONCLUSIONS AND POLICY IMPLICATIONS
Contrary to expectations and to the results published by Lu and
Comanor (1998) for the US and by Ekelund et al (2003) for Sweden,
in Spain the therapeutic value or degree of innovation does not seem
to be a key factor in determining the launching price of new drugs.
Price setting is mainly used as a mechanism to adjust for inflation
erosion independently of the degree of innovation.
Notwithstanding, there are difficulties to measure the degree of
innovation of new drugs objectively and exogenously. We have
discussed some alternatives in our text. In Spain, ratings by the
public regulator and by the public insurer are potentially endogenous,
in opposite ways. The regulator could use his rating to justify the
prices he has authorized. The insurer could opportunistically
underqualify the most disruptive drugs in order to control
expenditure. The alternative unofficial ranking provided by the
pharmaceutical councils was not significant either. We used
alternative proxies for innovation, such as the dummy for being first
in class proposed by Grabowski et al (1992), but we did not get
significant results for this either. A proxy for (lack of) therapeutic
value that is clearly exogenous is the dummy of non-approval by the
FDA. According to the model, these drugs have lower launch prices,
although the difference is not statistically significant.
While none of the three explanatory variables describing the
therapeutic value in our model is significant, their signs are as
expected. Our finding that the price of new drugs is hardly influenced
by their degree of innovation is robust to alternative measures, all
21
potentially problematic, of degree of innovation. The fact that in
Spain, unlike in Sweden and other European countries, there is not a
fourth threshold of cost-effectiveness for new drugs could help to
explain our result that price does not depend on therapeutic value. In
the price negotiation there is no need to justify prices with evidence
on effectiveness or cost per QALY at different levels of price.
The main contributing factor to predict the relative launching price is
the average age of competitors on the market. In Spain, once the
price of a new drug is set, it will rarely never be reviewed. Therefore,
in practice, the setting of prices for new drugs is also a mechanism of
adjustment for inflation. Our model points clearly to this fact.
Because we have selected only new molecules, our model is not
sensitive to the plausible strategic behaviour of those firms that ask
for authorization of old drugs by disguising them as new ones, for
instance setting new combinations of old molecules, in order to
update prices against inflation erosion.
Since 1995 there have been two alternative procedures in Europe for
authorizing new drugs: the centralized one, by EMA, and the one
based on mutual recognition. In the latter, the drug is authorized in a
particular country, with the understanding that all the other European
countries will recognize it automatically unless an objection is raised
in 90 days. Also, a drug could be authorized only in a particular
country. European regulation sets compulsory centralized approval
for some types of drugs (monoclonal antibodies; orphan drugs) and
medical conditions. After authorization, national authorities set prices
and decide whether to include the drugs in the public insurance
coverage list. Our data do not show a definite time trend in the
frequency of centralized authorizations in Spain. About one third of
the new drugs in our database have been authorized by the EMA
using the centralized procedure, and that share ranges from 25% to
22
50% of the drugs authorized each year, except 1997, with only one
centralized authorization.
An interesting new finding of this study is that drugs centrally
authorized by the EMA are overpriced by 70% (=e0.5327923). This
effect is large, very significant and robust to changes in the model
specification. A possible explanation of this result is that those drugs
that were centrally approved have more homogeneous prices among
countries because their markets are more globalized. As drug prices
in Spain are on average lower than in most countries, and below the
European average, centrally approved drugs are priced above the rest
in Spain. In summary, the dummy variable for centralized approval
could reflect the combined effect of market factors and regulation
factors in a globalized context. There is no difference between the top
15 companies and the rest. There is no evidence that the more
innovative drugs are centrally approved.
Companies try to speed up the introduction of new drugs in markets,
particularly in the larger ones. The countdown to patent expiry is a
key element in the profitability of the new drug throughout its
lifetime. But in the negotiation game, the company could possibly
prefer to delay the launching in order to avoid suffering spillover
effects of lowering international reference prices. We introduced into
the model the time elapsed from the first authorization of the drug to
its launching in Spain. We expected a negative effect, because large
delays could reflect harder negotiations in Spain, finishing up with
prices less favourable to the company. However, we did not find any
significant effect.
Competition influences prices, as expected. The more competitors,
the lower the relative launching price, as in the US. Market
concentration is also responsible for higher prices for antimalarial
drugs in developing countries (Goodman, 2009). But in Spain the
presence of substitutive generic drugs does not influence the price.
23
The volume of the market, measured through the number of DDDs
sold the year before the launching by competitor drugs, apparently
does not influence the launching price either. This lack of significance
of the market volume could be due to the positive correlation with the
number of competitors, which is a significant regressor in the model.
Perhaps it would be more relevant to include the potential expected
market ceiling – instead of real sales – which could be approximated
with data on morbidity. Some medical conditions, such as Alzheimer’s
disease or obesity, have a large market potential, in terms of unmet
demand, because of the lack of effective drugs. In fact, in the past,
the appearance of new disruptive drugs for certain conditions
increased the number of patients treated for such conditions. For
instance, the new antidepressants launched since the 1980s
increased consumption of antidepressants in the US from 5 to 460
million DDDs between 1988 and 1997 (Berndt et al, 2002).
Unfortunately there are no available data on the potential market for
each drug in our study.
Drug characteristics are important determinants of prices. In Spain,
where drug prices are traditionally low, the treatment of life
threatening conditions, including cancer, is overpriced. According to
the model, all other factors being equal, the relative launching price
of a drug against a life threatening disease is 2.65 times (e 0.9545)
higher than that of other drugs. There is abundant literature, more
often theoretical or based on social values than empirical, on the
social willingness to pay for these kinds of treatments (Becker et al,
2007). In our study we found that overpricing is more specific to
cancer than to generic immunomodulating drugs, because two out of
the three non-oncological drugs, which prevent organ rejection after
transplant, have negative residuals. One of the three is even an
outlier.
24
Unlike in the US and Sweden, in Spain acute treatments have a price
penalty. This result is the opposite of what we expected because in
Spain acute treatments generally have higher co-payments than
drugs for chronic conditions. Therefore it would be plausible that the
regulator would be ready to accept higher prices without affecting
public expenditure. The result for acute drugs is robust to alternative
specifications, but it is sensitive to the precise definition of acute
treatment. It would be useful to dig deeper into the causes, as it may
be that our finding cannot be generalized. In our database, acute
treatments are not associated with a better or worse therapeutic
value, and neither are they associated with the number of years the
competing drugs have been on the market.
After taking into account the rest of the covariables, there is no
definite temporal trend in the dynamics of the relative launching
prices authorized in Spain. A linear time trend is not significant, and
annual dummies are not significant either. Outliers are concentrated
in specific years: overpricing in 1997 and 1999 and negative outliers
in 2000. We expected a positive sign of the linear trend, indicating
that the willingness to pay for a drug in the country goes up over
time. But on the other hand, launch timing also reflects other
contextual factors, not accounted for in the model, which may vary
over time. In practice, the composite resultant of these forces is not
significant.
Two limitations of the study are the sample size (n=114) and the
problems of collinearity. Both are responsible for the lack of
robustness of the model results to small changes in the definition of
therapeutic innovation. However, this sample of 114 drugs is in fact
the population of new drugs launched on the Spanish market during
the period of study. The implied challenge in this context is to know
whether our findings can be generalized to other years, and whether
they describe stable phenomena of cause-effect relationships. Our
25
model fitting is good. The method used to determine close substitutes
is not perfect, but it is the usual method in market studies of drug
entries.
Another limitation is the omission of variables that are potentially
explanatory, related to the European context. We included the
dummy of centralized approval by the EMA but we omitted, due to
lack of data, other international references of spillover effects and
contagion effects (Kanavos and Costa-Font, 2005), which could
change the bargaining power of the company. The average price
previously approved in other countries (international reference price)
and the number of European countries that previously approved both
the drug price and its funding conditions would have been potentially
useful regressors in our model. They were not included either in the
Swedish model, which makes that comparison of results between
Sweden and Spain easier.
In summary, in Spain innovation is not a key factor in determining
the launching price of new drugs. Drugs centrally authorized, drugs
for treating life threatening diseases, and drugs for chronic conditions
(unlike the US) are overpriced. The more the number of competitors,
the lower the launching relative price, but the presence of
substitutive generic drugs does not influence the price. Price setting is
mainly used as a mechanism to adjust for inflation erosion
independently of the degree of innovation. These results cannot be
generalized without empirical evidence to every single country with a
highly regulated market. This a pending task for researchers.
ACKNOWLEDGEMENTS

26
This study was supported by an unrestricted educational grant from the
Merck Foundation, the philanthropic arm of Merck & Co. Inc.,
Whitehouse Station, New Jersey, USA. Partial funding was also
obtained from the Spanish Ministry of Science and Education under
grant SEJ2007-66133.
27
REFERENCES
Antoñanzas F, Oliva J, Pinillos M, Juárez C. 2007. Economic aspects of the new Spanish laws on pharmaceutical preparations. European Journal of Health Economics 8(3): 297-300.
Bardey D, Bommier A, Jullien B. 2010. Retail price regulation and innovation: reference pricing in the pharmaceutical industry. Journal of Health Economics 29(2): 306-316.
Becker G, Murphy K, Philipson T. 2007. The value of life near its end and terminal care. NBER Working Paper No. 13333, National Bureau of Economic Research, Cambridge, MA.
Benda M-C, Mallory C, Lu H. 2004. An econometric estimation of pricing of brand-name drugs. Applied Health Economics and Health Policy 3(1 suppl): S12.
Berndt ER. 2002. Pharmaceuticals in U.S. health care: determinants of quantity and price. Journal of Economic Perspectives 16(4): 45-66.
Berndt ER, Bhattacharjya A, Mishol DN, Arcelus A, Lasky T. 2002. An analysis of the diffusion of new antidepressants: variety, quality, and marketing efforts. Journal of Mental Health Policy and Economics 5(1): 3-19. Danzon PM, Wang YR, Wang LL. 2005. The impact of price regulation on the launch delay of new drugs―evidence from twenty-five major markets in the 1990s. Health Economics 14: 269-292.
Dean J. 1969. Pricing pioneering products. Journal of Industrial Economics 17(3): 165-179.
Ekelund M, Persson B. 2003. Pharmaceutical pricing in a regulated market. The Review of Economics and Statistics 85(2): 298-306.
Garcia Mariñoso B, Jelovac I, Olivella P. 2010. External referencing and pharmaceutical price negotiation. Health Economics doi: 10.1002/hec.1630.
Goodman C, Kachur SP, Abdulla S, Bloland P, Mills A. 2009. Concentration and drug prices in the retail market for malaria treatment in rural Tanzania. Health Economics 18: 727-742.
Grabowski HG, Vernon JM. 1992. Brand loyalty, entry and price competition in pharmaceuticals after the 1984 Drug Act. Journal of Law and Economics 35(2): 331-350.
Hong SH, Shepherd MD, Scoones D, Wan TTH. 2005. Product-line extensions and pricing strategies of brand-name drugs facing patent expiration. Journal of Managed Care Pharmacy 11(9): 746-754.
28
Kanavos P, Costa-Font J. 2005. Pharmaceutical parallel trade in Europe: stakeholder and competition effects. Economic Policy 20(44): 751-798.
Lexchin J. 2006. Do manufacturers of brand-name drugs engage in price competition? An analysis of introductory prices. Canadian Medical Association Journal 174(8): 1120-1121.
Lu ZJ, Comanor WS. 1998. Strategic pricing of new pharmaceuticals. The Review of Economics and Statistics 80(1): 108-118.
Office of Fair Trading (OFT). 2007. The Pharmaceutical Price Regulation Scheme. Office of Fair Trading, London, UK.
Philipson TJ, Dai C. 2003. Between- vs. within-patent competition. Regulation Fall: 42-48.
Puig-Junoy J. 2004. Incentives and pharmaceutical reimbursement in Spain. Health Policy 67: 149-165.
Reekie WD. 1978. Price and quality competition in the United States drug industry. Journal of Industrial Economics 26(March): 223-237.
Wiggins SN, Maness R. 2004. Price competition in pharmaceuticals: the case of anti-infectives. Economic Inquiry 42(2): 247-263.
Zaric GS. 2008. Optimal drug pricing, limited use conditions and stratified net benefits for Markov models of disease progression. Health Economics 17: 1277-1294.
29
Table 1. DESCRIPTIVE STATISTICS AND BIVARIATE ASSOCIATIONS WITH
RELATIVE LAUNCHING PRICE
Table 1A. Continuous variables
Variable Mean Std.
Dev.
Min Max Correlation
With relative launching
price (in log)(*)
Relative launching price (Pic) 4.8 6.1 .5 37.7 1 Launching price (Pi0) 5.7 13.9 .2 82.3 0.39(*) Competitors’ average price (Pc0) 1.6 2.7 .06 16.3 -0.14 Average number of years competitors in market (AGEic)
13.9 8.3 1.1 49 0.42(*)
Market size (DDDs sold by competitors the previous year) (QCic)
31.7 50.6 .001 229.5 -0.15
Number of competitors (NUMi0) 3.0 1.7 1 9 -0.30(*) Table 1B. Bivariate associations
Categorical variable Categories n % Average relative
launching price
Innovation rating (*) A 1 0.9 7.8 B 10 8.8 6.7 NoA NoB 103 90.4 4.5
Oncological/life threatening indication (*)
Yes 10 8.8 9.6 No 104 91.2 4.3
Year of launching 1997 17 14.9 6.7 1998 19 16.8 2.6 1999 12 19.5 4.6 2000 9 7.9 4.5 2001 12 10.5 7.4 2002 14 12.3 5.7 2003 12 10.5 2.0 2004 12 10.5 3.8 2005 7 6.1 6.6
Local company Yes 36 31.6 3.9 No 78 68.4 5.1 Acute Yes 32 28.1 3.1 No 82 71.9 5.4 Generic competitors Yes 58 50.9 4.3 No 56 49.1 4.4 Top company Yes 74 64.9 4.9 No 40 35.1 4.6 Non-FDA approved Yes 23 20.1 2.9
No 91 79.9 5.2 EMA centralized approval Yes 37 32.5 6.6
No 77 67.5 3.9 n=114 (*) Significant at 5%
30
Table 2. DETERMINANTS OF RELATIVE INTRODUCTORY PRICES
Variable Coefficient Std. Err. t P>t [95% Conf. Interval]
RATEAi .6012085 .7750288 0.78 0.440 -.9364266 2.138844 RATEBi .3302826 .2540725 1.30 0.197 -.17379 .8343553 FDA_NOi -.2452535 .2030331 -1.21 0.230 -.6480654 .1575584 EMAi .5327923 .1593886 3.34 0.001 .2165699 .8490146 LAGEic .7146351 .1073921 6.65 0.000 .5015723 .9276979 LNUMi -.4327426 .151737 -2.85 0.005 -.7337846 -.1317007 LQCiC .0109941 .0383689 0.29 0.775 -.0651288 .087117 DGENi .071764 .1632375 0.44 0.661 -.2520946 .3956225 HOMEi .1559611 .1655685 0.94 0.348 -.1725221 .4844444 TOPi .102674 .1536355 0.67 0.505 -.2021345 .4074825 NEOi .9745416 .2799591 3.48 0.001 .4191106 1.529973 ACUTEi -.3825421 .1629164 -2.35 0.021 -.7057636 -.0593207 ti0 -.0200322 .0277618 -0.72 0.472 -.0751107 .0350463 const -.5176107 .3322843 -1.56 0.122 -1.176853 .1416318
n=114 R2=0.5156; adjusted R2=0.4526; F(13,100)=8.19

Figure 1
31