Embed Size (px)
Citation preview

UNIVERSITA' DEGLI STUDI DI PISA
SCUOLA DI INGEGNERIA
CORSO DI LAUREA MAGISTRALE IN
INGEGNERIA EDILE E DELLE COTRUZIONI CIVILI
TESI DI LAUREA:
Launching of Prestressed Bridge_ Case study
Candidato: Relatori:
Christian Quilici Prof. Ing. Pietro Croce
Ing. Daniele Lucchesi
ANNO ACCADEMICO 2014/2015
Launching of Prestressed Bridge_Case Study
INDEX
0.FOREWORD ............................................................................................................. 4
1. SITE DESCRIPTION. ...................................................................................................................... 5
2. THE CARRIAGEWAY REGULATION. ......................................................................................... 8
3. DECK DESCRIPTION. ................................................................................................................... 8
4. INCREMENTALLY LAUNCHED DECK. ................................................................................... 11
4.1 Description of method. ................................................................................................................ 11
4.2 Casting Yard.................................................................................................................................. 11
4.3 Launching Nose ............................................................................................................................ 14
4.4 Casting: Beams shape and Path tendons. .................................................................................... 17
4.5 Launching. .................................................................................................................................... 31
4.5.1 Introduction .............................................................................................................................. 31
4.5.2 Preliminary Verification of Equilibrium (EQU). ......................................................................... 33
4.5.3 Structural Analysis (STR). .......................................................................................................... 34
4.5.3.1 Comparison between ............................................................................................................. 34
4.5.3.2 Summary of stress in SLU and SLE combination .................................................................... 50
4.5.3.3 Reinforced beams Check ........................................................................................................ 52
4.5.3.4 Prestressed beams Check. ..................................................................................................... 55
4.5.3.5 Beam's check .......................................................................................................................... 57
4.5.3.5 Nose ....................................................................................................................................... 57
4.5.3.5.2 Joint Nose-Deck .................................................................................................................. 61
4.6 End of Launching: static configuration ........................................................................................ 63
4.7 Prestressing of Path 1 "P1" and Slab casting ............................................................................... 66
4.7.1 Casting 1. ................................................................................................................................... 71
4.7.1.1 Bending Moment ................................................................................................................... 74
4.9 Behaviour during the life ............................................................................................................. 88
4.9.1 Shear force ................................................................................................................................ 96
5 ERECTION GIRDER. .................................................................................................................... 97
5.1 Description of method ................................................................................................................. 97
5.10 Frequent combination. ............................................................................................................ 130
5.11 Rara combination. .................................................................................................................... 132
5.12 Bending Moments of SLU combination ................................................................................... 135
5.12.1 Scenario t = 90 days. ............................................................................................................. 136
5.12.2 Scenario t = 00 days. ............................................................................................................. 136
5.13 Shear Force of SLU combination. ............................................................................................. 137
5.13.1 Scenario t = 90 days. ............................................................................................................. 138
5.13.2 Scenario t = 00 days. ............................................................................................................. 139
5.2 Description of beams ................................................................................................................... 99
5.3 Path Tendons ............................................................................................................................... 99
5.3.1 Span Tendons: External beams ................................................................................................. 99

Launching of Prestressed Bridge_Case Study
5.3.3 Support Tendons. .................................................................................................................... 103
5.3.4 Conclusion. .............................................................................................................................. 108
5.4 Erection Girder at t = 28 days. ................................................................................................... 109
5.5 Slab's casting at t = 60 days ........................................................................................................ 110
5.6 Prestressing of continuity joint at t = 90 days. .......................................................................... 112
5.7 Looking for Creep iperstatic. ...................................................................................................... 114
5.7.1 Elastic Beam's Edge rotations. ................................................................................................ 116
5.7.2 Steel Relaxation....................................................................................................................... 117
5.7.3 Shrinkage ................................................................................................................................. 117
5.7.4 Creep ....................................................................................................................................... 118
5.7.5 Interaction ............................................................................................................................... 120
5.8 Qp combination: Permanent No-resistance Load at t = 120 days. ............................................ 127
5.9 Qp combination: Permanent No-resistance Load at t = 00 days. .............................................. 128
Bibliography
Index of Figures:
Figura 1: Bridge's Plan and Substructure before Launching ................................................................ 7
Figura 2: Carriege Regulation ............................................................................................................... 8
Figura 3: Deck Section .......................................................................................................................... 9
Figura 4: Particular of Deck section ................................................................................................... 10
Figura 5: Yard Arrangement ............................................................................................................... 12
Figura 6: Prospect of Yard .................................................................................................................. 13
Figura 7: Pushing Device .................................................................................................................... 14
Figura 8: Sections of Nose .................................................................................................................. 15
Figura 9: Plan and Prospect of Nose .................................................................................................. 16
Figura 10: Jack in front of every Main Girder .................................................................................... 17
Figura 11: Segment 1 ......................................................................................................................... 23
Figura 12: Segment 2 ......................................................................................................................... 23
Figura 13: Section Z-Z ......................................................................................................................... 24
Figura 14: Section A-A ........................................................................................................................ 25
Figura 15: Section's B-B and C-C ........................................................................................................ 26
Figura 16: Section D-D ........................................................................................................................ 27
Figura 17: Segment 3 ......................................................................................................................... 28
Figura 18: Segment 4 ......................................................................................................................... 28
Figura 19: Segment 5 ......................................................................................................................... 28
Figura 20: Segment 6 ......................................................................................................................... 29
Figura 21: Segment 7 ......................................................................................................................... 29
Figura 22: Segment 8 ......................................................................................................................... 29
Figura 23: Example of Launching Stages ............................................................................................ 31
Figura 24: Plan of Falseworks ............................................................................................................. 32
Figura 25: Equilibrium Scheme .......................................................................................................... 33
Figura 26: Launching Rate .................................................................................................................. 46
Figura 27: Key of Shear Detail's.......................................................................................................... 54

Launching of Prestressed Bridge_Case Study
Figura 28: Worst-scenarios of Bending Moment and Axial Force in Nose ........................................ 58
Figura 29: Plan of Nose ...................................................................................................................... 59
Figura 30: Nose's Sections.................................................................................................................. 60
Figura 31: Plate of Anchorage ............................................................................................................ 61
Figura 32: Mesh of Anchorage's Plate ............................................................................................... 63
Figura 33: End of Launching: static configuration and Prestressing of Tendons "S" ......................... 68
Figura 34: Casting Stages ................................................................................................................... 69
Figura 35: Erection Girder_Arrangement of Prestrestressing Tendons ............................................ 96
Figura 36: Detail of Continuity Joint .................................................................................................. 97
Figura 37: Erection Girder Stages .................................................................................................... 105
Figura 38: Section A-A and B-B of beam .......................................................................................... 105
Figura 39: Section C-C of Beam ........................................................................................................ 106
Figura 40: Deatail of Pin ................................................................................................................... 108

Launching of Prestressed Bridge_Case Study
FOREWORD
The topic of this thesis is the study of launching of girder bridge. I will describe two
different methods:
- incrementally launched deck.
- erection girders method.
Regarding first method, I have focused on the phases of launching, the stresses in the Nose
and in the girders, the rigid equilibrium, the sequence of prestressing and the sequence of
casting.
Regarding the erection girder method, I have focused on the first path of tendons,
designing of the erection joint, designing of continuity joint on the piers, the creep effect
due to the dead load and prestressing.
I also checked the service life condition with traffic load.
Firstly, I will talk about the construction site.
Secondly, I will talk about the incrementally launched bridge.
Thirdly, I will talk about the erection girder method.

Launching of Prestressed Bridge_Case Study
1. SITE DESCRIPTION.
The bridge will be a road bridge, it will across the "Lama di Lenne" river and it will connect the
Province Street 103 in Palagiano, Taranto Province (Puglia, Italy).
This place is in the countryside, there aren't human settlements and the riverbed is always dry
in hot season so it is possible to work on it.
The total span between the river edges is 200 m.
In the cold season it has observed an extreme flood for ten years. It is necessary to make the
bridge sure to these event choosing a long span. The hydraulic and hydrologic study gives me
the following limits:
- Pier Height from low water level > 5m.
- min Bridge Span > 45m.
So I chose:
- Pier height: 5,75 m.
- Bridge Span: 50 m.
There is all the free space I need to manage the yard for both launching case.

Figura 1: Bridge's Plan and Substructure before Launching

2. THE CARRIAGEWAY REGULATION.
The road will have a section that will be conformed with secondary extra urban road, so it will
be C1 category (v.min 60 Km/h, v.max 100 Km/h by the Italian Road Codex). The section has to
respect the rules of D.M. 5 Novembre 2001 “Norme funzionali e geometriche per la
costruzione delle strade”, it has to have 2 lanes 3.75 m with, 1.5m footroad every sides, plus
0.75 m of safe device every sides and 0.9 m for water disposal plant.
The regulation orders to have 7% of longitudinal slope and between 2.5% and 7% of transverse
slope.
Figura 2: Carriege Regulation
3. DECK DESCRIPTION.
How I showed in the previous chapter I needed to have 13.8 m of carriageway minimum width,
but I have 14.5 m width.
I didn't want to create some girders too tall, so I chose to use 5 girders. With 5 girders I can
also use a low thickness's slab. I used the stress from SLU combination, which has the mobile
traffic load, in five bearings system and I added the stress from dead load of the beam and slab
in simply supported beam system, to do the preliminary design of the deck.
So I started to do my launching consideration to achieve this final deck:
- N° Beams: 5.
- Beam interaxle spacing: 2.9 m.
- Thickness's slab: 0.25 m.

DECK'S SECTION
Figura 3: Deck Section

Launching of Prestressed Bridge_Case Study
Figura 4: Particular of Deck section

4. INCREMENTALLY LAUNCHED DECK.
4.1. Description of method.
This method consist of building the bridge from one end only, casting individual segments,
managingits vertical and horizontal supports arrangement.
My objective is to cover all span length as soon as possible to save time and money. In this
phase my deck will be composed of beams and diaphragm. It will be cast in the yard
behind one of abutment, every segment will be joint with the previous segment with
prestressed tendons, epoxy joint and shear keys. After jointing, the pushing devices will
push the deck until the segment will be in design position. To avoid an excessive cantilever
from the abutment and piers I will connect in the front of deck a Launching Nose.
Finally I will have this sequence of works:
1. to built the yard for casting the girder behind the abutment.
2. to set up the slide and pushing devices.
3. to place the falsework.
4. to place the Launching Nose.
5. to cast.
6. to prestress and push.
When the deck achieve Permanent arrangement it will be possible to:
7. prestress again the deck.
8. cast the slab.
9. prestress again the deck.
10. build the accesories (asphalt, guardrail, ...).
All these points are explained in detail in following chapters.
4.2. Casting Yard.
Firstly, I have to control the Yard's Quote: I need to have the deck at the same odd of
Abutment 1'bearings. In order to achieve this purpose I will dig the zones behind the
Abutment 1: I will have an altitudes of 14.5 m above sea level. It is more than Abutment'1
bearings because I have to build a Movable Yard Floor. To build it, I will cast 4 transverse
foundation rows (perpendicular to bridge axle way) of concrete which will be:
- first row: on the abutment.
- second row: 25 m from the abutment.
- third row: 40 m from the abutment.
- fourth row: 55 m from the abutment.
These last 3 rows will support 6 vertical jacks, 2 per row, that will support and move two
steel beams. On these beams there will be other thinner traverse steel beams which will
support timber plates to create the Yard floor.
On every foundation rows there will be 5 short columns that will have fixed the slide device
on their upper faces which will have to be at same level of casting floor.
Finally I will have a floor where I will be able to placed falsework for casting.

Figura 5: Yard Arrangement

Launching of Prestressed Bridge_Case Study
Figura 6: Prospect of Yard
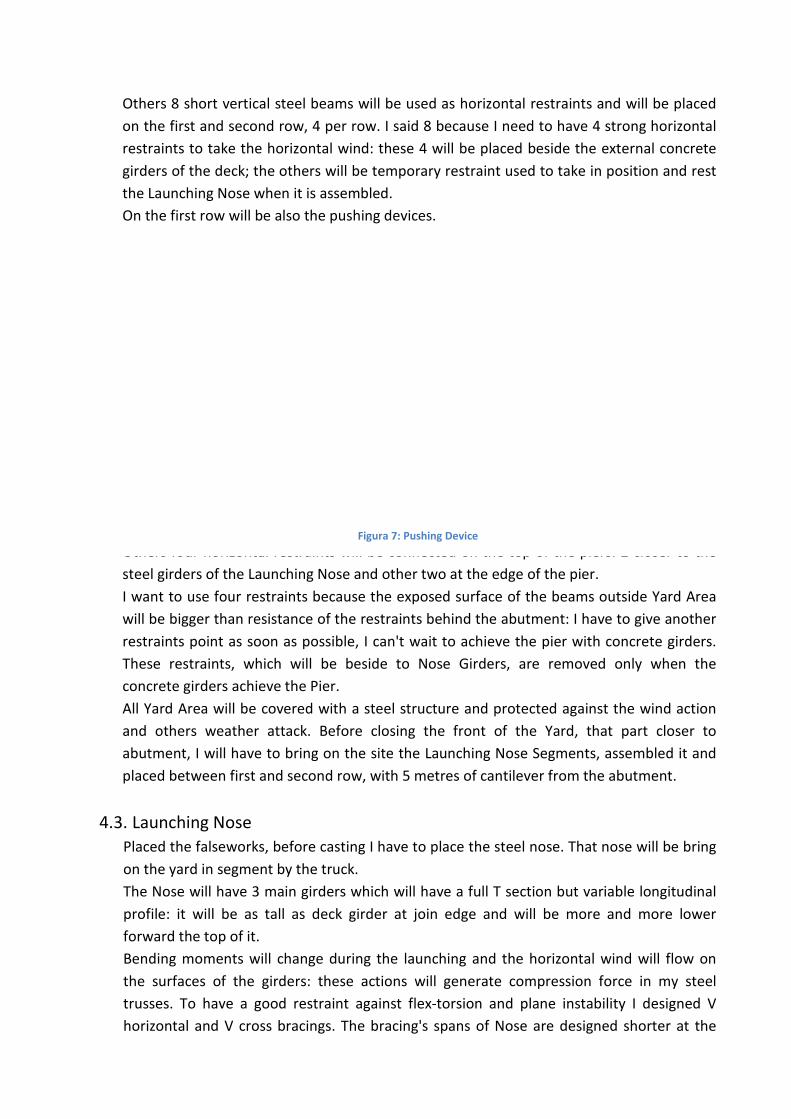
Others 8 short vertical steel beams
on the first and second row, 4 per row
restraints to take the horizontal wind: these 4 will be placed beside the external concrete
girders of the deck; the others will be temporary
the Launching Nose when it is assembled.
On the first row will be also the pushing devices.
Others four horizontal restraints
steel girders of the Launching Nose and other two at the edge of the pier.
I want to use four restraints
will be bigger than resistance of the
restraints point as soon as possible
These restraints, which will be beside to Nose Girders, are removed
concrete girders achieve the Pier.
All Yard Area will be covered with a steel structure and protected ag
and others weather attack. Before closing the front of the Yard, that part closer to
abutment, I will have to bring
placed between first and second row, with 5 metres of cantilever from the abutment.
4.3. Launching Nose
Placed the falseworks, before casting I have to place the steel nose.
on the yard in segment by the truck.
The Nose will have 3 main girders
profile: it will be as tall as deck
forward the top of it.
Bending moments will change during the launching and the horizontal wind will flow on
the surfaces of the girders: these actions will generate compression force in my steel
trusses. To have a good
horizontal and V cross bracings
steel beams will be used as horizontal restraints
on the first and second row, 4 per row. I said 8 because I need to have 4 strong horizontal
to take the horizontal wind: these 4 will be placed beside the external concrete
; the others will be temporary restraint used to take in position and
the Launching Nose when it is assembled.
will be also the pushing devices.
restraints will be connected on the top of the pier
of the Launching Nose and other two at the edge of the pier.
restraints because the exposed surface of the beams outside Yard Area
will be bigger than resistance of the restraints behind the abutment: I have to give another
point as soon as possible, I can't wait to achieve the pier with concrete girders.
, which will be beside to Nose Girders, are removed
concrete girders achieve the Pier.
All Yard Area will be covered with a steel structure and protected ag
and others weather attack. Before closing the front of the Yard, that part closer to
abutment, I will have to bring on the site the Launching Nose Segments, assembled it and
placed between first and second row, with 5 metres of cantilever from the abutment.
Placed the falseworks, before casting I have to place the steel nose. That nose will be bring
e yard in segment by the truck.
main girders which will have a full T section but variable longitudinal
as tall as deck girder at join edge and will be more and more
Bending moments will change during the launching and the horizontal wind will flow on
the surfaces of the girders: these actions will generate compression force in my steel
trusses. To have a good restraint against flex-torsion and plane instabili
horizontal and V cross bracings. The bracing's spans of Nose are designed shorter at the
Figura 7: Pushing Device
restraints and will be placed
I said 8 because I need to have 4 strong horizontal
to take the horizontal wind: these 4 will be placed beside the external concrete
used to take in position and rest
will be connected on the top of the piers: 2 closer to the
of the Launching Nose and other two at the edge of the pier.
because the exposed surface of the beams outside Yard Area
behind the abutment: I have to give another
, I can't wait to achieve the pier with concrete girders.
, which will be beside to Nose Girders, are removed only when the
All Yard Area will be covered with a steel structure and protected against the wind action
and others weather attack. Before closing the front of the Yard, that part closer to
on the site the Launching Nose Segments, assembled it and
placed between first and second row, with 5 metres of cantilever from the abutment.
That nose will be bring
but variable longitudinal
join edge and will be more and more lower
Bending moments will change during the launching and the horizontal wind will flow on
the surfaces of the girders: these actions will generate compression force in my steel
torsion and plane instability I designed V
The bracing's spans of Nose are designed shorter at the

Launching of Prestressed Bridge_Case Study
beginning than the end because I will show in next chapter that I will have the biggest force
closer to deck's side.
The main girders will be connected to deck at Beam 2, Beam 3 and Beam 4, its interaxle will
be 2.9 m. The joint Nose-Deck will be realised with coach screws, Rib and a plates. This last
one will have some holes due to head anchorages on the edge face of beams.
The width of main girder's web will make Girder sure against shear instability, but I
designed the cross Stringer every cross bracing's span, also because every section of main
girder will be placed on the support every time it will achieve one Pier and the shear force
will be more and more strong until the front side of deck will be on the support. It is for
this reason that I have more cross Stringer closer to the front of deck than the top of Nose.
Figura 8: Sections of Nose

Figura 9: Plan and Prospect of Nose

I thought about some problems due to deflection of the Nose while I will achieved the Pier.
So I thought to set 3 jacks in the front of the Nose to recover the lowering.
Figura 10: Jack in front of every Main Girder
4.4. Casting: Beams shape and Path tendons.
Everything is ready for casting. The casting rate has managed to save much time as
possible: I will cast segments 25m length. When the reinforcements are assembled behind
the casting zone, I will push them into position to placed the vertical falsework which will
be placed into preordained holes and rest with some slope strut. It will be cast 5 beams
and 2 diaphragm (except the first segment that will have 3 diaphragms) every 15 days. To
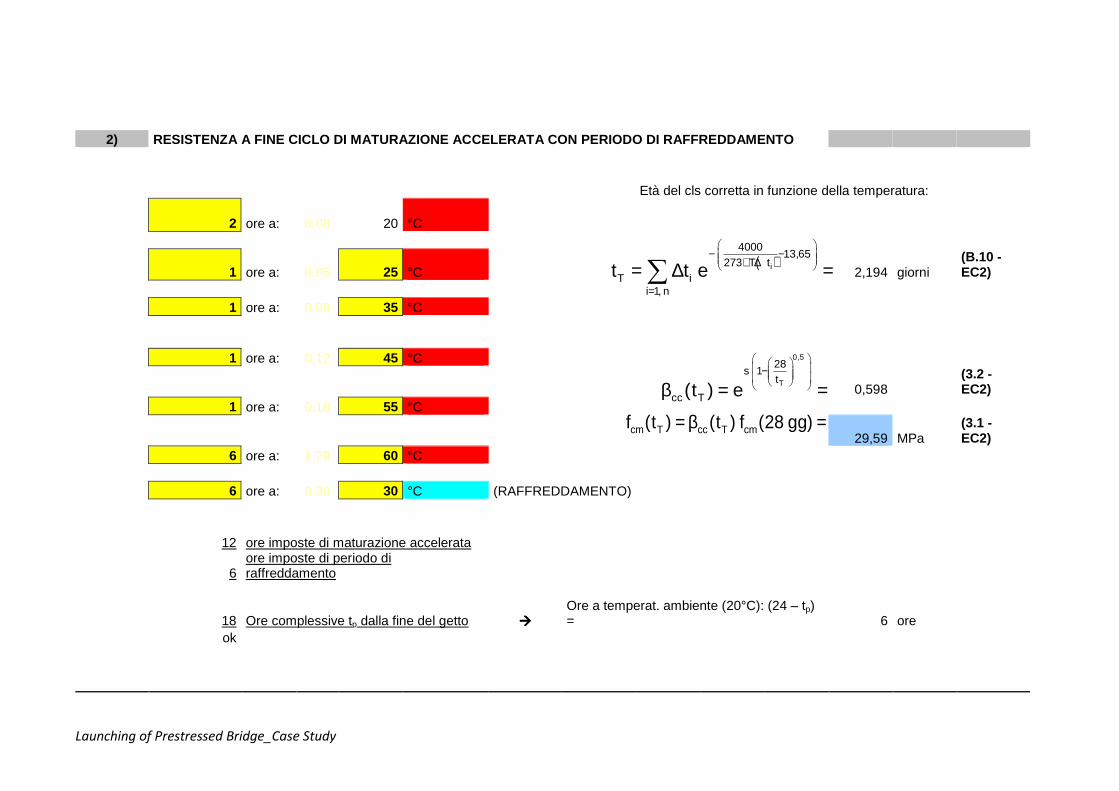
achieve this rate I will have to use fast curing of concrete. I explain the process below:

0) DATI DI PROGETTO COMUNI
Tipo di cemento
Cemento: CEM 42.5 R, CEM 52.5 N, CEM 52.5 R
coefficiente "s": 0,20
fcm(28 gg) = 49,5 MPa (da prospetto 3.1. - EC2)
1) RESISTENZA A COMPRESSIONE A "t" GIORNI, CON MATU RAZIONE NATURALE A 20° C
1,000 (3.2 - EC2)
Età cls espressa in giorni: t = 13 giorni 45.08 MPa (3.1 - EC2)
0,528
s 1t
cc (t) e
− β = =
cm cc cmf (t) (t) f (28 gg)= β =
Launching of Prestressed Bridge_Case Study
2) RESISTENZA A FINE CICLO DI MATURAZIONE ACCELERAT A CON PERIODO DI RAFFREDDAMENTO
Età del cls corretta in funzione della temperatura:
2 ore a: 0,08 20 °C
1 ore a: 0,05 25 °C 2,194 giorni (B.10 - EC2)
1 ore a: 0,08 35 °C
1 ore a: 0,12 45 °C
0,598 (3.2 - EC2)
1 ore a: 0,18 55 °C
29,59 MPa (3.1 - EC2)
6 ore a: 1,29 60 °C
6 ore a: 0,39 30 °C (RAFFREDDAMENTO)
12 ore imposte di maturazione accelerata
6 ore imposte di periodo di raffreddamento
18 Ore complessive tp dalla fine del getto ����
Ore a temperat. ambiente (20°C): (24 – tp) = 6 ore
ok
( )i4000
13,65273 T t
T ii 1, n
t t e
− − + ∆
=
= ∆ =∑
0,5
T
28s 1
t
cc T(t ) e
− β = =
cm T cc T cmf (t ) (t ) f (28 gg)= β =

Launching of Prestressed Bridge_Case Study
3) RESISTENZA A COMPRESSIONE CLS AL TEMPO "t" CON M ATURAZIONE ACCELERATA (vedere ciclo termico in alto )
Tempo dell’intero ciclo termico: t = tp = 18 ore
Resistenza a compressione fcm(tT) = 29,59 MPa
0,925 (3.2 - EC2)
Tempo di maturazione (equivalente): tT = 2,194 giorni
45,76 MPa (3.1 - EC2)
Tempo t in cui si vuole calcolare la resistenza del cls: 13,0 giorni (giorni dalla data del getto)
Tempo maturazione reale a 20°C: t20°C = 12,25 giorni
Tempo complessivo ttot = tT + t20°C
= 14,444 giorni
0,5
tot
28s 1
t
cc tot(t ) e
− β = =
cm tot cc tot cmf (t ) (t ) f (28 gg)= β =

How is evident to see I earn 2 days with this method.
The path of the tendons is managed to achieve:
- Path 0: the end of launching.
Devices: Tendons, Anchorages and Couplers 2x6831 (31 strands) upside, 2x6822 (22
strands) downside.
σpi = 1280 N/mm² because it is strong enough to launch the bridge, and it leaves a
range of stress between t = 140 days and t = 00 which permit to respect the Q.p.
limit of compression in the upper side of beam (0.45 fck).
- Path 1: the casting of slab.
Devices: Tendons, Anchorages 6822 (22 strands).
σpi = 1395 N/mm²
- Path 2: the life service.
Devices: Tendons, Anchorages 6831 (31 strands).
σpi = 1395 N/mm²
Regarding "Path 0", I thought to use an horizontal path because I have a lot of inversion
Moment sign, so it wouldn't be useful to use a curve Path for this phase, although I used
an eccentric linear tendons to advantage the resistance against Hogging bending Moment
in Concrete beams and reduce the Sagging Moment in the Nose when it achieve the Pier. I
use couplers at the Edge of every segments to prestress them.
Regarding "Path 1", I use a parabolic path of tendons to help the concrete Beams to
support the casting slab, especially in that section where I know how is the Moment
graph:
- tendons are closer to bottom side of Beam in the section where the Moment is positive.
- tendons are closer to Neutral axis of Beam in the section where the Moment is zero.
- tendons are closer to upper side of Beam in the section where the Moment is negative.
This path produce also a Positive Moment on the support (important to avoid the slab's
cracking) but produce a big shear force in the sections where the anchorage is installed
and not to produce Positive Moment.
The names of the Path is "S" and the tendon's names are assigned referring at the name of
Spans which start from Abutment 1:
- Span 1: S1.
- Span 2: S2.
- Span 3: S3.
- Span 4: S4.
I use one whole tendon for every S without couplers.

Launching of Prestressed Bridge_Case Study
Regarding "Path 2", it acts to a composite section beam-slab and it is disposed on the
upper side of Path 1 tendons. It is bigger than Path 1 but the reasons of its use are the
same of Path 1.
The names of the Path is "F" and the tendon's names are assigned referring at the name of
Spans which start from Abutment 1:
- Span 1: F1.
- Span 2: F2.
- Span 3: F3.
- Span 4: F4.
I use one whole tendon for every F without couplers.

SEGMENT 1_SPAN 1
Figura 11: Segment 1
SEGMENT 2_SPAN 1
Figura 12: Segment 2

Figura 13: Section Z-Z

Figura 14: Section A-A

Launching of Prestressed Bridge_Case Study
Figura 15: Section's B-B and C-C

Figura 16: Section D-D

Launching of Prestressed Bridge_Case Study
SEGMENT 3_SPAN 2
Figura 17: Segment 3
SEGMENT 4_SPAN 2
Figura 18: Segment 4
SEGMENT 5_SPAN 3
Figura 19: Segment 5

Launching of Prestressed Bridge_Case Study
SEGMENT 6_SPAN 3
Figura 20: Segment 6
SEGMENT 7_SPAN 4
Figura 21: Segment 7
SEGMENT 8_SPAN 4
Figura 22: Segment 8

So I will prestress the different Path in different moments:
- Path 0 at the launching phase (between t = 0 and t = 140 days; by t = 0 I mean after 15
days from the segment casting).
- Path 1 at the end of launching phase when I achieve the static configuration (t = 140
days).
- Path 2 at the end of casting slab (t = 200 days).
I had to resolve the disposal of head anchorage on the edge faces of beams per segments
because I had to respect the distance between tendons for concentrating of stress. How is
possible to watch on the Beam's prospect I made the section thicker at the edge of
segment than the mid span; so I have a rectangular beam every 25 metres and its length
is:
- 7 metres across the Pier.
- 1 metres in the mid span of the Pier distance.
In these section I will join the tendons between 2 different segments using the coupler.

Launching of Prestressed Bridge_Case Study
4.5. Launching.
4.5.1. Introduction
I said in previous chapter that I want to cast 25 metres of segment every 15 days and
stress the "Path 0" tendons just at 15th day. So I will use the following format in order to
explain construction rate and the phases I have studied:
Figura 23: Example of Launching Stages

I will use this nomenclature to describe Launching rate:
• "t = ..." means the number of days that have passed since casting day of the first
segment.
• morning, afternoon and Evening mean different moment of the same pushing rate:
I will start to push at the Morning and I will end at the evening. The different
number of "afternoon" are used to underline an intermediate phase during the
Launching that it is critic for design: it is one of the worst-scenario.
• The Rows, where Slide support will be placed, of casting Yard are changed the
Name in:
- First Row is changed in "C"
- Second Row is changed in "B"
- Third Row is changed in "A"
But I have to precise that I will use Snug tendons in my calculations; so I have to pump
grout inside ducts waiting 14 days for its hardening. To give these 14 days to ducts, I will
push segments on the supports "C" and "B" (first and second row), so I will have the Yard's
Area free for another segment's casting which will need to other 15 days before
prestressing and pushing.
Figura 24: Plan of Falseworks
In this period the grout will harden and the tendons will be snug when I push the new
segment. So I can resume this process as following:
1 day for casting
+ 13 days for hardening (1 day for prestressing)
+ 1 day for pushing
= 15 days.
During the 13 days of waiting, I will assemble the reinforcement cage, so it will be ready to
be pushed onto Casting Area.

Launching of Prestressed Bridge_Case Study
If I have to cover 200 metres I need to cast 8 segments which are 25 metres length, so I
need to 15 days x (8 segments + 1 Nose lenght) = 135 days but I take in account in my
calculation 140 days.
4.5.2. Preliminary Verification of Equilibrium (EQU).
After this revision, I could show the casting rate to study the force's behaviour inside the
deck and Nose but I think it is preparatory checking the equilibrium of the cantilever in the
first stages of launching. My aim is to have restraint's reaction upwards without the use of
counterweight:
Figura 25: Equilibrium Scheme
The combination that gives this result is:

Launching of Prestressed Bridge_Case Study
SLU_EQU: 1.1 G,destab + 0.9 G,stab + 1.5 x q vert,w
where q vert,w = 0.4 KN/m per steel girder.
q vert,w = 0.74 KN/m per concrete girder.
I calculated the q,wind with:
- TR = 10 years (3 months < Reference period of launching < 1 year) that gave c,prob =
0.90248 to apply to Vb = c,prob x Vb,0 = 22.56 N/mm².
- qb = 0,5x ρ x Vb² = 318,153 N/mm²
- z = 8 m.
- Roughness class: D
- Zone: 3.
- Cat. esp. site: 4.
- Kr = 0.19
- z0 = 0.05 m.
- ce(z=8m) = 2.21
4.5.3. Structural Analysis (STR).
4.5.3.1. Comparison between
After checking SLU_EQU, I have to choose how many Main Steel Girder of Nose I have to
use. In order to decide it, I use SLU_STR combination:
SLU_STR: 1.3x G + 1.5 x (q vert,w + q horiz,w) + G sett
where:
- q horiz,w is calculated to take in account parallel girders:
concrete
beams μ
c 3.3.10.4.2
NTC08
Case 2g:
steel beams μ
c 3.3.10.4.2
NTC08
Beam1 2,16789 KN/m
Beam1 2,16789 KN/m
Beam2 0,2 0,43358 KN/m
Beam2 0,3697 0,80146 KN/m
Beam3 0,2 0,08672 KN/m
Beam4 0,2 0,01734 KN/m
Case 3g:
steel beams μ
c 3.3.10.4.2
NTC08
Beam5 0,2 0,00347 KN/m
Tot 2,709 KN/m
Beam1 2,16789 KN/m
Beam2 0,2 0,43358 KN/m
Beam2 0,2 0,0867
- G sett: I have to take in account almost 10 mm between the Pier.
By "Case 2g" and "Case 3g" I mean 2 scenarios I have studied:
• Case 2g: Nose has 2 Main Steel Girders.
• Case 3g: Nose has 3 Main Steel Girders.

Launching of Prestressed Bridge_Case Study
In fact, I have showed in Paragraph "Nose" an Launching Nose with 3 Main Steel Girders
but I want to compare the differences between this Case to a Case with Nose has 2 Main
Girders.
These are all Main Phases I analyse:


Launching of Prestressed Bridge_Case Study

Launching of Prestressed Bridge_Case Study

Launching of Prestressed Bridge_Case Study

Launching of Prestressed Bridge_Case Study

Launching of Prestressed Bridge_Case Study

Launching of Prestressed Bridge_Case Study

Launching of Prestressed Bridge_Case Study

Launching of Prestressed Bridge_Case Study

Launching of Prestressed Bridge_Case Study

Launching of Prestressed Bridge_Case Study
Figura 26: Launching Rate

Analysing Launching Rate, I expect to have the worst scenarios in the following phases:
• Biggest Sagging Bending Moment.
In this stages I have:
Launching scheme of
Bridge_ Stage:
M+ in the last Mid. Span (KNm)
Case 2g Case 3g
t = 45 Evening 12880 12230
t = 75 Evening 11060 10080
t = 105 Evening 10700 10255
• Biggest Hogging Bending Moment.
In this stages I have:
Launching scheme of Bridge_
Stage:
M- on the last support before cantilever (KNm)
Case 2g Case 3g
t = 30 afternoon 2 - 20520 -22555

Launching of Prestressed Bridge_Case Study
There wouldn't be so big differences between two Cases but I have to take in account that
I could have some problems in Joint section between Deck and Nose because there is a big
difference of stiffness. In order to check this, I have created 5 intermediate phases for
every un-pair stage of the afternoon and I have studied their stresses naming this section
"Z":
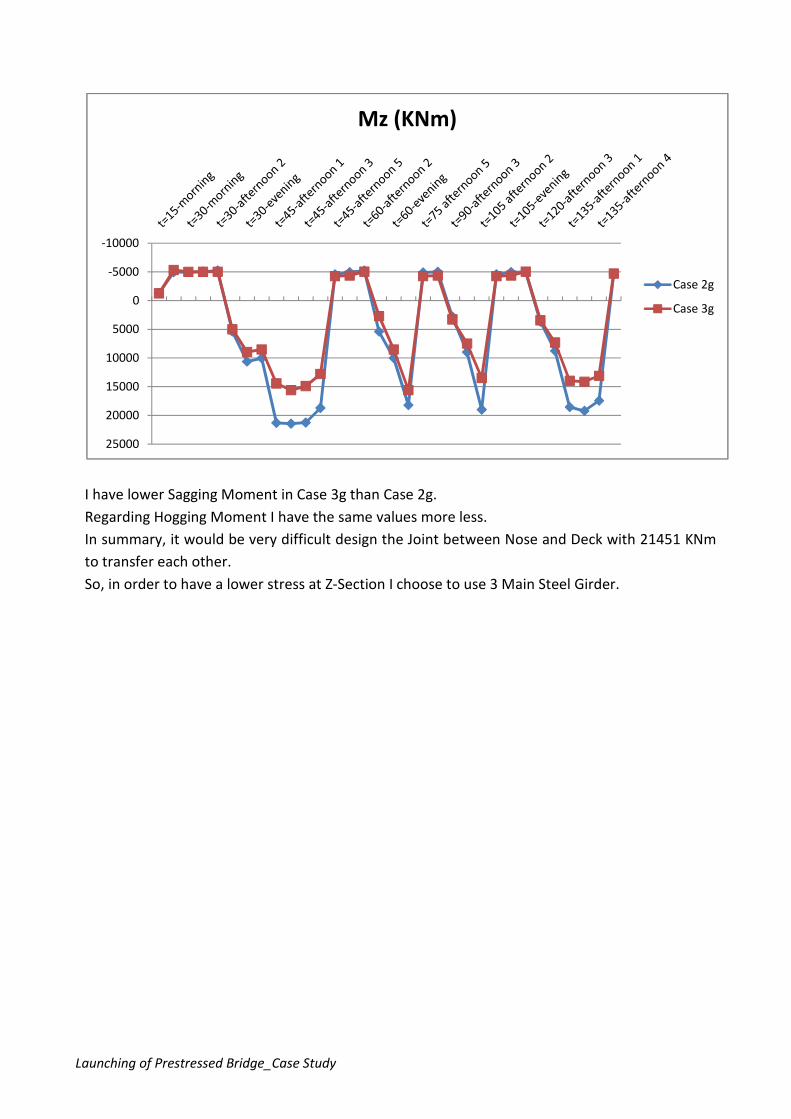
Mz (KNm) Case 2g Case 3g
t=15-morning -1304 -1255
t=15-evening -4935 -5321
t=30-morning -4950 -5000
t=30-afternoon 1 -5032 -5010
t=30-afternoon 2 -5227 -5020
t=30-afternoon 3 5402 5000
t=30-evening 10634 8960
t=45-morning 10045 8525
t=45-afternoon 1 21312 14421
t=45-afternoon 2 21451 15600
t=45-afternoon 3 21267 14900
t=45-afternoon 4 18720 12800
t=45-afternoon 5 -4563 -4251
t=45-evening -4950 -4351
t=60-afternoon 2 -5227 -5030
t=60-afternoon 3 5415 2700
t=60-evening 10030 8525
t=75 afternoon 2 18230 15600
t=75 afternoon 5 -4900 -4251
t=75 evening -5000 -4351
t=90-afternoon 3 2810 3280
t=90-evening 8985 7480
t=105 afternoon 2 19000 13500
t=105 afternoon 5 -4563 -4251
t=105-evening -4950 -4351
t=120-afternoon 2 -4980 -5030
t=120-afternoon 3 3676 3440
t=120-evening 8773 7311
t=135-afternoon 1 18563 13970
t=135-afternoon 2 19225 14130
t=135-afternoon 4 17444 13100
t=135-afternoon 5 -4600 -4700
Max 21451 15600
Min -5227 -5321
Launching of Prestressed Bridge_Case Study
I have lower Sagging Moment in Case 3g than Case 2g.
Regarding Hogging Moment I have the same values more less.
In summary, it would be very difficult design the Joint between Nose and Deck with 21451 KNm
to transfer each other.
So, in order to have a lower stress at Z-Section I choose to use 3 Main Steel Girder.
-10000
-5000
0
5000
10000
15000
20000
25000
Mz (KNm)
Case 2g
Case 3g

4.5.3.2. Summary of stress in SLU and SLE combination.
After choosing Main Girder's number of the Nose, I am able to show a table with all values of stress in the Deck during the
Launching at every stage:

Launching of Prestressed Bridge_Case Study

It is evident that the first Launched stages are more engaged than the other until t = 45
evening. I want to underline the difference between:
- extreme stage: morning and evening.
- intermediate stage: the afternoon stages.
- pair stages (ex: 30, 60 ...)
- impair stages (ex: 15, 45 ...)
They will help me to explain what I did.
4.5.3.3. Reinforced beams Check.
Firstly, I want to underline the biggest force in concrete beam in the segments where the
concrete won't be completely hardening and the grout will have been hardening:
System
t =
SLU SLE_ characteristic
Moment 33 The biggest 30th day_evening -15300 KNm
Moment 33 The biggest 45th day_evening -12260 KNm
Moment 33 The 2nd biggest 30th day_evening -11500 KNm
Moment 22 30th day_afternoon 2 1215 800
Shear 45th day_evening 2004 /
To find these bigger values I did the follow consideration:
- Moment 33: I took that moment from Group Ma Mb Mc Mc*; in this group I put the Mc
values at evening configuration and Ma Mb Mc* at every configuration. I want to put the
attention on Mc*: it is the first section of new casted segment where there is the joint
between completely hardened deck and reinforced new casted beam; it is always placed
between (or on) support "A" and "B". I notice that Mb is relevant until the achievement of
Pier 1, later this value is lower than before. This is normal because force changes are
concentrated in the top of the deck, every step of launching send away this part from the
Abutment 1 (because Rb value go down). Regarding Ma the value is repetitive because it is
connected with the 10 metres of cantilever at every morning stage.
- Moment 22: I have just taken the biggest value acting . To find it I followed the biggest
values of Fi Horizontal restraint's reactions; I have them when there is a Double T section
beside the restraint and I don't have the joint between beams and diaphragm; so I am
sure that it is the biggest M22.
- Shear: it is the more variable force but I have found the biggest shear of all
configurations I draw. The values are closer to each other.
- Fi horizontal restraint's reaction: I found it checking out the pair afternoon 2
configuration because it is the longer cantilevered configuration which is exposed to wind
action.
In these sections I will have an reinforced concrete section under external prestress.

Launching of Prestressed Bridge_Case Study
To calculate the section's ultimate bending resistance I used an axial force from prestress
at t = 30 days (15 days after prestressing):
N.(t = 30) = 17185 KN
and I took in account the friction loss as I would have the lower axial force at the dead-end
anchorage in all length of beam, a reduced fcm of concrete at 15 days of ripening as I
showed in the chapter above:
fcm = 45.76 N/mm²
fcd = 21.39 N/mm²
I calculated the resistance under combined compressive and bending moments (N, M33,
M22 interaction) by Gelfi_Vca SLU program; the safe ray at N.(t = 30) is:
Rectangular section: ρ = 0.79 < 1
Double T section: ρ = 0.94 < 1
Regarding the Shear, I have to design the shear key thinking at all life of the bridge
because they will work also when the launching is end: I couldn't just count on epoxy glue.
So I have to take in account the biggest Shear Force in the section on the Pier during all
bridge's life:
• Shear_ during launching = 2004 KN
• Shear_ maximum absolute Bridge's life = 3404 KN
To overcome these I placed 3 rows of keys on that zones I am sure that there will be
compressive all the time: I will have the shortest neutral axis when I am at t = 140th day
because I have the lowest pre-compression inside the beam; so in the ultimate state limit I
will have 65cm of neutral axis length from upper (Sagging Moment) and lower Beam's side
(Hogging Moment) and I placed in this length my keys which have the following resistance:
Vrd = 1.4 fcd(t=15) x (t x b) x n°keys =
= 1.4 x 21,72/10 x [(2.5 x 135) x 3 + (2.5 x 43)x 4] = 4390 KN I used the lower fcd I could have in it during the life, like I did before.
The shear resistance is stronger than force.

Launching of Prestressed Bridge_Case Study
Figura 27: Key of Shear Detail's

Regarding SLE_STR I used as Resistance parameters Crack Moment, widening Moment
limit. To math these I used:
1) Crack Moment (Mf):
I find it with the following input date:
• N.(t = 30)
• geometrical dimensions of section and reinforcement.
• when the upper fibre achieve fctd = fctm(t=15th day)/1.2 = 2,84 N/mm².
• Jomog y( ) Somog y( ) e y M, ( )⋅− 0=
2) Crack spacing's Moment limit (Mof):
I find it with the following input date:
• N.(t = 30)
• geometrical dimensions of section reinforcement.
• when the upper fibre achieve w1 = 0.2 mm:
where:
σs = stress limit in the reinforcement bars
when the section is cracked.
So I found:
SLE_Rd Mf Mof
Rectangular section -11750 KNm -14250 KNm
Double T section bigger bigger
The beams will not crack except at t = 45 evening stage when it happen, but the crack's
widening will be checked and they will be able to close themselves when P1 is applied.
4.5.3.4. Prestressed beams Check.
Secondly, I want to check every section during the Launching.
From the Launching tables I showed Moment values on every Piers and at fix Z section
which is the deck's edge, where it is collocated the Nose-deck joint. The values are
referred to deck, I will show the most important force of Nose later.
The eccentric prestress P0 helps my sections in every stage and in every combination:
- SLU: the biggest stress in general section is an Hogging Moment; so it gives a bigger
steel area where I need.
- SLE: it put down the Hogging Moment Stress on the supports increasing the
Sagging moment that is low, but it doesn't make any worse effects in impair-
afternoon stages where the geometry gives to the Nose a stiffness which takes the
0.00048151802183638329σ s
21000000
0.20474947966758143778
σ s−

Launching of Prestressed Bridge_Case Study
Edge Beam's Moment: the effect is a Negative Moment in the Nose and the null
Moment in the beams.
As in 4.5.1, I find the Mrd_SLU for Double T and Support section but this time I
used the full fcd from fcm(28days) = 49.5 N/mm². I also remembered to have a
Prestress beam (aderence Prestressed cable) at these stages, so I considered to
have an σP0:
σP0(t = 140 days) = 1116 N/mm² for SLE checks.
σP0(t = 0 days) = 1280 N/mm² for SLU checks.
The checks are:
Rectangular section: ρ = 0.78 < 1
Double T section: ρ = 0.89 < 1
Regarding the SLE check, if I check the widening Moment limit in the Support
section I am sure that it will be checked also in the Double T section:
1) Crack Moment (Mf):
I found it with the following input date:
• N(140days) = 16561 KN
• geometrical dimensions of section, reinforcement and cables.
• when the upper fibre achieve fctd = fctm(t=28th day)/1.2 = 3 N/mm².
• Jomog y( ) Somog y( ) e y M, ( )⋅− 0=
2) Widening Moment limit (Mof):
I found it with the following input date:
• N(140days) = 16561 KN
• geometrical dimensions of section, reinforcement and cables.
• when the upper fibre achieve w1 = 0.3 mm:
where:
σs = stress limit in the reinforcement bars
when the section is cracked.
System
t =
SLU SLE_ characteristic SLE_ characteristic
Without Z-section
Moment 33 30th day_evening -22555 KNm
15600 KNm
-15365
12660
10130
Moment 22 30th day_afternoon 2 1100 -
εsmσs
21000000
0.5σsr002⋅
21000000
1
σs⋅−

Launching of Prestressed Bridge_Case Study
So I have:
SLE_Rd Mf Mof (w = 0.3mm) Mof (w = 0.2mm)
Rectangular section -12300 KNm -17500 KNm -14700
Double T section bigger bigger -17000
Even if the biggest values of M33 acts in Double T section I make the Girder sure
because the value of Mof (w = 0.3mm) of Rectangular section is bigger than
4.5.3.5. Nose.
4.5.3.5.1. Beam's check.
As I said I used the Nose to make the cantilever lighter.
My first worry is the flex-torsion instability phenomenon in Main girder. To make
the Nose sure I connect:
• the lower flange to V horizontal bracings, which are shorter closer to the
joint Nose-Deck because I have the biggest Moment and Axial force
there.
• the upper flange to V cross bracings for the same reason.
But these bracings are also stressed to Axial force which come from horizontal
wind action.
I found the following worst-case scenarios:
- M33 is the biggest when Z-section is at 13.5 m from the closer Pier: they
are t = 45 afternoon 2, t = 75 afternoon 2, t = 105 afternoon 2, t = 135
afternoon 2.
- V22 is the biggest when Z-section is almost on Pier: they are t = 45
afternoon 5, t = 75 afternoon 5, t = 105 afternoon 5, t = 135 afternoon 5.
- M22 is bigger every time the Nose is cantilevered.
- Regarding N I want to spend some words: N of Nose's main girders
increase every step of launching because the increase of deck's length
increase the number of diaphragms that increase stiffness of it; the
Nose's axial force generate a couple that create like an hollow which
make M22 in the steel girder lower.
The biggest values of N are at t = 120 afternoon3 because I have the
biggest value of F into the new horizontal achieved restraint. For
example, if I do a comparison between the following steps:
t = 30 afternoon3 Fd = 109 KN
t = 30 evening Fc = 271 KN Fd = 75 KN
t = 60 afternoon3 Fe = 130 KN
t = 60 evening Fd = 307 KN Fe = 70 KN
Launching of Prestressed Bridge_Case Study
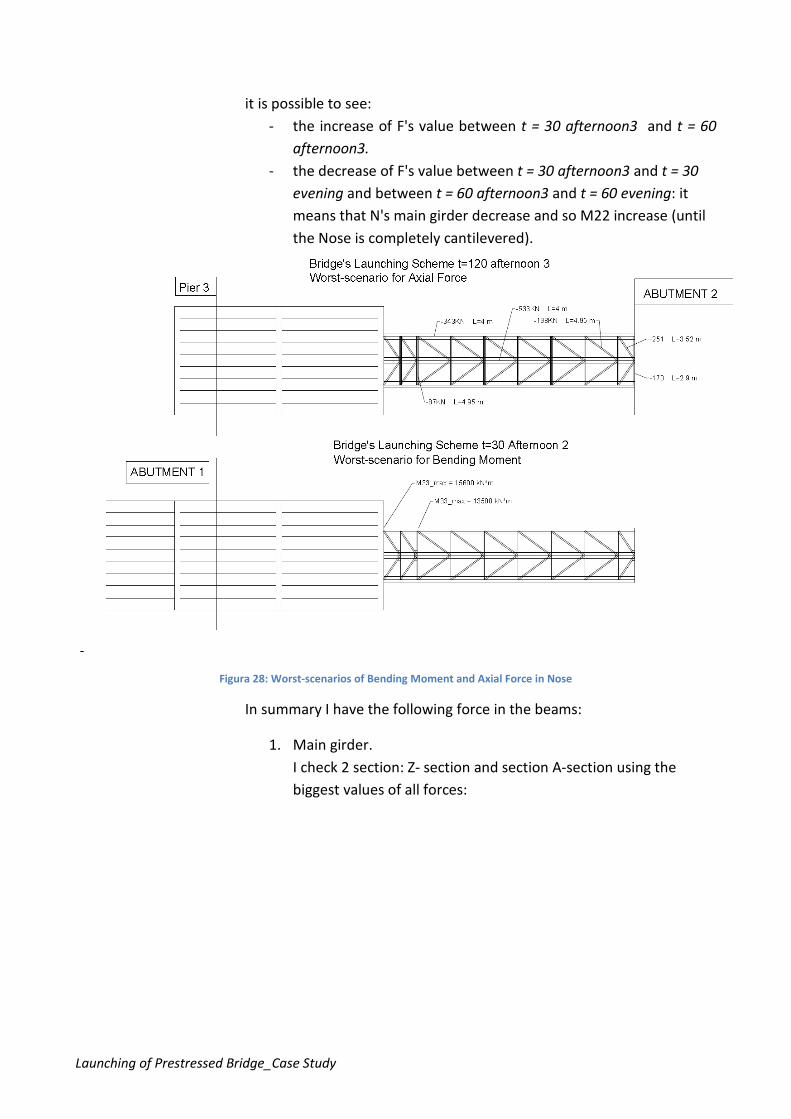
it is possible to see:
- the increase of F's value between t = 30 afternoon3 and t = 60
afternoon3.
- the decrease of F's value between t = 30 afternoon3 and t = 30
evening and between t = 60 afternoon3 and t = 60 evening: it
means that N's main girder decrease and so M22 increase (until
the Nose is completely cantilevered).
-
Figura 28: Worst-scenarios of Bending Moment and Axial Force in Nose
In summary I have the following force in the beams:
1. Main girder.
I check 2 section: Z- section and section A-section using the
biggest values of all forces:
Launching of Prestressed Bridge_Case Study
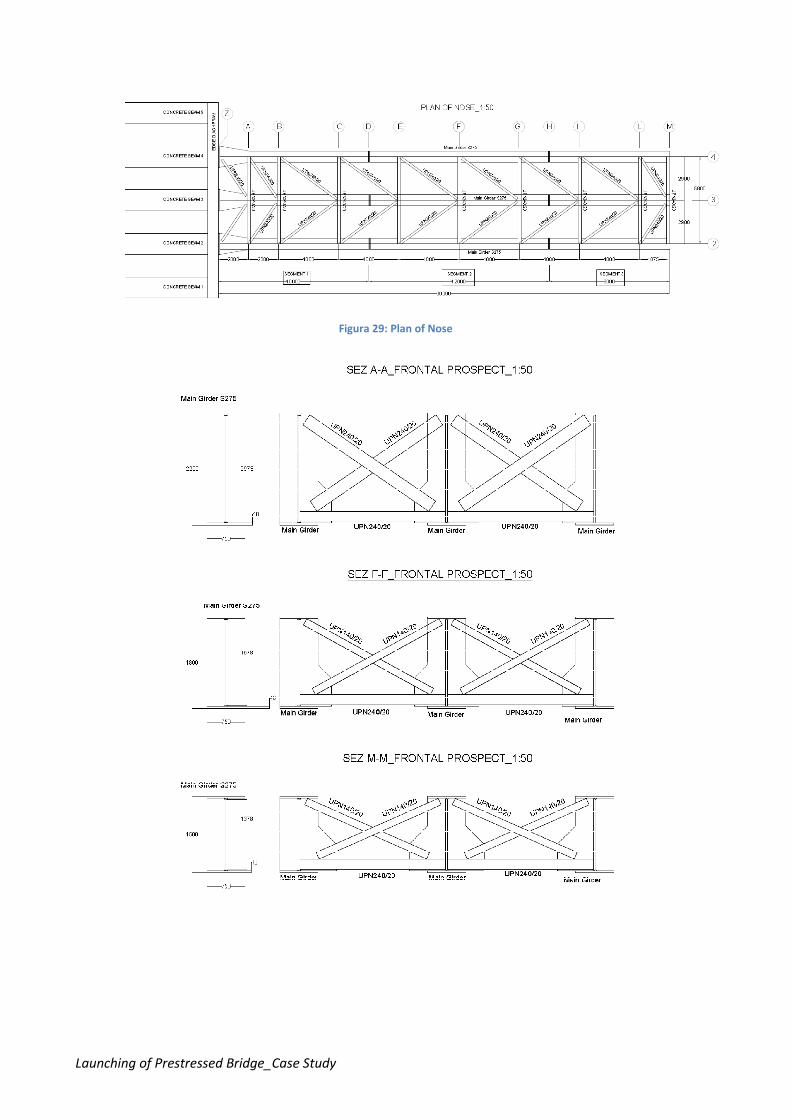
Figura 29: Plan of Nose

Launching of Prestressed Bridge_Case Study
Figura 30: Nose's Sections
M33_Z = 15600 KNm M33_A = 13500 KNm
M22 = 280 KNm N = 533 KN
V = 4259 KN h = 2.2 m L = 2 m
I have to check this formula:
Ned*γM1/(χmin*fyk*A)+My,ed,eq*γM1/(Χlt*Wy*(1-Ned/Ncrit)*fyk)+
+Mz,ed,eq*γM1/(Wz*(1-Ned/Ncrit)*fyk) ≤1
SECTION A-A: ρ = 0.67 < 1
SECTION Z-Z: ρ = 0.54 < 1
I don't take in account the Ribs in this last check.
In order to make me sure, I check also F-F section with same force of A-
A section but with Lo,z = 4 m:
SECTION F-F: ρ = 0.71 < 1
2. Cross V bracing first half span: I use 2UPN240/20
N(M) = 0.1 x 15600/2.2 = 710 KN L = 3.64 m
Nb,Rd = χmin*A*fyk/γM1= 1234 KN
Ned/Nb,Rd = 0.57 ≤ 1
Cross V bracing second half span: I use 2UPN140/20:
N(M) = 0.1 x 4000/2.2 = 181 KN
Ned/Nb,Rd = 0.41 ≤ 1

Launching of Prestressed Bridge_Case Study
1. Long Horizontal V bracing: I use 2UPN240/20
N(M) = 0.1 x 9000/2,2+75= 484 KN L = 4.95 m
Nb,Rd = χmin*A*fyk/γM1= 810 KN
Ned/Nb,Rd = 0.59≤ 1
2. Short Horizontal V bracing: I use 2UPN240/20
N(M) = 0.1 x 15600/2.2 + 115 = 825 KN L = 3.52 m
Nb,Rd = χmin*A*fyk/γM1= 1281 KN
Ned/Nb,Rd = 0.64 ≤ 1
3. Truss: I use 2UPN240/20
N(M) = 0.1 x 15600/2.2 + 170 = 880 KN L = 2.9 m
Nb,Rd = χmin*A*fyk/γM1= 1525 KN
Ned/Nb,Rd = 0.58 ≤ 1
4.5.3.5.2. Joint Nose-Deck.
Figura 31: Plate of Anchorage

Launching of Prestressed Bridge_Case Study
In order to ensure the transfer 15600 KN m of Bending Moment I have
to use 26 M30 screws class 10.9 closer to bottom Edge of Beam. The
biggest Hogging Moment is easy to transfer with 12 M30 (it is -5321
KNm).
The plate has 6 holes for the Anchor Heads.
I could have problems into plate: the stress caused to screws are very
big. To make the joint sure I have created a Model on Sap 2000 where I
have drawn the elements of that joint with their material data
reproducing the connection between plate and flange and web of the
Nose's Main Girder. I have also add 2 Ribs at external low side in order
to make plate stiffener. I have add the same Ribs at the upside in order
to avoid instabilty of flange.

Launching of Prestressed Bridge_Case Study
Figura 32: Mesh of Anchorage's Plate
The biggest stress is underlined to blue colour which means 260 N/mm²: so I use S355.
To achieve this result I have to use an plate width of 100 mm for 500 mm how it is
possible to see in the picture above.

Launching of Prestressed Bridge_Case Study
4.6. End of Launching: static configuration.
I described all launching stage and I inserted all force's values in a table in the previous
chapter. In the last row it is possible to see "final configuration after launching" with all
values belonging this phase. This is a temporary configuration between disassembly of
Nose and stressing of the path "P1". In these days I will have the following Prestressing
scenario and these biggest Moments:
1863,9432
-536,1054
-1000
-500
0
500
1000
1500
2000
0 3 6 9 12
15
18
21
24
27
30
33
36
39
42
45
48
51
54
57
60
63
66
69
72
75
78
81
84
87
90
93
96
99
M(P0) bending Moment _KNm_ t = 140 days
M(P0),140
-16564
-20000
-15000
-10000
-5000
0
0 3 6 9
12
15
18
21
24
27
30
33
36
39
42
45
48
51
54
57
60
63
66
69
72
75
78
81
84
87
90
93
96
99
N(P0)Axial Force _ KN_t = 140 days
N(P0),140

Launching of Prestressed Bridge_Case Study
10809,3726
-15460,30603
21752,92308
-26273,38462
-30000
-20000
-10000
0
10000
20000
30000
0 3 6 9 12
15
18
21
24
27
30
33
36
39
42
45
48
51
54
57
60
63
66
69
72
75
78
81
84
87
90
93
96
99
Bending Moment_SLU _KNm_ t= 140 days
Med_SLU
Mrd_140 P0.max
Mrd_140 P0.min
9177,9016
-12529,7359
-15000
-10000
-5000
0
5000
10000
15000
0 3 6 9 12
15
18
21
24
27
30
33
36
39
42
45
48
51
54
57
60
63
66
69
72
75
78
81
84
87
90
93
96
99
Bending Moment_SLE.Qp _KNm_ t= 140 days
TOTAL

Launching of Prestressed Bridge_Case Study
From this comparison it is possible to assert that the check is satisfied.
Regarding the Shear force, I make the bridge sure because I know that the biggest force
during the Launching is:
• Shear_ during launching = 2004 KN
and at the End of Launching:
• Shear_ End of launching = 1886 KN
but if I take like max shear resistance the worst-unreal-scenario:
Double T-section whose links distance is 200 mm and their diameter is φ = 10 mm I would
have: VRd = 2985 KN. Beams don't have problem of shear resistance.
I show the effective bracket arrangement which depends to next phases, especially the
last (during the life):
9328,7876
-12720,5742
-15000
-10000
-5000
0
5000
10000
15000
0 3 6 9 12
15
18
21
24
27
30
33
36
39
42
45
48
51
54
57
60
63
66
69
72
75
78
81
84
87
90
93
96
99
Bending Moment_SLE.Rara _KN_m t= 140 days
TOTAL
12
10
9
10
11
12
13
0 4 7
11
14
18
21
25
28
32
35
39
42
46
49
53
56
60
63
67
70
74
77
81
84
88
91
95
98
φ,link_mm
φ,staffe
M33_Ed M33_Rd
SLU -15663 KNm -28000 KNm
SLE_ characteristic -12735 KNm -14700

Launching of Prestressed Bridge_Case Study
So where I wrote "6" I will have 3 links, "4" I will have 2 links and "2" I will have 1 link.
4.7. Prestressing of Path 1 "P1" and Slab casting.
As I said, I will prestress the deck before slab's casting.
I need a Prestressing force that impede crack's opening. So I use 6822 tendons which path
is showed in Paragraph 4.4.
200
150
0
50
100
150
200
2500 3 6 9
12
15
18
21
24
27
30
33
36
39
42
45
48
51
54
57
60
63
66
69
72
75
78
81
84
87
90
93
96
99
Link spacing_cm
s
6
4
2
4
6
4
2
4
6
0
2
4
6
8
0 4 7
11
14
18
21
25
28
32
35
39
42
46
49
53
56
60
63
67
70
74
77
81
84
88
91
95
98
Bracket's number
n° bracci

Figura 33: End of Launching: static configuration and Prestressing of Tendons "S"

Axial force applied at beam's edges is:
NP1(t =150) = 4296 KN
They give these benefits:
- to close the cracks on the support at final configuration after launching phase.
- avoid opening new cracks during the casting.
- to give Sagging Moment on the support and bigger compression between the
anchorage's points.
- to give a Negative Moment in the section where I have the biggest positive
moment: at 19.5m from the abutments and at 23.5m from the P1 and P3.
I have the biggest Positive moment in those sections because I manage slab's casting rate:
my purpose is to concentrate the Moments at Mid span zone to make that part of beams
on the support less stress. To make this, I have to make the Mid Span stiffener than the
other bridge's part. So after prestressing, I will cast:
- at t = 155-160 days, the Mid Span zones: "slab casting 1".
- at t = 190 days, the Zones on the support zones: "slab casting 2".
Figura 34: Casting Stages
As it is possible to see I will cast eccentric zones in the external deck spans because I have
in those parts the biggest Moments.
It has to notice that I will have different form sections during the second casting: I will
have hardening slab on the mid span and just beam's sections on the support zones.
Regarding the combinations, I use:
SLU = 1.3 x G.permanent + 1.2 x Q.wind + 1.5 x (Q.ca + Q.cc + Q.cf)
SLE_Rara = 1 x G.permanent + 1 x Q.wind + 1 x (Q.ca + Q.cc + Q.cf) + P0
SLE_Qp = 1 x G.permanent + 0.2 x Q.ca + 1 x (Q.cc + Q.cf) + P0
where: Q.ca = 0.75 KN/m²

Launching of Prestressed Bridge_Case Study
Q.cc + Q.cf = 6.25 KN/m²
I show the Moment and Axial force from P1, Moment from SLE_Qp combination, stress at
bottom and top beam's edge in the following graphs; on the abscissa's axis there are the
distance between abutment and Mid Bridge (the ordinate's values are symmetrical):
-513,5979
-3527,8558
2446,9423
7401,6486
2143,3113
-6000
-4000
-2000
0
2000
4000
6000
8000
10000
0 3 6 9 12
15
18
21
24
27
30
33
36
39
42
45
48
51
54
57
60
63
66
69
72
75
78
81
84
87
90
93
96
99
M(P1) bending Moment _ t = 140 days
P1_KNm

Launching of Prestressed Bridge_Case Study
-3777,094
-6504,392
-7356,186
-6204,953
-3437,888
-6216,903
-7193,053-8000
-7000
-6000
-5000
-4000
-3000
-2000
-1000
00 3 6 9
12
15
18
21
24
27
30
33
36
39
42
45
48
51
54
57
60
63
66
69
72
75
78
81
84
87
90
93
96
99
N(P1) Axial Force _KN_ t = 140 days
P1_KN
-23920,186
-30000
-25000
-20000
-15000
-10000
-5000
0
0 3 6 9
12
15
18
21
24
27
30
33
36
39
42
45
48
51
54
57
60
63
66
69
72
75
78
81
84
87
90
93
96
99
Total Axial Force P0+P1 at t = 140 days
N(P0+P1)_KN_ t = 140 days
-10000
-8000
-6000
-4000
-2000
0
2000
4000
6000
8000
0 3 6 9 12
15
18
21
24
27
30
33
36
39
42
45
48
51
54
57
60
63
66
69
72
75
78
81
84
87
90
93
96
99
Bending Moment_SLE.Qp t= 140 days
M33_SLE.Qp
Launching of Prestressed Bridge_Case Study
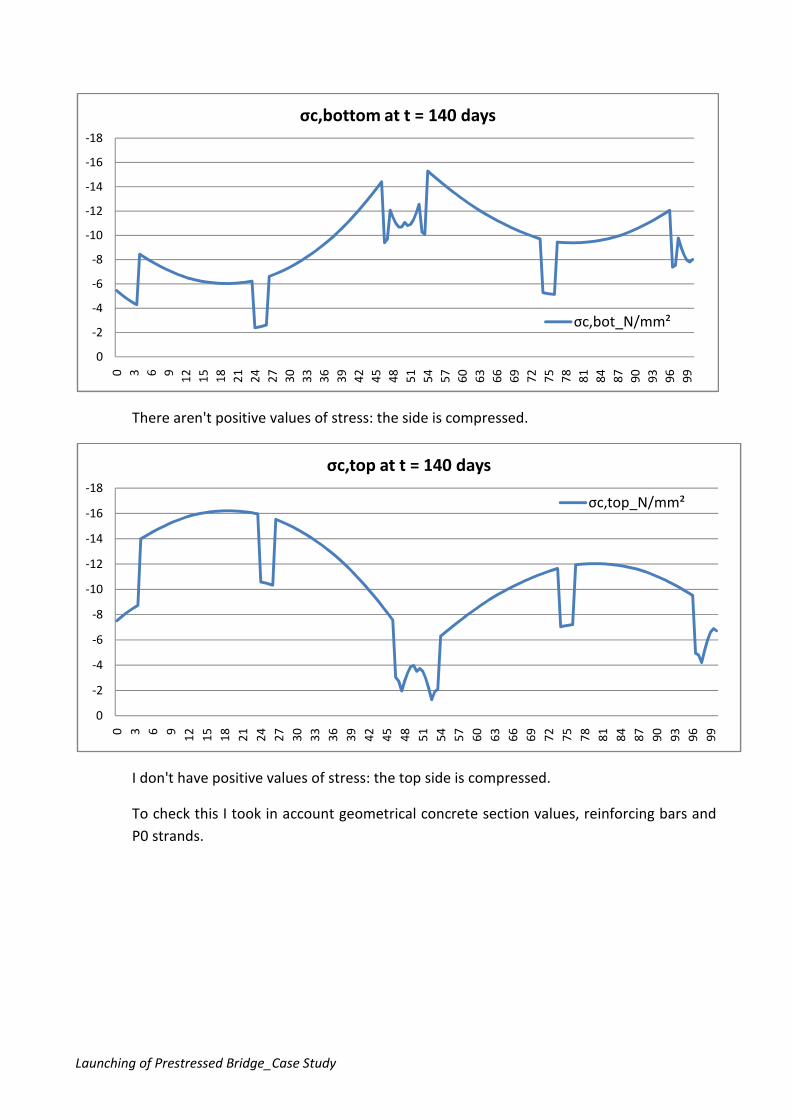
There aren't positive values of stress: the side is compressed.
I don't have positive values of stress: the top side is compressed.
To check this I took in account geometrical concrete section values, reinforcing bars and
P0 strands.
-18
-16
-14
-12
-10
-8
-6
-4
-2
0
0 3 6 9
12
15
18
21
24
27
30
33
36
39
42
45
48
51
54
57
60
63
66
69
72
75
78
81
84
87
90
93
96
99
σc,bottom at t = 140 days
σc,bot_N/mm²
-18
-16
-14
-12
-10
-8
-6
-4
-2
0
0 3 6 9
12
15
18
21
24
27
30
33
36
39
42
45
48
51
54
57
60
63
66
69
72
75
78
81
84
87
90
93
96
99
σc,top at t = 140 days
σc,top_N/mm²

Launching of Prestressed Bridge_Case Study
4.7.1. Casting 1.
After prestressing, it will start the slab casting 1. It is checked at t = 190 days:
Resistance Moments are linearised to be easy their calculation; in fact the parabolic
position of tendon P1 gives more resistance than I take in account with the linearization: I
took as reference points the section at: 0, 19.5, 46,5, 50, 53.5, 73.5, 96.5 and 100m. In
reality, this method isn't completely safe for Negative Moments along all length except
segments between 46.5 m and 53.5 m and between 96.5 and 103.5 m, because the
linearization take in account a cable higher than real position. But it isn't so important
because it is simple to see that the value of M.Rd in 46.5 m overcome an M Ed that is
lower than the minim Negative M Rd at 19.5 m. So every section is covered to check.
I will conduct the SLU checks with this Method in the following chapter.
-40000
-30000
-20000
-10000
0
10000
20000
30000
0 3 6 9 12
15
18
21
24
27
30
33
36
39
42
45
48
51
54
57
60
63
66
69
72
75
78
81
84
87
90
93
96
99
Bending Moment_SLU_KNm_ t= 190 days
Med_SLU
Mrd+
Mrd-

Launching of Prestressed Bridge_Case Study
-3437,1982
7315,7836
-4000
-2000
0
2000
4000
6000
8000
10000
0 3 6 9 12
15
18
21
24
27
30
33
36
39
42
45
48
51
54
57
60
63
66
69
72
75
78
81
84
87
90
93
96
99
M(P 1) bending Moment_ KNm _ t = 190 days
M(P1),190
-7213,808
-8000
-7000
-6000
-5000
-4000
-3000
-2000
-1000
0
0 3 6 9
12
15
18
21
24
27
30
33
36
39
42
45
48
51
54
57
60
63
66
69
72
75
78
81
84
87
90
93
96
99
P 1 Axial Force_KN _ t = 170 days
N(P1),190
-10000
-8000
-6000
-4000
-2000
0
2000
4000
6000
8000
10000
0 3 6 9 12
15
18
21
24
27
30
33
36
39
42
45
48
51
54
57
60
63
66
69
72
75
78
81
84
87
90
93
96
99
Bending Moment_SLE.Rara_KNm_ t= 190 days
DEAD+P0+P1+Rara,sl1

Launching of Prestressed Bridge_Case Study
There aren't positive values of stress: the side is compressed.
There aren't positive values of stress: the bottom side is compressed.
To check this phase I took in account geometrical concrete section values, reinforcement
bars and P0 and P1 strands because after Prestressing "P1" I will wait the day fifteenth to
cast the slab.
4.7.2. Casting 2.
I will start the slab casting 2 at t = 190. During this phase the concrete of slab casting 1 is
hardened: in these zones I have a composite section slab+beam. So I have to distinguish
beam section to slab+beam section. Especially for time losses (shrinkage, creep,
relaxation) I have to put more attention: I can't apply the New Value of P1 at the
-20
-18
-16
-14
-12
-10
-8
-6
-4
-2
0
0 3 6 9
12
15
18
21
24
27
30
33
36
39
42
45
48
51
54
57
60
63
66
69
72
75
78
81
84
87
90
93
96
99
σc,top_N/mm²_ at t = 190 days
σc,sup
-18
-16
-14
-12
-10
-8
-6
-4
-2
0
0 3 6 9
12
15
18
21
24
27
30
33
36
39
42
45
48
51
54
57
60
63
66
69
72
75
78
81
84
87
90
93
96
99
σc,bottom_N/mm²_ at t = 190 days
σc,inf

Launching of Prestressed Bridge_Case Study
composite sections because the slab isn't prestressed; so I apply the time losses between
two phases, ΔP1, to these section considering barycentre is changed.
So I will have the following two graphs:
Firstly, Bending moment of those zones without slab
-30
-25
-20
-15
-10
-5
0
5
10
15
0 3 6 9
12
15
18
21
24
27
30
33
36
39
42
45
48
51
54
57
60
63
66
69
72
75
78
81
84
87
90
93
96
99
ΔM(P1) Bending Moment_KNm_ between t = 190 days and
t = 220 days
ΔM(P1),190-220
0
5
10
15
20
25
30
0 3 6 9
12
15
18
21
24
27
30
33
36
39
42
45
48
51
54
57
60
63
66
69
72
75
78
81
84
87
90
93
96
99
ΔN(P1) Axial Force_KN_ between t = 190 days and t = 220 days
ΔN(P1),190-220
Launching of Prestressed Bridge_Case Study
and his stresses
-40000
-30000
-20000
-10000
0
10000
20000
30000
0 3 6 9 12
15
18
21
24
27
30
33
36
39
42
45
48
51
54
57
60
63
66
69
72
75
78
81
84
87
90
93
96
99
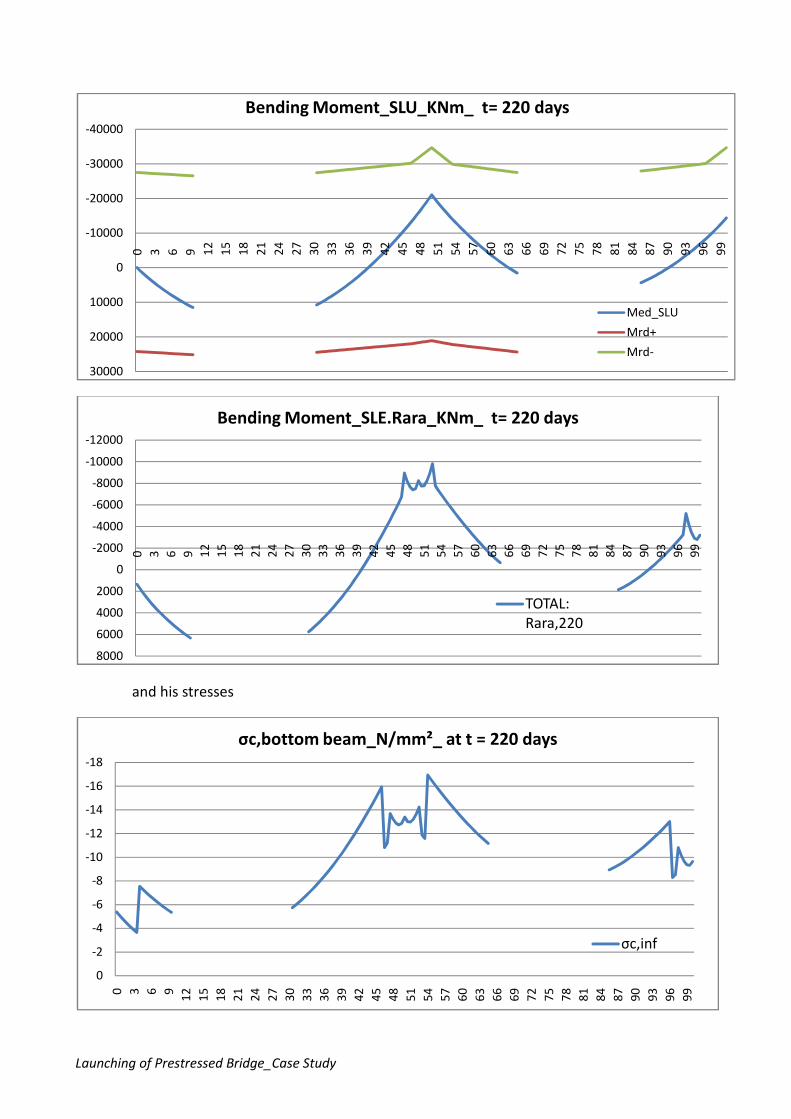
Bending Moment_SLU_KNm_ t= 220 days
Med_SLU
Mrd+
Mrd-
-12000
-10000
-8000
-6000
-4000
-2000
0
2000
4000
6000
8000
0 3 6 9 12
15
18
21
24
27
30
33
36
39
42
45
48
51
54
57
60
63
66
69
72
75
78
81
84
87
90
93
96
99
Bending Moment_SLE.Rara_KNm_ t= 220 days
TOTAL:
Rara,220
-18
-16
-14
-12
-10
-8
-6
-4
-2
0
0 3 6 9
12
15
18
21
24
27
30
33
36
39
42
45
48
51
54
57
60
63
66
69
72
75
78
81
84
87
90
93
96
99
σc,bottom beam_N/mm²_ at t = 220 days
σc,inf

Launching of Prestressed Bridge_Case Study
There aren't positive values of stress: the side is compressed.
There is just section 52.5 m with a positive values of stress at bottom. To check it I found
Ɛsup (N = -22966 KN; M33 = -9828 KNm) using:
• Jomog y( ) Somog y( ) e y M, ( )⋅− 0=
• y = 203 cm
• Ɛsup = 3.819*10^-5 < 1,688*10^-4
Secondly, Bending moment of those zones with hardening slab
-18
-16
-14
-12
-10
-8
-6
-4
-2
0
2
0 3 6 9 12
15
18
21
24
27
30
33
36
39
42
45
48
51
54
57
60
63
66
69
72
75
78
81
84
87
90
93
96
99
σc,top beam_N/mm²_ at t = 220 days
σc,sup
-40000
-30000
-20000
-10000
0
10000
20000
30000
40000
50000
0,0
0
3,5
0
7,0
0
10
,50
14
,00
17
,50
21
,00
24
,50
28
,00
31
,50
35
,00
38
,50
42
,00
45
,50
49
,00
52
,50
56
,00
59
,50
63
,00
66
,50
70
,00
73
,50
77
,00
80
,50
84
,00
87
,50
91
,00
94
,50
98
,00
Bending Moment_SLU_KNm_ t= 220 days
Med_SLU
Mrd+
Mrd-

Launching of Prestressed Bridge_Case Study
and his stresses
There aren't positive values of stress: the side is compressed.
There aren't positive values of stress: the side is compressed.
0
200
400
600
800
1000
1200
1400
0 3 6 9 12
15
18
21
24
27
30
33
36
39
42
45
48
51
54
57
60
63
66
69
72
75
78
81
84
87
90
93
96
99
Bending Moment_SLE.Rara_KNm_ Section slab+beam
t= 220 days
TOTAL:
Rara,220
-12
-10
-8
-6
-4
-2
0
0 3 6 9
12
15
18
21
24
27
30
33
36
39
42
45
48
51
54
57
60
63
66
69
72
75
78
81
84
87
90
93
96
99
σc,bottom beam_N/mm²_ at t = 220 days
σc,inf
-20
-15
-10
-5
0
0 3 6 9
12
15
18
21
24
27
30
33
36
39
42
45
48
51
54
57
60
63
66
69
72
75
78
81
84
87
90
93
96
99
σc,top beam_N/mm²_ at t = 220 days
σc,sup

Launching of Prestressed Bridge_Case Study
There aren't positive values of stress: the side is compressed.
These stresses are calculated summing:
- σc(t=220) due to SLE_Rara combination which takes in account ΔP.effects and
casting slab2 acting to composite section.
- σc(t=190) due to Qp(t = 190) acting to beam section.
This is the End of slab casting.
4.7.3. Shear force
I calculate shear force taking in account the vertical component of tendons which is
opposite to shear force.
Regarding calculation of resistance, I can't take in account the compression contribute,
αc, because it is too big (the cracks can't open in sub-horizontal direction).
Regarding d parametre, it is variable along the length and it depends to tendon position
even though tendon influence d just when it is tense.
So I show the graphs of principal phases below:
-0,8
-0,7
-0,6
-0,5
-0,4
-0,3
-0,2
-0,1
0
0 3 6 9
12
15
18
21
24
27
30
33
36
39
42
45
48
51
54
57
60
63
66
69
72
75
78
81
84
87
90
93
96
99
σc,top slab_N/mm²_ at t = 220 days
σc,sol

Launching of Prestressed Bridge_Case Study
-8000
-6000
-4000
-2000
0
2000
4000
6000
8000
0,0
0
3,0
0
6,0
0
9,0
0
12
,00
15
,00
18
,00
21
,00
24
,00
27
,00
30
,00
33
,00
36
,00
39
,00
42
,00
45
,00
48
,00
51
,00
54
,00
57
,00
60
,00
63
,00
66
,00
69
,00
72
,00
75
,00
78
,00
81
,00
84
,00
87
,00
90
,00
93
,00
96
,00
99
,00
Shear Force_SLU_KNm_ t= 190 days
VEd_SLU 190
-8000
-6000
-4000
-2000
0
2000
4000
6000
8000
0,0
0
3,0
0
6,0
0
9,0
0
12
,00
15
,00
18
,00
21
,00
24
,00
27
,00
30
,00
33
,00
36
,00
39
,00
42
,00
45
,00
48
,00
51
,00
54
,00
57
,00
60
,00
63
,00
66
,00
69
,00
72
,00
75
,00
78
,00
81
,00
84
,00
87
,00
90
,00
93
,00
96
,00
99
,00
Shear Force_SLU_KN_Beam t= 220 days
VEd_SLU 220
VRd 220_range1
VRd 220_range2
-2000
-1500
-1000
-500
0
500
1000
1500
2000
0,0
0
3,0
0
6,0
0
9,0
0
12
,00
15
,00
18
,00
21
,00
24
,00
27
,00
30
,00
33
,00
36
,00
39
,00
42
,00
45
,00
48
,00
51
,00
54
,00
57
,00
60
,00
63
,00
66
,00
69
,00
72
,00
75
,00
78
,00
81
,00
84
,00
87
,00
90
,00
93
,00
96
,00
99
,00
Shear Force_SLU_KN_Beam+SLab t= 220 days
VEd_SLU 220
VRd 220_range1
VRd 220_range2

Launching of Prestressed Bridge_Case Study
4.8. Prestressing of Path 2 "P2".
At the End of slab casting, I will prestress the third and last Tendon Path. The purpose of
this last prestressing is to avoid that the slab will be cracked during the life due to traffic
loads. To achieve this purpose I prestress the composite beam until the limit of
decompression in the slab is overcame, but not enough to overcome the tensile limit.
Finally I use 6831 device which has an initial Edge prestress axial force:
NP2(t=220) = 6055 KN
The effects in the deck are showed below:
9256,6473
-6000
-4000
-2000
0
2000
4000
6000
8000
10000
0 3 6 9 12
15
18
21
24
27
30
33
36
39
42
45
48
51
54
57
60
63
66
69
72
75
78
81
84
87
90
93
96
99
M(P2) bending Moment_ KNm _ t = 220days
M(P2),220
-8522,505-9000
-8000
-7000
-6000
-5000
-4000
-3000
-2000
-1000
0
0 3 6 9
12
15
18
21
24
27
30
33
36
39
42
45
48
51
54
57
60
63
66
69
72
75
78
81
84
87
90
93
96
99
N(P2) Axial Force_KN _ t = 220days
N(P2),220

Launching of Prestressed Bridge_Case Study
4.8.1. Bending Moment
The stresses are calculated considering concrete reagent to tensile and summing:
- σc(t=220) due to P2.effects acting to composite section.
- σc(t=220) due to Qp, ΔP.effects and casting slab2 acting to composite section.
- σc(t=190) due to Qp(t = 190) acting to beam section.
-8559,674-9000
-8000
-7000
-6000
-5000
-4000
-3000
-2000
-1000
0
0 3 6 9
12
15
18
21
24
27
30
33
36
39
42
45
48
51
54
57
60
63
66
69
72
75
78
81
84
87
90
93
96
99
N(P2) Axial Force_KN _ t = 220days
N(P2),200
-6000
-4000
-2000
0
2000
4000
6000
8000
10000
0 3 6 9 12
15
18
21
24
27
30
33
36
39
42
45
48
51
54
57
60
63
66
69
72
75
78
81
84
87
90
93
96
99
Bending Moment_SLE.Qp_KNm_ t= 220 days
M,220

Launching of Prestressed Bridge_Case Study
-16
-14
-12
-10
-8
-6
-4
-2
0
0 3 6 9
12
15
18
21
24
27
30
33
36
39
42
45
48
51
54
57
60
63
66
69
72
75
78
81
84
87
90
93
96
99
σc,bottom beam_N/mm²_ at t = 220 days
σc,inf
-18
-16
-14
-12
-10
-8
-6
-4
-2
0
0 3 6 9
12
15
18
21
24
27
30
33
36
39
42
45
48
51
54
57
60
63
66
69
72
75
78
81
84
87
90
93
96
99
σc,top beam_N/mm²_ at t = 220 days
σc,sup
-8
-7
-6
-5
-4
-3
-2
-1
0
1
0 3 6 9 12
15
18
21
24
27
30
33
36
39
42
45
48
51
54
57
60
63
66
69
72
75
78
81
84
87
90
93
96
99
σc,top slab_N/mm²_ at t = 220 days
σc,sup,sol

Launching of Prestressed Bridge_Case Study
As I said, there are Mid Span zones where the top sides of slab are tensile. To check them
I take the worst-unreal-scenario and I distinguish Support sections from Double-T
sections:
SUPPORT SECTION + SLAB between 24 and 26m and between 74 and 76 m:
• N.min = -4204 KN
• M.max = -3239 KNm
I find σtop.slab = 0,952 N/mm² < 2.79 N/mm²
DOUBLE-T SECTION + SLAB:
• N.min = -5122 KN
• M.max = -4126 KNm
I find σtop.slab = 0,562 N/mm² < 2.79 N/mm²
I have also checked that the worst-scenario not to crack top side of beams.
I will spend another 15 days to wait the hardening of grout in order to grant bond and
others 15 days to build Permanent-no structural device (asphalt, guard-rail,..):
G1 (e G2 fully defined).
Sidewalk 5 KN/m²
Asphalt 3 KN/m²
Curb 6,25 KN/m²
Guardrail/Railing 4 KN/m
Rib 5 KN/m
SLE_Qp = 1 x G,permanent
At the End of this phase I will have:
-300
-200
-100
0
100
200
0 3 6 9
12
15
18
21
24
27
30
33
36
39
42
45
48
51
54
57
60
63
66
69
72
75
78
81
84
87
90
93
96
99
ΔM(P2) Bending Moment_KNm_ between t = 220and t = 250
days
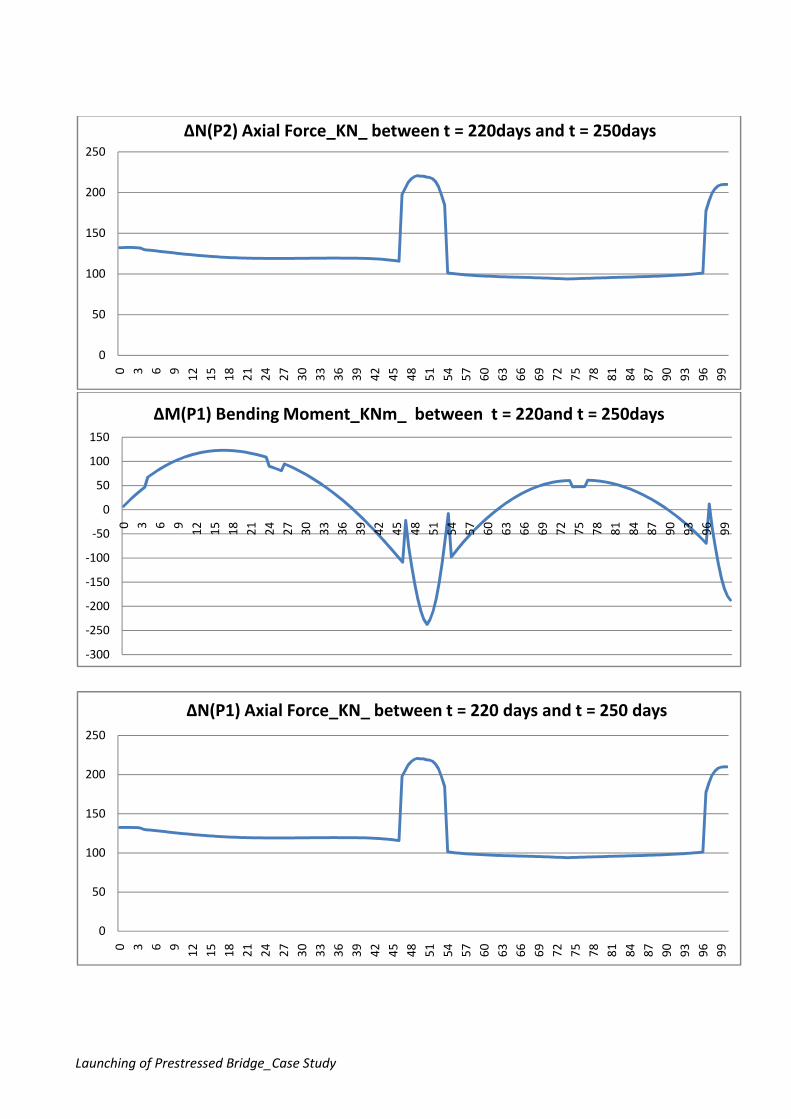
Launching of Prestressed Bridge_Case Study
0
50
100
150
200
250
0 3 6 9
12
15
18
21
24
27
30
33
36
39
42
45
48
51
54
57
60
63
66
69
72
75
78
81
84
87
90
93
96
99
ΔN(P2) Axial Force_KN_ between t = 220days and t = 250days
-300
-250
-200
-150
-100
-50
0
50
100
150
0 3 6 9
12
15
18
21
24
27
30
33
36
39
42
45
48
51
54
57
60
63
66
69
72
75
78
81
84
87
90
93
96
99
ΔM(P1) Bending Moment_KNm_ between t = 220and t = 250days
0
50
100
150
200
250
0 3 6 9
12
15
18
21
24
27
30
33
36
39
42
45
48
51
54
57
60
63
66
69
72
75
78
81
84
87
90
93
96
99
ΔN(P1) Axial Force_KN_ between t = 220 days and t = 250 days

Launching of Prestressed Bridge_Case Study
The stresses are calculated considering concrete reagent to tensile and summing the
stresses from the previous step with them.
There aren't positive values of stress: the side is compressed but I have to check to be
under compression limit in next chapter.
-3000
-2000
-1000
0
1000
2000
3000
4000
5000
6000
0 3 6 9 12
15
18
21
24
27
30
33
36
39
42
45
48
51
54
57
60
63
66
69
72
75
78
81
84
87
90
93
96
99
Bending Moment_SLE.Qp_KNm_ t= 250 days
M
-18,9070749-20
-18
-16
-14
-12
-10
-8
-6
-4
-2
0
0 3 6 9
12
15
18
21
24
27
30
33
36
39
42
45
48
51
54
57
60
63
66
69
72
75
78
81
84
87
90
93
96
99
σc,top beam_N/mm²_ at t = 250 days
σc,sup

Launching of Prestressed Bridge_Case Study
There aren't positive values of stress: the side is compressed.
There aren't positive values of stress: the side is compressed.
4.9. Behaviour during the life.
The bridge is ready to bear the traffic load.
From NTC08 I used these following loads:
qk,unif
(KN/m²) Qk,tandem (KN) per axis
Qk,horizz
(KN/m²)
LANE1 9 300
900
LANE2 2,5 200 - -
LANE3 2,5 100 - -
-6
-5
-4
-3
-2
-1
0
0 3 6 9
12
15
18
21
24
27
30
33
36
39
42
45
48
51
54
57
60
63
66
69
72
75
78
81
84
87
90
93
96
99
σc,top slab_N/mm²_ at t = 250 days
σc,sup,sol
-18
-16
-14
-12
-10
-8
-6
-4
-2
0
0 3 6 9
12
15
18
21
24
27
30
33
36
39
42
45
48
51
54
57
60
63
66
69
72
75
78
81
84
87
90
93
96
99
σc,bottom beam_N/mm²_ at t = 250 days
σc,inf

Launching of Prestressed Bridge_Case Study
qk,crowd
(KN/m²)
Sidewalk 1 2,5 - - -
Sidewalk 2 2,5 - - -
I placed all 3 lanes on the deck with Lane 3 beside the right side of carriageway and
loaded up just right sidewalk to maximize the effect of external beam.
Temperature load doesn't give big forces in the bridge. I use it just in:
SLE_Qp = G,permanent + 0.5 Tk.envelope,
where Tk,envelope is the envelope of:
T,M, heat = ∆T,M heat + 0,35 ∆T,N exp T,N,heat = 0,75 ∆T,M heat + ∆T,N exp
T,M, cool = ∆T,M cool + 0,35 ∆T,N con T,N,cool = 0,75 ∆T,M cool + ∆T,N con
where:
1) Uniform ∆T in the deck section.
Assuming that the deck is completed with a temperature of 20°C and that
temperature of the weather in Taranto is:
Tmax,aria = 30°C => Te,max = 32°C
Tmax,aria = 0°C => Te,max = 8°C
I have:
∆TN,cotr = To - Te,min = -12 °C
∆TN,exp = Te,max - To = 12 °C
2) Using Approach 2 of ANNEX B of EC1:
Heating
Cooling
h 2,45 m
h 2,45 m
h1 0,15 m
h1 0,25 m
h2 0,25 m
h2 0,2 m
h3 0,2 m
h3 0,2 m
∆T1 13 °C
h4 0,25 m
∆T2 3 °C
∆T1 -8,4 °C
∆T3 2,5 °C
∆T2 -0,5 °C
∆T3 -1 °C
∆T4 -6,5 °C

Launching of Prestressed Bridge_Case Study
Finally, I have these combination:
SLU: ∑1,3 G.permanent + 1,35 (qk,unif + Qk,tandem + qk,
SLE_Rara: ∑ G1 + (qk,unif + Qk,tandem +
SLE_Qp: ∑ G1 + 0,5 Tk,envelope
If I check that all sides of section don't overcome the tensile limit of concrete it isn't
important to check the Frequent Combination.
22260,4005
44130
-60000
-40000
-20000
0
20000
40000
60000
0 3 5 8 10131518202325
Bending Moment_SLU_KNm_ t= 00 days
Bridge_Case Study
Finally, I have these combination:
+ 1,35 (qk,unif + Qk,tandem + qk,crowd) + 1,5
∑ G1 + (qk,unif + Qk,tandem + qk,crowd) + qk,wind
∑ G1 + 0,5 Tk,envelope
If I check that all sides of section don't overcome the tensile limit of concrete it isn't
important to check the Frequent Combination.
22260,4005
-28093,0109
44130
-49684
252830333538404345485053555860636568707375
Bending Moment_SLU_KNm_ t= 00 days
) + 1,5x0,6xqk,vento
If I check that all sides of section don't overcome the tensile limit of concrete it isn't
75788083858890939598100
t00 beam+slab_MAX
t00 beam+slab_MIN
MRd 00 max
MRd 00 min
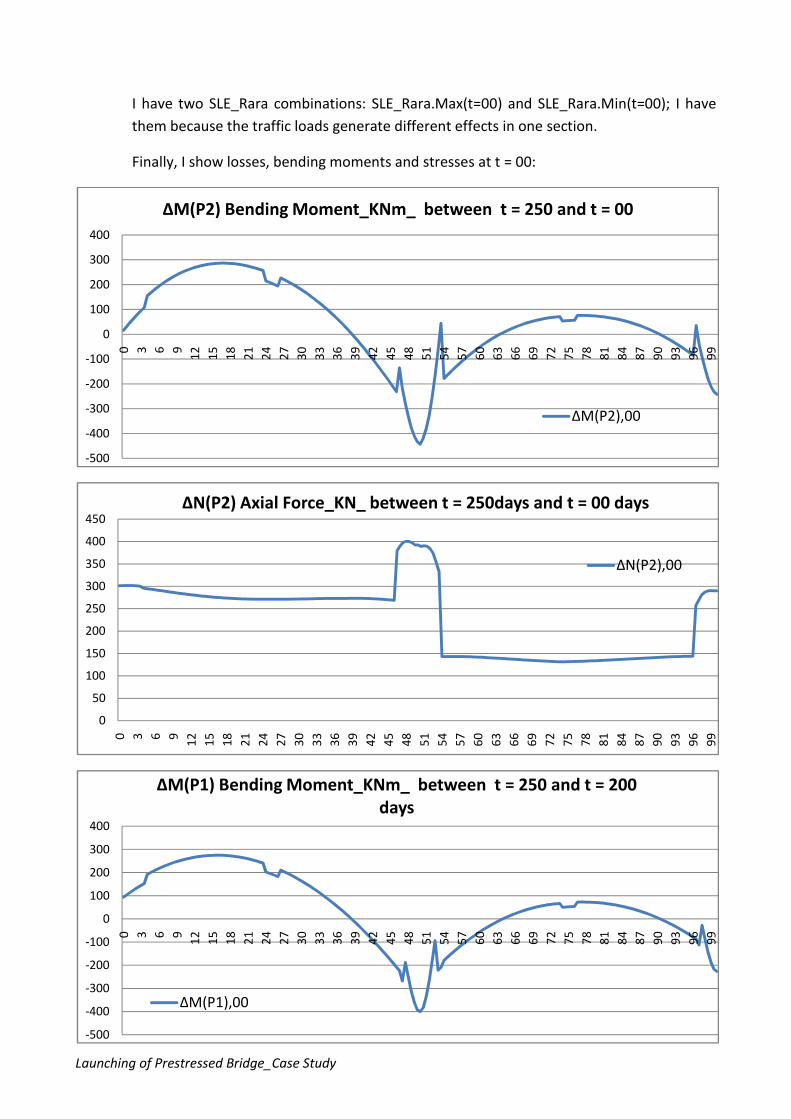
Launching of Prestressed Bridge_Case Study
I have two SLE_Rara combinations: SLE_Rara.Max(t=00) and SLE_Rara.Min(t=00); I have
them because the traffic loads generate different effects in one section.
Finally, I show losses, bending moments and stresses at t = 00:
-500
-400
-300
-200
-100
0
100
200
300
400
0 3 6 9
12
15
18
21
24
27
30
33
36
39
42
45
48
51
54
57
60
63
66
69
72
75
78
81
84
87
90
93
96
99
ΔM(P2) Bending Moment_KNm_ between t = 250 and t = 00
ΔM(P2),00
0
50
100
150
200
250
300
350
400
450
0 3 6 9
12
15
18
21
24
27
30
33
36
39
42
45
48
51
54
57
60
63
66
69
72
75
78
81
84
87
90
93
96
99
ΔN(P2) Axial Force_KN_ between t = 250days and t = 00 days
ΔN(P2),00
-500
-400
-300
-200
-100
0
100
200
300
400
0 3 6 9
12
15
18
21
24
27
30
33
36
39
42
45
48
51
54
57
60
63
66
69
72
75
78
81
84
87
90
93
96
99
ΔM(P1) Bending Moment_KNm_ between t = 250 and t = 200
days
ΔM(P1),00

Launching of Prestressed Bridge_Case Study
There aren't positive values of stress: the side is compressed.
The compression fibres are under limit:
σc top beam max = 17 N/mm² < 0.45 x fck = 18.68 N/mm²
0
50
100
150
200
250
300
350
400
0 3 6 9
12
15
18
21
24
27
30
33
36
39
42
45
48
51
54
57
60
63
66
69
72
75
78
81
84
87
90
93
96
99
ΔN(P1) Axial Force_KN_ between t = 250 days and t = 00 days
ΔN(P1),00
-3000
-2000
-1000
0
1000
2000
3000
4000
5000
6000
0 3 6 9 12
15
18
21
24
27
30
33
36
39
42
45
48
51
54
57
60
63
66
69
72
75
78
81
84
87
90
93
96
99
Bending Moment_SLE.Qp_KNm_ t= 00days
M
-16,9937585-18
-16
-14
-12
-10
-8
-6
-4
-2
0
0 3 6 9
12
15
18
21
24
27
30
33
36
39
42
45
48
51
54
57
60
63
66
69
72
75
78
81
84
87
90
93
96
99
σc,bottom beam_N/mm²_ at t = 00 days
σc,inf

Launching of Prestressed Bridge_Case Study
There aren't positive values of stress: the side is compressed.
The compression fibres are under limit:
σc top beam max = 18.59 N/mm² < 0.45 x fck = 18.68 N/mm²
There aren't positive values of stress: the side is compressed.
-18,59794091-20
-15
-10
-5
0
0 3 6 9
12
15
18
21
24
27
30
33
36
39
42
45
48
51
54
57
60
63
66
69
72
75
78
81
84
87
90
93
96
99
σc,top beam_N/mm²_ at t = 00 days
σc,sup
-5
-4
-3
-2
-1
0
0 3 6 9
12
15
18
21
24
27
30
33
36
39
42
45
48
51
54
57
60
63
66
69
72
75
78
81
84
87
90
93
96
99
σc,top slab_N/mm²_ at t = 00 days
σc,sup,sol
-5792,8016
-8000
-6000
-4000
-2000
0
2000
4000
6000
8000
0 3 6 9 12
15
18
21
24
27
30
33
36
39
42
45
48
51
54
57
60
63
66
69
72
75
78
81
84
87
90
93
96
99
Bending Moment_SLE.Rara_KNm_ t= 00days
P2,00+Rara Max,00
P2,00+Rara Min,00

Launching of Prestressed Bridge_Case Study
There are positive values of stress; these sections are between 24 m and 26m. There will
be checked at the end of these graphs.
There aren't positive values of stress: the side is compressed.
The compression fibres are under limit:
σc top beam max = 20.74 N/mm² < 0.6 x fck = 24.9 N/mm²
-25
-20
-15
-10
-5
0
5
0 3 6 9 12
15
18
21
24
27
30
33
36
39
42
45
48
51
54
57
60
63
66
69
72
75
78
81
84
87
90
93
96
99
σc,bottom beam_N/mm²_ at t = 00 days
σc,inf_SLE,Rara 00,min
σc,inf_SLE,Rara 00,max
-20,74939103
-25
-20
-15
-10
-5
0
5
0 3 6 9
12
15
18
21
24
27
30
33
36
39
42
45
48
51
54
57
60
63
66
69
72
75
78
81
84
87
90
93
96
99
σc,top beam_N/mm²_ at t = 00 days
σc,sup_SLE,Rara 00,min
σc,sup_SLE,Rara 00,max

Launching of Prestressed Bridge_Case Study
There are positive values of stress; these sections are at:
- between 24 m and 26 m.
- 46.5 m
- 53 m
- 53.5 m (the most stressed during the life): N = -6211 KN, M = -5792 KNm
ɛtc slab.limit = 7,71*10^-5
ɛcls topslab(P2+Rara) = 5.62*10^-5 < 7,71*10^-5
- 96.5 m
The most stressed fibre is checked with slab deformation limit: the deck doesn't crack in
SLE_Rara, so it isn't important check the SLE_Frequent Combination.
4.9.1. Shear force
-5
-4
-3
-2
-1
0
1
2
0 3 6 9 12
15
18
21
24
27
30
33
36
39
42
45
48
51
54
57
60
63
66
69
72
75
78
81
84
87
90
93
96
99
σc,top slab_N/mm²_ at t = 00 days
σc,sup,sol_SLE,Rara 00,min
σc,sup,sol_SLE,Rara 00,max
-8000
-6000
-4000
-2000
0
2000
4000
6000
8000
0 3 6 9 12
15
18
21
24
27
30
33
36
39
42
45
48
51
54
57
60
63
66
69
72
75
78
81
84
87
90
93
96
99
Shear Force_SLU_KN_Beam+SLab t= 00 daysVed_SLU,max
VRd 200_range1
VRd 200_range2
Ved_SLU,min

Launching of Prestressed Bridge_Case Study
5. ERECTION GIRDER.
5.1. Description of method.
This method consist in cast of 20 beams to cover 200 m of Span. Each beam will have 3 Span
tendons and 2 Support tendon and it will be cast in factory, where span tendons will be
prestressed. Finally they will be transported by lorry.
The name of Support tendons are: 1,2,3.
The name of Support tendons are: 4 and 5.
Figura 35: Erection Girder_Arrangement of Prestrestressing Tendons

Launching of Prestressed Bridge_Case Study
Figura 36: Detail of Continuity Joint
When they will be on River bed they will be lifted up and place on temporary jack.
In order not to have Hogging bending Moment in the deck's section on Piers, I decide to
proceed with the slab casting before beam continuing. In fact I design beams in order to avoid
beam's cracking.
In order to increase bridge performing when it bear traffic load, I will make the independent
segments on the pier continue. To make it, I will cast into a free space that I will leave between
beams on the support where I will overlap reinforcements and connect support tendons each
other. After overlapping, I will cast the continuity joints.
When they are hardened, I will prestress Support Tendons to make the continuity effective and
in order to give an Positive Moment in the Support Section.
In summary:
Rates
t=0 Casting of beams in Situ-Factory
t=28gg Prestress of 3 Span Tendons
t=43gg Hardening of growth.
t=43-60gg Slab Casting
t=60gg Casting of continuity joint
t=90gg Prestress of 2 Support Tendons
Changing the static scheme to continue beam from simply supported beam, it involves Bridge's
Deferred Behaviour; in fact the Deck "doesn't know" that its scheme is changed, so it will

Launching of Prestressed Bridge_Case Study
continue to deform itself as it would be simply supported again: I have to take in account the
Creeping iperstatic Moment in the sections on the Piers.
5.2. Description of beams.
Remembering to have 50 m of Span between Piers and to leave 1.2 m across Pier to
permit the reinforcements overlapping, I have to use the following beam's length:
- 49,4 m for external beams.
- 48,8 m for internal beams.
in order to achieve the span length. In fact:
L = 49.4 x 2 + 48.8 x 2 + 1.2 x 3 = 200 m
In spite of different length, I will have symmetrical beams as it is showed above.
5.3. Path Tendons.
5.3.1. Span Tendons: External beams
I choose a parabolic distribution of these 3 cables. In my count will be referred to
"Resultant Tendons".
I use:
- Tendon 1.
Devices: Tendons, Anchorages 6831 (31 strands) upside.
σpi = 1395 N/mm².
First Tendon Prestress.
Both Edge Prestress.
Tendon 1
Xp 0 m
Yp 163,50 cm
Xv 24.7 m
Yv 24 cm
A (1 trefolo) 1,4 cm²
n° strands 37
A tot strands 51.8 cm²
σ initial maximum 1395 N/mm2
N initial 7226 KN
Immediate losses -10,18%
N initial effective 6495 KN
By Immediate losses, I mean the sum of Friction loss at the mid span and
Progressive Prestressing contribute.

Launching of Prestressed Bridge_Case Study
- Tendon 2.
Devices: Tendons, Anchorages 6837 (37 strands) upside.
σpi = 1395 N/mm².
Second Tendon Prestress.
Both Edge Prestress.
Tendon 2
Xp 0 m
Yp 99,00 cm
Xv 24.7 m
Yv 14 cm
A (1 trefolo) 1,4 cm²
n° strands 37
A tot strands 51,8 cm²
σ initial maximum 1395 N/mm2
N initial 7226,1 KN
Immediate losses -8,49%
N initial effective 6612,8 KN
- Tendon 3.
Devices: Tendons, Anchorages 6837 (37 strands) upside.
σpi = 1395 N/mm².
Last Tendon Prestress.
Both Edge Prestress.
Tendon 3
Xp 0 m
Yp 34,50 cm
Xv 24.7 m
Yv 14 cm
A (1 trefolo) 1,4 cm²
n° strands 37
A tot strands 51,8 cm²
σ initial maximum 1395 N/mm2
N initial 7226,1 KN
Immediate losses -4,75%
N initial effective 6882,8 KN

Launching of Prestressed Bridge_Case Study
5.3.2. Span Tendons: Internal beams.
I choose the same Path. These beams are a bit shorter than external beams, but this
60 cm of difference doesn't cause big differences to each other.
- Tendon 1.
Devices: Tendons, Anchorages 6831 (31 strands) upside.
σpi = 1395 N/mm².
First Tendon Prestress.
Both Edge Prestress.
Tendon 1
Xp 0 m
Yp 163,50 cm
Xv 24,4 m
Yv 24 cm
A (1 trefolo) 1,4 cm²
n° strands 37
A tot strands 51.8 cm²
σ initial maximum 1395 N/mm2
N initial 7226,1 KN
Immediate losses -10,14%
N initial effective 6495 KN
By Immediate losses, I mean the sum of Friction loss at the mid span and
Progressive Prestressing contribute: I take in account all these losses as they would
be applied at Beam's Edge. This method is secure even though I have to take in
account the beginning condition at t = 28 days considering the effective stress
present to avoid the excessive compression in the lower fibre.
-10
90
190
290
0 5 10 15 20 25 30 35 40 45
Path Tendons_External Beams
Tendon 1
Tendon 2
Tendon3

Launching of Prestressed Bridge_Case Study
- Tendon 2.
Devices: Tendons, Anchorages 6837 (37 strands) upside.
σpi = 1395 N/mm².
Second Tendon Prestress.
Both Edge Prestress.
Tendon 2
Xp 0 m
Yp 99,00 cm
Xv 24.4 m
Yv 14 cm
A (1 trefolo) 1,4 cm²
n° strands 37
A tot strands 51,8 cm²
σ initial maximum 1395 N/mm2
N initial 7226,1 KN
Immediate losses -8,45%
N initial effective 6609,8 KN
- Tendon 3.
Devices: Tendons, Anchorages 6837 (37 strands) upside.
σpi = 1395 N/mm².
Last Tendon Prestress.
Both Edge Prestress.
Tendon 3
Xp 0 m
Yp 34,50 cm
Xv 24.4 m
Yv 14 cm
A (1 trefolo) 1,4 cm²
n° strands 37
A tot strands 51,8 cm²
σ initial maximum 1395 N/mm2
N initial 7226,1 KN
Immediate losses -4,71%
N initial effective 6879,8 KN

Launching of Prestressed Bridge_Case Study
5.3.3. Support Tendons.
They will be placed at the Edge that will be on the Pier. After placing of the beams,
the first thing I have to do it will be to join the couplers.
- Tendon 4 and 5.
Devices: Tendons, Anchorages 6815 (15 strands) upside.
σpi = 1395 N/mm².
I will prestress Tendon 4 and 5 in the same time: I don't take in account the
Progressive prestressing loss.
Both Edge Prestress.
Tendon 4 - 5_External beam
Xs 0 m
Ys 0 cm
Xv,s 0 m
Yv,s 0 cm
Xe 46,5 m
Ye 0 cm
Xv,e 49,4 m
Yv,e 210 cm
A (1 strand) 1,4 cm²
n° strands 15
A tot strands 21 cm²
A tot strands 1395 N/mm2
N initial 2929,5 KN
Differed loss -12,69%
N t= 00 2557 KN
-10
90
190
290
0 4,8 9,6 14,4 19,2 24 28,8 33,6 38,4 43,2 48
Path Tendons_External Beams
Tendon 1
Tendon 2
Tendon3

Launching of Prestressed Bridge_Case Study
Tendon 4 - 5_Internal beam
Xs 0 m
Ys 210 cm
Xv,s 2,9 m
Yv,s 0 cm
Xe 45,9 m
Ye 0 cm
Xv,e 48,8 m
Yv,e 210 cm
A (1 strand) 1,4 cm²
n° strands 15
A tot strands 21 cm²
A tot strands 1395 N/mm2
N initial 2929,5 KN
Differed loss -12,69%
N t= 00 2557 KN
I didn't report instantaneous Loss because I will prestress this 2 tendons in the same time,
and because I take friction Loss in account in Sap Model, assigning:
fc (lubricated ducts)= 0,18
k
0,01 rad/m
I calculated Differed Loss taking in account the biggest Loss cased to the combinate effect of
creep, shrinkage and relaxation using Ec2 formula. Regarding Creep, I considered
deformations of that fibre at the Tendon quote and considering its slope.
Note: abscissa "0" means Pier's vertical axis
I don't write Friction Loss here because I take it in account in SAP model.
I show the graphs of these phases:
0
50
100
150
200
250
-4 -3 -2 -1 0 1 2 3 4
h,beam (cm)
m
Tendon 4-5 Path on the Pier
Tendon 4-5


Launching of Prestressed Bridge_Case Study
Figura 37: Erection Girder Stages
Figura 38: Section A-A and B-B of beam

Launching of Prestressed Bridge_Case Study
Figura 39: Section C-C of Beam

5.3.4. Conclusion.
The differences are very small but I take the external beam for my calculation even
though I use the Internal Beam to check not to overcome compression limit of
concrete at t = 30 days.
Regarding Differed Losses I take in account them for every sections because I will
pump growth in the ducts to achieve the bond between concrete and tendons.
As it is possible to see the beam doesn't overcome the initial compression stress limit:
fc.lim,o = 0.7 x fck = 290,5 Kg/cm²
After prestressing, it is strictly forbidden overthrow the side of beam and it is important
to maintain simply supported scheme in each phases of transport to avoid up side's
cracking.
-9,50
40,50
90,50
140,50
190,50
240,50
290,50
0 5 9,5 14,5 19,5 24,7 29,5 34,5 39,5 44,5 49,4
Prestressing of beams_stress graph at
t = 28days_Kg/cm²
σci
σce

Launching of Prestressed Bridge_Case Study
5.4. Erection Girder at t = 43 days.
When beams arrive on river's bed I will use 2 crowns to lift up it and place on the Pier. To
lift up them I design an Hole in the beams Edge.
Figura 40: Deatail of Pin
P.beam = 25x [1.275x37,8 + 2,31 x7 + (2,31 + 1.275)/2 x2.6x2] x 1,3 = 2394 KN
F.hole = 2394/2 = 1197 KN
Class of reinforcement B450C.
As,min = 1197000 x √2 /391,3 = 4326 mm² => 43,26 mm²
Diameter of reinforcement: φ = 2.6 cm
n° reinfor.min = As,min/2.2 = 16,64
I use:

Launching of Prestressed Bridge_Case Study
21φ26
that I place around the hole. The length of these reinforcements is:
L = 115 + 95+110 = 320 cm but I use 400 cm to make me sure.
It will be placed a Pin in the hole to lift up the beams;
Class of steel: S275, ftk = 430 N/mm²
n° planes of shear: 2
Fv.Ed = 1197/2 = 598 KN
��� = 1.25
. min = 4 ∗ 598 ∗ 10� ∗ ���0.6 ∗ ��� ∗ � = 61 ��
but I use:
φ = 80 mm
Fv.rd = 1037 KN
The beams will be placed on the temporary jacks on the pier and abutment.
5.5. Slab's casting at t = 43-60 days.
At t = 60 days, I will finish to cast slab and I will have to wait 28 days for hardening.
In this moment I have a simply supported beam and resistant section will be just section of
the beam.
Firstly, I show the Bending Moment of permanent load:
0
500
1000
1500
0 5 10 15 20 25 30 35 40 45Bending Moments of Dead Load_Slab and Beam_tm
Mg1 (slab)

Launching of Prestressed Bridge_Case Study
I also show the differed losses graph, where the values are ΔN.loss in each section (in fact
it is achieved bond between tendons and concrete in this stage) at 90 days; values are in
tons:
Secondly, I show the stress scenario in the following graph:
5.6. Prestressing of continuity joint at t = 90 days.
80,00
90,00
100,00
110,00
120,00
130,00
140,00
150,00
160,00
170,00
0 5 10 15 20 25 30 35 40 45 50
Differed losses: creep + shrinkage + relaxing_stress graphs at
t = 90 days_tons
Ds C+s+r*Ap
-9,50
40,50
90,50
140,50
190,50
240,50
290,50
0 5 10 15 20 25 30 35 40 45
Slab's casting_stress graphs at t = 90 days_Kg/cm²
σce
σci

Launching of Prestressed Bridge_Case Study
After slab's casting, I have to make Deck continue. To make it , I prestress tendons across
the Pier. When it happen I will have a Sagging moment closer to support, Hogging
Moment in the other parts of bridge.
Regarding Hogging Moment, it is possible to notice that it is big closer to Anchor's sections
but it is coupled with an increase of Axial Force. So the worst-scenario is the section of
-381,8684
-512,8985
-381,96
-512,9988 -513,534
-382,9504
-600
-500
-400
-300
-200
-100
0
100
0
6,5 13
19
,5 26
32
,5 39
45
,5 52
58
,5 65
71
,5 78
84
,5 91
97
,5
10
4
11
0,5
11
7
12
3,5
13
0
13
6,5
14
3
14
9,5
15
6
16
2,5
16
9
17
5,5
18
2
18
8,5
19
5
Prestressing of support tendons_Axial Force
at t = 90 days_tm
M.Support tend
-485
365
-478,62263
373,55432 365
-485
-600
-500
-400
-300
-200
-100
0
100
200
300
400
500
0 6,5
13
19
,5
26
32
,5
39
45
,5
52
58
,5
65
71
,5
78
84
,5
91
97
,5
10
4
11
0,5
11
7
12
3,5
13
0
13
6,5
14
3
14
9,5
15
6
16
2,5
16
9
17
5,5
18
2
18
8,5
19
5
Prestressing of support tendons_Bending Moment
at t = 90 days_tm M.Support tend

Launching of Prestressed Bridge_Case Study
Anchorage because I have the biggest Hogging Moment and the smallest Axial Force: if it
is checked, the other sections across the support they will be too.
In the following graph is showed deformation of three significant fibres:
- Upper side of slab: ɛ.sup,slab
- Upper side of beams: ɛ.beam,sup
- Lower side of beams: ɛ.beam,inf
Nothing deformation overcome the limits:
- compression limit: ɛcc.lim = 290.5/355470 = 0.000817
- tensile limit: ɛct.lim = 29.96/173130 = 0.00017309
5.7. Looking for Creep iperstatic.
As I said at beginning of this section, the Continuity joint produce an iperstatic Moment in
the section on the Pier. This happen because the differed deformations are impeded to
continuity joint.
All actions that act on the deck before making it continue giving a contribute; they are:
- permanent Dead Load of beams and slab giving Moment.
- permanent Load of prestressing giving Axial Force and Moment.
So I pay attention to:
- rotation of beam's edges.
- axial length shortening.
These two parameters are connected each other because every sections has an axial
deformation and a curvature which give different tendons deformation along the length.
So I have to consider the interaction between increase of differed deformation and loss of
-0,0004
-0,0002
0
0,0002
0,0004
0,0006
0,0008
0,001
0 5 10 15 20 25 30 35 40 45 50
Prestressing of support tendons_ Deformation graphs
at t = 90 days
ɛ.beam,inf
ɛbeam,sup
ɛsup,slab
ɛcc.lim
ɛct.lim

Launching of Prestressed Bridge_Case Study
prestressing because this last one reduces its action into deck during bridge's life (after t =
90 days).
But creep isn't the last differed phenomenon, there are also shrinkage and relaxation of
steel that con-caused the effect I talked above.
In order to take all these interact action in account I use a SPP analysis: linear analysis per
stage. I divide the period after making deck continue in interval and I use all of them as
independent period. At the start of every period I have the actualize value of prestressing
from the previous step that I bring at the end of the period: the value of beam's edge
rotation and Axial shortening is referred at centre of the period and the second of them is
used to calculate the beginning axial force at the next stage.
I conduct this check finding the elastic Edge rotation at t = 28 days (it is my "zero" for
creep) and dividing the Bridge's life in intervals.
5.7.1. Elastic Beam's Edge rotations.
Dead Load of beam (casting at t = 0gg; creep effects start from t = 28 days)
g1 31,875 kN/m
fg1 = (G1 L³)/(24EJ)
L 49,4 m
E 35547,10528 N/mm2
J1(t<90gg) 0,77 m4
ϕg1 0,006084786 rad
Dead Load of slab (casting at t = 43-60gg; creep effects start from t = 60 days)
g1 18.125 kN/m
L 49,4 m
E 35547,10528 N/mm2
fg1 = (G1 L³)/(24EJ)
J1(t<90gg) 0,77 m4
ϕg1 0,006084786 rad
Prestressing of Tendons 1-2-3 (applied at t = 30days;
creep effects start from t = 30 days)
fp' = (m L)/(3EJ) + (m L)/(6EJ)
fp' = (p L³)/(24EJ)
Where m= Nd*ed is the Moment caused to prestressing
at the Edge.
Np 18878,9859 kN
ep 0,146857143 m
ϕp(N) 0,00254 rad

Launching of Prestressed Bridge_Case Study
distr. -50,36122319 kNm
d CR mid span 0,11952381 m
f 0,833619048 m
ϕp(distr.) -0,009613719 rad
ϕp(tot) -0,0071 rad
5.7.2. Steel Relaxation.
µ 0,75
Low relaxation Strands (class 2) has:
t 500000
∆σpr/σpi = 0,66 ρ1000 e^9,1μ
(t/1000)^0,75(1-μ) 10 ^-5
to (g) 28
t (g) ρ1000 (t) 28 0
45 0,007075432
60 0,00796635
75 0,008561742
90 0,009018145
135 0,009989718
160 0,010390858
195 0,010859332
300 0,011899411
650 0,01389567
1000 0,015108843
1500 0,016331516
2000 0,017251975
3500 0,01918238
5000 0,020518394
7500 0,022146913
10000 0,023378436
5.7.3. Shrinkage
I calculate the total (from t = 7 days) loss of prestressing which is caused to shrinkage at every
stage:
L,parabola (ti):

Launching of Prestressed Bridge_Case Study
∆L(ti) = L,parabola (ti) - L,parabola,o
Where:
∆N,rit (ti) = ∆L(ti)/L,parabola,o*Es*As,tot
As.tot is the total prestressing steel area.
ho 366,91 L 49,4 As, tot = 0,0147 m²
ε cd,00 0,00027424 f 0,833619 Es = 2E+08 KN/m²
to (g) 7
t (g) β(t-to) ε cd(t) ε,ca ε cs,ritiro L,oriz L,parabola ∆L ∆N,rit
7 - - 0 0 49,4 49,437487
28 0 0 0,000274 0,0002742 49,3865 49,4239496 -0,013537 -784,92959
45 0,8923863 0,000245 0,000274 0,000519 49,3744 49,411869 -0,025618 -1485,3897
60 0,93979315 0,000258 0,000274 0,000532 49,3737 49,4112273 -0,02626 -1522,6008
75 0,95820502 0,000263 0,000274 0,000537 49,3735 49,410978 -0,026509 -1537,0528
90 0,96799306 0,000265 0,000274 0,0005397 49,3733 49,4108455 -0,026641 -1544,7357
135 0,98120087 0,000269 0,000274 0,0005433 49,3732 49,4106667 -0,02682 -1555,1029
160 0,98470686 0,00027 0,000274 0,0005443 49,3731 49,4106192 -0,026868 -1557,8548
195 0,98787314 0,000271 0,000274 0,0005452 49,3731 49,4105764 -0,026911 -1560,3401
300 0,99251945 0,000272 0,000274 0,0005464 49,373 49,4105135 -0,026974 -1563,9872
650 0,99671493 0,000273 0,000274 0,0005476 49,3729 49,4104567 -0,02703 -1567,2803
1000 0,99789534 0,000274 0,000274 0,0005479 49,3729 49,4104407 -0,027046 -1568,2068
1500 0,99860924 0,000274 0,000274 0,0005481 49,3729 49,410431 -0,027056 -1568,7672
2000 0,9989615 0,000274 0,000274 0,0005482 49,3729 49,4104263 -0,027061 -1569,0437
3500 0,9994099 0,000274 0,000274 0,0005483 49,3729 49,4104202 -0,027067 -1569,3957
5000 0,99958785 0,000274 0,000274 0,0005484 49,3729 49,4104178 -0,027069 -1569,5354
7500 0,99972571 0,000274 0,000274 0,0005484 49,3729 49,4104159 -0,027071 -1569,6436
10000 0,99979446 0,000274 0,000274 0,0005484 49,3729 49,410415 -0,027072 -1569,6975
I calculated the shortening of the Resultant tendons between 7 days to 10000 days.
Anyway I will take in account just values after t = 28 days and I will use the differences
between stages.
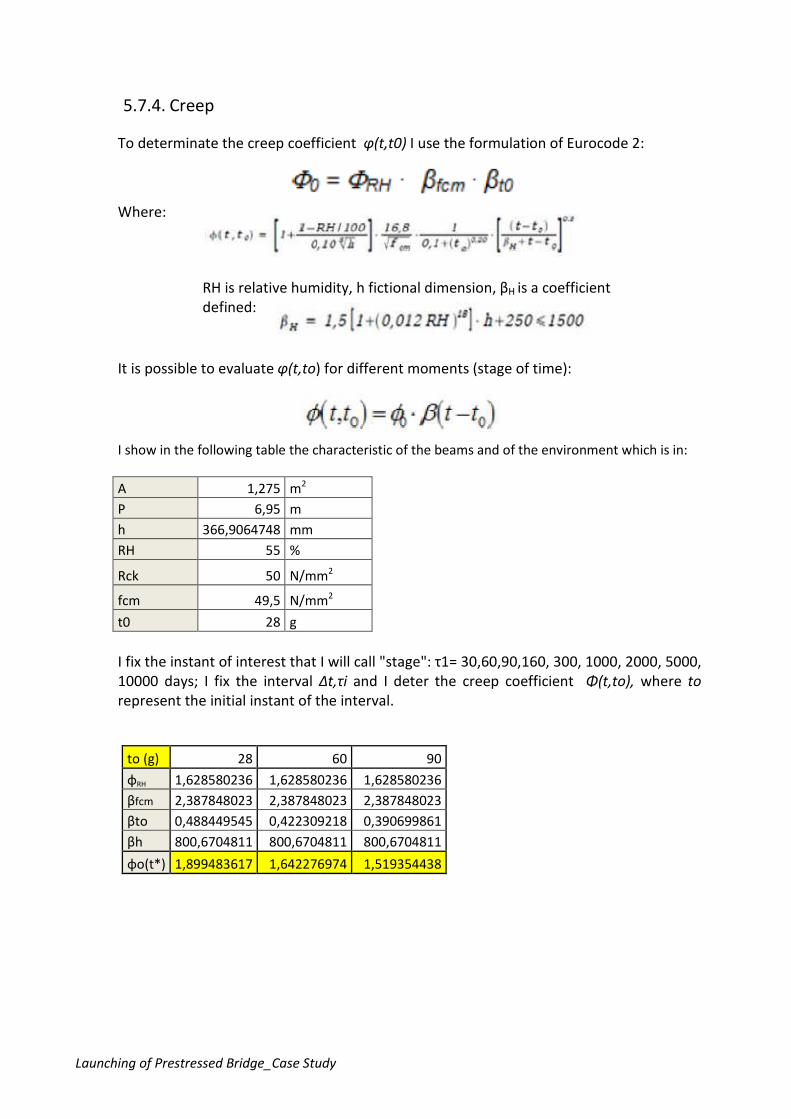
Launching of Prestressed Bridge_Case Study
5.7.4. Creep
To determinate the creep coefficient φ(t,t0) I use the formulation of Eurocode 2:
Where:
RH is relative humidity, h fictional dimension, βH is a coefficient
defined:
It is possible to evaluate φ(t,to) for different moments (stage of time):
I show in the following table the characteristic of the beams and of the environment which is in:
A 1,275 m2
P 6,95 m
h 366,9064748 mm
RH 55 %
Rck 50 N/mm2
fcm 49,5 N/mm2
t0 28 g
I fix the instant of interest that I will call "stage": τ1= 30,60,90,160, 300, 1000, 2000, 5000,
10000 days; I fix the interval Δt,τi and I deter the creep coefficient Φ(t,to), where to
represent the initial instant of the interval.
to (g) 28 60 90
φRH 1,628580236 1,628580236 1,628580236
βfcm 2,387848023 2,387848023 2,387848023
βto 0,488449545 0,422309218 0,390699861
βh 800,6704811 800,6704811 800,6704811
φo(t*) 1,899483617 1,642276974 1,519354438

Launching of Prestressed Bridge_Case Study
Note: even thought it is impossible to watch out I want to underline that the origins of these
last 3 curves are different (t =28 days, 60 days, 90 days).
to (g) 28 60 90
t (g) β(t-to) φ(t,to) β(t-to) φ(t,to) β(t-to) φ(t,to)
28 0 0 - - - -
45 0,312868025 0,594287688 - -
60 0,376186359 0,714559825 0 0 - -
75 0,419914856 0,797621389 0,301559458 0,49524415 - -
90 0,453904016 0,862183243 0,369239151 0,60639295 0 0
120 0,50574197 0,960648587 0,449773955 0,73865341 0,369239151 0,56100514
135 0,526546427 1,000166311 0,478427534 0,78571052 0,414766243 0,63017693
160 0,556229105 1,056548072 0,517166305 0,84933031 0,469432621 0,71323454
195 0,5903325 1,121326912 0,559452543 0,91877603 0,523920903 0,79602155
300 0,662568481 1,258537975 0,643975584 1,05758627 0,62414129 0,94829184
650 0,780199772 1,481976685 0,773193746 1,26979829 0,766179485 1,1640982
1000 0,835048068 1,586160125 0,831234168 1,36511673 0,827489533 1,2572499
1500 0,877831987 1,667427477 0,875780659 1,43827441 0,873792937 1,32760118
2000 0,902822961 1,714897422 0,901536828 1,48057317 0,900299465 1,36787399
3500 0,939645623 1,784841465 0,939154783 1,54235228 0,938687289 1,4261987
5000 0,956194642 1,816276056 0,955937061 1,56991342 0,955692807 1,45203611
7500 0,969923186 1,842353201 0,969802091 1,59268364 0,969687675 1,47329927
10000 0,977096974 1,855979694 0,977026847 1,60454869 0,976960711 1,48434959
0
0,2
0,4
0,6
0,8
1
1,2
1,4
1,6
1,8
2
0 2000 4000 6000 8000 10000 12000
φ(t,to)
t (days)
φ(t,to)
φ(t,28)
φ(t,60)
φ(t,90)

Launching of Prestressed Bridge_Case Study
5.7.5. Interaction
Now I have all element to make the analysis.
The parameter that permit to evaluate the difference of prestressing at each stage is
εcls,average: it is calculated averaging all ɛ.concrete at the quote of resultant tendon
along all length. In fact I will have different elastic deformation caused to:
- uniform vertical equivalent load of prestressing: p[N(t)]
- Prestressing axial force: N(t)
at every each stage.
In order to calculate the creep deformation I will use:
∆f(τi) = fel(ti-1) * φ(ti;ti-1)
in that interval Δt,τi = (ti;ti-1) which has name: τ1.
I have to specify that:
• φ(ti,ti-1) = φ(t00,to) [β(ti-to) - β((ti-1)-to)]
Where : β(ti-to) = [(ti-to)/(βh+t-to)]³
• fel(ti-1) will have to calculate every time I change stage and I have to
apply this new value at the beginning of the next interval (that I general
called t,i-1) because I will have a different value of N at the start of every
stage.
In summary, I have:
1. interaction of 3 differed effect: creep, shrinkage, relaxation.
2. creep effects of dead load start at t = 28 days.
At t = 90 days, I have:
3. changing of static scheme.
4. in that moment the slab is unstressed.
5. changing resistant section because the slab is hardened: thanks to
connectors between beam and slab, differed deformations in the beam
involve also the slab. From this moment to the rest of the bridge life, I have
to calculate fel(ti-1) with the following formula:
φ,g1,el,tr,90 = g1.beam L³/(24EJ.beam+slab)
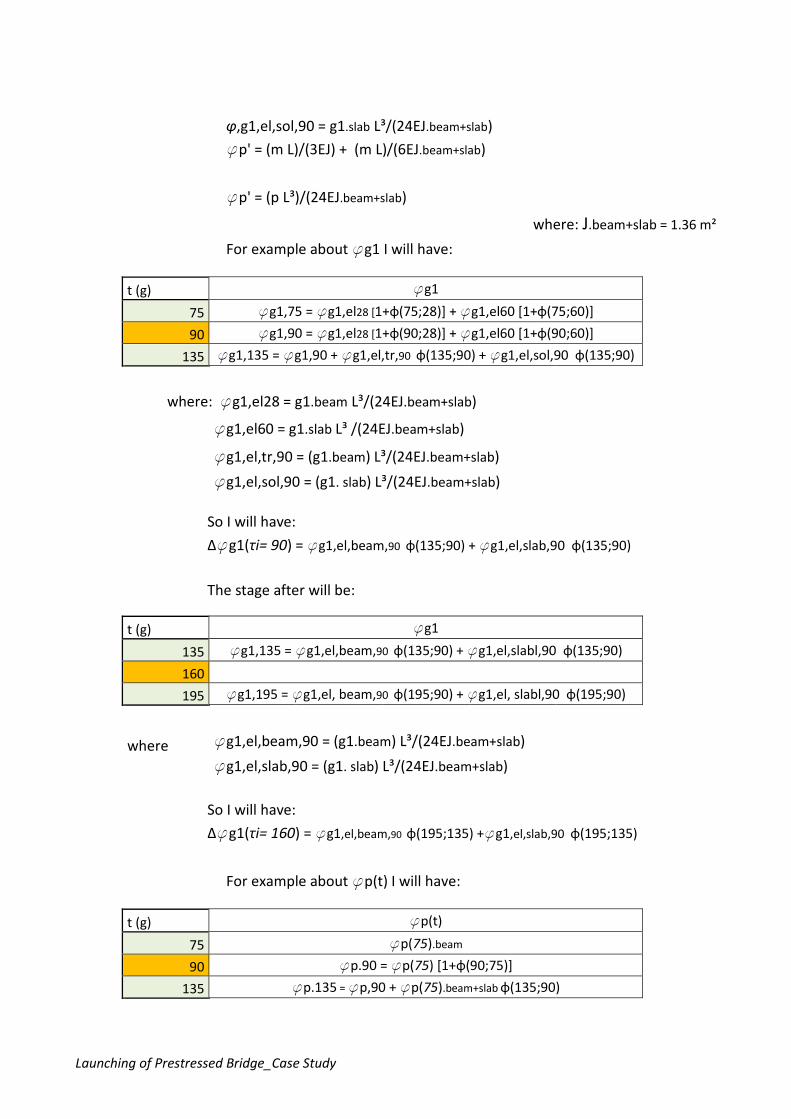
Launching of Prestressed Bridge_Case Study
φ,g1,el,sol,90 = g1.slab L³/(24EJ.beam+slab)
fp' = (m L)/(3EJ) + (m L)/(6EJ.beam+slab)
fp' = (p L³)/(24EJ.beam+slab)
where: J.beam+slab = 1.36 m²
For example about fg1 I will have:
t (g) fg1
75 fg1,75 = fg1,el28 [1+φ(75;28)] + fg1,el60 [1+φ(75;60)]
90 fg1,90 = fg1,el28 [1+φ(90;28)] + fg1,el60 [1+φ(90;60)]
135 fg1,135 = fg1,90 + fg1,el,tr,90 φ(135;90) + fg1,el,sol,90 φ(135;90)
where: fg1,el28 = g1.beam L³/(24EJ.beam+slab)
fg1,el60 = g1.slab L³ /(24EJ.beam+slab)
fg1,el,tr,90 = (g1.beam) L³/(24EJ.beam+slab)
fg1,el,sol,90 = (g1. slab) L³/(24EJ.beam+slab)
So I will have:
∆fg1(τi= 90) = fg1,el,beam,90 φ(135;90) + fg1,el,slab,90 φ(135;90)
The stage after will be:
t (g) fg1
135 fg1,135 = fg1,el,beam,90 φ(135;90) + fg1,el,slabl,90 φ(135;90)
160
195 fg1,195 = fg1,el, beam,90 φ(195;90) + fg1,el, slabl,90 φ(195;90)
where fg1,el,beam,90 = (g1.beam) L³/(24EJ.beam+slab)
fg1,el,slab,90 = (g1. slab) L³/(24EJ.beam+slab)
So I will have:
∆fg1(τi= 160) = fg1,el,beam,90 φ(195;135) +fg1,el,slab,90 φ(195;135)
For example about fp(t) I will have:
t (g) fp(t)
75 fp(75).beam
90 fp.90 = fp(75) [1+φ(90;75)]
135 fp.135 = fp,90 + fp(75).beam+slab φ(135;90)

Launching of Prestressed Bridge_Case Study
where: fp(75).beam = p(75) L³/(24EJ.beam)
fp(75).beam+slab = p(75) L³ /(24EJ.beam+slab)
So I will have:
∆fp(τi= 90) = fp(75).beam+slab φ(135;90)
The stage after will be:
t (g) fp(t)
135 fp(135).beam+slab
160
195 fp.195 = fp(135).beam+slab [1+φ(195;135)]
where: fp(135).beam+slab = p(135) L³ /(24EJ.beam+slab)
So I will have:
∆fp(τi= 160) = fp(135).beam+slab φ(195;135)
I have to do the same for fm(t).
In conclusion I will have for every stage:
∆f.sx.Φ (τi) = ∆f g1(τi) + ∆f p(τi) + ∆f m(τi)
and I also calculate progressive value which will be named: f.sx.Φ (τi). I named "sx" because is referred to simply supported beam: I will have to find
the ∆f.tot on the support in the continuity beam's scheme with Muller-
Breslau.
6. I have to calculate ɛ.concrete average at the resultant tendon quote at every
stage, so I can obtain the Prestressing loss at the end of that stage itself.
L = 50 m A,cls tr = 1,275 cm²
D = 2,2 Ecls = 35547105 KN/m²
yG= 1,10 J1(t<90gg) = 0,77 m⁴

Launching of Prestressed Bridge_Case Study
ep = 0,1468571 cm J1(t>90gg) 1,36 m⁴
f = 0,833619 m
d,inf = 0,1195238 m
D-yG 1,1 m
∆L(ti − 1) = ! ɛ(x)#x$%
At this point, I can find L(ti) at the end of interval:
ΔL(ti) = ∆L,el (ti-1)*(1 + φ(ti;ti-1))
and finally the shortening of Resultant tendon in that interval:
∆L,visc (τi)=ΔL(ti) - ∆L(ti-1) so:
ɛ.concrete average = ∆L,visc (τi)/L
Whit this value I am able to calculate Prestressing Loss at the beginning of every stage:
N(ti) = N(ti-1) - Es As εc,avarage (ti) - [∆N,sh(ti-1) - ∆N, sh(ti-2)] - [∆N,relax(ti-1) - ∆N,relax(ti-2)]
For example:
N(75) =N(45) - Es As εc,avarage (75)-[∆N, sh(75) - ∆N, sh(45)]-[∆N, relax (75)-∆N, relax(45)]
This loss generate an decrease of f(p) and f(m) at every stage that it will be take in
account as named:
fsx.ΔN
which is a progressive value.
I show the following table where there is everything I talked until now:

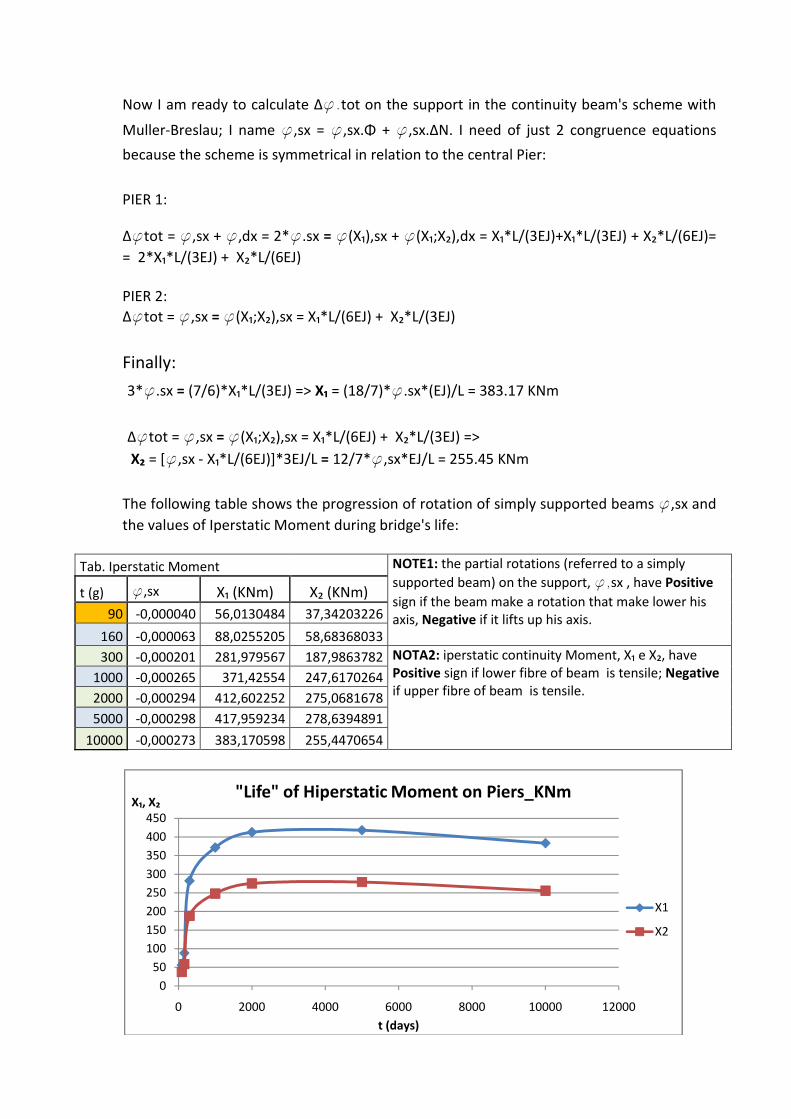
Now I am ready to calculate ∆f.tot on the support in the continuity beam's scheme with
Muller-Breslau; I name f,sx = f,sx.Φ + f,sx.ΔN. I need of just 2 congruence equations
because the scheme is symmetrical in relation to the central Pier:
PIER 1:
Δ�tot = f,sx + f,dx = 2*f.sx = f(X₁),sx + f(X₁;X₂),dx = X₁*L/(3EJ)+X₁*L/(3EJ) + X₂*L/(6EJ)=
= 2*X₁*L/(3EJ) + X₂*L/(6EJ)
PIER 2:
Δ�tot = f,sx = f(X₁;X₂),sx = X₁*L/(6EJ) + X₂*L/(3EJ)
Finally:
3*f.sx = (7/6)*X₁*L/(3EJ) => X₁ = (18/7)*f.sx*(EJ)/L = 383.17 KNm
Δ�tot = f,sx = f(X₁;X₂),sx = X₁*L/(6EJ) + X₂*L/(3EJ) =>
X₂ = [f,sx - X₁*L/(6EJ)]*3EJ/L = 12/7*f,sx*EJ/L = 255.45 KNm
The following table shows the progression of rotation of simply supported beams f,sx and
the values of Iperstatic Moment during bridge's life:
Tab. Iperstatic Moment NOTE1: the partial rotations (referred to a simply
supported beam) on the support, f,sx , have Positive
sign if the beam make a rotation that make lower his
axis, Negative if it lifts up his axis.
t (g) f,sx X₁ (KNm) X₂ (KNm)
90 -0,000040 56,0130484 37,34203226
160 -0,000063 88,0255205 58,68368033
300 -0,000201 281,979567 187,9863782 NOTA2: iperstatic continuity Moment, X₁ e X₂, have
Positive sign if lower fibre of beam is tensile; Negative
if upper fibre of beam is tensile. 1000 -0,000265 371,42554 247,6170264
2000 -0,000294 412,602252 275,0681678
5000 -0,000298 417,959234 278,6394891
10000 -0,000273 383,170598 255,4470654
0
50
100
150
200
250
300
350
400
450
0 2000 4000 6000 8000 10000 12000
X₁, X₂
t (days)
"Life" of Hiperstatic Moment on Piers_KNm
X1
X2

Launching of Prestressed Bridge_Case Study
The Positive Moment is caused to Prestressing:
5.8. Qp combination: Permanent No-Structural Load at t = 120 days.
At t = 120 days I will finish to apply the permanent no-resistance Load: the bridge is ready
to useful.
I have to check that my slab doesn't overcome the widening of joint limit w1 = 0.2 mm and
that my beam isn't decompressed at lower side.
Firstly, I show the Moment act in the deck:
Where: M.creep is the effect of Iperstatic Moment I found before.
M' prestress is the effect of Support Tendons.
M.Qp is the effect of Quasi permanent combination.
0,0
0,0
0,0
0,0
0,0
0,0
0,0
0,0
0 2000 4000 6000 8000 10000 12000
ffff
t (days)
"Life" of rotation at the Edge of simply supported beam's
scheme.
f,sx
f,sx,ΔN
f,sx.Φ
-600
-500
-400
-300
-200
-100
0
100
200
300
400
500
0 4 8 12
16
20
24
28
32
36
40
44
48
52
56
60
64
68
72
76
80
84
88
92
96
10
0
Bending Moments at t = 120 days_tm
M.Qp
M.creep
M'.Pres

Launching of Prestressed Bridge_Case Study
Note: Negative sign means tensile fibre.
How it is evident I have to check just the sections where Support tendons are anchored.
At 53.5 m I have the worst- section scenario:
M = -750 tm; N = 381 t.
σc,slab = - 26.7 Kg/cm² < σct,slab.kimit = 27.9 kg/cm²
5.9. Qp combination: Permanent No-resistance Load at t = 00 days.
I repeat the same checks but considering the total tendon losses at t = 00 in Resultant
Span Tendon and in Support Tendon:
-100,00
-50,00
0,00
50,00
100,00
150,00
200,00
250,00
0
4,5 9
13
,5 18
22
,5 27
31
,5 36
40
,5 45
49
,5 54
58
,5 63
67
,5 72
76
,5 81
85
,5 90
94
,5 99
Qp stress_kg/cm²
σci.beam
σce,beam
σce,slab
412,10439,56
0,00
50,00
100,00
150,00
200,00
250,00
300,00
350,00
400,00
450,00
500,00
0
4,5 9
13
,5 18
22
,5 27
31
,5 36
40
,5 45
49
,5 54
58
,5 63
67
,5 72
76
,5 81
85
,5 90
94
,5 99
Axial Force Loss in Span Resultant tendon_tons
Ds C+s+r*Ap

Launching of Prestressed Bridge_Case Study
1475,80
1671,32
1300,00
1350,00
1400,00
1450,00
1500,00
1550,00
1600,00
1650,00
1700,00
0
4,5 9
13
,5 18
22
,5 27
31
,5 36
40
,5 45
49
,5 54
58
,5 63
67
,5 72
76
,5 81
85
,5 90
94
,5 99
Axial Force in Span Resultant tendon
at t = 00_tons
N
450,0271
0
50
100
150
200
250
300
350
400
450
500
0 4,5
9 13
,5
18
22
,5
27
31
,5
36
40
,5
45
49
,5
54
58
,5
63
67
,5
72
76
,5
81
85
,5
90
94
,5
99
Axial Force Prestressing of Support
Tendons_tons
N'
-600
-500
-400
-300
-200
-100
0
100
200
300
400
500
0 4,5
9 13
,5
18
22
,5
27
31
,5
36
40
,5
45
49
,5
54
58
,5
63
67
,5
72
76
,5
81
85
,5
90
94
,5
99
Bending Moments Qp at t = 00 days_tm M.Qp
M.creep
M'.Pres

Launching of Prestressed Bridge_Case Study
At 53.5 m I have the worst- section scenario:
M = -6950 tm; N = 3350 t.
σc,slab = - 24.9 Kg/cm² < σct,slab.limit = 27.9 kg/cm²
5.10. Frequent combination.
As explained in the chapter 4.9, I have to consider the effects of traffic Load. In previous
Launching I didn't use Frequent combination because I checked no-cracking of deck under
Rara_combination stress.
This combination is composed by:
SLE_Freq = G1 + 0.5 x Tk envelope + 0.75 x Tandem Load + 0.4 Uniform Traffic Load
-50,00
0,00
50,00
100,00
150,00
200,00
0
4,5 9
13
,5 18
22
,5 27
31
,5 36
40
,5 45
49
,5 54
58
,5 63
67
,5 72
76
,5 81
85
,5 90
94
,5 99
Qp stress_kg/cm²σci.beam
σce,beam
σce,slab
-800
-600
-400
-200
0
200
400
600
800
0 5 10 15 20 25 30 35 40 45 50 55 60 65
Bending Moment_Freq. comb_tm
M.Freq.Min
M. Freq.Max

Launching of Prestressed Bridge_Case Study
I have the biggest Positive Moment in the External Span.
Regarding Negative Moment, I have to check all zone across the Pier and I know that the
worst-scenario is at section 53.5m.
It is this check that lead my Reinforcement arrangement in slab and beam.
At 53.5 m I have the worst- section scenario:
M = -9216 tm; N = 3350 t.
This section has Support section form: if I check it I will make all other sections sure:
Geometrical Date:
B.slab = 290 cm
s.resistant slab = 19 cm (without predal width)
H.beam = 220 cm
b.beam = 105 cm
As1 = 153.9 cm² (29φ26)
-1000
-800
-600
-400
-200
0
200
400
0 5 10 15 20 25 30 35 40 45 50 55 60 65
Bending Moment_Freq.Min + M.Prestress_tm
M.Freq.Min+M'.Prestress
-100,00
-50,00
0,00
50,00
100,00
150,00
200,00
250,00
0 5 10 15 20 25 30 35 40 45 50 55 60 65
Stress_Freq. comb_Kg/cm²
σci.beam
σce,beam
σce,slab

Launching of Prestressed Bridge_Case Study
As2 = 153.9 cm² (29φ26)
As3 = 53 cm² (10φ26)
Steel class of reinforcement: B450C
and I find that the most external row of reinforcements has:
σs.reinf = - 895 Kg/cm² < σs.limit (w1= 0.2) = 1080 kg/cm²
Ac B s⋅ 5.8 2.5⋅+ 5.524 103×=:=
φ = 2.6 mm
pB
29:=
Srm 26
10p+
⋅ 0.1250.4⋅φ
Asl
Ac
⋅+ 23.803=:=
εsm0.2
1.7 Srm⋅ 10⋅4.943 10
4−×=:=
4.943 104−×
σs
21000000
0.5σsr002⋅
21000000
1
σs⋅− 0.0004943
σs
21000000
0.24662292917932592471
σs−→ solve
477.01318233963017926−
10857.313182339630179
→
σs 1085.7:=Kg
cm²
Asl As1 As2+ As3+ 360.849=:=
e y( )M
NYg+ y−:=
Sn y( ) n− As1⋅ y c−( )⋅ n As2⋅ y 18−( )( )⋅− n As3⋅ y S− 5.8−( )⋅− bD S+ y−( )
2
2⋅+:=
Jn y( ) n As1⋅ y c−( )2⋅ n As2⋅ y 18−( )
2 ⋅+ bD S+ y−( )
3
3⋅+ n As3⋅ y S− 5.8−( )
2⋅+:=
Jn y( ) Sn y( ) e y( )⋅− 0

Launching of Prestressed Bridge_Case Study
5.11. Rara combination. As I said in 4.9 chapter I will have:
SLE_Rara: ∑ G1 + (qk,unif + Qk,tandem + qk,crowd) + qk,wind
I have to check the tension limit:
σc.conc.slab.limit = 224.1 kg/cm²
ɛc.conc.beam.limit = σc.conc.beam/Ecm = 6.3 x 10&'
ɛs.reinf.limit = σs.reinf.beam/Es = -1.56 x 10&�
ɛs.Tendon.limit = [0.8 fpyk0.1 - (σpi-Δσ.Losses)]/Es.p
Regarding M.Rara max I report just values of external span where I will have the biggest
Positive Moment:
0
100
200
300
400
500
600
700
800
900
0 2,5
5 7,5
10
12
,5
15
17
,5
20
22
,5
25
27
,5
30
32
,5
35
37
,5
40
42
,5
Bending Moment_M.Rara.Max_tm
M.Rara.Max
0
20
40
60
80
100
120
140
0 2 4 6 8
10
12
14
16
18
20
22
24
26
28
30
32
34
36
38
40
42
σsup,slab_kg/cm²
σsup,slab

Launching of Prestressed Bridge_Case Study
Regarding Negative Moment, I report values in that zone across Piers and I check that
section in the worst-scenario:
-0,002
-0,0015
-0,001
-0,0005
0
0,0005
0,001
0
2,5 5
7,5 10
12
,5 15
17
,5 20
22
,5 25
27
,5 30
32
,5 35
37
,5 40
42
,5
Strain of beam_Rara
εsup,trave
εinf,armature
εc.beam.limit
εs.reinf.limit
-0,002
-0,0015
-0,001
-0,0005
0
0,0005
1 5 9 13172125293337414549535761656973778185
Strain of Resultant Tendon_Rara
εinf,cavo
εs.tendon.limit
-1000
-800
-600
-400
-200
0
200
34
,5
37
39
,5
42
44
,5
47
49
,5
52
54
,5
57
59
,5
62
64
,5
67
69
,5
72
74
,5
77
79
,5
82
84
,5
87
89
,5
92
94
,5
97
99
,5
Bending Moment with M.Rara_Min
M.Rara_Min

Launching of Prestressed Bridge_Case Study
At 53.5 m I have the worst- section scenario:
M = -9829 tm; N = 3350 t.
σs.reinf = 982 Kg/cm²
ɛc.top beam = - 9.31x10( < ɛc.t.lim = -1.68 x 10'
If I had the support Tendons that crossing this section (so at quote 210 cm ) and I
took in account just Friction Loss without the effect of Differed Losses, it would
have this stress:
σs = 434 kg/cm² < 0.8 fpyk0,1 - (σpi - Friction Loss) = 13360- (13950 - 2900) = 2310 Kg/cm²
I also show that the other section outside this zones don't overcome σtensile.conc.slab.limit
and that upper side of beam is compressed:
Note: Positive sign means compression, Negative sign means Tensile.
5.12. Bending Moments of SLU combination
As I said in 4.9 chapter I will have:
SLU: ∑1,3 G.permanent + 1,35 (qk,unif + Qk,tandem + qk,crowd) + 1,5x0,6xqk,vento
I focus on 2 steps:
1. scenario at t = 90 days before Prestressing of Support Tendons; resistant section:
beam.
2. scenario at t = 00; resistant section: Slab+beam.
-0,0002
-0,0001
0
0,0001
0,0002
0,0003
0,0004
0,0005
34
,5
37
39
,5
42
44
,5
47
49
,5
52
54
,5
57
59
,5
62
64
,5
67
69
,5
72
74
,5
77
79
,5
82
84
,5
87
89
,5
92
Strain in the others section outside Support Zone
εsup,solet
εtrave,TOT
εct.slab.lim

Launching of Prestressed Bridge_Case Study
5.12.1. Scenario t = 90 days.
To calculate of Mrd I linearised the Resistance along the beam, taking 5 section as
reference and I use the Vca_Slu Gelfi Program. Regarding value of stress in
Resultant tendons at t = 90 days I have:
Z (m) from
the abutment
Δσp(90days) Kg/cm² σp(90days) Kg/cm² MRd
tm
0 616 12880-616 = 12264 2073
2.9 636 12880-636 = 12244 2533
24,7 1041 12880-1041 =
11839
3056
46.5 636 12880-636 = 12244 2533
49.4 616 12880-616 = 12264 2073
Every section is checked.
0,00
200,00
400,00
600,00
800,00
1000,00
1200,00
0 3 6 9 12 15 18 21 24 27 30 33 36 39 42 45 48
Bending Moment_External
Span_SLU_Slab+beam_t=90 before continuity_tm
M trave
Mg1 (soletta)
0,00
500,00
1000,00
1500,00
2000,00
2500,00
3000,00
3500,00
0 3 6 9 12 15 18 21 24 27 30 33 36 39 42 45 48
Bending Moment_External Span_SLU_Slab+beam_t=90
before continuity_tm
Med_SLU
Mrd_max
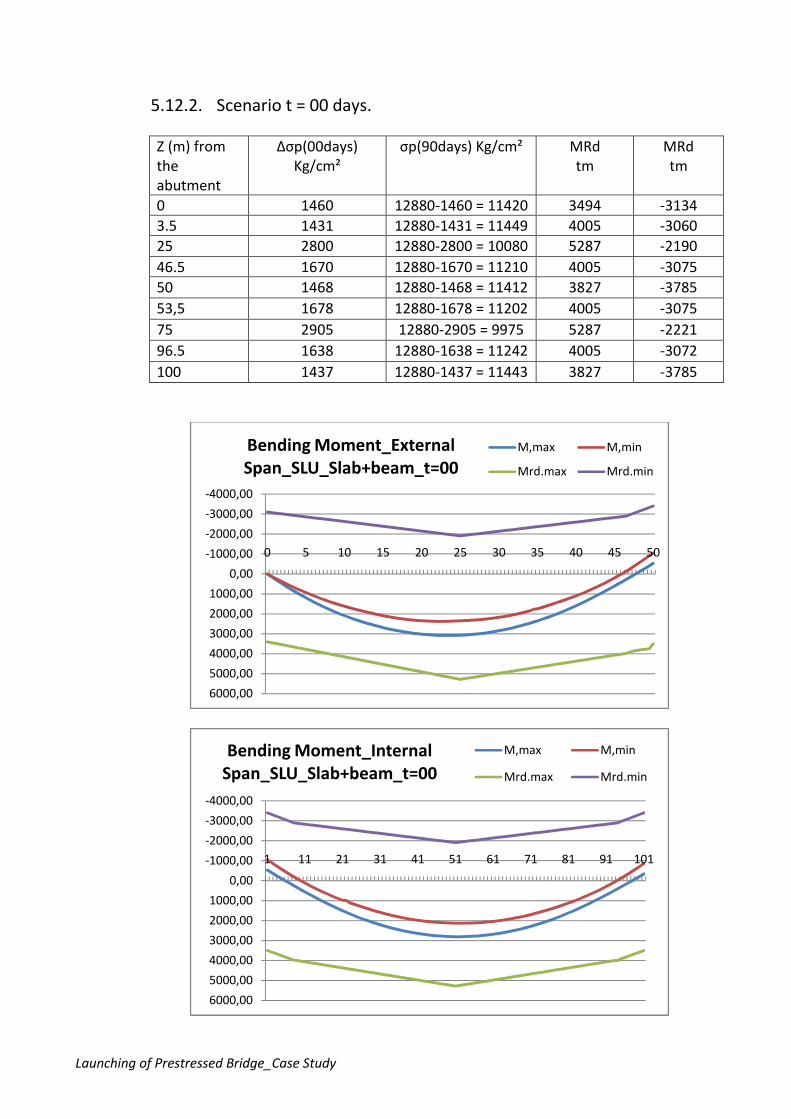
Launching of Prestressed Bridge_Case Study
5.12.2. Scenario t = 00 days.
Z (m) from
the
abutment
Δσp(00days)
Kg/cm²
σp(90days) Kg/cm² MRd
tm
MRd
tm
0 1460 12880-1460 = 11420 3494 -3134
3.5 1431 12880-1431 = 11449 4005 -3060
25 2800 12880-2800 = 10080 5287 -2190
46.5 1670 12880-1670 = 11210 4005 -3075
50 1468 12880-1468 = 11412 3827 -3785
53,5 1678 12880-1678 = 11202 4005 -3075
75 2905 12880-2905 = 9975 5287 -2221
96.5 1638 12880-1638 = 11242 4005 -3072
100 1437 12880-1437 = 11443 3827 -3785
-4000,00
-3000,00
-2000,00
-1000,00
0,00
1000,00
2000,00
3000,00
4000,00
5000,00
6000,00
0 5 10 15 20 25 30 35 40 45 50
Bending Moment_External
Span_SLU_Slab+beam_t=00
M,max M,min
Mrd.max Mrd.min
-4000,00
-3000,00
-2000,00
-1000,00
0,00
1000,00
2000,00
3000,00
4000,00
5000,00
6000,00
1 11 21 31 41 51 61 71 81 91 101
Bending Moment_Internal
Span_SLU_Slab+beam_t=00
M,max M,min
Mrd.max Mrd.min

Launching of Prestressed Bridge_Case Study
5.13. Shear Force of SLU combination.
Like I did in the previous chapter I consider two different stage:
1. scenario at t = 90 days before Prestressing of Support Tendons; resistant section:
beam.
2. scenario at t = 00; resistant section: Slab+beam.
5.13.1. Scenario t = 90 days.
I will use the same diameter for all length φ = 10 mm, except in that 10 metres across
Piers where I use φ = 12 mm:
I will place 3 brackets in the Support sections, 2 Brackets in Span sections and 4
brackets in 1.5 m from the end section of Support section:
I will place brackets at the same costant distance: 200 mm.
10
12
9
9,5
10
10,5
11
11,5
12
12,5
0 5
10
15
20
25
30
35
40
45
50
55
60
65
70
75
80
85
90
95
10
0
φ,Brackets
φ,brackets
6
4
2
0
1
2
3
4
5
6
7
0 5 10 15 20 25 30 35 40 45 50 55 60 65 70 75 80 85 90 95 100
n° brackets
n° brackets
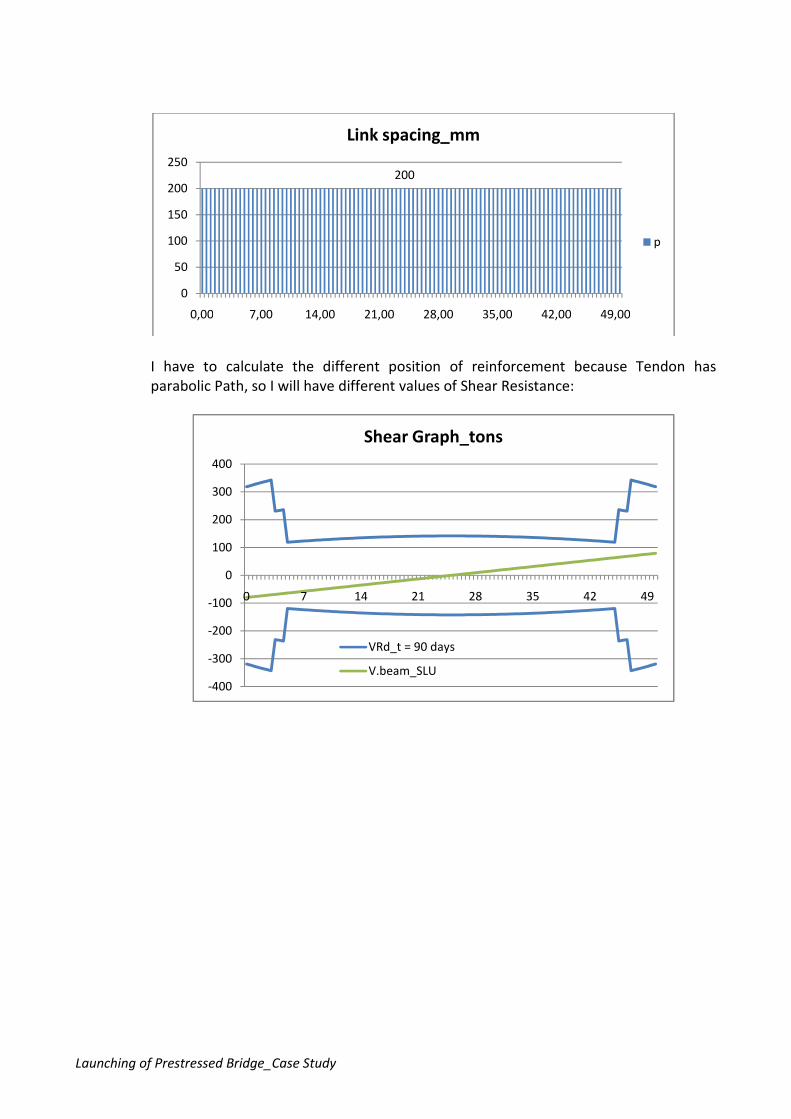
Launching of Prestressed Bridge_Case Study
I have to calculate the different position of reinforcement because Tendon has
parabolic Path, so I will have different values of Shear Resistance:
200
0
50
100
150
200
250
0,00 7,00 14,00 21,00 28,00 35,00 42,00 49,00
Link spacing_mm
p
-400
-300
-200
-100
0
100
200
300
400
0 7 14 21 28 35 42 49
Shear Graph_tons
VRd_t = 90 days
V.beam_SLU

Launching of Prestressed Bridge_Case Study
5.13.2. Scenario t = 00 days.
As it is evident, the sections at 46.5, 53.5 and 96.5 m are the most stressed. It is the
reason cause I use φ = 12 mm for brackets between these sections across the Pier.
-800
-600
-400
-200
0
200
400
600
800
0 4 8
12
16
20
24
28
32
36
40
44
48
52
56
60
64
68
72
76
80
84
88
92
96
10
0
Shear Graph_tons VRd_t = 00
V,max
V,min

Launching of Prestressed Bridge_Case Study
Bibliography:
• Bridge Engineering Handbook, 2° Ediction
Edit. Wai-Fah chen Lian Duan
• Prestressed concrete bridge: Design and Constuction
Nigel R. Hewson, Ed. Thomas Telford
• Prestressed concrete bridge: Design and Constuction
Nigel R. Hewson, Ed. Thomas Telford
• Prestressed concrete bridge
Christian Menn, Ed. Thomas Telford
• Progettazione e Costruzioni di Ponti IV Edizione
Petrangeli Mario, Edit: CEA
• Tecnica delle Costruzioni, Seconda Edizione V.2
Emanuele Filiberto Radogna, Edit: MASSON
• Dispense del Corso di Teoria e progetto di ponti tenuto dal Prof. Ing. Caramelli
Andrea Belli, Radogna, Edit: TEP
• Ponti in calcestruzzo prefabbricato, Edizione Italiana
AICAP, Edit: FIB
• COSTRUZIONI DI PONTI, tavole e dettagli di elementi costruttivi e di insieme strutturale.
Parte seconda : PONTI IN CALCESTRUZZO
Cosimo Bianco Radogna, Edit: ROMA
• Manual of Bridge Engineering
Ryall, Parke, Harding, Ed. Thomas Telford
• Il cemento Armato, 2° Edizione
Aurelio Ghersi, Ed. Dario Flaccovio
• PROGETTAZIONE DI STRUTTURE IN CALCESTRUZZO ARMATO: Guida all'uso di Eurocodice 2.
V.1.
AICAP