Embed Size (px)
Citation preview

Launch Vehicle Business
Workshop
Faculty
John M. Jurist, Ph.D.
David L. Livingston, D.B.A.
Tasks Characterize notional vehicle Principles of cost engineering Estimate development costs Estimate production costs Synthesis of financial proforma Market assumptions / factors
Goals for Participants Step through process of notional vehicle
characterization Gather data required for cost estimation Learn principles and concepts of Transcost Estimate development and production costs Synthesis of financial proforma Study variable sensitivities Discuss market assumptions / factors
Characterize Notional Vehicle Define mission characteristics Incorporate understanding of technology Rough out vehicle concept
Notional Vehicle Disclaimer
Any similarity to Space-X Falcon-1 is purely coincidental
Public domain information from Space-X is useful for sanity checks
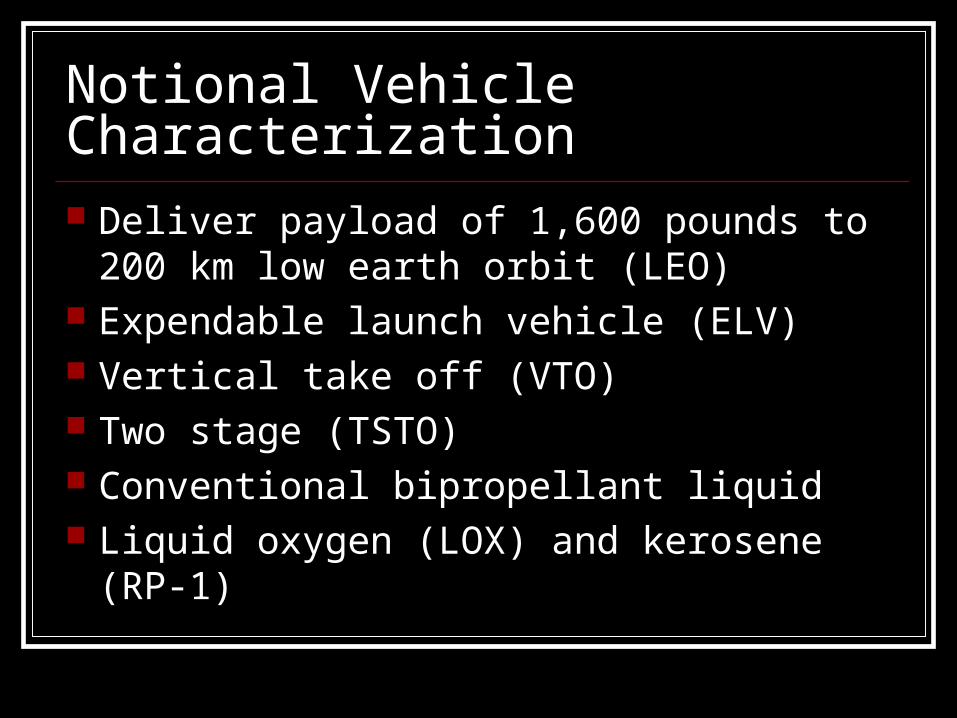
Notional Vehicle Characterization
Deliver payload of 1,600 pounds to 200 km low earth orbit (LEO)
Expendable launch vehicle (ELV) Vertical take off (VTO) Two stage (TSTO) Conventional bipropellant liquid Liquid oxygen (LOX) and kerosene (RP-1)
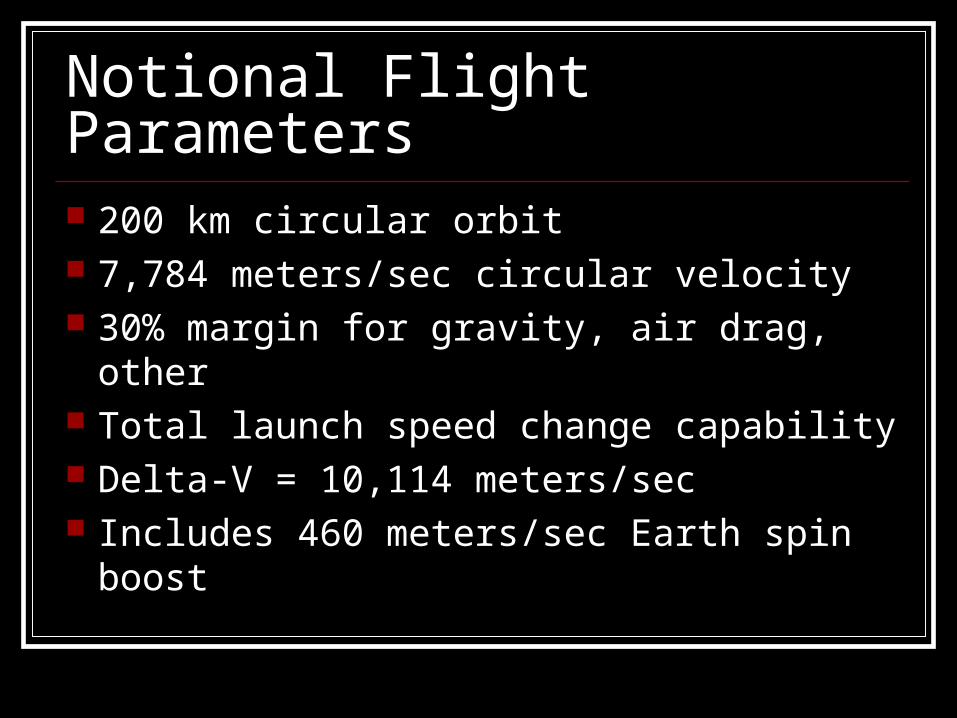
Notional Flight Parameters 200 km circular orbit 7,784 meters/sec circular velocity 30% margin for gravity, air drag, other Total launch speed change capability Delta-V = 10,114 meters/sec Includes 460 meters/sec Earth spin boost
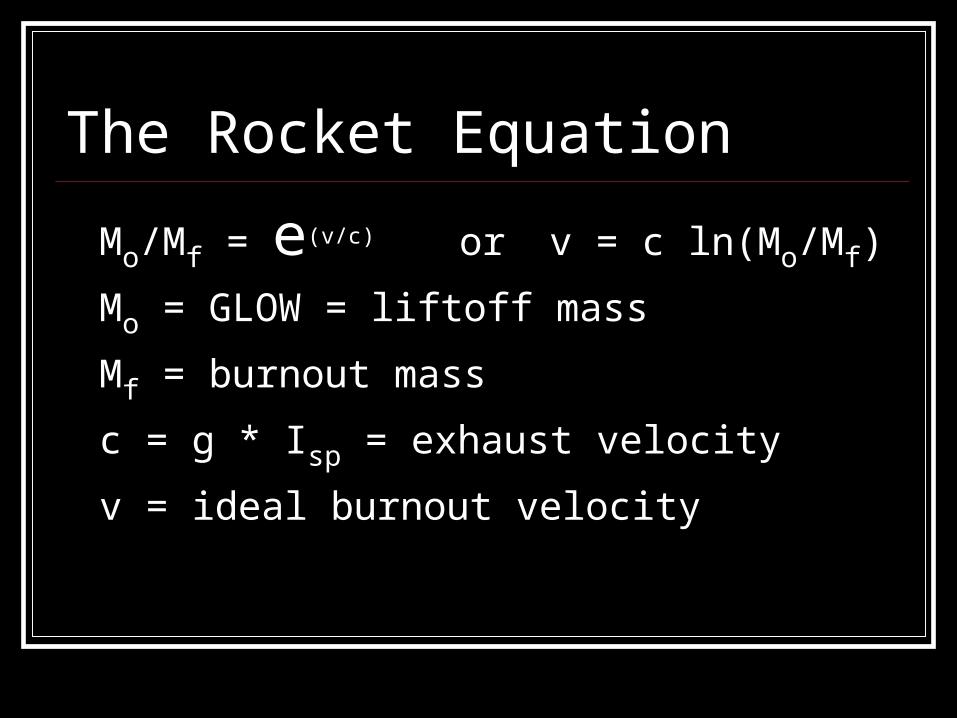
The Rocket Equation
Mo/Mf = e(v/c) or v = c ln(Mo/Mf)
Mo = GLOW = liftoff mass
Mf = burnout mass
c = g * Isp = exhaust velocity
v = ideal burnout velocity
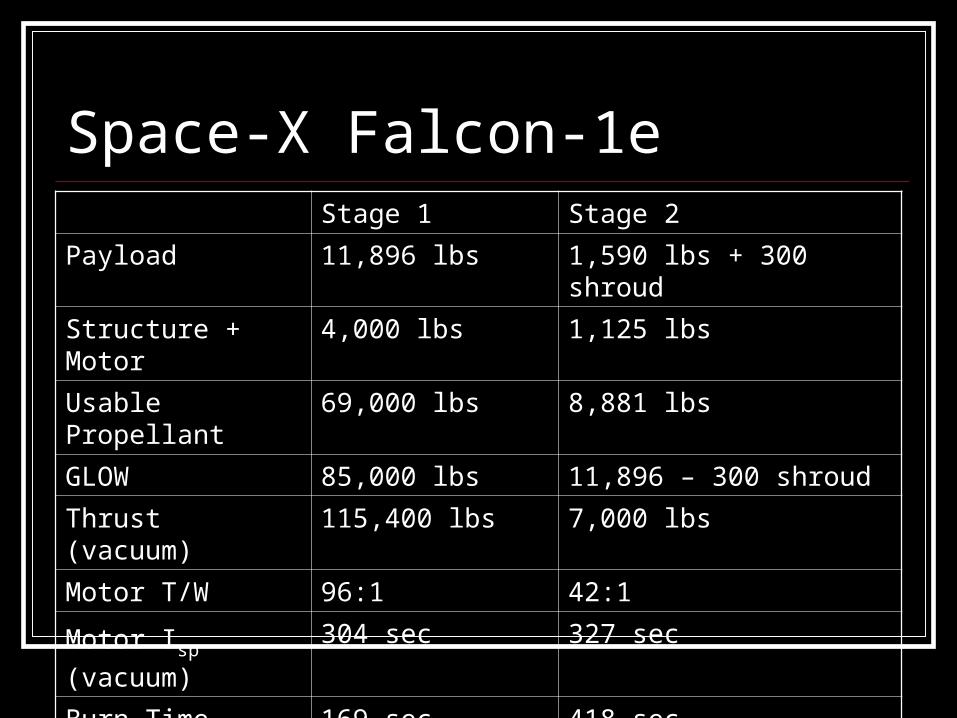
Space-X Falcon-1eStage 1 Stage 2
Payload 11,896 lbs 1,590 lbs + 300 shroud
Structure + Motor 4,000 lbs 1,125 lbs
Usable Propellant 69,000 lbs 8,881 lbs
GLOW 85,000 lbs 11,896 – 300 shroud
Thrust (vacuum) 115,400 lbs 7,000 lbs
Motor T/W 96:1 42:1
Motor Isp (vacuum) 304 sec 327 sec
Burn Time 169 sec 418 sec
Delta-V (ideal) 4,995 meters/sec 4,653 meters/sec
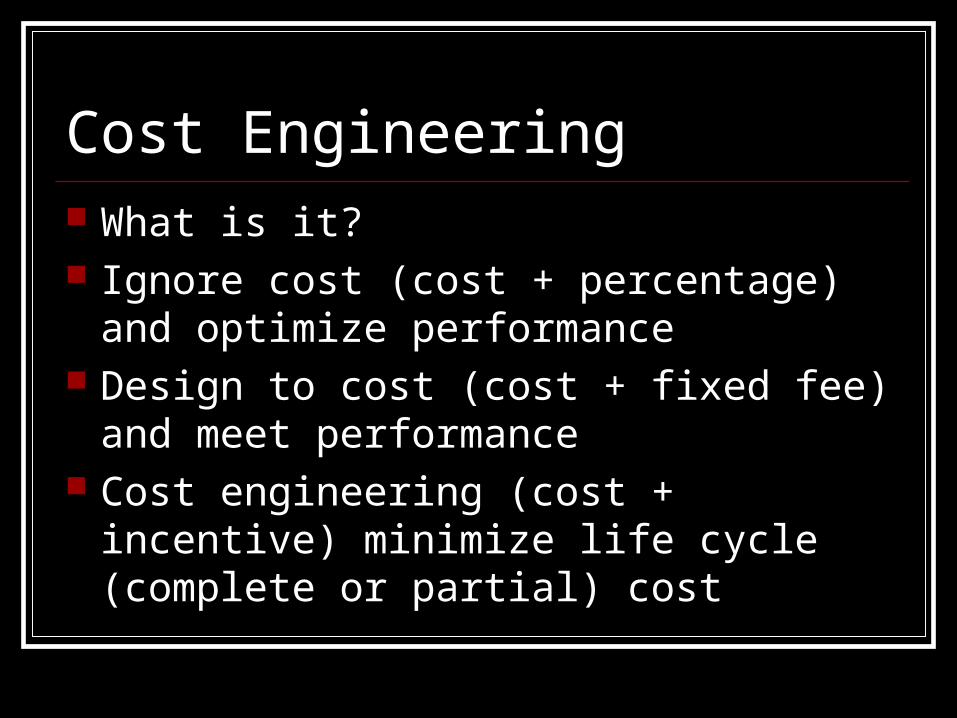
Cost Engineering What is it? Ignore cost (cost + percentage) and
optimize performance Design to cost (cost + fixed fee) and meet
performance Cost engineering (cost + incentive)
minimize life cycle (complete or partial) cost
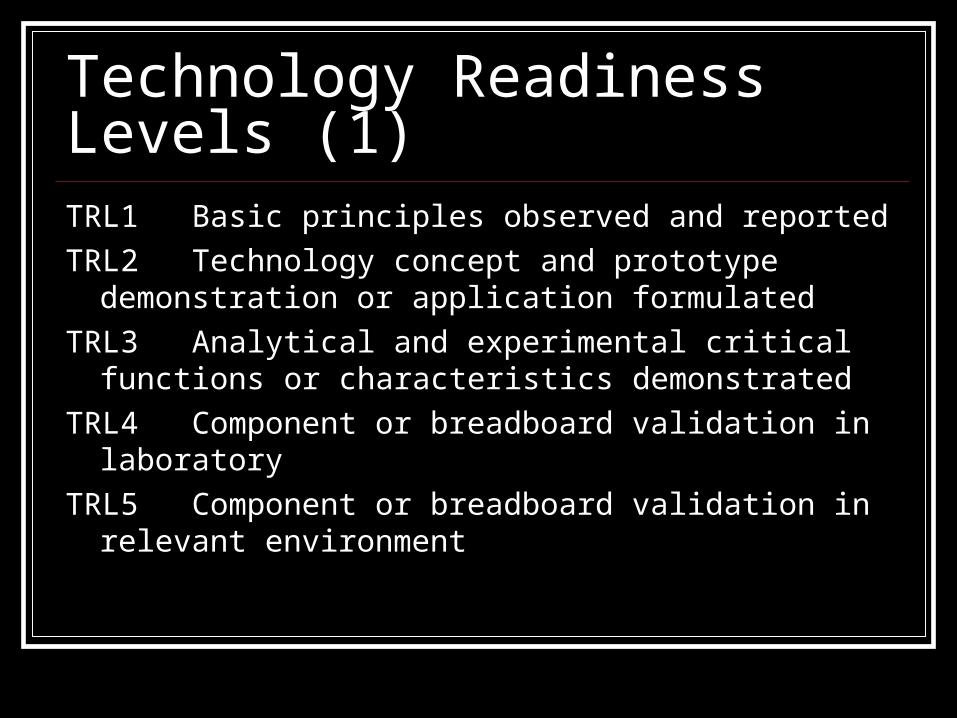
Technology Readiness Levels (1)TRL1 Basic principles observed and reported
TRL2 Technology concept and prototype demonstration or application formulated
TRL3 Analytical and experimental critical functions or characteristics demonstrated
TRL4 Component or breadboard validation in laboratory
TRL5 Component or breadboard validation in relevant environment
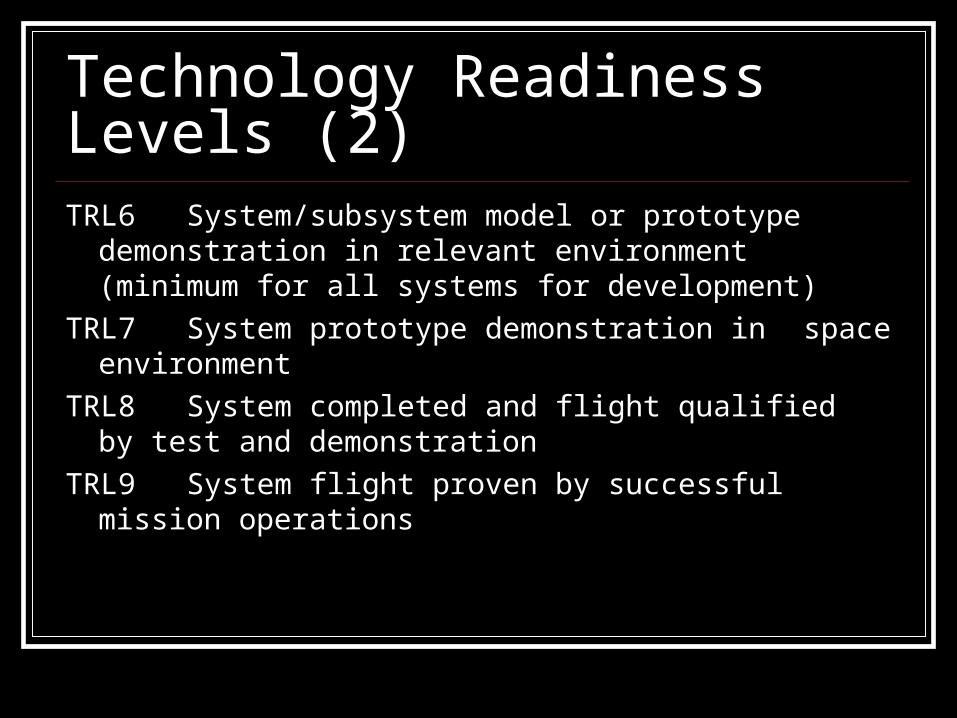
Technology Readiness Levels (2)TRL6 System/subsystem model or prototype
demonstration in relevant environment (minimum for all systems for development)
TRL7 System prototype demonstration in space environment
TRL8 System completed and flight qualified by test and demonstration
TRL9 System flight proven by successful mission operations
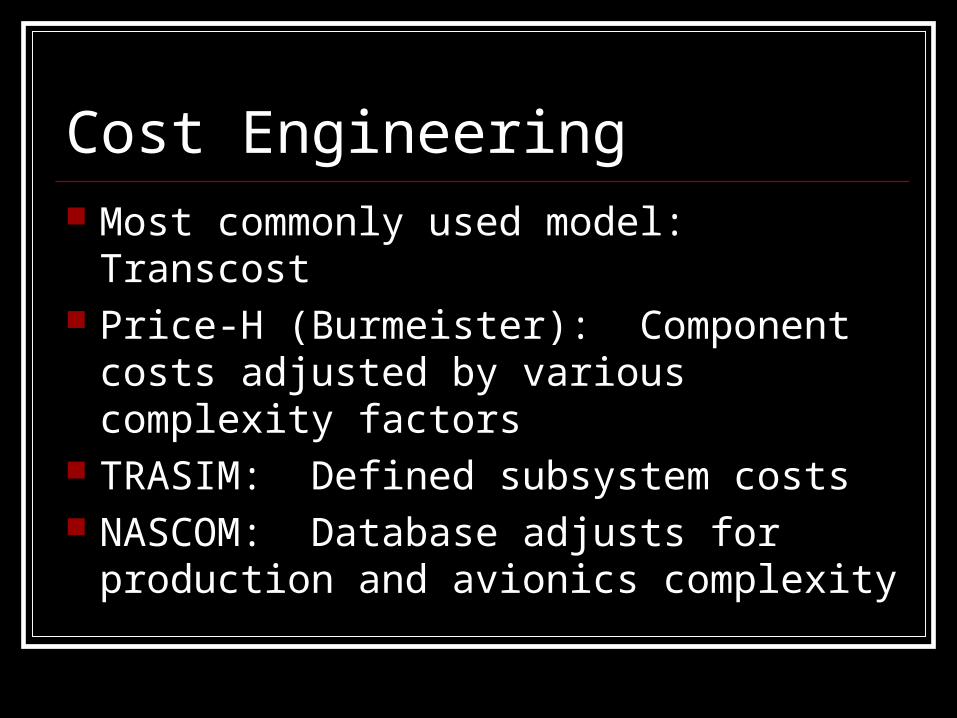
Cost Engineering Most commonly used model: Transcost Price-H (Burmeister): Component costs
adjusted by various complexity factors TRASIM: Defined subsystem costs NASCOM: Database adjusts for production
and avionics complexity
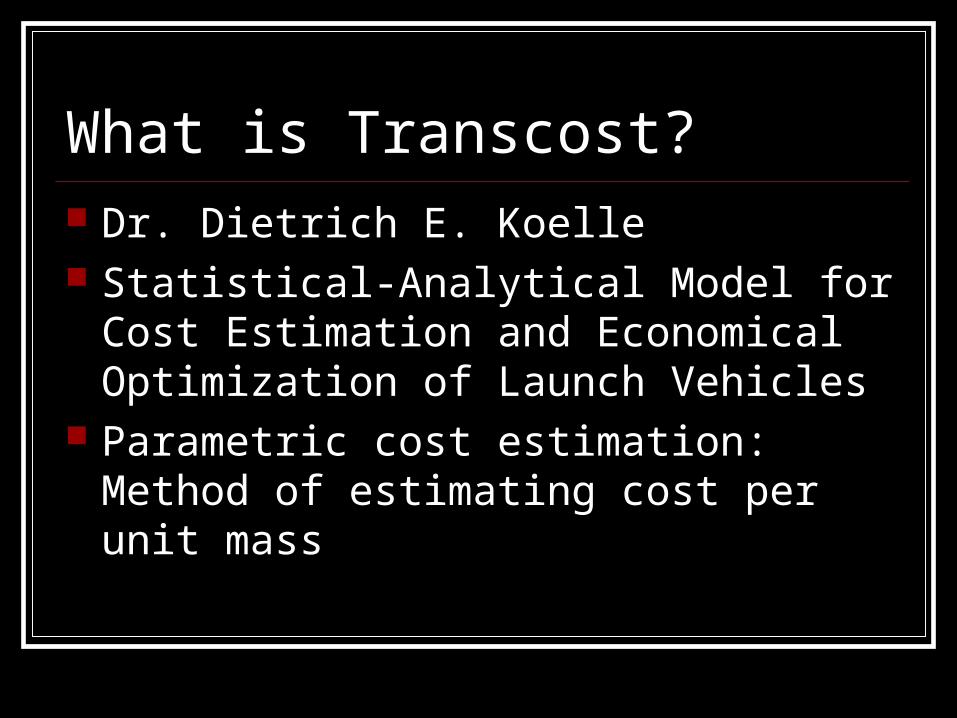
What is Transcost? Dr. Dietrich E. Koelle Statistical-Analytical Model for Cost
Estimation and Economical Optimization of Launch Vehicles
Parametric cost estimation: Method of estimating cost per unit mass
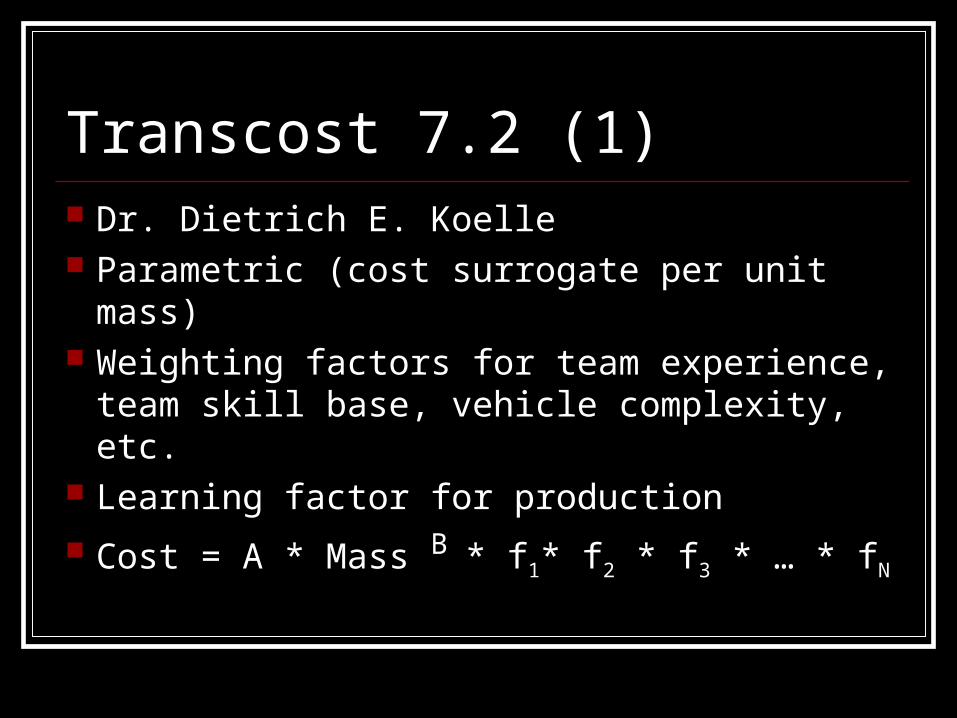
Transcost 7.2 (1) Dr. Dietrich E. Koelle Parametric (cost surrogate per unit mass) Weighting factors for team experience,
team skill base, vehicle complexity, etc. Learning factor for production
Cost = A * Mass B * f1* f2 * f3 * … * fN
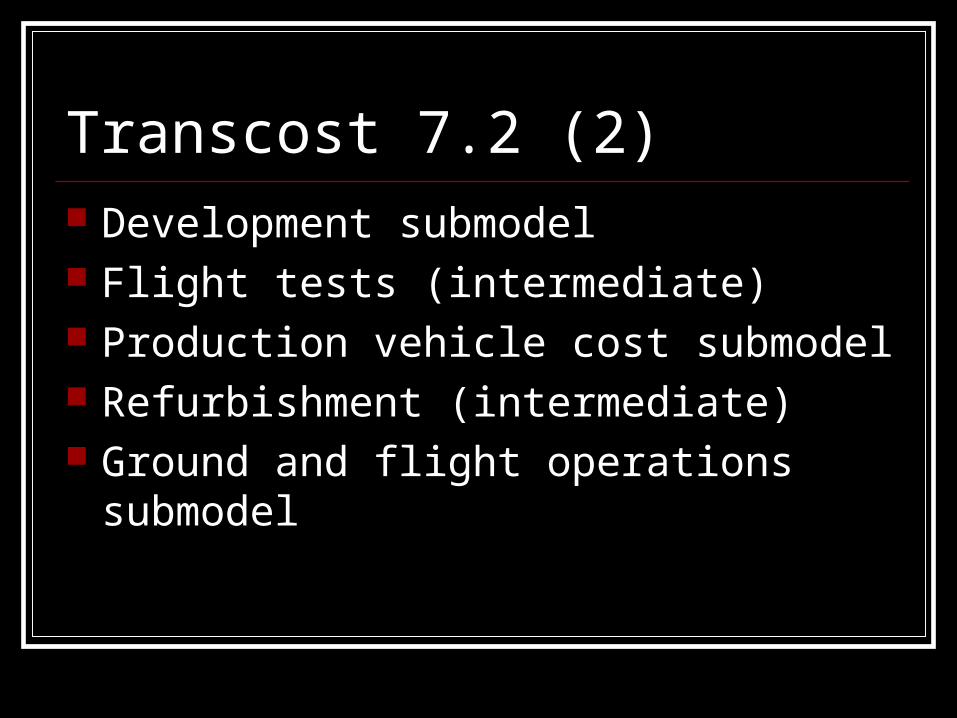
Transcost 7.2 (2) Development submodel Flight tests (intermediate) Production vehicle cost submodel Refurbishment (intermediate) Ground and flight operations submodel
Cost – Why a Surrogate? Engineering or production man years
cleaner variable than dollars Can be adjusted for inflation Can be adjusted for productivity Can be adjusted for currency fluctuations
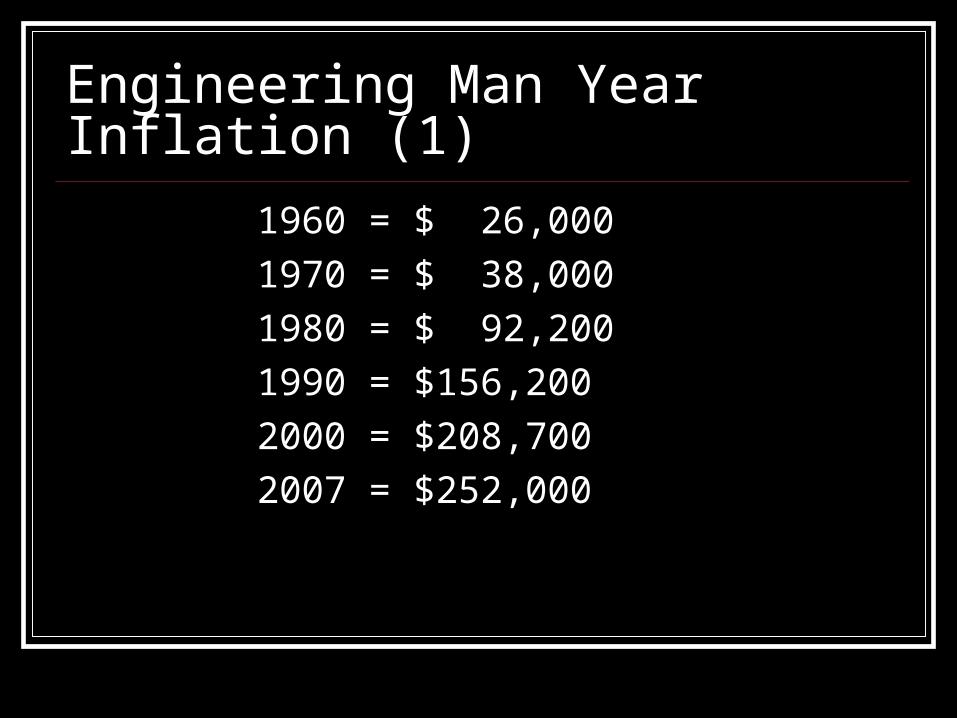
Engineering Man Year Inflation (1)
1960 = $ 26,000
1970 = $ 38,000
1980 = $ 92,200
1990 = $156,200
2000 = $208,700
2007 = $252,000
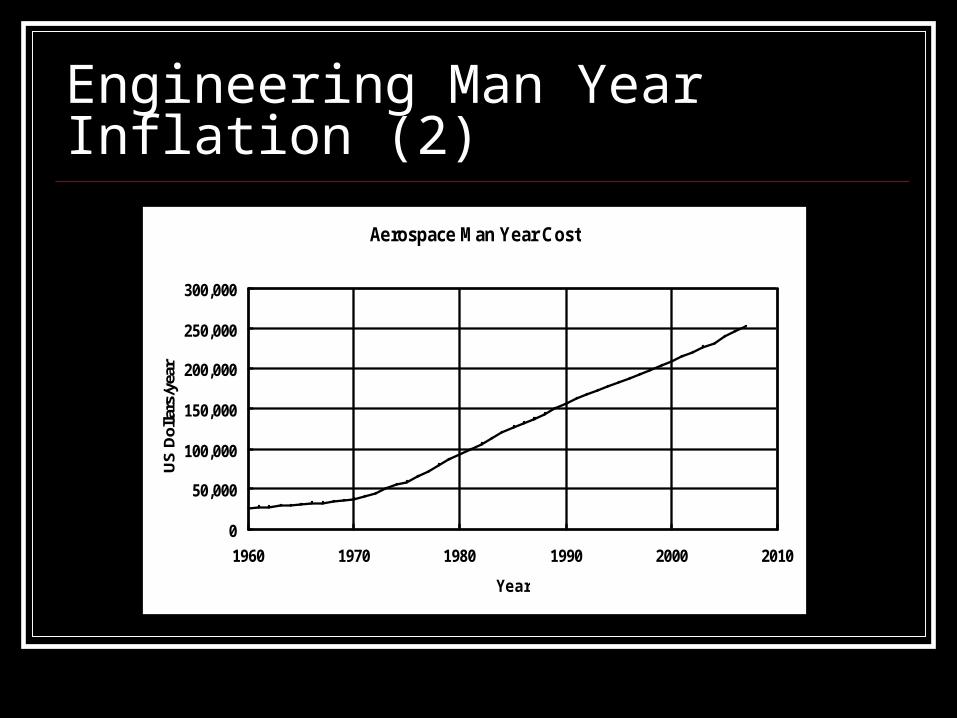
Engineering Man Year Inflation (2)
Aerospace Man Year Cost
0
50,000
100,000
150,000
200,000
250,000
300,000
1960 1970 1980 1990 2000 2010
Year
US
Dol
lars
/yea
r
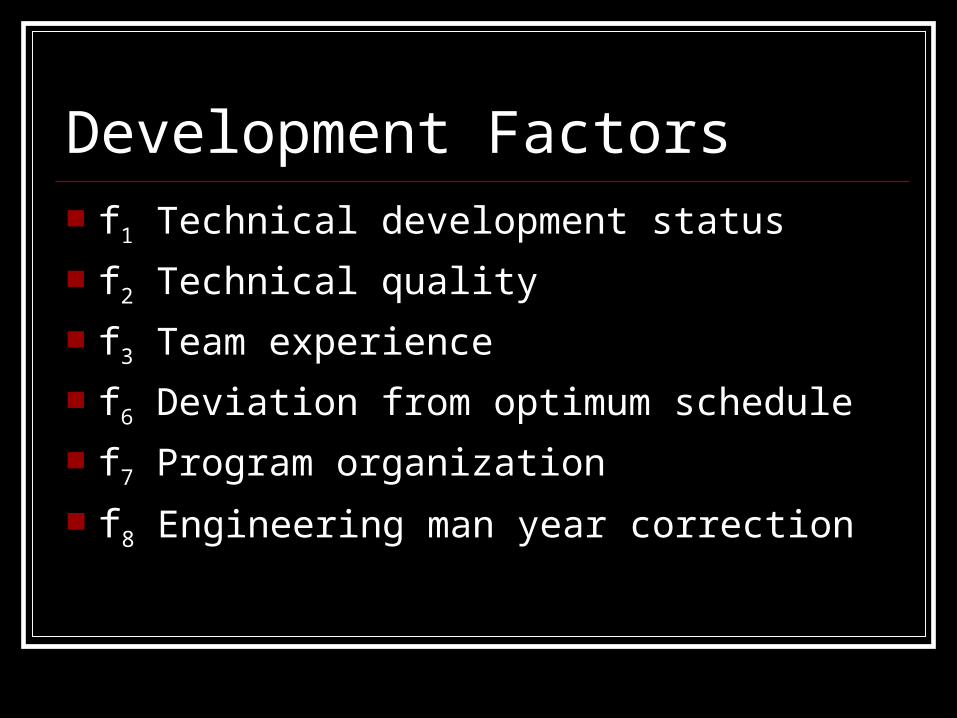
Development Factors f1 Technical development status
f2 Technical quality
f3 Team experience
f6 Deviation from optimum schedule
f7 Program organization
f8 Engineering man year correction
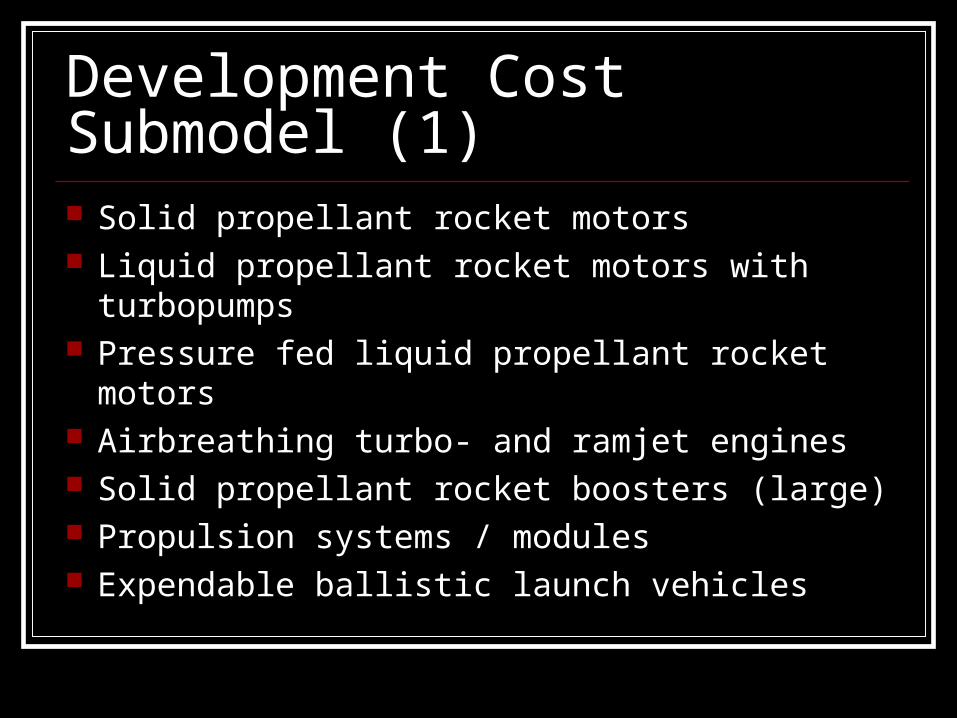
Development Cost Submodel (1) Solid propellant rocket motors Liquid propellant rocket motors with turbopumps Pressure fed liquid propellant rocket motors Airbreathing turbo- and ramjet engines Solid propellant rocket boosters (large) Propulsion systems / modules Expendable ballistic launch vehicles
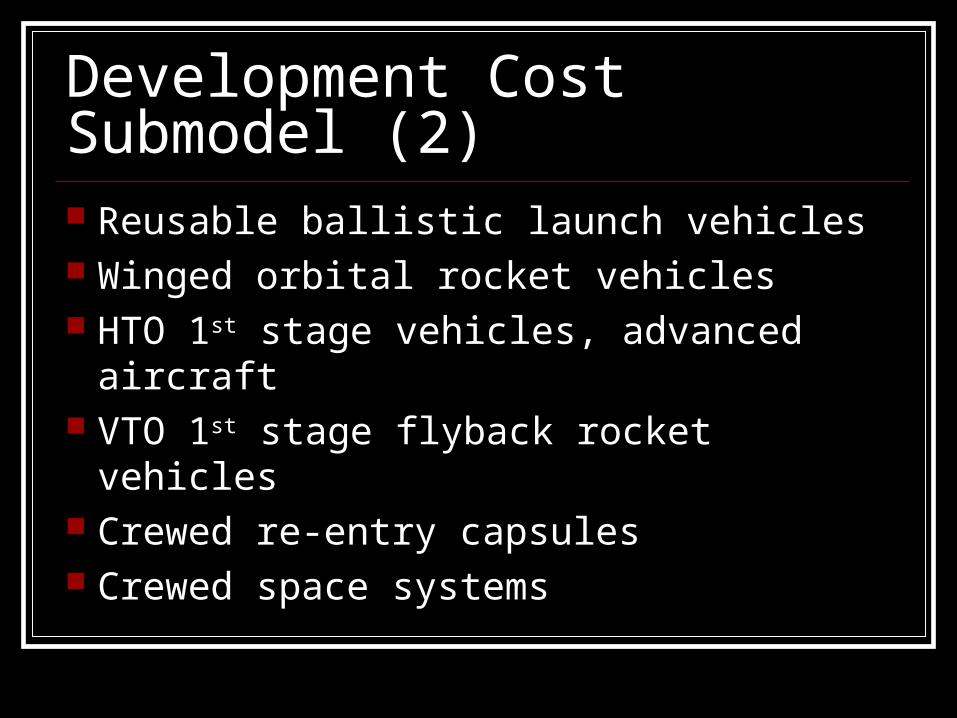
Development Cost Submodel (2) Reusable ballistic launch vehicles Winged orbital rocket vehicles HTO 1st stage vehicles, advanced aircraft VTO 1st stage flyback rocket vehicles Crewed re-entry capsules Crewed space systems
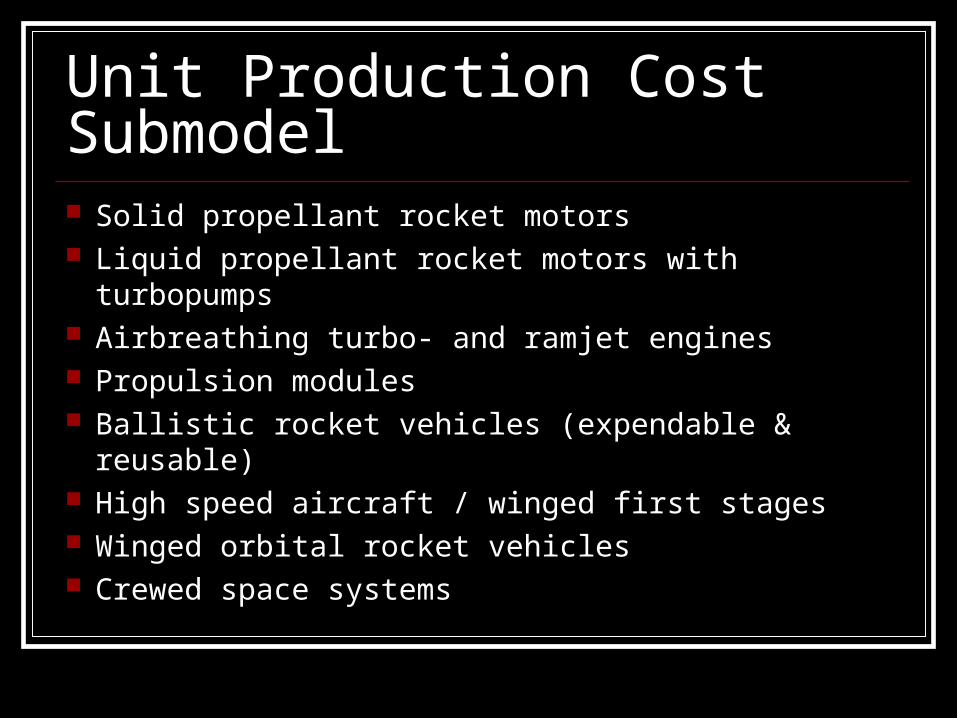
Unit Production Cost Submodel Solid propellant rocket motors Liquid propellant rocket motors with turbopumps Airbreathing turbo- and ramjet engines Propulsion modules Ballistic rocket vehicles (expendable & reusable) High speed aircraft / winged first stages Winged orbital rocket vehicles Crewed space systems
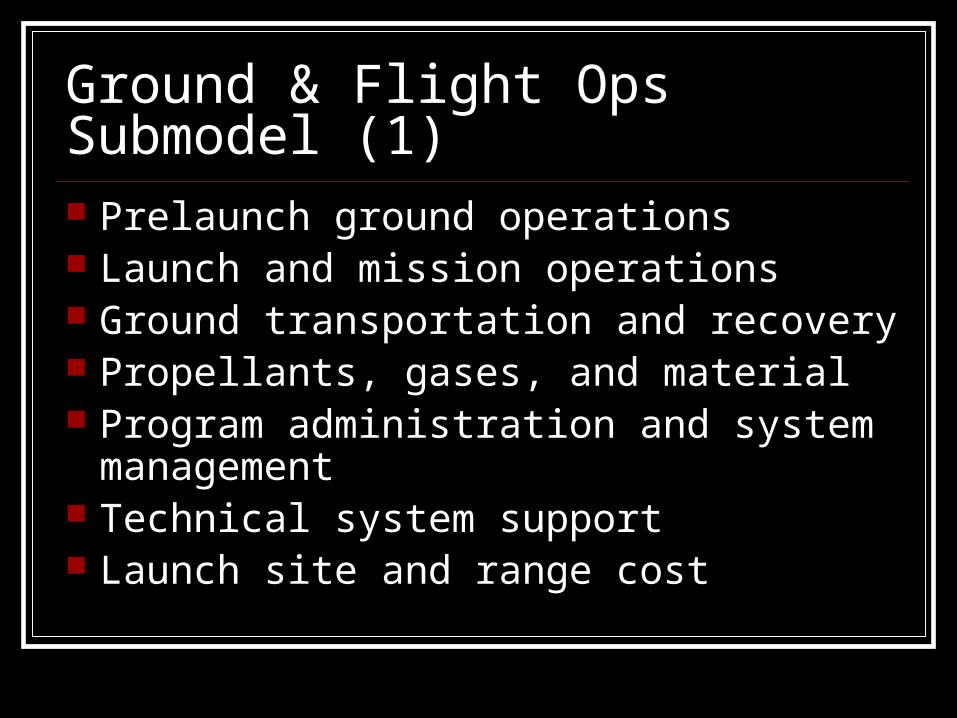
Ground & Flight Ops Submodel (1) Prelaunch ground operations Launch and mission operations Ground transportation and recovery Propellants, gases, and material Program administration and system
management Technical system support Launch site and range cost
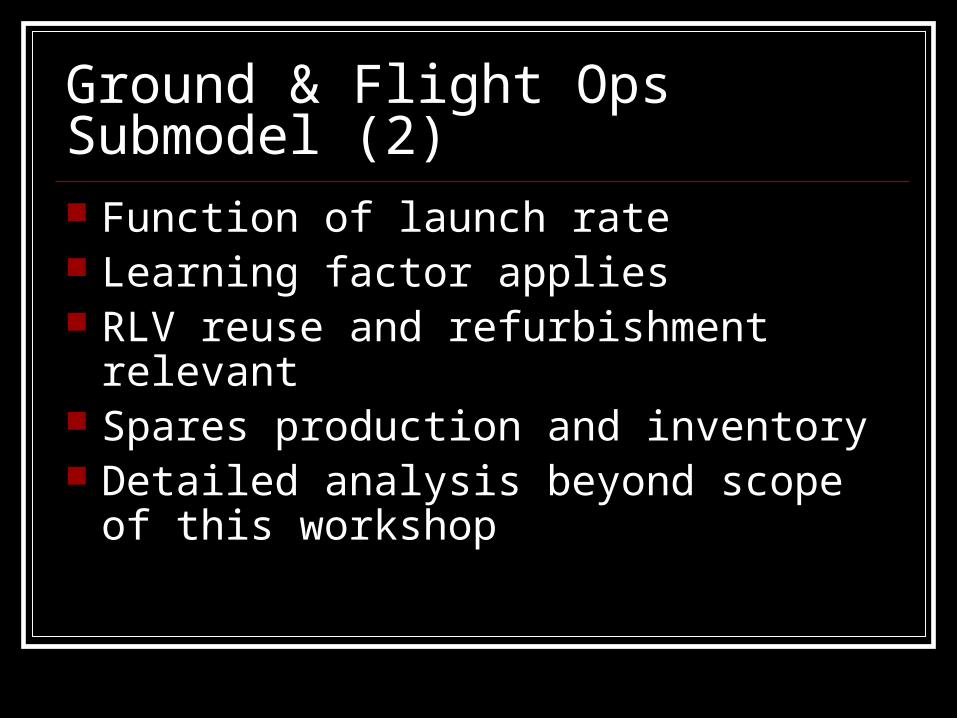
Ground & Flight Ops Submodel (2) Function of launch rate Learning factor applies RLV reuse and refurbishment relevant Spares production and inventory Detailed analysis beyond scope of this
workshop
Development Cost Configure system Develop mass budget Develop appropriate margins
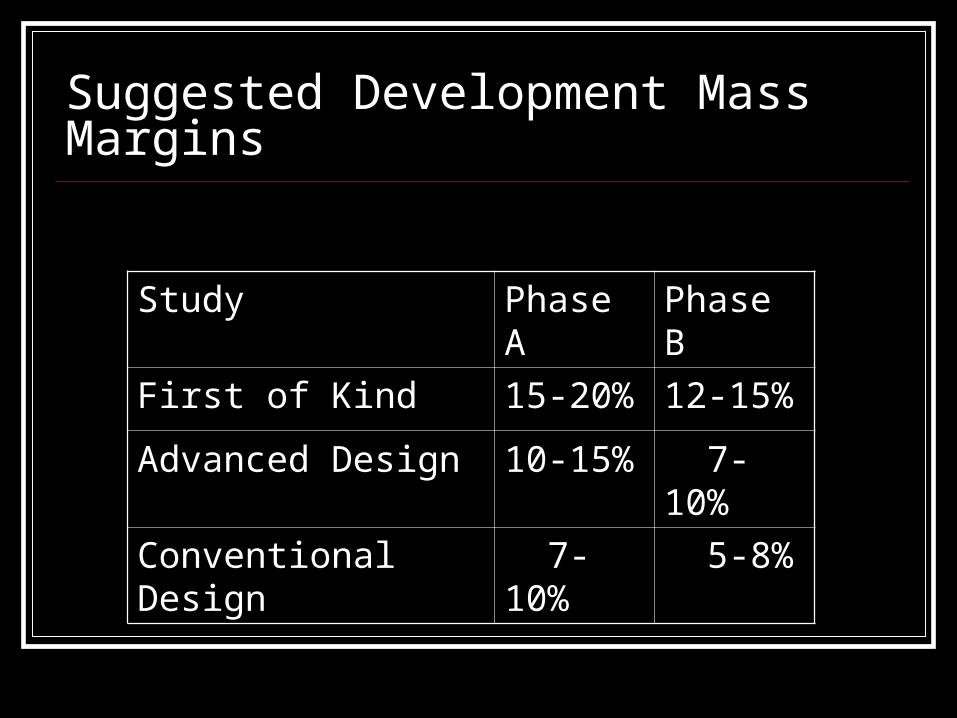
Suggested Development Mass Margins
Study Phase A Phase B
First of Kind 15-20% 12-15%
Advanced Design 10-15% 7-10%
Conventional Design 7-10% 5-8%
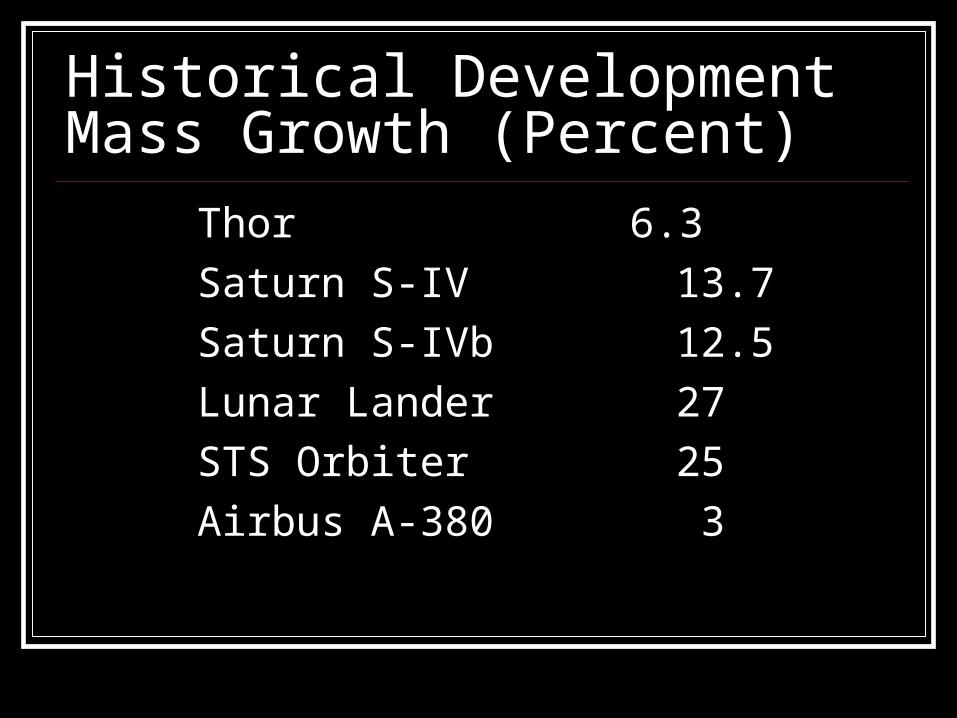
Historical Development Mass Growth (Percent)
Thor 6.3
Saturn S-IV 13.7
Saturn S-IVb 12.5
Lunar Lander 27
STS Orbiter 25
Airbus A-380 3
Existing Structural Safety Factors
ELV = 1.10 – 1.25
RLV = 1.35 – 2.0
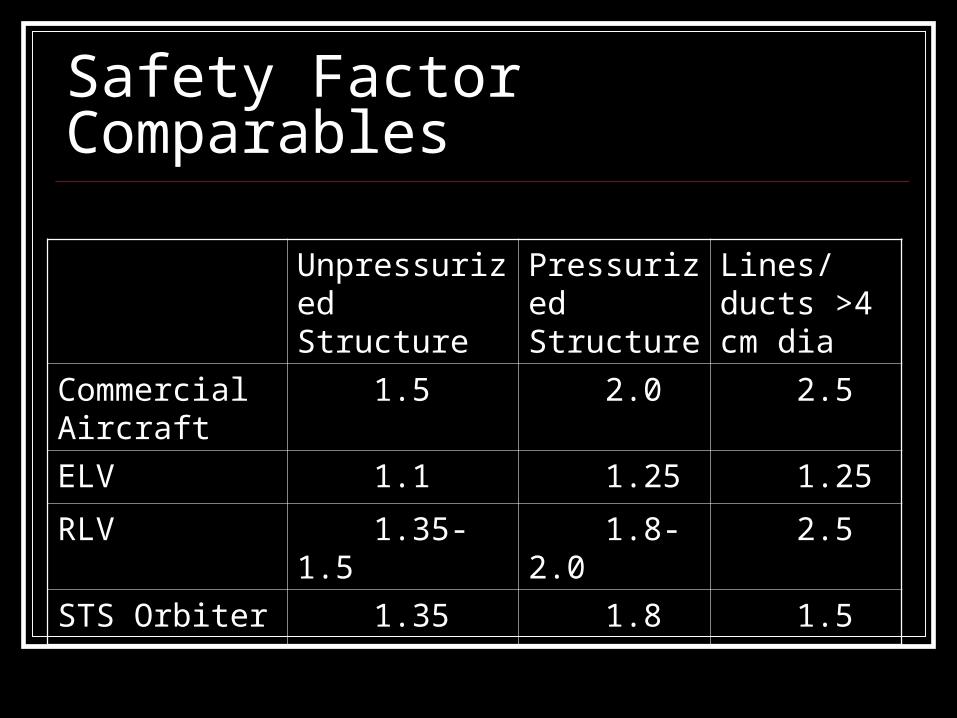
Safety Factor Comparables
Unpressurized Structure
Pressurized Structure
Lines/ducts >4 cm dia
Commercial Aircraft
1.5 2.0 2.5
ELV 1.1 1.25 1.25
RLV 1.35-1.5 1.8-2.0 2.5
STS Orbiter 1.35 1.8 1.5
Cost Driver -- Payload Payload is more important cost driver than
GLOW 20% increase in payload increases ELV
development by 7% 20% increase in payload increases RLV
development by 4% Cost effective to oversize vehicle to assure
payload sufficiency
Estimate Development Cost First stage motor(s) Second stage motor(s) First stage vehicle Second stage vehicle Correct for various relevant factors Convert into dollars
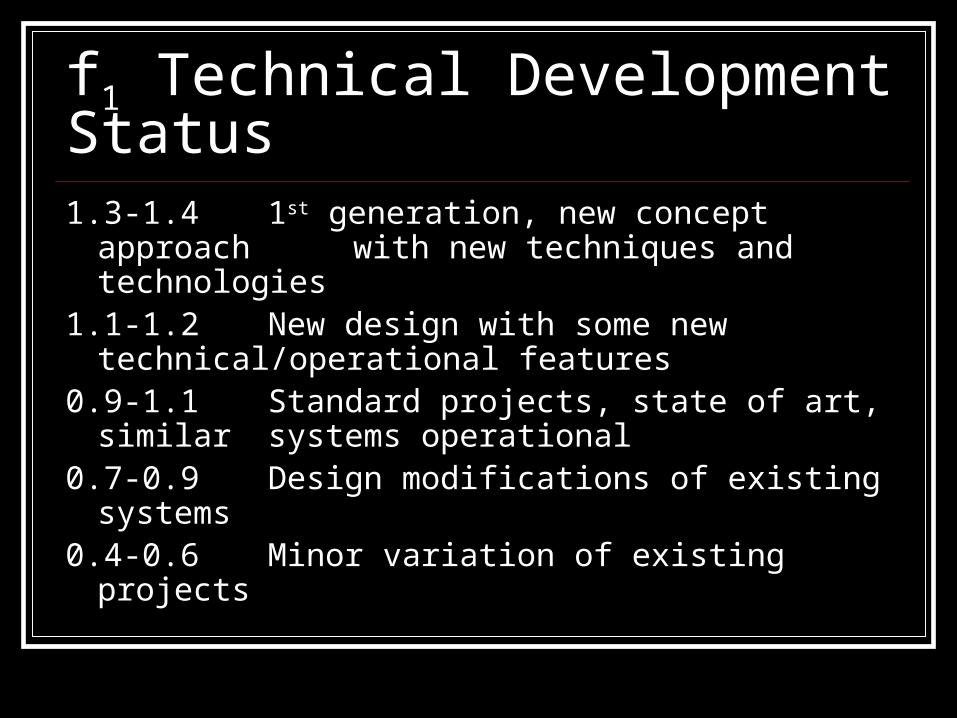
f1 Technical Development Status1.3-1.4 1st generation, new concept approach
with new techniques and technologies1.1-1.2 New design with some new
technical/operational features0.9-1.1 Standard projects, state of art, similar
systems operational0.7-0.9 Design modifications of existing
systems0.4-0.6 Minor variation of existing projects
f2 Technical Quality
Specific definition depends on submodel
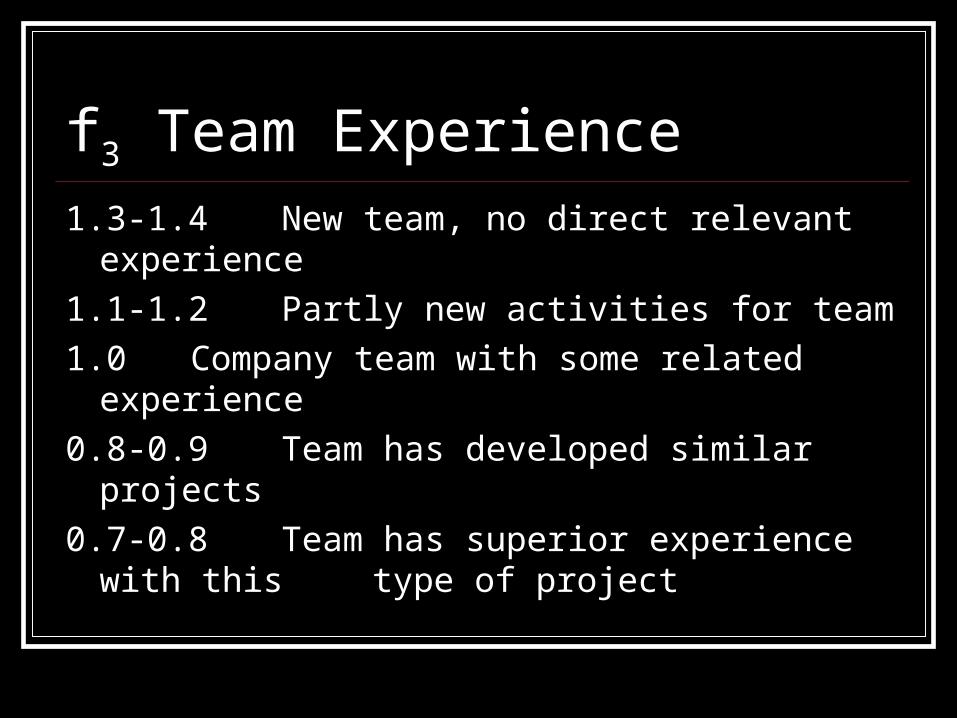
f3 Team Experience1.3-1.4 New team, no direct relevant experience
1.1-1.2 Partly new activities for team
1.0 Company team with some related experience
0.8-0.9 Team has developed similar projects
0.7-0.8 Team has superior experience with this type of project
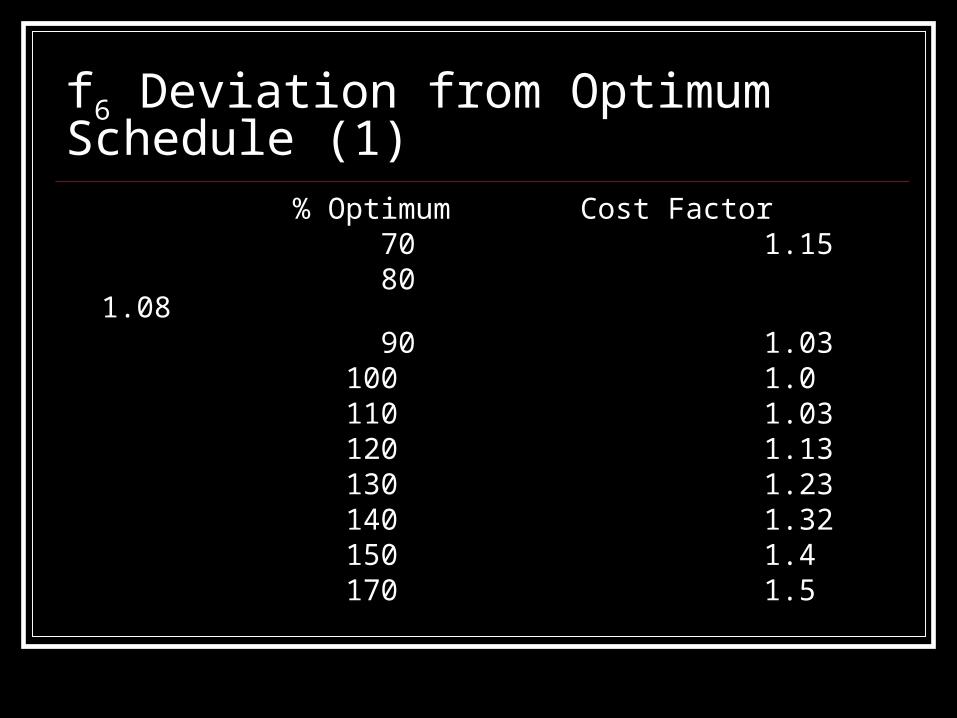
f6 Deviation from Optimum Schedule (1)% Optimum Cost Factor 70 1.15 80 1.08 90 1.03 100 1.0 110 1.03 120 1.13 130 1.23 140 1.32 150 1.4 170 1.5
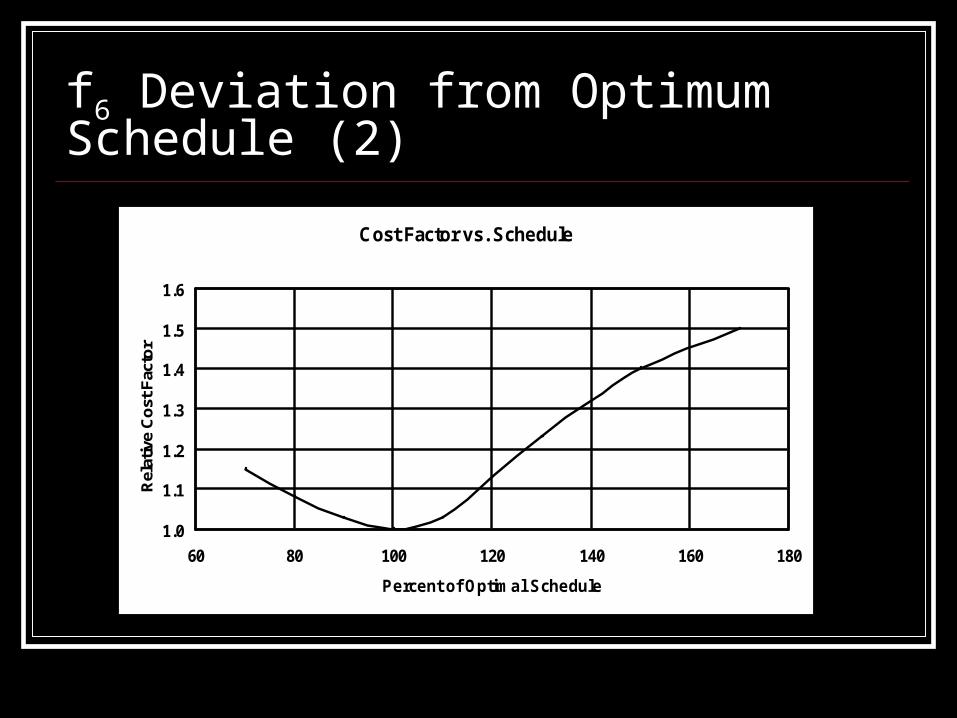
f6 Deviation from Optimum Schedule (2)
Cost Factor vs. Schedule
1.0
1.1
1.2
1.3
1.4
1.5
1.6
60 80 100 120 140 160 180
Percent of Optimal Schedule
Rel
ativ
e C
ost
Fac
tor
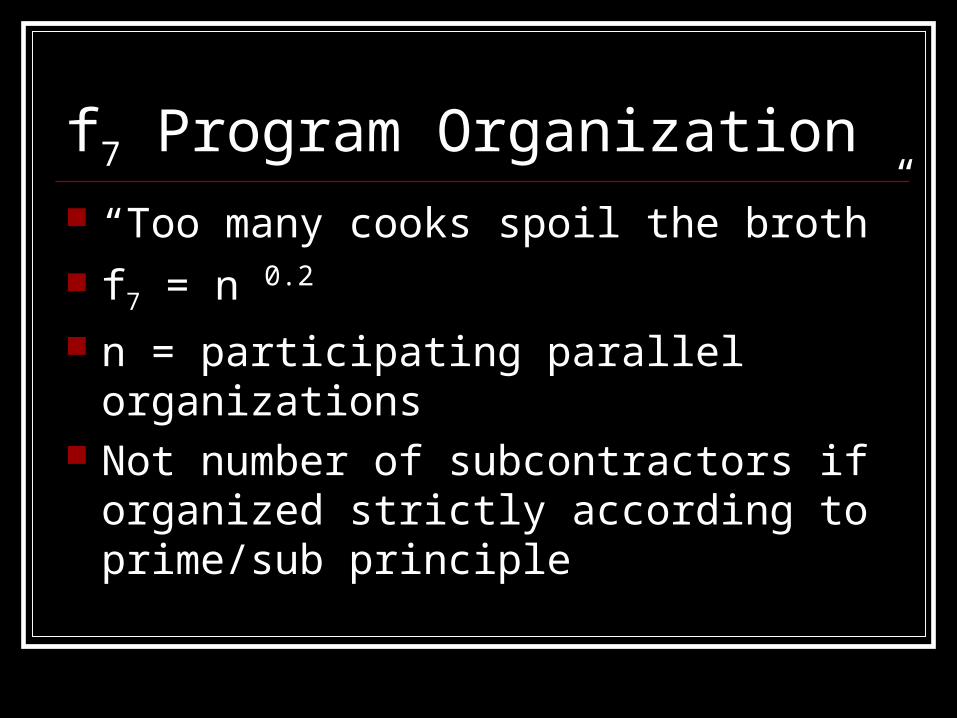
f7 Program Organization “Too many cooks spoil the broth” f7 = n 0.2
n = participating parallel organizations Not number of subcontractors if organized
strictly according to prime/sub principle

f8 Engineering Man Year Correction
USA f8 = 1.00
France f8 = 0.79
China f8 = 1.34
Correction factor f8 based on effective working
hours/year * relative education * relative dedication
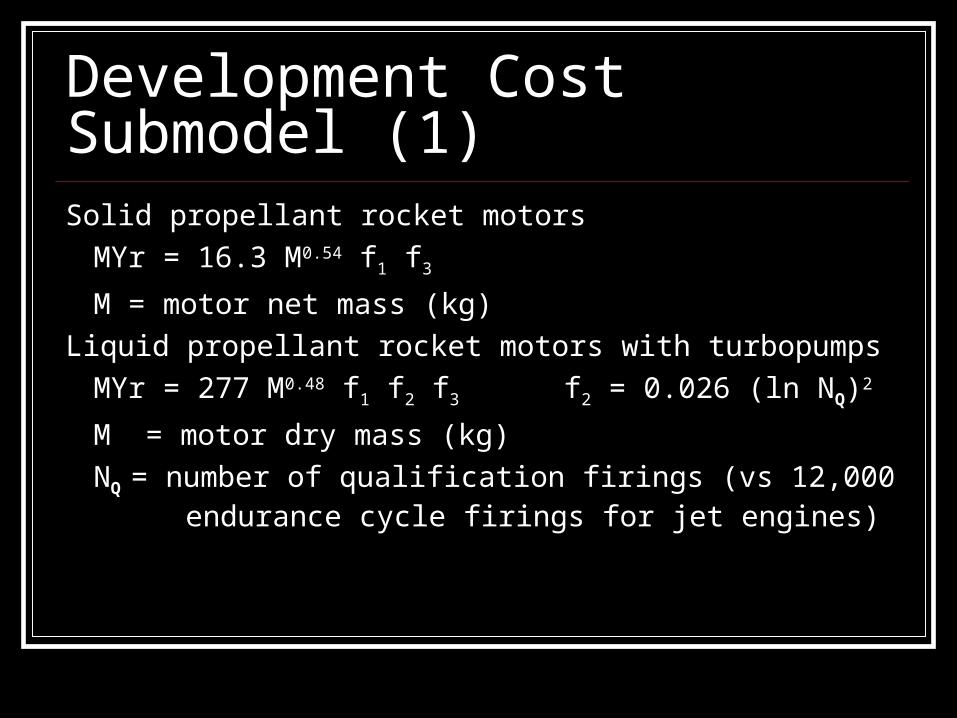
Development Cost Submodel (1)Solid propellant rocket motors
MYr = 16.3 M0.54 f1 f3
M = motor net mass (kg)
Liquid propellant rocket motors with turbopumps
MYr = 277 M0.48 f1 f2 f3 f2 = 0.026 (ln NQ)2
M = motor dry mass (kg)
NQ = number of qualification firings (vs 12,000 endurance cycle firings for jet engines)
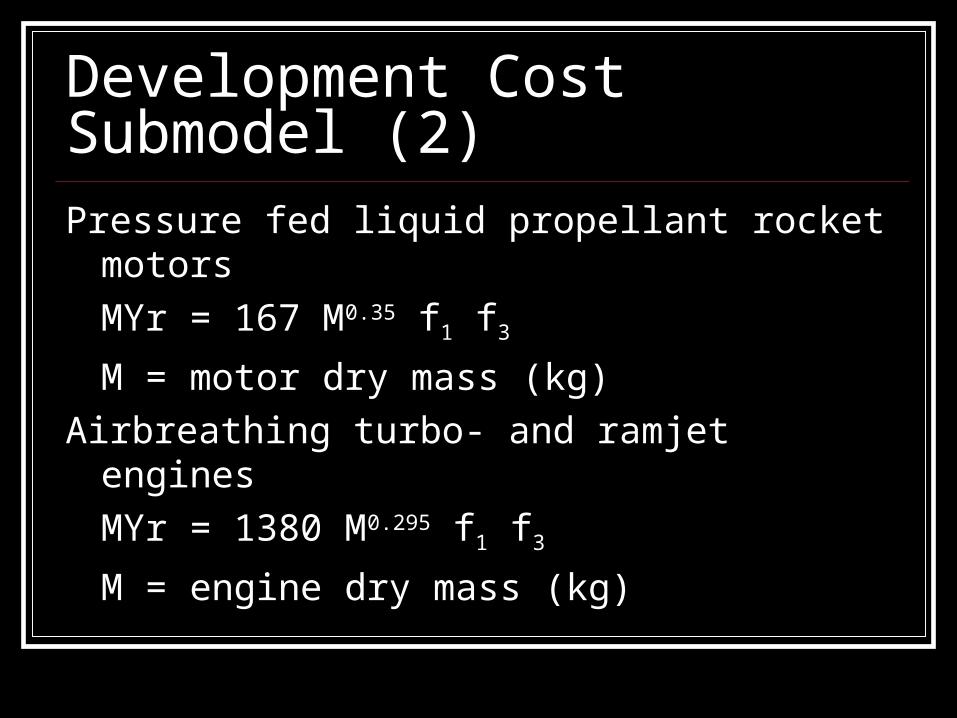
Development Cost Submodel (2)Pressure fed liquid propellant rocket motors
MYr = 167 M0.35 f1 f3
M = motor dry mass (kg)
Airbreathing turbo- and ramjet engines
MYr = 1380 M0.295 f1 f3
M = engine dry mass (kg)
Development Cost Submodel (3)Solid propellant rocket boosters (large)
MYr = 10.4 M0.6 f1 f3
M = booster net mass (kg)
Propulsion systems / modules
MYr = 14.2 M0.577 f1 f3
M = system dry mass with motors (kg)
Development Cost Submodel (4)Expendable ballistic launch vehicles
MYr = 100 M0.555 f1 f2 f3 f2 = Kref / Keff
M = vehicle dry mass without motors (kg)Kref = reference net mass fraction (from graph)Keff = (M + residuals) / propellant
Reusable ballistic launch vehiclesMYr = 803.5 M0.385 f1 f2 f3 f2 = Kref / Keff
M = vehicle dry mass without motors (kg)Kref = reference net mass fraction (from graph)Keff = (M + residuals) / propellant
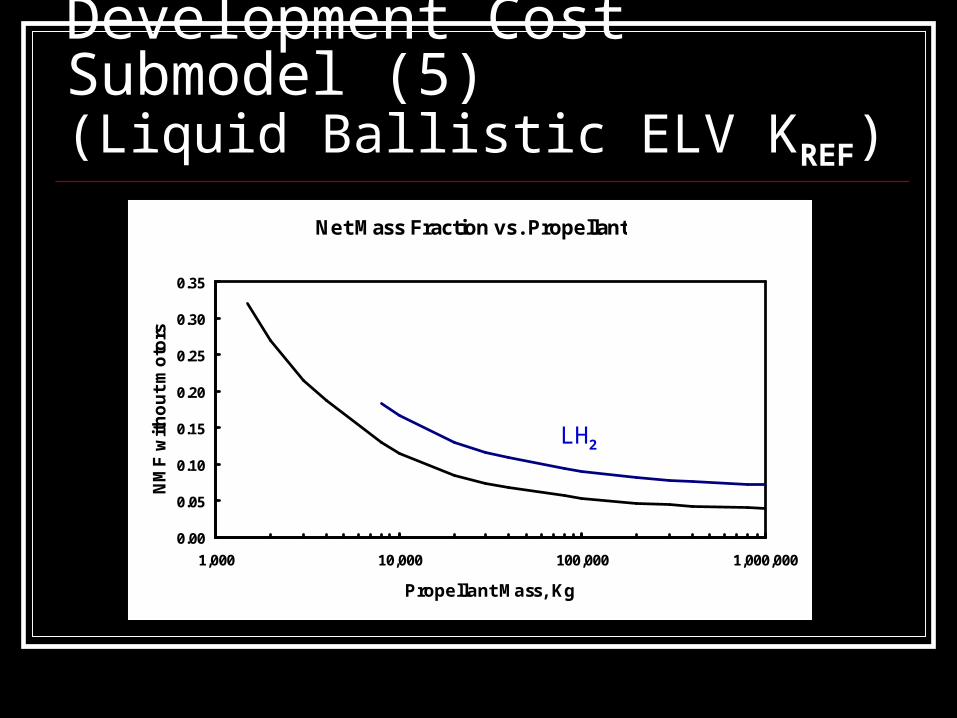
Development Cost Submodel (5)(Liquid Ballistic ELV KREF)
Net Mass Fraction vs. Propellant
0.00
0.05
0.10
0.15
0.20
0.25
0.30
0.35
1,000 10,000 100,000 1,000,000
Propellant Mass, Kg
NM
F w
ith
ou
t m
oto
rs
LH2
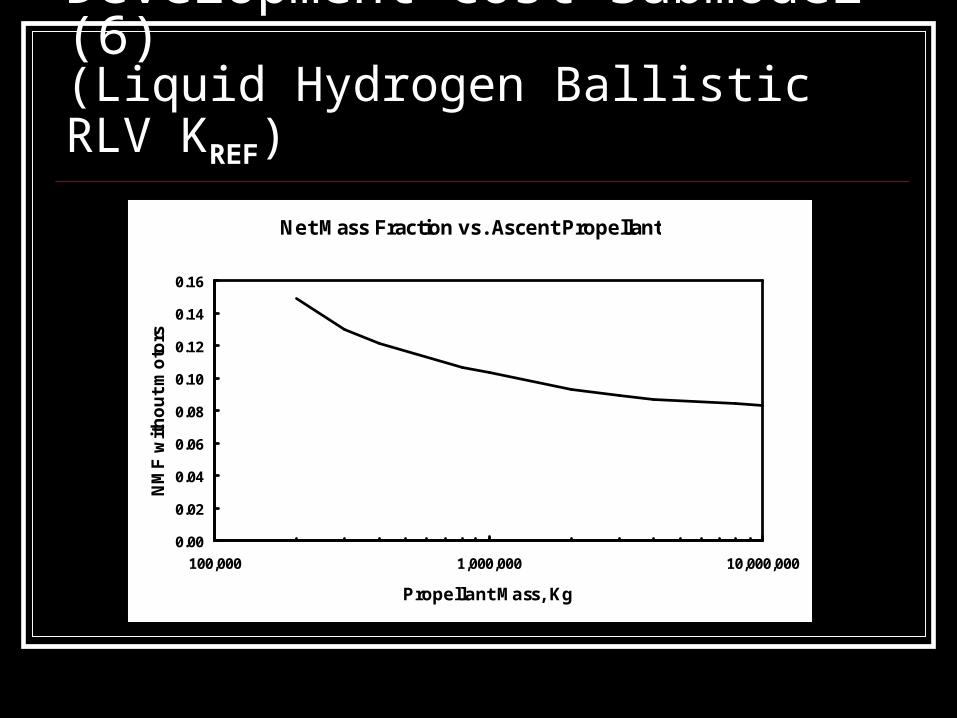
Development Cost Submodel (6)(Liquid Hydrogen Ballistic RLV KREF)
Net Mass Fraction vs. Ascent Propellant
0.00
0.02
0.04
0.06
0.08
0.10
0.12
0.14
0.16
100,000 1,000,000 10,000,000
Propellant Mass, Kg
NM
F w
ith
ou
t m
oto
rs
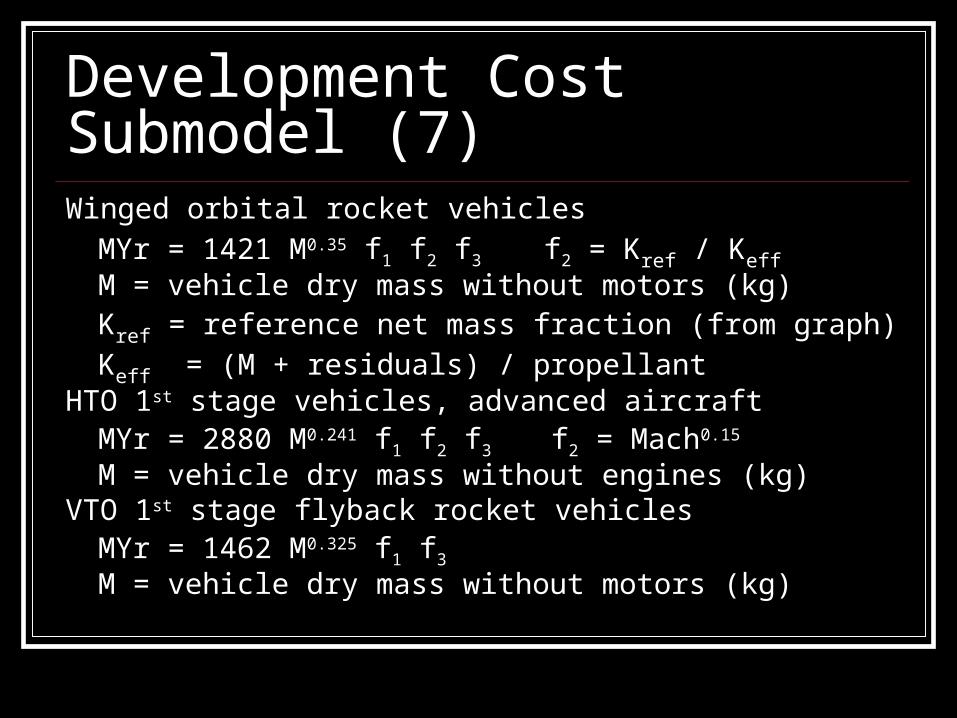
Development Cost Submodel (7)Winged orbital rocket vehicles
MYr = 1421 M0.35 f1 f2 f3 f2 = Kref / Keff
M = vehicle dry mass without motors (kg)Kref = reference net mass fraction (from graph)Keff = (M + residuals) / propellant
HTO 1st stage vehicles, advanced aircraftMYr = 2880 M0.241 f1 f2 f3 f2 = Mach0.15
M = vehicle dry mass without engines (kg)VTO 1st stage flyback rocket vehicles
MYr = 1462 M0.325 f1 f3
M = vehicle dry mass without motors (kg)

Development Cost Submodel (8)(Liquid Hydrogen Winged RLV KREF)
Net Mass Fraction vs. Ascent Propellant
0.00
0.05
0.10
0.15
0.20
0.25
0.30
0.35
0.40
10,000 100,000 1,000,000 10,000,000
Propellant Mass, Kg
NM
F w
ith
ou
t m
oto
rs
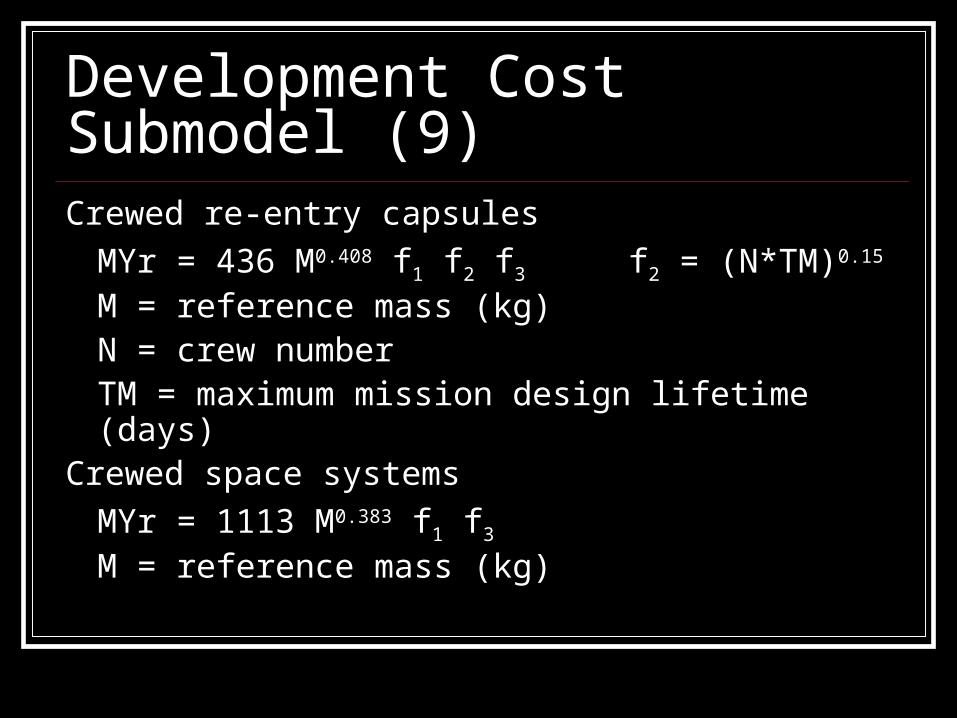
Development Cost Submodel (9)Crewed re-entry capsules
MYr = 436 M0.408 f1 f2 f3 f2 = (N*TM)0.15 M = reference mass (kg)N = crew numberTM = maximum mission design lifetime (days)
Crewed space systems
MYr = 1113 M0.383 f1 f3
M = reference mass (kg)
Development Margins Requirement changes during development Technical changes or “improvements” Technical component/software failures Changes in personnel or management
structure Funding limitations per budget year
Development Cost Risks Technology not fully qualified Vehicle specifications incomplete at start of
project and not frozen Masses underestimated – optimistic
assumptions Schedule assumes no mishaps or delays
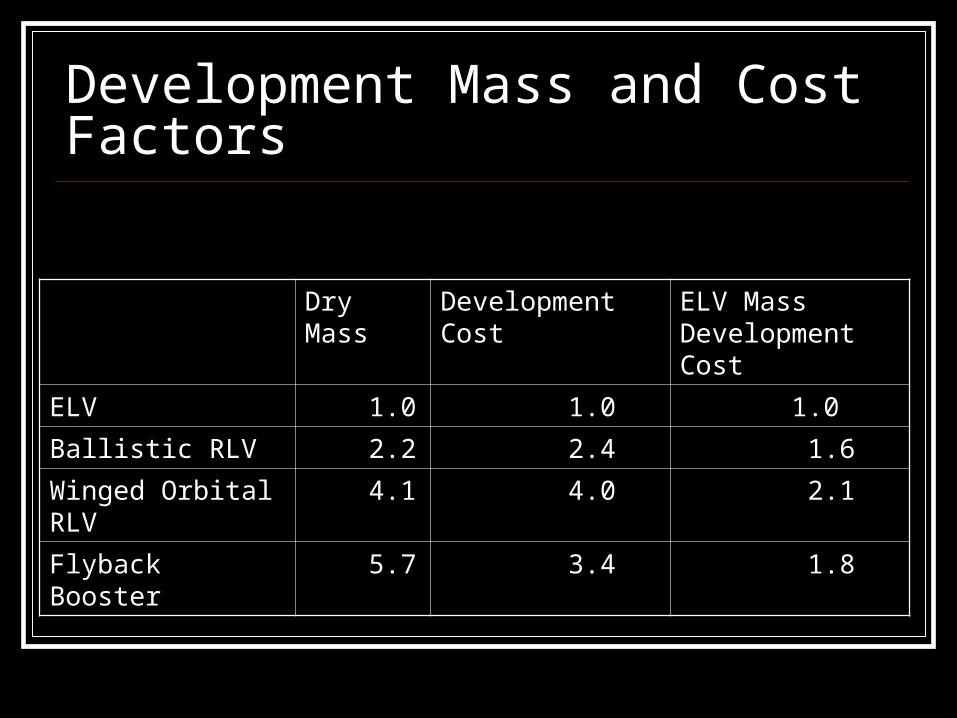
Development Mass and Cost Factors
Dry Mass Development Cost ELV Mass Development Cost
ELV 1.0 1.0 1.0
Ballistic RLV 2.2 2.4 1.6
Winged Orbital RLV 4.1 4.0 2.1
Flyback Booster 5.7 3.4 1.8
Production Costs Assume preproduction prototype Assume successful tests
Estimate Production Costs First stage motor Second stage motor First stage vehicle Second stage vehicle Correct for production numbers Convert to dollars

Production Learning Factor f4 (1) Defined by T. P. Wright in 1936 f4 Cost reduction with production Each doubling of production of identical
units reduces costs by a fixed percentage Percentage varies directly with production
rate and inversely with size and complexity
Production Learning Factor f4 (2) Aerospace manufacturing reduction
approximately 10-15% per doubling Agena-A 15% Ariane-4 12.5% STS ET 10%
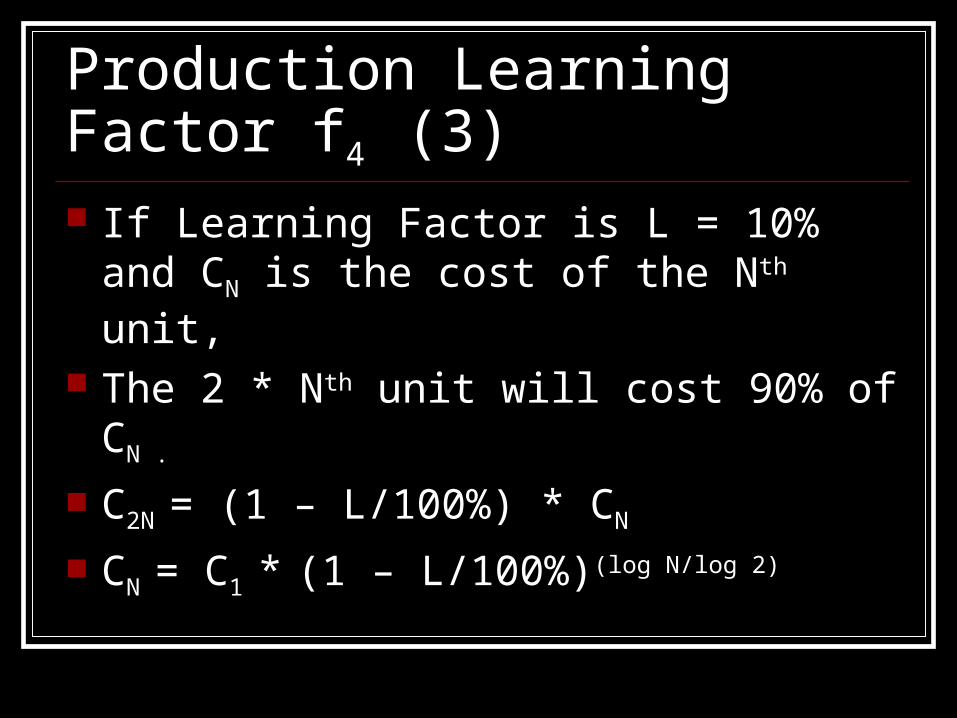
Production Learning Factor f4 (3) If Learning Factor is L = 10% and CN is the
cost of the Nth unit, The 2 * Nth unit will cost 90% of CN .
C2N = (1 – L/100%) * CN
CN = C1 * (1 – L/100%)(log N/log 2)
Production Learning Factor f4 (4)
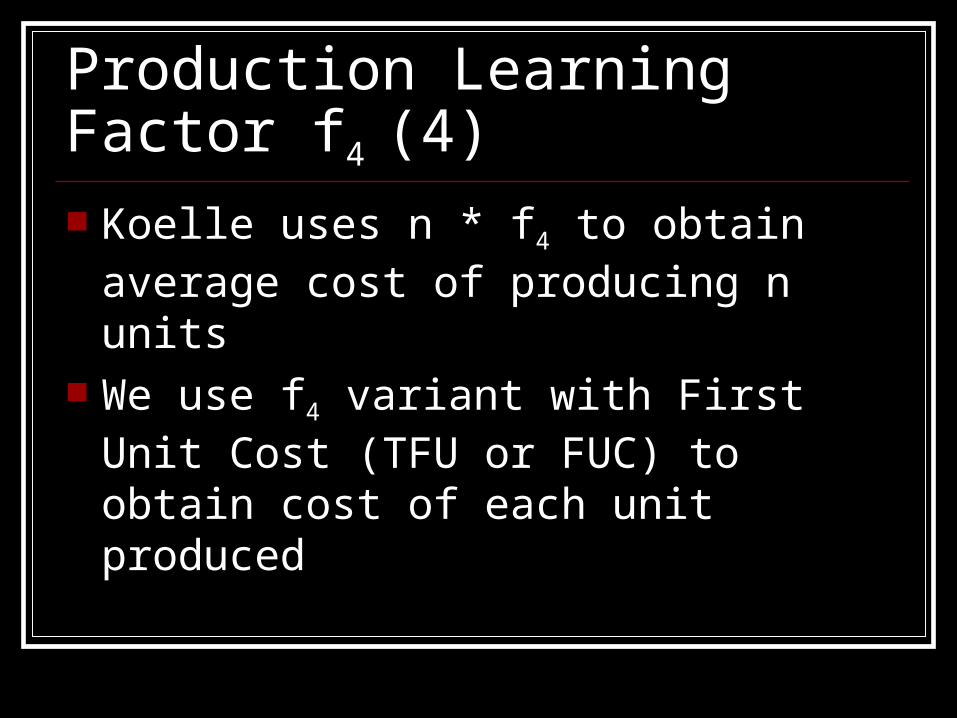
Koelle uses n * f4 to obtain average cost of producing n units
We use f4 variant with First Unit Cost (TFU or FUC) to obtain cost of each unit produced
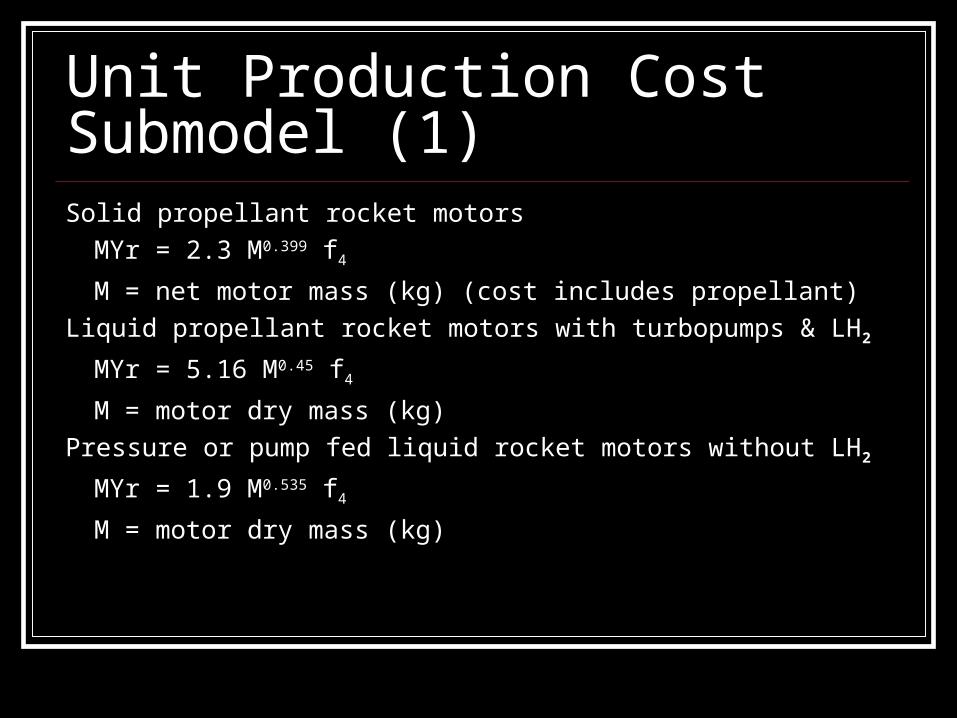
Unit Production Cost Submodel (1)Solid propellant rocket motors
MYr = 2.3 M0.399 f4
M = net motor mass (kg) (cost includes propellant)
Liquid propellant rocket motors with turbopumps & LH2
MYr = 5.16 M0.45 f4
M = motor dry mass (kg)
Pressure or pump fed liquid rocket motors without LH2
MYr = 1.9 M0.535 f4
M = motor dry mass (kg)
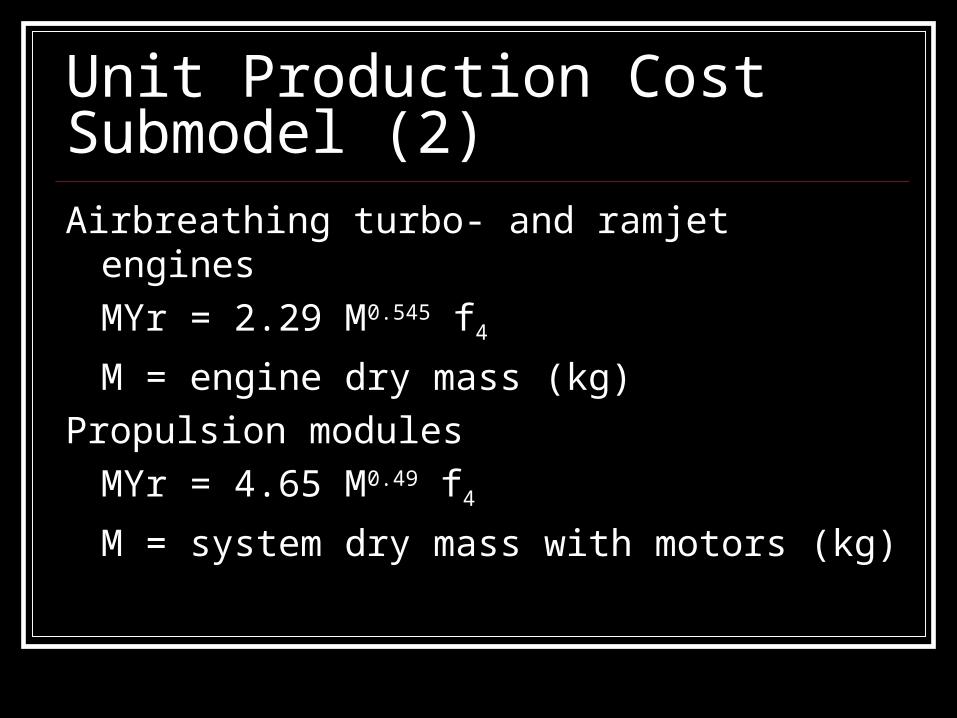
Unit Production Cost Submodel (2)Airbreathing turbo- and ramjet engines
MYr = 2.29 M0.545 f4
M = engine dry mass (kg)
Propulsion modules
MYr = 4.65 M0.49 f4
M = system dry mass with motors (kg)
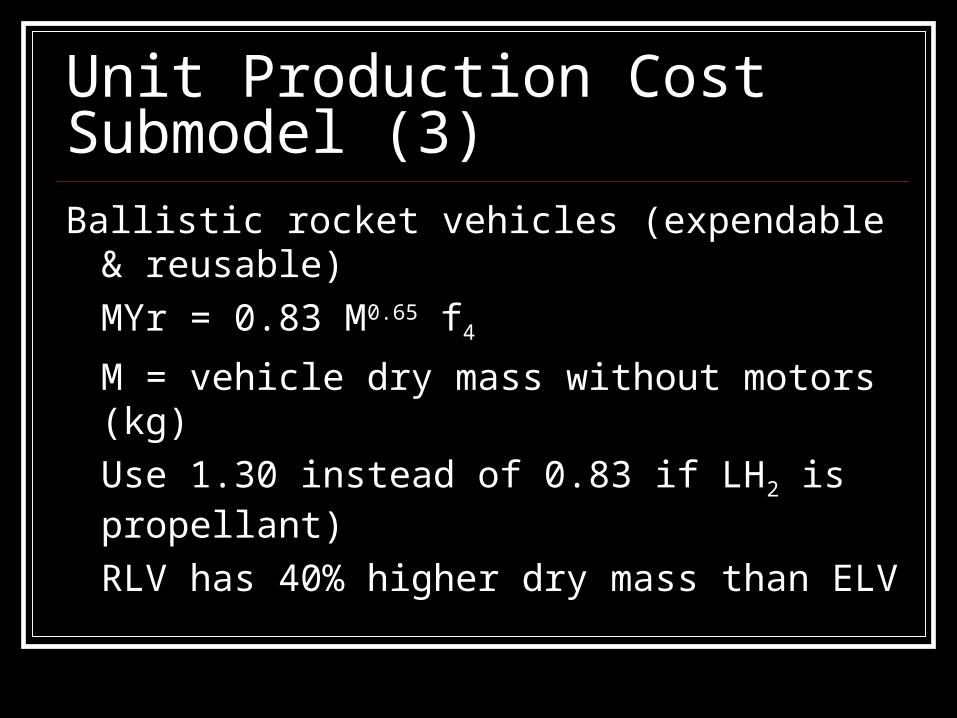
Unit Production Cost Submodel (3)Ballistic rocket vehicles (expendable & reusable)
MYr = 0.83 M0.65 f4
M = vehicle dry mass without motors (kg)
Use 1.30 instead of 0.83 if LH2 is propellant)
RLV has 40% higher dry mass than ELV
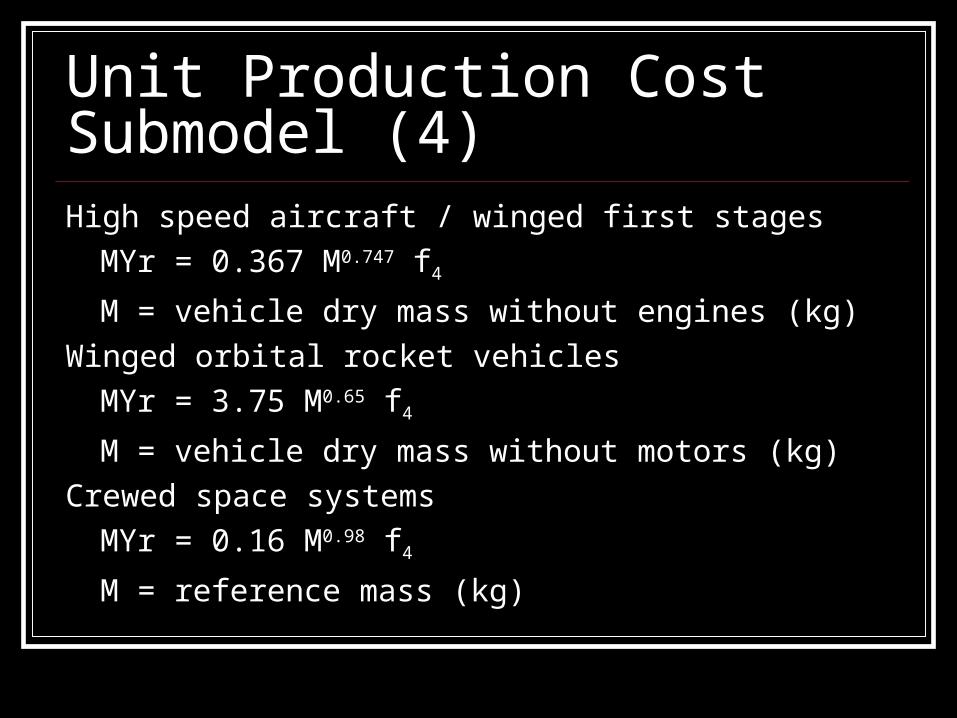
Unit Production Cost Submodel (4)High speed aircraft / winged first stages
MYr = 0.367 M0.747 f4
M = vehicle dry mass without engines (kg)
Winged orbital rocket vehicles
MYr = 3.75 M0.65 f4
M = vehicle dry mass without motors (kg)
Crewed space systems
MYr = 0.16 M0.98 f4
M = reference mass (kg)
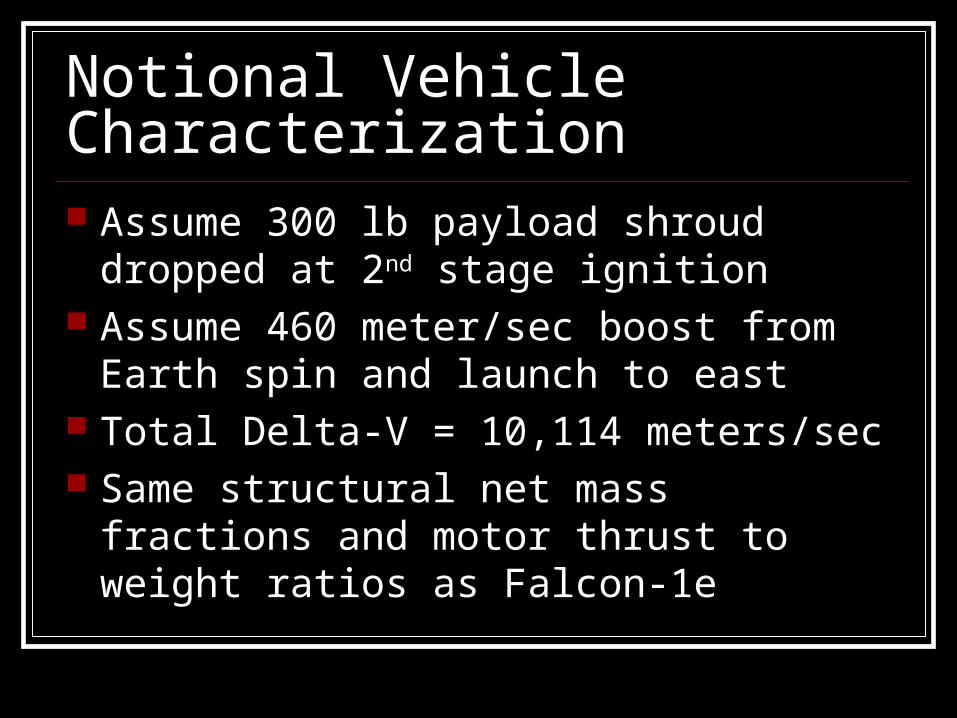
Notional Vehicle Characterization Assume 300 lb payload shroud dropped at
2nd stage ignition Assume 460 meter/sec boost from Earth
spin and launch to east Total Delta-V = 10,114 meters/sec Same structural net mass fractions and
motor thrust to weight ratios as Falcon-1e
Notional Vehicle Data
Spreadsheet: Scale-by-Payload.xls
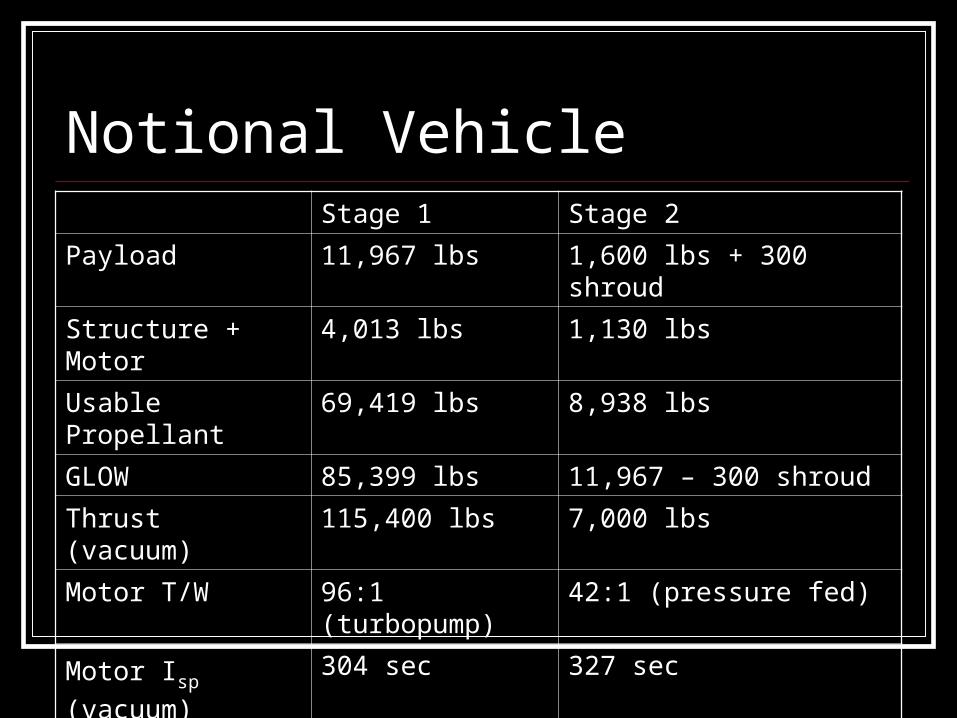
Notional VehicleStage 1 Stage 2
Payload 11,967 lbs 1,600 lbs + 300 shroud
Structure + Motor 4,013 lbs 1,130 lbs
Usable Propellant 69,419 lbs 8,938 lbs
GLOW 85,399 lbs 11,967 – 300 shroud
Thrust (vacuum) 115,400 lbs 7,000 lbs
Motor T/W 96:1 (turbopump) 42:1 (pressure fed)
Motor Isp (vacuum) 304 sec 327 sec
Burn Time 183 sec 418 sec
Delta-V (ideal) 4,996 meters/sec 4,658 meters/sec
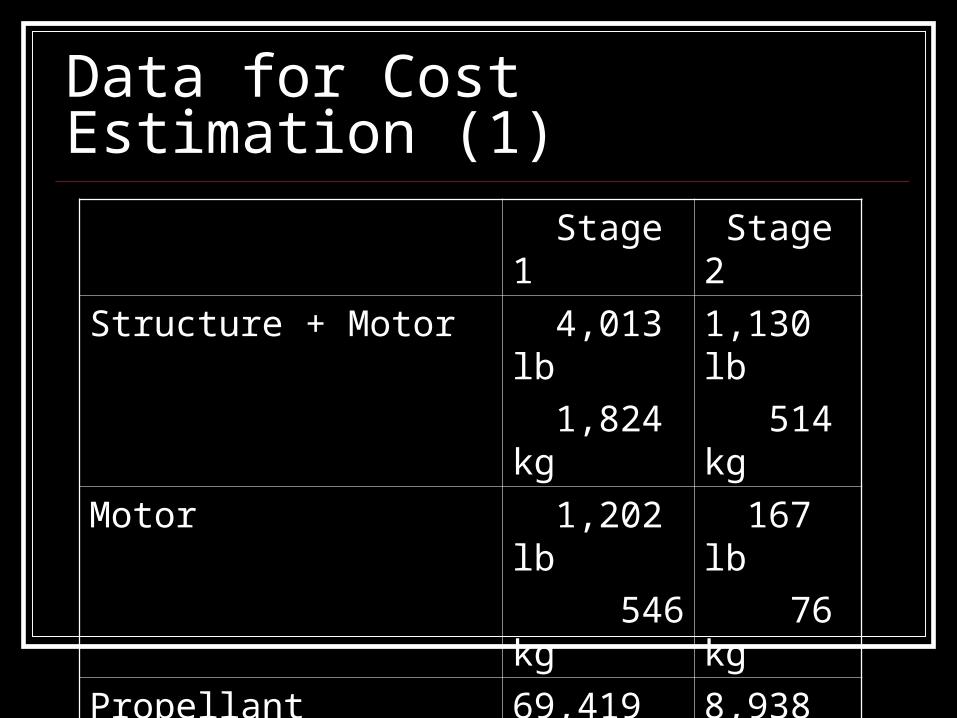
Data for Cost Estimation (1)
Stage 1 Stage 2
Structure + Motor 4,013 lb
1,824 kg
1,130 lb
514 kg
Motor 1,202 lb
546 kg
167 lb
76 kg
Propellant 69,419 lb
31,554 kg
8,938 lb
4,063 kg
Motor qualification firings 300
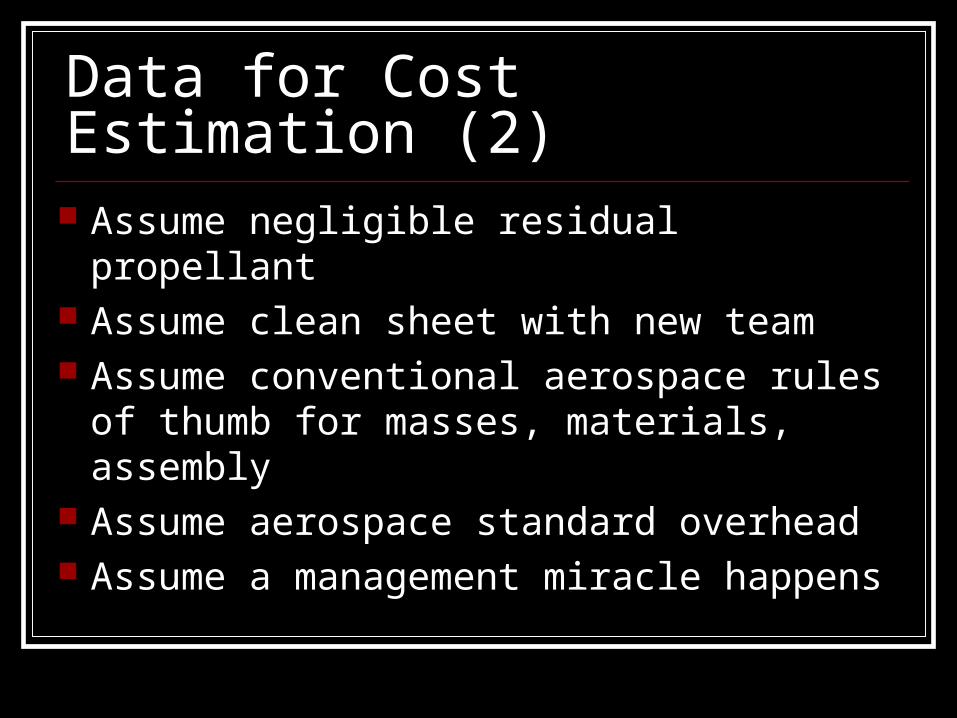
Data for Cost Estimation (2) Assume negligible residual propellant Assume clean sheet with new team Assume conventional aerospace rules of
thumb for masses, materials, assembly Assume aerospace standard overhead Assume a management miracle happens
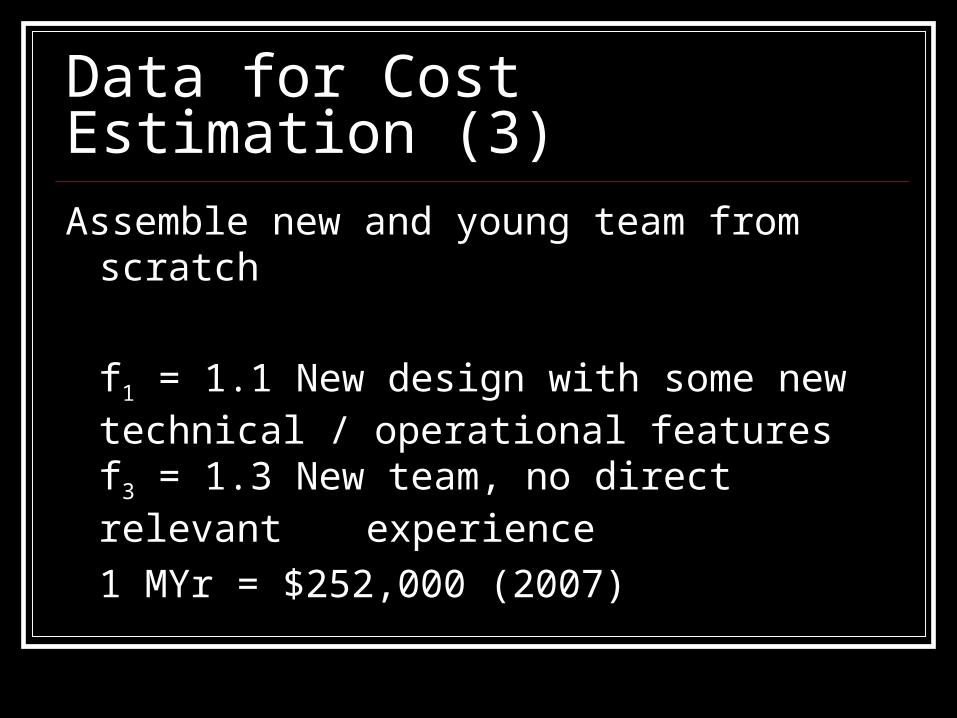
Data for Cost Estimation (3)
Assemble new and young team from scratch
f1 = 1.1 New design with some new technical / operational features
f3 = 1.3 New team, no direct relevant experience
1 MYr = $252,000 (2007)
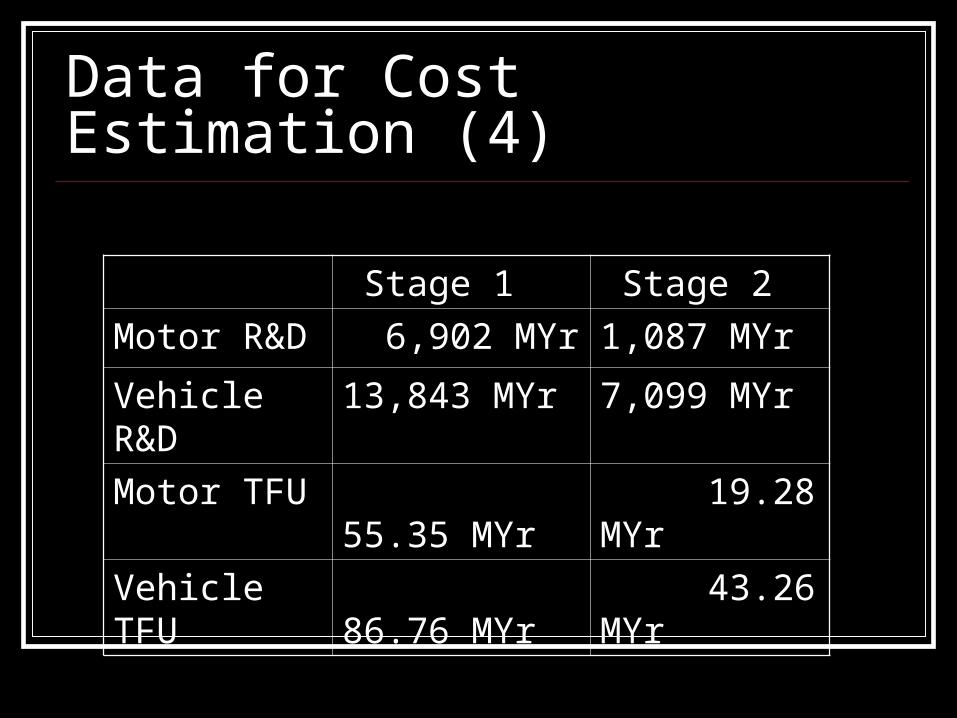
Data for Cost Estimation (4)
Stage 1 Stage 2
Motor R&D 6,902 MYr 1,087 MYr
Vehicle R&D 13,843 MYr 7,099 MYr
Motor TFU 55.35 MYr 19.28 MYr
Vehicle TFU 86.76 MYr 43.26 MYr
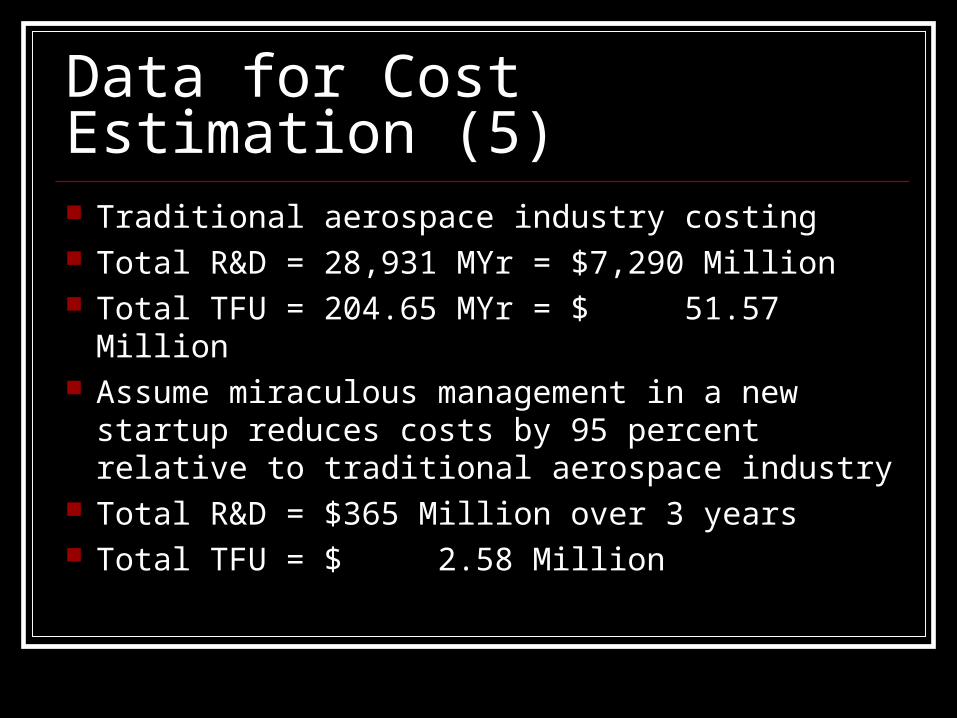
Data for Cost Estimation (5) Traditional aerospace industry costing Total R&D = 28,931 MYr = $7,290 Million Total TFU = 204.65 MYr = $ 51.57 Million Assume miraculous management in a new
startup reduces costs by 95 percent relative to traditional aerospace industry
Total R&D = $365 Million over 3 years Total TFU = $ 2.58 Million
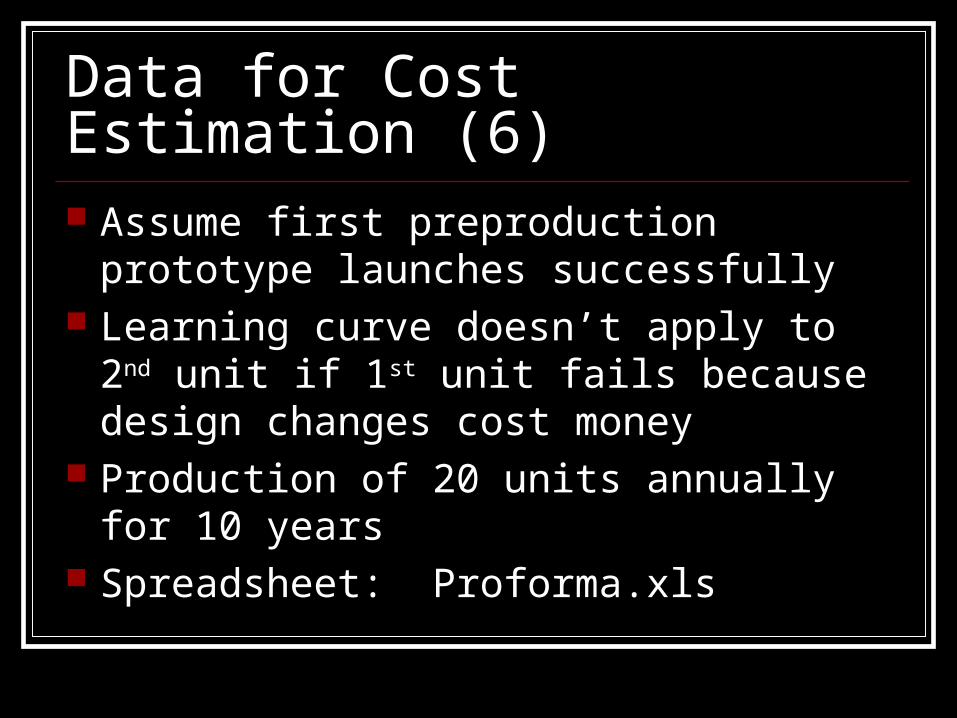
Data for Cost Estimation (6) Assume first preproduction prototype
launches successfully Learning curve doesn’t apply to 2nd unit if 1st
unit fails because design changes cost money
Production of 20 units annually for 10 years Spreadsheet: Proforma.xls
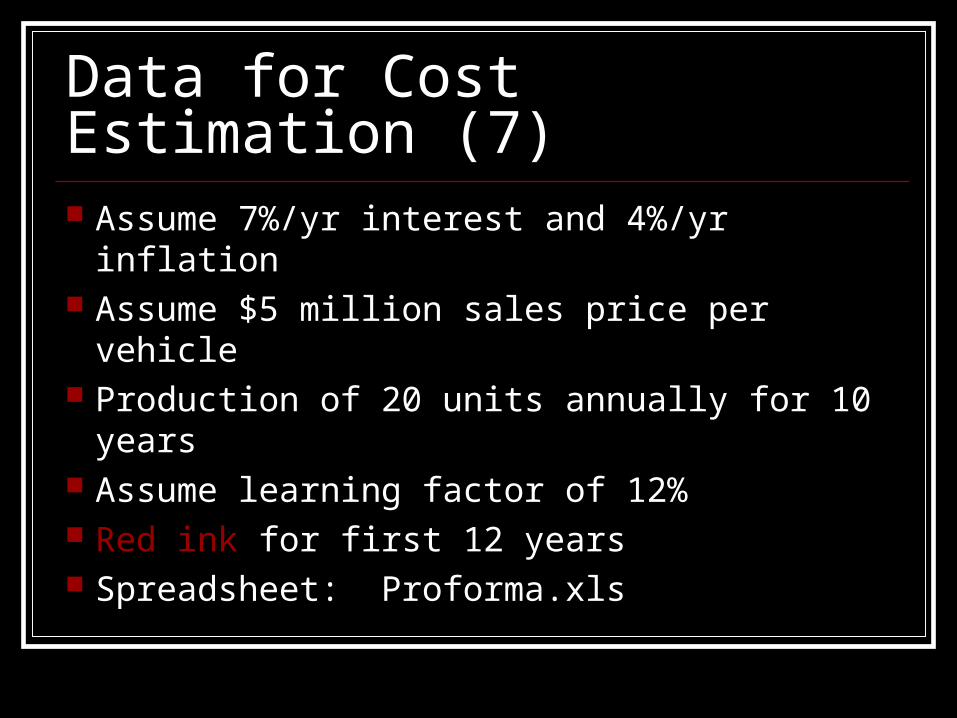
Data for Cost Estimation (7) Assume 7%/yr interest and 4%/yr inflation Assume $5 million sales price per vehicle Production of 20 units annually for 10 years Assume learning factor of 12% Red ink for first 12 years Spreadsheet: Proforma.xls
Problems for Cost Estimation Examine effects of learning curve factor Examine effects of interest cost Examine effects of sales price and manufacturing
costs Examine effects of increased R&D costs and/or
development delays What happens if initial test fails or demand
doesn’t match production? Spreadsheet: Proforma.xls