Embed Size (px)
Citation preview
Lattice dynamics of wurtzite and rocksalt AlN under high pressure: Effect of compressionon the crystal anisotropy of wurtzite-type semiconductors
Francisco Javier Manjón*Departamento de Física Aplicada-IDF-MALTA Consolider Team, Universitat Politècnica de València,
Camino de Vera s/n, 46022 Valencia, Spain
Daniel ErrandoneaDepartamento de Física Aplicada-ICMUV-MALTA Consolider Team, Universitat de València,
C/. Dr. Moliner 50, Burjassot, 46100 Valencia, Spain
Aldo Humberto RomeroCINVESTAV, 76230 Querétaro, Mexico
Núria GarroFundació General de la Universitat de València-ICMUV, Universitat de València,
Polígon La Coma s/n, 46980 Paterna, Spain
Jorge SerranoICREA–Departamento de Física Aplicada, EPSC, Universitat Politècnica de Catalunya,
Avinguda Canal Olimpic 15, E-08860 Castelldefels, Spain
Martin KuballH.H. Wills Physics Laboratory, University of Bristol, Bristol BS8 1TL, United Kingdom
�Received 24 April 2007; revised manuscript received 17 April 2008; published 16 May 2008�
Raman spectra of aluminum nitride �AlN� under pressure have been measured up to 25 GPa, i.e., beyond theonset of the wurtzite-to-rocksalt phase transition around 20 GPa. The experimental pressure coefficients for allthe Raman-active modes of the wurtzite phase are reported and compared to those obtained from ab initiolattice dynamical calculations, as well as to previous experimental and theoretical results. The pressure coef-ficients of all the Raman-active modes in wurtzite-type semiconductors �AlN, GaN, InN, ZnO, and BeO�, aswell as the relatively low bulk modulus and phase transition pressure in wurtzite AlN, are discussed in the lightof the pressure dependence of the structural crystal anisotropy in wurtzite semiconductors. On pressure release,AlN partially returns to the wurtzite phase below 1.3 GPa but the presence of a rocksalt phase in AlN wasobserved at pressures as low as 1.3 GPa, as evidenced by comparing the experimental Raman spectra tocalculated one- and two-phonon densities of states of the rocksalt phase.
DOI: 10.1103/PhysRevB.77.205204 PACS number�s�: 62.50.�p, 63.20.�e, 78.20.Bh, 78.30.Fs
I. INTRODUCTION
Aluminum nitride �AlN� is an important semiconductor ofthe group III-V nitride family for the fabrication of optoelec-tronic devices operating in the deep UV range.1 It crystallizesin the wurtzite structure and in the past years, there has beenconsiderable interest in the characterization of this wide bandgap semiconductor. Particular attention has been paid to thebehavior under pressure of wurtzite AlN �w-AlN� both inbulk and nanocrystalline forms.2–4 It has been found thatw-AlN bulk crystals undergo a pressure-induced wurtzite-to-rocksalt phase transition near 20 GPa that is fully completedabove 30 GPa, as observed by x-ray diffraction mea-surements.4–7 Furthermore, theoretical studies on AlN haveshown that its wurtzite structure behaves under pressure dif-ferently in comparison with other group-III nitrides, such asGaN and InN, and this leads to a different path for thewurtzite-to-rocksalt phase transition.8,9
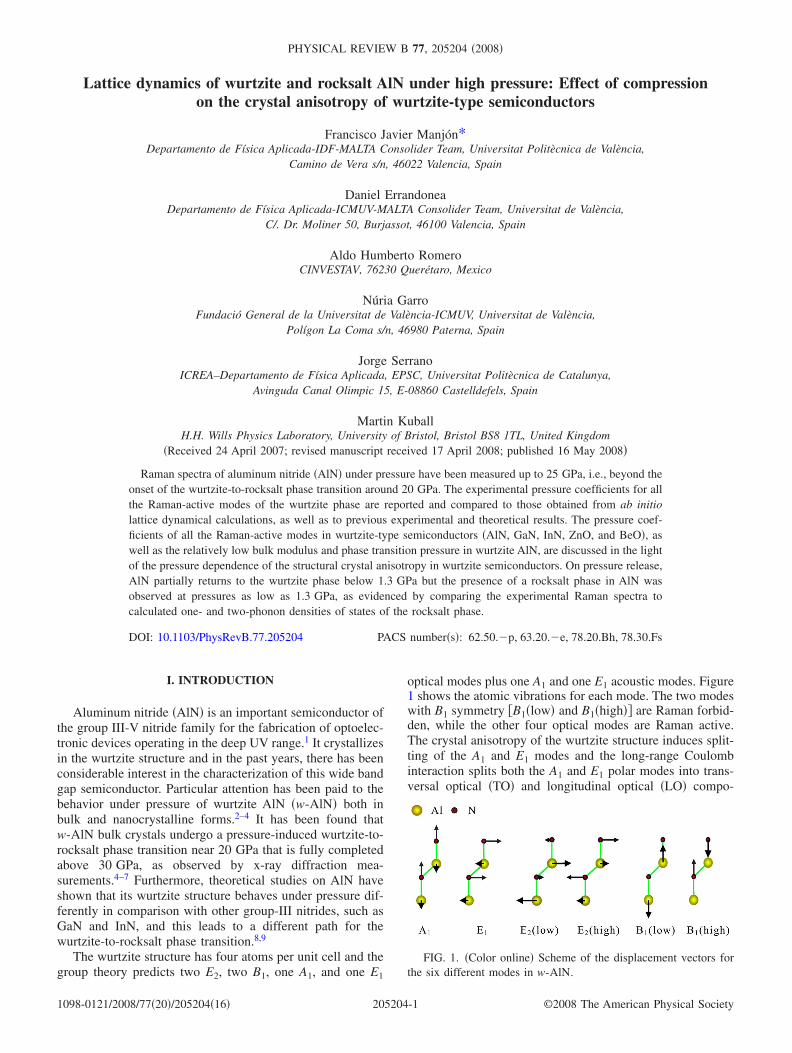
The wurtzite structure has four atoms per unit cell and thegroup theory predicts two E2, two B1, one A1, and one E1
optical modes plus one A1 and one E1 acoustic modes. Figure1 shows the atomic vibrations for each mode. The two modeswith B1 symmetry �B1�low� and B1�high�� are Raman forbid-den, while the other four optical modes are Raman active.The crystal anisotropy of the wurtzite structure induces split-ting of the A1 and E1 modes and the long-range Coulombinteraction splits both the A1 and E1 polar modes into trans-versal optical �TO� and longitudinal optical �LO� compo-
FIG. 1. �Color online� Scheme of the displacement vectors forthe six different modes in w-AlN.
PHYSICAL REVIEW B 77, 205204 �2008�
1098-0121/2008/77�20�/205204�16� ©2008 The American Physical Society205204-1
nents; the modes of E2 symmetry are usually denotedE2�low� and E2�high�. In total, there are therefore sixRaman-active optical modes.
The first Raman scattering studies on w-AlN under pres-sure were performed in thin films up to 10 GPa by Sanjurjoet al.10 These authors reported the pressure dependence ofthe TO and LO modes and the pressure coefficients of theLO-TO splitting for both the A1 and E1 modes; however, theE2�high� mode was incorrectly assigned to the A1�TO� mode.Later on, Raman scattering measurements under pressure inw-AlN single crystals up to 13 GPa reported estimations ofthe pressure coefficients of several Raman-active modes, butthe LO-TO splittings were not reported.11 More recently, Ra-man experiments under pressure up to 10 GPa suggested aslightly decreasing LO-TO �A1� splitting and an increasingLO-TO �E1� splitting with increasing pressure.12,13 This waslater confirmed in measurements of the Raman-active modesof w-GaN and w-AlN under pressures of up to 6 GPa,14
which found a small increase in the LO-TO �E1� splittingwith increasing pressure in both materials. Finally, a veryrecent study reported the pressure dependence of all theRaman-active modes in w-AlN up to 20 GPa and showedthat �i� there was a decrease in the LO-TO splitting for bothA1 and E1 modes and �ii� there was a strong dependence ofthe E2�low� mode frequency on the pressure-transmittingmedium above 15 GPa.15
Concerning the rocksalt phase of AlN �rs-AlN�, Ref. 15 isthe only work, to the best of our knowledge, that has ex-plored the experimental behavior of the Raman modes ofw-AlN upon application of pressure up to the wurtzite-to-rocksalt phase transition. However, there is no available in-formation regarding the behavior of the vibrational proper-ties of AlN on decreasing pressures upon reaching the phasetransition.
As regards to theoretical calculations of the lattice dynam-ics of w-AlN, full-potential linear muffin tin orbital �FP-LMTO� calculations were used to predict the frequencies andpressure coefficients of Raman-active modes, but the pres-sure coefficients for the LO modes were not reported.16 Abinitio lattice dynamical calculations were the first to estimatethe frequencies and pressure coefficients of all the Raman-active modes of w-AlN and predicted an increase in theLO-TO splitting for both the A1 and E1 modes.17,18 Further-more, a theoretical work was devoted to the explanation ofthe strange positive pressure coefficient of the E2�low� modein w-AlN.19 Since then, several groups have performed abinitio lattice dynamical calculations for wurtzite and zincblende AlN �zb-AlN� at ambient pressure20,21 and, recently,for rs-AlN.22 To our knowledge, there is no report on the abinitio calculated two-phonon density of states in any of thethree phases.
In this work, we report on the pressure dependence of theRaman-active modes of wurtzite AlN up to 25 GPa, i.e.,above the transition to the rocksalt structure observed here at20 GPa. We also discuss the effect of pressure on theRaman-active modes of w-AlN and rs-AlN on the upstrokeand the downstroke, respectively. In order to understand thepressure dependence of the phonons in the wurtzite phaseand to identify the possible phases during the downstroke,we have performed ab initio lattice dynamical calculations of
the wurtzite, zinc blende, and rocksalt phases at differentpressures, including the calculation of zone-center phonons,phonon-dispersion curves, and one- and two-phonon �sumand difference� densities of states. Finally, in the light of theexperimental and theoretical results, we discuss the effect ofthe crystal anisotropy on the pressure coefficients of the Ra-man modes in w-AlN and its comparison to those in otherwurtzite semiconductors. A preliminary report on the presentwork using density-functional theory �DFT�–local densityapproximation �LDA� calculations was previously pub-lished.23 In this work, we report a more detailed discussionon the experimental results in the light of DFT–generalizedgradient approximation �GGA� calculations, which we foundto be more accurate than the previous LDA calculations.
II. EXPERIMENTAL DETAILS
Wurtzite AlN single crystals of 100 �m diameter and30 �m thickness were loaded in a diamond anvil cellequipped with 500 �m culet-size diamonds. The samplechamber was formed by drilling a 200 �m diameter hole in a350 �m Inconel gasket that had been preindented to a thick-ness of 45 �m. A 4:1 methanol-ethanol mixture was used asa pressure-transmitting medium ensuring hydrostatic condi-tions up to 10 GPa and quasihydrostatic conditions between10 and 20 GPa.24 The sample pressure was determined byusing a ruby chip as a pressure sensor.25 Raman experimentsat room temperature were performed in the backscatteringgeometry by using the 514.5 nm line of an Ar+-ion laser anda Jobin-Yvon T64000 triple spectrometer in combinationwith a multichannel charge coupled device detector. Thespectral resolutions were around 1 cm−1. Argon and neonplasma lines were used to calibrate the spectra. The measure-ments were performed with a laser power below 50 mW atthe sample position in order to avoid thermal effects.
III. AB INITIO CALCULATION DETAILS
Our calculations rely on the DFT, with a plane-wave basisset and norm-conserving pseudopotentials. We have used theABINIT code26–28 to calculate the structural and electronicproperties, phonon frequencies, and interatomic force con-stants for AlN. The exchange-correlation energy was com-puted in the GGA by using the Perdew-Burke-Ernzerhofexchange-correlation functional.29 The pseudopotentialswere generated by using the scheme implemented in theOPIUM project30 with s and p electrons for the valencestates of both Al and N. They correspond to nonrelativisticoptimized pseudopotentials obtained by following the proce-dure explained in Ref. 31.
To describe the electronic properties and approximate theintegrals on the wave vectors of the electronic wave functionover the entire first Brillouin zone �BZ�, a Monkhorst-Packgrid of 10�10�8 for the wurtzite and 8�8�8 for therocksalt and zinc blende unit cells32 was used. With respectto this grid and the corresponding cutoff of 60 Ry,this choice gives an energy convergence better than1 mhartree / f.u. and pressure accuracy of better than0.001 GPa. The optimization of the unit cell at a given pres-
MANJÓN et al. PHYSICAL REVIEW B 77, 205204 �2008�
205204-2
sure was performed in three steps: �i� Relaxation of the lat-tice parameters �a and c in the wurtzite phase and a in thezinc blende and rocksalt phases� at a given pressure with afixed value of the internal parameter in the case of the wurtz-ite structure; �ii� relaxation of u at the above obtained cellparameter values; and �iii� relaxation of both the internalparameter and the lattice constants at the target pressure.
The dynamical matrices were computed by using a varia-tional formulation of the density-functional perturbationtheory.33,34 This formulation allows the calculation of thephonon response directly from the unit cell without the useof supercells and with the possibility of calculating the dy-namical matrix of an arbitrary q vector. The force constantswere extracted from a Fourier transform of the dynamicalmatrices obtained for the predefined grid in the BZ. Thesematrices were then employed to obtain the phonon frequen-cies at arbitrary points in reciprocal space and the phonon-dispersion relations by Fourier interpolation. The one- andtwo-phonon densities of states were also calculated by usingthe same approach35 with the initial grid and then a subse-quent and increasing size was calculated until the change inthe total vibrational density of states was less than 0.1.
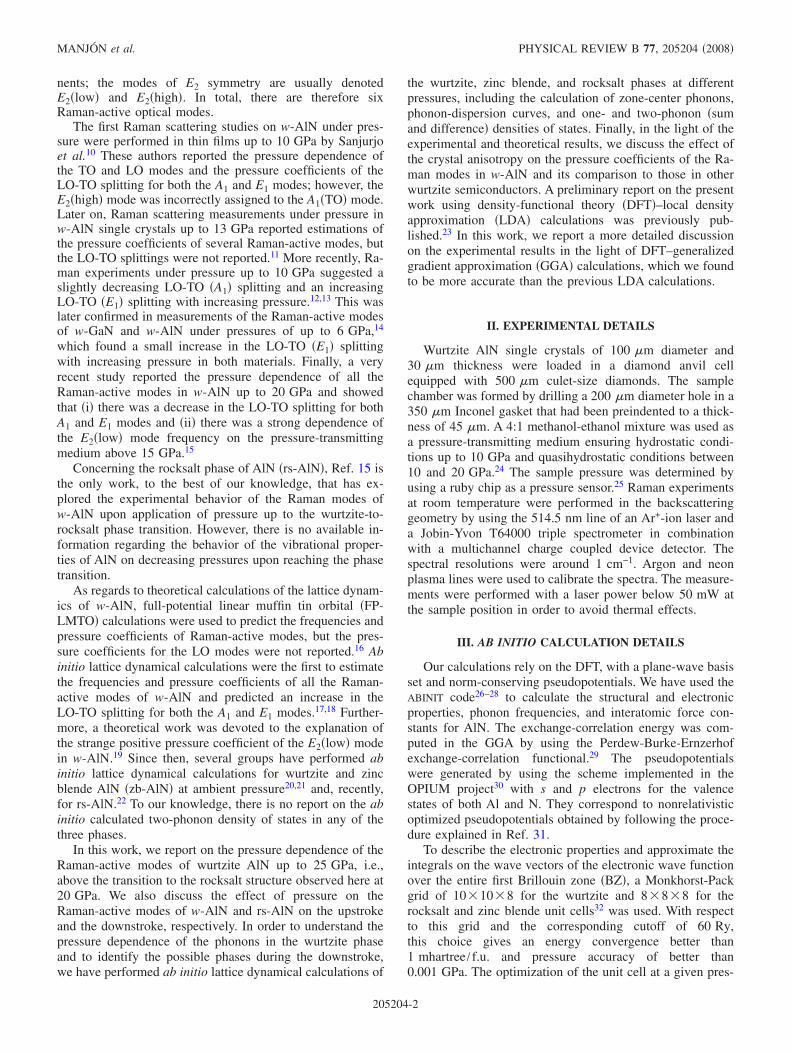
In order to check the accuracy of our lattice dynamicalcalculations, Fig. 2 shows the calculated pressure depen-dence of the relative volume �V /V0�, the axial c /a ratio, andthe internal parameter u in w-AlN. The comparison with theexperimental pressure dependence of the relative volume andc /a ratio obtained from fits of data reported in the literature5
is satisfactory. To our knowledge, no information has beenreported regarding the experimental pressure dependence ofthe parameter u in w-AlN.
IV. RESULTS AND DISCUSSION
A. Experimental and theoretical results for the wurtzite phase
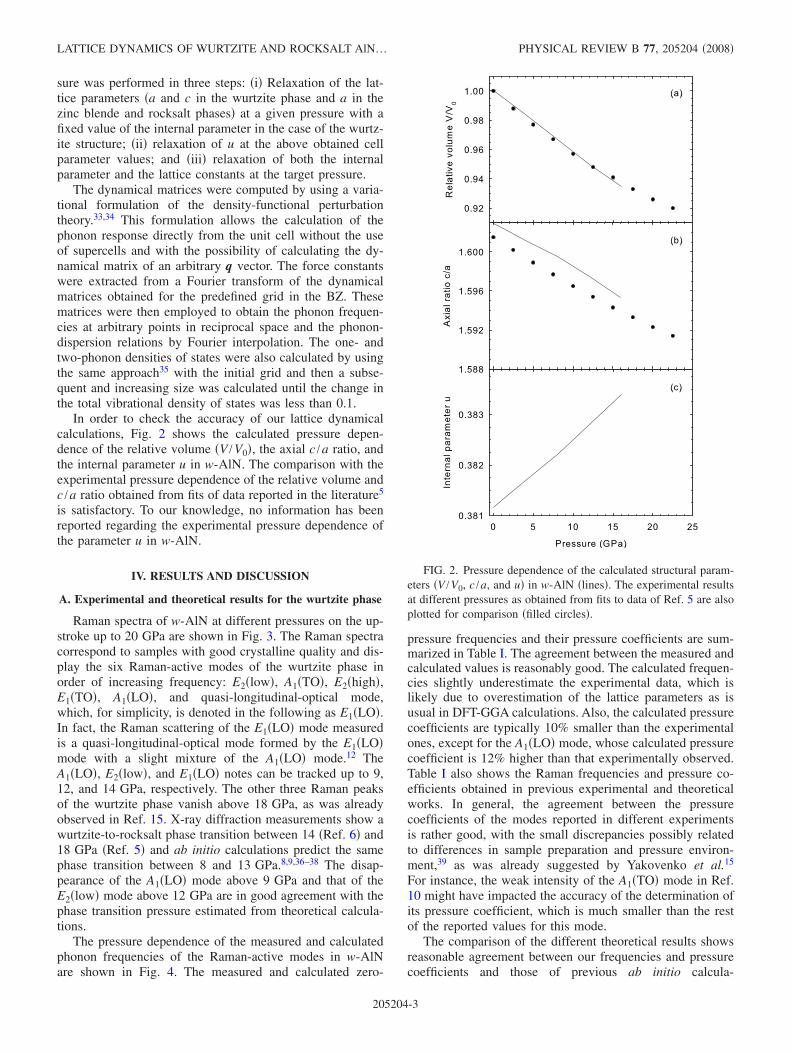
Raman spectra of w-AlN at different pressures on the up-stroke up to 20 GPa are shown in Fig. 3. The Raman spectracorrespond to samples with good crystalline quality and dis-play the six Raman-active modes of the wurtzite phase inorder of increasing frequency: E2�low�, A1�TO�, E2�high�,E1�TO�, A1�LO�, and quasi-longitudinal-optical mode,which, for simplicity, is denoted in the following as E1�LO�.In fact, the Raman scattering of the E1�LO� mode measuredis a quasi-longitudinal-optical mode formed by the E1�LO�mode with a slight mixture of the A1�LO� mode.12 TheA1�LO�, E2�low�, and E1�LO� notes can be tracked up to 9,12, and 14 GPa, respectively. The other three Raman peaksof the wurtzite phase vanish above 18 GPa, as was alreadyobserved in Ref. 15. X-ray diffraction measurements show awurtzite-to-rocksalt phase transition between 14 �Ref. 6� and18 GPa �Ref. 5� and ab initio calculations predict the samephase transition between 8 and 13 GPa.8,9,36–38 The disap-pearance of the A1�LO� mode above 9 GPa and that of theE2�low� mode above 12 GPa are in good agreement with thephase transition pressure estimated from theoretical calcula-tions.
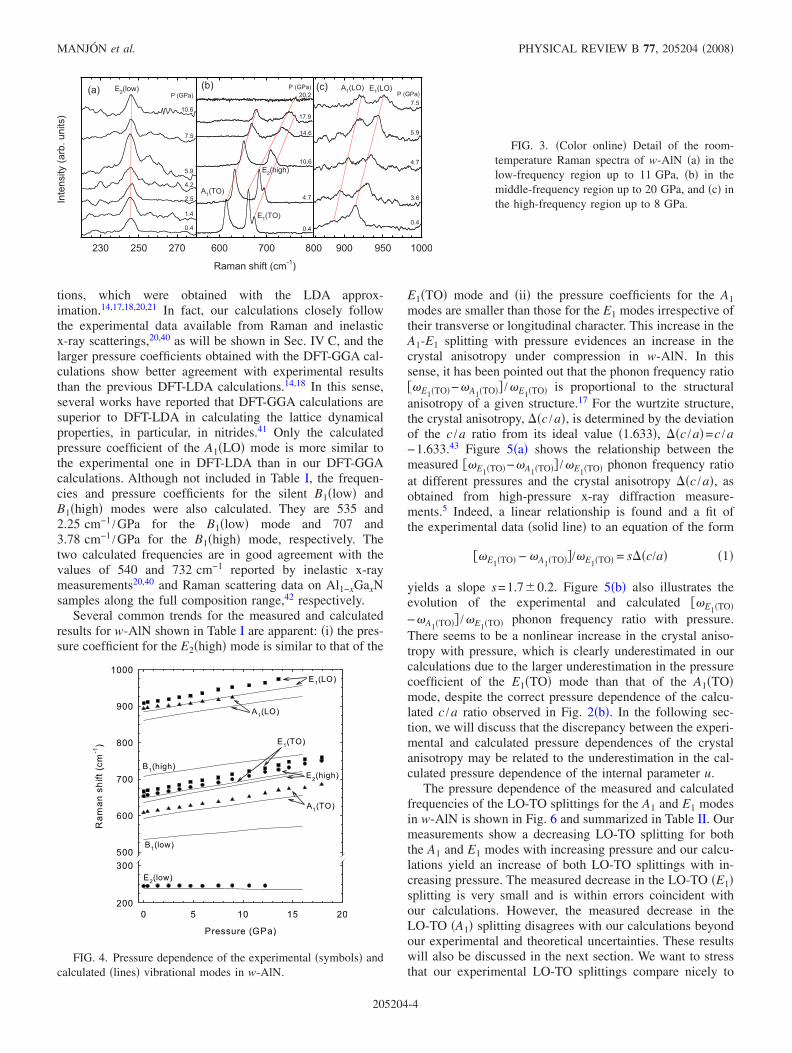
The pressure dependence of the measured and calculatedphonon frequencies of the Raman-active modes in w-AlNare shown in Fig. 4. The measured and calculated zero-
pressure frequencies and their pressure coefficients are sum-marized in Table I. The agreement between the measured andcalculated values is reasonably good. The calculated frequen-cies slightly underestimate the experimental data, which islikely due to overestimation of the lattice parameters as isusual in DFT-GGA calculations. Also, the calculated pressurecoefficients are typically 10% smaller than the experimentalones, except for the A1�LO� mode, whose calculated pressurecoefficient is 12% higher than that experimentally observed.Table I also shows the Raman frequencies and pressure co-efficients obtained in previous experimental and theoreticalworks. In general, the agreement between the pressurecoefficients of the modes reported in different experimentsis rather good, with the small discrepancies possibly relatedto differences in sample preparation and pressure environ-ment,39 as was already suggested by Yakovenko et al.15
For instance, the weak intensity of the A1�TO� mode in Ref.10 might have impacted the accuracy of the determination ofits pressure coefficient, which is much smaller than the restof the reported values for this mode.
The comparison of the different theoretical results showsreasonable agreement between our frequencies and pressurecoefficients and those of previous ab initio calcula-
FIG. 2. Pressure dependence of the calculated structural param-eters �V /V0, c /a, and u� in w-AlN �lines�. The experimental resultsat different pressures as obtained from fits to data of Ref. 5 are alsoplotted for comparison �filled circles�.
LATTICE DYNAMICS OF WURTZITE AND ROCKSALT AlN… PHYSICAL REVIEW B 77, 205204 �2008�
205204-3
tions, which were obtained with the LDA approx-imation.14,17,18,20,21 In fact, our calculations closely followthe experimental data available from Raman and inelasticx-ray scatterings,20,40 as will be shown in Sec. IV C, and thelarger pressure coefficients obtained with the DFT-GGA cal-culations show better agreement with experimental resultsthan the previous DFT-LDA calculations.14,18 In this sense,several works have reported that DFT-GGA calculations aresuperior to DFT-LDA in calculating the lattice dynamicalproperties, in particular, in nitrides.41 Only the calculatedpressure coefficient of the A1�LO� mode is more similar tothe experimental one in DFT-LDA than in our DFT-GGAcalculations. Although not included in Table I, the frequen-cies and pressure coefficients for the silent B1�low� andB1�high� modes were also calculated. They are 535 and2.25 cm−1 /GPa for the B1�low� mode and 707 and3.78 cm−1 /GPa for the B1�high� mode, respectively. Thetwo calculated frequencies are in good agreement with thevalues of 540 and 732 cm−1 reported by inelastic x-raymeasurements20,40 and Raman scattering data on Al1−xGaxNsamples along the full composition range,42 respectively.
Several common trends for the measured and calculatedresults for w-AlN shown in Table I are apparent: �i� the pres-sure coefficient for the E2�high� mode is similar to that of the
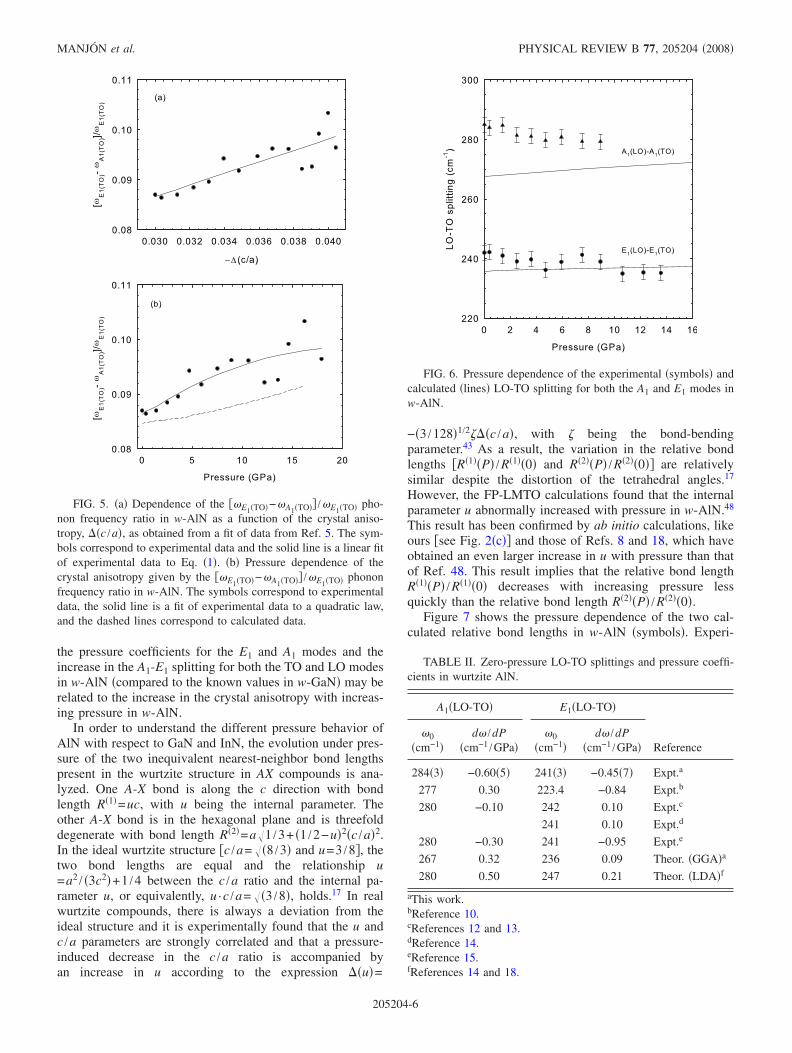
E1�TO� mode and �ii� the pressure coefficients for the A1modes are smaller than those for the E1 modes irrespective oftheir transverse or longitudinal character. This increase in theA1-E1 splitting with pressure evidences an increase in thecrystal anisotropy under compression in w-AlN. In thissense, it has been pointed out that the phonon frequency ratio��E1�TO�−�A1�TO�� /�E1�TO� is proportional to the structuralanisotropy of a given structure.17 For the wurtzite structure,the crystal anisotropy, ��c /a�, is determined by the deviationof the c /a ratio from its ideal value �1.633�, ��c /a�=c /a−1.633.43 Figure 5�a� shows the relationship between themeasured ��E1�TO�−�A1�TO�� /�E1�TO� phonon frequency ratioat different pressures and the crystal anisotropy ��c /a�, asobtained from high-pressure x-ray diffraction measure-ments.5 Indeed, a linear relationship is found and a fit ofthe experimental data �solid line� to an equation of the form
��E1�TO� − �A1�TO��/�E1�TO� = s��c/a� �1�
yields a slope s=1.7�0.2. Figure 5�b� also illustrates theevolution of the experimental and calculated ��E1�TO�−�A1�TO�� /�E1�TO� phonon frequency ratio with pressure.There seems to be a nonlinear increase in the crystal aniso-tropy with pressure, which is clearly underestimated in ourcalculations due to the larger underestimation in the pressurecoefficient of the E1�TO� mode than that of the A1�TO�mode, despite the correct pressure dependence of the calcu-lated c /a ratio observed in Fig. 2�b�. In the following sec-tion, we will discuss that the discrepancy between the experi-mental and calculated pressure dependences of the crystalanisotropy may be related to the underestimation in the cal-culated pressure dependence of the internal parameter u.
The pressure dependence of the measured and calculatedfrequencies of the LO-TO splittings for the A1 and E1 modesin w-AlN is shown in Fig. 6 and summarized in Table II. Ourmeasurements show a decreasing LO-TO splitting for boththe A1 and E1 modes with increasing pressure and our calcu-lations yield an increase of both LO-TO splittings with in-creasing pressure. The measured decrease in the LO-TO �E1�splitting is very small and is within errors coincident withour calculations. However, the measured decrease in theLO-TO �A1� splitting disagrees with our calculations beyondour experimental and theoretical uncertainties. These resultswill also be discussed in the next section. We want to stressthat our experimental LO-TO splittings compare nicely to
230 250 270
Intensity(arb.units)
E2(low)
0.4
1.4
2.5
4.2
7.5
10.6
P (GPa)
5.9
(a)
Raman shift (cm-1)
600 700 800
0.4
4.7
17.9
20.2
P (GPa)
14.6
10.6
E2(high)
A1(TO)
E1(TO)
(b)
900 950 1000
E1(LO)
0.4
3.6
4.7
7.5
P (GPa)
5.9
A1(LO)(c)
FIG. 3. �Color online� Detail of the room-temperature Raman spectra of w-AlN �a� in thelow-frequency region up to 11 GPa, �b� in themiddle-frequency region up to 20 GPa, and �c� inthe high-frequency region up to 8 GPa.
FIG. 4. Pressure dependence of the experimental �symbols� andcalculated �lines� vibrational modes in w-AlN.
MANJÓN et al. PHYSICAL REVIEW B 77, 205204 �2008�
205204-4
those of Yakovenko et al.15 and disagree to a certain levelwith other experimental data summarized in Table II forcomparison. From the inspection of the Raman scatteringspectra reported in Refs. 10, 12, and 13, we believe that theweak intensity of some of the optical modes might havelimited the accuracy of the determination of the pressure co-efficients of the LO-TO splittings. Furthermore, the pressuredependence of the LO-TO �A1� splitting in Ref. 10 was notmeasured since the E2�high� mode was incorrectly assignedto the A1�TO� mode. Unfortunately, no high-pressure Ramanspectra are shown in Ref. 14, preventing a direct comparisonwith our spectra. The dispersion in the measured pressurecoefficients of the LO-TO splittings is very high and it isdifficult to draw any conclusion; however, we might pointout that our negative measured pressure coefficients for bothLO-TO �A1 and E1� splittings are in qualitative agreementwith the negative values of the pressure coefficients obtainedfrom the average of the different experimental splittings re-ported �−0.17 and −0.4 cm−1 /GPa for the A1 and E1 modes,respectively�. Furthermore, the comparison of the experi-mental and theoretical results for the LO-TO splittings pointsout that our DFT-GGA calculations give pressure coefficientsthat are in better agreement with experimental results thanprevious DFT-LDA calculations and suggest that bothLO-TO splittings in w-AlN have smaller pressure coeffi-cients than those previously calculated.
B. Discussion of the results obtained for the wurtzite phase
In this section, we will show that the larger pressure co-efficients of the frequencies for the E1 modes with respect tothe A1 modes in w-AlN is a consequence of the increase in
the crystal anisotropy with increasing pressure. The pressuredependence of the TO and LO modes in w-AlN is also dis-cussed and the relative pressure coefficients of the differentmodes are shown to scale with the relative pressure coeffi-cients of the two inequivalent Al-N distances of the wurtzitestructure. Finally, the decrease in the LO-TO splitting forboth the A1 and E1 modes with pressure is illustrated to be aconsequence of the decrease in the bond polarizability inAlN on compression.
1. Structural anisotropy: A1-E1 splittings
Table III shows the pressure coefficients and the relativepressure coefficients for the Raman-active optical modes inwurtzite-type AlN, GaN, and InN. In GaN, the pressure co-efficients for the A1�TO� and E1�TO� are very similar, thuspointing toward an almost pressure-independent A1-E1 �TO�splitting. Unfortunately, the only Raman measurements ofInN under pressure44 have not reported the pressure depen-dence of the A1-E1 splitting. Note that we have consideredthat the measured frequency of the A1�LO� mode in InNrather correspond to the E1�LO� �see Ref. 45�. The ��E1�TO�−�A1�TO�� /�E1�TO� phonon frequency ratio at ambient pres-sure yields 0.048, 0.061, and 0.087 for GaN, InN, and AlN,respectively.14,46 These values qualitatively agree with thevariation in ��c /a� in the three compounds at ambient pres-sure, known from structural data,5,47 which shows that thecrystal anisotropy in w-AlN is much larger than that inw-InN and that in w-GaN. Concerning the pressure depen-dence of ��c /a�, structural data show that the crystal aniso-tropy is almost independent of pressure in w-GaN andw-InN,8,47 unlike in w-AlN. Therefore, the large difference in
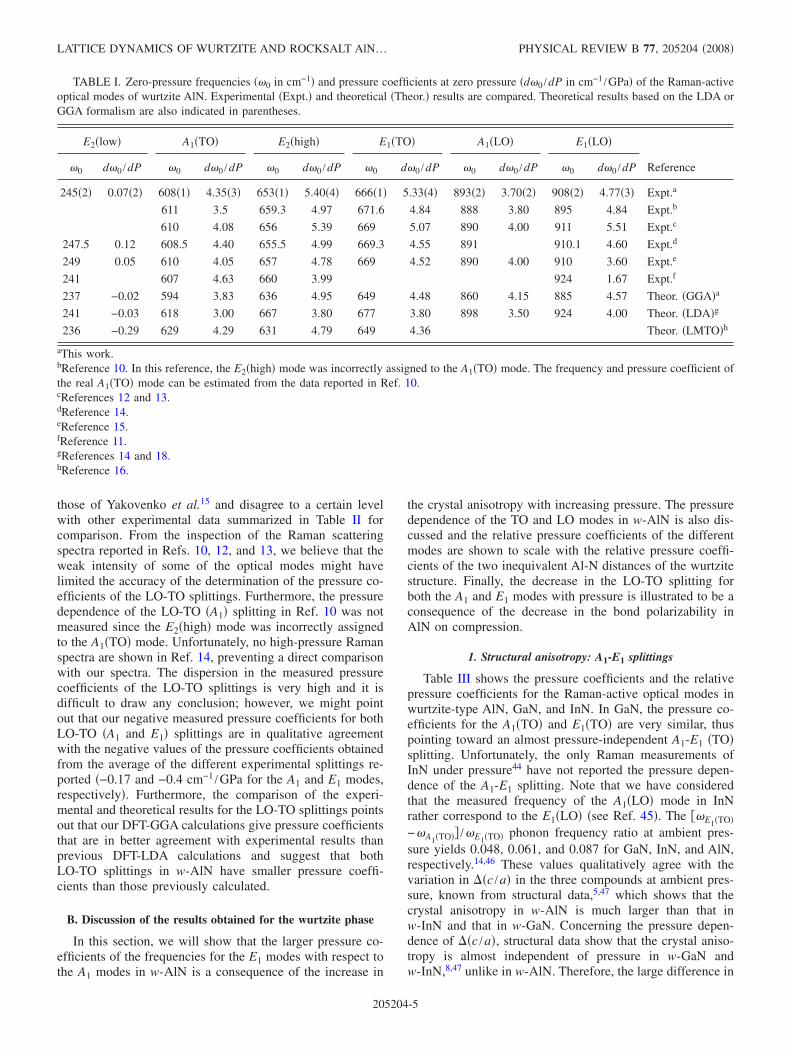
TABLE I. Zero-pressure frequencies ��0 in cm−1� and pressure coefficients at zero pressure �d�0 /dP in cm−1 /GPa� of the Raman-activeoptical modes of wurtzite AlN. Experimental �Expt.� and theoretical �Theor.� results are compared. Theoretical results based on the LDA orGGA formalism are also indicated in parentheses.
E2�low� A1�TO� E2�high� E1�TO� A1�LO� E1�LO�
Reference�0 d�0 /dP �0 d�0 /dP �0 d�0 /dP �0 d�0 /dP �0 d�0 /dP �0 d�0 /dP
245�2� 0.07�2� 608�1� 4.35�3� 653�1� 5.40�4� 666�1� 5.33�4� 893�2� 3.70�2� 908�2� 4.77�3� Expt.a
611 3.5 659.3 4.97 671.6 4.84 888 3.80 895 4.84 Expt.b
610 4.08 656 5.39 669 5.07 890 4.00 911 5.51 Expt.c
247.5 0.12 608.5 4.40 655.5 4.99 669.3 4.55 891 910.1 4.60 Expt.d
249 0.05 610 4.05 657 4.78 669 4.52 890 4.00 910 3.60 Expt.e
241 607 4.63 660 3.99 924 1.67 Expt.f
237 −0.02 594 3.83 636 4.95 649 4.48 860 4.15 885 4.57 Theor. �GGA�a
241 −0.03 618 3.00 667 3.80 677 3.80 898 3.50 924 4.00 Theor. �LDA�g
236 −0.29 629 4.29 631 4.79 649 4.36 Theor. �LMTO�h
aThis work.bReference 10. In this reference, the E2�high� mode was incorrectly assigned to the A1�TO� mode. The frequency and pressure coefficient ofthe real A1�TO� mode can be estimated from the data reported in Ref. 10.cReferences 12 and 13.dReference 14.eReference 15.fReference 11.gReferences 14 and 18.hReference 16.
LATTICE DYNAMICS OF WURTZITE AND ROCKSALT AlN… PHYSICAL REVIEW B 77, 205204 �2008�
205204-5
the pressure coefficients for the E1 and A1 modes and theincrease in the A1-E1 splitting for both the TO and LO modesin w-AlN �compared to the known values in w-GaN� may berelated to the increase in the crystal anisotropy with increas-ing pressure in w-AlN.
In order to understand the different pressure behavior ofAlN with respect to GaN and InN, the evolution under pres-sure of the two inequivalent nearest-neighbor bond lengthspresent in the wurtzite structure in AX compounds is ana-lyzed. One A-X bond is along the c direction with bondlength R�1�=uc, with u being the internal parameter. Theother A-X bond is in the hexagonal plane and is threefolddegenerate with bond length R�2�=a�1 /3+ �1 /2−u�2�c /a�2.In the ideal wurtzite structure �c /a= ��8 /3� and u=3 /8�, thetwo bond lengths are equal and the relationship u=a2 / �3c2�+1 /4 between the c /a ratio and the internal pa-rameter u, or equivalently, u ·c /a= ��3 /8�, holds.17 In realwurtzite compounds, there is always a deviation from theideal structure and it is experimentally found that the u andc /a parameters are strongly correlated and that a pressure-induced decrease in the c /a ratio is accompanied byan increase in u according to the expression ��u�=
−�3 /128�1/2���c /a�, with � being the bond-bendingparameter.43 As a result, the variation in the relative bondlengths �R�1��P� /R�1��0� and R�2��P� /R�2��0�� are relativelysimilar despite the distortion of the tetrahedral angles.17
However, the FP-LMTO calculations found that the internalparameter u abnormally increased with pressure in w-AlN.48
This result has been confirmed by ab initio calculations, likeours �see Fig. 2�c�� and those of Refs. 8 and 18, which haveobtained an even larger increase in u with pressure than thatof Ref. 48. This result implies that the relative bond lengthR�1��P� /R�1��0� decreases with increasing pressure lessquickly than the relative bond length R�2��P� /R�2��0�.
Figure 7 shows the pressure dependence of the two cal-culated relative bond lengths in w-AlN �symbols�. Experi-
FIG. 5. �a� Dependence of the ��E1�TO�−�A1�TO�� /�E1�TO� pho-non frequency ratio in w-AlN as a function of the crystal aniso-tropy, ��c /a�, as obtained from a fit of data from Ref. 5. The sym-bols correspond to experimental data and the solid line is a linear fitof experimental data to Eq. �1�. �b� Pressure dependence of thecrystal anisotropy given by the ��E1�TO�−�A1�TO�� /�E1�TO� phononfrequency ratio in w-AlN. The symbols correspond to experimentaldata, the solid line is a fit of experimental data to a quadratic law,and the dashed lines correspond to calculated data.
FIG. 6. Pressure dependence of the experimental �symbols� andcalculated �lines� LO-TO splitting for both the A1 and E1 modes inw-AlN.
TABLE II. Zero-pressure LO-TO splittings and pressure coeffi-cients in wurtzite AlN.
A1�LO-TO� E1�LO-TO�
Reference�0
�cm−1�d� /dP
�cm−1 /GPa��0
�cm−1�d� /dP
�cm−1 /GPa�
284�3� −0.60�5� 241�3� −0.45�7� Expt.a
277 0.30 223.4 −0.84 Expt.b
280 −0.10 242 0.10 Expt.c
241 0.10 Expt.d
280 −0.30 241 −0.95 Expt.e
267 0.32 236 0.09 Theor. �GGA�a
280 0.50 247 0.21 Theor. �LDA�f
aThis work.bReference 10.cReferences 12 and 13.dReference 14.eReference 15.fReferences 14 and 18.
MANJÓN et al. PHYSICAL REVIEW B 77, 205204 �2008�
205204-6
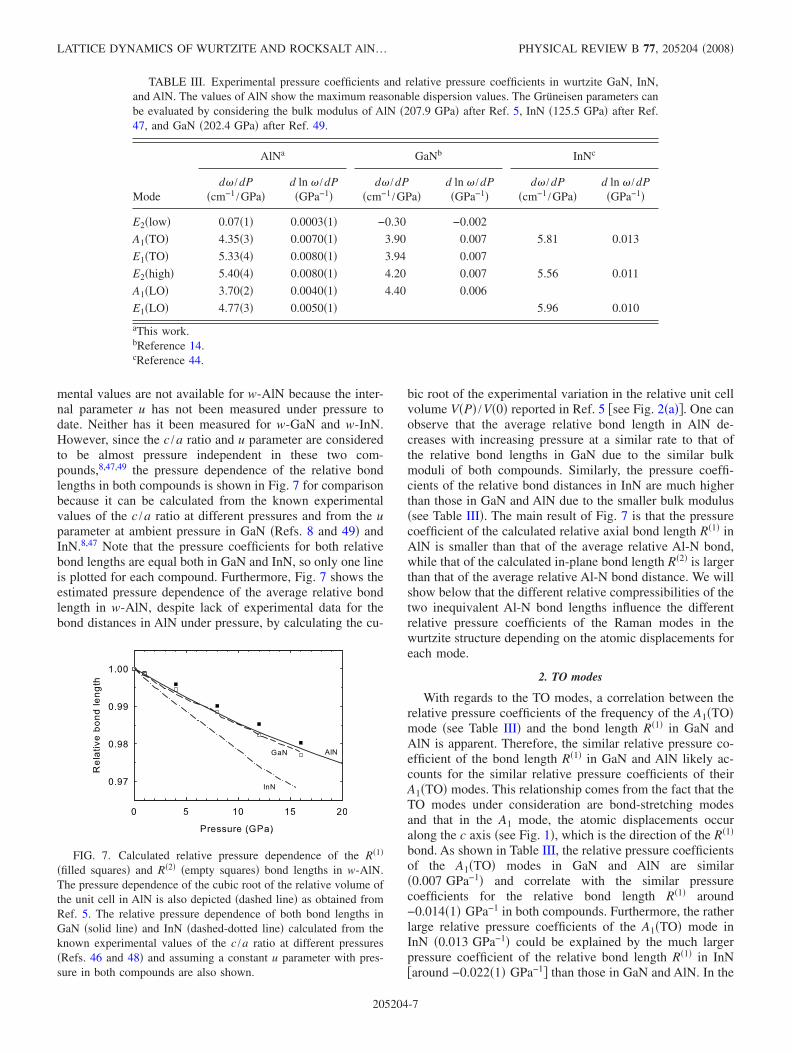
mental values are not available for w-AlN because the inter-nal parameter u has not been measured under pressure todate. Neither has it been measured for w-GaN and w-InN.However, since the c /a ratio and u parameter are consideredto be almost pressure independent in these two com-pounds,8,47,49 the pressure dependence of the relative bondlengths in both compounds is shown in Fig. 7 for comparisonbecause it can be calculated from the known experimentalvalues of the c /a ratio at different pressures and from the uparameter at ambient pressure in GaN �Refs. 8 and 49� andInN.8,47 Note that the pressure coefficients for both relativebond lengths are equal both in GaN and InN, so only one lineis plotted for each compound. Furthermore, Fig. 7 shows theestimated pressure dependence of the average relative bondlength in w-AlN, despite lack of experimental data for thebond distances in AlN under pressure, by calculating the cu-
bic root of the experimental variation in the relative unit cellvolume V�P� /V�0� reported in Ref. 5 �see Fig. 2�a��. One canobserve that the average relative bond length in AlN de-creases with increasing pressure at a similar rate to that ofthe relative bond lengths in GaN due to the similar bulkmoduli of both compounds. Similarly, the pressure coeffi-cients of the relative bond distances in InN are much higherthan those in GaN and AlN due to the smaller bulk modulus�see Table III�. The main result of Fig. 7 is that the pressurecoefficient of the calculated relative axial bond length R�1� inAlN is smaller than that of the average relative Al-N bond,while that of the calculated in-plane bond length R�2� is largerthan that of the average relative Al-N bond distance. We willshow below that the different relative compressibilities of thetwo inequivalent Al-N bond lengths influence the differentrelative pressure coefficients of the Raman modes in thewurtzite structure depending on the atomic displacements foreach mode.
2. TO modes
With regards to the TO modes, a correlation between therelative pressure coefficients of the frequency of the A1�TO�mode �see Table III� and the bond length R�1� in GaN andAlN is apparent. Therefore, the similar relative pressure co-efficient of the bond length R�1� in GaN and AlN likely ac-counts for the similar relative pressure coefficients of theirA1�TO� modes. This relationship comes from the fact that theTO modes under consideration are bond-stretching modesand that in the A1 mode, the atomic displacements occuralong the c axis �see Fig. 1�, which is the direction of the R�1�
bond. As shown in Table III, the relative pressure coefficientsof the A1�TO� modes in GaN and AlN are similar�0.007 GPa−1� and correlate with the similar pressurecoefficients for the relative bond length R�1� around−0.014�1� GPa−1 in both compounds. Furthermore, the ratherlarge relative pressure coefficients of the A1�TO� mode inInN �0.013 GPa−1� could be explained by the much largerpressure coefficient of the relative bond length R�1� in InN�around −0.022�1� GPa−1� than those in GaN and AlN. In the
TABLE III. Experimental pressure coefficients and relative pressure coefficients in wurtzite GaN, InN,and AlN. The values of AlN show the maximum reasonable dispersion values. The Grüneisen parameters canbe evaluated by considering the bulk modulus of AlN �207.9 GPa� after Ref. 5, InN �125.5 GPa� after Ref.47, and GaN �202.4 GPa� after Ref. 49.
Mode
AlNa GaNb InNc
d� /dP�cm−1 /GPa�
d ln � /dP�GPa−1�
d� /dP�cm−1 /GPa�
d ln � /dP�GPa−1�
d� /dP�cm−1 /GPa�
d ln � /dP�GPa−1�
E2�low� 0.07�1� 0.0003�1� −0.30 −0.002
A1�TO� 4.35�3� 0.0070�1� 3.90 0.007 5.81 0.013
E1�TO� 5.33�4� 0.0080�1� 3.94 0.007
E2�high� 5.40�4� 0.0080�1� 4.20 0.007 5.56 0.011
A1�LO� 3.70�2� 0.0040�1� 4.40 0.006
E1�LO� 4.77�3� 0.0050�1� 5.96 0.010
aThis work.bReference 14.cReference 44.
FIG. 7. Calculated relative pressure dependence of the R�1�
�filled squares� and R�2� �empty squares� bond lengths in w-AlN.The pressure dependence of the cubic root of the relative volume ofthe unit cell in AlN is also depicted �dashed line� as obtained fromRef. 5. The relative pressure dependence of both bond lengths inGaN �solid line� and InN �dashed-dotted line� calculated from theknown experimental values of the c /a ratio at different pressures�Refs. 46 and 48� and assuming a constant u parameter with pres-sure in both compounds are also shown.
LATTICE DYNAMICS OF WURTZITE AND ROCKSALT AlN… PHYSICAL REVIEW B 77, 205204 �2008�
205204-7
light of the above reasoning, we suggest that the relativepressure coefficient of the A1�TO� modes in wurtzite semi-conductors is given by a phenomenological equation of thefollowing form:
d ln �TO�z�dP
= −1
2
d ln R�1�
dP, �2�
where we have introduced the notation �TO���, with �=x ,z referring to the frequencies of the E1�TO� and A1�TO�modes, respectively.
Similarly to the case of the A1�TO� mode, the larger pres-sure coefficient of the in-plane relative bond length R�2� thanthat of the axial bond length R�1� in w-AlN may be respon-sible for the larger pressure coefficients of the E1 modesrelative to those of the A1 modes in w-AlN. The correlationof the pressure coefficient of the E1 modes with that of thein-plane relative bond length R�2� is also coherent with thesimilar relative pressure coefficients for the E1�TO� andE2�high� modes in w-AlN and also in w-GaN. In fact, forboth these TO modes, the atomic displacements occur in theplane perpendicular to the c axis �see Fig. 1�. This also holdsfor the E2�low� mode, which, however, exhibits a completelydifferent behavior due to the bond-bending nature of thismode. Again, Table III evidences that the relative pressurecoefficients for the E1�TO� and E2�high� modes in AlN�0.008 GPa−1� and those in GaN �0.007 GPa−1� are similarand correlate with the pressure coefficients for the relativebond length R�2�, which are around −0.016�2� and −0.014�1�in AlN and GaN, respectively. Also in InN, the measuredrelative pressure coefficient for the E2�high� mode�0.011 GPa−1 �Ref. 44�� and for the bond length R�2�
�−0.022�1� GPa−1� obtained from Fig. 6 follow the same cor-relation. We anticipate that the pressure coefficient of theE1�TO� mode in InN should be similar to that for theE2�high� mode. As before, the relative pressure coefficient ofthe E1�TO� and E2�high� modes is −1 /2 times the relativepressure coefficient of the bond length R�2�. Consequently,the relative pressure coefficient of the E1�TO� and E2�high�modes in wurtzite semiconductors is given by the followingquantitative correlation:
d ln �TO�x�dP
=d ln �E2�high�
dP= −
1
2
d ln R�2�
dP. �3�
The validity of Eqs. �2� and �3� for the group III-nitridesand other wurtzite semiconductors is based on the fact thatmost of the optical modes are bond-stretching modes �seeFig. 1�. It is well known that the frequency of a bond-stretching mode is proportional to the square root of the bondspring constant and inversely proportional to the square rootof the reduced mass of the cation and the anion. Besides, thebond spring constant is given by the ratio of the bond forceand the bond distance. With these considerations, Eqs. �2�and �3� can be obtained by differentiation with respect to thepressure P if one considers that the pressure dependence ofthe bond force F is negligible, as seems to be the case inwurtzite semiconductors, and that only the bond distance de-pends on P. The argument used above for deriving Eqs. �2�and �3� is also valid for LO modes. However, the behavior of
the LO modes is more complicated due to the effects of themacroscopic polarization associated with them, as will bediscussed later on.
Equations �2� and �3� and Fig. 7 allow us to understandthe pressure dependence of the A1-E1 �TO� splitting in thethree nitrides. In GaN and InN, the equal pressure coeffi-cients for the relative axial and in-plane bond lengths R�1�
and R�2� explain the similar relative pressure coefficients forboth the A1�TO� and E1�TO� modes and, consequently, oftheir absolute pressure coefficients. In AlN, the larger pres-sure coefficient of the relative bond length R�2� compared toR�1� explains the larger relative and absolute pressure coeffi-cient of the E1�TO� compared to that of the A1�TO� mode.The A1-E1�LO� splitting increases in AlN also due to thelarger pressure coefficient of the E1�LO� compared to that ofthe A1�LO� mode. In fact, the smaller pressure coefficient ofthe A1 modes with respect to the E1 modes is a consequenceof the increase in the internal parameter u with increasingpressure, which is in good agreement with theoreticalcalculations.50,51
The fact that A1�TO� phonons in wurtzite AlN, GaN, andInN follow Eq. �2� allows us to explain the similar Grüneisenparameters, = �B0 /�0��d� /dP�, with B0 being the bulkmodulus, in the three nitrides �around 1.4 in GaN and AlNand around 1.6 in InN according to the data of this work andRefs. 14 and 44�. The reason for such similarity is that therelative bond lengths in the nitrides scale with the averagecompressibility �or with its inverse, which is the bulk modu-lus�; therefore, in the calculation of the Grüneisen parameter,the larger relative pressure coefficient of the TO modes inInN compared to those in AlN and GaN is counterweightedby its smaller bulk modulus, leading to a similar Grüneisenparameter in the three nitrides. In the same manner, Eq. �3�can explain the similar Grüneisen parameters of the E1�TO�and E2�high� modes in GaN and InN �around 1.4 �Refs. 14and 44��, and the considerably large Grüneisen parameter�1.66� for these two modes in AlN.
The similarity of the Grüneisen parameters for the A1�TO�modes in the three nitrides and the similarity of the Grü-neisen parameters for the E2�high� modes in GaN and InNjust described indicates a close relationship between the rela-tive pressure coefficients of the TO modes and the bulkmodulus. The Grüneisen parameter of the average TO modein nitrides can be described by the following relationship:
TO = B0d ln �TO
dP� t , �4�
with t=1.45�0.15 being a nondimensional constant, and�TO being the average TO frequency, �TO= ��TO�z�+3�TO�x�� /4, obtained after considering that there is onecation-anion bond along the c axis and three in the planeperpendicular to the c axis. The above expression can betransformed to approximately estimate the bulk modulus inthe following way:
1
B0�
1
t�1
4
d ln �TO�z�dP
+3
4
d ln �TO�x�dP
�= −
1
2t�1
4
d ln R�1�
dP+
3
4
d ln R�2�
dP� . �5�
By using Eq. �5� and the relative pressure coefficients of the
MANJÓN et al. PHYSICAL REVIEW B 77, 205204 �2008�
205204-8
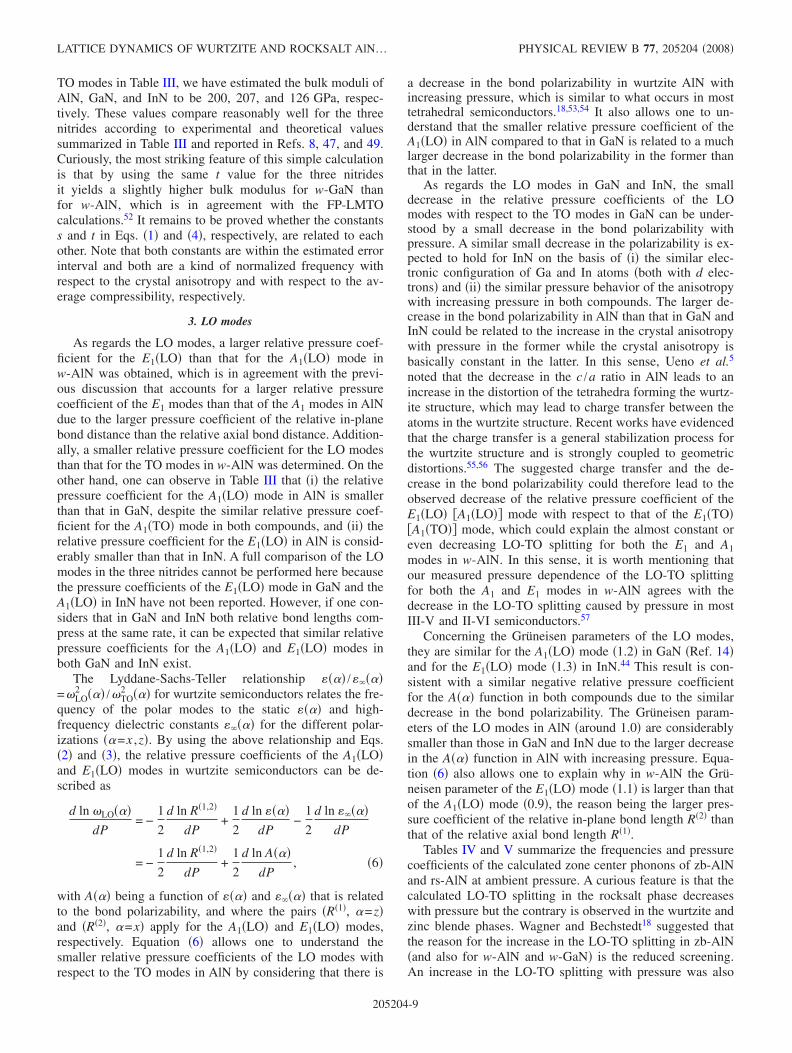
TO modes in Table III, we have estimated the bulk moduli ofAlN, GaN, and InN to be 200, 207, and 126 GPa, respec-tively. These values compare reasonably well for the threenitrides according to experimental and theoretical valuessummarized in Table III and reported in Refs. 8, 47, and 49.Curiously, the most striking feature of this simple calculationis that by using the same t value for the three nitridesit yields a slightly higher bulk modulus for w-GaN thanfor w-AlN, which is in agreement with the FP-LMTOcalculations.52 It remains to be proved whether the constantss and t in Eqs. �1� and �4�, respectively, are related to eachother. Note that both constants are within the estimated errorinterval and both are a kind of normalized frequency withrespect to the crystal anisotropy and with respect to the av-erage compressibility, respectively.
3. LO modes
As regards the LO modes, a larger relative pressure coef-ficient for the E1�LO� than that for the A1�LO� mode inw-AlN was obtained, which is in agreement with the previ-ous discussion that accounts for a larger relative pressurecoefficient of the E1 modes than that of the A1 modes in AlNdue to the larger pressure coefficient of the relative in-planebond distance than the relative axial bond distance. Addition-ally, a smaller relative pressure coefficient for the LO modesthan that for the TO modes in w-AlN was determined. On theother hand, one can observe in Table III that �i� the relativepressure coefficient for the A1�LO� mode in AlN is smallerthan that in GaN, despite the similar relative pressure coef-ficient for the A1�TO� mode in both compounds, and �ii� therelative pressure coefficient for the E1�LO� in AlN is consid-erably smaller than that in InN. A full comparison of the LOmodes in the three nitrides cannot be performed here becausethe pressure coefficients of the E1�LO� mode in GaN and theA1�LO� in InN have not been reported. However, if one con-siders that in GaN and InN both relative bond lengths com-press at the same rate, it can be expected that similar relativepressure coefficients for the A1�LO� and E1�LO� modes inboth GaN and InN exist.
The Lyddane-Sachs-Teller relationship ��� /����=�LO
2 ��� /�TO2 ��� for wurtzite semiconductors relates the fre-
quency of the polar modes to the static ��� and high-frequency dielectric constants ���� for the different polar-izations ��=x ,z�. By using the above relationship and Eqs.�2� and �3�, the relative pressure coefficients of the A1�LO�and E1�LO� modes in wurtzite semiconductors can be de-scribed as
d ln �LO���dP
= −1
2
d ln R�1,2�
dP+
1
2
d ln ���dP
−1
2
d ln ����dP
= −1
2
d ln R�1,2�
dP+
1
2
d ln A���dP
, �6�
with A��� being a function of ��� and ���� that is relatedto the bond polarizability, and where the pairs �R�1�, �=z�and �R�2�, �=x� apply for the A1�LO� and E1�LO� modes,respectively. Equation �6� allows one to understand thesmaller relative pressure coefficients of the LO modes withrespect to the TO modes in AlN by considering that there is
a decrease in the bond polarizability in wurtzite AlN withincreasing pressure, which is similar to what occurs in mosttetrahedral semiconductors.18,53,54 It also allows one to un-derstand that the smaller relative pressure coefficient of theA1�LO� in AlN compared to that in GaN is related to a muchlarger decrease in the bond polarizability in the former thanthat in the latter.
As regards the LO modes in GaN and InN, the smalldecrease in the relative pressure coefficients of the LOmodes with respect to the TO modes in GaN can be under-stood by a small decrease in the bond polarizability withpressure. A similar small decrease in the polarizability is ex-pected to hold for InN on the basis of �i� the similar elec-tronic configuration of Ga and In atoms �both with d elec-trons� and �ii� the similar pressure behavior of the anisotropywith increasing pressure in both compounds. The larger de-crease in the bond polarizability in AlN than that in GaN andInN could be related to the increase in the crystal anisotropywith pressure in the former while the crystal anisotropy isbasically constant in the latter. In this sense, Ueno et al.5
noted that the decrease in the c /a ratio in AlN leads to anincrease in the distortion of the tetrahedra forming the wurtz-ite structure, which may lead to charge transfer between theatoms in the wurtzite structure. Recent works have evidencedthat the charge transfer is a general stabilization process forthe wurtzite structure and is strongly coupled to geometricdistortions.55,56 The suggested charge transfer and the de-crease in the bond polarizability could therefore lead to theobserved decrease of the relative pressure coefficient of theE1�LO� �A1�LO�� mode with respect to that of the E1�TO��A1�TO�� mode, which could explain the almost constant oreven decreasing LO-TO splitting for both the E1 and A1modes in w-AlN. In this sense, it is worth mentioning thatour measured pressure dependence of the LO-TO splittingfor both the A1 and E1 modes in w-AlN agrees with thedecrease in the LO-TO splitting caused by pressure in mostIII-V and II-VI semiconductors.57
Concerning the Grüneisen parameters of the LO modes,they are similar for the A1�LO� mode �1.2� in GaN �Ref. 14�and for the E1�LO� mode �1.3� in InN.44 This result is con-sistent with a similar negative relative pressure coefficientfor the A��� function in both compounds due to the similardecrease in the bond polarizability. The Grüneisen param-eters of the LO modes in AlN �around 1.0� are considerablysmaller than those in GaN and InN due to the larger decreasein the A��� function in AlN with increasing pressure. Equa-tion �6� also allows one to explain why in w-AlN the Grü-neisen parameter of the E1�LO� mode �1.1� is larger than thatof the A1�LO� mode �0.9�, the reason being the larger pres-sure coefficient of the relative in-plane bond length R�2� thanthat of the relative axial bond length R�1�.
Tables IV and V summarize the frequencies and pressurecoefficients of the calculated zone center phonons of zb-AlNand rs-AlN at ambient pressure. A curious feature is that thecalculated LO-TO splitting in the rocksalt phase decreaseswith pressure but the contrary is observed in the wurtzite andzinc blende phases. Wagner and Bechstedt18 suggested thatthe reason for the increase in the LO-TO splitting in zb-AlN�and also for w-AlN and w-GaN� is the reduced screening.An increase in the LO-TO splitting with pressure was also
LATTICE DYNAMICS OF WURTZITE AND ROCKSALT AlN… PHYSICAL REVIEW B 77, 205204 �2008�
205204-9
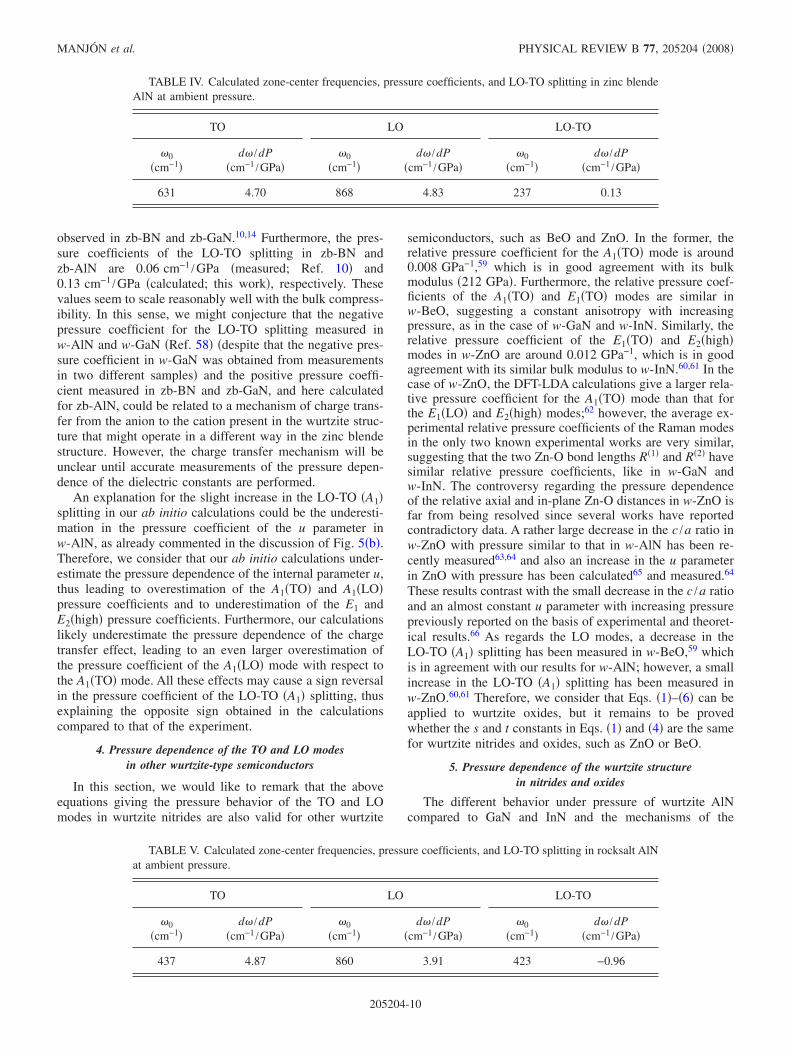
observed in zb-BN and zb-GaN.10,14 Furthermore, the pres-sure coefficients of the LO-TO splitting in zb-BN andzb-AlN are 0.06 cm−1 /GPa �measured; Ref. 10� and0.13 cm−1 /GPa �calculated; this work�, respectively. Thesevalues seem to scale reasonably well with the bulk compress-ibility. In this sense, we might conjecture that the negativepressure coefficient for the LO-TO splitting measured inw-AlN and w-GaN �Ref. 58� �despite that the negative pres-sure coefficient in w-GaN was obtained from measurementsin two different samples� and the positive pressure coeffi-cient measured in zb-BN and zb-GaN, and here calculatedfor zb-AlN, could be related to a mechanism of charge trans-fer from the anion to the cation present in the wurtzite struc-ture that might operate in a different way in the zinc blendestructure. However, the charge transfer mechanism will beunclear until accurate measurements of the pressure depen-dence of the dielectric constants are performed.
An explanation for the slight increase in the LO-TO �A1�splitting in our ab initio calculations could be the underesti-mation in the pressure coefficient of the u parameter inw-AlN, as already commented in the discussion of Fig. 5�b�.Therefore, we consider that our ab initio calculations under-estimate the pressure dependence of the internal parameter u,thus leading to overestimation of the A1�TO� and A1�LO�pressure coefficients and to underestimation of the E1 andE2�high� pressure coefficients. Furthermore, our calculationslikely underestimate the pressure dependence of the chargetransfer effect, leading to an even larger overestimation ofthe pressure coefficient of the A1�LO� mode with respect tothe A1�TO� mode. All these effects may cause a sign reversalin the pressure coefficient of the LO-TO �A1� splitting, thusexplaining the opposite sign obtained in the calculationscompared to that of the experiment.
4. Pressure dependence of the TO and LO modesin other wurtzite-type semiconductors
In this section, we would like to remark that the aboveequations giving the pressure behavior of the TO and LOmodes in wurtzite nitrides are also valid for other wurtzite
semiconductors, such as BeO and ZnO. In the former, therelative pressure coefficient for the A1�TO� mode is around0.008 GPa−1,59 which is in good agreement with its bulkmodulus �212 GPa�. Furthermore, the relative pressure coef-ficients of the A1�TO� and E1�TO� modes are similar inw-BeO, suggesting a constant anisotropy with increasingpressure, as in the case of w-GaN and w-InN. Similarly, therelative pressure coefficient of the E1�TO� and E2�high�modes in w-ZnO are around 0.012 GPa−1, which is in goodagreement with its similar bulk modulus to w-InN.60,61 In thecase of w-ZnO, the DFT-LDA calculations give a larger rela-tive pressure coefficient for the A1�TO� mode than that forthe E1�LO� and E2�high� modes;62 however, the average ex-perimental relative pressure coefficients of the Raman modesin the only two known experimental works are very similar,suggesting that the two Zn-O bond lengths R�1� and R�2� havesimilar relative pressure coefficients, like in w-GaN andw-InN. The controversy regarding the pressure dependenceof the relative axial and in-plane Zn-O distances in w-ZnO isfar from being resolved since several works have reportedcontradictory data. A rather large decrease in the c /a ratio inw-ZnO with pressure similar to that in w-AlN has been re-cently measured63,64 and also an increase in the u parameterin ZnO with pressure has been calculated65 and measured.64
These results contrast with the small decrease in the c /a ratioand an almost constant u parameter with increasing pressurepreviously reported on the basis of experimental and theoret-ical results.66 As regards the LO modes, a decrease in theLO-TO �A1� splitting has been measured in w-BeO,59 whichis in agreement with our results for w-AlN; however, a smallincrease in the LO-TO �A1� splitting has been measured inw-ZnO.60,61 Therefore, we consider that Eqs. �1�–�6� can beapplied to wurtzite oxides, but it remains to be provedwhether the s and t constants in Eqs. �1� and �4� are the samefor wurtzite nitrides and oxides, such as ZnO or BeO.
5. Pressure dependence of the wurtzite structurein nitrides and oxides
The different behavior under pressure of wurtzite AlNcompared to GaN and InN and the mechanisms of the
TABLE IV. Calculated zone-center frequencies, pressure coefficients, and LO-TO splitting in zinc blendeAlN at ambient pressure.
TO LO LO-TO
�0
�cm−1�d� /dP
�cm−1 /GPa��0
�cm−1�d� /dP
�cm−1 /GPa��0
�cm−1�d� /dP
�cm−1 /GPa�
631 4.70 868 4.83 237 0.13
TABLE V. Calculated zone-center frequencies, pressure coefficients, and LO-TO splitting in rocksalt AlNat ambient pressure.
TO LO LO-TO
�0
�cm−1�d� /dP
�cm−1 /GPa��0
�cm−1�d� /dP
�cm−1 /GPa��0
�cm−1�d� /dP
�cm−1 /GPa�
437 4.87 860 3.91 423 −0.96
MANJÓN et al. PHYSICAL REVIEW B 77, 205204 �2008�
205204-10
wurtzite-to-rocksalt pressure-induced phase transition are indebate today. Saitta and Decremps9 and Cai and Chen38 sug-gested that this phase transition goes through different pathsin the three nitrides. In AlN, the transition occurs through anintermediate hexagonal path; in GaN, it goes through an in-termediate tetragonal path; and in InN, there is a controversyregarding the final mechanism of the phase transition but,initially, it goes through a tetragonal path. Saitta andDecremps9 considered that the different paths in the threenitrides could be related to the lack of d levels in the Alcation and its presence in Ga and In; however, Cai andChen38 considered that the different paths can be explainedin terms of ionic radii of the cations. The different path forthe wurtzite-to-rocksalt phase transition in AlN with respectto those in GaN and InN is consistent with the crystallizationof BN in the hexagonal graphitelike phase at ambient condi-tions and indicates that AlN is a compound in the borderlinebetween the crystallization in the wurtzite or in graphitelikestructure. The tendency of AlN toward the hexagonal graphi-telike structure is confirmed by recent calculations inwurtzite-type binary semiconductors that have found that thehighest stable number of graphitelike layers previous to theirtransformation in the wurtzite structure correspond to AlN.55
In fact, the increase in the crystal anisotropy reflected in thedecrease in the c /a ratio and the increase in the internalparameter u with pressure is a signature of the hexagonalintermediate phase previous to the wurtzite-to-rocksalt phasetransition.9,38,67 With this picture in mind, we can understandmany of the strange properties observed in wurtzite AlNwhen compared to other nitrides. For instance, the small bulkmodulus of AlN compared to the extrapolated value that onewould obtain from the series InN-GaN-AlN is due to thesmall c11 and c33 elastic constants of AlN, which are similarto those of GaN.68 The values of these elastic constants in-dicating softness of AlN with respect to distortions along thewurtzite c axis are related to the c44 elastic constant thataffects the B1�low� mode, as suggested by Saitta andDecremps.9 In fact, our calculated pressure coefficient for theB1�low� mode in AlN is much smaller than the rest of theoptic modes at � with the exception of the E2�low�, which isin agreement with this picture. Similarly, the small wurtzite-to-rocksalt phase transition pressure in AlN, as compared tothat in GaN, might be related to the tendency of AlN towardthe graphitelike phase. On the other hand, wurtzite GaN hassoft c44 and c66 elastic constants;9 i.e., they show negativepressure coefficients due to the tendency toward a tetragonalphase on increasing pressure. The soft c66 elastic constant isresponsible for the negative pressure coefficient of theE2�low� mode9 in GaN, InN, and ZnO. This is not the casefor AlN, which shows a nearly zero but positive pressurecoefficient, in good agreement with the calculated pressurecoefficient of the c66 elastic constant.9 Wurtzite BeO alsoexhibits positive pressure coefficients for the E2�low�mode,59 and the same is expected for w-SiC, so the positivepressure coefficients for the E2�low� modes in AlN, BeO,and SiC could be related to the tendency of these semicon-ductors toward the intermediate hexagonal phase in thewurtzite-to-rocksalt transition in the absence of d cationlevels.9,69
C. High-pressure phase
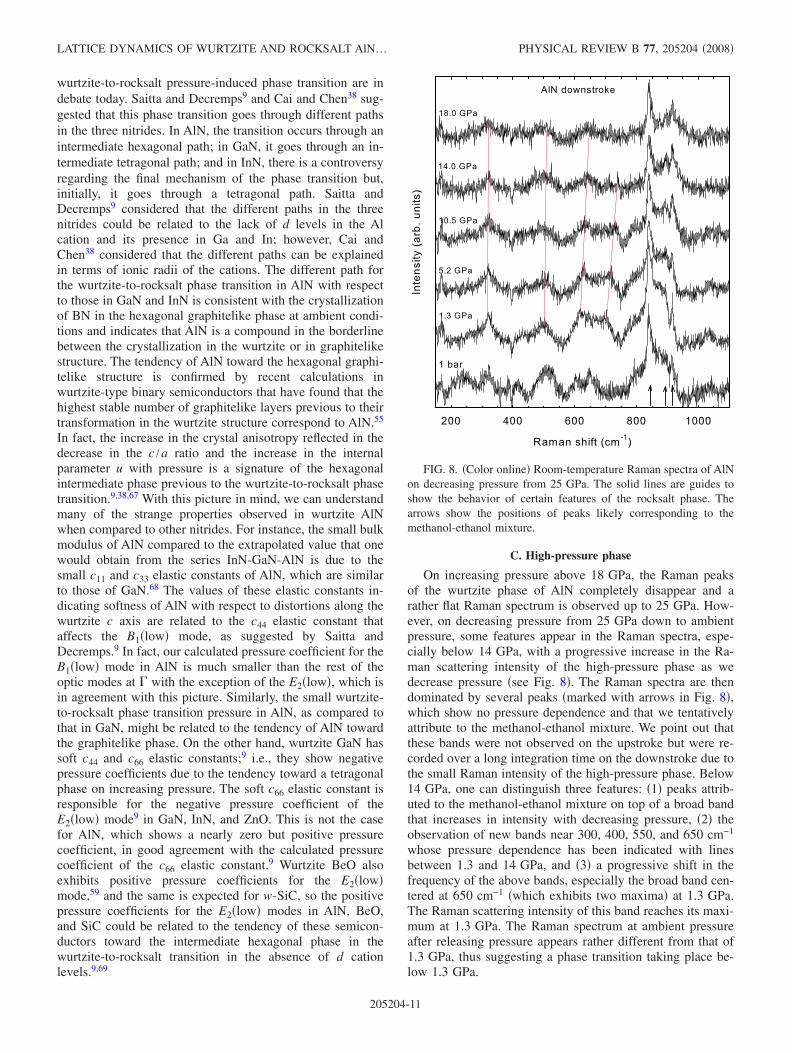
On increasing pressure above 18 GPa, the Raman peaksof the wurtzite phase of AlN completely disappear and arather flat Raman spectrum is observed up to 25 GPa. How-ever, on decreasing pressure from 25 GPa down to ambientpressure, some features appear in the Raman spectra, espe-cially below 14 GPa, with a progressive increase in the Ra-man scattering intensity of the high-pressure phase as wedecrease pressure �see Fig. 8�. The Raman spectra are thendominated by several peaks �marked with arrows in Fig. 8�,which show no pressure dependence and that we tentativelyattribute to the methanol-ethanol mixture. We point out thatthese bands were not observed on the upstroke but were re-corded over a long integration time on the downstroke due tothe small Raman intensity of the high-pressure phase. Below14 GPa, one can distinguish three features: �1� peaks attrib-uted to the methanol-ethanol mixture on top of a broad bandthat increases in intensity with decreasing pressure, �2� theobservation of new bands near 300, 400, 550, and 650 cm−1
whose pressure dependence has been indicated with linesbetween 1.3 and 14 GPa, and �3� a progressive shift in thefrequency of the above bands, especially the broad band cen-tered at 650 cm−1 �which exhibits two maxima� at 1.3 GPa.The Raman scattering intensity of this band reaches its maxi-mum at 1.3 GPa. The Raman spectrum at ambient pressureafter releasing pressure appears rather different from that of1.3 GPa, thus suggesting a phase transition taking place be-low 1.3 GPa.
FIG. 8. �Color online� Room-temperature Raman spectra of AlNon decreasing pressure from 25 GPa. The solid lines are guides toshow the behavior of certain features of the rocksalt phase. Thearrows show the positions of peaks likely corresponding to themethanol-ethanol mixture.
LATTICE DYNAMICS OF WURTZITE AND ROCKSALT AlN… PHYSICAL REVIEW B 77, 205204 �2008�
205204-11
First-order Raman scattering on the rocksalt structure issymmetry forbidden. Therefore, observation of a Ramanscattering signal in the rocksalt phase can be due to eithersecond-order scattering, reflecting the two-phonon density ofstates �2-PDOS�, which is not symmetry forbidden, or tofirst-order Raman scattering because of defects, reflecting theone-phonon density of states �1-PDOS� of the rocksalt phase.The 1-PDOS nature of the Raman spectra in rs-GaN �Ref.70� and rs-InN �Refs. 44, 71, and 72� after a pressure-induced transition has been already reported. First-order Ra-man scattering showing the 1-PDOS can be observed after apressure-induced transition due to defect-assisted Ramanscattering �DARS�; i.e., first-order Raman modes are ob-served because the selection rules are broken due to loss ofthe translational symmetry of the samples due to the excessof defects in the samples. This situation occurs after apressure-induced transformation with a great volume col-lapse, like the wurtzite-rocksalt transition ��V /V020% �,because of the nanometer size of the grains in the high-pressure phase.
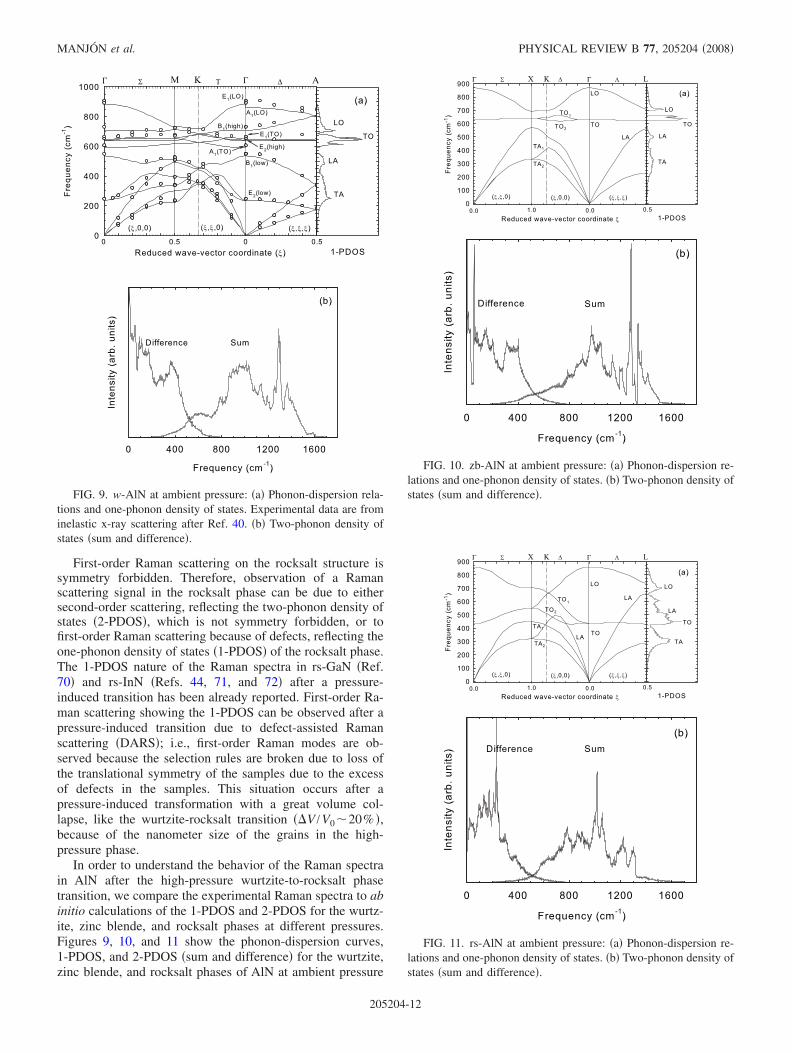
In order to understand the behavior of the Raman spectrain AlN after the high-pressure wurtzite-to-rocksalt phasetransition, we compare the experimental Raman spectra to abinitio calculations of the 1-PDOS and 2-PDOS for the wurtz-ite, zinc blende, and rocksalt phases at different pressures.Figures 9, 10, and 11 show the phonon-dispersion curves,1-PDOS, and 2-PDOS �sum and difference� for the wurtzite,zinc blende, and rocksalt phases of AlN at ambient pressure
FIG. 9. w-AlN at ambient pressure: �a� Phonon-dispersion rela-tions and one-phonon density of states. Experimental data are frominelastic x-ray scattering after Ref. 40. �b� Two-phonon density ofstates �sum and difference�.
FIG. 10. zb-AlN at ambient pressure: �a� Phonon-dispersion re-lations and one-phonon density of states. �b� Two-phonon density ofstates �sum and difference�.
FIG. 11. rs-AlN at ambient pressure: �a� Phonon-dispersion re-lations and one-phonon density of states. �b� Two-phonon density ofstates �sum and difference�.
MANJÓN et al. PHYSICAL REVIEW B 77, 205204 �2008�
205204-12
and T=0 K, respectively. The phonon-dispersion curves and1-PDOS of w-AlN are very similar to those previously re-ported in Refs. 15, 17, and 18, and our phonon-dispersioncurves closely follow the experimental data available fromRaman and inelastic x-ray scattering.20,40 Our phonon-dispersion curves and 1-PDOS for zb-AlN are also similar tothose reported by Karch and Bechstedt.17 Finally, as regardsour calculations for rs-AlN, they are similar to those recentlyreported;22 however, our calculations do not show the strangedispersion of the LO phonon branch along the �-X and �-Ldirections present in the previous calculations.22 The1-PDOS of the rocksalt phase will be discussed later on;however, the 2-PDOS �difference� of the rocksalt phase isshown in Fig. 11�b� and the most significant feature is anarrow and intense peak near 220 cm−1, which correspondsto the TO-TA�X� and LO-LA�X� modes near the X point ofthe BZ, which are located near 330 and 310 cm−1 in bothwurtzite and zinc blende phases, respectively �see Figs. 9 and10�b��. Some minor contributions near 300 and 400 cm−1
arise from the LO-TO�L� and LO-TO��� modes, respec-tively. Finally, contributions between 100 and 200 cm−1 aredue to TO-LA�X-K� modes. On the other hand, the moreextended 2-PDOS �sum� of the rocksalt phase also shown inFig. 11�b� has several contributions: 2TA�X-L� modes at theX and L points of the BZ near 600 cm−1; TA+TO�L� near700 cm−1; a prominent band around 760 cm−1 comes fromthe TA+TO��-K-X�; while the 2TO ��-K-X-L� modesmainly contribute to the band around 890 cm−1; the peaksbetween 1000 and 1100 cm−1 are due to LA+TO�X-L�and TA+LO�X� contributions; peaks between 1100 and1200 cm−1 come from the TO+LO�X-L�, while that of1230 cm−1 comes from LO+LA�X�. Finally, the band cen-tered around 1300 cm−1 is due to the TO+LO contributionnear the � point of the BZ.
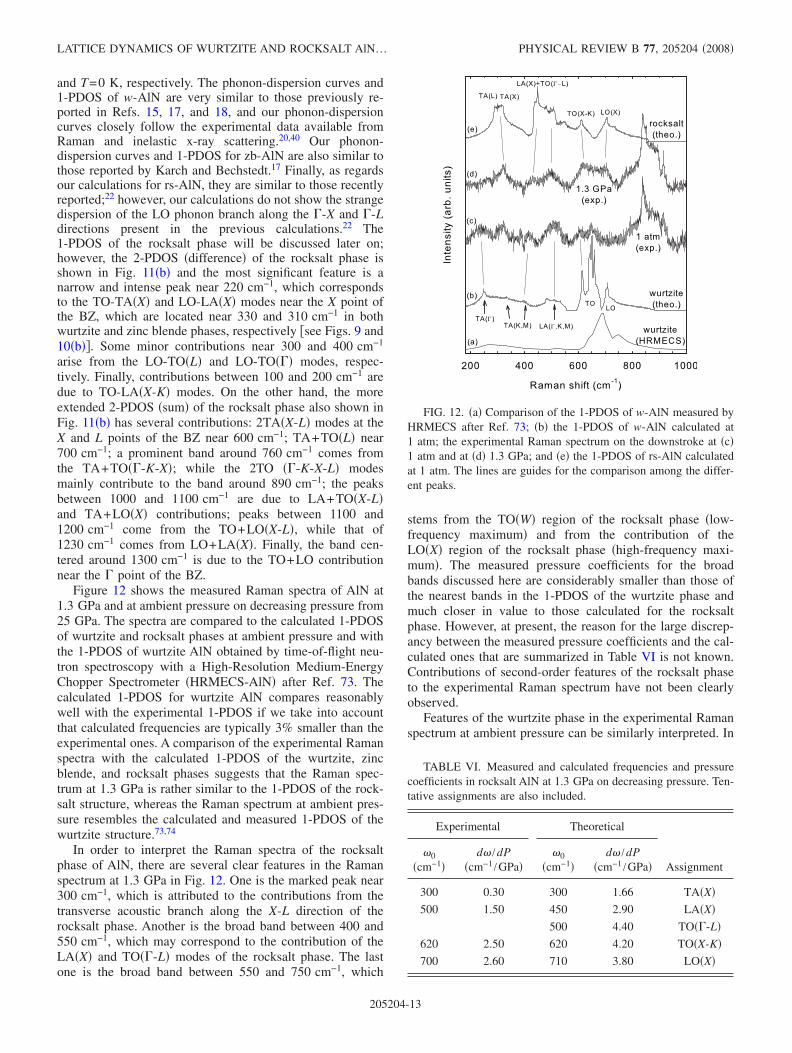
Figure 12 shows the measured Raman spectra of AlN at1.3 GPa and at ambient pressure on decreasing pressure from25 GPa. The spectra are compared to the calculated 1-PDOSof wurtzite and rocksalt phases at ambient pressure and withthe 1-PDOS of wurtzite AlN obtained by time-of-flight neu-tron spectroscopy with a High-Resolution Medium-EnergyChopper Spectrometer �HRMECS-AlN� after Ref. 73. Thecalculated 1-PDOS for wurtzite AlN compares reasonablywell with the experimental 1-PDOS if we take into accountthat calculated frequencies are typically 3% smaller than theexperimental ones. A comparison of the experimental Ramanspectra with the calculated 1-PDOS of the wurtzite, zincblende, and rocksalt phases suggests that the Raman spec-trum at 1.3 GPa is rather similar to the 1-PDOS of the rock-salt structure, whereas the Raman spectrum at ambient pres-sure resembles the calculated and measured 1-PDOS of thewurtzite structure.73,74
In order to interpret the Raman spectra of the rocksaltphase of AlN, there are several clear features in the Ramanspectrum at 1.3 GPa in Fig. 12. One is the marked peak near300 cm−1, which is attributed to the contributions from thetransverse acoustic branch along the X-L direction of therocksalt phase. Another is the broad band between 400 and550 cm−1, which may correspond to the contribution of theLA�X� and TO��-L� modes of the rocksalt phase. The lastone is the broad band between 550 and 750 cm−1, which
stems from the TO�W� region of the rocksalt phase �low-frequency maximum� and from the contribution of theLO�X� region of the rocksalt phase �high-frequency maxi-mum�. The measured pressure coefficients for the broadbands discussed here are considerably smaller than those ofthe nearest bands in the 1-PDOS of the wurtzite phase andmuch closer in value to those calculated for the rocksaltphase. However, at present, the reason for the large discrep-ancy between the measured pressure coefficients and the cal-culated ones that are summarized in Table VI is not known.Contributions of second-order features of the rocksalt phaseto the experimental Raman spectrum have not been clearlyobserved.
Features of the wurtzite phase in the experimental Ramanspectrum at ambient pressure can be similarly interpreted. In
FIG. 12. �a� Comparison of the 1-PDOS of w-AlN measured byHRMECS after Ref. 73; �b� the 1-PDOS of w-AlN calculated at1 atm; the experimental Raman spectrum on the downstroke at �c�1 atm and at �d� 1.3 GPa; and �e� the 1-PDOS of rs-AlN calculatedat 1 atm. The lines are guides for the comparison among the differ-ent peaks.
TABLE VI. Measured and calculated frequencies and pressurecoefficients in rocksalt AlN at 1.3 GPa on decreasing pressure. Ten-tative assignments are also included.
Experimental Theoretical
Assignment�0
�cm−1�d� /dP
�cm−1 /GPa��0
�cm−1�d� /dP
�cm−1 /GPa�
300 0.30 300 1.66 TA�X�500 1.50 450 2.90 LA�X�
500 4.40 TO��-L�620 2.50 620 4.20 TO�X-K�700 2.60 710 3.80 LO�X�
LATTICE DYNAMICS OF WURTZITE AND ROCKSALT AlN… PHYSICAL REVIEW B 77, 205204 �2008�
205204-13
this Raman spectrum, the broad bands around 250 and500 cm−1 correlate with the maxima of the 1-PDOS corre-sponding to the TA��� and the LA��-K-M� modes of thewurtzite phase. Finally, the two marked maxima of the bandthat extends from 550 to 700 cm−1 can be assigned to con-tributions of the TO branches since the contribution of theLO branches are considerably smaller. Therefore, we con-clude from the comparison between experimental and theo-retical data that the rocksalt phase in AlN is preserved downto 1.3 GPa on decreasing pressure and that there is a partialtransformation to the wurtzite phase below 1.3 GPa. Thisresult seems to contradict the previous experiments thatquenched the rocksalt phase after a high-pressure treat-ment;6,75 however, it agrees with the rocksalt-to-wurtzitebacktransformation found in InN.44 This backtransformationto the wurtzite phase in AlN can be understood if we con-sider that the full wurtzite-to-rocksalt phase transition is onlycompleted above 30 GPa �Ref. 4� and that we have onlyreached a pressure of 25 GPa in our experiments. Therefore,some microcrystals or nanocrystals of the wurtzite phasecould remain at 25 GPa, which leads to nucleation of thisphase on decreasing pressure. As regards the band near320 cm−1 in the spectrum at ambient pressure, it can comeeither from rests of the rocksalt phase or from the differenceTO-TA second-order mode of the wurtzite phase alreadypresent at ambient pressure. We can also note that the in-creasing contribution of the 1-PDOS of the rocksalt phase inAlN with decreasing pressure is in agreement with the back-transformation to the wurtzite phase. As pressure decreasesbelow 14 GPa, there is a gradual increase in the intensity ofthe Raman scattering due to DARS of the rocksalt phaselikely due to progressive transformation of the sample fromthe rocksalt to the wurtzite structure. Finally, we can mentionthat the wurtzite-to-rocksalt transition measured on the up-stroke at 18 GPa and on the downstroke below 1.3 GPa in-dicate that the middle of the hysteresis cycle is somewhatbelow 9.6 GPa. This value is in good agreement with thepressure of the coexistence of both phases �9.2 GPa� re-ported by Serrano et al.8
V. CONCLUSIONS
We have performed Raman scattering measurements inw-AlN at room temperature up to 25 GPa. The pressure de-pendence of the phonon frequencies of AlN in the wurtziteand high-pressure phases are reported and compared to abinitio lattice dynamical calculations performed for the wurtz-ite, zinc blende, and rocksalt phases. Our theoretical resultsusing DFT-GGA calculations show pressure coefficients forwurtzite-type modes that are in better agreement with experi-mental Raman data than previous calculations. We have mea-sured much larger pressure coefficients for the E1 andE2�high� modes in w-AlN than for the A1 modes. This resultis a consequence of the bond-stretching nature of the modesand of the different compressibilities of the two inequivalentAl-N bond distances in the wurtzite structure. We haveshown that the relative pressure coefficients of the TO modesin wurtzite materials scale with the relative compressibilityof their cation-anion distances. Furthermore, we consider
that the relatively small bulk modulus and phase transitionpressure as well as the counterintuitive positive pressure co-efficient of the E2�low� in w-AlN are consequences of thetendency of the wurtzite AlN structure toward the hexagonalgraphitelike structure of BN with increasing pressure previ-ous to the wurtzite-to-rocksalt phase transition. The tendencytoward the graphitelike structure in w-AlN is manifestedthrough a decrease in the c /a ratio and the increase in theinternal parameter u under compression. This tendency to-ward an intermediate hexagonal phase in w-AlN is contraryto that of other wurtzite semiconductors, such as GaN andInN, which tend to an intermediate tetragonal phase andshow a pressure-independent anisotropy and, consequently,similar relative pressure coefficients for the E1 and A1modes.
We have measured a negative pressure coefficient for theLO-TO splitting for both the A1 and E1 modes in w-AlN thatcuriously agrees with the average of the pressure coefficientsreported in the literature. The decrease in the LO-TO split-ting is attributed to a decrease in the ionicity of AlN undercompression. Our theoretical results for the LO-TO splittingsdo not agree with the experimental data but the deviation iswithin errors in the case of the LO-TO �E1� splitting. Thediscrepancies may be related to the underestimation of thepressure coefficient of the internal parameter u in the calcu-lations and deviations regarding the pressure dependence ofthe charge transfer. Curiously enough, the calculations pre-dict an increase in the LO-TO splitting in zb-AlN, which isin agreement with the predictions for other nitrides. It re-mains to be proved whether the increase or decrease in theLO-TO splitting with increasing pressure in nitrides andother semiconductors with anions of the first row �C, N, andO� is related to the different behaviors of the bonds underpressure in the zinc blende and wurtzite structures.
Finally, we have observed a weak Raman scattering ap-pearing below 14 GPa on decreasing pressure from 25 GPaand lasting down to 1.3 GPa. Such Raman scattering hasbeen attributed to the one-phonon density of states of therocksalt phase. Below 1.3 GPa, there is a partial return to adisordered wurtzite phase likely due to its nucleation fromwurtzite microcrystals still present at 25 GPa due to the in-complete wurtzite-to-rocksalt phase transition.
ACKNOWLEDGMENTS
This work was supported by the Spanish MCYT �ProjectsNo. MAT2006-02279, No. MAT2007-65990-C03-01, andNo. MAT2007-60087�, by Generalitat Valenciana �ProjectsNo. GV06/358 and No. ACOMP06/81�, and by Generalitatde Catalunya �Grants No. 2005SGR00535 and No.2005SGR201�. The authors thank J. H. Edgar �Kansas StateUniversity� for supplying the AlN samples, A. Cantarero forproviding access to the experimental Raman setup, and A.Segura for critical reading of the manuscript. D.E. acknowl-edges the financial support from the MEC of Spain throughthe “Ramón y Cajal” program. A.H.R. is supported byProject No. J-59853-F from CONACYT-Mexico. We wouldalso like to thank the Centro Nacional de Spercomputo atIPICyT, Mexico for allocation of computer time.
MANJÓN et al. PHYSICAL REVIEW B 77, 205204 �2008�
205204-14
*Corresponding author; [email protected] J. Li, Z. Y. Fan, R. Dahal, M. L. Nakarmi, J. Y. Lin, and H. X.
Jiang, Appl. Phys. Lett. 89, 213510 �2006�.2 Z. Wang, K. Tait, Y. Zhao, D. Schiferl, C. Zha, H. Uchida, and R.
Downs, J. Phys. Chem. B 108, 11506 �2004�.3 P. S. Branicio, R. K. Kalia, A. Nakano, and P. Vashishta, Phys.
Rev. Lett. 96, 065502 �2006�.4 L. H. Shen, X. F. Li, Y. M. Ma, K. F. Yang, W. W. Lei, Q. L. Lui,
and G. T. Zou, Appl. Phys. Lett. 89, 141903 �2006�.5 M. Ueno, A. Onodera, O. Shimomura, and K. Takemura, Phys.
Rev. B 45, 10123 �1992�.6 Q. Xia, H. Xia, and A. L. Ruoff, J. Appl. Phys. 73, 8198 �1993�.7 S. Uehara, T. Masamoto, A. Onodera, M. Ueno, O. Shinomura,
and K. Takemura, J. Phys. Chem. Solids 58, 2093 �1997�.8 J. Serrano, A. Rubio, E. Hernández, A. Muñoz, and A. Mujica,
Phys. Rev. B 62, 16612 �2000�.9 A. M. Saitta and F. Decremps, Phys. Rev. B 70, 035214 �2004�.
10 J. A. Sanjurjo, E. López-Cruz, P. Vogl, and M. Cardona, Phys.Rev. B 28, 4579 �1983�.
11 P. Perlin, A. Polian, and T. Suski, Phys. Rev. B 47, 2874 �1993�.12 M. Kuball, J. M. Hayes, A. D. Prins, N. W. A. van Uden, D. J.
Dunstan, Y. Shi, and J. H. Edgar, Appl. Phys. Lett. 78, 724�2001�.
13 M. Kuball, J. M. Hayes, Y. Shi, J. H. Edgar, A. D. Prins, N. W.A. van Uden, and D. J. Dunstan, J. Cryst. Growth 231, 391�2001�.
14 A. R. Goñi, H. Siegle, K. Syassen, C. Thomsen, and J.-M. Wag-ner, Phys. Rev. B 64, 035205 �2001�.
15 E. V. Yakovenko, M. Gauthier, and A. Polian, JETP 98, 981�2004�.
16 I. Gorczyca, N. E. Christensen, E. L. Peltzer y Blancá, and C. O.Rodríguez, Phys. Rev. B 51, 11936 �1995�.
17 K. Karch and F. Bechstedt, Phys. Rev. B 56, 7404 �1997�.18 J.-M. Wagner and F. Bechstedt, Phys. Rev. B 62, 4526 �2000�.19 J.-M. Wagner and F. Bechstedt, Phys. Status Solidi B 235, 464
�2003�.20 M. Schwoerer-Böhning, A. T. Macrander, M. Pabst, and P.
Pavone, Phys. Status Solidi B 215, 177 �1999�.21 C. Bungaro, K. Rapcewicz, and J. Bernholc, Phys. Rev. B 61,
6720 �2000�.22 A. Siegel, K. Parlinski, and U. D. Wdowik, Phys. Rev. B 74,
104116 �2006�.23 F. J. Manjón, D. Errandonea, N. Garro, A. H. Romero, J. Ser-
rano, and M. Kuball, Phys. Status Solidi B 244, 42 �2007�.24 G. J. Piermarini, S. Block, and J. D. Barnett, J. Appl. Phys. 44,
5377 �1973�.25 G. J. Piermarini, S. Block, J. D. Barnett, and R. A. Forman, J.
Appl. Phys. 46, 2774 �1975�.26 X. Gonze, J.-M. Beuken, R. Caracas, F. Detraux, M. Fuchs,
G.-M. Rignanese, L. Sindic, M. Verstraete, G. Zerah, F. Jollet,M. Torrent, A. Roy, M. Mikami, Ph. Ghosez, J.-Y. Raty, and D.C. Allan, Comput. Mater. Sci. 25, 478 �2002�.
27 X. Gonze, G.-M. Rignanese, M. Verstraete, J.-M. Beuken, Y.Pouillon, R. Caracas, F. Jollet, M. Torrent, G. Zerah, M. Mi-kami, P. Ghosez, M. Veithen, J. Y. Raty, V. Olevano, F.Bruneval, L. Reining, R. Godby, G. Onida, D. R. Hamann, andD. C. Allan, Z. Kristallogr. 220, 558 �2005�.
28 The ABINIT code is a common project of the UniversitéCatholique de Louvain, Corning Incorporated, and other con-tributors �http://www.abinit.org�.
29 J. P. Perdew, K. Burke, and M. Ernzerhof, Phys. Rev. Lett. 77,3865 �1996�.
30 http://opium.sourceforge.net/31 A. M. Rappe, K. M. Rabe, E. Kaxiras, and J. D. Joannopoulos,
Phys. Rev. B 41, 1227 �1990�.32 H. J. Monkhorst and J. D. Pack, Phys. Rev. B 13, 5188 �1976�.33 X. Gonze, Phys. Rev. B 55, 10337 �1997�.34 X. Gonze and C. Lee, Phys. Rev. B 55, 10355 �1997�.35 S. Baroni, P. Giannozzi, and A. Testa, Phys. Rev. Lett. 58, 1861
�1987�.36 C. C. Silva, H. W. Leite Alves, L. M. R. Scolfaro, and J. R. Leite,
Phys. Status Solidi C 2, 2468 �2005�.37 A. Muñoz and K. Kunc, Phys. Rev. B 44, 10372 �1991�.38 J. Cai and N. Chen, Phys. Rev. B 75, 134109 �2007�.39 D. Errandonea, Y. Meng, M. Somayazulu, and D. Hausermann,
Physica B 355, 116 �2005�.40 M. Schwoerer-Böhning and A. T. Macrander, J. Phys. Chem.
Solids 61, 485 �2000�.41 A. Zoroddu, F. Bernardini, P. Ruggerone, and V. Fiorentini,
Phys. Rev. B 64, 045208 �2001�.42 V. Yu. Davydov, I. N. Goncharuk, A. N. Smirnov, A. E. Ni-
kolaev, W. V. Lundin, A. S. Usikov, A. A. Klochikhin, J. Ader-hold, J. Graul, O. Semchinova, and H. Harima, Phys. Rev. B 65,125203 �2002�.
43 P. Lawaetz, Phys. Rev. B 5, 4039 �1972�.44 C. Pinquier, F. Demangeot, J. Frandon, J.-C. Chervin, A. Polian,
B. Couzinet, P. Munsch, O. Briot, S. Ruffenach, B. Gil, and B.Maleyre, Phys. Rev. B 73, 115211 �2006�.
45 Z. G. Qian, W. Z. Shen, H. Ogawa, and Q. X. Guo, J. Phys.:Condens. Matter 16, R381 �2004�.
46 V. Yu. Davydov, V. V. Emtsev, I. N. Goncharuk, A. N. Smirnov,V. D. Petrikov, V. V. Mamutin, V. A. Vekshin, S. V. Ivanov, M.B. Smirnov, and T. Inushima, Appl. Phys. Lett. 75, 3297 �1999�;V. Yu. Davydov, A. A. Klochikin, M. B. Smirnov, V. V. Emtsev,V. D. Petrikov, I. A. Abroyan, A. I. Titov, I. N. Goncharuk, A. N.Smirnov, V. V. Mamutin, S. V. Ivanov, and T. Inushima, Phys.Status Solidi B 216, 779 �1999�.
47 M. Ueno, M. Yoshida, A. Onodera, O. Shimomura, and K. Take-mura, Phys. Rev. B 49, 14 �1994�.
48 N. E. Christensen and I. Gorczyca, Phys. Rev. B 47, 4307�1993�.
49 T. Tsuchiya, K. Kawamura, O. Ohtaka, H. Fukui, and T.Kikegawa, Solid State Commun. 121, 555 �2002�.
50 J.-M. Wagner and F. Bechstedt, Phys. Status Solidi B 216, 793�1999�.
51 H. M. Tütüncü and G. P. Srivastava, Phys. Rev. B 62, 5028�2000�.
52 K. Kim, W. R. L. Lambrecht, and B. Segall, Phys. Rev. B 53,16310 �1996�.
53 T. Sengstag, N. Binggeli, and A. Baldereschi, Phys. Rev. B 52,R8613 �1995�.
54 S. Q. Wang and H. Q. Ye, J. Phys.: Condens. Matter 17, 4475�2005�, and references therein.
55 A. Wander, F. Schedin, P. Steadman, A. Norris, R. McGrath, T.S. Turner, G. Thornton, and N. M. Harrison, Phys. Rev. Lett. 86,3811 �2001�.
56 C. L. Freeman, F. Claeyssens, N. L. Allan, and J. H. Harding,Phys. Rev. Lett. 96, 066102 �2006�.
57 M. D. Frogley, D. J. Dunstan, and W. Palos, Solid State Com-mun. 107, 537 �1998�.
LATTICE DYNAMICS OF WURTZITE AND ROCKSALT AlN… PHYSICAL REVIEW B 77, 205204 �2008�
205204-15
58 P. Perlin, T. Suski, J. W. Ager, G. Conti, A. Polian, N. E. Chris-tensen, I. Gorczyca, I. Grzegory, E. R. Weber, and E. Haller,Phys. Rev. B 60, 1480 �1999�.
59 A. P. Jephcoat, R. J. Hemley, H. K. Mao, R. E. Cohen, and M. J.Mehl, Phys. Rev. B 37, 4727 �1988�.
60 F. J. Manjón, K. Syassen, and R. Lauck, High Press. Res. 22,299 �2002�.
61 F. Decremps, J. Pellicer-Porres, A. M. Saitta, J. C. Chervin, andA. Polian, Phys. Rev. B 65, 092101 �2002�.
62 J. Serrano, A. H. Romero, F. J. Manjón, R. Lauck, M. Cardona,and A. Rubio, Phys. Rev. B 69, 094306 �2004�.
63 H. Sowa and H. Ahsbahs, J. Appl. Crystallogr. 39, 169 �2006�.64 H. Liu, Y. Ding, M. Somayazulu, J. Qian, J. Shu, D. Häuser-
mann, and H. K. Mao, Phys. Rev. B 71, 212103 �2005�.65 J. E. Jaffe and A. C. Hess, Phys. Rev. B 48, 7903 �1993�.66 F. Decremps, F. Datchi, A. M. Saitta, A. Polian, S. Pascarelli, A.
Di Cicco, J. P. Itié, and F. Baudelet, Phys. Rev. B 68, 104101�2003�.
67 S. Limpijumnong and W. R. L. Lambrecht, Phys. Rev. Lett. 86,91 �2001�; Phys. Rev. B 63, 104103 �2001�.
68 D. K. Pandey, D. Singh, and R. P. Yadav, Appl. Acoust. 68, 766�2007�.
69 M. Durandurdu, Phys. Rev. B 75, 235204 �2007�.70 M. P. Halsall, P. Harmer, P. J. Parbrook, and S. J. Henley, Phys.
Rev. B 69, 235207 �2004�.71 C. Pinquier, F. Demangeot, J. Frandon, J. W. Pomeroy, M.
Kuball, H. Hubel, N. W. A. van Uden, D. J. Dunstan, O. Briot,B. Maleyre, S. Ruffenach, and B. Gil, Phys. Rev. B 70, 113202�2004�.
72 C. Pinquier, F. Demangeot, J. Frandon, O. Briot, B. Maleyre, S.Ruffenach, B. Gil, J. W. Pomeroy, M. Kuball, H. Hubel, N. W.A. van Uden, and D. J. Dunstan, Superlattices Microstruct. 36,581 �2004�.
73 J. C. Nipko and C.-K. Loong, Phys. Rev. B 57, 10550 �1998�.74 V. Yu. Davydov, Yu. E. Kitaev, I. N. Goncharuk, A. N. Smirnov,
J. Graul, O. Semchinova, D. Uffmann, M. B. Smirnov, A. P.Mirgorodsky, and R. A. Evarestov, Phys. Rev. B 58, 12899�1998�.
75 H. Vollstädt, E. Ito, M. Akaishi, S. Akimoto, and O. Fukunaga,Proc. Jpn. Acad., Ser. B: Phys. Biol. Sci. 66, 7 �1990�.
MANJÓN et al. PHYSICAL REVIEW B 77, 205204 �2008�
205204-16