Embed Size (px)
Citation preview
670
Latitudinal variation in clutch size–lay date regressions in Tachycineta swallows: effects of food supply or demography?
David W. Winkler, Kevin M. Ringelman, Peter O. Dunn, Linda Whittingham, David J. T. Hussell, Robert G. Clark, Russell D. Dawson, L. Scott Johnson, Alexandra Rose, Suzanne H. Austin, W. Douglas Robinson, Michael P. Lombardo, Patrick A. Thorpe, Dave Shutler, Raleigh J. Robertson, Maria Stager, Marty Leonard, Andrew G. Horn, Janis Dickinson, Valentina Ferretti, Viviana Massoni, Florencia Bulit, Juan C. Reboreda, Marcela Liljesthröm, Martín Quiroga, Eldar Rakhimberdiev and Daniel R. Ardia
D. W. Winkler ([email protected]), Dept of Ecology and Evolutionary Biology and Laboratory of Ornithology, Cornell Univ., Ithaca, NY 14853, USA. – K. M. Ringelman, Dept of Ecology and Evolutionary Biology, Cornell Univ., Ithaca, NY 14853, USA, present address: Dept of Entomology and Wildlife Ecology, Univ. of Delaware, Newark, DE 19716, USA. – P. O. Dunn, Dept of Biological Sciences, Univ. of Wisconsin-Milwaukee, Milwaukee, WI 53201, USA. – L. Whittingham, Dept of Biological Sciences, Univ. of Wisconsin-Milwaukee, Milwaukee, WI, USA. – D. J. T. Hussell, Ontario Ministry of Natural Resources, 2140 East Bank Drive, Peterborough, ON K9J 7B8, Canada. – R. G. Clark, Environment Canada, 115 Perimeter Road, Saskatoon, SK S7N OX4, Canada. – R. D. Dawson, Ecosystem Science and Management Program, Univ. of Northern British Columbia, University Way, Prince George, BC V2N 4Z9, Canada. – L. S. Johnson, Dept of Biological Sciences, Towson Univ., Towson, MD 21252, USA. – A. Rose, Univ. of Colorado Museum of Natural History, Boulder, CO 80309, USA. – S. H. Austin, Dept of Fisheries and Wildlife, Oregon State Univ., 104 Nash Hall, Corvallis, OR 97331, USA. – W. D. Robinson, Dept of Fisheries and Wildlife, Oregon State Univ., 104 Nash Hall, Corvallis, OR 97331, USA. – M. P. Lombardo, Dept of Biology, Grand Valley State Univ., Allendale, MI 49401, USA. – P. A. Thorpe, Dept of Biology, Grand Valley State Univ., Allendale, MI 49401, USA. – D. Shutler, Dept of Biology, Acadia Univ., Wolfville, NS B4P 2R6, Canada. – R. J. Robertson, Dept of Biology, Queen’s Univ., Kingston, ON K7L 3N6, Canada. – M. Stager, Dept of Ecology and Evolutionary Biology, Cornell Univ., Ithaca, NY 14853, USA, present address: Dept of Animal Biology, Univ. of illinois, Urbana-Champaign, IL 61820, USA. – M. Leonard, Dept of Biology, Dalhousie Univ., Halifax, NS B3H 4R2, Canada. – A. G. Horn, Dept of Biology, Dalhousie Univ., Halifax, NS B3H 4R2, Canada. – J. Dickinson, Cornell Laboratory of Ornithology, 159 Sapsucker Woods Road, Ithaca, NY 14850, USA. – V. Ferretti, Dept of Ecology and Evolutionary Biology, Cornell Univ., Ithaca, NY 14853, USA, and Fuller Evolutionary Biology Program, Cornell Lab of Ornithology, Ithaca, NY 14850, USA, present address: División Ornitología, Museo Argentino de Ciencias Naturales ‘Bernardino Rivadavia’, Av. Ángel Gallardo 470, Buenos Aires, C 1405 DJR, Argentina. – V. Massoni, Depto de Ecología, Genética y Evolución, Facultad de Ciencias Exactas y Naturales, Univ. de Buenos Aires, Intendente Güiraldes 2160, Buenos Aires, C 1428 EHA, Argentina. – F. Bulit, Depto de Ecología, Genética y Evolución, Facultad de Ciencias Exactas y Naturales, Univ. de Buenos Aires, Intendente Güiraldes 2160, Buenos Aires, C 1428 EHA, Argentina. – J. C. Reboreda, Depto de Ecología, Genética y Evolución, Facultad de Ciencias Exactas y Naturales, Univ. de Buenos Aires, Intendente Güiraldes 2160, Buenos Aires, C 1428 EHA, Argentina. – M. Liljesthröm, Depto de Ecología y Evolución, Facultad de Ciencias Exactas y Naturales, Univ. de Buenos Aires, Pabellón II, Ciudad Universitaria, Buenos Aires, C 1428 EHA, Argentina, present address: Centro Austral de Investigaciones Científicas, CADIC-CONICET, Bernardo Houssay 200, Ushuaia, Tierra del Fuego, V 9410 BFD, Argentina. – M. Quiroga, Aquatic Birds Lab, INALI-CONICET-UNL/UADER, Santa Fé, SF 3000, Argentina. – E. Rakhimberdiev, Dept of Ecology and Evolutionary Biology, Cornell Univ., Ithaca, NY 14853, USA, and Dept of Marine Ecology, Royal Netherlands Inst. for Sea Research (NIOZ), PO Box 59, NL-1790 AB, Den Burg, Texel, the Netherlands, and Dept of Vertebrate Zoology, Biological Faculty, Lomonosov Moscow State Univ., RU-119991, Moscow, Russia. – D. R. Ardia, Dept of Biology, Franklin and Marshall College, Lancaster, PA 17604, USA.
In a study of almost 16 000 nest records from seven swallow species across the entire Western Hemisphere, clutch sizes decline with relative laying date in each population, but the slope of this decline grows steeper with increasing distance from the equator. Late-laying birds at all latitudes lay clutches of similar sizes, suggesting that latitudinal differences may be driven primarily by earlier-laying birds. Focused comparisons of site-years in North America with qualitatively different food availability indicate that food supply significantly affects mean clutch size but not the clutch size–lay date regression. Other studies on the seasonality of swallow food also indicate that steeper clutch size–lay date declines in the North are not caused by steeper earlier food peaks there. The distribution of lay dates grows increasingly right-skewed with increasing latitude. This variation in lay-date distributions could be due to the predominance of higher quality, early-laying (and large-clutched) individuals among populations at higher latitudes, resulting from latitudinal variation in mortality rates and the intensity of sexual selection. Our results underscore the importance of studying clutch size and lay date in tandem and suggest new research into the causes of their joint geographic variation.
Ecography 37: 670–678, 2014 doi: 10.1111/j.1600-0587.2013.00458.x
© 2014 The Authors. Ecography © 2014 Nordic Society Oikos Subject Editor: Carsten Rahbek. Accepted 1 November 2013
671
Natural selection acts rigorously to shape phenotypic traits closely associated with survival and reproduction. These life history traits may be especially sensitive to selection under changing environmental conditions that directly affect population demographics. Despite the central importance of life history trade-offs in evolutionary ecology (Stearns 1989), there has been little research on the potential tempo-ral and spatial variability in these trade-offs (Ardia 2005). For many bird species, the only life history trait that is frequently quantified with certainty is clutch size – the number of eggs laid in a single nesting attempt. Clutch size is thus the most studied avian life history trait (Ricklefs 1980, Murray and Nolan 1989, Cooper et al. 2005), and latitudinal variation in avian clutch size is one of the most thoroughly documented examples of geographic life history variation in any organism (Lack and Moreau 1965, Dunn et al. 2000, Martin et al. 2000). Birds breeding nearer the Equator tend to lay smaller clutches than their conspecifics or congeners breeding at higher latitudes, yet convincing general explanations for this broad geographic pattern remain elusive. By contrast, latitudinal variation in distributions of lay date (the date on which the first egg of a clutch is laid) is not well documented, but it appears that timing of breeding is more tied to local environmental con-ditions (Dunn and Winkler 1999, Hussell 2003). Efforts to understand clutch size or lay date variation individually are complicated by the fact that clutch size is negatively cor-related with lay date in many single-brooded bird species (Daan et al. 1990, Winkler and Allen 1996, Christians et al. 2001). This correlation creates an interesting and generative tension: how might the inherent relationship between clutch size and lay date itself affect geographic variation in average clutch size?
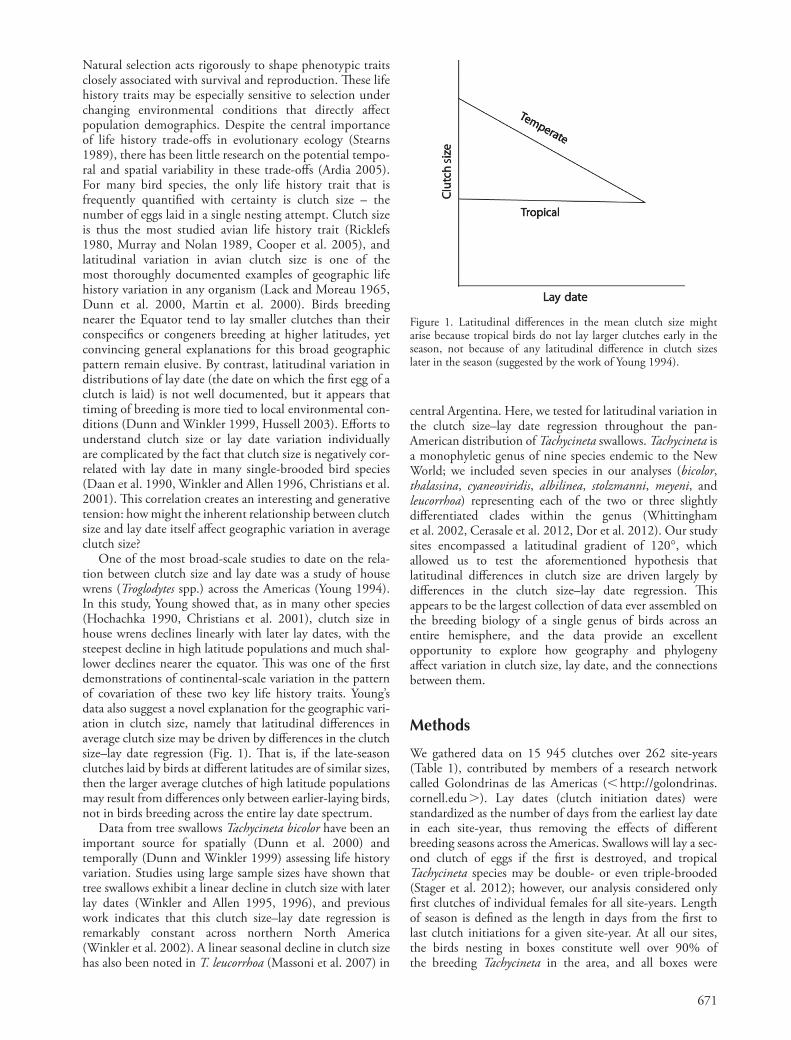
One of the most broad-scale studies to date on the rela-tion between clutch size and lay date was a study of house wrens (Troglodytes spp.) across the Americas (Young 1994). In this study, Young showed that, as in many other species (Hochachka 1990, Christians et al. 2001), clutch size in house wrens declines linearly with later lay dates, with the steepest decline in high latitude populations and much shal-lower declines nearer the equator. This was one of the first demonstrations of continental-scale variation in the pattern of covariation of these two key life history traits. Young’s data also suggest a novel explanation for the geographic vari-ation in clutch size, namely that latitudinal differences in average clutch size may be driven by differences in the clutch size–lay date regression (Fig. 1). That is, if the late-season clutches laid by birds at different latitudes are of similar sizes, then the larger average clutches of high latitude populations may result from differences only between earlier-laying birds, not in birds breeding across the entire lay date spectrum.
Data from tree swallows Tachycineta bicolor have been an important source for spatially (Dunn et al. 2000) and temporally (Dunn and Winkler 1999) assessing life history variation. Studies using large sample sizes have shown that tree swallows exhibit a linear decline in clutch size with later lay dates (Winkler and Allen 1995, 1996), and previous work indicates that this clutch size–lay date regression is remarkably constant across northern North America (Winkler et al. 2002). A linear seasonal decline in clutch size has also been noted in T. leucorrhoa (Massoni et al. 2007) in
central Argentina. Here, we tested for latitudinal variation in the clutch size–lay date regression throughout the pan-American distribution of Tachycineta swallows. Tachycineta is a monophyletic genus of nine species endemic to the New World; we included seven species in our analyses (bicolor, thalassina, cyaneoviridis, albilinea, stolzmanni, meyeni, and leucorrhoa) representing each of the two or three slightly differentiated clades within the genus (Whittingham et al. 2002, Cerasale et al. 2012, Dor et al. 2012). Our study sites encompassed a latitudinal gradient of 120°, which allowed us to test the aforementioned hypothesis that latitudinal differences in clutch size are driven largely by differences in the clutch size–lay date regression. This appears to be the largest collection of data ever assembled on the breeding biology of a single genus of birds across an entire hemisphere, and the data provide an excellent opportunity to explore how geography and phylogeny affect variation in clutch size, lay date, and the connections between them.
Methods
We gathered data on 15 945 clutches over 262 site-years (Table 1), contributed by members of a research network called Golondrinas de las Americas ( http://golondrinas.cornell.edu ). Lay dates (clutch initiation dates) were standardized as the number of days from the earliest lay date in each site-year, thus removing the effects of different breeding seasons across the Americas. Swallows will lay a sec-ond clutch of eggs if the first is destroyed, and tropical Tachycineta species may be double- or even triple-brooded (Stager et al. 2012); however, our analysis considered only first clutches of individual females for all site-years. Length of season is defined as the length in days from the first to last clutch initiations for a given site-year. At all our sites, the birds nesting in boxes constitute well over 90% of the breeding Tachycineta in the area, and all boxes were
Figure 1. Latitudinal differences in the mean clutch size might arise because tropical birds do not lay larger clutches early in the season, not because of any latitudinal difference in clutch sizes later in the season (suggested by the work of Young 1994).
672
Tabl
e 1.
Stu
dy s
ites
and
thei
r re
spec
tive
prop
ertie
s, a
rran
ged
alph
abet
ical
ly b
y si
te c
ode.
Site
ele
vatio
ns a
re g
iven
in m
eter
s.
Site
Cod
eSp
ecie
sLa
t.Lo
ng.
Elev
.Se
ason
sn
Fair
bank
s, A
K, U
SAA
KS
T. b
icol
or64
.86
147.
7314
220
00–2
005
170
Bea
verh
ill, A
B, C
AA
LBT.
bic
olor
53.0
511
3.05
668
1986
–198
816
5B
eave
rhill
Lak
e, A
B, C
AB
BO
T. b
icol
or53
.37
112.
5467
020
08–2
011
241
Gra
nd B
aham
a, B
SB
HM
T. c
yane
oviri
dis
26.5
078
.73
1995
10H
ill B
ank,
Ora
nge
Wal
k, B
ZB
LZT.
alb
iline
a17
.60
88.6
839
2001
, 200
3, 2
009–
2011
219
Cha
scom
us, B
s A
s, A
RC
HA
T. le
ucor
rhoa
235
.57
58.0
28
2002
–200
5, 2
009–
2010
287
Car
mel
, CA
, USA
CR
MT.
thal
assi
na36
.41
121.
5967
019
86–1
990,
199
2–19
96, 1
998–
2006
111
Elkh
orn
Slou
gh, C
A, U
SAEL
KT.
bic
olor
36.8
012
1.79
2020
0628
Geo
rge
Res
, MI,
USA
ESG
T. b
icol
or42
.45
84.0
029
119
88–1
990
157
Alle
ndal
e, M
I, U
SAG
VS
T. b
icol
or42
.95
85.8
821
419
92–2
005
834
Am
es, I
A, U
SAIO
WT.
bic
olor
42.0
893
.61
303
2003
–200
753
2Ith
aca,
NY,
USA
ITH
T. b
icol
or42
.476
.50
344
1986
–201
051
85G
ener
al L
aval
le, B
s A
s, A
RLA
VT.
leuc
orrh
oa2
36.4
256
.95
120
03–2
005
122
Long
Poi
nt, O
N, C
ALP
TT.
bic
olor
42.5
580
.07
175
1986
–201
099
1Le
e V
inin
g, C
A, U
SALV
CT.
bic
olor
T. th
alas
sina
38.0
011
9.02
2073
2000
–200
989 77
Win
dsor
, NS,
CA
NSC
T. b
icol
or45
.05
64.2
512
1994
–200
588
1Ye
llow
knife
, NT,
CA
NW
TT.
bic
olor
62.4
511
4.35
205
1988
–198
957
Port
Row
an, O
N, C
AO
NT
T. b
icol
or42
.64
80.4
618
219
86–1
998,
200
1–20
04, 2
009–
2010
819
Cor
valli
s, O
R, U
SAO
SUT.
bic
olor
T. th
alas
sina
44.5
812
3.27
200
2003
–200
531 56
Lam
baye
que,
Per
uPE
RT.
sto
lzm
anni
26.
4679
.80
6620
1019
Poin
t Rey
es, C
A, U
SAPR
BT.
bic
olor
38.2
712
1.44
120
03–2
004
80Pr
ince
Geo
rge,
BC
, CA
PRG
T. b
icol
or53
.79
122.
7771
520
01–2
005,
201
156
0La
ke O
pini
con,
ON
, CA
QU
BT.
bic
olor
44.5
776
.33
123
2000
–200
1, 2
005
112
St D
enis
, SK
, CA
RG
CT.
bic
olor
52.2
010
6.08
500
1991
–199
6, 1
998–
2004
, 200
9–20
1115
84Sa
cram
ento
, CA
, USA
SAC
T. b
icol
or38
.76
121.
3336
1997
–200
215
4Sa
ticoy
, CA
, USA
SAT
T. b
icol
or34
.28
119.
1343
1997
, 199
9, 2
002
129
Sant
e Fe
, SF,
AR
SFP
T. le
ucor
rhoa
231
.66
60.5
914
2004
–200
5, 2
008–
2010
169
Port
Row
an, O
N, C
A (s
ewag
e la
goon
)SL
NT.
bic
olor
42.6
480
.46
182
1986
–199
9, 2
001–
2004
, 200
9–20
1092
3Lo
uden
Co.
, TN
, USA
TEN
T. b
icol
or35
.884
.27
260
2001
–200
210
6Jo
nes
Bea
ch, N
Y, U
SATO
BT.
bic
olor
40.6
373
.46
219
80–1
983
104
Har
bert
on, T
F, A
RU
SHT.
mey
eni
254
.81
67.7
520
020
06–2
010
177
Red
land
, OR
, USA
WIL
T. b
icol
or45
.35
122.
5030
.520
01–2
003
119
Sauk
ville
, WI,
USA
WIS
T. b
icol
or43
.38
88.0
223
019
97–2
005
574
Sher
idan
, WY,
USA
WYO
T. b
icol
or44
.50
107.
0213
1020
00–2
001
89
673
Ontario where food availability varies dramatically across a distance of only a few kilometers.
Results
Similar to T. bicolor and leucorrhoa, most other Tachycineta species exhibited a linear seasonal decline in clutch size, and larger clutches occurred more frequently at higher lati-tudes (Fig. 2a). The final clutch size–lay date regression model for fixed effects contained only statistically significant terms and had the following design:
CS eb1 1 b2 lay 1 b3 lat 3 b4 spp 1 b5 lay 1 lat 1 ei
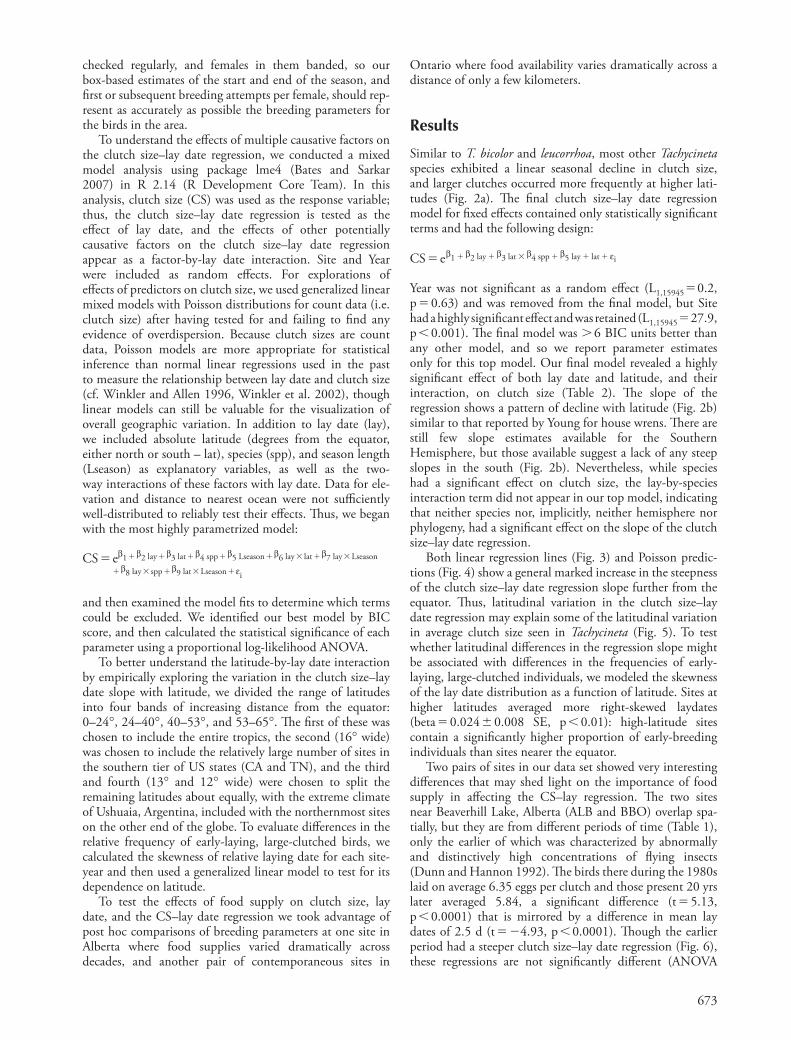
Year was not significant as a random effect (L1,15945 0.2, p 0.63) and was removed from the final model, but Site had a highly significant effect and was retained (L1,15945 27.9, p 0.001). The final model was 6 BIC units better than any other model, and so we report parameter estimates only for this top model. Our final model revealed a highly significant effect of both lay date and latitude, and their interaction, on clutch size (Table 2). The slope of the regression shows a pattern of decline with latitude (Fig. 2b) similar to that reported by Young for house wrens. There are still few slope estimates available for the Southern Hemisphere, but those available suggest a lack of any steep slopes in the south (Fig. 2b). Nevertheless, while species had a significant effect on clutch size, the lay-by-species interaction term did not appear in our top model, indicating that neither species nor, implicitly, neither hemisphere nor phylogeny, had a significant effect on the slope of the clutch size–lay date regression.
Both linear regression lines (Fig. 3) and Poisson predic-tions (Fig. 4) show a general marked increase in the steepness of the clutch size–lay date regression slope further from the equator. Thus, latitudinal variation in the clutch size–lay date regression may explain some of the latitudinal variation in average clutch size seen in Tachycineta (Fig. 5). To test whether latitudinal differences in the regression slope might be associated with differences in the frequencies of early- laying, large-clutched individuals, we modeled the skewness of the lay date distribution as a function of latitude. Sites at higher latitudes averaged more right-skewed laydates (beta 0.024 0.008 SE, p 0.01): high-latitude sites contain a significantly higher proportion of early-breeding individuals than sites nearer the equator.
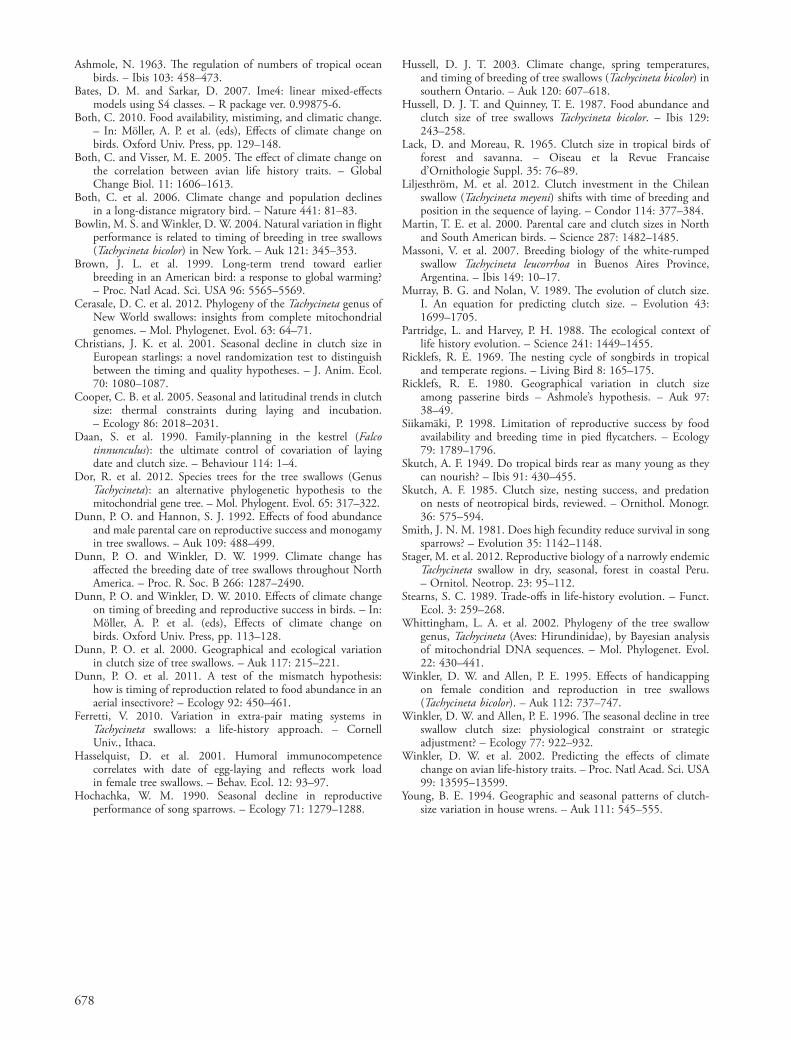
Two pairs of sites in our data set showed very interesting differences that may shed light on the importance of food supply in affecting the CS–lay regression. The two sites near Beaverhill Lake, Alberta (ALB and BBO) overlap spa-tially, but they are from different periods of time (Table 1), only the earlier of which was characterized by abnormally and distinctively high concentrations of flying insects (Dunn and Hannon 1992). The birds there during the 1980s laid on average 6.35 eggs per clutch and those present 20 yrs later averaged 5.84, a significant difference (t 5.13, p 0.0001) that is mirrored by a difference in mean lay dates of 2.5 d (t 24.93, p 0.0001). Though the earlier period had a steeper clutch size–lay date regression (Fig. 6), these regressions are not significantly different (ANOVA
checked regularly, and females in them banded, so our box-based estimates of the start and end of the season, and first or subsequent breeding attempts per female, should rep-resent as accurately as possible the breeding parameters for the birds in the area.
To understand the effects of multiple causative factors on the clutch size–lay date regression, we conducted a mixed model analysis using package lme4 (Bates and Sarkar 2007) in R 2.14 (R Development Core Team). In this analysis, clutch size (CS) was used as the response variable; thus, the clutch size–lay date regression is tested as the effect of lay date, and the effects of other potentially causative factors on the clutch size–lay date regression appear as a factor-by-lay date interaction. Site and Year were included as random effects. For explorations of effects of predictors on clutch size, we used generalized linear mixed models with Poisson distributions for count data (i.e. clutch size) after having tested for and failing to find any evidence of overdispersion. Because clutch sizes are count data, Poisson models are more appropriate for statistical inference than normal linear regressions used in the past to measure the relationship between lay date and clutch size (cf. Winkler and Allen 1996, Winkler et al. 2002), though linear models can still be valuable for the visualization of overall geographic variation. In addition to lay date (lay), we included absolute latitude (degrees from the equator, either north or south – lat), species (spp), and season length (Lseason) as explanatory variables, as well as the two- way interactions of these factors with lay date. Data for ele-vation and distance to nearest ocean were not sufficiently well-distributed to reliably test their effects. Thus, we began with the most highly parametrized model:
CS eb1 1 b2 lay 1 b3 lat 1 b4 spp 1 b5 Lseason 1 b6 lay 3 lat 1 b7 lay 3 Lseason
1 b8 lay 3 spp 1 b9 lat 3 Lseason 1 ei
and then examined the model fits to determine which terms could be excluded. We identified our best model by BIC score, and then calculated the statistical significance of each parameter using a proportional log-likelihood ANOVA.
To better understand the latitude-by-lay date interaction by empirically exploring the variation in the clutch size–lay date slope with latitude, we divided the range of latitudes into four bands of increasing distance from the equator: 0–24°, 24–40°, 40–53°, and 53–65°. The first of these was chosen to include the entire tropics, the second (16° wide) was chosen to include the relatively large number of sites in the southern tier of US states (CA and TN), and the third and fourth (13° and 12° wide) were chosen to split the remaining latitudes about equally, with the extreme climate of Ushuaia, Argentina, included with the northernmost sites on the other end of the globe. To evaluate differences in the relative frequency of early-laying, large-clutched birds, we calculated the skewness of relative laying date for each site-year and then used a generalized linear model to test for its dependence on latitude.
To test the effects of food supply on clutch size, lay date, and the CS–lay date regression we took advantage of post hoc comparisons of breeding parameters at one site in Alberta where food supplies varied dramatically across decades, and another pair of contemporaneous sites in
674
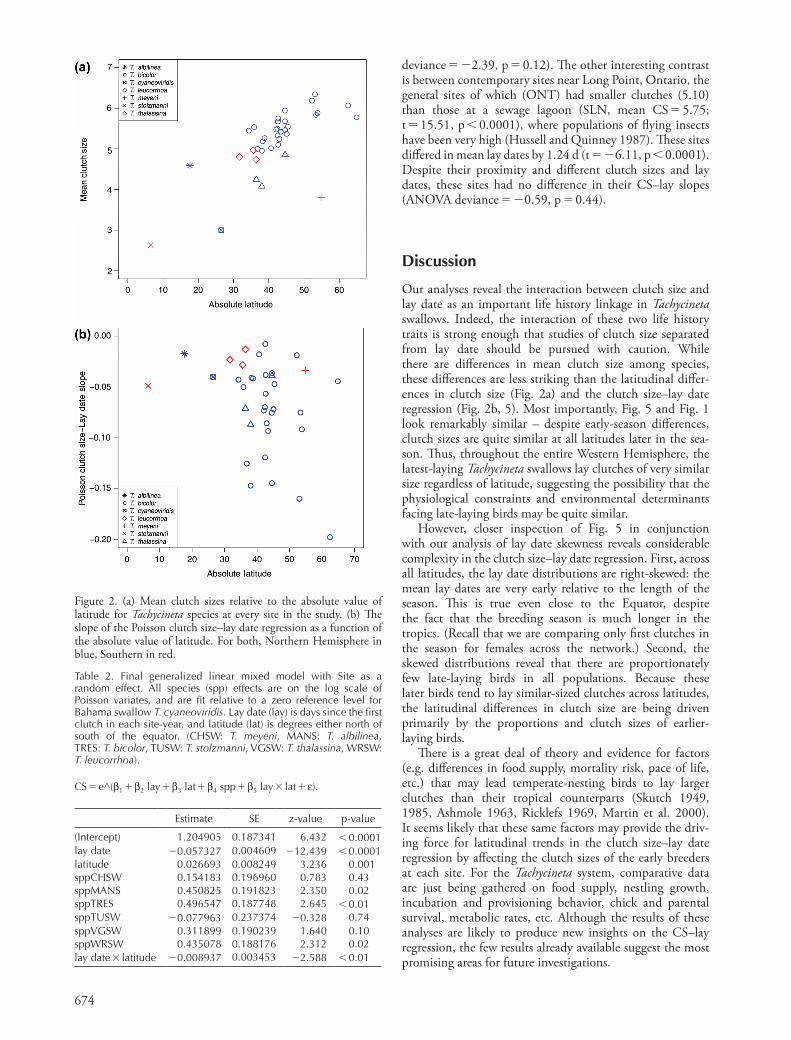
Table 2. Final generalized linear mixed model with Site as a random effect. All species (spp) effects are on the log scale of Poisson variates, and are fit relative to a zero reference level for Bahama swallow T. cyaneoviridis. Lay date (lay) is days since the first clutch in each site-year, and latitude (lat) is degrees either north of south of the equator. (CHSW: T. meyeni, MANS: T. albilinea, TRES: T. bicolor, TUSW: T. stolzmanni, VGSW: T. thalassina, WRSW: T. leucorrhoa).
CS e^(b1 1 b2 lay 1 b3 lat 1 b4 spp 1 b5 lay 3 lat 1 e).
Estimate SE z-value p-value
(Intercept) 1.204905 0.187341 6.432 0.0001lay date 20.057327 0.004609 212.439 0.0001latitude 0.026693 0.008249 3.236 0.001sppCHSW 0.154183 0.196960 0.783 0.43sppMANS 0.450825 0.191823 2.350 0.02sppTRES 0.496547 0.187748 2.645 0.01sppTUSW 20.077963 0.237374 20.328 0.74sppVGSW 0.311899 0.190239 1.640 0.10sppWRSW 0.435078 0.188176 2.312 0.02lay date 3 latitude 20.008937 0.003453 22.588 0.01
Figure 2. (a) Mean clutch sizes relative to the absolute value of latitude for Tachycineta species at every site in the study. (b) The slope of the Poisson clutch size–lay date regression as a function of the absolute value of latitude. For both, Northern Hemisphere in blue, Southern in red.
deviance 22.39, p 0.12). The other interesting contrast is between contemporary sites near Long Point, Ontario, the general sites of which (ONT) had smaller clutches (5.10) than those at a sewage lagoon (SLN, mean CS 5.75; t 15.51, p 0.0001), where populations of flying insects have been very high (Hussell and Quinney 1987). These sites differed in mean lay dates by 1.24 d (t 26.11, p 0.0001). Despite their proximity and different clutch sizes and lay dates, these sites had no difference in their CS–lay slopes (ANOVA deviance 20.59, p 0.44).
Discussion
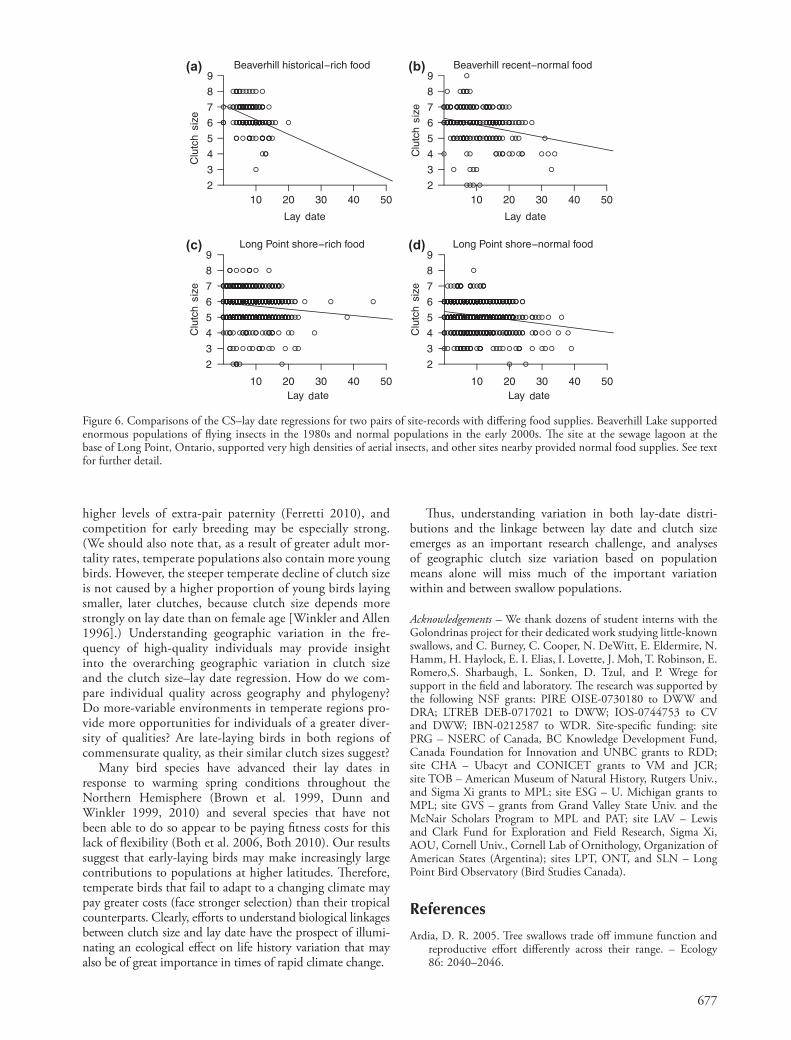
Our analyses reveal the interaction between clutch size and lay date as an important life history linkage in Tachycineta swallows. Indeed, the interaction of these two life history traits is strong enough that studies of clutch size separated from lay date should be pursued with caution. While there are differences in mean clutch size among species, these differences are less striking than the latitudinal differ-ences in clutch size (Fig. 2a) and the clutch size–lay date regression (Fig. 2b, 5). Most importantly, Fig. 5 and Fig. 1 look remarkably similar – despite early-season differences, clutch sizes are quite similar at all latitudes later in the sea-son. Thus, throughout the entire Western Hemisphere, the latest-laying Tachycineta swallows lay clutches of very similar size regardless of latitude, suggesting the possibility that the physiological constraints and environmental determinants facing late-laying birds may be quite similar.
However, closer inspection of Fig. 5 in conjunction with our analysis of lay date skewness reveals considerable complexity in the clutch size–lay date regression. First, across all latitudes, the lay date distributions are right-skewed: the mean lay dates are very early relative to the length of the season. This is true even close to the Equator, despite the fact that the breeding season is much longer in the tropics. (Recall that we are comparing only first clutches in the season for females across the network.) Second, the skewed distributions reveal that there are proportionately few late-laying birds in all populations. Because these later birds tend to lay similar-sized clutches across latitudes, the latitudinal differences in clutch size are being driven primarily by the proportions and clutch sizes of earlier- laying birds.
There is a great deal of theory and evidence for factors (e.g. differences in food supply, mortality risk, pace of life, etc.) that may lead temperate-nesting birds to lay larger clutches than their tropical counterparts (Skutch 1949, 1985, Ashmole 1963, Ricklefs 1969, Martin et al. 2000). It seems likely that these same factors may provide the driv-ing force for latitudinal trends in the clutch size–lay date regression by affecting the clutch sizes of the early breeders at each site. For the Tachycineta system, comparative data are just being gathered on food supply, nestling growth, incubation and provisioning behavior, chick and parental survival, metabolic rates, etc. Although the results of these analyses are likely to produce new insights on the CS–lay regression, the few results already available suggest the most promising areas for future investigations.
675
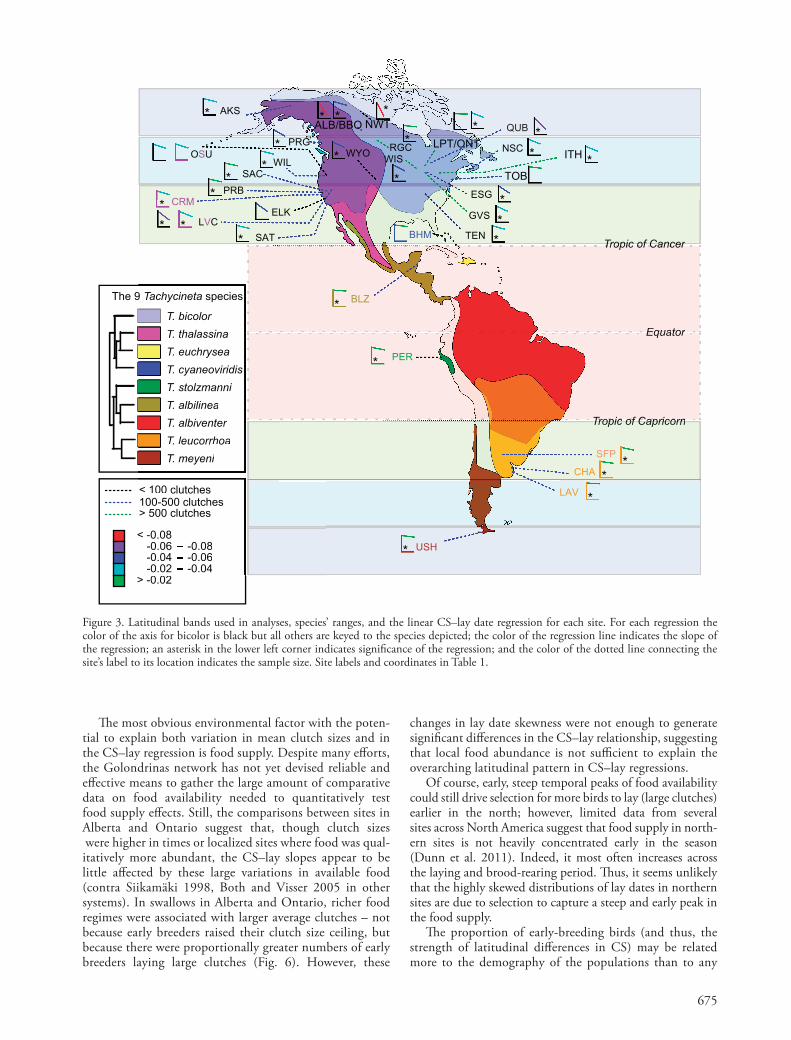
The 9 Tachycineta species
T. bicolor
T. thalassina
T. albilinea
T. cyaneoviridis
T. albiventer
T. leucorrhoa
T. meyeni
T. euchrysea
T. stolzmanni
< 100 clutches
Tropic of Cancer
Tropic of Capricorn
Equator
100-500 clutches> 500 clutches
< -0.08 -0.06 -0.08 -0.04 -0.06 -0.02 -0.04> -0.02
9 Tachycineta species
T. bicolor
T. thalassina
T. albilinea
T. cyaneoviridis
T. albiventer
T. leucorrhoa
T. meyeni
T. euchrysea
T. stolzmanni
< 100 clutches
TrTrTrTrTTrT opopopopopiciciciccici oooooofffff CaCaCaCaCaCaCancncncnccncncererererer
TrTrTrTrTrTropoppopopopicicicicic ooooooffffff CaCaCaCaCaCaprprprprprpriciicicicicororoororornnnnn
EqEEqEqEquauauauatottototorrrr
100-500 clutches> 500 clutches
< -0.08 -0.06 -0.08 -0.04 -0.06 -0.02 -0.04
OSU
AKS
BLZ
WIS
SFP
CHA
RGC NSC
QUB
GVS
ALB/BBO
NWT
ITHLPT/ONT
LAV
TEN
WIL
SATLVC
SAC
CRM
WYOPRG
ELK
ESG
BHM
USH
PER
TOBPRB
* **
**
**
**
*
*
*
*
*
**
*
***
****
*
*
*
*
Figure 3. Latitudinal bands used in analyses, species’ ranges, and the linear CS–lay date regression for each site. For each regression the color of the axis for bicolor is black but all others are keyed to the species depicted; the color of the regression line indicates the slope of the regression; an asterisk in the lower left corner indicates significance of the regression; and the color of the dotted line connecting the site’s label to its location indicates the sample size. Site labels and coordinates in Table 1.
The most obvious environmental factor with the poten-tial to explain both variation in mean clutch sizes and in the CS–lay regression is food supply. Despite many efforts, the Golondrinas network has not yet devised reliable and effective means to gather the large amount of comparative data on food availability needed to quantitatively test food supply effects. Still, the comparisons between sites in Alberta and Ontario suggest that, though clutch sizes were higher in times or localized sites where food was qual-itatively more abundant, the CS–lay slopes appear to be little affected by these large variations in available food (contra Siikamäki 1998, Both and Visser 2005 in other systems). In swallows in Alberta and Ontario, richer food regimes were associated with larger average clutches – not because early breeders raised their clutch size ceiling, but because there were proportionally greater numbers of early breeders laying large clutches (Fig. 6). However, these
changes in lay date skewness were not enough to generate significant differences in the CS–lay relationship, suggesting that local food abundance is not sufficient to explain the overarching latitudinal pattern in CS–lay regressions.
Of course, early, steep temporal peaks of food availability could still drive selection for more birds to lay (large clutches) earlier in the north; however, limited data from several sites across North America suggest that food supply in north-ern sites is not heavily concentrated early in the season (Dunn et al. 2011). Indeed, it most often increases across the laying and brood-rearing period. Thus, it seems unlikely that the highly skewed distributions of lay dates in northern sites are due to selection to capture a steep and early peak in the food supply.
The proportion of early-breeding birds (and thus, the strength of latitudinal differences in CS) may be related more to the demography of the populations than to any
676
Figure 5. Summary of the predictions from Poisson regression of clutch size on lay date for all data in each of the latitudinal bands of the same color in Fig. 3. For each band, the mean lay date and clutch size is also indicated by a colored dot.
(a) (b)
(c) (d)
s s
s s
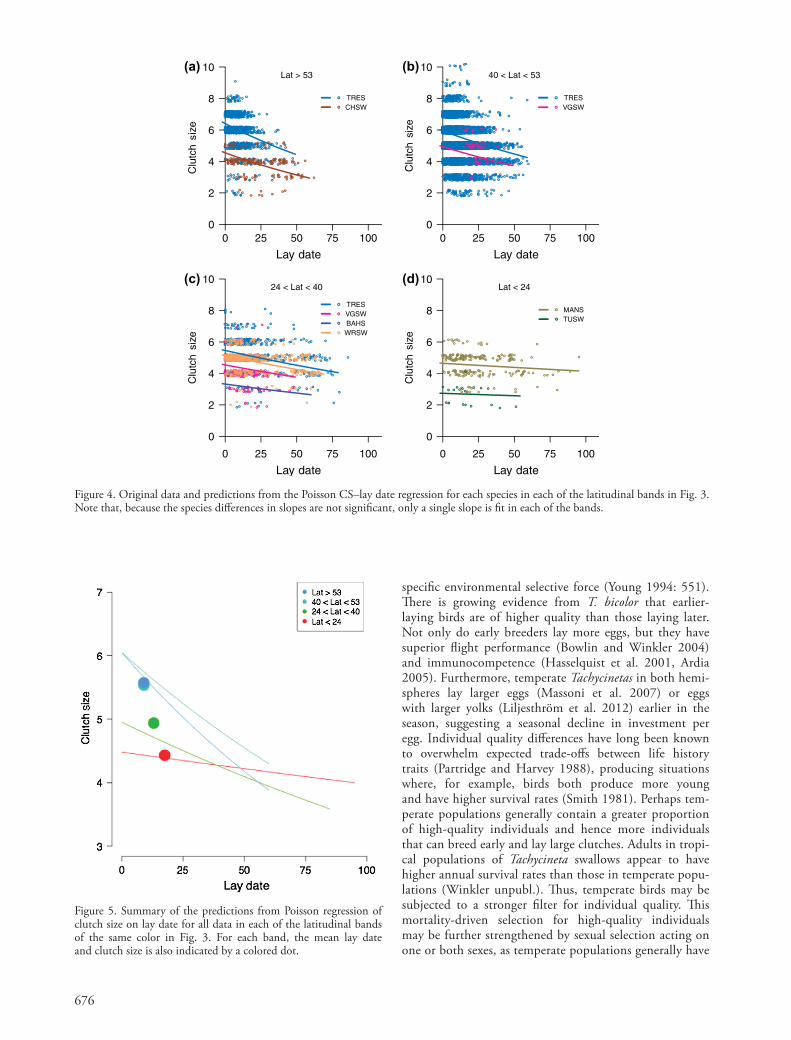
Figure 4. Original data and predictions from the Poisson CS–lay date regression for each species in each of the latitudinal bands in Fig. 3. Note that, because the species differences in slopes are not significant, only a single slope is fit in each of the bands.
specific environmental selective force (Young 1994: 551). There is growing evidence from T. bicolor that earlier- laying birds are of higher quality than those laying later. Not only do early breeders lay more eggs, but they have superior flight performance (Bowlin and Winkler 2004) and immunocompetence (Hasselquist et al. 2001, Ardia 2005). Furthermore, temperate Tachycinetas in both hemi-spheres lay larger eggs (Massoni et al. 2007) or eggs with larger yolks (Liljesthröm et al. 2012) earlier in the season, suggesting a seasonal decline in investment per egg. Individual quality differences have long been known to overwhelm expected trade-offs between life history traits (Partridge and Harvey 1988), producing situations where, for example, birds both produce more young and have higher survival rates (Smith 1981). Perhaps tem-perate populations generally contain a greater proportion of high-quality individuals and hence more indivi duals that can breed early and lay large clutches. Adults in tropi-cal populations of Tachycineta swallows appear to have higher annual survival rates than those in temperate popu-lations (Winkler unpubl.). Thus, temperate birds may be subjected to a stronger filter for individual quality. This mortality-driven selection for high-quality individuals may be further strengthened by sexual selection acting on one or both sexes, as temperate populations generally have
677
Thus, understanding variation in both lay-date distri-butions and the linkage between lay date and clutch size emerges as an important research challenge, and analyses of geographic clutch size variation based on population means alone will miss much of the important variation within and between swallow populations.
Acknowledgements – We thank dozens of student interns with the Golondrinas project for their dedicated work studying little-known swallows, and C. Burney, C. Cooper, N. DeWitt, E. Eldermire, N. Hamm, H. Haylock, E. I. Elias, I. Lovette, J. Moh, T. Robinson, E. Romero,S. Sharbaugh, L. Sonken, D. Tzul, and P. Wrege for support in the field and laboratory. The research was supported by the following NSF grants: PIRE OISE-0730180 to DWW and DRA; LTREB DEB-0717021 to DWW; IOS-0744753 to CV and DWW; IBN-0212587 to WDR. Site-specific funding: site PRG – NSERC of Canada, BC Knowledge Development Fund, Canada Foundation for Innovation and UNBC grants to RDD; site CHA – Ubacyt and CONICET grants to VM and JCR; site TOB – American Museum of Natural History, Rutgers Univ., and Sigma Xi grants to MPL; site ESG – U. Michigan grants to MPL; site GVS – grants from Grand Valley State Univ. and the McNair Scholars Program to MPL and PAT; site LAV – Lewis and Clark Fund for Exploration and Field Research, Sigma Xi, AOU, Cornell Univ., Cornell Lab of Ornithology, Organization of American States (Argentina); sites LPT, ONT, and SLN – Long Point Bird Observatory (Bird Studies Canada).
References
Ardia, D. R. 2005. Tree swallows trade off immune function and reproductive effort differently across their range. – Ecology 86: 2040–2046.
higher levels of extra-pair paternity (Ferretti 2010), and competition for early breeding may be especially strong. (We should also note that, as a result of greater adult mor-tality rates, temperate populations also contain more young birds. However, the steeper temperate decline of clutch size is not caused by a higher proportion of young birds laying smaller, later clutches, because clutch size depends more strongly on lay date than on female age [Winkler and Allen 1996].) Understanding geographic variation in the fre-quency of high-quality individuals may provide insight into the overarching geographic variation in clutch size and the clutch size–lay date regression. How do we com-pare individual quality across geography and phylogeny? Do more-variable environments in temperate regions pro-vide more opportunities for individuals of a greater diver-sity of qualities? Are late-laying birds in both regions of commensurate quality, as their similar clutch sizes suggest?
Many bird species have advanced their lay dates in response to warming spring conditions throughout the Northern Hemisphere (Brown et al. 1999, Dunn and Winkler 1999, 2010) and several species that have not been able to do so appear to be paying fitness costs for this lack of flexibility (Both et al. 2006, Both 2010). Our results suggest that early-laying birds may make increasingly large contributions to populations at higher latitudes. Therefore, temperate birds that fail to adapt to a changing climate may pay greater costs (face stronger selection) than their tropical counterparts. Clearly, efforts to understand biological linkages between clutch size and lay date have the prospect of illumi-nating an ecological effect on life history variation that may also be of great importance in times of rapid climate change.
(a) (b)
(c) (d)
s
sss
d d
dd
Figure 6. Comparisons of the CS–lay date regressions for two pairs of site-records with differing food supplies. Beaverhill Lake supported enormous populations of flying insects in the 1980s and normal populations in the early 2000s. The site at the sewage lagoon at the base of Long Point, Ontario, supported very high densities of aerial insects, and other sites nearby provided normal food supplies. See text for further detail.
678
Hussell, D. J. T. 2003. Climate change, spring temperatures, and timing of breeding of tree swallows (Tachycineta bicolor) in southern Ontario. – Auk 120: 607–618.
Hussell, D. J. T. and Quinney, T. E. 1987. Food abundance and clutch size of tree swallows Tachycineta bicolor. – Ibis 129: 243–258.
Lack, D. and Moreau, R. 1965. Clutch size in tropical birds of forest and savanna. – Oiseau et la Revue Francaise d’Ornithologie Suppl. 35: 76–89.
Liljesthröm, M. et al. 2012. Clutch investment in the Chilean swallow (Tachycineta meyeni) shifts with time of breeding and position in the sequence of laying. – Condor 114: 377–384.
Martin, T. E. et al. 2000. Parental care and clutch sizes in North and South American birds. – Science 287: 1482–1485.
Massoni, V. et al. 2007. Breeding biology of the white-rumped swallow Tachycineta leucorrhoa in Buenos Aires Province, Argentina. – Ibis 149: 10–17.
Murray, B. G. and Nolan, V. 1989. The evolution of clutch size. I. An equation for predicting clutch size. – Evolution 43: 1699–1705.
Partridge, L. and Harvey, P. H. 1988. The ecological context of life history evolution. – Science 241: 1449–1455.
Ricklefs, R. E. 1969. The nesting cycle of songbirds in tropical and temperate regions. – Living Bird 8: 165–175.
Ricklefs, R. E. 1980. Geographical variation in clutch size among passerine birds – Ashmole’s hypothesis. – Auk 97: 38–49.
Siikamäki, P. 1998. Limitation of reproductive success by food availability and breeding time in pied flycatchers. – Ecology 79: 1789–1796.
Skutch, A. F. 1949. Do tropical birds rear as many young as they can nourish? – Ibis 91: 430–455.
Skutch, A. F. 1985. Clutch size, nesting success, and predation on nests of neotropical birds, reviewed. – Ornithol. Monogr. 36: 575–594.
Smith, J. N. M. 1981. Does high fecundity reduce survival in song sparrows? – Evolution 35: 1142–1148.
Stager, M. et al. 2012. Reproductive biology of a narrowly endemic Tachycineta swallow in dry, seasonal, forest in coastal Peru. – Ornitol. Neotrop. 23: 95–112.
Stearns, S. C. 1989. Trade-offs in life-history evolution. – Funct. Ecol. 3: 259–268.
Whittingham, L. A. et al. 2002. Phylogeny of the tree swallow genus, Tachycineta (Aves: Hirundinidae), by Bayesian analysis of mitochondrial DNA sequences. – Mol. Phylogenet. Evol. 22: 430–441.
Winkler, D. W. and Allen, P. E. 1995. Effects of handicapping on female condition and reproduction in tree swallows (Tachycineta bicolor). – Auk 112: 737–747.
Winkler, D. W. and Allen, P. E. 1996. The seasonal decline in tree swallow clutch size: physiological constraint or strategic adjustment? – Ecology 77: 922–932.
Winkler, D. W. et al. 2002. Predicting the effects of climate change on avian life-history traits. – Proc. Natl Acad. Sci. USA 99: 13595–13599.
Young, B. E. 1994. Geographic and seasonal patterns of clutch- size variation in house wrens. – Auk 111: 545–555.
Ashmole, N. 1963. The regulation of numbers of tropical ocean birds. – Ibis 103: 458–473.
Bates, D. M. and Sarkar, D. 2007. Ime4: linear mixed-effects models using S4 classes. – R package ver. 0.99875-6.
Both, C. 2010. Food availability, mistiming, and climatic change. – In: Möller, A. P. et al. (eds), Effects of climate change on birds. Oxford Univ. Press, pp. 129–148.
Both, C. and Visser, M. E. 2005. The effect of climate change on the correlation between avian life history traits. – Global Change Biol. 11: 1606–1613.
Both, C. et al. 2006. Climate change and population declines in a long-distance migratory bird. – Nature 441: 81–83.
Bowlin, M. S. and Winkler, D. W. 2004. Natural variation in flight performance is related to timing of breeding in tree swallows (Tachycineta bicolor) in New York. – Auk 121: 345–353.
Brown, J. L. et al. 1999. Long-term trend toward earlier breeding in an American bird: a response to global warming? – Proc. Natl Acad. Sci. USA 96: 5565–5569.
Cerasale, D. C. et al. 2012. Phylogeny of the Tachycineta genus of New World swallows: insights from complete mitochondrial genomes. – Mol. Phylogenet. Evol. 63: 64–71.
Christians, J. K. et al. 2001. Seasonal decline in clutch size in European starlings: a novel randomization test to distinguish between the timing and quality hypotheses. – J. Anim. Ecol. 70: 1080–1087.
Cooper, C. B. et al. 2005. Seasonal and latitudinal trends in clutch size: thermal constraints during laying and incubation. – Ecology 86: 2018–2031.
Daan, S. et al. 1990. Family-planning in the kestrel (Falco tinnunculus): the ultimate control of covariation of laying date and clutch size. – Behaviour 114: 1–4.
Dor, R. et al. 2012. Species trees for the tree swallows (Genus Tachycineta): an alternative phylogenetic hypothesis to the mitochondrial gene tree. – Mol. Phylogent. Evol. 65: 317–322.
Dunn, P. O. and Hannon, S. J. 1992. Effects of food abundance and male parental care on reproductive success and monogamy in tree swallows. – Auk 109: 488–499.
Dunn, P. O. and Winkler, D. W. 1999. Climate change has affected the breeding date of tree swallows throughout North America. – Proc. R. Soc. B 266: 1287–2490.
Dunn, P. O. and Winkler, D. W. 2010. Effects of climate change on timing of breeding and reproductive success in birds. – In: Möller, A. P. et al. (eds), Effects of climate change on birds. Oxford Univ. Press, pp. 113–128.
Dunn, P. O. et al. 2000. Geographical and ecological variation in clutch size of tree swallows. – Auk 117: 215–221.
Dunn, P. O. et al. 2011. A test of the mismatch hypothesis: how is timing of reproduction related to food abundance in an aerial insectivore? – Ecology 92: 450–461.
Ferretti, V. 2010. Variation in extra-pair mating systems in Tachycineta swallows: a life-history approach. – Cornell Univ., Ithaca.
Hasselquist, D. et al. 2001. Humoral immunocompetence correlates with date of egg-laying and reflects work load in female tree swallows. – Behav. Ecol. 12: 93–97.
Hochachka, W. M. 1990. Seasonal decline in reproductive performance of song sparrows. – Ecology 71: 1279–1288.


![TOKYO YAKULT SWALLOWS YAKULT SWALLOWS 1279B JD-MY 1,000P1 ROUTE iNN NISAà NISA [iDeCo] "Waku It](https://img.pdfslide.us/doc/110x75/5cef534488c9937c458d29a3/tokyo-yakult-yakult-swallows-1279b-jd-my-1000p1-route-inn-nisaa-nisa-ideco-waku.jpg)