Embed Size (px)
Citation preview

Ann. Geophys., 24, 3329–3341, 2006www.ann-geophys.net/24/3329/2006/© European Geosciences Union 2006
AnnalesGeophysicae
Latitudinal and temporal variation of equatorial ionosphericirregularities determined from GPS scintillation observations
M. A. Cervera1 and R. M. Thomas2
1Intelligence, Surveillance and Reconnaissance Division, Defence Science and Technology Organisation, PO Box 1500,Edinburgh, S.A. 5111, Australia2Box 154, Cockatoo Valley, S.A. 5351, Australia
Received: 10 April 2006 – Revised: 19 October 2006 – Accepted: 27 November 2006 – Published: 21 December 2006
Abstract. In this paper we investigate the spatial and tempo-ral distribution of ionospheric irregularities in the South-EastAsian longitude sector by analysing the scintillation of GPSsignals received at ground based stations. The data used forthis work were collected during 1998 to 2002 with our re-gional network of GPS based scintillation monitors (Thomaset al., 2001).
The aim of this analysis is to better understand the mor-phology and climatology of ionospheric irregularities inour region. Interesting differences between the north andsouth anomalies are noted when we examine the latitudinal–temporal variation of irregularity activity. We investigate thepossible causes of these differences and note that variationsin the irregularity seeding mechanism and in the backgroundionosphere at the two anomalies could be important.
Phase screen diffraction theory is used to analyse our scin-tillation data and we note problems with this theory for ray-paths with large off-zenith angles. The height of the phasescreen is another important issue. We discuss the implica-tions for models which rely on phase screen diffraction the-ory.
Keywords. Ionosphere (Equatorial ionosphere; Ionospericirregularities; General or miscellaneous)
1 Introduction
Radio-wave signals which traverse the Earth’s ionosphereare subject to various effects. Under quiescent conditions(i.e. the ionosphere is not turbulent) such signals experiencethe well know group delay and carrier advance due to thenon-unitary refractive index of the medium. As the iono-sphere is inhomogeneous, refraction of the radio-wave signaloccurs. When the ionosphere becomes turbulent through thegeneration and evolution of irregularities, more severe effectsare imposed upon the signals. Diffraction of the signals oc-
Correspondence to:M. A. Cervera([email protected])
curs and as the irregular medium drifts with respect to the raypath the diffraction pattern observed at the receiver fluctuatestemporally. At HF this is manifest as spread-F in radar ob-servations. For trans-ionospheric signals such as those fromGPS satellites it is manifest as amplitude and phase scintil-lation imposed upon the signals. The two main regions ofthe ionosphere where irregularities occur are the polar andequatorial zones. The physical processes involved are verydifferent and we focus solely on the latter.
The equatorial ionosphere is that region bounded by∼±20◦ magnetic latitude with the Appleton anomaly peak-ing at ∼±15◦. Irregularities may form in this region of theionosphere 1–2 h post sunset, and the irregularity generatingregion moves westward with the sunset terminator. The ir-regularities, in the form of bubbles of depleted ionization, aregenerated at or near the magnetic equator in the bottom-sideof the F2 layer, rise and map poleward along the magneticfield lines until they reach the Appleton anomaly regionsnorth and south of the equator. Heights of up to 1000 kmmay be attained. The bubbles are large structures and as theymap down the field lines they break down into a spectrum ofsmaller irregularities. Once formed the irregularities subse-quently drift eastward with the neutral wind.
The physical process which generates the bubbles is aRayleigh–Taylor like instability (Kelley, 1989). Chemicalprocesses which control recombination in the post sunsetionosphere produce a sharp gradient in the vertical electrondensity profile. Perturbations (e.g. due to acoustic gravitywaves or the equatorial post-sunset vortex) in this region be-come unstable at the magnetic equator due to east-west polar-isation electric fields which form within the perturbation as aconsequence of the zonal current flow. The resultantδE×B
forces at the magnetic equator cause the perturbations to be-come unstable.
Gravity waves in the neutral atmosphere have long beenrecognised as the generating mechanism of travelling iono-spheric disturbances (TIDs) and the case for their role as theseeding mechanism of ionospheric irregularities is steadilystrengthening.Whitehead(1971) first proposed that gravity
Published by Copernicus GmbH on behalf of the European Geosciences Union.

3330 M. A. Cervera and R. M. Thomas: Equatorial ionospheric irregularities
waves can produce perturbations in the ionosphere underthe conditions of spatial resonance. Here the requirementis that the phase speed of the gravity wave is equal to thedrift speed of the ionization.Huang and Kelley(1996a,b)extensively modelled the physical processes whereby grav-ity waves seeded the initial perturbations in the bottom-side night time ionosphere and their subsequent evolutionthrough the Rayleigh-Taylor instability amplification to pro-duce plasma bubbles and plumes. They not only demon-strated the importance of the gravity wave seeding mecha-nism of plasma bubbles but also that spatial resonance wasnot required for their generation (although spatial resonancecould speed up the process). Extensive observations of equa-torial plasma bubbles by radar (e.g.Kelley et al., 1981; Hy-sell et al., 1990; Kelley and Hysell, 1991; Huang et al., 1993),satellite borne ion drift sensors (e.g.Singh et al., 1997), andoptical observations of F region night-glow emissions (e.g.Fagundes et al., 1999; Sinha and Raizada, 2000) have in-creasingly strengthened the hypothesis that gravity waves area seed mechanism. RecentlyNicolls and Kelley(2005) ob-served wave activity several hours prior to the onset of theconditions suitable for plasma instabilities. Once these con-ditions were met the perturbations rapidly generated iono-spheric irregularities. This new observation has added addi-tional compelling evidence for gravity wave seeding of equa-torial plasma bubbles.
A further controlling factor of the generation of equato-rial ionospheric irregularities is the orientation of the solarterminator with respect to the geomagnetic field lines (Tsun-oda, 1985). When the terminator is aligned with the geo-magnetic field, the longitudinal gradient in the E-region Ped-ersen conductivity maximises. This causes an enhancementin the eastward electric field and, in turn, the polarisationelectric fields within any ionospheric perturbations. Conse-quently the strength of the irregularities maximises duringthese times. In the south-east Asian longitude sector the mag-netic declination is small and so the maxima in the irregular-ity strength occur at the equinoxes.
The extent of the source region and the altitude and lati-tudinal distribution of irregularities within the source regionare poorly understood as is the mechanism which governsthe mapping of the bubbles down the magnetic field lines.These issues formed one of the motivating factors behind theestablishment of our network of scintillation monitors in theSouth-East Asian region. Other motivating factors includethe evaluation of the robustness of GPS integrity under scin-tillation conditions (Thomas et al., 2004), and the validationof scintillation models (Cervera et al., 2001).
2 GPS scintillation monitor network
Scintillation data are provided by Ionospheric ScintillationMonitors (ISM). The ISMs are based on Novatel 951 GPSsingle frequency (L1) receivers which have been modified
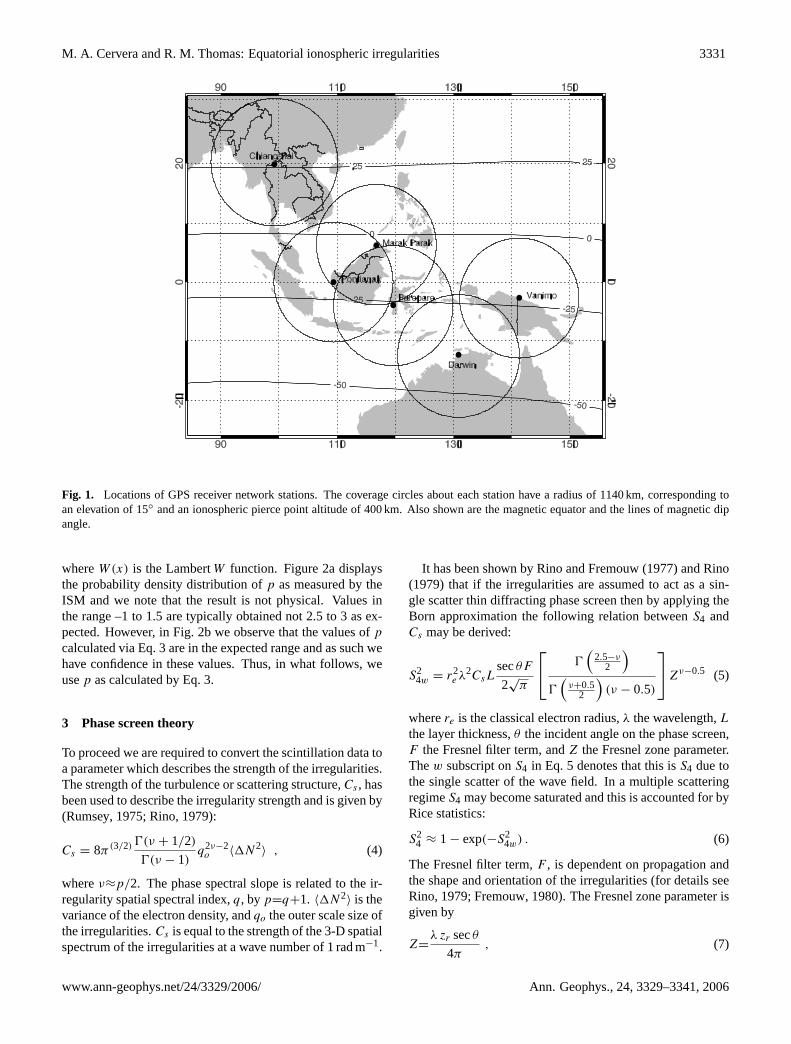
to process raw data sampled at 50 Hz and calculate vari-ous parameters which characterise the observed scintillation.The ISMs are stationed at 6 separate locations in the South–East Asian region, a detailed description of the the networkis given byThomas et al.(2001). Briefly, Fig. 1 displaysthe locations of the GPS based ISMs within the networktogether with their coverage circles. Darwin, Chiang-Rai,Marak Parak, and Pare Pare also have dual frequency No-vatel Millenium GPS receivers for the purpose of measuringTEC. However, these will not be described here.
In this paper we will present data from three stations onlyviz. Chiang-Rai, Pare Pare and Marak Parak. These stationsare respectively located under the north and south anomalycrests, and the magnetic equator.
The ISMs log data automatically at 1 minute intervalsthroughout the day. Quantities which are logged includethe amplitude and phase scintillation indicesS4 andσφ , andphase spectral parametersT (strength at 1 Hz) andp (in-dex of power-law decay). Raw 50 Hz data may also berecorded non-routinely if desired. Detailed descriptions ofthe ISMs may be found inVan Dierendonck et al.(1993) andVan Dierendonck et al.(1996).
TheS4 index is given by the standard deviation of the sig-nal power normalised by its mean and typically lies in therange 0 to 1, whereasσφ is the standard deviation of thephase which has been detrended to remove total electron con-tent (TEC) variations.Rino (1979) has shown that the phasevariance may also be given by
σ 2φ =
2T
(p − 1)fp−1c
, (1)
wherefc is the cutoff frequency of the detrend filter.The phase data from these ISMs can, on occasions, be sub-
ject to external noise severe enough to render them unusable.Care must be taken to ensure that these data are discarded. Ofmuch greater concern was the unreliability of the value ofp
measured by the ISMs. As we shall see in the next section,p
is crucial for the calculation of the strength of the irregulari-ties. The problem is due to the ISM firmware which performsa linear least squares fit to the phase spectrum in order to cal-culatep. Unfortunately, this fit often extends down into thesystem noise which biasesp towards lower values and theproblem becomes progressively worse as the level of phasescintillation decreases.
Given the importance ofp, we need an alternative methodfor producing reliable values. Equation (1) may be used tothis end when the ISMs are not subject to phase noise. Rear-ranging this equation yields
2T log(fc)
σ 2φ
= (p − 1) log(fc)e(p−1) log(fc) , (2)
whence
p = W
(2T log(fc)
σ 2φ
)/ log(fc) + 1 , (3)
Ann. Geophys., 24, 3329–3341, 2006 www.ann-geophys.net/24/3329/2006/
M. A. Cervera and R. M. Thomas: Equatorial ionospheric irregularities 3331
Fig. 1. Locations of GPS receiver network stations. The coverage circles about each station have a radius of 1140 km, corresponding toan elevation of 15◦ and an ionospheric pierce point altitude of 400 km. Also shown are the magnetic equator and the lines of magnetic dipangle.
whereW(x) is the LambertW function. Figure2a displaysthe probability density distribution ofp as measured by theISM and we note that the result is not physical. Values inthe range –1 to 1.5 are typically obtained not 2.5 to 3 as ex-pected. However, in Fig.2b we observe that the values ofp
calculated via Eq.3 are in the expected range and as such wehave confidence in these values. Thus, in what follows, weusep as calculated by Eq.3.
3 Phase screen theory
To proceed we are required to convert the scintillation data toa parameter which describes the strength of the irregularities.The strength of the turbulence or scattering structure,Cs , hasbeen used to describe the irregularity strength and is given by(Rumsey, 1975; Rino, 1979):
Cs = 8π (3/2) 0(ν + 1/2)
0(ν − 1)q2ν−2o 〈1N2
〉 , (4)
whereν≈p/2. The phase spectral slope is related to the ir-regularity spatial spectral index,q, byp=q+1. 〈1N2
〉 is thevariance of the electron density, andqo the outer scale size ofthe irregularities.Cs is equal to the strength of the 3-D spatialspectrum of the irregularities at a wave number of 1 rad m−1.
It has been shown byRino and Fremouw(1977) andRino(1979) that if the irregularities are assumed to act as a sin-gle scatter thin diffracting phase screen then by applying theBorn approximation the following relation betweenS4 andCs may be derived:
S24w = r2
e λ2CsLsecθF
2√
π
0(
2.5−ν2
)0(
ν+0.52
)(ν − 0.5)
Zν−0.5 (5)
wherere is the classical electron radius,λ the wavelength,Lthe layer thickness,θ the incident angle on the phase screen,F the Fresnel filter term, andZ the Fresnel zone parameter.Thew subscript onS4 in Eq.5 denotes that this isS4 due tothe single scatter of the wave field. In a multiple scatteringregimeS4 may become saturated and this is accounted for byRice statistics:
S24 ≈ 1 − exp(−S2
4w) . (6)
The Fresnel filter term,F , is dependent on propagation andthe shape and orientation of the irregularities (for details seeRino, 1979; Fremouw, 1980). The Fresnel zone parameter isgiven by
Z=λ zr secθ
4π, (7)
www.ann-geophys.net/24/3329/2006/ Ann. Geophys., 24, 3329–3341, 2006

3332 M. A. Cervera and R. M. Thomas: Equatorial ionospheric irregularities
−1 0 1 2 30
0.05
0.1
0.15
Phase spectral index, p
Pro
babi
lity
dens
ity
(a)
2 2.5 3 3.5 40
0.05
0.1
0.15
Phase spectral index, p
Pro
babi
lity
dens
ity
(b)
Fig. 2. Probability density distribution ofp as measured by the ISM(a) and as calculated by Eq.3 (b). The mode of the distribution inpanel (b) is 2.75 and the median is 2.77. Data are from September2000.
wherezr is the reduced height:
zr=z1z2
z1+z2, (8)
with z1 andz2 the vertical distances from the observer andsource to the phase screen
An expression equivalent to Eq. (5) which relates the phasespectral strengthT to Cs may also be derived:
T =r2e λ2CsLG secθ
[ √π0(ν)
(2π)2ν+10(ν+0.5)
]V 2ν−1
e , (9)
whereG is a geometrical parameter which likeF is depen-dent on the geometry of the irregularities. The quantityVe
is the effective velocity of the irregularities which is the scanvelocity modified to account for the effect that the anisotropyof the irregularities has on the conversion from the spatial(structure) to temporal (scintillation) domain. The scan ve-locity is the velocity relative to the irregularities of the pointwhere the radio path cuts the phase screen. Thus,Ve is de-pendent on the drift velocity of the irregularities, the velocityof receiver and transmitter, and the shape and orientation ofthe irregularities.
Previous researchers have used the height integrated irreg-ularity strength defined at a scale size of 1 km,CkL, to de-
scribe the irregularities (e.g.Secan et al., 1995) and it is re-lated toCs as follows:
CkL=1000(2ν+1)Cs L . (10)
This formulation has the advantage that the layer thickness isnot required to be known. We follow this convention.
4 Data processing
The theory outlined above requires us to assume a height atwhich the phase screen is to be placed. Previous researchers(Rino and Fremouw, 1977; Rino, 1979; Fremouw, 1980; Se-can et al., 1995) have used 350 km and we also use thisheight. The shape and orientation of the irregularities is alsorequired; we have assumed field aligned rods. Finally wenote that the disadvantage of this theory is that informationabout the vertical structure of the irregularities is not ob-tained.
A 15◦ elevation mask is first applied to the 1 minute res-olution S4 data and thenCkL calculated from Eq. (5), (6)and (10) in conjunction with Eq.3). We do not use Eq. (9)to calculate an alternative value forCkL as we have no wayof measuring the drift speed of the irregularities, henceVe
is unknown. For each resulting datum, the geographical lat-itude and longitude are calculated (assuming spherical Earthgeometry) based on the recorded elevation and azimuth ofthe satellite and the height of the phase screen, and may beregarded as the position of the ionospheric penetration point(IPP) of the satellite–receiver link. The local solar time atthe IPP is calculated for each datum from the recorded UTCtime stamp.
CkL data from each month are binned according to thelocal solar time (1/2 h bins) and geomagnetic dip angle(2 degree bins) at the IPP. We use magnetic dip rather thanmagnetic latitude as dip is an actual magnetic field quan-tity whereas magnetic latitude relies on a model (e.g. off-set dipole) to define it. As the irregularities are geomagnet-ically controlled we consider that it is better to use the realfield (i.e. magnetic dip) to bin the data. For reference, in theSouth-East Asian region, near the anomaly crests, the mag-netic latitude is approximately half the dip angle. The slantS4 data used to calculateCkL may also be binned in thismanner which allows us to examine exactly where the scin-tillation activity is observed to originate from. Figure3 dis-plays the the upper decile slant S4 index at Pare Pare duringSeptember 2000. The peak activity is equator-ward of theanomaly crest which is not surprising given that poleward ofthe anomaly the scintillation activity drops off rapidly.
Figure 4 displays upper decileCkL observed from ParePare during September 2000 using calculated values (top)and a fixed value (bottom) forp. The mode of the probabil-ity density distribution forp (2.75) was chosen for the fixedvalue. We discuss this result in detail in the next section.Here we limit the discussion to two points. The first thing
Ann. Geophys., 24, 3329–3341, 2006 www.ann-geophys.net/24/3329/2006/

M. A. Cervera and R. M. Thomas: Equatorial ionospheric irregularities 3333
Time post sunset at IPP (hours)
Dip
ang
le (
degr
ees)
Upper decile S4 (ISM)
Site: Pare Pare, Sep 2000
0 1 2 3 4 5 6 7 8 9
−40
−35
−30
−25
−20
−15
−10
S4 in
dex
0.1
0.2
0.3
0.4
0.5
0.6
0.7
0.8
Fig. 3. Upper decile slant S4 index at Pare Pare during September2000.
to note is the effect of the geometrical corrections on the ge-ographical distribution of the data vis-a-vis Fig.3: the peakhas moved southward as expected. Secondly a comparisonof the top and bottom panels shows that there are only minordifferences between the two results. Thus, we conclude thatwhen the phase data are unusable (e.g. due to contaminationby noise), the employment of a fixed representative value forp is a viable alternative.
We have assumed that there is a high degree of correlationof scintillation occurrence over longitude, not only across thefield of view at each site, but also over the region in general.This is validated by the results ofThomas et al.(2001) andis due to the very small magnetic declination angle over theregion.
5 Results
We present results from two equinoctial sunspot maximummonths: September 2000 (Fig.5) and March 2001 (Fig.6).In each figure upper decileCkL is displayed as a function oftime post sunset,tpss, at the IPP and geomagnetic dip anglefor the 3 aforementioned sites. All the results displayed herewere produced usingp calculated from Eq. (3).
The following points are noted:
1. Gross features are as expected with peaks in the activitynear the anomaly crests and a reduction at the magneticequator.
2. Irregularity activity starts attpss≈1.5− 2 h and finishesat tpss ≈ 5.5 − 7 h, depending on site and season.
3. Peak activity occurs at magnetic dips of≈ −27◦ and+27◦ (geomagnetic latitudes –12.5◦ and +12.5◦; geo-graphic latitudes –4.3◦ and +20.3◦).
Time post sunset at IPP (hours)
Dip
ang
le (
degr
ees)
Upper decile CkL
Site: Pare Pare, Sep 2000
0 1 2 3 4 5 6 7 8 9
−40
−35
−30
−25
−20
−15
−10
log(
CkL)
32.5
33
33.5
34
34.5
35
35.5
Time post sunset at IPP (hours)
Dip
ang
le (
degr
ees)
Upper decile CkL
Site: Pare Pare, Sep 2000
0 1 2 3 4 5 6 7 8 9
−40
−35
−30
−25
−20
−15
−10
log(
CkL)
32.5
33
33.5
34
34.5
35
35.5
Fig. 4. Upper decileCkL, September 2000, at Pare Pare. Thetop panel displays results usingp calculated from Eq. (3) while thebottom panel a fixed value forp of 2.75
4. The irregularities at the northern anomaly (NA) persistlonger (about 1–1.5 h) into the night than at the southernanomaly (SA) during the September equinox.
5. During the March equinox, the northern anomaly activ-ity cuts off ∼1.0 h earlier than during September. Thisbehaviour is not noted at the southern anomaly.
6. Southern and northern anomaly activity as a function oftpss differ with the southern anomaly activity occurringat higher latitudes with increasingtpss. This behaviouris not noted at the northern anomaly. It is observed atboth the vernal and autumnal equinoxes.
7. The Marak Parak results are inconsistent with the SAand NA station results where they overlap. In addition asingle peak is observed near the magnetic equator ratherthan an expected trough with increasing activity withincreasing latitude north and south.
www.ann-geophys.net/24/3329/2006/ Ann. Geophys., 24, 3329–3341, 2006

3334 M. A. Cervera and R. M. Thomas: Equatorial ionospheric irregularities
Time post sunset at IPP (hours)
Dip
ang
le (
degr
ees)
Upper decile CkL
Site: Fang / Chiang Rai, Sep 2000
0 1 2 3 4 5 6 7 8 9
10
15
20
25
30
35
40
log(
CkL)
32.5
33
33.5
34
34.5
35
35.5
Time post sunset at IPP (hours)
Dip
ang
le (
degr
ees)
Upper decile CkL
Site: Marak Parak, Sep 2000
0 1 2 3 4 5 6 7 8 9−25
−20
−15
−10
−5
0
5
10
log(
CkL)
32.5
33
33.5
34
34.5
35
35.5
Time post sunset at IPP (hours)
Dip
ang
le (
degr
ees)
Upper decile CkL
Site: Pare Pare, Sep 2000
0 1 2 3 4 5 6 7 8 9
−40
−35
−30
−25
−20
−15
−10
log(
CkL)
32.5
33
33.5
34
34.5
35
35.5
Fig. 5. Upper decileCkL, September 2000, at Chiang-Rai (top),Marak Parak (middle) and Pare Pare (bottom). The dashed line in-dicates the magnetic equator.
Time post sunset at IPP (hours)
Dip
ang
le (
degr
ees)
Upper decile CkL
Site: Fang / Chiang Rai, Mar 2001
0 1 2 3 4 5 6 7 8 9
10
15
20
25
30
35
40
log(
CkL)
32.5
33
33.5
34
34.5
35
35.5
Time post sunset at IPP (hours)
Dip
ang
le (
degr
ees)
Upper decile CkL
Site: Marak Parak, Mar 2001
0 1 2 3 4 5 6 7 8 9
−20
−15
−10
−5
0
5
10
15
log(
CkL)
32.5
33
33.5
34
34.5
35
35.5
Time post sunset at IPP (hours)
Dip
ang
le (
degr
ees)
Upper decile CkL
Site: Pare Pare, Mar 2001
0 1 2 3 4 5 6 7 8 9
−40
−35
−30
−25
−20
−15
−10
log(
CkL)
32.5
33
33.5
34
34.5
35
35.5
Fig. 6. Upper decileCkL, March 2001, at Chiang-Rai (top), MarakParak (middle) and Pare Pare (bottom). The dashed line indicatesthe magnetic equator.
Ann. Geophys., 24, 3329–3341, 2006 www.ann-geophys.net/24/3329/2006/

M. A. Cervera and R. M. Thomas: Equatorial ionospheric irregularities 3335
We discuss these points below.
5.1 Latitudinal position of irregularity activity
While the first two points above are expected from the knownclimatology of scintillation at L-band frequencies (Aaronsand Basu, 1994; Basu et al., 1980), the third point, at firstimpression, seems to indicate that the peak activity is biasedequator-ward from the anomaly crests by 2◦–3◦ in magneticlatitude. However, this is not the case as the anomaly crestsmove equator-ward after the passage of the sunset terminatoras displayed in Fig.7. This figure displays foF2 generatedby the International Reference Ionosphere (IRI90) (Bilitza,1990). Clearly, not only does the strength of the anoma-lies decrease post sunset, they also move equator-ward. Infact at the time when activity level of the irregularities max-imises (∼20:30 LT), the latitude of the peaks in irregularityactivity and the background ionosphere coincide at the north-ern anomaly while at the southern anomaly the backgroundionosphere is even further equator-ward than our results. Wedo not infer anything from the latter point as the ionosphereused in the comparison is that from a model (albeit empiri-cally derived from real data) rather than a real ionosphere.
The reason for the anomaly crests moving equator-wardpost sunset is probably due to recombination processes pre-venting the vertically moving plasma at the magnetic equatorfrom reaching as high an altitude than during the day. Thus,when the plasma (and also the irregularities) map down themagnetic field lines they do not travel as far from the equatoras it would otherwise do during the day.
5.2 Variability of irregularity temporal behaviour
The behaviour noted by points 4 and 5 could be due to vari-ability of either (1) the irregularity seeding mechanism or (2)the background ionosphere itself. We consider each of thesepossibilities in turn.
5.2.1 Temporal variability of irregularity seeding
Tropical convection is one of the most important mechanismsfor the generation of non-orographic gravity waves (Dhakaet al., 2001, 2003) which may subsequently seed ionosphericirregularities when they propagate up to the F region. Vincent(private communication, 2005) indicates that gravity waveswith horizontal scales of 400 km are important for the seed-ing of irregularities in the ionosphere and they take∼1 h topropagate from the ground to ionospheric heights. The obser-vations ofKelley et al.(1981) andNicolls and Kelley(2005)show strong evidence for the seeding of ionospheric irregu-larities by gravity waves with horizontal scales of∼600 km.
The irregularity generating region (which is at the mag-netic equator) for the Chiang Rai (north anomaly) data isover land near a moderately large mountain in southern Thai-land (Khao Luang, 1786 m). However, the irregularity gen-erating region for the Pare Pare (south anomaly) data is in
Geo
grap
hic
Latit
ude
(deg
rees
)
Local Solar Time (hours)
September 2000
8 12 16 20 0 4
−20
−10
0
10
20
30
Geo
grap
hic
Latit
ude
(deg
rees
)Local Solar Time (hours)
March 2001
8 12 16 20 0 4
−20
−10
0
10
20
30 f 0F2
(MH
z)
4
6
8
10
12
14
Fig. 7. Critical frequency of the F2 layer at the 110◦ meridian asa function of time and geographic latitude generated by IRI90. Thedotted line indicates the time when the peak irregularity activityoccurs while the dashed line indicates local midnight
the Sulu Sea. Atmospheric convection is stronger over landthan sea (Soden, 2000; Yang and Slingo, 2001; Tian et al.,2004). Furthermore, continental convection peaks in theearly evening (∼17:00-22:00 LST) whereas oceanic convec-tion peaks in the early morning (∼06:00-09:00 LST). Thiscould explain the observed later cutoff of ionospheric irregu-larities at Chiang Rai than at Pare Pare during the Septemberequinox; the convection induced gravity waves would occurlater into the night over land than over sea. Figure8 displaysthe mean deep convection activity (DCA) index for the twoirregularity generating regions during March and Septem-ber. The DCA was derived from the Cloud Archive UserService (CLAUS) archive of global brightness temperaturesfrom 1989 to 1991 employing the same methodology asYangand Slingo(2001). The CLAUS archive is based on the Inter-national Satellite Cloud Climatology Project (ISCCP) levelB3 data (Rossow et al., 1997). We acknowledge that theCLAUS data is not contemporary with our scintillation data.However, as we are only examining climatology we feel thisis not invalid given that the data are from similar periods inthe solar cycle. Figure8 shows a strong peak in the postsunset convection activity at the Chiang-Rai irregularity gen-eration region during September which is absent in the ParePare generation region. This is consistent with the discus-sion in the previous paragraph. During the March equinoxlow convection activity in both the regions of interest is ob-
www.ann-geophys.net/24/3329/2006/ Ann. Geophys., 24, 3329–3341, 2006

3336 M. A. Cervera and R. M. Thomas: Equatorial ionospheric irregularities
Fig. 8. Mean deep convection activity (DCA) index at(a) theChiang-Rai and(b) the Pare Pare irregularity generating regions forSeptember (solid line) and March (dashed line).
served and this may be a possible explanation of the lack oflate scintillation activity at either of sites.
5.2.2 Temporal variability of the anomalies’ cessationtimes
We now consider the latter mechanism: variability of thebackground ionosphere. Figure7 shows that IRI90 indicatesthe northern anomaly holds up well past local midnight and∼2 h later into the night than the southern anomaly duringthe September equinox. However, during March this dis-crepancy is much reduced with the southern anomaly lastinglonger than during September while the northern anomalyfinishes earlier. While IRI is only a model, it is empiricallybased and as such it captures the climatological behaviourof the ionosphere. The variability of the ionosphere as mod-eled by IRI at the anomalies during the two equinoxes is inline with the noted irregularity durations of activity at bothseasons and anomalies and thus is a possible explanation forit.
5.2.3 Discussion
Whilst acknowledging the caveats and the preliminary natureof the above analyses, we feel that both hypotheses presentedhere are plausible explanations for the variability of the ob-served irregularity temporal behaviour. Indeed it is likely
that both mechanisms play a role. Further investigation iswarranted, and to this end additional detailed observations ofirregularity activity together with measurements of the back-ground ionosphere, gravity wave activity and convection arerequired.
5.3 Asymmetric irregularity behaviour at the anomalies
The penultimate point is interesting and while we do notfully understand the cause of the different latitude vs.tpssbehaviour between the two anomaly regions, we posit thefollowing possible explanation.
The neutral winds are the driving mechanism of theSq
current system which gives rise to the eastward electric fieldin the E region. Over the geomagnetic equator the eastwardconductivity takes the Cowling value due to the horizon-tal electric field and the vertical limitation of the conduct-ing layer. Consequently the so-called equatorial electrojet ismanifest and it in turn a causes an enhanced eastward elec-tric field. This E-region neutral wind dynamo, which drivesthe zonal eastward electric field, gives rise to a verticalE×B
drift. Away from the geomagnetic equator, the Hall currentleakage means that the eastward conductivity rapidly dropsto the Pedersen value and thus the eastward electric field ismuch weaker. Consequently theE×B drift is much weakerand in addition is no longer vertical. However, it is not un-reasonable to assume that it would still affect the motion ofthe plasma and irregularities to a small degree as they prop-agate down the field lines. The neutral winds are a modera-tor of the strength of the eastward electric field and as theyare not symmetrical about the magnetic equator any residualE×B drift affecting the motion of plasma and irregularitieswill also not be symmetrical. This may give rise to differentbehaviour at the two anomalies.
In order to verify our hypothesis detailed observations ofthe diurnal variation of the zonal electric field as well as thedynamics of the neutral wind at several latitudes in the regionare required.
5.4 Limitations of thin phase screen theory
The last point we listed at the start of this section is impor-tant and we believe it is an indicator of the limitations ofapplying thin phase screen theory to represent irregularitieswhich have a vertical structure. Physical models of irregu-larity formation (e.g.Keskinen et al., 2003) clearly show thatthin phase screen models need to be updated.
Figure9 displays the upper decile slant S4 at Marak Parakduring September 2000. We observe, as expected, that thescintillation activity is concentrated away from the geomag-netic equator where a trough in the activity level is known tooccur.
When the theory is applied to calculateCkL we expectthe activity level to rise at the geomagnetic equator (i.e. thetrough become shallower) as the geometrical effects on the
Ann. Geophys., 24, 3329–3341, 2006 www.ann-geophys.net/24/3329/2006/

M. A. Cervera and R. M. Thomas: Equatorial ionospheric irregularities 3337
Time post sunset at IPP (hours)
Dip
ang
le (
degr
ees)
Upper decile S4 (ISM)
Site: Marak Parak, Sep 2000
0 1 2 3 4 5 6 7 8 9−25
−20
−15
−10
−5
0
5
10
S4 in
dex
0.1
0.2
0.3
0.4
0.5
0.6
0.7
0.8
Fig. 9. Upper decile slant S4 index at Marak Parak during Septem-ber 2000. The dashed line indicates the magnetic equator.
large off-zenith angle paths are corrected. However, it is clearfrom a comparison of Fig.9 with the Marak ParakCkL datadisplayed in Fig.5 that the theory has over-compensated forthe geometrical effects and furthermore the over-correctionbecomes progressively worse with increasing off zenith an-gle.
5.4.1 Large off-zenith angle issues
The quantities from Eq. (5) which affectCkL as a functionof ray elevation are the Fresnel filter factor,F , andZ sec(θ).Figure10 (top) displaysF as a function of ray elevation atMarak Parak. Examination of this figure shows that peaksoccur at∼12◦ South and∼10◦ North where the rays are per-pendicular to the magnetic field. At these ray elevations thereduction factor applied toCkL is a maximum. However, thevariation ofF with ray elevation is not great and it is notenough to explain the observed drop inCkL activity for lowelevation rays.
In Fig. 10 (bottom) we examineZ sec(θ). At high ele-vations the reduction factor is small e.g. at 45◦ (assumingall else is equal)CkL is reduced to 74.6% of its zenithalvalue. However, as the elevation decreases to 30◦ and fur-ther to 15◦ the effect on the calculatedCkL is to reduce itto 17.6% and 1.9% respectively. ClearlyZ sec(θ) has a largeeffect on low elevation rays and is the main reason for the cal-culated lowCkL activity at low elevations at Marak Parak.However,Z sec(θ) is site independent, thus the question israised why similar behaviour at Pare Pare and Chiang-Rai isnot observed. Examination of Fig.11 helps to resolve thisquestion. In this figure we see that whilst at Marak Parak thelow elevation (15◦) rays to the North and South traverse theanomaly regions with concomitant high levels of scintilla-tion (see Fig.9), at Pare Pare these rays miss the southernanomaly region. The south bound ray traverses the iono-
10S 30S 50S 70S 90 70N 50N 30N 10N
0.6
0.8
1
Ray elevation (degrees)
Fre
snel
filte
r fa
ctor
, F
10S 30S 50S 70S 90 70N 50N 30N 10N0
100
200
300
Ray elevation (degrees)
Z s
ec(θ
)Fig. 10. Fresnel filter factor (top) andZ sec(θ) (bottom) as a func-tion of ray elevation at Marak Parak. The ray azimuth was fixed ateither 0◦ or 180◦ and is indicated by the ordinate tick suffixes (“N”or “S” respectively).F has been calculated for isotropic irregular-ities (solid line) and field aligned rods with axial ratios (parallel tothe magnetic field) of 2 (dotted), 5 (dashed-dot) and 50 (dashed).
Geographic Latitude (degrees)
Hei
ght (
km)
−20 −10 0 10 20 30
100
200
300
400
500
600
700
800
900
1000
Pla
sma
freq
uenc
y (M
Hz)
0
2
4
6
8
10
12
Fig. 11. IRI90 derived plasma frequency as a function of geo-graphic latitude and height. The solid lines represent north andsouth bound rays with elevations of 15◦ (thick) and 30◦ (thin) orig-inating from Pare Pare while the dashed lines are similar rays orig-inating from Marak Parak. The ray paths appear curved due to therepresentation of curved Earth geometry in a rectilinear coordinatesystem. The dotted line indicates the geomagnetic equator.
sphere so far poleward of the anomaly that scintillation isnot observed (see Fig.3) while the north bound ray traversesthe ionosphere near the magnetic equator where scintillationis much reduced in severity. The effect ofZ sec(θ) on CkL
calculated from these rays is either non-existent (south bound
www.ann-geophys.net/24/3329/2006/ Ann. Geophys., 24, 3329–3341, 2006

3338 M. A. Cervera and R. M. Thomas: Equatorial ionospheric irregularities
Time post sunset at IPP (hours)
Dip
ang
le (
degr
ees)
Upper decile CkL
0 1 2 3 4 5 6 7 8 9
−30
−20
−10
0
10
20
30
log(
CkL)
32.5
33
33.5
34
34.5
35
35.5
Fig. 12. Upper decileCkL combined from three sites duringSeptember 2000. Dashed line indicates magnetic equator. A 30◦
elevation mask was applied to the raw data.
ray) or simply enhances the drop in activity near the equator(north bound ray). Thus, the effect is not obvious at Pare Parewhere it is in line with the existing latitudinal variation unlikeat Marak Parak. We have not displayed rays from Chiang-Rai in Fig.11, however, from symmetry the same argumentapplies.
Turning our attention to the 30◦ rays in Fig.11we observethat the north bound ray from Pare Pare intersects the southbound ray from Marak Parak near the height of the phasescreen. It is interesting to note thatCkL data derived fromthese rays (occurring at∼16◦ N at Pare Pare and∼15◦ N atMarak Parak) are in close agreement. This together with themuch reduced effect ofZ sec(θ) at this elevation suggeststhat 30◦ is a more appropriate elevation mask to apply to thedata. Since WBMOD employs the same phase screen theory,these observations suggest that caution should be exercisedwhen using this model for low elevation receiver–satellitelinks.
With the above in mind we reprocessed the September2000 data using a 30◦ elevation mask. As theCkL resultsfor the three sites now do not overlap we display them as acombined plot in Fig.12. We observe that while the situationhas improved there are still problems at the interface of theMarak Parak and Pare Pare data. The southern most MarakParak data holds up while the northern most Pare Pare datarapidly declines which together seemingly indicates an extrasmall peak in activity. Needless to say, we do not believe thisand we investigate it below in Sect.5.4.2as a possible issue
with the height of the phase screen.
Another interesting point to note is that the NorthernAnomaly activity now extends further poleward. This isprobably due to the exclusion of the low elevation datawhich had its calculatedCkL activity suppressed by the over-correction problem discussed above. Thus, we regard thisplot to be a more accurate representation of irregularity ac-tivity.
5.4.2 Phase screen height issues
It is well known that the ionospheric height varies spatiallyto a large degree in the equatorial region and Fig.11 dis-plays this clearly with the ionosphere attaining its maximumheight at the magnetic equator. Also apparent in this plotis that the 30◦ elevation south-bound ray from Marak Paraktraverses the southern anomaly region. Thus, the apparentanomalous peak noted in Fig.12 is probably due to scintil-lation activity from the southern anomaly observed by theMarak Parak ISM which has been mapped to a latitude toofar equator-ward. This incorrect mapping is due to the phasescreen being placed at too low an altitude.
It is beyond the scope of this paper to include an exhaustiveinvestigation on the phase screen height. However, we haverepeated our analysis with a variable height phase screen. Foreach satellite–receiver link at every 1 minute epoch that wehave data, the phase screen is placed at that height where theplasma density, as given by IRI90, is a maximum. There isnow some overlap of the Marak Parak and Pare Pare data. Inthese regions the average value is taken. The result is dis-played in Fig.13 and we see an improvement in the latitu-dinal distribution of irregularity activity equator-ward of theanomaly regions. Figure13 suggests that the use of a fixedphase screen height is not appropriate in the equatorial re-gion and that models such as WBMOD, which rely on phasescreens, might be improved by including the ability to use avariable height phase screen.
5.5 IrregularityCkL probability density function
Finally in Fig. 14 we examine the probability density func-tion (PDF) of CkL at Pare Pare at the peak activity (dip= −27◦, tpss=3.0 h) and at two later times (tpss=5.0 h andtpss=7.0 h). Note the bi-modal nature of the PDF in Fig.14a.This is as reported bySecan et al.(1995). However, later inFig. 14b when the scintillation activity is lower, the strengthof the upper peak is weaker relative to the lower peak. Fi-nally, the upper peak is not in evidence at all in Fig.14cwhen scintillation activity has finished. Thus, we interpretthe lower peak of the PDF of our data as that due to noise,whether internal or external to the system, whereas the upperpeak is interpreted as due to scintillation activity. The lowercomponent reported bySecan et al.(1995) could be due tounderlying irregularities at scale sizes which affect VHF and
Ann. Geophys., 24, 3329–3341, 2006 www.ann-geophys.net/24/3329/2006/

M. A. Cervera and R. M. Thomas: Equatorial ionospheric irregularities 3339
Time post sunset at IPP (hours)
Dip
ang
le (
degr
ees)
Upper decile CkL
0 1 2 3 4 5 6 7 8 9
−30
−20
−10
0
10
20
30
log(
CkL)
32.5
33
33.5
34
34.5
35
35.5
Fig. 13. As for Fig. 12 except hereCkL was calculated using avariable height phase screen. See text for details.
UHF signals but do not develop sufficiently to have an effecton GPS signals at L-band.
When the phase screen height issues discussed inSect.5.4.2have been fully resolved then the parametrisationof the CkL PDF as a function of magnetic dip angle,tpss,season and solar cycle will yield a climatological model ofirregularities for the South–East Asian region.
6 Conclusions
Phase screen theory has been used to analyse scintillation ontrans-ionospheric GPS signals. We have noted limitations ofthis technique: treating ionospheric irregularities as a thinphase screen ignores their inherent vertical structure and thecalculated irregularity strength become less reliable with in-creasing ray-path off-zenith angle. In addition we noted thereis some question as to a suitable phase screen altitude. Never-the-less, with appropriate care, this technique yields usefulinsights into equatorial irregularity morphology.
We noted differences in the morphology of the irregular-ity activity at the two anomalies. Firstly, the activity dura-tion varied with season.This could have been due to eitherseasonal variations in the background ionosphere or in theseeding mechanism. The latter was posited as being due toseasonal variations in tropical convection. Secondly, differ-ent latitudinal–temporal behaviour at the two anomaly re-gions was observed which we hypothesised as possibly be-ing caused by the neutral winds generating eastward electric
32 33 34 35 360
0.1
0.2
0.3
log(CkL)
Pro
babi
lity
dens
ity (a)
32 33 34 35 360
0.1
0.2
0.3
log(CkL)
Pro
babi
lity
dens
ity (b)
32 33 34 35 360
0.1
0.2
0.3
log(CkL)
Pro
babi
lity
dens
ity (c)
Fig. 14. CkL PDF from Pare Pare at dip =−27◦ andtpss=3.0 h (a)and later attpss=5.0 h (b) andtpss=7.0 h (c).
fields asymmetric about the geomagnetic equator. Detailedobservations of irregularity activity together with measure-ments of the background ionosphere, gravity wave activity,convection, zonal electric field and the dynamics of the neu-tral wind at several latitudes in the region are required to fullyunderstand the morphology of equatorial irregularity activityand to confirm or reject the above theories.
We intend to use our data to climatologically charac-terise ionospheric irregularities in the South-East Asian re-gion more precisely than has been hitherto achieved. Thiswill allow models which rely on the irregularity strength tobe improved in the region. Ultimately we require the iono-spheric irregularities to be fully characterised in three dimen-sions. This will allow us to employ raytacing techniques tomodel the Doppler spread induced on HF signals (e.g. com-munications links, Doppler ionospheric sounders, HF radar)traversing the disturbed ionosphere (Coleman, 1996).
Other techniques such as tomography of the turbulentionosphere (e.g.Kunitsyn and Tereshchenko, 1992b,a), or amultiple phase screen approach, may yield insights into thevertical structure of equatorial ionospheric irregularities. Al-ternatively, an improved scintillation theory which employs a
www.ann-geophys.net/24/3329/2006/ Ann. Geophys., 24, 3329–3341, 2006

3340 M. A. Cervera and R. M. Thomas: Equatorial ionospheric irregularities
3 dimensional structure function for the irregularities insteadof the usual 2 dimensional form of thin phase screens may berequired. The vertical profile of this 3-D structure functionis as yet unknown and further observations and experimentswith a more closely spaced chain of receivers together with3-D physical models of irregularity formation (e.g.Keskinenet al., 2003) will be required to elucidate its form.
Acknowledgements.The deep convection activity results were ob-tained using the CLAUS archive held at the British AtmosphericData Centre, produced using ISCCP source data distributed by theNASA Langley Data Center. The ISMs were loaned by K. Grovesof AFRL, Hanscom Airforce Base, US. We thank A. G. bin Ramli ofSTRIDE, Malasia; Effendy of LAPAN, Indonesia; and P. Totorongof MRDC, Thailand for the provision of sites and data collection.
Topical Editor M. Pinnock thanks M. J. Keskinen for his help inevaluating this paper.
References
Aarons, J. and Basu, S.: Ionospheric amplitude and phase fluctu-ations at the GPS frequencies, in: Proceedings of the Instituteof Navigation GPS-94, pp. 1596–1578, Institute of Navigation,Alexandria, Va., USA, 1994.
Basu, S., Basu, S., Mullen, J. P., and Bushby, A.: Long term1.5 GHz amplitude scintillation measurements at the magneticequator, Geophys. Res. Lett., 7, 259–262, 1980.
Bilitza, D.: International Reference Ionosphere 1990, NationalSpace Science Data Center (NSSDC) 90-22, Greenbelt, Mary-land, 1990.
Cervera, M. A., Thomas, R. M., Ramli, A. G., Effendy, and Groves,K. M.: Validation of WBMOD in the South–East Asian Region,Radio Sci., 36, 1559–1572, 2001.
Coleman, C. J.: A model of HF sky wave radar clutter, Radio Sci.,31, 869–875, 1996.
Dhaka, S. K., Devrajan, P. K., Shibagaki, Y., Choudhary, R. K., andFukao, S.: Indian MST radar observations of gravity wave activ-ities associated with tropical convection, J. Atmos. Terr. Phys.,63, 1631–1642, 2001.
Dhaka, S. K., Takahashi, M., Kawatani, Y., Malik, S., Shibagaki, Y.,and Fukao, S.: Observations of deep convective updrafts in trop-ical convection and their role in the generation of gravity waves,J. Met. Soc. Japan, 81, 1185–1199, 2003.
Fagundes, P. R., Sahai, Y., Batista, I. S., Abudu, M. A., Bittencourt,J. A., and Takahashi, H.: Observations of day-to-day variabilityin precursor signatures to equatorial F-region plasma depletions,Ann. Geophysicae, 17, 1053–1063, 1999.
Fremouw, E. J.: Geometrical control of the ratio of intensity andphase scintillation indicies, J. Atmos. Terr. Phys, 42, 775–782,1980.
Huang, C. O., Kelley, M. C., and Hysell, D. L.: Nonlinear Rayleigh-Taylor instabilities, atmospheric gravity waves and equatorialspread F, J. Geophys. Res., 98, 15 631–15 642, 1993.
Huang, C.-S. and Kelley, M.: Nonlinear evolution of equatorialspread-F: 1. On the role of plasma instabilities and spatial res-onance associated with gravity wave seeding, J. Geophys. Res.,101, 283–292, 1996a.
Huang, C.-S. and Kelley, M. C.: Nonlinear evolution of equatorialspread-F: 2. Gravity wave seeding of Rayleigh-Taylor insability,J. Geophys. Res., 101, 293–302, 1996b.
Hysell, D. L., Kelley, M. C., Swartz, W. E., and Woodman, R. F.:Seeding and layering of equatorial spread F by gravity waves, J.Geophys. Res., 95, 17 253–17 260, 1990.
Kelley, M. C.: The Earth’s Ionosphere, Academic Press, San Deigo,Calif., USA, p. 487 S., 1989.
Kelley, M. C. and Hysell, D. L.: Equatorial spread-F and neutralatmospheric turbulence: a review and comparative anatomy, J.Atmos. Terr. Phys., 53, 695–708, 1991.
Kelley, M. C., Larsen, M. F., LaHoz, C., and McClure, J. P.: Gravitywave initiation of equatorial spread F: A case study, J. Geophys.Res., 86, 9087–9100, 1981.
Keskinen, M. J., Ossakow, S. L., and Fejer, B. G.: Three-dimensional nonlinear evolution of equatorial ionosphericspread-F, Geophys. Res. Lett., 30, 1855, 2003.
Kunitsyn, V. E. and Tereshchenko, E. D.: Radio tomography of theionosphere, IEEE Antennas and Propagation, 34, 22–32, 1992a.
Kunitsyn, V. E. and Tereshchenko, E. D.: Determination of the tur-bulent spectrum in the ionosphere by a tomographic method, J.Atmos. Terr. Phys., 54, 1275–1282, 1992b.
Nicolls, M. J. and Kelley, M. C.: Strong evidence for the gravitywave seeding of an ionospheric plasma instability, Geophys. Res.Lett., 32, L05 108, 2005.
Rino, C. L.: A power law phase screen model for ionospheric scin-tillation: 1. Weak scatter, Radio Sci., 14, 1135–1145, 1979.
Rino, C. L. and Fremouw, E. J.: The angle dependence of singlyscattered wavefields, J. Atmos. Terr. Phys., 39, 859–868, 1977.
Rossow, W. B., Walker, A., and Roiter, M.: International CloudClimatology Project (ISCCP): Description of reduced resolutionradiance data, WTMO/TD-No. 58, 1997.
Rumsey, V. H.: Scintillations due to a concentrated layer with apower-law turbulence spectrum, Radio Sci,, 10, 107–, 1975.
Secan, J. A., Bussey, R. M., and Fremouw, E. J.: An improvedmodel of equatorial scintillation, Radio Sci., 30, 607–617, 1995.
Singh, S., Johnson, F. S., and Power, R. A.: Gravity wave seedingof equatorial plasma bubbles, J. Geophys. Res., 102, 7399–7410,1997.
Sinha, H. S. S. and Raizada, S.: Some new features of ionosphericplasma depletions over the Indian zone using all sky opticalimaging, Earth Planets Space, 52, 549–559, 2000.
Soden, B. J.: The diurnal cycle of convection, clouds, and watervapor in the tropical upper atmosphere, Geophys. Res. Lett., 27,2173–2176, 2000.
Thomas, R. M., Cervera, M. A., Eftaxiadis, K., Manurung, S. L.,Saroso, S., Effendy, Ramli, A. G., Salwa Hassan, W., Rahman,H., Dalimin, M. N., Groves, K. M., and Wang, Y.: A RegionalGPS Receiver Network for Monitoring Equatorial Scintillationand Total Electron Content, Radio Sci., 36, 1545–1557, 2001.
Thomas, R. M., Cervera, M. A., Ghaffar Ramli, A., Effendy, To-tarong, P., Groves, K. M., and Wilkinson, P. J.: Seasonal Mod-ulation of GPS performance due to equatorial scintillation, Geo-phys. Res. Lett., 31, L18 806, 2004.
Tian, B., Soden, B. J., and Wu, X.: Diurnal cycle of convection,clouds, and water vapour in the tropical upper troposphere: Satel-lites versus a general circulation model, J. Geophys. Res., 109,D10 101, doi:10.1029/2003JD004117, 2004.
Ann. Geophys., 24, 3329–3341, 2006 www.ann-geophys.net/24/3329/2006/

M. A. Cervera and R. M. Thomas: Equatorial ionospheric irregularities 3341
Tsunoda, R. T.: Control of the seasonal and longitudinal occurrenceof equatorial scintillations by the longitudinal gradient in inte-gratedE region Pedersen conductivity, J. Geophys. Res., 90,447–456, 1985.
Van Dierendonck, A. J., Klobuchar, J., and Hua, Q.: Ionosphericscintillation monitoring using commercial single frequency C/Acode receivers, in: Proceedings of the Institute of NavigationGPS-93, pp. 1333–1343, Inst. of Navig., Alexandria, Va., USA,1993.
Van Dierendonck, A. J., Hua, Q., Fenton, P., and Klobuchar, J.:Commercial ionospheric scintillation monitoring receiver devel-opment and test results, in: Proceedings of the Institute of Nav-igation GPS-96, pp. 573–582, Inst. of Navig., Alexandria, Va.,USA, 1996.
Whitehead, J. D.: Ionization disturbances caused by gravity wavesin the presence of an electrostatic field and background wind, J.Geophys. Res., 76, 238–, 1971.
Yang, G.-Y. and Slingo, J.: The diurnal cycle in the tropics, MonthlyWeather Review, 129, 784–801, 2001.
www.ann-geophys.net/24/3329/2006/ Ann. Geophys., 24, 3329–3341, 2006