Embed Size (px)
Citation preview
2
ABOUT THIS STUDY
This study, commissioned by the Greater Milwaukee Foundation, provides the first
comprehensive statistical portrait of metropolitan Milwaukee’s Latino community. Using
the best and most recent data, from a wide variety of sources, this study examines key
areas such as population growth, language use, residential segregation, income, poverty,
employment, earnings, housing, social assistance, health insurance, health indicators,
business ownership, educational attainment, K-12 enrollments, school segregation,
incarceration, political behavior, and more. With over 190 charts and tables, the study
offers a thorough, systematic overview of key data, analysis of trends, and an
unprecedented look at Latino Milwaukee in comparative and recent historical
perspective.
The lead author of the study is Marc V. Levine, professor of history, economic
development and urban studies, and director of the University of Wisconsin-Milwaukee
Center for Economic Development (CED). The CED research team included: Catherine
Madison, Shuayee Lee, Professor Paru Shah, Lisa Heuler Williams, Caitlin Taylor, and
Professor William Velez. A grant from the Greater Milwaukee Foundation provided
generous financial support for the project; additional funding for project research was
provided from the core-operating budget of CED.
CED is a unit of the College of Letters and Science at the University of Wisconsin-
Milwaukee. The College established CED in 1990 to conduct university research on key
economic development issues, and to provide technical assistance to community
organizations and units of government working to improve the Greater Milwaukee
economy. The analysis and conclusions presented in this study are solely those of CED
and do not necessarily reflect the views and opinions of the University of Wisconsin-
Milwaukee, the Greater Milwaukee Foundation, or any organizations providing financial
support to the Center.
CED strongly believes that informed public debate is vital to the development of good
public policy. The Center publishes briefing papers, detailed analyses of economic trends
and policies, and technical assistance reports on issues of applied economic development.
In these ways, as well as in conferences and public lectures sponsored by the Center, we

3
hope to contribute to public discussion and community knowledge on economic
development policy in metro Milwaukee – and beyond.
Further information about the Center and its research and activities is available at our
web site: www.ced.uwm.edu
4
TABLE OF CONTENTS Introduction 6 List of Charts and Tables 8
Demographic Trends 15
• Population Growth 15 • Cultural Generation Gap 18 • Immigration and Migration Trends 19 • Latino-White Segregation 22 • Language Use 23 • Family Structure 25 • Charts and Tables 26
Income, Poverty, Housing, and Social Assistance 69
• Income Trends 69 • Poverty 71 • Supplemental Nutrition Assistance Program Benefits 73 • Homeownership and Housing Costs 74 • Charts and Tables 75
Employment and Earnings 111
• Employment and Non-employment 111 • The Latinoisation of Urban Labor Markets 112 • A Cultural Division of Labor? 113 • Earnings 115 • Charts and Tables 117
Business Ownership 152
• Charts and Tables 154 Health and Health Care 162
• Health Insurance Coverage 162 • Health Indicators 163 • Charts and Tables 165
Education and Schooling 183
• Educational Attainment 183 • The Latinoisation of Milwaukee School Enrollments 184 • Latino Segregation in Metro Milwaukee Schools 185 • The Privatization of Latino Schooling 185 • Latino Student Achievement 186 • Charts and Tables 187

5
Incarceration Trends 209 • Charts and Tables 210
Politics 213
• Charts and Tables 214 Sources 217
6
INTRODUCTION
The Latino population in the United States has grown at a dizzying pace over the past
quarter century, remaking the demographic, economic, social and cultural fabric of cities
and metropolitan areas. In 1990, Latinos made up more than 20 percent of the population
in only 8 of the nation’s 50 largest metropolitan areas; by 2014, that total had risen to 17
of the 50 largest metros. In all but six of the 50 largest metropolitan areas, the Latino
population more than doubled between 1990-2014 (and in all six of the other metros, the
Latino population increased by more than 50 percent).
Milwaukee has been a full participant in this tectonic transformation. To be sure, the
Latino presence in Milwaukee remains less deep-seated and pervasive than in
metropolises such as Miami, New York, Houston, or Los Angeles, long established as
gateways for Latino immigration. And Latino growth here has not been nearly as
explosive as in “emerging gateway” metropolises of Atlanta, Charlotte, Nashville, or
Raleigh. Nevertheless, as this study documents, there has been an unmistakable
“Latinoisation” of Milwaukee over the past quarter century, in schools, labor markets,
and the demographic composition of the city and the region. In over 190 charts and tables
that follow, we take stock of this transformation, analyzing trends in population growth,
language use, employment, income and poverty, business ownership, housing, health
care, criminal justice, and politics, and more.
We examine the state of Latino Milwaukee from three vantage points. First, on many
indicators, we examine how Latino Milwaukee has changed over the past 15-25 years.
For example: Has Latino poverty or segregation increased or decreased? How well has
proficiency in English progressed? To what extent has a Latino business class developed
in Milwaukee? Has the health insurance coverage of Latinos increased or decreased?
Second, we compare Latino Milwaukee to other groups in metro Milwaukee, on a
broad range of indicators. We examine such questions as: How does the educational
attainment of Latinos stack up against non-Hispanic whites and African Americans in
Milwaukee? How does Latino household income or worker earnings compare to other
groups in the region? Are Latinos more or less likely than other groups to be
homeowners? Compared to other groups, are Latino workers concentrated in certain
occupations?
7
Third, we compare conditions in Latino Milwaukee to Latino communities in the 50
largest metropolitan areas in the United States. Is Latino poverty in Milwaukee higher or
lower than elsewhere? How does the rate of Latino business ownership in Milwaukee
compare to other large metropolitan areas? Are Latino schoolchildren in Milwaukee less
or more likely than their Latino counterparts elsewhere to attend segregated schools?
How does the size of Milwaukee’s “unauthorized” Latino population compare to other
metro areas? Is Latino teen pregnancy higher or lower in Milwaukee than elsewhere?
This study provides extensive and detailed data on all these questions --and many
more-- and offers an unprecedented statistical portrait of Latino Milwaukee, in
comparative and historical perspective.
Finally, to avoid any confusion, we offer two introductory technical points: definitional
and methodological. On definitions: Throughout this study, following the social science
literature as well as usage by various statistical sources, we use the terms “Latino” and
“Hispanic” interchangeably, to refer to the subject of this study, persons and communities
of “Spanish-speaking ancestry.”
Methodologically: Many of the key charts and tables in this study compare conditions
over time in the 50 largest metropolitan areas across the country. A problem for such
comparisons is that many metropolitan area boundaries have changed over time. The
Census Bureau definition of metro Atlanta of 1990, for example, includes different
counties than metro Atlanta of 2014. Therefore, to ensure “apples to apples”
comparisons, we have standardized all metropolitan area data from 1990 and 2000 to
current metropolitan area boundaries. Thus, to take one example, when a table shows
“Latino population growth in metropolitan areas between 1990-2014,” readers can be
confident that the table is revealing a genuine trend in the region and not simply an
illusion produced by changing Census Bureau definitions.
Finally, a methodological caution. Many of the charts and tables in this study rely on
data from the Census Bureau’s American Community Survey (ACS). The ACS contains
non-trivial error margins on most variables examined in this study; thus, readers are
cautioned to regard rankings, especially when metro areas’ statistics are separated by
small values, as approximations of a given region’s relative standing.
8
LIST OF CHARTS AND TABLES
Table 1: Latino Percentage of Metropolitan Area Population: 1990-2014 26 Chart 1: Percentage Growth in Latino Population: 1990-2014 27 Chart 2: Percentage Growth in Latino Population: 2000-2014 28 Table 2: Rates of Hispanic and Non-Hispanic Population Growth: 1990-2014 29 Table 3: Rates of Hispanic and Non-Hispanic Population Growth: 2000-2014 30 Chart 3: Latino Share of Net Population Growth in Largest Metros: 1990-2014 31 Chart 4: Latino Share of Net Population Growth in Largest Metros: 2000-2014 32 Table 4: Latino Population Growth in Selected Central Cities: 2000-2014 33 Table 5: Latino Population Growth in City of Milwaukee: 1990-2014 33 Chart 5: Latino and Non-Hispanic Population Change in Selected
Central Cities: 2000-2014 34 Chart 6: Percentage of Metro Area Hispanics Living in Central City: 2014 35 Chart 7: Milwaukee’s Cultural Generation Gap: 2014 36 Table 6: The Ethnolinguistic Generation Gap in Largest Metros: 2013 37 Table 7: Shrinking White Non-Hispanic Percentage of Residents Under 18
in Largest Metropolitan Areas 38 Table 8: Culture Shock I: Linguistic Generation Gap in Large Metros, 2013 39 Table 9: Culture Shock II: Growing Hispanic Percentage of Residents Under Age 18 in Large Metropolitan Areas 40 Chart 8: The Growing Cultural Generation Gap in Milwaukee: 1990-2014 41 Chart 9: Latino Share of “Over 65” and “Under 18” Population: 1990-2014 42 Chart 10: Percentage of Males in Adult Population, By Race,
Metro Milwaukee: 2014 43 Chart 11: Percentage of Metro Area Latinos Over 18 Who Are Male 44 Chart 12: Composition of Milwaukee’s Latino Community By Place of Birth and Citizenship: 2014 45 Chart 13: National Origins of Milwaukee’s Latino Population: 2014 46 Chart 14: Place of Birth for Milwaukee’s Latino Foreign-Born Population: 2010 46 Table 10: Decade of Entry of Milwaukee’s Latino Foreign-Born Population: 2010 47 Table 11: Citizenship of Milwaukee’s Latino Foreign-Born Population By Decade of Entry: 2010 47 Table 12: Decade of Entry of Milwaukee’s Latino Foreign-Born Population: 2010. City of Milwaukee, Waukesha County, And Milwaukee County Suburbs 47 Chart 15: Percentage of Latinos Who Are US Citizens, Born in the US: City of Milwaukee, Waukesha County, and Milwaukee County Suburbs: 2010 48 Chart 16: Percentage of Latinos Who Are Not US Citizens: City of Milwaukee, Waukesha County, and Milwaukee County Suburbs: 2010 48 Chart 17: Percentage of Metro Area Latinos Who Are Not Citizens 49 Chart 18: Percentage of Metro Area Latinos Over 18 Who Are Not Citizens 50
9
Chart 19: Hispanic Population Born Outside The U.S.: 2014 Percentage Entered Before 2000 51 Chart 20: Hispanic Population Born Outside The U.S.: 2014 Percentage Entered 2000 or later 52 Chart 21: Hispanic Population Born Outside The U.S.: 2014 Percentage Entered 2010 or later 53 Chart 22: Estimated Unauthorized Percentage of Foreign-Born Latinos: 2013 54 Chart 23: Estimated Unauthorized Percentage of Mexican-Born
Population in Selected Large Urban Counties: 2013 55 Chart 24: Leading Domestic Sources of Net Hispanic Migration Gains In Milwaukee County: 2006-2010 56 Chart 25: Leading Domestic Destinations For Net Hispanic Migration Losses From Milwaukee County: 2006-2010 56 Chart 26: Latino-White Segregation Rates in Largest Metro Areas: 2010 57 Table 13: Latino-White Segregation Rates in Largest Metro Areas: 1990-2010 58 Chart 27: Percentage of Limited English Speaking Latino Households: 2014 59 Table 14: Limited English Speaking Latino Household Rates in Largest Metro Areas: 1990-2014 60 Chart 28: Language Spoken At Home: Percentage of Latinos Who Speak
Only English: 2014 61 Chart 29: Language Spoken At Home: Percentage of Latinos Who Speak
English “Very Well” or “Well”: 2014 62 Chart 30: Language Spoken At Home: Percentage of Latinos Who Speak
English “Not at All”: 2014 63 Chart 31: Language Spoken at Home By Ability to Speak English: City of Milwaukee, Waukesha County, and Milwaukee County Suburbs: 2014 64 Table 15: Language Spoke at Home By Ability to Speak English: 2009-2014 65 Table 16: Language Spoke at Home By Age and By Ability to Speak English: City of Milwaukee, Waukesha County, and Milwaukee County Suburbs: 2010 65 Chart 32: Married Couple Family Percentage of Households, By Race: Metro Milwaukee: 2014 66 Chart 33: Percentage of Households, By Race, Female-Headed, No Husband, with Children: Metro Milwaukee: 2014 66 Chart 34: Married Couple Family Percentage of Latino Households: 2014 67 Chart 35: Percentage of Latino Households, Female Headed, No Husband With Children 68 Chart 36: Latino Real Median Household Income: 1989 75 Chart 37: Latino Real Median Household Income: 1999 76 Chart 38: Latino Real Median Household Income: 2014 77 Chart 39: Percent Decline in Real Household Income for Hispanics: 1999-2014 78 Chart 40: Median Latino Household Income: 2014: Adjusted for Regional Price Parities 79 Chart 41: Hispanic Household Income as Percentage of White: 2014 80 Table 17: Hispanic Household Income as Percentage of White: 1989-2014 81
10
Chart 42: Hispanic Household Income as a Percentage of White: Milwaukee and the Nation, 1979-2014 82 Chart 43: Percentage Distribution of Income Among Latino Households: Milwaukee and Selected Metro Areas: 2014 83 Chart 44: Income Distribution Among Milwaukee Households, by Race And Ethnicity: 2014 84 Chart 45: Hispanic Poverty Rates: Milwaukee and the Nation: 1979-2014 85 Chart 46: Latino Poverty Rates in 50 Largest Metro Areas: 1999 86 Chart 47: Latino Poverty Rates in 50 Largest Metro Areas: 2014 87 Table 18: Change in Latino Poverty Rates In Largest Metros: 1999-2014 88 Table 19: Latino-White Disparities in Poverty Rates: 1999 89 Table 20: Latino-White Disparities in Poverty Rates: 2014 90 Chart 48: Poverty Rates By Race and Ethnicity in Milwaukee: 2014 91 Chart 49: Percentage of Latinos Living in “Extreme Poverty” 2014 92 Chart 50: Percentage of Poor Latinos Living in Concentrated Poverty Neighborhoods: 2010-2014 93 Chart 51: Percentage of Metro Area Latinos Living in Concentrated Poverty Neighborhoods: 2010-2014 94 Table 21: Latino-White Household Income and Concentrated Poverty In Milwaukee: 2010-2014 95 Chart 52: Percentage of Children, By Race, in Poverty in Milwaukee: 2014 96 Chart 53: Percentage of Latino Children Living in Poverty: 1999 97 Chart 54: Percentage of Latino Children Living in Poverty: 2014 98 Table 22: Latino Child Poverty Rates in Largest Metro Areas: 1999-2014 99 Chart 55: The Geography of Latino Affluence and Poverty in Milwaukee: 2010-2014 100 Table 23: Percentage of Households in Milwaukee, By Race, With Food Stamps/SNAP Benefits: 2007-2014 100 Chart 56: Percentage of Latino Households With Food Stamps/SNAP
Benefits: 2007 101 Chart 57: Percentage of Latino Households With Food Stamps/SNAP
Benefits: 2014 102 Table 24: Change in Percentage of Latino Households With
Food Stamps/SNAP Benefits: 2014 103 Chart 58: Latino Homeownership Rates: 2000 104 Chart 59: Latino Homeownership Rates: 2014 105 Table 25: Percentage Change in Latino Homeownership Rates: 2000-2014 106 Table 26: Homeownership Rates By Race, Milwaukee: 2000-2014 107 Chart 60: Percentage of Latino Homeowners With High Monthly Owner Costs: 2014 108 Chart 61: Percentage of Latino Renters With High Rent Burden: 2014 109 Chart 62: Percentage of Milwaukee Homeowners, By Race, With High Monthly Owner Costs: 2014 110 Chart 63: Percentage of Milwaukee Renters, By Race, With High Rent Burden: 2014 110 Chart 64: Non-employment Rates for Young Adult Latino Males: 2014 117
11
Chart 65: Non-employment Rates for Prime Age Latino Males: 2014 118 Chart 66: Non-employment Rates for Young Adult Latino Females: 2014 119 Chart 67: Non-employment Rates for Prime Age Latino Females: 2014 120 Chart 68: Non-employment Rates, By Race, for Young Adult
Males: Metro Milwaukee, 2014 121 Chart 69: Non-employment Rates, By Race, for Prime Age Males:
Metro Milwaukee, 2014 121 Chart 70: Non-employment Rates, By Race, for Young Adult
Females: Metro Milwaukee, 2014 122 Chart 71: Non-employment Rates, By Race, for Prime Age Females:
Metro Milwaukee, 2014 122 Table 27: Non-employment Rates for Young Adult Latino Males: 1990-2014 123 Table 28: Non-employment Rates for Prime Age Latino Males: 1990-2014 124 Table 29: Non-employment Rates for Young Adult Latino Females: 1990-2014 125 Table 30: Non-employment Rates for Prime Age Latino Females: 1990-2014 126 Table 31: The Latinoisation of Young Adult Male Employment: 1990-2014 127 Table 32: The Latinoisation of Prime Age Male Employment: 1990-2014 128 Table 33: The Latinoisation of Young Adult Female Employment: 1990-2014 129 Table 34: The Latinoisation of Prime Age Female Employment: 1990-2014 130 Table 35: Employment Growth Rates for Latino and Non-Hispanic Young Adult Males in Selected Metro Areas: 1990-2014 131 Table 36: Employment Growth Rates for Latino and Non-Hispanic Prime
Age Males in Selected Metro Areas: 1990-2014 131 Table 37: Employment Growth Rates for Latino and Non-Hispanic Young Adult Females in Selected Metro Areas: 1990-2014 132 Table 38: Employment Growth Rates for Latino and Non-Hispanic Prime
Age Females in Selected Metro Areas: 1990-2014 132 Chart 72: Index of Labor Market Concentration for Latino Males: 2014: Building and Grounds Cleaning and Maintenance 133 Chart 73: Index of Labor Market Concentration for Latino Males: 2014: Construction and Extraction Occupations 134 Chart 74: Index of Labor Market Concentration for Latino Males: 2014: Production Occupations 135 Chart 75: Index of Labor Market Concentration for Latino Males: 2014: Materials Moving Occupations 136 Chart 76: Index of Labor Market Concentration for Latino Females: 2014: Food Preparation and Service Occupations 137 Chart 77: Index of Labor Market Concentration for Latino Females: 2014: Building and Grounds Cleaning and Maintenance 138 Chart 78: Index of Labor Market Concentration for Latino Females: 2014: Personal Care Service Occupations 139 Chart 79: Index of Labor Market Concentration, By Race, for Metropolitan Milwaukee Males: 2014 Building and Grounds Cleaning and Maintenance 140 Chart 80: Index of Labor Market Concentration, By Race, for Metropolitan Milwaukee Males: 2014
12
Construction and Extraction Occupations 140 Chart 81: Index of Labor Market Concentration, By Race, for Metropolitan Milwaukee Males: 2014 Production Occupations 141 Chart 82: Index of Labor Market Concentration, By Race, for Metropolitan Milwaukee Females: 2014 Building and Grounds Cleaning and Maintenance 141 Chart 83: Index of Labor Market Concentration, By Race, for Metropolitan Milwaukee Females: 2014 Personal Care Service Occupations 142 Chart 84: Earnings Distribution By Race, Ethnicity, and Citizenship: Males, Metro Milwaukee: 2006-2010 143 Chart 85: Earnings Distribution By Race, Ethnicity, and Citizenship: Females, Metro Milwaukee: 2006-2010 144 Chart 86: Earnings Distribution By Race: Male Production Workers in Metropolitan Milwaukee: 2006-2010 145 Chart 87: Percentage of Latino Male Workers Earning Under $25,000 in Selected Metropolitan Areas: 2006-2010 146 Chart 88: Percentage of Latino Female Workers Earning Under $25,000 in Selected Metropolitan Areas: 2006-2010 147 Chart 89: Percentage of Latino Male Workers Earning Under $25,000 in Selected Metropolitan Areas, By Citizenship: 2006-2010 148 Chart 90: Percentage of Latino Female Workers Earning Under $25,000 in Selected Metropolitan Areas, By Citizenship: 2006-2010 148 Chart 91: Percentage of Male Latino Workers in Metro Areas Who Are Not Citizens: 2006-2010 149 Chart 92: Percentage of Female Latino Workers in Metro Areas Who Are Not Citizens: 2006-2010 150 Table 39: The Geography of Employment, By Race, in Milwaukee: 2013 151 Table 40: Number of Hispanic-Owned Firms in Metro Areas: 2007-2012 154 Chart 93: Percentage Growth in Hispanic-Owned Firms: 2007-2012 155 Table 41: Number of Employees in Hispanic-Owned Firms in Metropolitan Areas: 2007-2012 156 Chart 94: Rate of Hispanic Business Ownership: 2007 157 Chart 95: Rate of Hispanic Business Ownership: 2012 158 Table 42: Hispanic Share of Business Ownership: 2007-2012 159 Chart 96: Employment in Hispanic-Owned Firms as Percentage of Employment in All Firms: 2012 160 Table 43: Sectoral Distribution of Businesses in Milwaukee: 2012 Hispanic-owned Firms compared to All Firms 161 Chart 97: Percentage of Persons, By Race, Ages 18-64, Without Health Insurance: Milwaukee, 2014 165 Chart 98: Percentage of Persons, By Race, Under 65, Without Health Insurance: Milwaukee, 2014 165 Table 44: Change in Percentage of Population, By Race and Age, Without Health Insurance Coverage: Milwaukee, 2009-2014 166
13
Chart 99: Percentage of Latinos Under Age 65 Without Health Insurance: 2009 167
Chart 100: Percentage of Latinos Under Age 65 Without Health Insurance: 2014 168
Table 45: Percentage of Latinos Under Age 65 Without Health Insurance: 2009-2014 169
Chart 101: Percentage of Latinos Under Age 18 Without Health Insurance: 2014 170
Table 46: Percentage of Latinos Under Age 18 Without Health Insurance: 2009-2014 171
Chart 102: Percentage of Latinos Ages 18-64 Without Health Insurance: 2014 172
Table 47: Percentage of Latinos Ages 18-64 Without Health Insurance: 2009-2014 173
Chart 103: Latino Mortality Rates from Heart Disease: 2006-2010 174 Chart 104: Mortality Rates, By Race, From Heart Disease: Milwaukee County: 2006-2010 175 Chart 105: Latino Infant Mortality Rates: 2007-2013 176 Chart 106: Infant Mortality Rates, By Race, Milwaukee and Waukesha County: 2007-2013 177 Chart 107: Births to Latino Teenage Mothers: 2009-2013 178 Chart 108: Births to Teenage Mothers, By Race, Milwaukee County: 2009-2013 179 Chart 109: Births to Teenage Mothers, By Race, Waukesha County: 2009-2013 179 Chart 110: Births to Teenage Mothers, By Race, Milwaukee County: 2009-2013 180 Chart 111: Births to Teenage Mothers, By Race, Waukesha County: 2009-2013 181 Chart 112: Low Birthweight Babies, By Race, Milwaukee County: 2009-2013 182 Chart 113: Low Birthweight Babies, By Race, Waukesha County: 2009-2013 182 Chart 114: Percentage of Population, Over 25 Years Old, With At Least High School Degree, By Race, Milwaukee: 2014 187 Chart 115: Percentage of Population, Over 25 Years Old, With At Least Bachelor’s Degree, By Race, Milwaukee: 2014 187 Table 48: Latino Educational Attainment, High School Degree: 2000-2014 188 Table 49: Latino Educational Attainment, Bachelor’s Degree: 2000-2014 189 Chart 116: Percentage of Latinos Over 25 Years Old, With At Least High School Degree: Metro Areas: 2000 190 Chart 117: Percentage of Latinos, Over 25 Years Old, With At Least Bachelor’s Degree: Metro Areas: 2000 191 Chart 118: Percentage of Latinos Over 25 Years Old, With At Least High School Degree: Metro Areas: 2014 192 Chart 119: Percentage of Latinos, Over 25 Years Old, With At Least
14
Bachelor’s Degree: Metro Areas: 2014 193 Table 50: The Latinoisation of K-12 Enrollments: Milwaukee: 1997-2014 194 Table 51: The Latinoisation of K-12 Enrollments: Metro Milwaukee, By County: 1997-2014 195 Table 52: White Non-Hispanic and Latino Public School Enrollment Trends in Metro Milwaukee: 1987-2016 196 Chart 120: The Changing Ethnic and Racial Composition of School Enrollments in the City of Milwaukee: 1987-2016 197 Chart 121: The Changing Ethnic and Racial Composition of School Enrollments in Milwaukee County Suburbs: 1987-2016 198 Chart 122: The Changing Ethnic and Racial Composition of School Enrollments in the WOW Counties: 1987-2016 199 Table 53: The Geography of Latino Public School Enrollments in Metro Milwaukee: 1987-2016 200 Chart 123: Where Latino Students Attended K-12 Public Schools in Metro Milwaukee: 1987-1988 201 Chart 124: Where Latino Students Attended K-12 Public Schools in Metro Milwaukee: 2015-2016 201 Chart 125: Latino Schoolchildren Attending Hypersegregated Schools: 2013-2014 202 Chart 126: Segregation of Latino Public Primary School Students: 2010-11 203 Table 54: Latino Students in Hypersegregated Schools, By School Types, Milwaukee: 1995-2016 204 Chart 127: Percentage of Latino Schoolchildren Enrolled in Private Schools: 2011-2012 205 Table 55: Latino Student NAEP Scores: 4th Grade Math: 2013 206 Table 56: Latino Student NAEP Scores: 8th Grade Math: 2013 206 Table 57: Latino Student NAEP Scores: 4th Grade Reading: 2013 207 Table 58: Latino Student NAEP Scores: 8th Grade Reading: 2013 207 Table 59: NAEP Average Scale Scores by Race, MPS: 2013 208 Chart 128: Incarceration Rates for Latino Males: 2010 210 Chart 129: Incarceration Rates for Latino Females: 2010 211 Table 60: Race and Male Incarceration in Wisconsin: 1970-2010 212 Table 61: Percentage of Wisconsin Males, By Age and Race, In Prison Or Under Supervision of DOC: 2013 212 Chart 130: Partisan Affiliation of Latinos in Largest Cities: 2012 214 Chart 131: Latino Voter Turnout: 2012 215 Chart 132: Latino Share of the City Electorate 216
15
DEMOGRAPHIC TRENDS
Population Growth
The explosive growth of the Latino population in the United States over the past
quarter century, fueled in large measure by surging international immigration, has
dramatically transformed the demographic face of cities and metropolitan areas across the
country. In all of the nation’s 50 largest metropolitan areas, the Latino share of the
population has increased markedly since 1990; and in some cases, especially in mid-sized
cities across the South, Hispanic population growth and the subsequent transformation of
the metropolis’ ethnic composition has been astounding. Traditional “gateway”
metropolises such as Miami, Los Angeles, New York, Houston, Dallas, Riverside, and
Chicago have continued to attract large numbers of Latinos; indeed, between 2000-2014,
these seven metropolises accounted for almost half of the total Latino population growth
in the nation’s 50 largest metropolitan areas. But now there are “emerging gateways” 1 –
places such as Atlanta, Austin, Charlotte, Las Vegas, Nashville, Orlando, Raleigh, Salt
Lake City, and Phoenix-- experiencing massive immigration and explosive growth in
their Hispanic populations. These newer “emerging gateways,” cities with tiny pre-1990
Latino populations and little historical experience with mass immigration, have registered
the highest rates of metro area Latino immigrant growth in the country over the past
quarter century. In Charlotte, for example, the Latino population in 2014 was 21 times
greater than it was in 1990, growing from approximately 11,000 to over 231,000;
Raleigh’s Latino population expanded by over 17-fold between 1990 and 2014 (from
almost 7,000 to over 129,000); and by 2014, Nashville’s Latino population (over
122,000) was over 16 times larger than it was in 1990 (just over 8,000). In short, as the
tables and charts that follow plainly reveal, it is hardly an exaggeration to talk of a
1 For a useful discussion and typology of metropolitan immigrant gateways, see Audrey Singer, “Metropolitan Immigrant Gateways Revisited, 2014,” Brooking Institution Paper, December 1, 2015. Accessed at: http://www.brookings.edu/research/papers/2015/12/01-metropolitan-immigrant-gateways-revisited-singer; and Audrey Singer, “The Rise of New Immigrant Gateways,” Brookings Institution Paper, February 2004. Accessed at: http://www.brookings.edu/research/reports/2004/02/demographics-singer.
16
demographic “Latinoisation” of an urban and suburban America – a core element in what
noted demographer William H. Frey has called America’s “diversity explosion.”2
Milwaukee’s Latino community has grown rapidly as well over the past 25 years,
though not at the staggering pace of the emerging gateway metropolises. The Latino
population in metro Milwaukee has more than tripled since 1990, and now totals over
160,000, or slightly more than 10 percent of the region’s total population (up from 3.6
percent in 1990). In numbers, Milwaukee’s Latino community is comparable in size to
metro areas such as Nashville (122,222); Indianapolis (125,644); Raleigh (129,007);
Baltimore (147,928); Oklahoma City (163,578); Hartford (169,558); Kansas City
(180,321); Detroit (180,919); Providence (186,596); Minneapolis (196,495); and Salt
Lake City (201,578). As a share of the overall metro area population, Latino Milwaukee
is comparable to Kansas City (8.7 percent); Philadelphia (8.8 percent); Charlotte (9.7
percent); Boston (10.2 percent); Atlanta (10.4 percent); Raleigh (10.4 percent); Portland
(11.5 percent); and Providence (11.6 percent).
On most indicators of Latino demographic change arrayed in the tables and charts
below, Milwaukee ranks toward the middle of the nation’s 50 largest metropolitan areas,
but there is variation, and on some measures Milwaukee stands out as one of the “top” or
“bottom” regions. The key findings on Latino population growth:
• (Table 1): Latinos grew from 3.6 percent of metro Milwaukee’s population in
1990 to 10.2 percent in 2014. In both 1990 and 2014, Milwaukee ranked 27th
among the nation’s 50 largest metros in the Latino percentage of the overall
population.
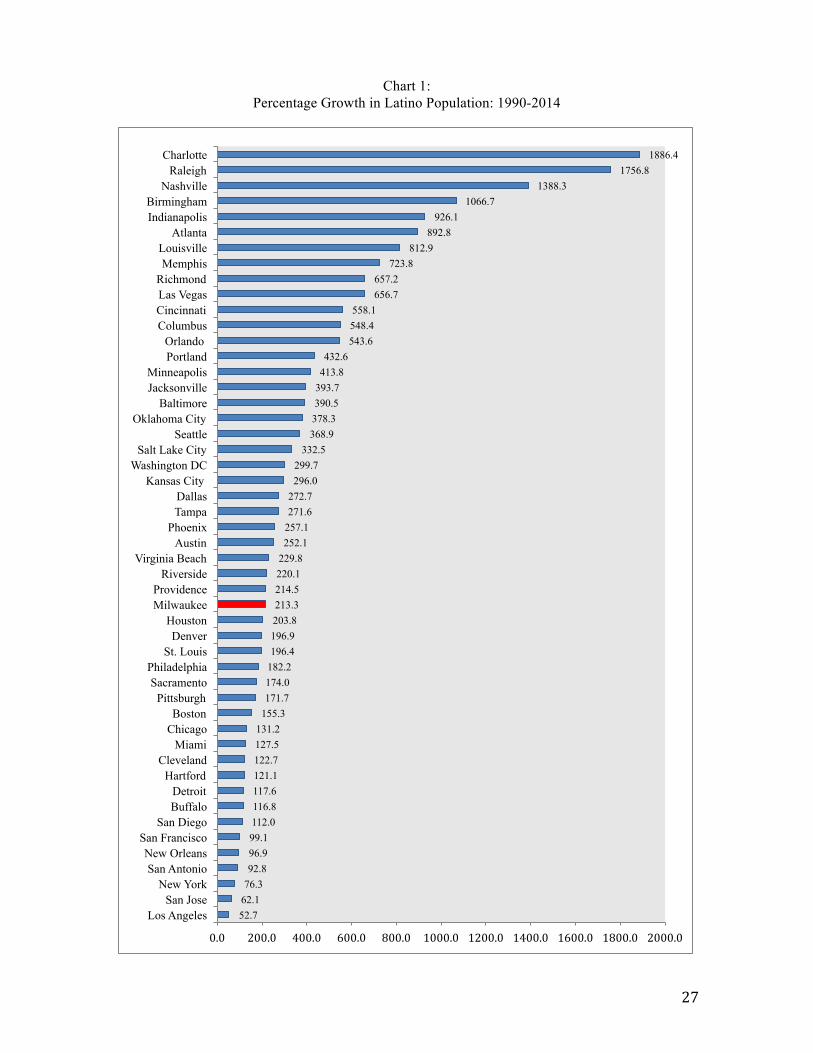
• (Charts 1 and 2): Milwaukee’s Latino population grew by 213.3 percent
between 1990-2014, a rapid rate of increase but one which nevertheless had
Milwaukee ranking 30th among the largest metros on this indicator (and well
behind the staggeringly high growth rates posted in metros such as Charlotte,
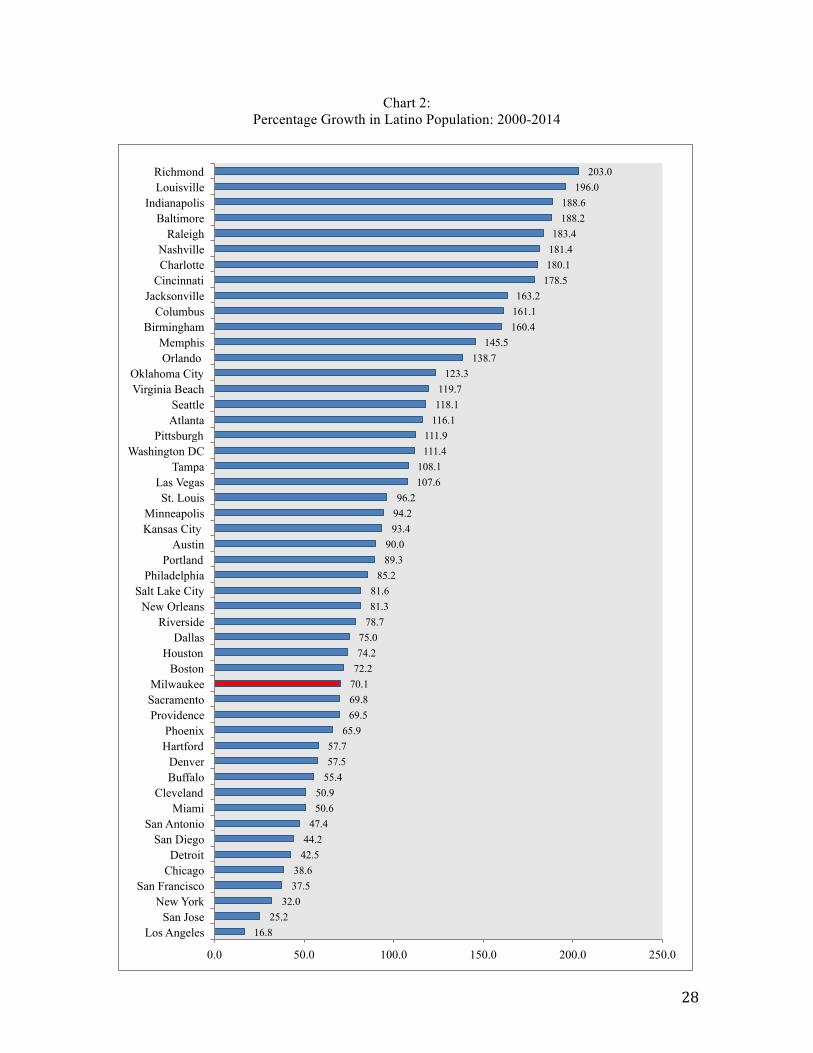
Raleigh, Nashville, Birmingham, Indianapolis, and Atlanta). Since 2000,
Milwaukee’s Latino population has grown by 70.1 percent, ranking 34th
among the nation’s 50 biggest metropolitan areas.
2 William H. Frey, Diversity Explosion: How New Racial Demographics Are Remaking America (Washington, D.C.: Brookings Institution Press, 2014).
17
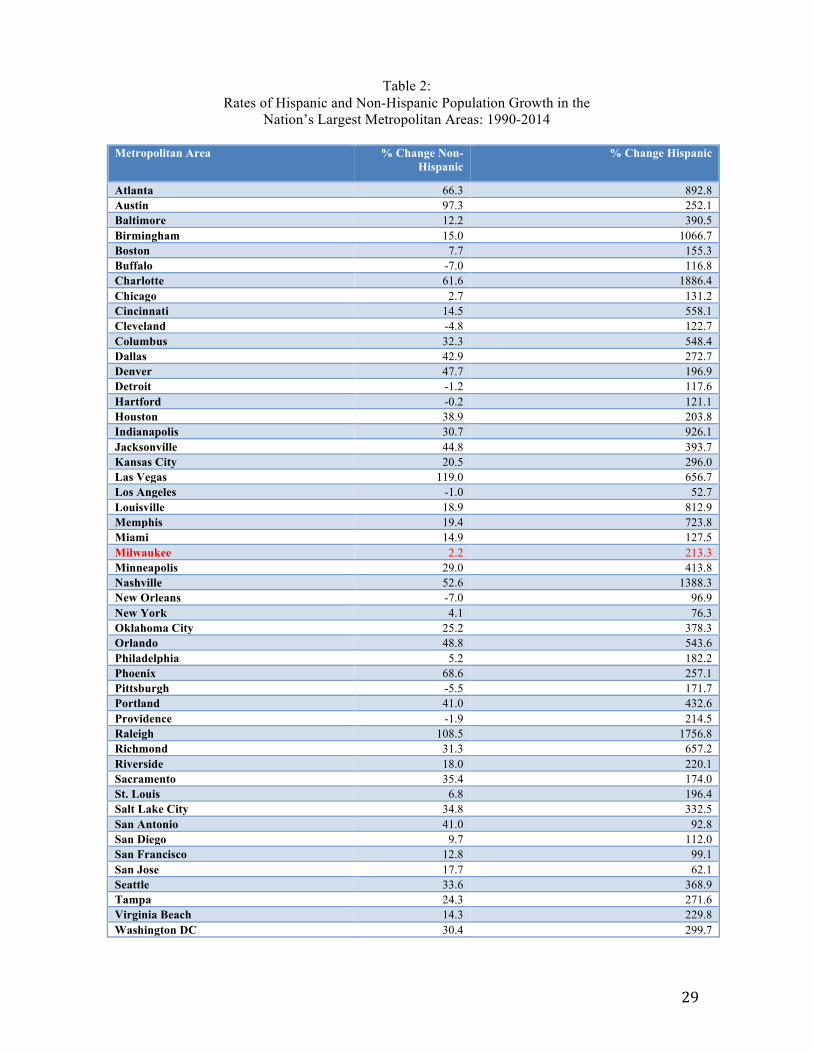
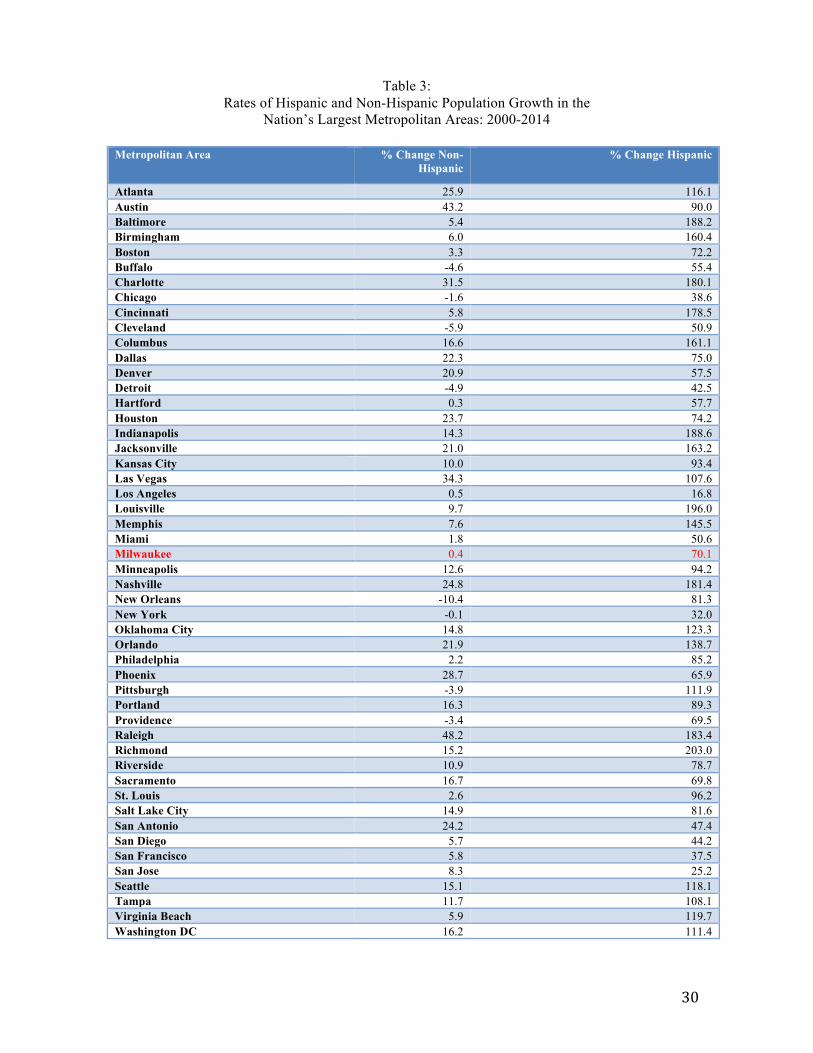
• (Tables 2 and 3): As is the case in every large metropolitan area in the U.S.,
the rate of Hispanic population growth in metro Milwaukee in recent years
dwarfs the rate of non-Hispanic population growth, in both in the 1990-2014
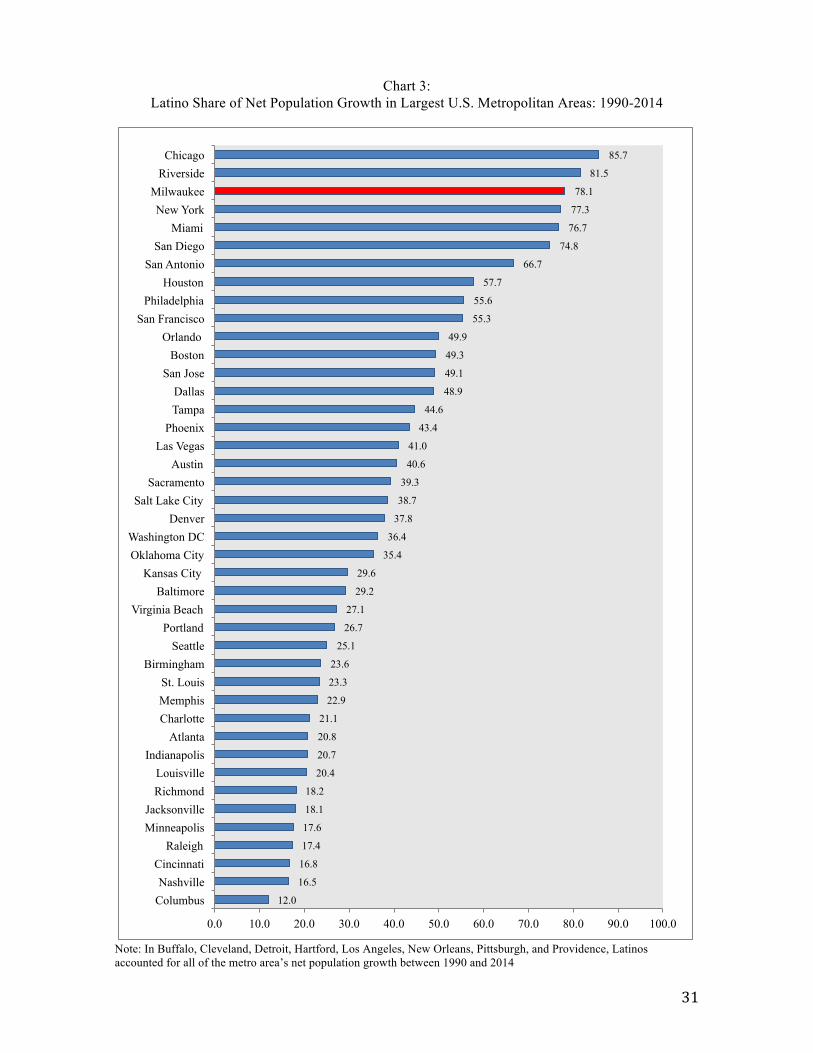
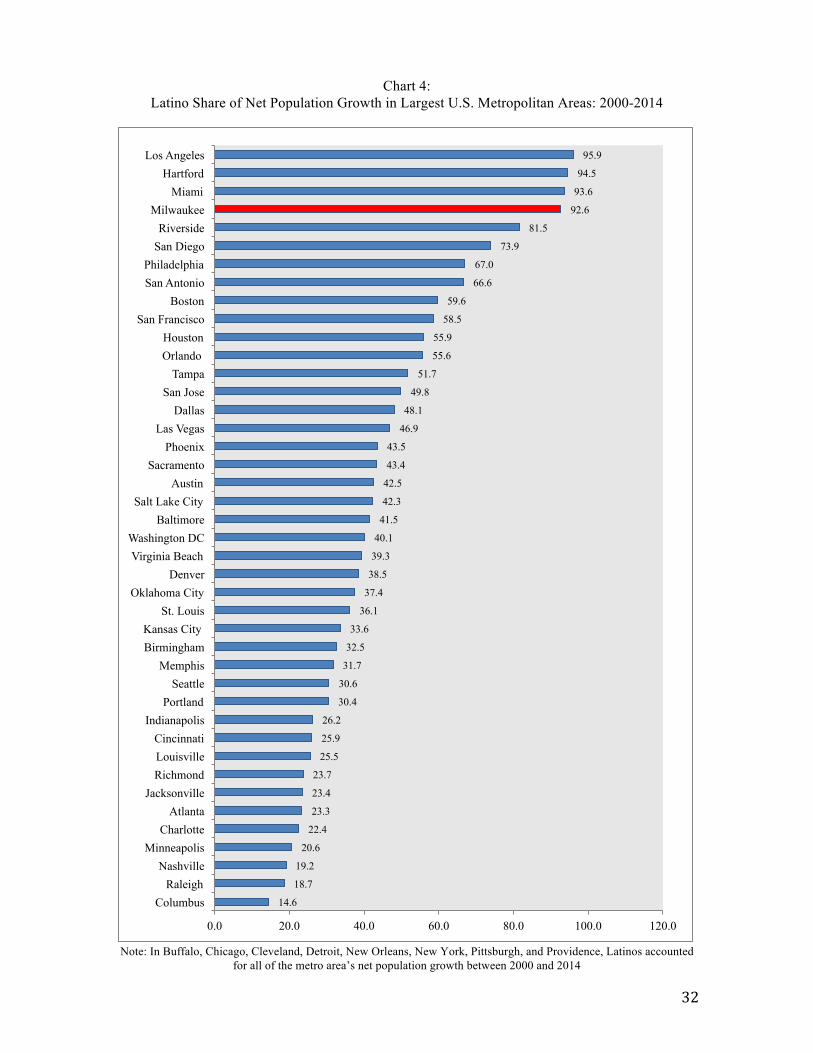
period and the 2000-2014 period. Consequently (Charts 3 and 4), given the
stagnation in non-Hispanic population growth in Milwaukee, Latino
population growth accounts for virtually all of the net demographic increase in
the region, for the longer period (1990-2014) as well as the more recent period
(2000-2014). The combination of stagnant non-Hispanic demographic growth
and steady Latino population gains has resulted in a pronounced and
accelerating “Latinoisation” of the metropolitan area’s ethnic composition.
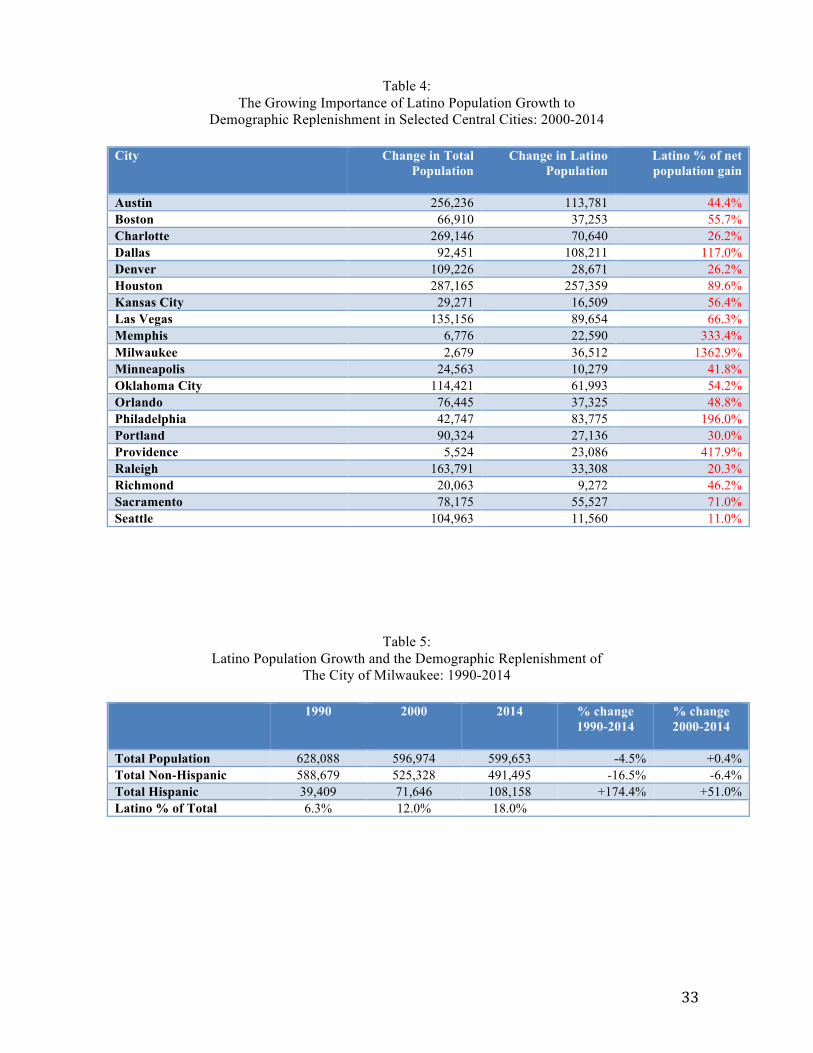
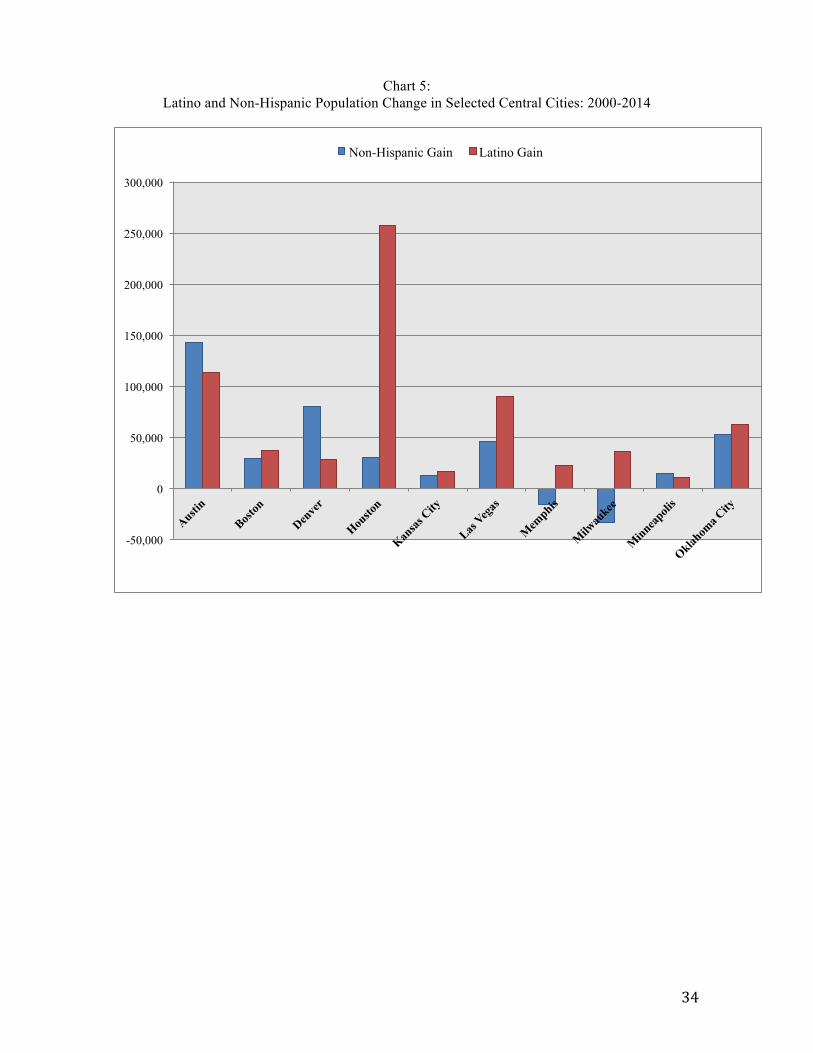
• This demographic trend –a slowly growing or declining non-Hispanic
population and a growing Latino population-- is especially pronounced when
examining population trends in central cities. Much attention has been paid to
“comeback cities” and signs of an urban revival of the past decade, with the
post-1970 population declines of many cities slowing or even turning around
after 2000. As (Tables 4 and 5 and Chart 5) show, Latino population growth
has been a key element in this central city demographic replenishment in
many cities across the country. Hispanics are, in many places, the main
sources of city population growth and in some cases, like Milwaukee, Latino
population growth accounts for all of the net population increase in the city
since 2000 (illustrated most vividly in Chart 5). Without the surge in Latino
population growth in Milwaukee since the 1990s, the city’s population would
still be declining.
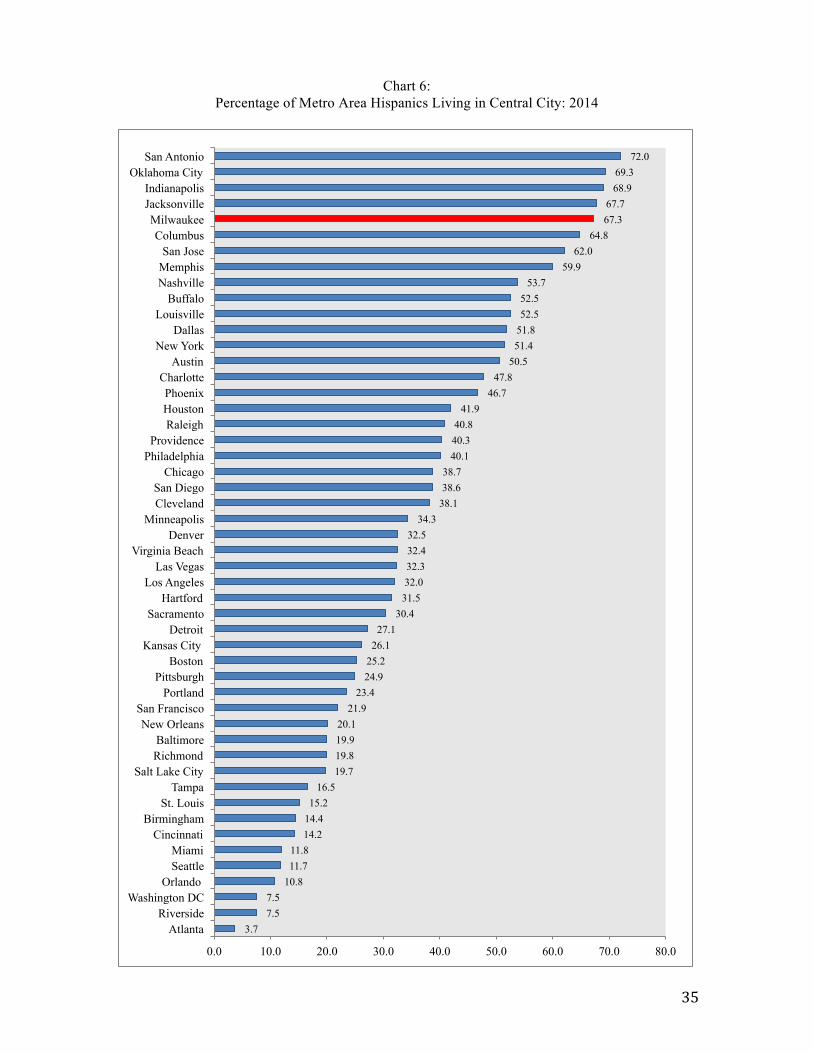
• To a much greater degree than in virtually all other large metropolitan areas,
Milwaukee’s Latino community lives in the central city of the region. Two-
thirds of the metro area’s Latinos live in the city of Milwaukee (Chart 6), the
fourth highest level of “urban” concentration among the nation’s largest
metropolitan areas. This indicator is, in some metro areas, an artifact of legal
jurisdictional boundaries rather than sociological settlement patterns (in
regions with city-county consolidation or metro government, such as
Indianapolis, Jacksonville, Nashville, Louisville, and Columbus). However,
18
such jurisdictional factors do not account for Milwaukee exhibiting among the
lowest levels of Latino suburbanization in the country – a phenomenon that is
closely connected to patterns of residential segregation examined below. (By
way of comparison, 88.9 percent of metro Milwaukee’s black population and
only 20.8 percent of the region’s white non-Hispanic population live in the
central city).
The Cultural Generation Gap: Age, Race, Gender, and Ethnolinguistic Diversity
In his important book on the “diversity explosion” in U.S. metropolises since 1990,
demographer William H. Frey analyzes what he calls the “cultural generation” gap in
U.S. metropolitan areas: the growing co-existence of aging, demographically stagnant
white non-Hispanic communities alongside younger, rapidly increasing immigrant (and
largely Latino) populations. Milwaukee stands out as having one of the widest cultural
generation gaps in the country. Several tables and charts offer different perspectives on
this age-related cultural division:
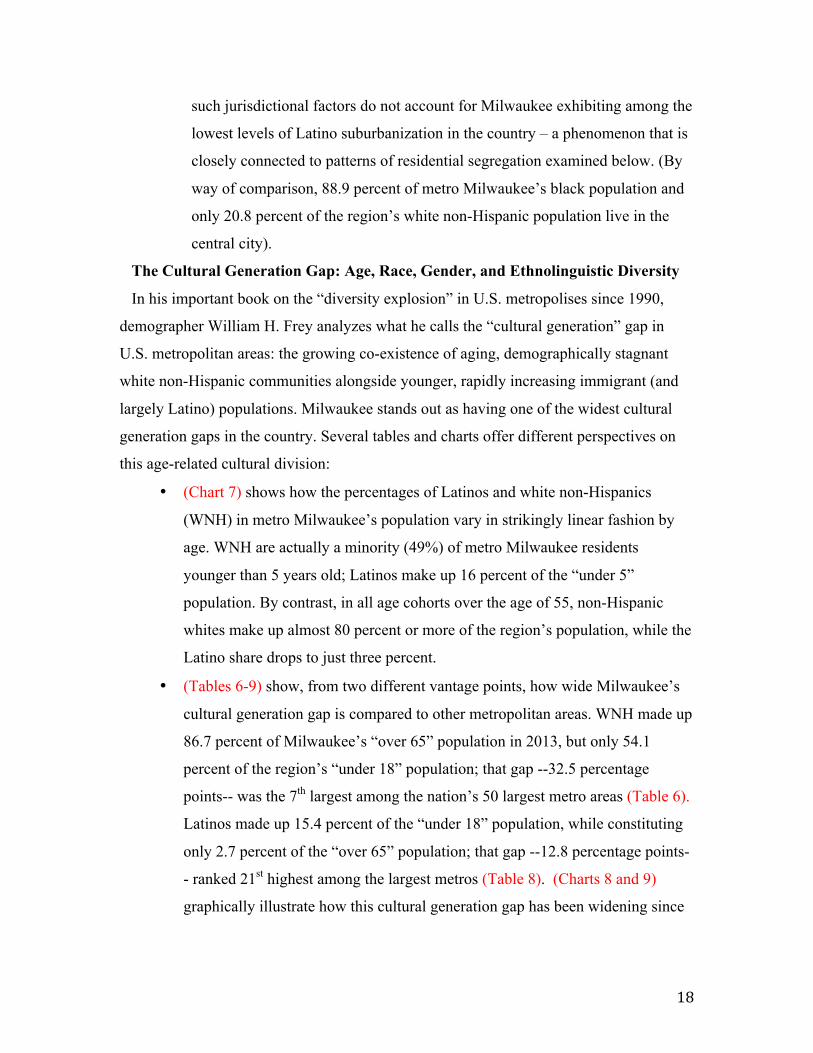
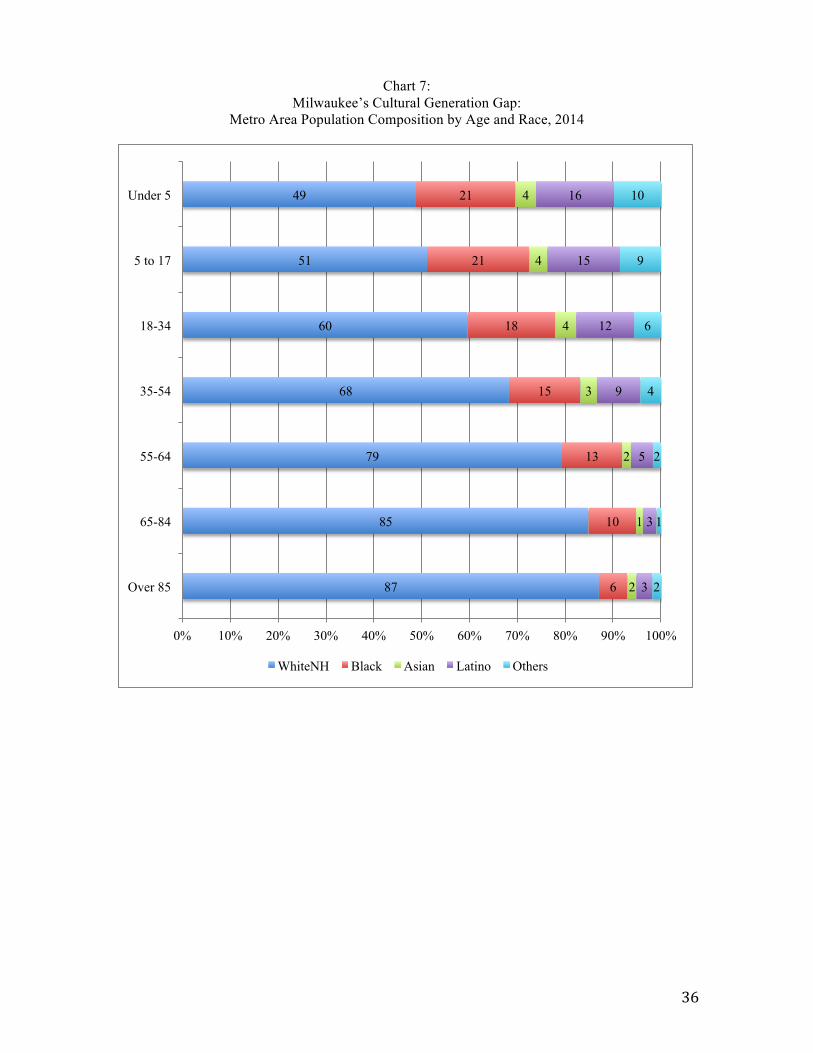
• (Chart 7) shows how the percentages of Latinos and white non-Hispanics
(WNH) in metro Milwaukee’s population vary in strikingly linear fashion by
age. WNH are actually a minority (49%) of metro Milwaukee residents
younger than 5 years old; Latinos make up 16 percent of the “under 5”
population. By contrast, in all age cohorts over the age of 55, non-Hispanic
whites make up almost 80 percent or more of the region’s population, while the
Latino share drops to just three percent.
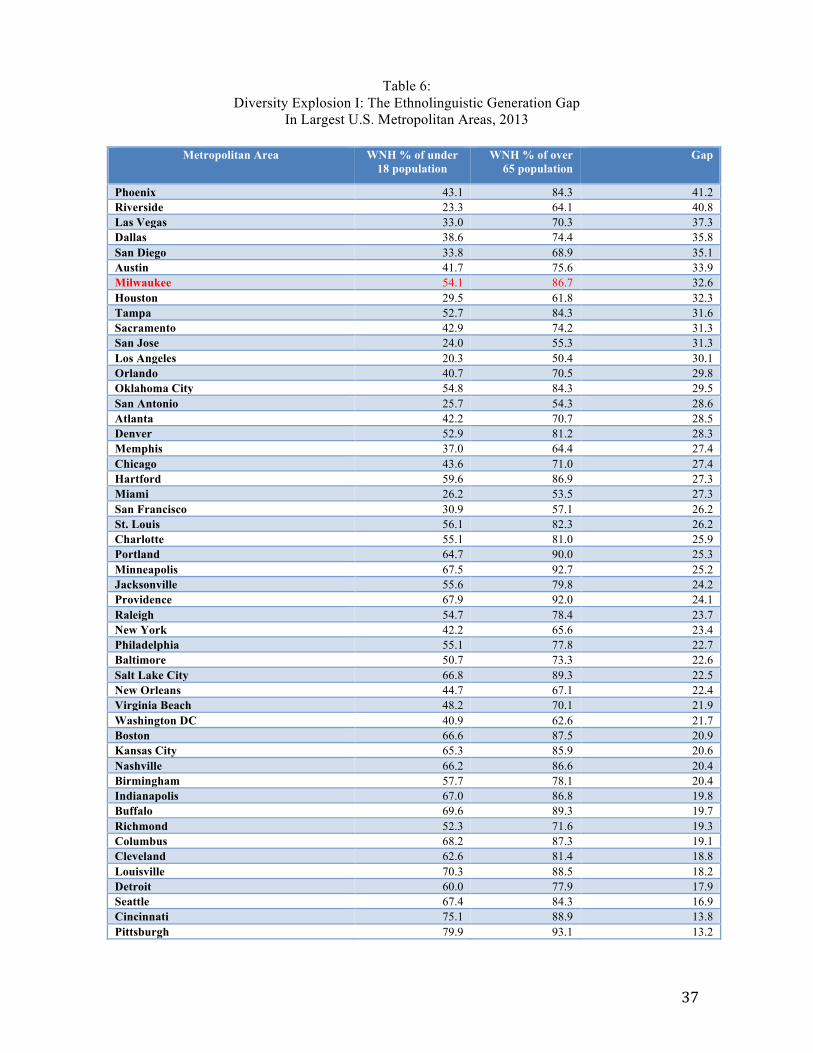
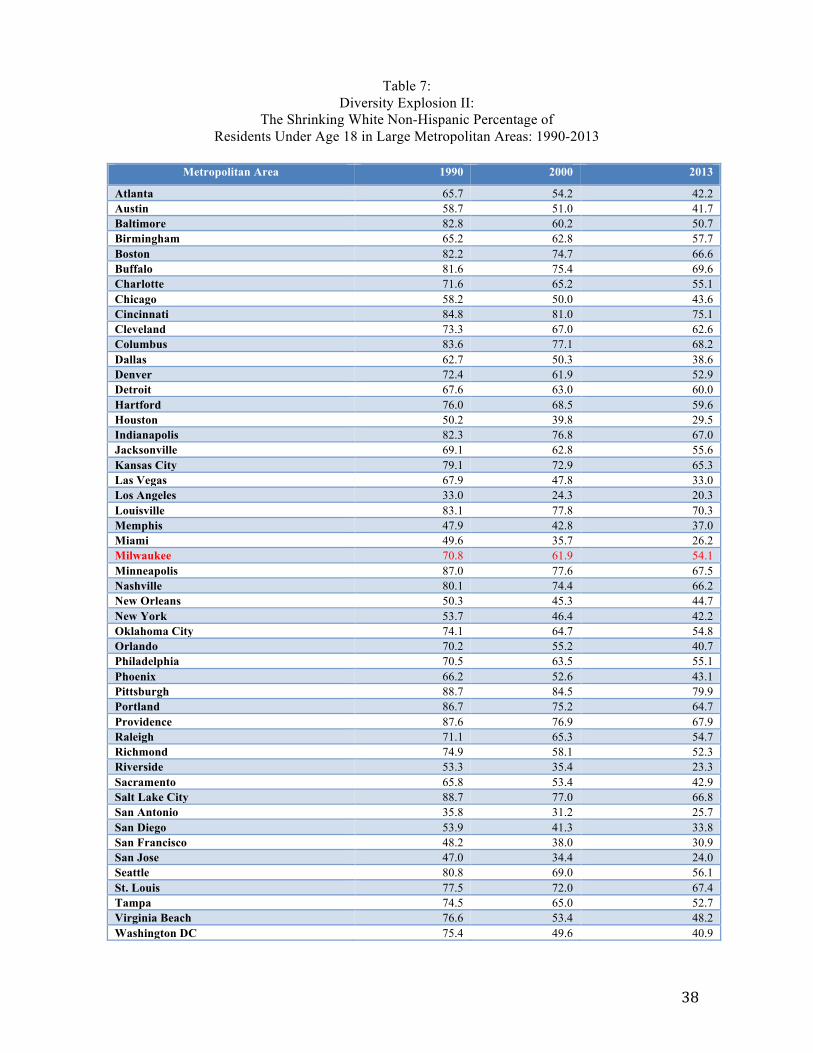
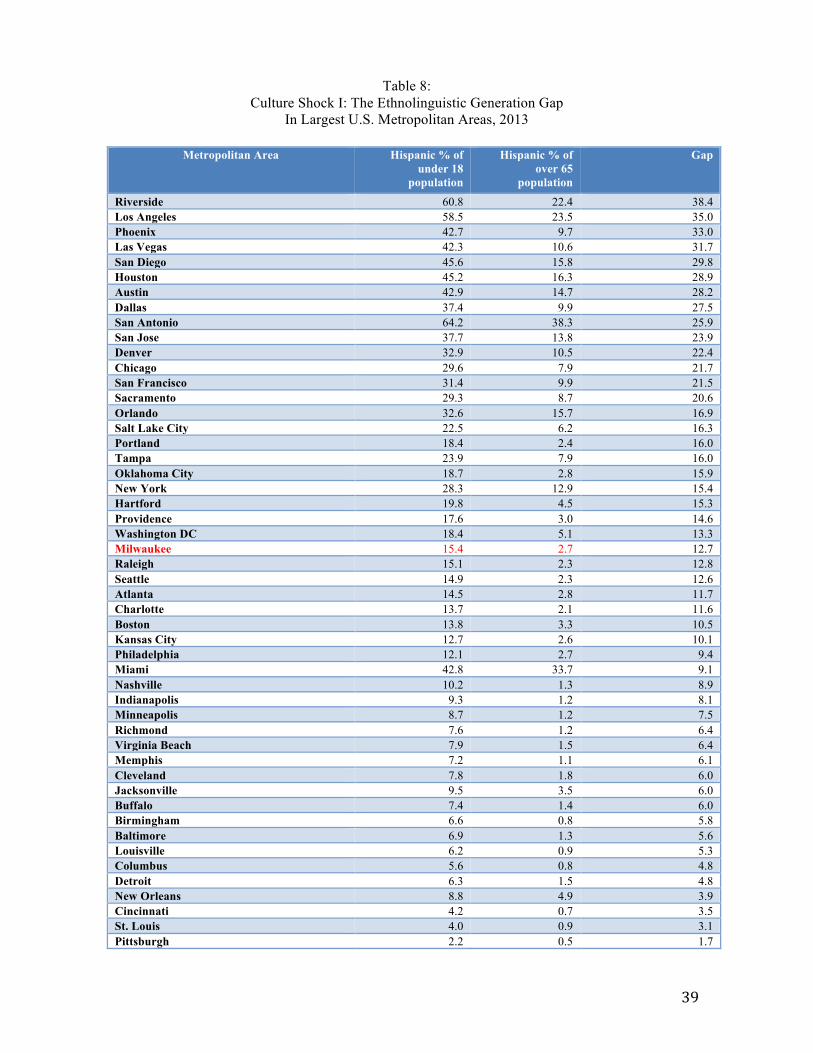
• (Tables 6-9) show, from two different vantage points, how wide Milwaukee’s
cultural generation gap is compared to other metropolitan areas. WNH made up
86.7 percent of Milwaukee’s “over 65” population in 2013, but only 54.1
percent of the region’s “under 18” population; that gap --32.5 percentage
points-- was the 7th largest among the nation’s 50 largest metro areas (Table 6).
Latinos made up 15.4 percent of the “under 18” population, while constituting
only 2.7 percent of the “over 65” population; that gap --12.8 percentage points-
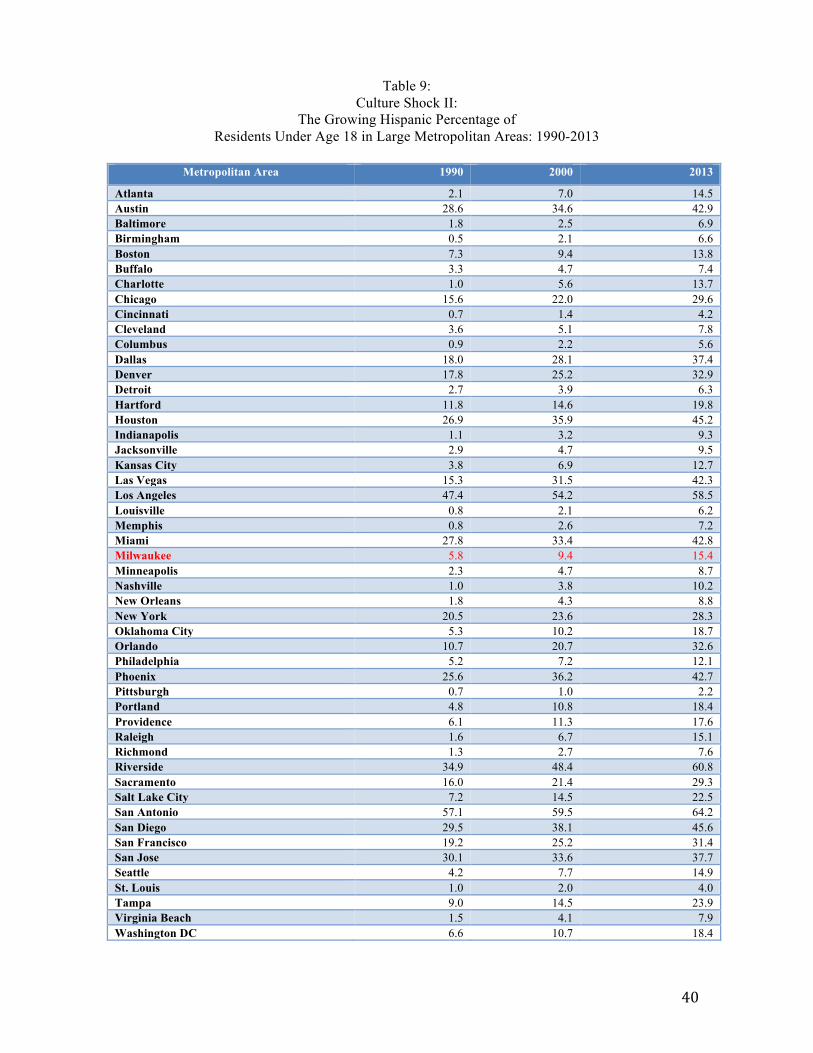
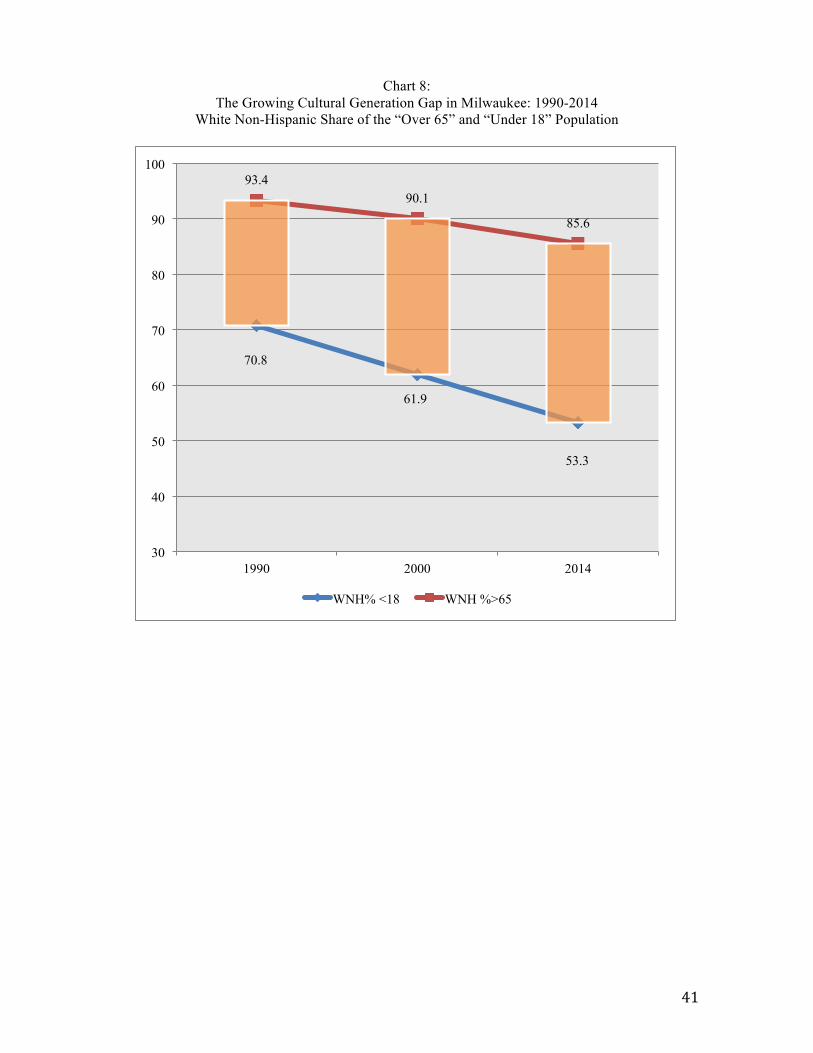
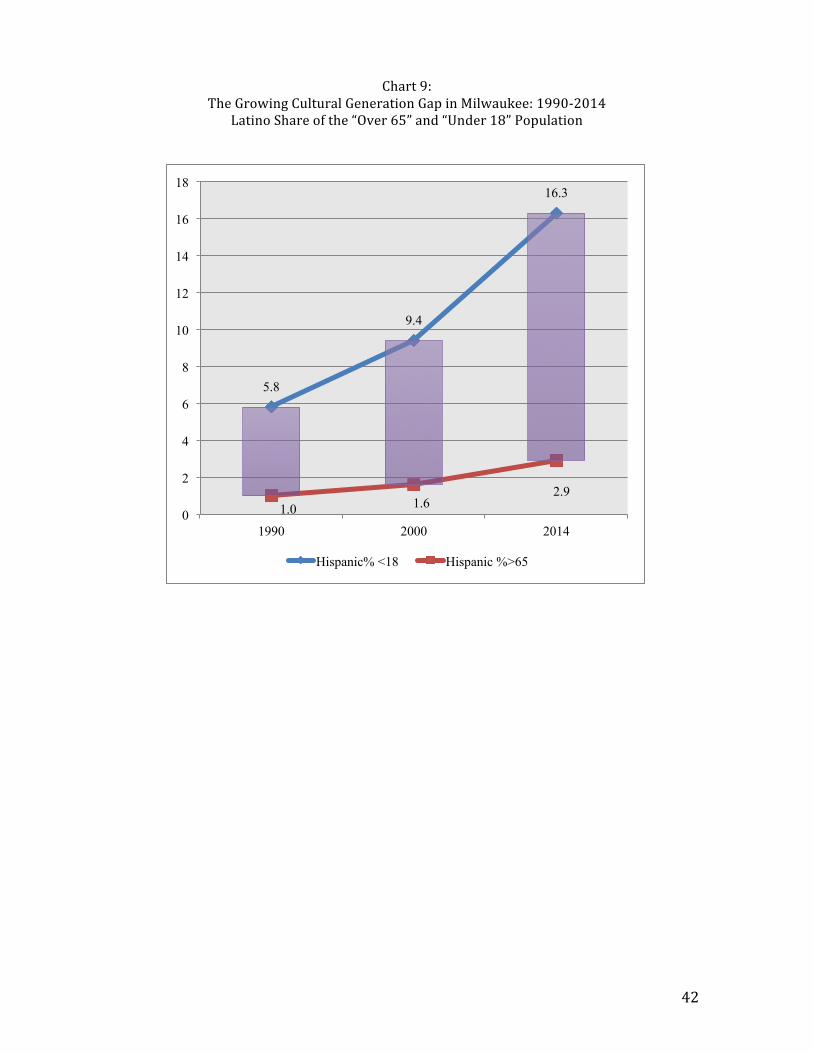
- ranked 21st highest among the largest metros (Table 8). (Charts 8 and 9)
graphically illustrate how this cultural generation gap has been widening since
19
1990 in Milwaukee. (Tables 7 and 9) show the trends in the cultural generation
gap since 1990 in all of the nation’s 50 largest metropolitan areas.
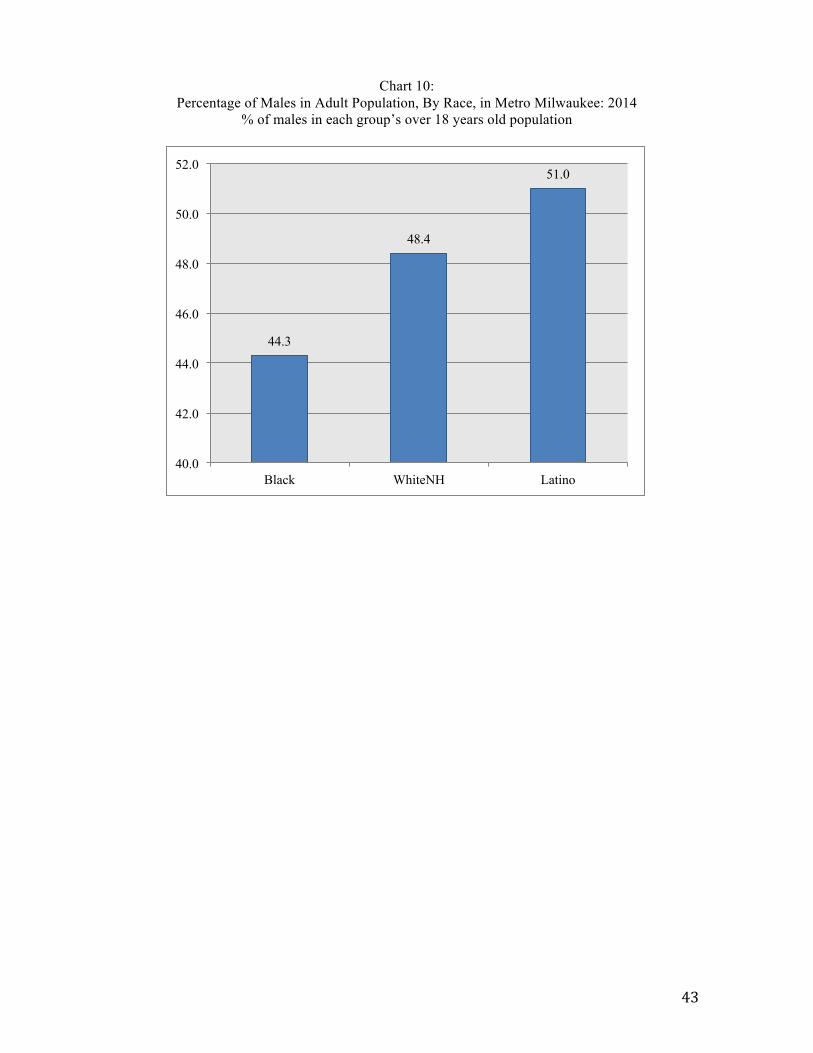
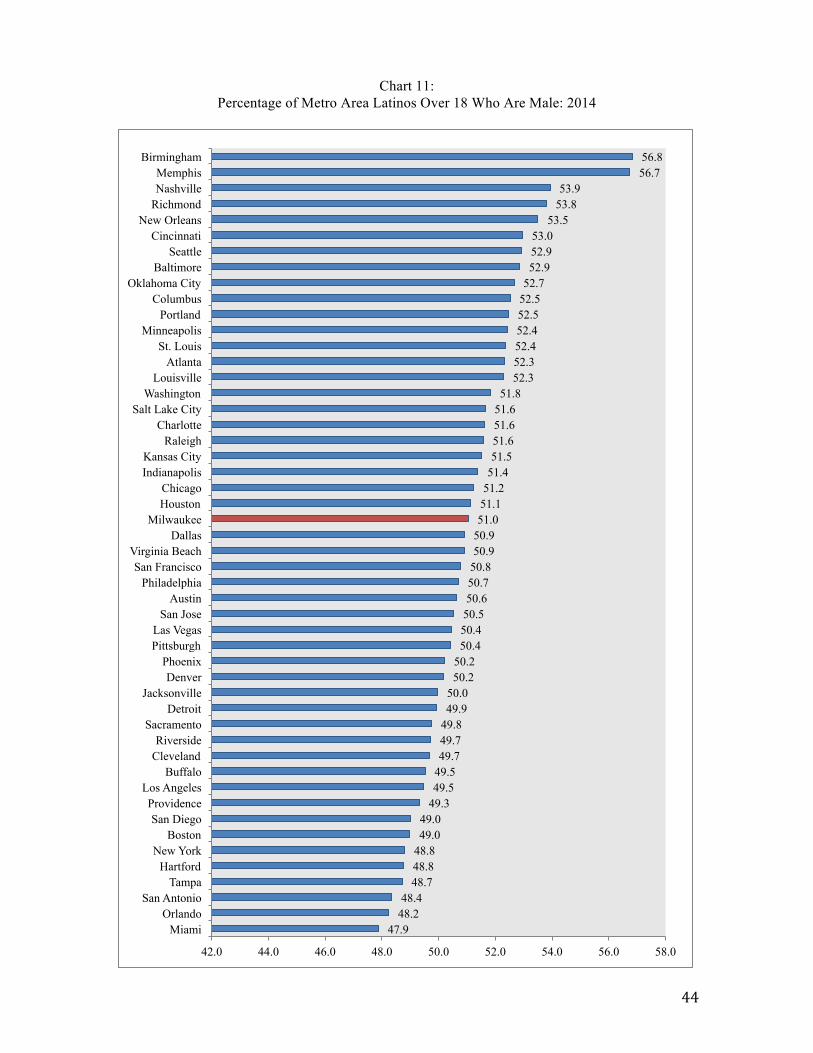
• (Charts 10 and 11) illustrate a gender dimension in Milwaukee’s growing
cultural divide. Latino Milwaukee is a much more demographically “male”
community than either the WNH or black communities. Males represent 51%
of all adult (over age 18) Latinos in Milwaukee, compared to 48.4% for non-
Hispanic whites, and only 44.3% for blacks. Nationally, Milwaukee ranks right
in the middle of the nation’s 50 largest metros in the percentage of the Latino
adult population that is male.
Immigration and Migration Trends
The surge in international immigration to the United States since the 1980s –both legal
and unauthorized—has been the driving element in the Latino demographic explosion in
metropolitan areas across the country. Although Latino immigration to Milwaukee has
accelerated since the 1990s, the pace has been less explosive than in many other
metropolises; consequently, Latino Milwaukee today contains a higher proportion of
native-born citizens than is the case in Hispanic communities in most other large metro
areas.
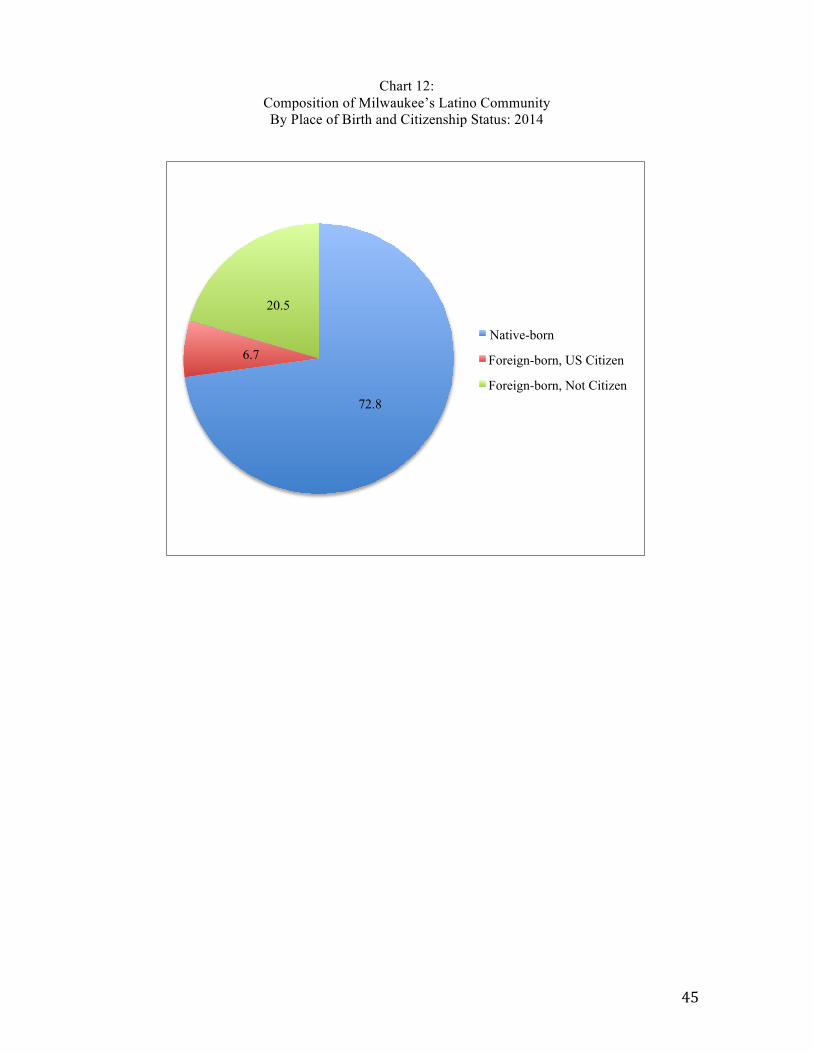
• Native-born citizens made up almost 73 percent of metro Milwaukee’s Latino
population in 2014. Just over 20 percent of Milwaukee Latinos were foreign-
born, non-citizens. The remaining 7 percent were foreign-born, naturalized
citizens (Chart 12).
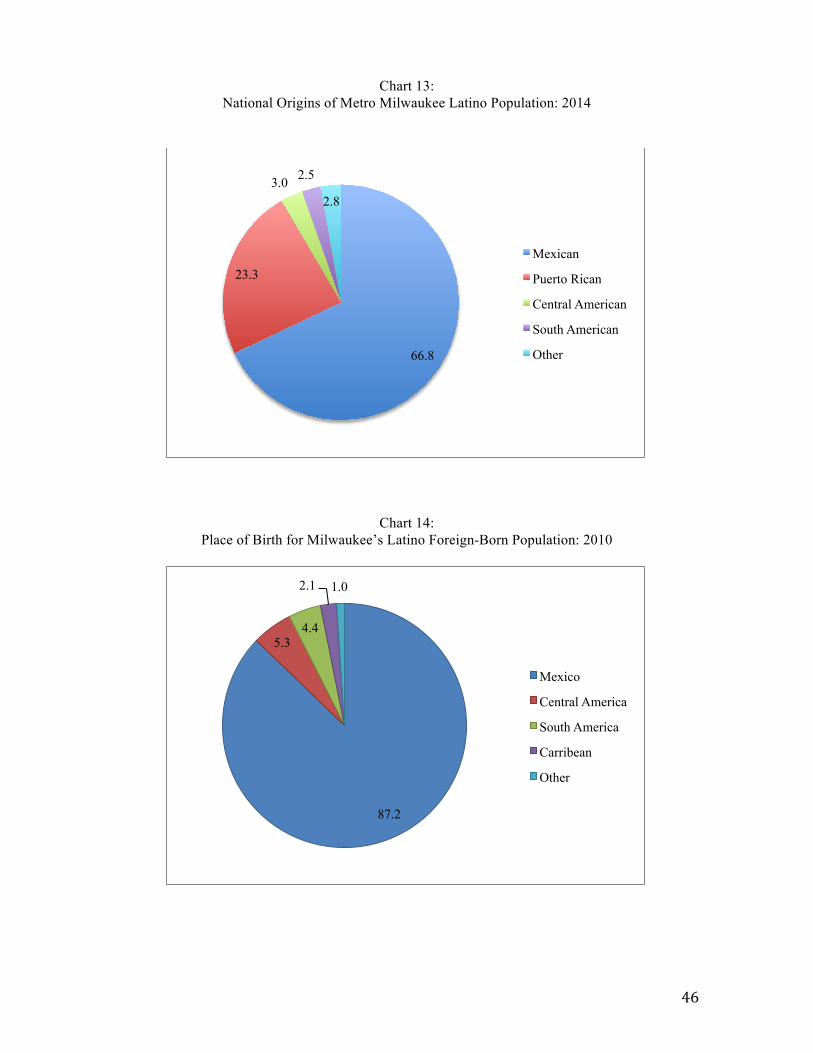
• The vast majority of Milwaukee Latinos, regardless of immigration status, are
of Mexican (66.8%) and Puerto Rican (23.3%) national origin (Chart 13).
Among Milwaukee’s foreign-born Latino population, the overwhelming
majority (87%) was born in Mexico (Chart 14).
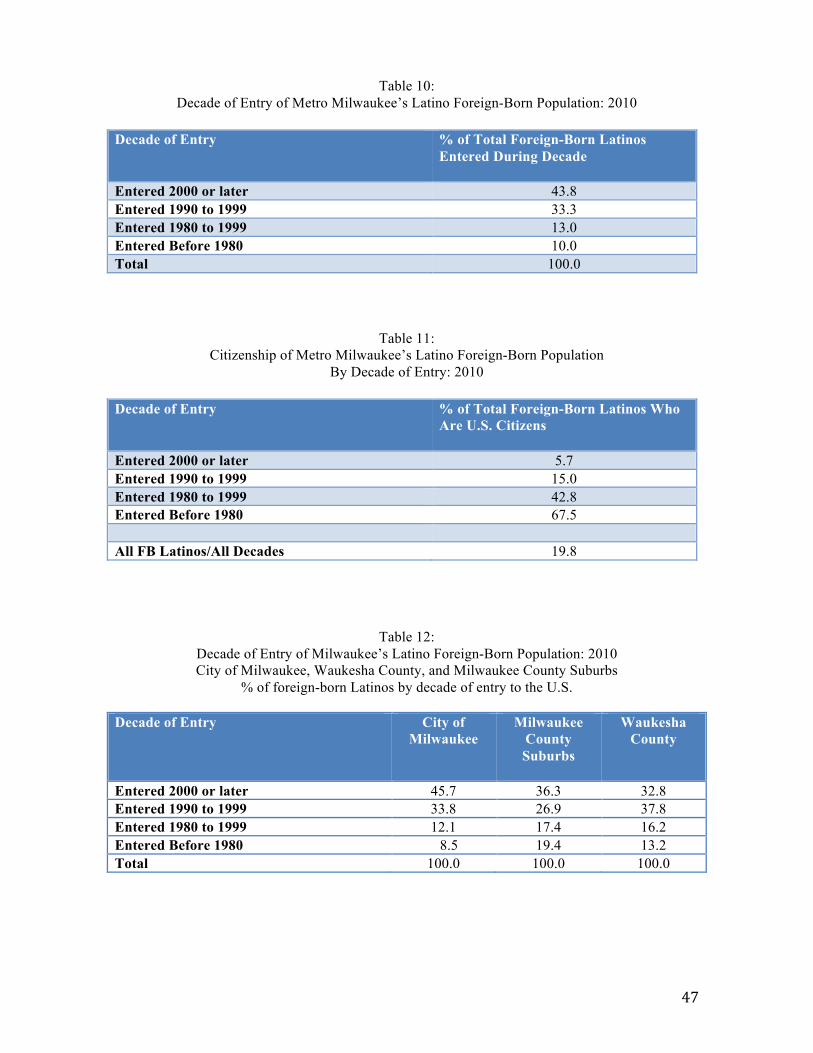
• (Tables 10 and 11) show that over three-quarters of Milwaukee’s foreign-born
population entered the United States after 1990; almost 44 percent have entered
since 2000. Predictably, the degree to which Milwaukee’s foreign-born Latinos
have become citizens is directly proportional to the decade of entry. Among
Milwaukee Latinos who entered the U.S. before 1980, 67.5 percent are citizens;
20
among local Latinos who entered after 2000, only 5.7 percent have gained
citizenship.
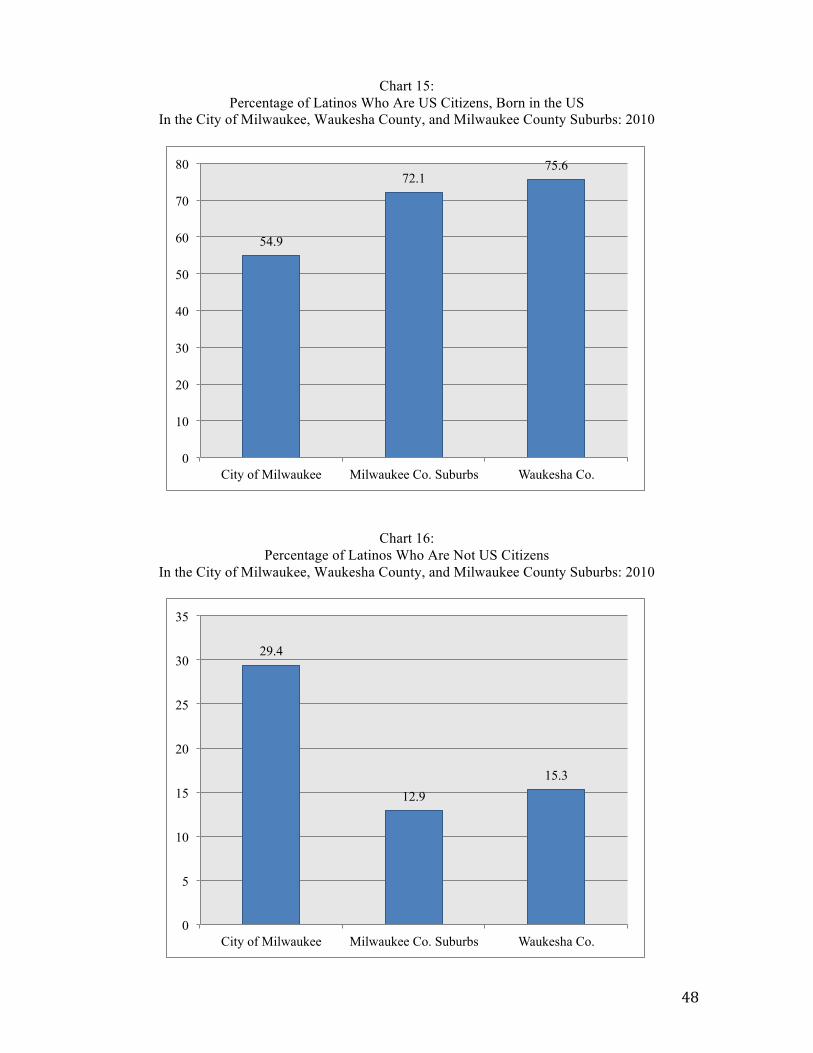
• (Table 12 and Charts 15-16) reveal the degree to which these Latino
immigration and citizenship trends vary in different parts of the Milwaukee
metropolitan area. The vast majority (almost 75%) of Latino immigrants in
metro Milwaukee live in the city of Milwaukee. But, among Latino immigrants
living throughout the region, those living in Waukesha County and the
Milwaukee County suburbs are likelier than those living in the city of
Milwaukee to be of “older vintage,” to have entered the U.S. before 1990
(Table 12). For the Latino community as a whole, a much higher percentage of
those living in the city of Milwaukee are not U.S. citizens (29.4%) compared to
Waukesha County (15.3%) or the Milwaukee County suburbs (12.9%). (Chart
16) Conversely, a much higher percentage of suburban Latinos are native-born,
U.S. citizens – almost 75% of Latinos in the suburban jurisdictions are native-
born, compared to 55% in the city of Milwaukee (Chart 15).
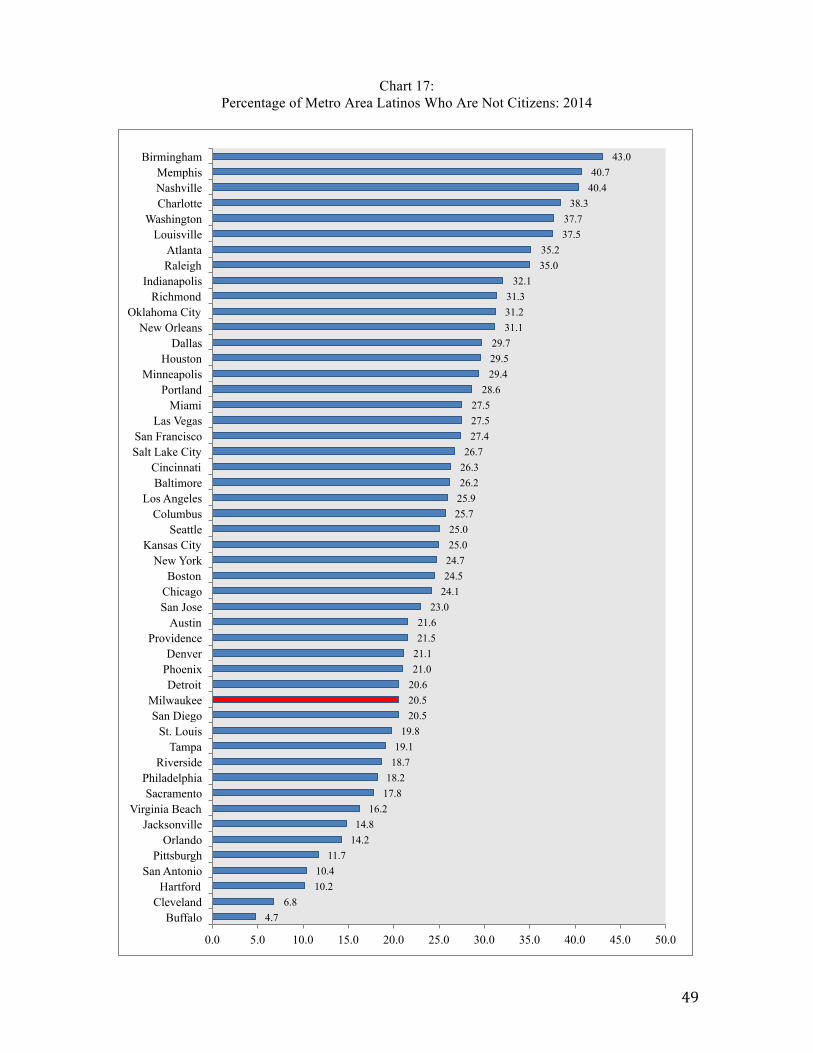
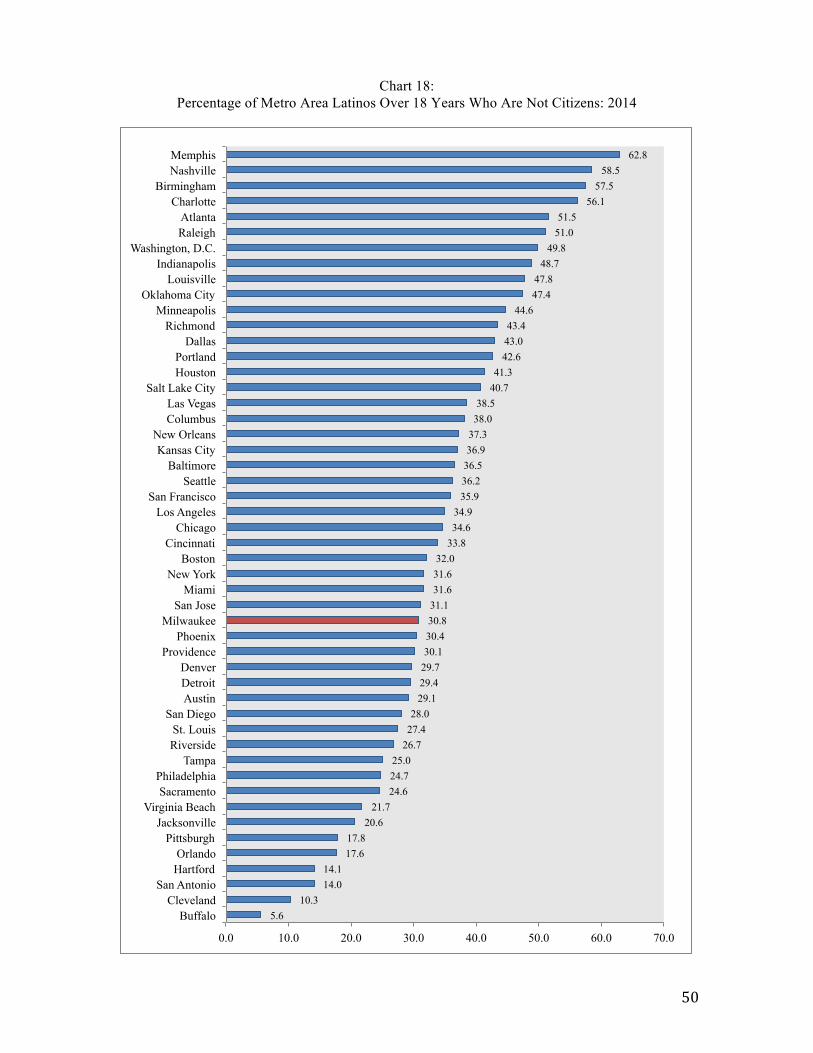
• Non-citizens make up a relatively smaller share of metro Milwaukee’s Latino
population than in most of the nation’s large metropolitan areas. In 2014,
Milwaukee ranked 36th among the 50 largest metropolitan areas in the
percentage of Latinos who are not citizens (Chart 17). Among adult Latinos
(over the age of 18), Milwaukee ranked 31st among the 50 big metros in the
share of Latinos who are not citizens (Chart 18). Once again, the new emerging
gateways of the south with explosively growing Latino populations, such as
Memphis, Nashville, Birmingham, Charlotte, Atlanta, and Raleigh, now boast
very high “non-citizen” percentages of their adult Latino populations. In
comparative terms, Milwaukee’s Latino community is more homegrown than
in most large metros.
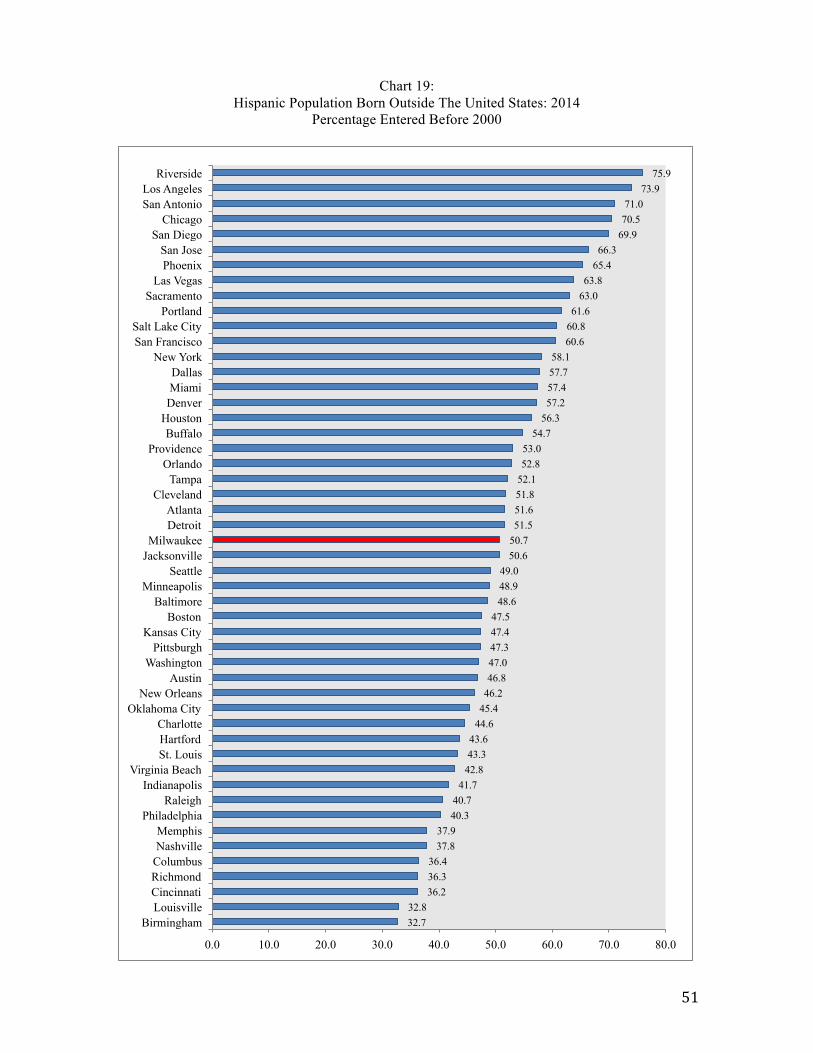
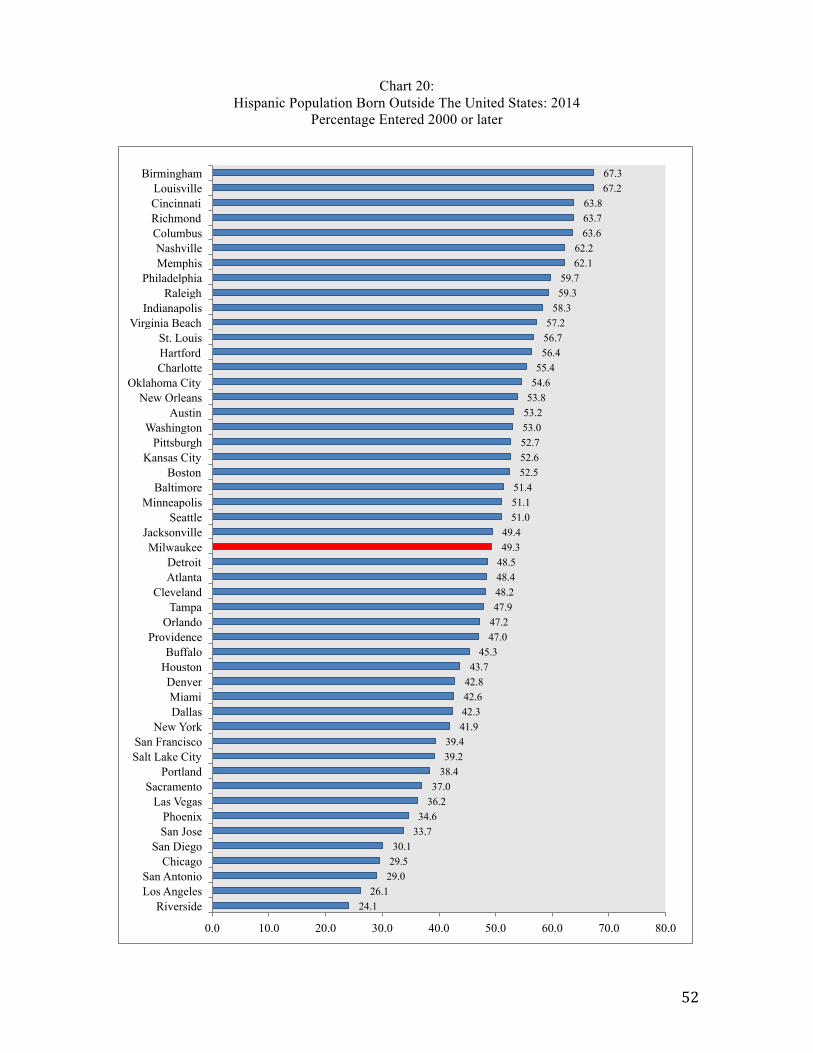
• In terms of the vintage of immigration, Milwaukee ranks right in the middle of
the pack in the percentage of its immigrant Latino population that entered the
U.S., both “before 2000” or “since 2000” (Charts 19 and 20). Approximately
50 percent of Milwaukee’s Latino immigrants entered during each of those
periods; by contrast, in older Latino gateways such as Los Angeles and
21
Chicago, over 70 percent of the immigrants entered before 2000. In an
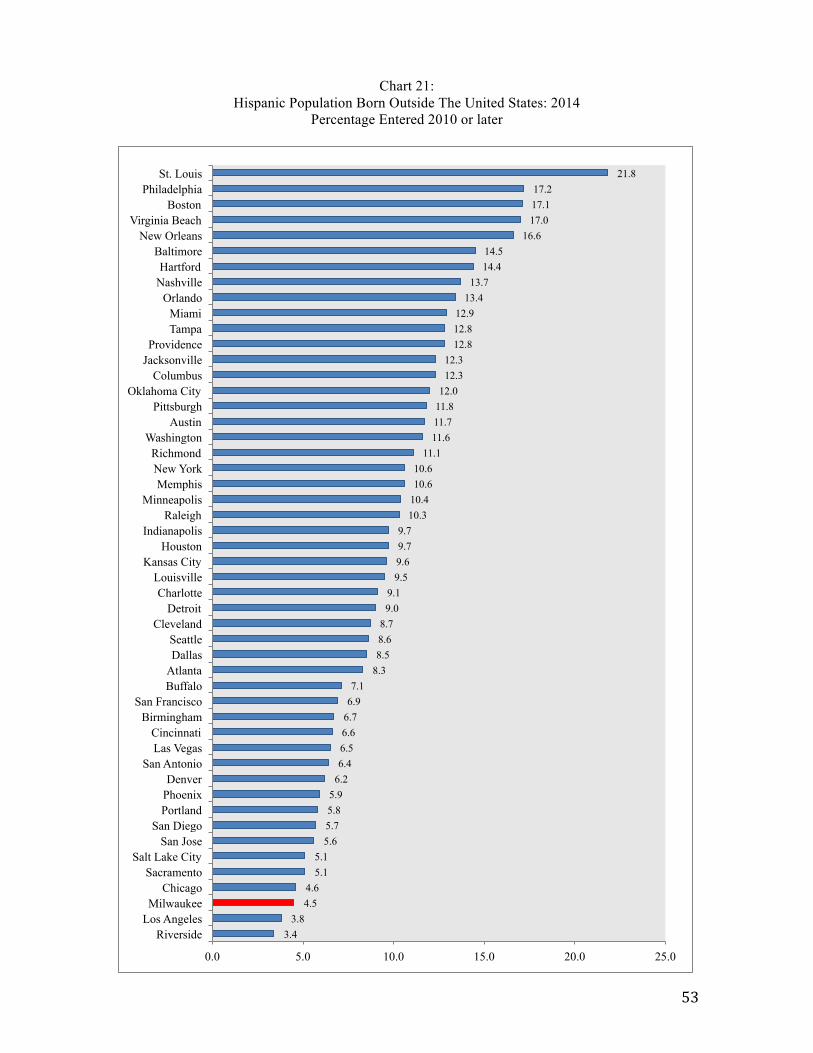
emerging gateway like Raleigh, that figure is only 40 percent. Interestingly,
Milwaukee ranks toward the bottom (48th) of the large metros in the percentage
of Latino immigrants who entered the U.S. after 2010, perhaps a sign, in
relative terms, of slowing international migration to Milwaukee since the Great
Recession (Chart 21).
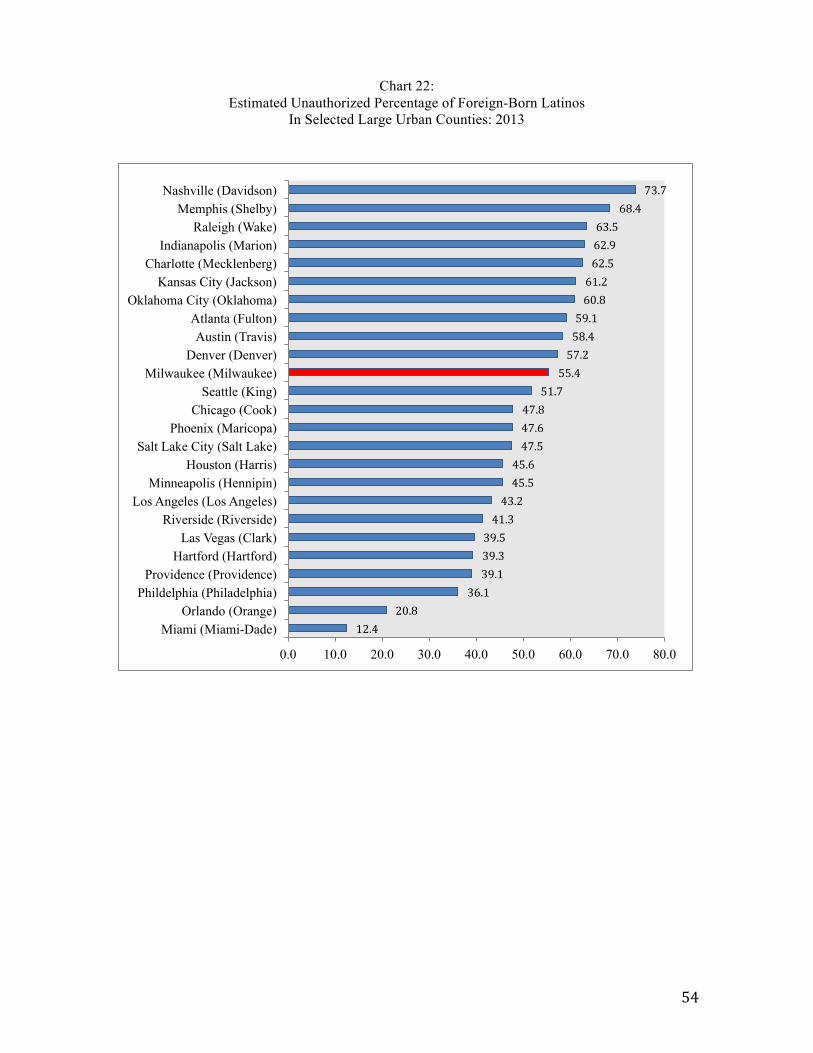
• (Charts 22 and 23) provide estimates for 2013 on the percentage of foreign-
born Latinos who are “unauthorized,” in Milwaukee and in a selection of other
metros. These data are available only for certain counties in the U.S., so we
have compared Milwaukee County to a selection of large urban counties,
combining estimates of the unauthorized population by the Migration Policy
Institute (drawn from DACA and DAPA data as well as U.S. Census Bureau
data) with Census Bureau data on the total foreign-born Latino population in
those counties. As Chart 22 shows, with 55.4 percent of the county’s foreign-
born Latino population estimated to be unauthorized immigrants, Milwaukee
County posts the 11th highest rate of unauthorized Latino immigrants among
the 25 large urban counties for which we collected data. Once again, the new
southern gateways lead the way in unauthorized Latino immigrants, with over
60 percent of foreign-born Latinos falling into this category in places like
Nashville, Memphis, and Raleigh. If we look specifically at the Mexican-born
immigrant population (Chart 23), Milwaukee County ranks 13th of the 25
counties in the unauthorized percentage: an estimated 61.9 percent of the
Mexican-born immigrants in the county were unauthorized in 2013. In the
central counties of Raleigh, Atlanta, Charlotte, and Nashville, the unauthorized
percentage of Mexican-born immigrants is estimated at over 80 percent.
• Shifting from international to domestic migration, (Charts 24 and 25) present
the sources of net domestic Hispanic migration to Milwaukee County between
2006-2010. [Net domestic migration is a much less important factor in
Milwaukee’s Latino population growth than international immigration and
natural increase (births minus deaths)]. The leading sources of net domestic
Hispanic in-migration to Milwaukee County were Cook County (Chicago),
22
Kenosha, Walworth, and Los Angeles County. The leading counties for net
Hispanic outmigration were all in Wisconsin: Waukesha, Dane, Racine, and
Dodge counties. There was also net Latino outmigration to Bexar County,
Texas (San Antonio) and Kane County, Illinois.
Latino-White Segregation
The academic consensus that Milwaukee is one of America’s most segregated cities has
focused generally on the persistently high levels of black-white residential segregation in
the region – levels that most scholars characterize as hypersegregation. Although the data
show that Latino-WNH segregation is not as pervasive as racial segregation in
Milwaukee, the rate of Latino-WNH segregation here is high and has not declined over
the past twenty years.
There are numerous ways to measure residential segregation. The most commonly
accepted is the “index of dissimilarity,” which measures the degree of evenness with
which two groups are distributed across geographic units (i.e. census tracts or
neighborhoods) that make up a larger area (i.e. cities or metropolitan areas). The index is
not without some drawbacks, but the most serious scholars of segregation in the country
used it to compare levels of segregation in cities and regions, and to examine how
segregation rates have changed over time. An index of dissimilarity of 80 is generally
considered “extreme segregation;” and an index of 60 is considered “high segregation.”
As Chart 26 shows, metro Milwaukee’s index of Latino-WNH segregation, using 2010
census population data, was 57.0 – on the cusp of what is considered “high segregation,”
although it is substantially less than the 81.6 index for black-WNH segregation for that
year. Nevertheless, the level of Milwaukee’s Latino-WNH segregation ranked 7th highest
among the nation’s 50 largest metropolitan areas. Moreover, as Table 13 reveals, the rate
of Latino-WNH segregation in metro Milwaukee has remained unchanged since 1990,
despite the substantial growth of the region’s Latino population and some modest Latino
suburbanization. Clearly, demographic growth in Latino Milwaukee is generally
occurring along the lines of historical patterns of segregation.
23
Language Use
To what extent do Milwaukee Latinos speak English or Spanish in their homes? What
are the levels of English language proficiency among Milwaukee’s Latino community?
How does Milwaukee stack up against other metropolitan areas on these measures? And
how is language use changing over time?
• Milwaukee ranked towards the middle-of-the-pack (28th) in 2014 among the
nation’s largest metropolitan areas in the percentage of Latino households that
are “limited English speaking.” (Chart 27). Slightly more than one-fifth of
Milwaukee Latino households fall into this category. The Census bureau defines
such households as “one in which no member 14 years old and over (1) speaks
only English, or (2) speaks a non-English language and speaks English ‘very
well.’ In other words, all members 14 years old and over have at least some
difficulty with English.” In previous census years, these households were
referred to as “linguistically isolated,” and as Table 14 reveals, the percentage
of such Latino households in metro Milwaukee has grown from 15.2 percent in
1990 to 22.2 percent in 2014.
• (Charts 28-30) gauge patterns of language use as well as English language
proficiency among Latinos (over the age of 5). In 2014, around one-third of
metro Milwaukee Latinos spoke “only English” in their homes. This level of
linguistic assimilation to English ranked 18th highest among the nation’s 50
largest metro areas – not a surprising finding in light of Milwaukee’s relatively
lower levels of Latinos who are not citizens. By contrast, fewer than one-fifth of
Latinos in high-immigration emerging gateways like Atlanta, Orlando, or
Raleigh exhibit this level of English usage.
• Among Milwaukee Latinos who speak Spanish at home, almost three-quarters
speak English “very well” or “well.” This level of bilingualism places
Milwaukee 21st among the nation’s 50 largest metropolitan areas.
• By contrast, only 6.3 percent of Milwaukee Latinos who speak Spanish at home
spoke English “not at all.” Compared to most large metro areas, this is a very
low rate of Spanish unilingualism: Milwaukee ranks 41st among the 50 largest
metros in the proportion of Spanish-speaking unilinguals. In metros with larger
24
Latino communities (such as Miami, Austin, Los Angeles, or Houston) or larger
“non-citizen” Latino communities comprised of more recent immigrants (such
as Charlotte, Memphis, Raleigh, or Atlanta), the rate of Spanish unilingualism
among Latinos is higher than in Milwaukee.
• (Table 15) shows how language use and linguistic proficiency have evolved
over past five years for all Milwaukee Latinos (over age 5), no matter the
language spoken at home. In 2014, among all Milwaukee Latinos, around one-
third spoke only English; around 50 percent were “Spanish bilinguals”
(speaking Spanish at home, but speaking English “very well” or “well”); and
about 17 percent were “Spanish Limited English” (speaking Spanish at home,
but speaking English “not well” or “not at all”). Between 2009-2014, the
percentage of “English only” among Milwaukee Latinos increased from 26.9
percent to 32.9 percent; the rate of Spanish bilinguals remained constant (small
decline); and the rate of Spanish “limited English” declined from 22.4 percent to
17.1 percent.
• (Chart 31 and Table 16) illustrate how these Latino language use trends vary
between the city of Milwaukee and the suburbs of Milwaukee and Waukesha
Counties. Latinos living in the suburbs are twice as likely as city-dwelling
Latinos to speak “English only” in the home (Chart 31). Conversely, about
twice as many city Latinos as their suburban counterparts are likely to speak
Spanish at home while also reporting limited English-speaking proficiency. As
Table 16 shows, these city-suburb variations exist for both Latino youth (ages 5-
17) as well as adults (ages 18-64). However, in all jurisdictions, Latino youth
are likelier than adults to speak “only English” and less likely than adults to
report “limited English proficiency,” even if they speak Spanish in the home.
These differences in language use and proficiency, by age, suggest that the
historical process of generational linguistic integration is ongoing in Latino
Milwaukee.

25
Family Structure
• Milwaukee’s Latino community has a lower percentage of “married couple
family households” than the WNH population and a substantially higher
percentage than the black community (Chart 32).
• The Latino rate in 2014 of “female headed, no husband present, with children”
households in Milwaukee (16.0 percent) is four times higher than the white non-
Hispanic rate, but lower than the black rate (25.6 percent). (Chart 33)
• Among the nation’s 50 largest metropolitan areas, Milwaukee ranks a very low
43rd in the percentage of Latino households that are married couple families
(Chart 34).
• On the other hand, Milwaukee ranks 8th among the 50 large metros in the
percentage of Latino households that are female headed, no husband, with
children (Chart 35).
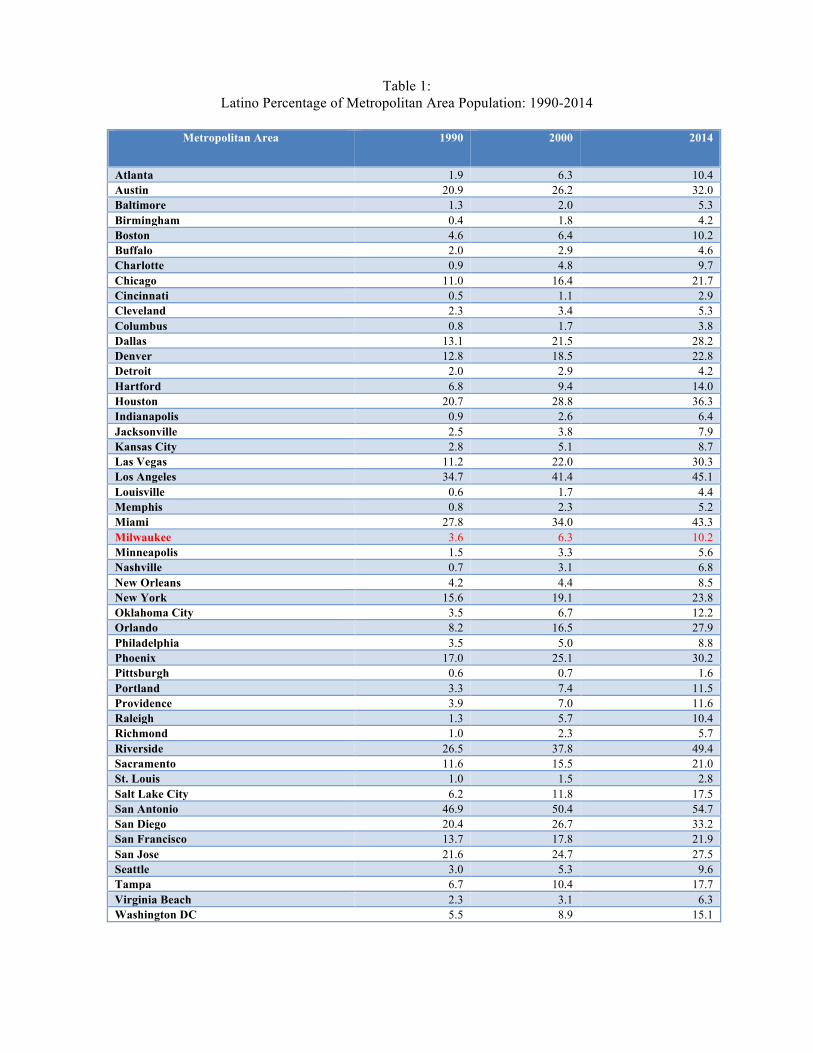
Table 1: Latino Percentage of Metropolitan Area Population: 1990-2014
Metropolitan Area 1990 2000 2014
Atlanta 1.9 6.3 10.4 Austin 20.9 26.2 32.0 Baltimore 1.3 2.0 5.3 Birmingham 0.4 1.8 4.2 Boston 4.6 6.4 10.2 Buffalo 2.0 2.9 4.6 Charlotte 0.9 4.8 9.7 Chicago 11.0 16.4 21.7 Cincinnati 0.5 1.1 2.9 Cleveland 2.3 3.4 5.3 Columbus 0.8 1.7 3.8 Dallas 13.1 21.5 28.2 Denver 12.8 18.5 22.8 Detroit 2.0 2.9 4.2 Hartford 6.8 9.4 14.0 Houston 20.7 28.8 36.3 Indianapolis 0.9 2.6 6.4 Jacksonville 2.5 3.8 7.9 Kansas City 2.8 5.1 8.7 Las Vegas 11.2 22.0 30.3 Los Angeles 34.7 41.4 45.1 Louisville 0.6 1.7 4.4 Memphis 0.8 2.3 5.2 Miami 27.8 34.0 43.3 Milwaukee 3.6 6.3 10.2 Minneapolis 1.5 3.3 5.6 Nashville 0.7 3.1 6.8 New Orleans 4.2 4.4 8.5 New York 15.6 19.1 23.8 Oklahoma City 3.5 6.7 12.2 Orlando 8.2 16.5 27.9 Philadelphia 3.5 5.0 8.8 Phoenix 17.0 25.1 30.2 Pittsburgh 0.6 0.7 1.6 Portland 3.3 7.4 11.5 Providence 3.9 7.0 11.6 Raleigh 1.3 5.7 10.4 Richmond 1.0 2.3 5.7 Riverside 26.5 37.8 49.4 Sacramento 11.6 15.5 21.0 St. Louis 1.0 1.5 2.8 Salt Lake City 6.2 11.8 17.5 San Antonio 46.9 50.4 54.7 San Diego 20.4 26.7 33.2 San Francisco 13.7 17.8 21.9 San Jose 21.6 24.7 27.5 Seattle 3.0 5.3 9.6 Tampa 6.7 10.4 17.7 Virginia Beach 2.3 3.1 6.3 Washington DC 5.5 8.9 15.1
27
Chart 1: Percentage Growth in Latino Population: 1990-2014
52.7 62.1 76.3 92.8 96.9 99.1 112.0 116.8 117.6 121.1 122.7 127.5 131.2
155.3 171.7 174.0 182.2 196.4 196.9 203.8 213.3 214.5 220.1 229.8 252.1 257.1 271.6 272.7 296.0 299.7
332.5 368.9 378.3 390.5 393.7 413.8 432.6
543.6 548.4 558.1
656.7 657.2
723.8 812.9
892.8 926.1
1066.7 1388.3
1756.8 1886.4
0.0 200.0 400.0 600.0 800.0 1000.0 1200.0 1400.0 1600.0 1800.0 2000.0
Los Angeles San Jose
New York San Antonio
New Orleans San Francisco
San Diego Buffalo Detroit
Hartford Cleveland
Miami Chicago Boston
Pittsburgh Sacramento
Philadelphia St. Louis
Denver Houston
Milwaukee Providence
Riverside Virginia Beach
Austin Phoenix
Tampa Dallas
Kansas City Washington DC
Salt Lake City Seattle
Oklahoma City Baltimore
Jacksonville Minneapolis
Portland Orlando
Columbus Cincinnati Las Vegas Richmond Memphis
Louisville Atlanta
Indianapolis Birmingham
Nashville Raleigh
Charlotte
28
Chart 2:
Percentage Growth in Latino Population: 2000-2014
16.8 25.2
32.0 37.5 38.6
42.5 44.2
47.4 50.6 50.9
55.4 57.5 57.7
65.9 69.5 69.8 70.1 72.2 74.2 75.0
78.7 81.3 81.6
85.2 89.3 90.0
93.4 94.2 96.2
107.6 108.1
111.4 111.9
116.1 118.1 119.7
123.3 138.7
145.5 160.4 161.1 163.2
178.5 180.1 181.4 183.4
188.2 188.6
196.0 203.0
0.0 50.0 100.0 150.0 200.0 250.0
Los Angeles San Jose
New York San Francisco
Chicago Detroit
San Diego San Antonio
Miami Cleveland
Buffalo Denver
Hartford Phoenix
Providence Sacramento Milwaukee
Boston Houston
Dallas Riverside
New Orleans Salt Lake City
Philadelphia Portland
Austin Kansas City Minneapolis
St. Louis Las Vegas
Tampa Washington DC
Pittsburgh Atlanta Seattle
Virginia Beach Oklahoma City
Orlando Memphis
Birmingham Columbus
Jacksonville Cincinnati Charlotte Nashville
Raleigh Baltimore
Indianapolis Louisville Richmond
29
Table 2: Rates of Hispanic and Non-Hispanic Population Growth in the
Nation’s Largest Metropolitan Areas: 1990-2014
Metropolitan Area % Change Non-Hispanic
% Change Hispanic
Atlanta 66.3 892.8 Austin 97.3 252.1 Baltimore 12.2 390.5 Birmingham 15.0 1066.7 Boston 7.7 155.3 Buffalo -7.0 116.8 Charlotte 61.6 1886.4 Chicago 2.7 131.2 Cincinnati 14.5 558.1 Cleveland -4.8 122.7 Columbus 32.3 548.4 Dallas 42.9 272.7 Denver 47.7 196.9 Detroit -1.2 117.6 Hartford -0.2 121.1 Houston 38.9 203.8 Indianapolis 30.7 926.1 Jacksonville 44.8 393.7 Kansas City 20.5 296.0 Las Vegas 119.0 656.7 Los Angeles -1.0 52.7 Louisville 18.9 812.9 Memphis 19.4 723.8 Miami 14.9 127.5 Milwaukee 2.2 213.3 Minneapolis 29.0 413.8 Nashville 52.6 1388.3 New Orleans -7.0 96.9 New York 4.1 76.3 Oklahoma City 25.2 378.3 Orlando 48.8 543.6 Philadelphia 5.2 182.2 Phoenix 68.6 257.1 Pittsburgh -5.5 171.7 Portland 41.0 432.6 Providence -1.9 214.5 Raleigh 108.5 1756.8 Richmond 31.3 657.2 Riverside 18.0 220.1 Sacramento 35.4 174.0 St. Louis 6.8 196.4 Salt Lake City 34.8 332.5 San Antonio 41.0 92.8 San Diego 9.7 112.0 San Francisco 12.8 99.1 San Jose 17.7 62.1 Seattle 33.6 368.9 Tampa 24.3 271.6 Virginia Beach 14.3 229.8 Washington DC 30.4 299.7
30
Table 3: Rates of Hispanic and Non-Hispanic Population Growth in the
Nation’s Largest Metropolitan Areas: 2000-2014
Metropolitan Area % Change Non-Hispanic
% Change Hispanic
Atlanta 25.9 116.1 Austin 43.2 90.0 Baltimore 5.4 188.2 Birmingham 6.0 160.4 Boston 3.3 72.2 Buffalo -4.6 55.4 Charlotte 31.5 180.1 Chicago -1.6 38.6 Cincinnati 5.8 178.5 Cleveland -5.9 50.9 Columbus 16.6 161.1 Dallas 22.3 75.0 Denver 20.9 57.5 Detroit -4.9 42.5 Hartford 0.3 57.7 Houston 23.7 74.2 Indianapolis 14.3 188.6 Jacksonville 21.0 163.2 Kansas City 10.0 93.4 Las Vegas 34.3 107.6 Los Angeles 0.5 16.8 Louisville 9.7 196.0 Memphis 7.6 145.5 Miami 1.8 50.6 Milwaukee 0.4 70.1 Minneapolis 12.6 94.2 Nashville 24.8 181.4 New Orleans -10.4 81.3 New York -0.1 32.0 Oklahoma City 14.8 123.3 Orlando 21.9 138.7 Philadelphia 2.2 85.2 Phoenix 28.7 65.9 Pittsburgh -3.9 111.9 Portland 16.3 89.3 Providence -3.4 69.5 Raleigh 48.2 183.4 Richmond 15.2 203.0 Riverside 10.9 78.7 Sacramento 16.7 69.8 St. Louis 2.6 96.2 Salt Lake City 14.9 81.6 San Antonio 24.2 47.4 San Diego 5.7 44.2 San Francisco 5.8 37.5 San Jose 8.3 25.2 Seattle 15.1 118.1 Tampa 11.7 108.1 Virginia Beach 5.9 119.7 Washington DC 16.2 111.4
31
Chart 3: Latino Share of Net Population Growth in Largest U.S. Metropolitan Areas: 1990-2014
Note: In Buffalo, Cleveland, Detroit, Hartford, Los Angeles, New Orleans, Pittsburgh, and Providence, Latinos accounted for all of the metro area’s net population growth between 1990 and 2014
12.0
16.5
16.8
17.4
17.6
18.1
18.2
20.4
20.7
20.8
21.1
22.9
23.3
23.6
25.1
26.7
27.1
29.2
29.6
35.4
36.4
37.8
38.7
39.3
40.6
41.0
43.4
44.6
48.9
49.1
49.3
49.9
55.3
55.6
57.7
66.7
74.8
76.7
77.3
78.1
81.5
85.7
0.0 10.0 20.0 30.0 40.0 50.0 60.0 70.0 80.0 90.0 100.0
Columbus Nashville
Cincinnati Raleigh
Minneapolis Jacksonville
Richmond Louisville
Indianapolis Atlanta
Charlotte Memphis St. Louis
Birmingham Seattle
Portland Virginia Beach
Baltimore Kansas City
Oklahoma City Washington DC
Denver Salt Lake City
Sacramento Austin
Las Vegas Phoenix
Tampa Dallas
San Jose Boston
Orlando San Francisco
Philadelphia Houston
San Antonio San Diego
Miami New York
Milwaukee Riverside Chicago
32
Chart 4: Latino Share of Net Population Growth in Largest U.S. Metropolitan Areas: 2000-2014
Note: In Buffalo, Chicago, Cleveland, Detroit, New Orleans, New York, Pittsburgh, and Providence, Latinos accounted for all of the metro area’s net population growth between 2000 and 2014
14.6
18.7
19.2
20.6
22.4
23.3
23.4
23.7
25.5
25.9
26.2
30.4
30.6
31.7
32.5
33.6
36.1
37.4
38.5
39.3
40.1
41.5
42.3
42.5
43.4
43.5
46.9
48.1
49.8
51.7
55.6
55.9
58.5
59.6
66.6
67.0
73.9
81.5
92.6
93.6
94.5
95.9
0.0 20.0 40.0 60.0 80.0 100.0 120.0
Columbus Raleigh
Nashville Minneapolis
Charlotte Atlanta
Jacksonville Richmond Louisville Cincinnati
Indianapolis Portland
Seattle Memphis
Birmingham Kansas City
St. Louis Oklahoma City
Denver Virginia Beach
Washington DC Baltimore
Salt Lake City Austin
Sacramento Phoenix
Las Vegas Dallas
San Jose Tampa
Orlando Houston
San Francisco Boston
San Antonio Philadelphia
San Diego Riverside
Milwaukee Miami
Hartford Los Angeles
33
Table 4: The Growing Importance of Latino Population Growth to
Demographic Replenishment in Selected Central Cities: 2000-2014
City Change in Total Population
Change in Latino Population
Latino % of net population gain
Austin 256,236 113,781 44.4% Boston 66,910 37,253 55.7% Charlotte 269,146 70,640 26.2% Dallas 92,451 108,211 117.0% Denver 109,226 28,671 26.2% Houston 287,165 257,359 89.6% Kansas City 29,271 16,509 56.4% Las Vegas 135,156 89,654 66.3% Memphis 6,776 22,590 333.4% Milwaukee 2,679 36,512 1362.9% Minneapolis 24,563 10,279 41.8% Oklahoma City 114,421 61,993 54.2% Orlando 76,445 37,325 48.8% Philadelphia 42,747 83,775 196.0% Portland 90,324 27,136 30.0% Providence 5,524 23,086 417.9% Raleigh 163,791 33,308 20.3% Richmond 20,063 9,272 46.2% Sacramento 78,175 55,527 71.0% Seattle 104,963 11,560 11.0%
Table 5:
Latino Population Growth and the Demographic Replenishment of The City of Milwaukee: 1990-2014
1990 2000 2014 % change
1990-2014 % change 2000-2014
Total Population 628,088 596,974 599,653 -4.5% +0.4% Total Non-Hispanic 588,679 525,328 491,495 -16.5% -6.4% Total Hispanic 39,409 71,646 108,158 +174.4% +51.0% Latino % of Total 6.3% 12.0% 18.0%
34
Chart 5: Latino and Non-Hispanic Population Change in Selected Central Cities: 2000-2014
-50,000
0
50,000
100,000
150,000
200,000
250,000
300,000
Non-Hispanic Gain Latino Gain
35
Chart 6: Percentage of Metro Area Hispanics Living in Central City: 2014
3.7 7.5 7.5
10.8 11.7 11.8
14.2 14.4 15.2
16.5 19.7 19.8 19.9 20.1
21.9 23.4
24.9 25.2 26.1
27.1 30.4
31.5 32.0 32.3 32.4 32.5
34.3 38.1 38.6 38.7
40.1 40.3 40.8
41.9 46.7
47.8 50.5 51.4 51.8 52.5 52.5
53.7 59.9
62.0 64.8
67.3 67.7
68.9 69.3
72.0
0.0 10.0 20.0 30.0 40.0 50.0 60.0 70.0 80.0
Atlanta Riverside
Washington DC Orlando
Seattle Miami
Cincinnati Birmingham
St. Louis Tampa
Salt Lake City Richmond Baltimore
New Orleans San Francisco
Portland Pittsburgh
Boston Kansas City
Detroit Sacramento
Hartford Los Angeles
Las Vegas Virginia Beach
Denver Minneapolis
Cleveland San Diego
Chicago Philadelphia
Providence Raleigh
Houston Phoenix
Charlotte Austin
New York Dallas
Louisville Buffalo
Nashville Memphis San Jose
Columbus Milwaukee
Jacksonville Indianapolis
Oklahoma City San Antonio
36
Chart 7: Milwaukee’s Cultural Generation Gap:
Metro Area Population Composition by Age and Race, 2014
87
85
79
68
60
51
49
6
10
13
15
18
21
21
2
1
2
3
4
4
4
3
3
5
9
12
15
16
2
1
2
4
6
9
10
0% 10% 20% 30% 40% 50% 60% 70% 80% 90% 100%
Over 85
65-84
55-64
35-54
18-34
5 to 17
Under 5
WhiteNH Black Asian Latino Others
37
Table 6: Diversity Explosion I: The Ethnolinguistic Generation Gap
In Largest U.S. Metropolitan Areas, 2013
Metropolitan Area WNH % of under 18 population
WNH % of over 65 population
Gap
Phoenix 43.1 84.3 41.2 Riverside 23.3 64.1 40.8 Las Vegas 33.0 70.3 37.3 Dallas 38.6 74.4 35.8 San Diego 33.8 68.9 35.1 Austin 41.7 75.6 33.9 Milwaukee 54.1 86.7 32.6 Houston 29.5 61.8 32.3 Tampa 52.7 84.3 31.6 Sacramento 42.9 74.2 31.3 San Jose 24.0 55.3 31.3 Los Angeles 20.3 50.4 30.1 Orlando 40.7 70.5 29.8 Oklahoma City 54.8 84.3 29.5 San Antonio 25.7 54.3 28.6 Atlanta 42.2 70.7 28.5 Denver 52.9 81.2 28.3 Memphis 37.0 64.4 27.4 Chicago 43.6 71.0 27.4 Hartford 59.6 86.9 27.3 Miami 26.2 53.5 27.3 San Francisco 30.9 57.1 26.2 St. Louis 56.1 82.3 26.2 Charlotte 55.1 81.0 25.9 Portland 64.7 90.0 25.3 Minneapolis 67.5 92.7 25.2 Jacksonville 55.6 79.8 24.2 Providence 67.9 92.0 24.1 Raleigh 54.7 78.4 23.7 New York 42.2 65.6 23.4 Philadelphia 55.1 77.8 22.7 Baltimore 50.7 73.3 22.6 Salt Lake City 66.8 89.3 22.5 New Orleans 44.7 67.1 22.4 Virginia Beach 48.2 70.1 21.9 Washington DC 40.9 62.6 21.7 Boston 66.6 87.5 20.9 Kansas City 65.3 85.9 20.6 Nashville 66.2 86.6 20.4 Birmingham 57.7 78.1 20.4 Indianapolis 67.0 86.8 19.8 Buffalo 69.6 89.3 19.7 Richmond 52.3 71.6 19.3 Columbus 68.2 87.3 19.1 Cleveland 62.6 81.4 18.8 Louisville 70.3 88.5 18.2 Detroit 60.0 77.9 17.9 Seattle 67.4 84.3 16.9 Cincinnati 75.1 88.9 13.8 Pittsburgh 79.9 93.1 13.2
38
Table 7: Diversity Explosion II:
The Shrinking White Non-Hispanic Percentage of Residents Under Age 18 in Large Metropolitan Areas: 1990-2013
Metropolitan Area 1990 2000 2013
Atlanta 65.7 54.2 42.2 Austin 58.7 51.0 41.7 Baltimore 82.8 60.2 50.7 Birmingham 65.2 62.8 57.7 Boston 82.2 74.7 66.6 Buffalo 81.6 75.4 69.6 Charlotte 71.6 65.2 55.1 Chicago 58.2 50.0 43.6 Cincinnati 84.8 81.0 75.1 Cleveland 73.3 67.0 62.6 Columbus 83.6 77.1 68.2 Dallas 62.7 50.3 38.6 Denver 72.4 61.9 52.9 Detroit 67.6 63.0 60.0 Hartford 76.0 68.5 59.6 Houston 50.2 39.8 29.5 Indianapolis 82.3 76.8 67.0 Jacksonville 69.1 62.8 55.6 Kansas City 79.1 72.9 65.3 Las Vegas 67.9 47.8 33.0 Los Angeles 33.0 24.3 20.3 Louisville 83.1 77.8 70.3 Memphis 47.9 42.8 37.0 Miami 49.6 35.7 26.2 Milwaukee 70.8 61.9 54.1 Minneapolis 87.0 77.6 67.5 Nashville 80.1 74.4 66.2 New Orleans 50.3 45.3 44.7 New York 53.7 46.4 42.2 Oklahoma City 74.1 64.7 54.8 Orlando 70.2 55.2 40.7 Philadelphia 70.5 63.5 55.1 Phoenix 66.2 52.6 43.1 Pittsburgh 88.7 84.5 79.9 Portland 86.7 75.2 64.7 Providence 87.6 76.9 67.9 Raleigh 71.1 65.3 54.7 Richmond 74.9 58.1 52.3 Riverside 53.3 35.4 23.3 Sacramento 65.8 53.4 42.9 Salt Lake City 88.7 77.0 66.8 San Antonio 35.8 31.2 25.7 San Diego 53.9 41.3 33.8 San Francisco 48.2 38.0 30.9 San Jose 47.0 34.4 24.0 Seattle 80.8 69.0 56.1 St. Louis 77.5 72.0 67.4 Tampa 74.5 65.0 52.7 Virginia Beach 76.6 53.4 48.2 Washington DC 75.4 49.6 40.9
39
Table 8: Culture Shock I: The Ethnolinguistic Generation Gap
In Largest U.S. Metropolitan Areas, 2013
Metropolitan Area Hispanic % of under 18
population
Hispanic % of over 65
population
Gap
Riverside 60.8 22.4 38.4 Los Angeles 58.5 23.5 35.0 Phoenix 42.7 9.7 33.0 Las Vegas 42.3 10.6 31.7 San Diego 45.6 15.8 29.8 Houston 45.2 16.3 28.9 Austin 42.9 14.7 28.2 Dallas 37.4 9.9 27.5 San Antonio 64.2 38.3 25.9 San Jose 37.7 13.8 23.9 Denver 32.9 10.5 22.4 Chicago 29.6 7.9 21.7 San Francisco 31.4 9.9 21.5 Sacramento 29.3 8.7 20.6 Orlando 32.6 15.7 16.9 Salt Lake City 22.5 6.2 16.3 Portland 18.4 2.4 16.0 Tampa 23.9 7.9 16.0 Oklahoma City 18.7 2.8 15.9 New York 28.3 12.9 15.4 Hartford 19.8 4.5 15.3 Providence 17.6 3.0 14.6 Washington DC 18.4 5.1 13.3 Milwaukee 15.4 2.7 12.7 Raleigh 15.1 2.3 12.8 Seattle 14.9 2.3 12.6 Atlanta 14.5 2.8 11.7 Charlotte 13.7 2.1 11.6 Boston 13.8 3.3 10.5 Kansas City 12.7 2.6 10.1 Philadelphia 12.1 2.7 9.4 Miami 42.8 33.7 9.1 Nashville 10.2 1.3 8.9 Indianapolis 9.3 1.2 8.1 Minneapolis 8.7 1.2 7.5 Richmond 7.6 1.2 6.4 Virginia Beach 7.9 1.5 6.4 Memphis 7.2 1.1 6.1 Cleveland 7.8 1.8 6.0 Jacksonville 9.5 3.5 6.0 Buffalo 7.4 1.4 6.0 Birmingham 6.6 0.8 5.8 Baltimore 6.9 1.3 5.6 Louisville 6.2 0.9 5.3 Columbus 5.6 0.8 4.8 Detroit 6.3 1.5 4.8 New Orleans 8.8 4.9 3.9 Cincinnati 4.2 0.7 3.5 St. Louis 4.0 0.9 3.1 Pittsburgh 2.2 0.5 1.7
40
Table 9: Culture Shock II:
The Growing Hispanic Percentage of Residents Under Age 18 in Large Metropolitan Areas: 1990-2013
Metropolitan Area 1990 2000 2013
Atlanta 2.1 7.0 14.5 Austin 28.6 34.6 42.9 Baltimore 1.8 2.5 6.9 Birmingham 0.5 2.1 6.6 Boston 7.3 9.4 13.8 Buffalo 3.3 4.7 7.4 Charlotte 1.0 5.6 13.7 Chicago 15.6 22.0 29.6 Cincinnati 0.7 1.4 4.2 Cleveland 3.6 5.1 7.8 Columbus 0.9 2.2 5.6 Dallas 18.0 28.1 37.4 Denver 17.8 25.2 32.9 Detroit 2.7 3.9 6.3 Hartford 11.8 14.6 19.8 Houston 26.9 35.9 45.2 Indianapolis 1.1 3.2 9.3 Jacksonville 2.9 4.7 9.5 Kansas City 3.8 6.9 12.7 Las Vegas 15.3 31.5 42.3 Los Angeles 47.4 54.2 58.5 Louisville 0.8 2.1 6.2 Memphis 0.8 2.6 7.2 Miami 27.8 33.4 42.8 Milwaukee 5.8 9.4 15.4 Minneapolis 2.3 4.7 8.7 Nashville 1.0 3.8 10.2 New Orleans 1.8 4.3 8.8 New York 20.5 23.6 28.3 Oklahoma City 5.3 10.2 18.7 Orlando 10.7 20.7 32.6 Philadelphia 5.2 7.2 12.1 Phoenix 25.6 36.2 42.7 Pittsburgh 0.7 1.0 2.2 Portland 4.8 10.8 18.4 Providence 6.1 11.3 17.6 Raleigh 1.6 6.7 15.1 Richmond 1.3 2.7 7.6 Riverside 34.9 48.4 60.8 Sacramento 16.0 21.4 29.3 Salt Lake City 7.2 14.5 22.5 San Antonio 57.1 59.5 64.2 San Diego 29.5 38.1 45.6 San Francisco 19.2 25.2 31.4 San Jose 30.1 33.6 37.7 Seattle 4.2 7.7 14.9 St. Louis 1.0 2.0 4.0 Tampa 9.0 14.5 23.9 Virginia Beach 1.5 4.1 7.9 Washington DC 6.6 10.7 18.4
41
Chart 8: The Growing Cultural Generation Gap in Milwaukee: 1990-2014
White Non-Hispanic Share of the “Over 65” and “Under 18” Population
70.8
61.9
53.3
93.4 90.1
85.6
30
40
50
60
70
80
90
100
1990 2000 2014
WNH% <18 WNH %>65
42
Chart 9: The Growing Cultural Generation Gap in Milwaukee: 1990-‐2014
Latino Share of the “Over 65” and “Under 18” Population
5.8
9.4
16.3
1.0 1.6 2.9
0
2
4
6
8
10
12
14
16
18
1990 2000 2014
Hispanic% <18 Hispanic %>65
43
Chart 10: Percentage of Males in Adult Population, By Race, in Metro Milwaukee: 2014
% of males in each group’s over 18 years old population
44.3
48.4
51.0
40.0
42.0
44.0
46.0
48.0
50.0
52.0
Black WhiteNH Latino
44
Chart 11: Percentage of Metro Area Latinos Over 18 Who Are Male: 2014
47.9 48.2 48.4
48.7 48.8 48.8 49.0 49.0
49.3 49.5 49.5 49.7 49.7 49.8 49.9 50.0
50.2 50.2 50.4 50.4 50.5 50.6 50.7 50.8 50.9 50.9 51.0 51.1 51.2 51.4 51.5 51.6 51.6 51.6 51.8
52.3 52.3 52.4 52.4 52.5 52.5 52.7 52.9 52.9 53.0
53.5 53.8 53.9
56.7 56.8
42.0 44.0 46.0 48.0 50.0 52.0 54.0 56.0 58.0
Miami Orlando
San Antonio Tampa
Hartford New York
Boston San Diego
Providence Los Angeles
Buffalo Cleveland Riverside
Sacramento Detroit
Jacksonville Denver
Phoenix Pittsburgh Las Vegas
San Jose Austin
Philadelphia San Francisco
Virginia Beach Dallas
Milwaukee Houston Chicago
Indianapolis Kansas City
Raleigh Charlotte
Salt Lake City Washington
Louisville Atlanta
St. Louis Minneapolis
Portland Columbus
Oklahoma City Baltimore
Seattle Cincinnati
New Orleans Richmond Nashville Memphis
Birmingham
45
Chart 12: Composition of Milwaukee’s Latino Community By Place of Birth and Citizenship Status: 2014
72.8
6.7
20.5
Native-born
Foreign-born, US Citizen
Foreign-born, Not Citizen
46
Chart 13: National Origins of Metro Milwaukee Latino Population: 2014
Chart 14: Place of Birth for Milwaukee’s Latino Foreign-Born Population: 2010
66.8
23.3
3.0 2.5
2.8
Mexican
Puerto Rican
Central American
South American
Other
87.2
5.3 4.4
2.1 1.0
Mexico
Central America
South America
Carribean
Other
47
Table 10: Decade of Entry of Metro Milwaukee’s Latino Foreign-Born Population: 2010
Decade of Entry
% of Total Foreign-Born Latinos Entered During Decade
Entered 2000 or later 43.8 Entered 1990 to 1999 33.3 Entered 1980 to 1999 13.0 Entered Before 1980 10.0 Total 100.0
Table 11: Citizenship of Metro Milwaukee’s Latino Foreign-Born Population
By Decade of Entry: 2010
Decade of Entry
% of Total Foreign-Born Latinos Who Are U.S. Citizens
Entered 2000 or later 5.7 Entered 1990 to 1999 15.0 Entered 1980 to 1999 42.8 Entered Before 1980 67.5 All FB Latinos/All Decades 19.8
Table 12: Decade of Entry of Milwaukee’s Latino Foreign-Born Population: 2010 City of Milwaukee, Waukesha County, and Milwaukee County Suburbs
% of foreign-born Latinos by decade of entry to the U.S.
Decade of Entry City of Milwaukee
Milwaukee County Suburbs
Waukesha County
Entered 2000 or later 45.7 36.3 32.8 Entered 1990 to 1999 33.8 26.9 37.8 Entered 1980 to 1999 12.1 17.4 16.2 Entered Before 1980 8.5 19.4 13.2 Total 100.0 100.0 100.0
48
Chart 15: Percentage of Latinos Who Are US Citizens, Born in the US
In the City of Milwaukee, Waukesha County, and Milwaukee County Suburbs: 2010
Chart 16:
Percentage of Latinos Who Are Not US Citizens In the City of Milwaukee, Waukesha County, and Milwaukee County Suburbs: 2010
54.9
72.1 75.6
0
10
20
30
40
50
60
70
80
City of Milwaukee Milwaukee Co. Suburbs Waukesha Co.
29.4
12.9 15.3
0
5
10
15
20
25
30
35
City of Milwaukee Milwaukee Co. Suburbs Waukesha Co.
49
Chart 17: Percentage of Metro Area Latinos Who Are Not Citizens: 2014
4.7 6.8
10.2 10.4
11.7 14.2 14.8
16.2 17.8 18.2 18.7 19.1
19.8 20.5 20.5 20.6 21.0 21.1 21.5 21.6
23.0 24.1 24.5 24.7 25.0 25.0
25.7 25.9 26.2 26.3 26.7
27.4 27.5 27.5
28.6 29.4 29.5 29.7
31.1 31.2 31.3
32.1 35.0 35.2
37.5 37.7
38.3 40.4 40.7
43.0
0.0 5.0 10.0 15.0 20.0 25.0 30.0 35.0 40.0 45.0 50.0
Buffalo Cleveland
Hartford San Antonio
Pittsburgh Orlando
Jacksonville Virginia Beach
Sacramento Philadelphia
Riverside Tampa
St. Louis San Diego
Milwaukee Detroit
Phoenix Denver
Providence Austin
San Jose Chicago Boston
New York Kansas City
Seattle Columbus
Los Angeles Baltimore Cincinnati
Salt Lake City San Francisco
Las Vegas Miami
Portland Minneapolis
Houston Dallas
New Orleans Oklahoma City
Richmond Indianapolis
Raleigh Atlanta
Louisville Washington
Charlotte Nashville Memphis
Birmingham
50
Chart 18: Percentage of Metro Area Latinos Over 18 Years Who Are Not Citizens: 2014
5.6 10.3
14.0 14.1
17.6 17.8
20.6 21.7
24.6 24.7 25.0
26.7 27.4 28.0
29.1 29.4 29.7 30.1 30.4 30.8 31.1 31.6 31.6 32.0
33.8 34.6 34.9
35.9 36.2 36.5 36.9 37.3 38.0 38.5
40.7 41.3
42.6 43.0 43.4
44.6 47.4 47.8
48.7 49.8
51.0 51.5
56.1 57.5
58.5 62.8
0.0 10.0 20.0 30.0 40.0 50.0 60.0 70.0
Buffalo Cleveland
San Antonio Hartford Orlando
Pittsburgh Jacksonville
Virginia Beach Sacramento
Philadelphia Tampa
Riverside St. Louis
San Diego Austin Detroit Denver
Providence Phoenix
Milwaukee San Jose
Miami New York
Boston Cincinnati
Chicago Los Angeles
San Francisco Seattle
Baltimore Kansas City
New Orleans Columbus Las Vegas
Salt Lake City Houston Portland
Dallas Richmond
Minneapolis Oklahoma City
Louisville Indianapolis
Washington, D.C. Raleigh Atlanta
Charlotte Birmingham
Nashville Memphis
51
Chart 19: Hispanic Population Born Outside The United States: 2014
Percentage Entered Before 2000
32.7 32.8
36.2 36.3 36.4
37.8 37.9
40.3 40.7
41.7 42.8 43.3 43.6
44.6 45.4 46.2 46.8 47.0 47.3 47.4 47.5
48.6 48.9 49.0
50.6 50.7 51.5 51.6 51.8 52.1 52.8 53.0
54.7 56.3 57.2 57.4 57.7 58.1
60.6 60.8 61.6
63.0 63.8
65.4 66.3
69.9 70.5 71.0
73.9 75.9
0.0 10.0 20.0 30.0 40.0 50.0 60.0 70.0 80.0
Birmingham Louisville Cincinnati Richmond Columbus Nashville Memphis
Philadelphia Raleigh
Indianapolis Virginia Beach
St. Louis Hartford Charlotte
Oklahoma City New Orleans
Austin Washington
Pittsburgh Kansas City
Boston Baltimore
Minneapolis Seattle
Jacksonville Milwaukee
Detroit Atlanta
Cleveland Tampa
Orlando Providence
Buffalo Houston Denver Miami Dallas
New York San Francisco Salt Lake City
Portland Sacramento
Las Vegas Phoenix San Jose
San Diego Chicago
San Antonio Los Angeles
Riverside
52
Chart 20: Hispanic Population Born Outside The United States: 2014
Percentage Entered 2000 or later
24.1 26.1
29.0 29.5 30.1
33.7 34.6
36.2 37.0
38.4 39.2 39.4
41.9 42.3 42.6 42.8 43.7
45.3 47.0 47.2 47.9 48.2 48.4 48.5 49.3 49.4
51.0 51.1 51.4
52.5 52.6 52.7 53.0 53.2 53.8 54.6 55.4
56.4 56.7 57.2
58.3 59.3 59.7
62.1 62.2
63.6 63.7 63.8
67.2 67.3
0.0 10.0 20.0 30.0 40.0 50.0 60.0 70.0 80.0
Riverside Los Angeles San Antonio
Chicago San Diego
San Jose Phoenix
Las Vegas Sacramento
Portland Salt Lake City San Francisco
New York Dallas Miami Denver
Houston Buffalo
Providence Orlando
Tampa Cleveland
Atlanta Detroit
Milwaukee Jacksonville
Seattle Minneapolis
Baltimore Boston
Kansas City Pittsburgh
Washington Austin
New Orleans Oklahoma City
Charlotte Hartford St. Louis
Virginia Beach Indianapolis
Raleigh Philadelphia
Memphis Nashville
Columbus Richmond Cincinnati Louisville
Birmingham
53
Chart 21: Hispanic Population Born Outside The United States: 2014
Percentage Entered 2010 or later
3.4 3.8
4.5 4.6
5.1 5.1
5.6 5.7 5.8 5.9
6.2 6.4 6.5 6.6 6.7 6.9 7.1
8.3 8.5 8.6 8.7
9.0 9.1
9.5 9.6 9.7 9.7
10.3 10.4 10.6 10.6
11.1 11.6 11.7 11.8 12.0
12.3 12.3
12.8 12.8 12.9
13.4 13.7
14.4 14.5
16.6 17.0 17.1 17.2
21.8
0.0 5.0 10.0 15.0 20.0 25.0
Riverside Los Angeles Milwaukee
Chicago Sacramento
Salt Lake City San Jose
San Diego Portland Phoenix Denver
San Antonio Las Vegas Cincinnati
Birmingham San Francisco
Buffalo Atlanta Dallas Seattle
Cleveland Detroit
Charlotte Louisville
Kansas City Houston
Indianapolis Raleigh
Minneapolis Memphis
New York Richmond
Washington Austin
Pittsburgh Oklahoma City
Columbus Jacksonville Providence
Tampa Miami
Orlando Nashville Hartford
Baltimore New Orleans
Virginia Beach Boston
Philadelphia St. Louis
54
Chart 22: Estimated Unauthorized Percentage of Foreign-Born Latinos
In Selected Large Urban Counties: 2013
12.4 20.8
36.1 39.1 39.3 39.5 41.3 43.2 45.5 45.6 47.5 47.6 47.8
51.7 55.4 57.2 58.4 59.1 60.8 61.2 62.5 62.9 63.5
68.4 73.7
0.0 10.0 20.0 30.0 40.0 50.0 60.0 70.0 80.0
Miami (Miami-Dade) Orlando (Orange)
Phildelphia (Philadelphia) Providence (Providence)
Hartford (Hartford) Las Vegas (Clark)
Riverside (Riverside) Los Angeles (Los Angeles)
Minneapolis (Hennipin) Houston (Harris)
Salt Lake City (Salt Lake) Phoenix (Maricopa)
Chicago (Cook) Seattle (King)
Milwaukee (Milwaukee) Denver (Denver)
Austin (Travis) Atlanta (Fulton)
Oklahoma City (Oklahoma) Kansas City (Jackson)
Charlotte (Mecklenberg) Indianapolis (Marion)
Raleigh (Wake) Memphis (Shelby)
Nashville (Davidson)
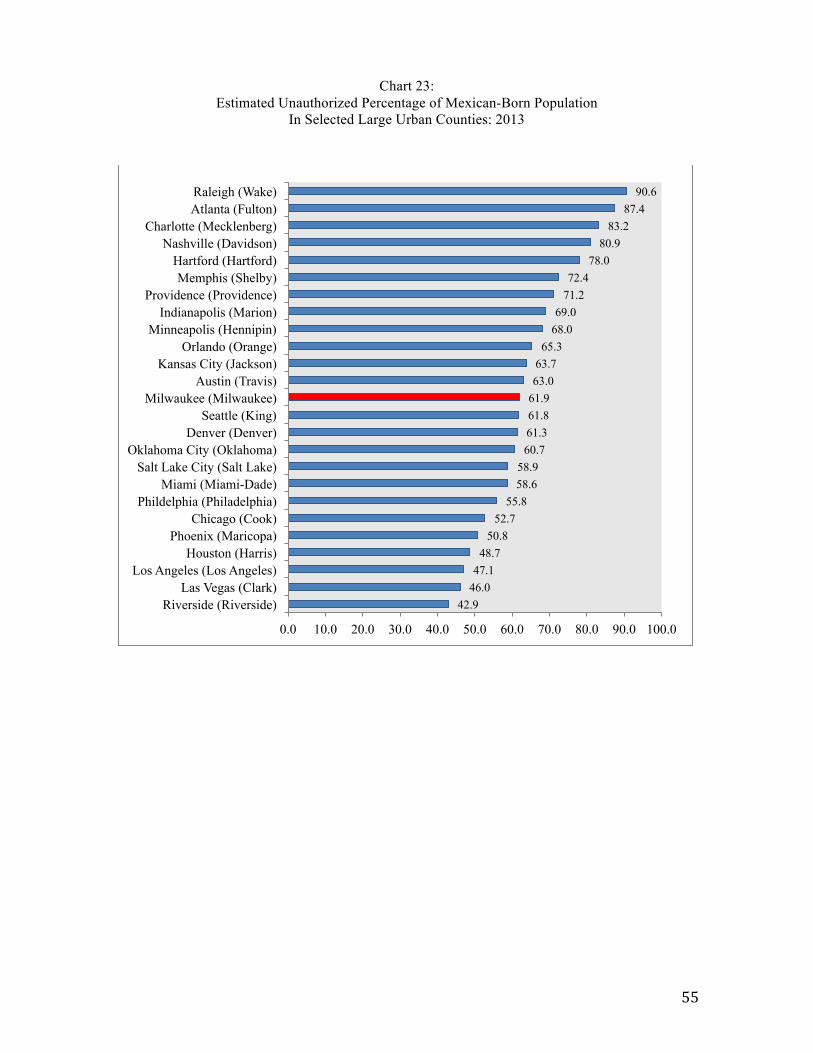
55
Chart 23: Estimated Unauthorized Percentage of Mexican-Born Population
In Selected Large Urban Counties: 2013
42.9 46.0 47.1
48.7 50.8
52.7 55.8
58.6 58.9
60.7 61.3 61.8 61.9 63.0 63.7 65.3
68.0 69.0
71.2 72.4
78.0 80.9
83.2 87.4
90.6
0.0 10.0 20.0 30.0 40.0 50.0 60.0 70.0 80.0 90.0 100.0
Riverside (Riverside) Las Vegas (Clark)
Los Angeles (Los Angeles) Houston (Harris)
Phoenix (Maricopa) Chicago (Cook)
Phildelphia (Philadelphia) Miami (Miami-Dade)
Salt Lake City (Salt Lake) Oklahoma City (Oklahoma)
Denver (Denver) Seattle (King)
Milwaukee (Milwaukee) Austin (Travis)
Kansas City (Jackson) Orlando (Orange)
Minneapolis (Hennipin) Indianapolis (Marion)
Providence (Providence) Memphis (Shelby)
Hartford (Hartford) Nashville (Davidson)
Charlotte (Mecklenberg) Atlanta (Fulton) Raleigh (Wake)
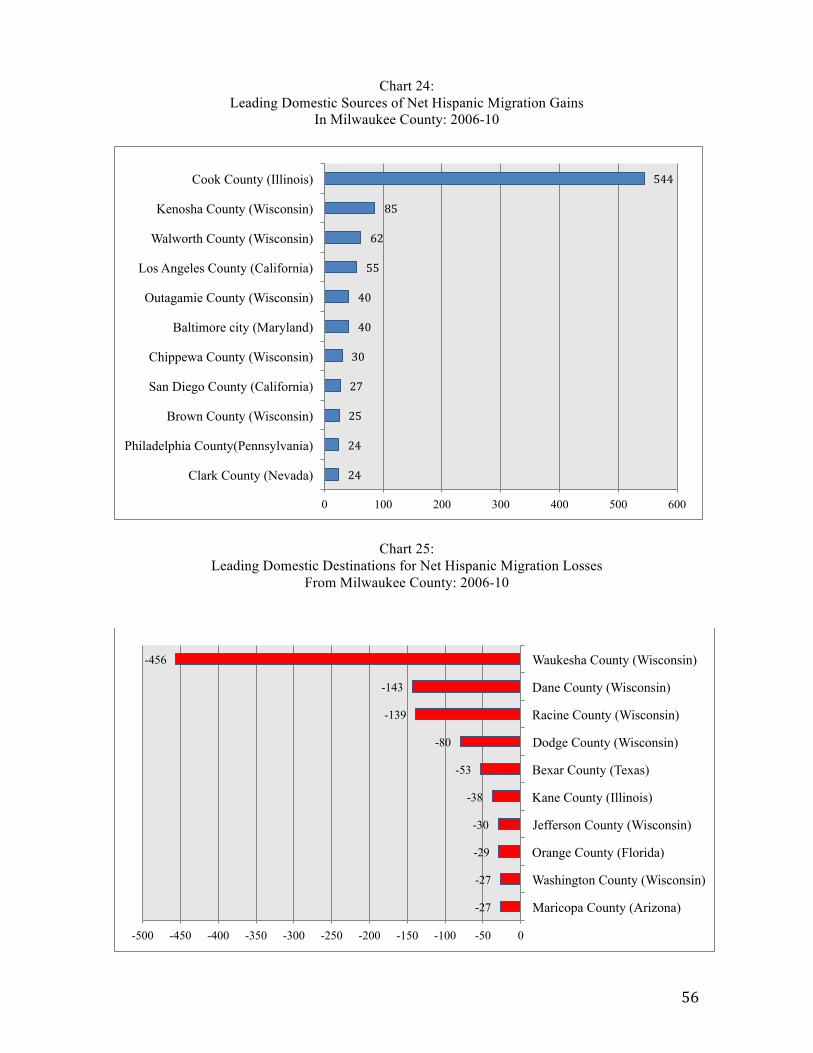
56
Chart 24: Leading Domestic Sources of Net Hispanic Migration Gains
In Milwaukee County: 2006-10
Chart 25: Leading Domestic Destinations for Net Hispanic Migration Losses
From Milwaukee County: 2006-10
24
24
25
27
30
40
40
55
62
85
544
0 100 200 300 400 500 600
Clark County (Nevada)
Philadelphia County(Pennsylvania)
Brown County (Wisconsin)
San Diego County (California)
Chippewa County (Wisconsin)
Baltimore city (Maryland)
Outagamie County (Wisconsin)
Los Angeles County (California)
Walworth County (Wisconsin)
Kenosha County (Wisconsin)
Cook County (Illinois)
-27
-27
-29
-30
-38
-53
-80
-139
-143
-456
-500 -450 -400 -350 -300 -250 -200 -150 -100 -50 0
Maricopa County (Arizona)
Washington County (Wisconsin)
Orange County (Florida)
Jefferson County (Wisconsin)
Kane County (Illinois)
Bexar County (Texas)
Dodge County (Wisconsin)
Racine County (Wisconsin)
Dane County (Wisconsin)
Waukesha County (Wisconsin)
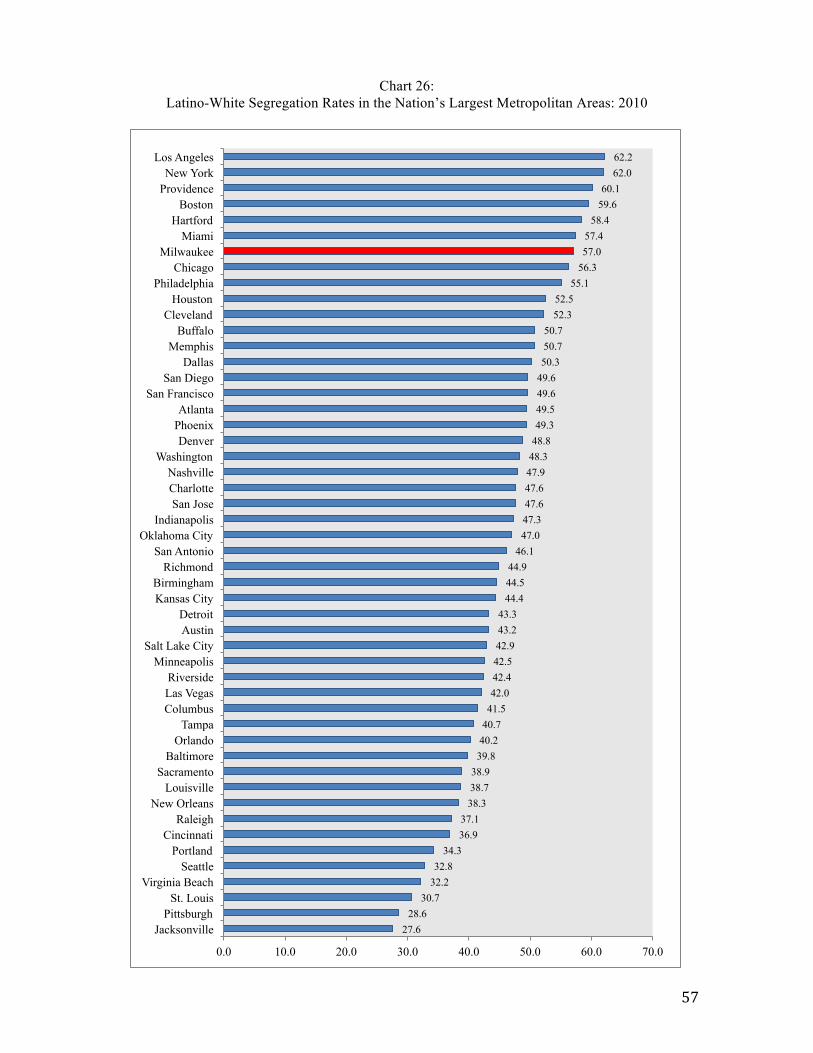
57
Chart 26: Latino-White Segregation Rates in the Nation’s Largest Metropolitan Areas: 2010
27.6 28.6
30.7 32.2 32.8
34.3 36.9 37.1
38.3 38.7 38.9
39.8 40.2 40.7 41.5 42.0 42.4 42.5 42.9 43.2 43.3
44.4 44.5 44.9
46.1 47.0 47.3 47.6 47.6 47.9 48.3 48.8 49.3 49.5 49.6 49.6 50.3 50.7 50.7
52.3 52.5
55.1 56.3 57.0 57.4
58.4 59.6 60.1
62.0 62.2
0.0 10.0 20.0 30.0 40.0 50.0 60.0 70.0
Jacksonville Pittsburgh
St. Louis Virginia Beach
Seattle Portland
Cincinnati Raleigh
New Orleans Louisville
Sacramento Baltimore
Orlando Tampa
Columbus Las Vegas Riverside
Minneapolis Salt Lake City
Austin Detroit
Kansas City Birmingham
Richmond San Antonio
Oklahoma City Indianapolis
San Jose Charlotte Nashville
Washington Denver
Phoenix Atlanta
San Francisco San Diego
Dallas Memphis
Buffalo Cleveland
Houston Philadelphia
Chicago Milwaukee
Miami Hartford
Boston Providence New York
Los Angeles
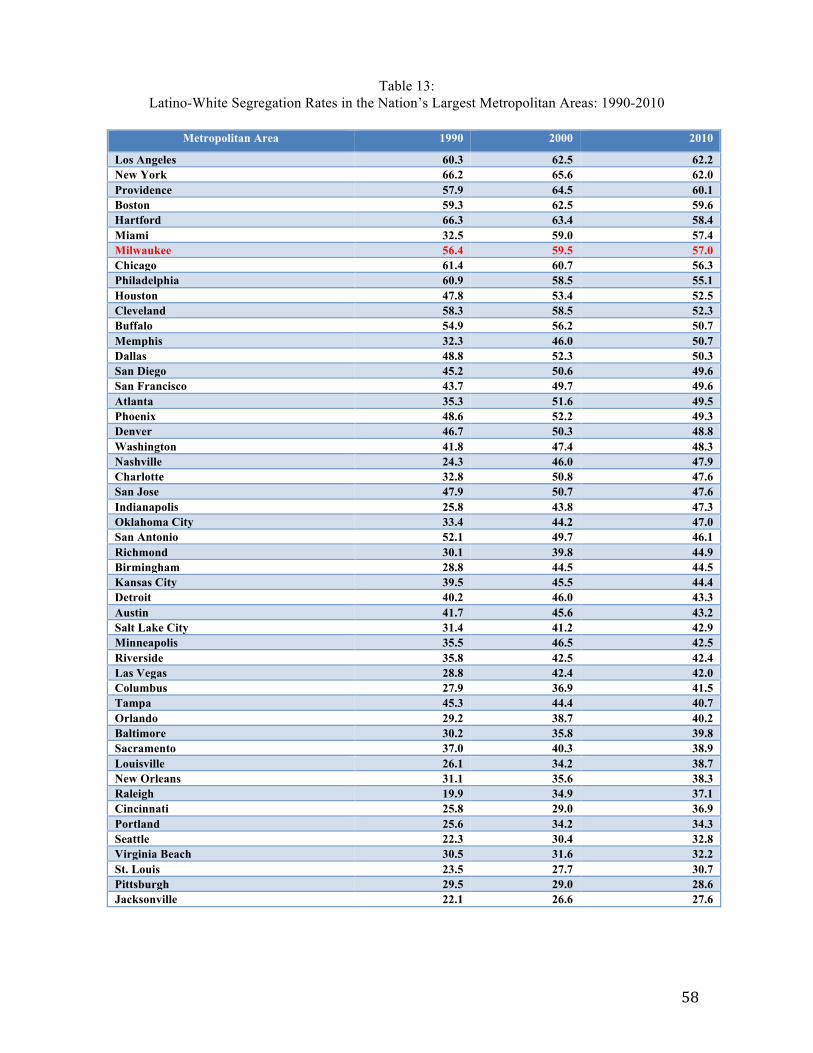
58
Table 13: Latino-White Segregation Rates in the Nation’s Largest Metropolitan Areas: 1990-2010
Metropolitan Area 1990 2000 2010
Los Angeles 60.3 62.5 62.2 New York 66.2 65.6 62.0 Providence 57.9 64.5 60.1 Boston 59.3 62.5 59.6 Hartford 66.3 63.4 58.4 Miami 32.5 59.0 57.4 Milwaukee 56.4 59.5 57.0 Chicago 61.4 60.7 56.3 Philadelphia 60.9 58.5 55.1 Houston 47.8 53.4 52.5 Cleveland 58.3 58.5 52.3 Buffalo 54.9 56.2 50.7 Memphis 32.3 46.0 50.7 Dallas 48.8 52.3 50.3 San Diego 45.2 50.6 49.6 San Francisco 43.7 49.7 49.6 Atlanta 35.3 51.6 49.5 Phoenix 48.6 52.2 49.3 Denver 46.7 50.3 48.8 Washington 41.8 47.4 48.3 Nashville 24.3 46.0 47.9 Charlotte 32.8 50.8 47.6 San Jose 47.9 50.7 47.6 Indianapolis 25.8 43.8 47.3 Oklahoma City 33.4 44.2 47.0 San Antonio 52.1 49.7 46.1 Richmond 30.1 39.8 44.9 Birmingham 28.8 44.5 44.5 Kansas City 39.5 45.5 44.4 Detroit 40.2 46.0 43.3 Austin 41.7 45.6 43.2 Salt Lake City 31.4 41.2 42.9 Minneapolis 35.5 46.5 42.5 Riverside 35.8 42.5 42.4 Las Vegas 28.8 42.4 42.0 Columbus 27.9 36.9 41.5 Tampa 45.3 44.4 40.7 Orlando 29.2 38.7 40.2 Baltimore 30.2 35.8 39.8 Sacramento 37.0 40.3 38.9 Louisville 26.1 34.2 38.7 New Orleans 31.1 35.6 38.3 Raleigh 19.9 34.9 37.1 Cincinnati 25.8 29.0 36.9 Portland 25.6 34.2 34.3 Seattle 22.3 30.4 32.8 Virginia Beach 30.5 31.6 32.2 St. Louis 23.5 27.7 30.7 Pittsburgh 29.5 29.0 28.6 Jacksonville 22.1 26.6 27.6
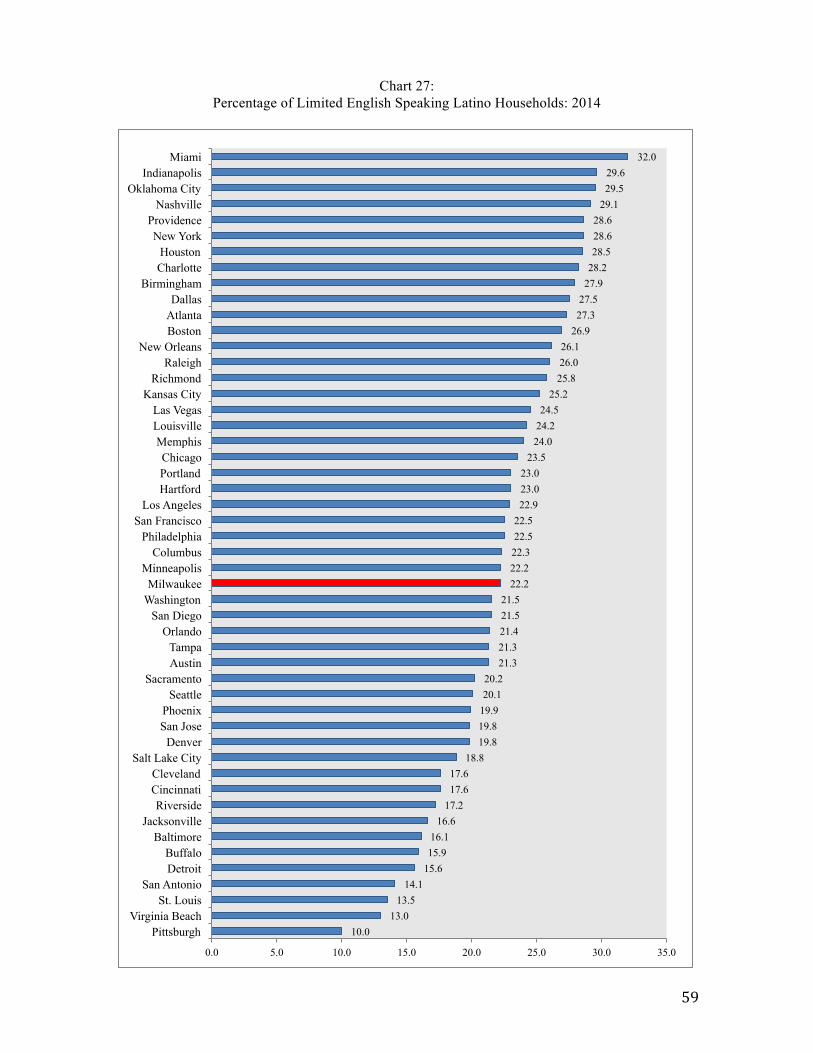
59
Chart 27: Percentage of Limited English Speaking Latino Households: 2014
10.0 13.0
13.5 14.1
15.6 15.9 16.1
16.6 17.2 17.6 17.6
18.8 19.8 19.8 19.9 20.1 20.2
21.3 21.3 21.4 21.5 21.5
22.2 22.2 22.3 22.5 22.5 22.9 23.0 23.0
23.5 24.0 24.2 24.5
25.2 25.8 26.0 26.1
26.9 27.3 27.5 27.9 28.2 28.5 28.6 28.6
29.1 29.5 29.6
32.0
0.0 5.0 10.0 15.0 20.0 25.0 30.0 35.0
Pittsburgh Virginia Beach
St. Louis San Antonio
Detroit Buffalo
Baltimore Jacksonville
Riverside Cincinnati Cleveland
Salt Lake City Denver
San Jose Phoenix
Seattle Sacramento
Austin Tampa
Orlando San Diego
Washington Milwaukee
Minneapolis Columbus
Philadelphia San Francisco
Los Angeles Hartford Portland Chicago
Memphis Louisville Las Vegas
Kansas City Richmond
Raleigh New Orleans
Boston Atlanta Dallas
Birmingham Charlotte Houston
New York Providence
Nashville Oklahoma City
Indianapolis Miami
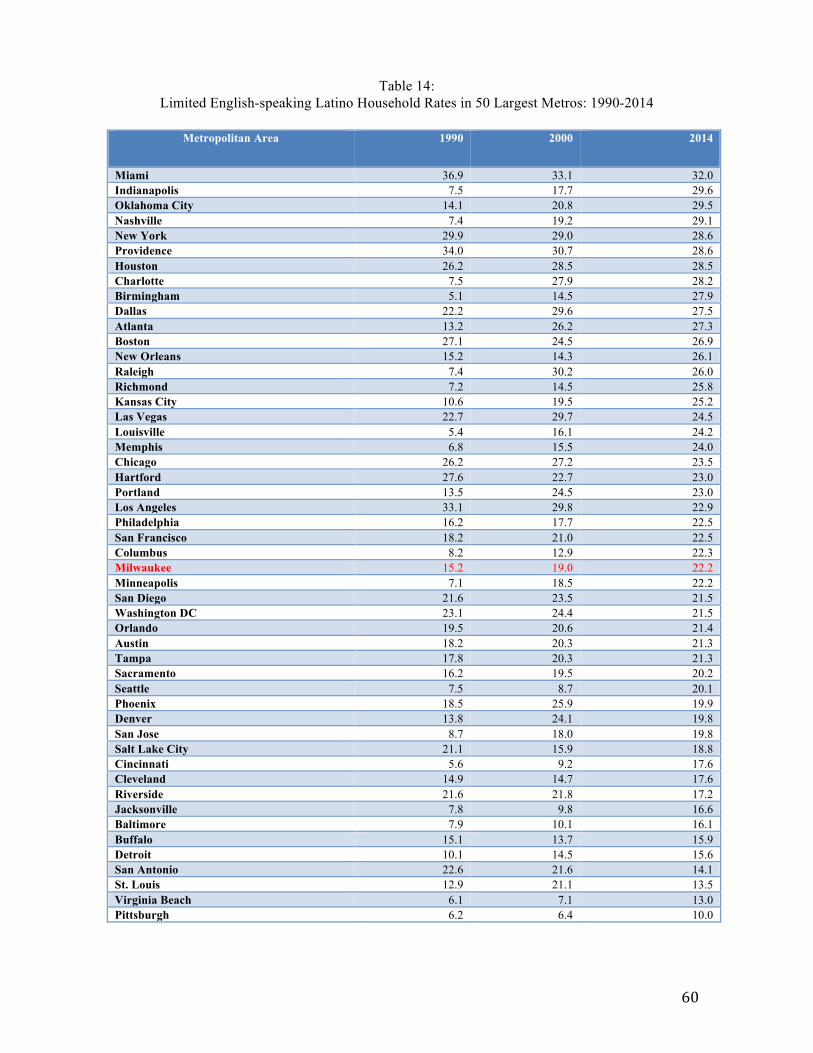
60
Table 14: Limited English-speaking Latino Household Rates in 50 Largest Metros: 1990-2014
Metropolitan Area 1990 2000 2014
Miami 36.9 33.1 32.0 Indianapolis 7.5 17.7 29.6 Oklahoma City 14.1 20.8 29.5 Nashville 7.4 19.2 29.1 New York 29.9 29.0 28.6 Providence 34.0 30.7 28.6 Houston 26.2 28.5 28.5 Charlotte 7.5 27.9 28.2 Birmingham 5.1 14.5 27.9 Dallas 22.2 29.6 27.5 Atlanta 13.2 26.2 27.3 Boston 27.1 24.5 26.9 New Orleans 15.2 14.3 26.1 Raleigh 7.4 30.2 26.0 Richmond 7.2 14.5 25.8 Kansas City 10.6 19.5 25.2 Las Vegas 22.7 29.7 24.5 Louisville 5.4 16.1 24.2 Memphis 6.8 15.5 24.0 Chicago 26.2 27.2 23.5 Hartford 27.6 22.7 23.0 Portland 13.5 24.5 23.0 Los Angeles 33.1 29.8 22.9 Philadelphia 16.2 17.7 22.5 San Francisco 18.2 21.0 22.5 Columbus 8.2 12.9 22.3 Milwaukee 15.2 19.0 22.2 Minneapolis 7.1 18.5 22.2 San Diego 21.6 23.5 21.5 Washington DC 23.1 24.4 21.5 Orlando 19.5 20.6 21.4 Austin 18.2 20.3 21.3 Tampa 17.8 20.3 21.3 Sacramento 16.2 19.5 20.2 Seattle 7.5 8.7 20.1 Phoenix 18.5 25.9 19.9 Denver 13.8 24.1 19.8 San Jose 8.7 18.0 19.8 Salt Lake City 21.1 15.9 18.8 Cincinnati 5.6 9.2 17.6 Cleveland 14.9 14.7 17.6 Riverside 21.6 21.8 17.2 Jacksonville 7.8 9.8 16.6 Baltimore 7.9 10.1 16.1 Buffalo 15.1 13.7 15.9 Detroit 10.1 14.5 15.6 San Antonio 22.6 21.6 14.1 St. Louis 12.9 21.1 13.5 Virginia Beach 6.1 7.1 13.0 Pittsburgh 6.2 6.4 10.0
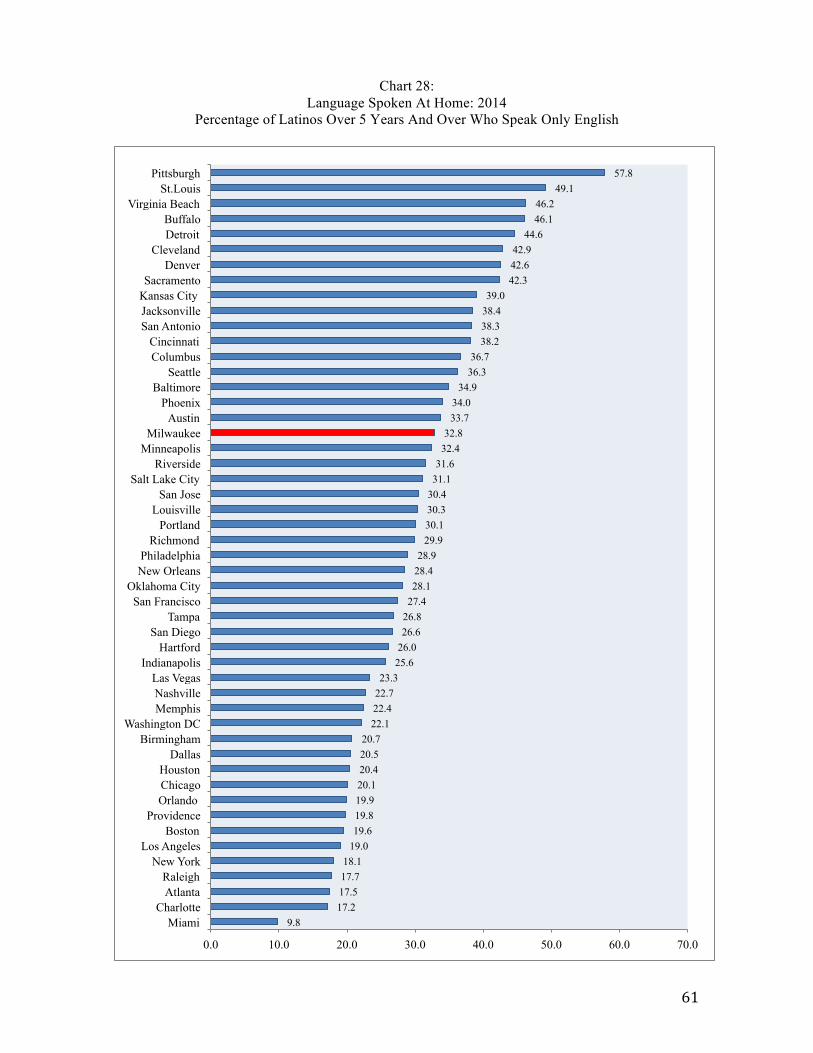
61
Chart 28: Language Spoken At Home: 2014
Percentage of Latinos Over 5 Years And Over Who Speak Only English
9.8 17.2 17.5 17.7 18.1
19.0 19.6 19.8 19.9 20.1 20.4 20.5 20.7
22.1 22.4 22.7 23.3
25.6 26.0 26.6 26.8 27.4 28.1 28.4 28.9
29.9 30.1 30.3 30.4 31.1 31.6
32.4 32.8
33.7 34.0
34.9 36.3 36.7
38.2 38.3 38.4 39.0
42.3 42.6 42.9
44.6 46.1 46.2
49.1 57.8
0.0 10.0 20.0 30.0 40.0 50.0 60.0 70.0
Miami Charlotte
Atlanta Raleigh
New York Los Angeles
Boston Providence
Orlando Chicago Houston
Dallas Birmingham
Washington DC Memphis Nashville Las Vegas
Indianapolis Hartford
San Diego Tampa
San Francisco Oklahoma City
New Orleans Philadelphia
Richmond Portland
Louisville San Jose
Salt Lake City Riverside
Minneapolis Milwaukee
Austin Phoenix
Baltimore Seattle
Columbus Cincinnati
San Antonio Jacksonville Kansas City Sacramento
Denver Cleveland
Detroit Buffalo
Virginia Beach St.Louis
Pittsburgh
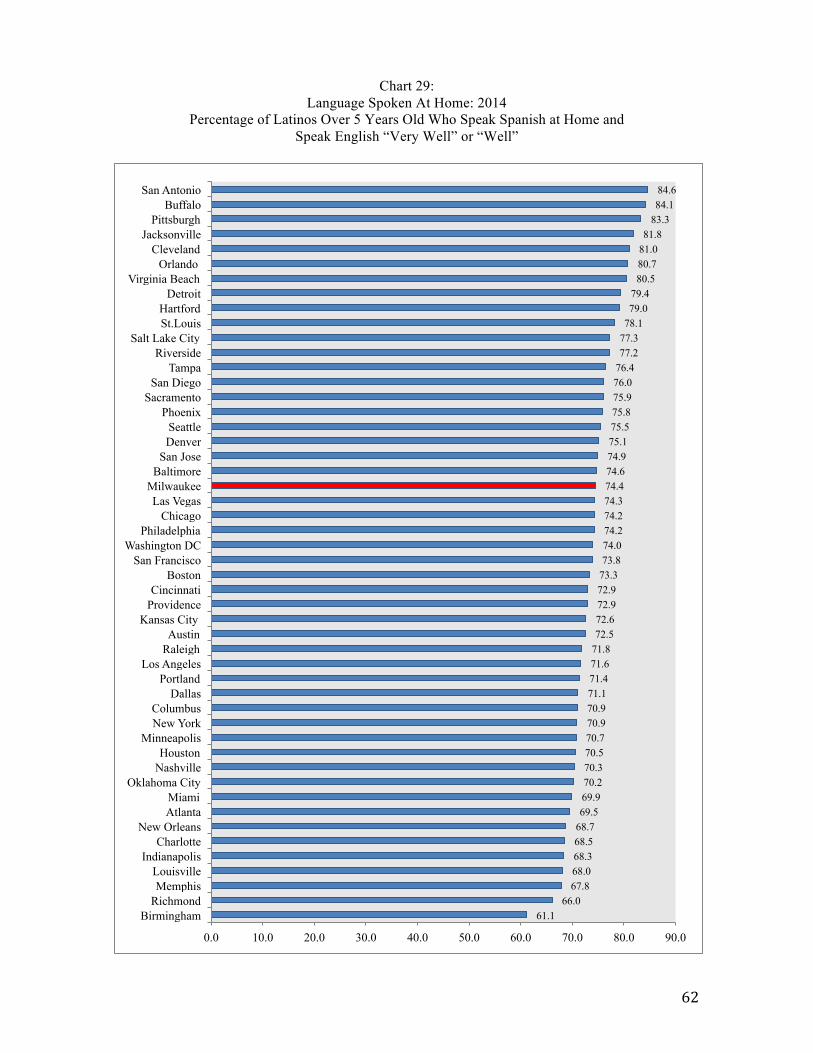
62
Chart 29: Language Spoken At Home: 2014
Percentage of Latinos Over 5 Years Old Who Speak Spanish at Home and Speak English “Very Well” or “Well”
61.1 66.0
67.8 68.0 68.3 68.5 68.7 69.5 69.9 70.2 70.3 70.5 70.7 70.9 70.9 71.1 71.4 71.6 71.8 72.5 72.6 72.9 72.9 73.3 73.8 74.0 74.2 74.2 74.3 74.4 74.6 74.9 75.1 75.5 75.8 75.9 76.0 76.4 77.2 77.3 78.1 79.0 79.4
80.5 80.7 81.0 81.8
83.3 84.1 84.6
0.0 10.0 20.0 30.0 40.0 50.0 60.0 70.0 80.0 90.0
Birmingham Richmond Memphis
Louisville Indianapolis
Charlotte New Orleans
Atlanta Miami
Oklahoma City Nashville Houston
Minneapolis New York Columbus
Dallas Portland
Los Angeles Raleigh Austin
Kansas City Providence Cincinnati
Boston San Francisco
Washington DC Philadelphia
Chicago Las Vegas
Milwaukee Baltimore
San Jose Denver Seattle
Phoenix Sacramento
San Diego Tampa
Riverside Salt Lake City
St.Louis Hartford
Detroit Virginia Beach
Orlando Cleveland
Jacksonville Pittsburgh
Buffalo San Antonio
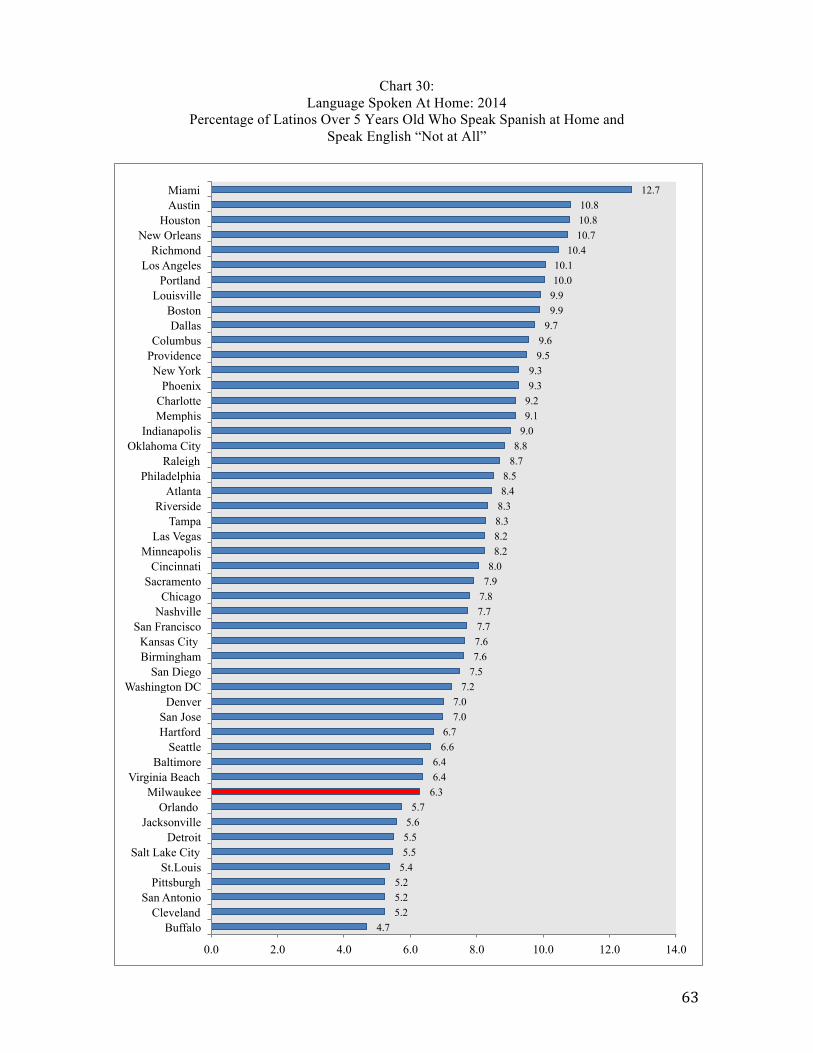
63
Chart 30: Language Spoken At Home: 2014
Percentage of Latinos Over 5 Years Old Who Speak Spanish at Home and Speak English “Not at All”
4.7 5.2 5.2 5.2 5.4 5.5 5.5 5.6 5.7
6.3 6.4 6.4
6.6 6.7
7.0 7.0
7.2 7.5 7.6 7.6 7.7 7.7 7.8 7.9 8.0
8.2 8.2 8.3 8.3 8.4 8.5
8.7 8.8
9.0 9.1 9.2 9.3 9.3
9.5 9.6
9.7 9.9 9.9 10.0 10.1
10.4 10.7 10.8 10.8
12.7
0.0 2.0 4.0 6.0 8.0 10.0 12.0 14.0
Buffalo Cleveland
San Antonio Pittsburgh
St.Louis Salt Lake City
Detroit Jacksonville
Orlando Milwaukee
Virginia Beach Baltimore
Seattle Hartford San Jose
Denver Washington DC
San Diego Birmingham Kansas City
San Francisco Nashville Chicago
Sacramento Cincinnati
Minneapolis Las Vegas
Tampa Riverside
Atlanta Philadelphia
Raleigh Oklahoma City
Indianapolis Memphis Charlotte Phoenix
New York Providence Columbus
Dallas Boston
Louisville Portland
Los Angeles Richmond
New Orleans Houston
Austin Miami
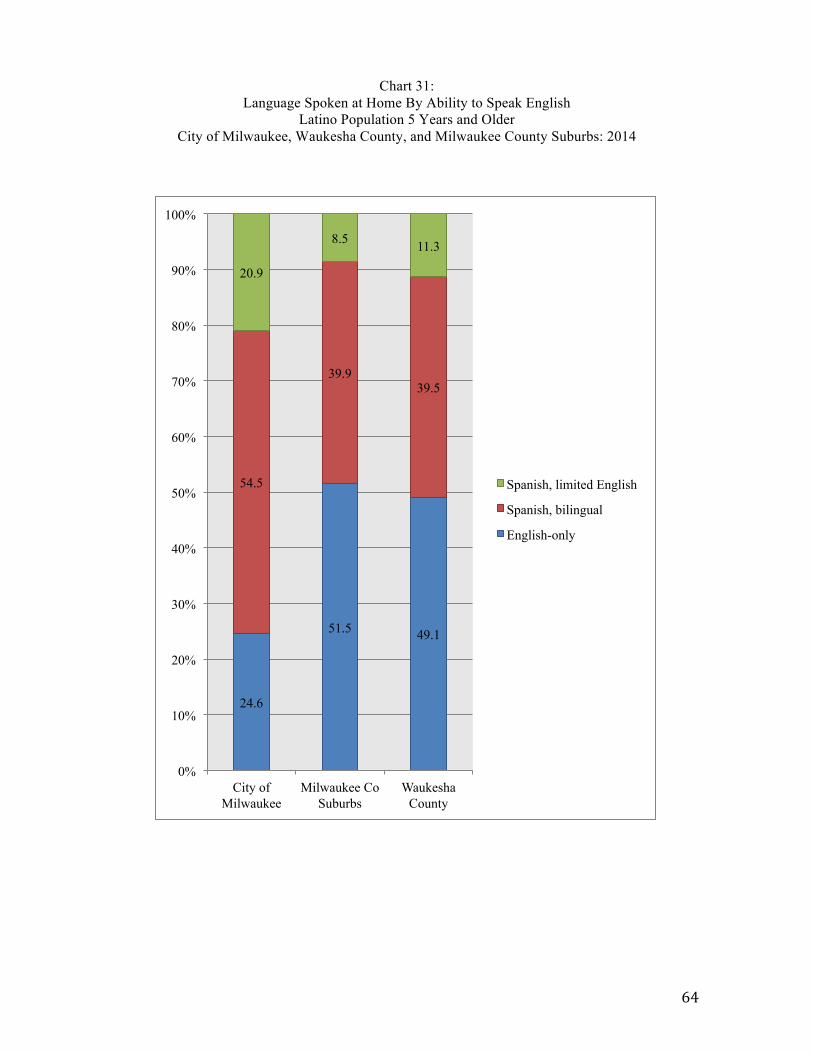
64
Chart 31: Language Spoken at Home By Ability to Speak English
Latino Population 5 Years and Older City of Milwaukee, Waukesha County, and Milwaukee County Suburbs: 2014
24.6
51.5 49.1
54.5
39.9 39.5
20.9
8.5 11.3
0%
10%
20%
30%
40%
50%
60%
70%
80%
90%
100%
City of Milwaukee
Milwaukee Co Suburbs
Waukesha County
Spanish, limited English
Spanish, bilingual
English-only
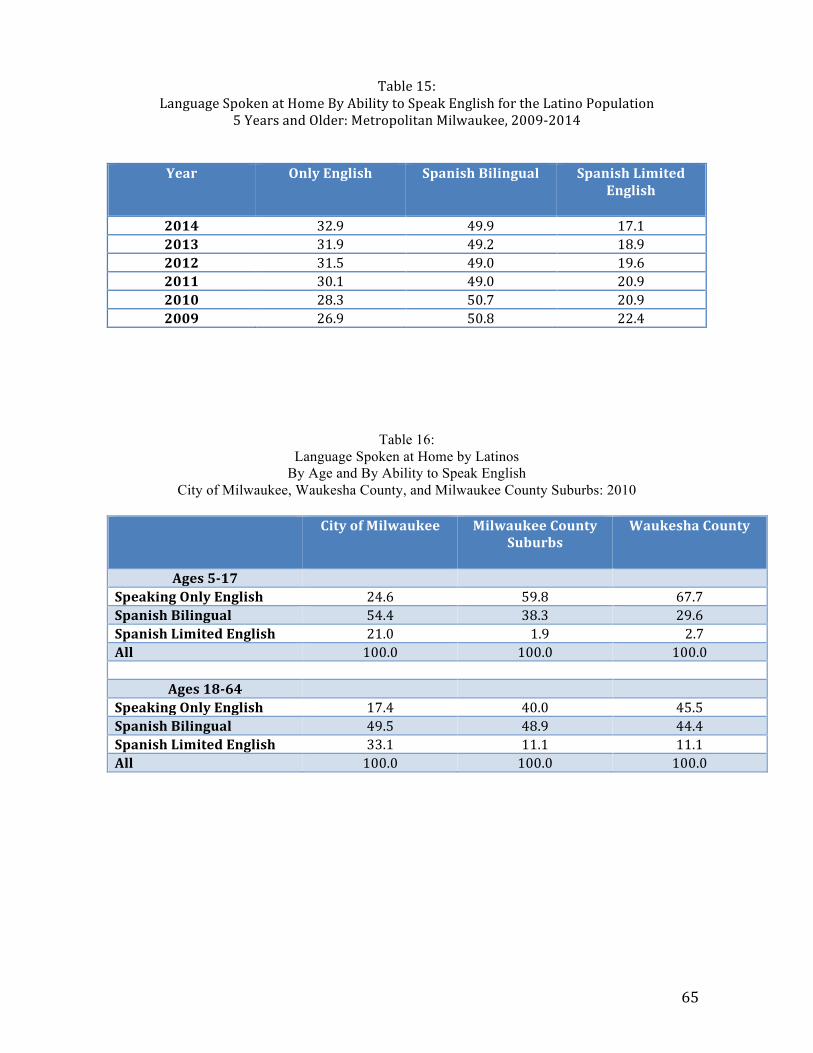
65
Table 15: Language Spoken at Home By Ability to Speak English for the Latino Population
5 Years and Older: Metropolitan Milwaukee, 2009-‐2014
Year Only English Spanish Bilingual Spanish Limited English
2014 32.9 49.9 17.1 2013 31.9 49.2 18.9 2012 31.5 49.0 19.6 2011 30.1 49.0 20.9 2010 28.3 50.7 20.9 2009 26.9 50.8 22.4
Table 16: Language Spoken at Home by Latinos
By Age and By Ability to Speak English City of Milwaukee, Waukesha County, and Milwaukee County Suburbs: 2010
City of Milwaukee Milwaukee County
Suburbs
Waukesha County
Ages 5-‐17 Speaking Only English 24.6 59.8 67.7 Spanish Bilingual 54.4 38.3 29.6 Spanish Limited English 21.0 1.9 2.7 All 100.0 100.0 100.0
Ages 18-‐64 Speaking Only English 17.4 40.0 45.5 Spanish Bilingual 49.5 48.9 44.4 Spanish Limited English 33.1 11.1 11.1 All 100.0 100.0 100.0
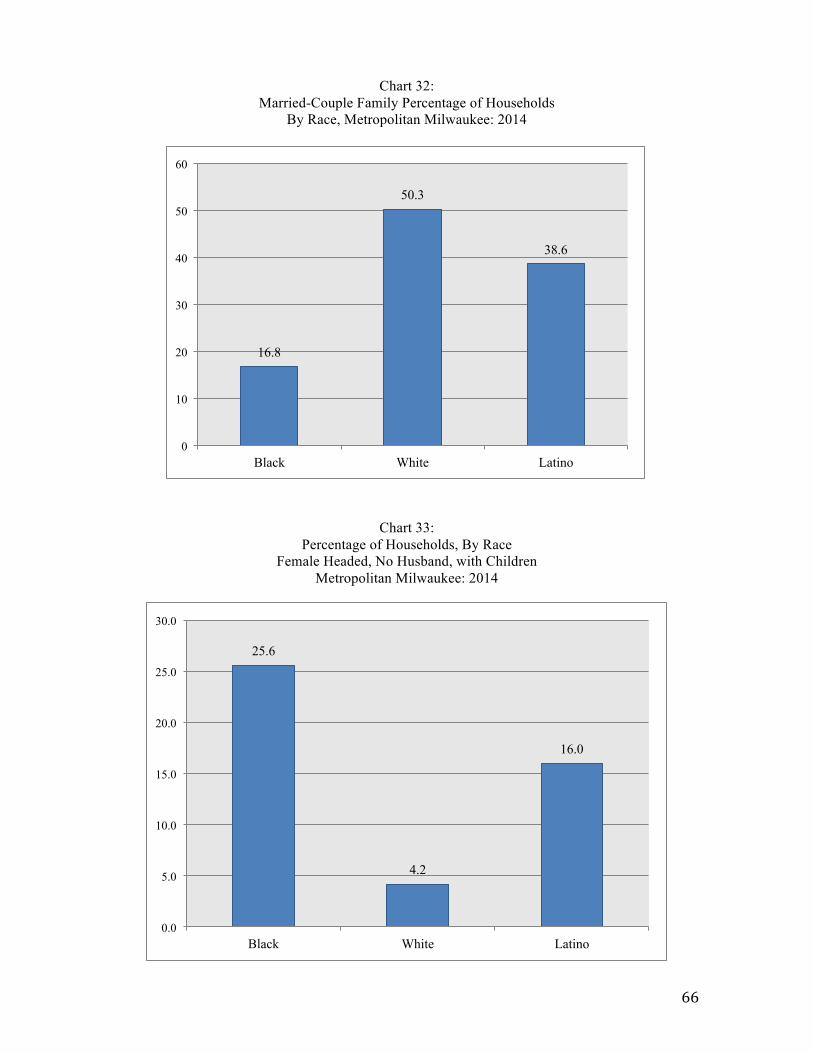
66
Chart 32: Married-Couple Family Percentage of Households
By Race, Metropolitan Milwaukee: 2014
Chart 33:
Percentage of Households, By Race Female Headed, No Husband, with Children
Metropolitan Milwaukee: 2014
16.8
50.3
38.6
0
10
20
30
40
50
60
Black White Latino
25.6
4.2
16.0
0.0
5.0
10.0
15.0
20.0
25.0
30.0
Black White Latino
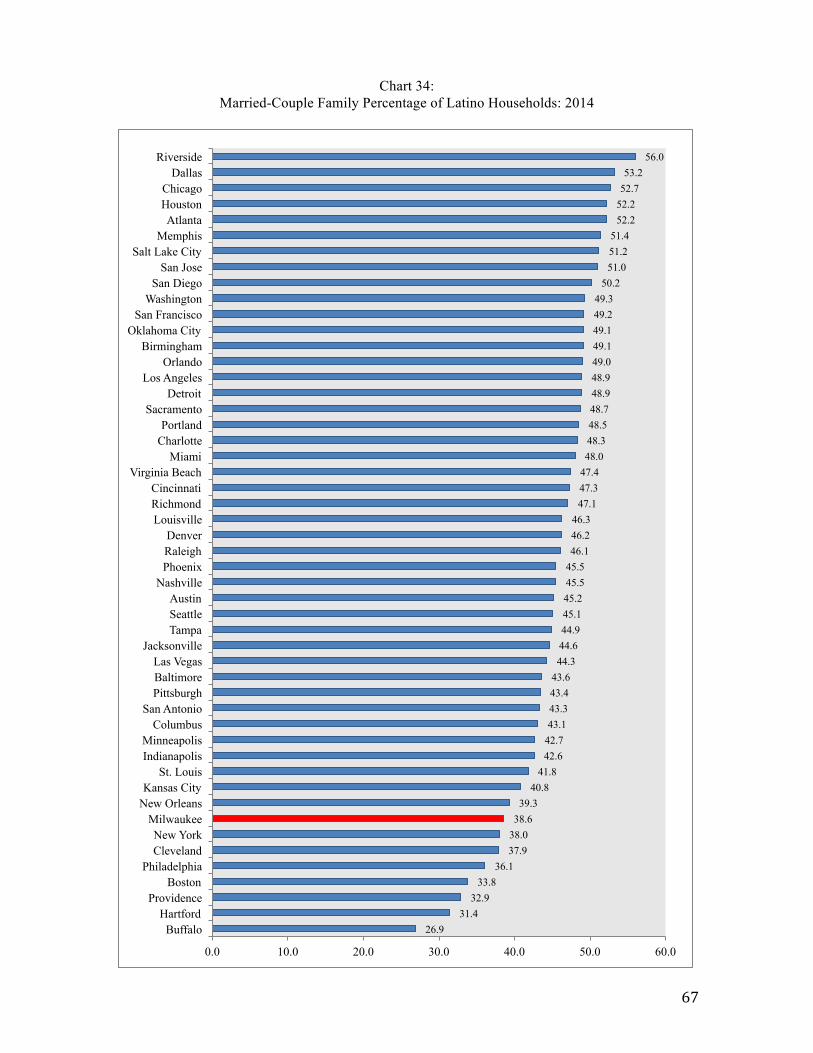
67
Chart 34: Married-Couple Family Percentage of Latino Households: 2014
26.9 31.4
32.9 33.8
36.1 37.9 38.0 38.6 39.3
40.8 41.8
42.6 42.7 43.1 43.3 43.4 43.6 44.3 44.6 44.9 45.1 45.2 45.5 45.5 46.1 46.2 46.3
47.1 47.3 47.4 48.0 48.3 48.5 48.7 48.9 48.9 49.0 49.1 49.1 49.2 49.3
50.2 51.0 51.2 51.4
52.2 52.2 52.7 53.2
56.0
0.0 10.0 20.0 30.0 40.0 50.0 60.0
Buffalo Hartford
Providence Boston
Philadelphia Cleveland New York
Milwaukee New Orleans Kansas City
St. Louis Indianapolis Minneapolis
Columbus San Antonio
Pittsburgh Baltimore Las Vegas
Jacksonville Tampa Seattle Austin
Nashville Phoenix Raleigh Denver
Louisville Richmond Cincinnati
Virginia Beach Miami
Charlotte Portland
Sacramento Detroit
Los Angeles Orlando
Birmingham Oklahoma City
San Francisco Washington
San Diego San Jose
Salt Lake City Memphis
Atlanta Houston Chicago
Dallas Riverside
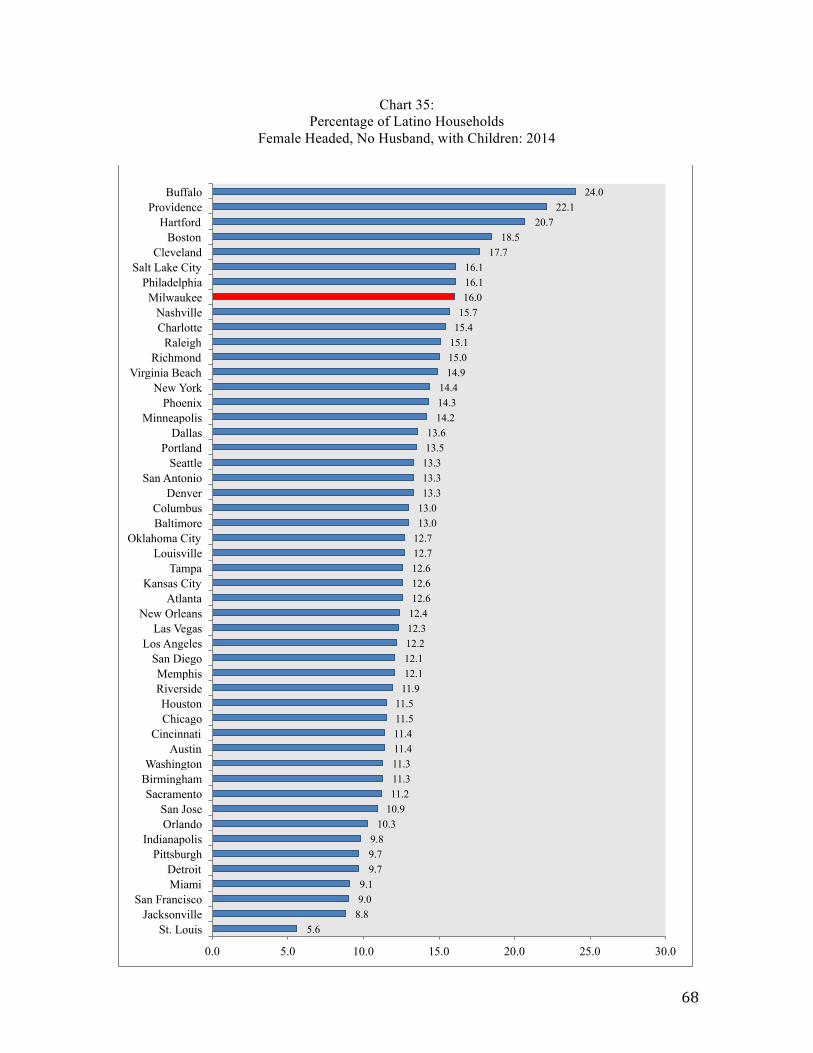
68
Chart 35:
Percentage of Latino Households Female Headed, No Husband, with Children: 2014
5.6 8.8 9.0 9.1
9.7 9.7 9.8
10.3 10.9 11.2 11.3 11.3 11.4 11.4 11.5 11.5
11.9 12.1 12.1 12.2 12.3 12.4 12.6 12.6 12.6 12.7 12.7 13.0 13.0 13.3 13.3 13.3 13.5 13.6
14.2 14.3 14.4
14.9 15.0 15.1 15.4 15.7 16.0 16.1 16.1
17.7 18.5
20.7 22.1
24.0
0.0 5.0 10.0 15.0 20.0 25.0 30.0
St. Louis Jacksonville
San Francisco Miami Detroit
Pittsburgh Indianapolis
Orlando San Jose
Sacramento Birmingham Washington
Austin Cincinnati
Chicago Houston
Riverside Memphis
San Diego Los Angeles
Las Vegas New Orleans
Atlanta Kansas City
Tampa Louisville
Oklahoma City Baltimore Columbus
Denver San Antonio
Seattle Portland
Dallas Minneapolis
Phoenix New York
Virginia Beach Richmond
Raleigh Charlotte Nashville
Milwaukee Philadelphia
Salt Lake City Cleveland
Boston Hartford
Providence Buffalo
69
INCOME, POVERTY, HOUSING, AND SOCIAL ASSISTANCE
Income Trends
By virtually every measure, Latino Milwaukee suffers from lagging household incomes
and high levels of poverty. On most income indicators, these conditions have deteriorated
in Latino Milwaukee over the past quarter-century; on a few other metrics, there has been
only slight improvement. And by most gauges, Latino household income in metro
Milwaukee lags behind Latino income in most of the nation’s 50 largest metropolitan
areas, and continues to fall behind the national level. Key findings on income include:
• The real median household income of Milwaukee Latinos –household income
adjusted for inflation-- has consistently ranked towards the bottom of the nation’s
50 largest metropolitan areas. In 2014, Latino Milwaukee ranked 43rd among the
nation’s 50 largest metros in median household income (Chart 38). As Charts 36
and 37 show, Milwaukee ranked 42nd in 1989 and 36th in 1999. Adjusted for
inflation, Latino median household income in Milwaukee fell from $47,943 in
1999 to $36,121 in 2014, a massive decline of 24.7 percent. As Chart 39 shows,
that was the 8th worst decline in Latino household income between 1999-2014
among the nation’s largest metropolitan areas. By and large, only “emerging
gateway” metropolises such as Indianapolis, Atlanta, Memphis, Birmingham, and
Charlotte -- with very high percentages of non-citizen Latino residents—
exceeded Latino Milwaukee’s decline in real household income.
• (Chart 40) adjusts median household income in 2014 in the largest metropolitan
areas for cost-of-living differences. An income of, say, $50,000 in a high-cost
city such as New York or San Francisco would not represent equal buying power
to $50,000 in Milwaukee or Charlotte, so we used U.S. Department of Commerce
“Regional Price Parities” to adjust metro area incomes. Even taking into account
Milwaukee’s relatively favorable cost-of-living, Latino median household
income here in 2014 ranked 41st among the nation’s 50 largest metropolitan
areas.
• The disparity between white non-Hispanic and Latino household income
continues to grow in Milwaukee. In 2014, Latino median household income in
Milwaukee was only 57.1 percent of the WNH median (Chart 41), down from
70
66.5 percent in 1999 (Table 17). This gives Milwaukee the 11th worst disparity in
Latino-WNH median household income among the 50 largest metro areas (Chart
41). As Chart 42 shows, as recently as 1999, Milwaukee’s Latino-WNH income
disparity was only slightly worse than the national gap; by 2014, however, while
nationally Latino household income was 70.5 percent that of WNHs, in
Milwaukee that percentage was only 57.1 percent.
• (Chart 43) underscores how household income in Latino Milwaukee is weighted
toward lower income classes. This chart compares the distribution of income for
Latino households, by annual household income in 2014, across a series of
income classes in a set of large metropolitan areas. Compared to Latinos in most
of the metros examined here, a large share of Latino Milwaukee households
reported income under $25,000 in 2014. Surprisingly, this is even the case when
comparing Milwaukee to high-immigration, non-citizen Latino metros such as
Charlotte, Atlanta, and Orlando, as well as more established Latino communities
such as Chicago or Dallas. The low-income share of the Latino distribution in
Milwaukee is comparable to Nashville, Memphis, and, surprisingly, Boston – but
not nearly as high as Buffalo, which has the highest percentage of low-income
Latino households. At the other end of the scale, compared to most metros, a
lower percentage of Latino Milwaukee households had income over $100,000.
• (Chart 44) presents the distribution of household income in Milwaukee for 2014,
by various racial groups, across income classes. A much higher percentage of
black households (46.8 percent) than Latino households (33.3 percent) reported
annual income under $25,000; unsurprisingly, only 17.5 percent of WNH
households reported income under $25,000. At the other end of the income
distribution, the percentage of WNH households with income over $100,000
(27.3 percent) was almost three times greater than the percentage of Latino
households (9.7 percent) and over four times greater than the percentage of black
households.
71
Poverty As the household income data would suggest, Latino Milwaukee is a high poverty
community. This is true in relative terms, compared to national averages and other
metropolitan areas as well as compared to the WNH community in Milwaukee. And it is
also true when we break down the measure over poverty into sub-categories, such as
children’s poverty, “extreme poverty” (households with income below 50 percent of the
poverty line), or “concentrated poverty” (the share of community members living in
neighborhoods in which 40 percent of more of the total population is poor).
• 35 years ago, the poverty rate for Latinos in Milwaukee was slightly lower than
the national Hispanic poverty rate. Consistently, however, over the past 25 years,
Milwaukee’s Latino poverty has run several percentage points above the national
average. In 2014, the national Latino poverty rate was 23.6 percent; in
Milwaukee it was 28.7 percent (Chart 45).
• Among the 50 largest metropolitan areas, Milwaukee posted the 11th highest
Latino poverty rate in 1999 and the 16th highest Latino poverty rate in 2014
(Charts 46-47). However, Milwaukee’s Latino poverty rate increased at a slower
pace between 1999-2014 than most large metropolitan areas; Milwaukee’s rate
grew by 19.2 percent over the past years, ranking 34th among the largest metro
areas. The trendsetters in Latino poverty growth since 1999 have been
Indianapolis (where the rate doubled), Memphis, Cincinnati, Atlanta, and
Richmond (Table 18).
• The disparity between Latino and WNH poverty in Milwaukee is among the
widest in the country, although the gap does has narrowed in Milwaukee since
1999 as WNH poverty has increased at a faster rate than Latino poverty.
Nevertheless, as Tables 19-20 show, Milwaukee had the 3rd highest disparity in
Latino-White poverty rates in 1999, and the 7th highest disparity in 2014. Chart
48 displays the poverty rates for Latinos, non-Hispanic whites, and blacks in
Milwaukee in 2014.
• Not only is the Latino poverty rate high in Milwaukee, but Latino Milwaukee
also manifests comparatively high levels of “extreme” and “concentrated”
poverty. 11.2 percent of all Latinos in metro Milwaukee lived in “extreme
poverty” in 2014, with annual income less than half of the federal poverty line.
72
This is the 17th highest rate of Latino extreme poverty among the nation’s 50
largest metropolitan areas (Chart 49).
• 41.8 percent of Milwaukee’s poor Latinos – persons with income below the
poverty line—live in neighborhoods of “concentrated poverty.” (A concentrated
poverty neighborhood is defined as an area where 40 percent or more of the total
neighborhood population is poor). This is the 3rd highest rate, among the nation’s
largest metropolises, of poor Latinos living in concentrated poverty
neighborhoods (Chart 50). Thus, poor Latinos in Milwaukee are not only
impoverished but, compared to other metro areas, they are likelier to live in
segregated neighborhoods with large numbers of other poor people, experiencing
the “neighborhood effects” of concentrated poverty. Latino poverty in
Milwaukee is concentrated, not dispersed as in Salt Lake City, Washington,
D.C., or San Jose; and as sociologists and economists have documented,
concentrated poverty has a much more pernicious effect on economic
opportunity than when the poor are scattered into more socio-economically
mixed neighborhoods.
• 27.5 percent of all Milwaukee Latinos – whether or not they are poor—live in
neighborhoods of “concentrated poverty,” where 40 percent or more of the
population is poor. This is the 2nd highest rate of Latinos living in concentrated
poverty among the nation’s large metro areas (Chart 51). Concentrated poverty is
highly correlated with residential segregation, so it is not surprising --with
Milwaukee’s high levels of Latino-WNH segregation combined with high
overall rates of Latino poverty-- that Latinos here, regardless of their income,
would be exposed to high levels of poverty in their neighborhoods. Thus, as
Table 21 shows in a rather stunning finding, an affluent Latino household in
Milwaukee, with annual income over $100,000, is likelier to live in a
concentrated poverty neighborhood than a poor WNH household with annual
income under $10,000.
• Latino Milwaukee also suffers from a high percentage of children living in
poverty. Chart 52 compares childhood poverty rates for blacks, Latinos, and
WNH in Milwaukee in 2014; the Latino rate (33.9 percent) is almost five times
higher than the WNH rate, but much lower than the black rate (50.4 percent).
73
(Charts 53-54 and Table 22) reveal that Latino Milwaukee’s childhood poverty
rate has grown markedly since 1999, but a bit more slowly than increases in the
Hispanic rate in most other metros. In 1999, Milwaukee posted the 15th highest
Latino childhood poverty rate among the nation’s largest metros; in 2014,
Milwaukee ranked 18th in this category.
• (Chart 55) breaks down Latino affluence and poverty in metro Milwaukee by
place. 68.6 percent of all Latino households in metro Milwaukee live in the
central city, but 82.0 percent of the region’s poor households live in the city. By
contrast, only 41.4 percent of the region’s affluent Latino households – those
with annual incomes over $100,000—live in the city. The converse is true when
we look at exurban Waukesha County: one-third of the region’s affluent Latinos
live in that western suburban county, compared to less than ten percent of the
region’s Latino poor.
Supplemental Nutrition Assistance Program (SNAP) Benefits
A sign of community poverty is the degree to which SNAP benefits, also known as
“Food Stamps,” are needed. As Table 23 reveals, the percentage of households in metro
Milwaukee receiving SNAP benefits varies roughly along the lines of racial differences in
poverty rates. Moreover, as we would expect, SNAP usage for all groups –Latinos, WNH,
and blacks—increased sharply between 2007-2014, a consequence of the economic
dislocation of the Great Recession.
(Charts 56-57 and Table 24) places Latino Milwaukee’s receipt of SNAP benefits in
comparative perspective. Again, unsurprisingly, these data closely track the comparative
metro area Latino poverty data. In 2007, pre-Great Recession, Milwaukee ranked 11th of
the 50 largest metro areas in the percentage of Latino households with SNAP benefits
(15.1 percent). In 2014, a little over four years after the official end of the recession,
Milwaukee ranked 6th among the 50 big metros on this measure, with 33.2 percent of
Latino households receiving SNAP benefits (double the 2007 rate). Table 24 reveals that
this rate of increase in Latino SNAP benefits in Milwaukee was the 18th highest among the
nation’s biggest metropolitan areas between 2007-2014. For the most part, the leading
increases were in the rapidly expanding new gateway metros – places like Atlanta, Las
Vegas, Birmingham, Indianapolis, Richmond, and Memphis.
74
Homeownership and Housing Costs
The low incomes and high poverty in Latino Milwaukee are reflected in homeownership
rates as well as measures of the financial burden of housing. As Charts 58-59 and Table 25
reveal, Milwaukee ranked low among the 50 largest metropolitan areas in both 2000 and
2014 in Latino homeownership rates (36th in 2000 and 38th in 2014). Although low, Latino
homeownership rates in Milwaukee were actually rather stable between 2000-2014, despite
the housing bust and the foreclosure crisis; as Table 25 shows, it was in mainly metro areas
at the epicenter of the mortgage lending meltdown – places like Orlando, San Jose,
Phoenix, San Francisco, Las Vegas, and Riverside—that Latino homeownership rates
declined the most between 2000-2014. Nevertheless, as Table 26 shows, Latino
homeownership in metro Milwaukee lags far behind the WNH rate, although it is
discernibly higher than the black rate (which did decline significantly in Milwaukee
between 2000-2014).
(Charts 60-63) spell out the relative financial burdens facing Latino Milwaukee
homeowners and renters. Milwaukee ranks toward the middle of the 50 large metros (29th)
in the percentage of Latino homeowners with monthly owner costs exceeding 30 percent of
household income in 2014 – a Census Bureau measure of high housing cost burden. The
burden is a bit more onerous for Latino renters in Milwaukee: 45.3 percent of metro
Milwaukee’s Latino renters paid gross rent that exceeds 30 percent of their household
income in 2014, a level that ranked 18th highest among the nation’s largest metropolitan
areas.
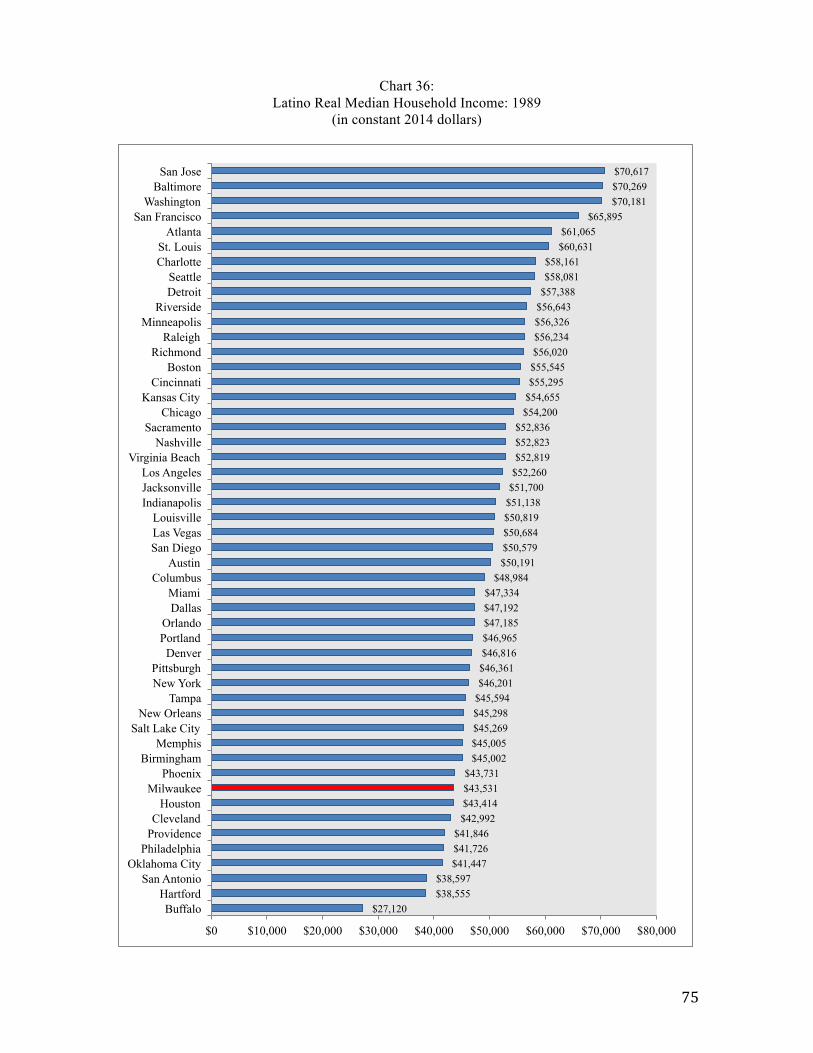
75
Chart 36: Latino Real Median Household Income: 1989
(in constant 2014 dollars)
$27,120 $38,555 $38,597
$41,447 $41,726 $41,846
$42,992 $43,414 $43,531 $43,731
$45,002 $45,005 $45,269 $45,298 $45,594 $46,201 $46,361 $46,816 $46,965 $47,185 $47,192 $47,334
$48,984 $50,191 $50,579 $50,684 $50,819 $51,138 $51,700 $52,260 $52,819 $52,823 $52,836
$54,200 $54,655 $55,295 $55,545 $56,020 $56,234 $56,326 $56,643 $57,388 $58,081 $58,161
$60,631 $61,065
$65,895 $70,181 $70,269 $70,617
$0 $10,000 $20,000 $30,000 $40,000 $50,000 $60,000 $70,000 $80,000
Buffalo Hartford
San Antonio Oklahoma City
Philadelphia Providence Cleveland
Houston Milwaukee
Phoenix Birmingham
Memphis Salt Lake City
New Orleans Tampa
New York Pittsburgh
Denver Portland Orlando
Dallas Miami
Columbus Austin
San Diego Las Vegas Louisville
Indianapolis Jacksonville Los Angeles
Virginia Beach Nashville
Sacramento Chicago
Kansas City Cincinnati
Boston Richmond
Raleigh Minneapolis
Riverside Detroit Seattle
Charlotte St. Louis
Atlanta San Francisco
Washington Baltimore
San Jose
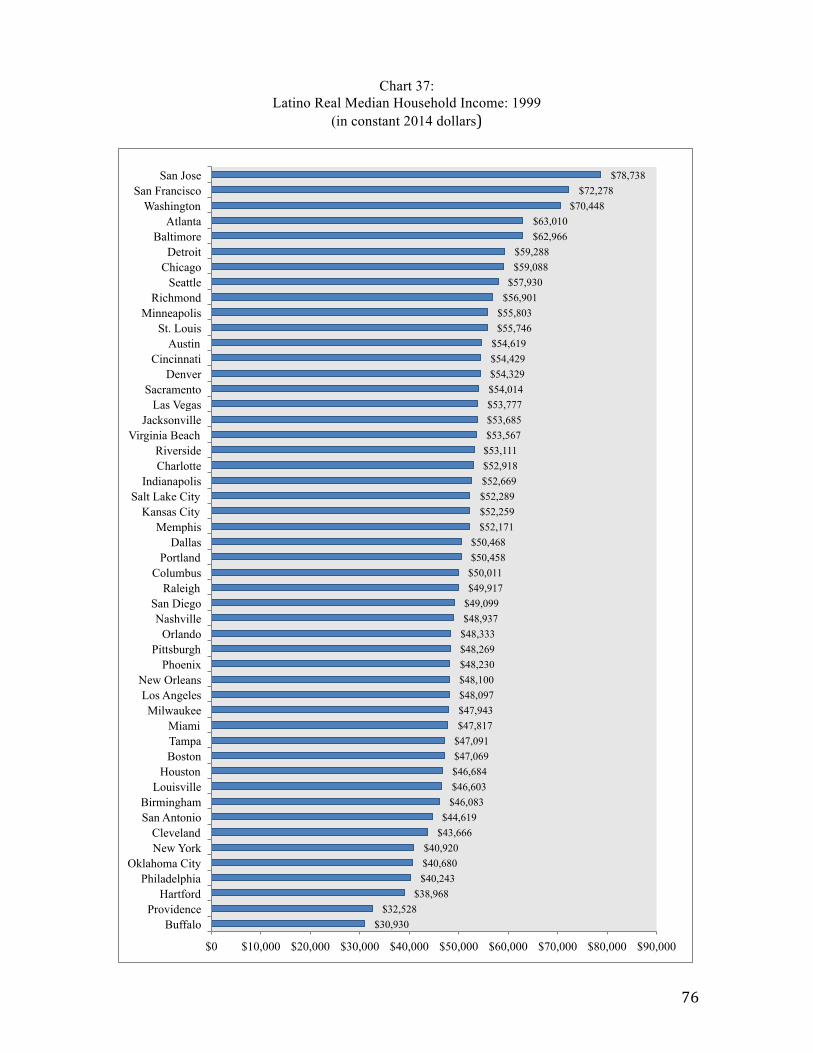
76
Chart 37: Latino Real Median Household Income: 1999
(in constant 2014 dollars)
$30,930 $32,528
$38,968 $40,243 $40,680 $40,920
$43,666 $44,619
$46,083 $46,603 $46,684 $47,069 $47,091 $47,817 $47,943 $48,097 $48,100 $48,230 $48,269 $48,333 $48,937 $49,099 $49,917 $50,011 $50,458 $50,468
$52,171 $52,259 $52,289 $52,669 $52,918 $53,111 $53,567 $53,685 $53,777 $54,014 $54,329 $54,429 $54,619
$55,746 $55,803
$56,901 $57,930
$59,088 $59,288
$62,966 $63,010
$70,448 $72,278
$78,738
$0 $10,000 $20,000 $30,000 $40,000 $50,000 $60,000 $70,000 $80,000 $90,000
Buffalo Providence
Hartford Philadelphia
Oklahoma City New York Cleveland
San Antonio Birmingham
Louisville Houston
Boston Tampa Miami
Milwaukee Los Angeles
New Orleans Phoenix
Pittsburgh Orlando
Nashville San Diego
Raleigh Columbus
Portland Dallas
Memphis Kansas City
Salt Lake City Indianapolis
Charlotte Riverside
Virginia Beach Jacksonville
Las Vegas Sacramento
Denver Cincinnati
Austin St. Louis
Minneapolis Richmond
Seattle Chicago Detroit
Baltimore Atlanta
Washington San Francisco
San Jose
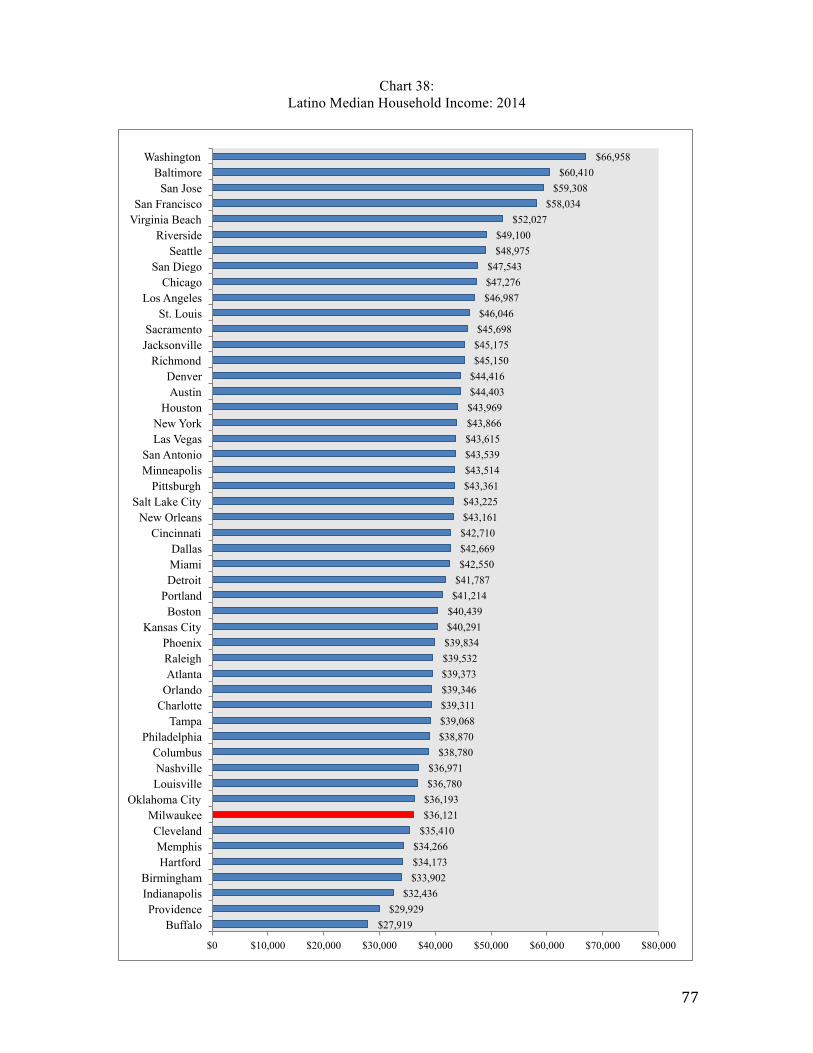
77
Chart 38: Latino Median Household Income: 2014
$27,919 $29,929
$32,436 $33,902 $34,173 $34,266
$35,410 $36,121 $36,193 $36,780 $36,971
$38,780 $38,870 $39,068 $39,311 $39,346 $39,373 $39,532 $39,834 $40,291 $40,439 $41,214 $41,787 $42,550 $42,669 $42,710 $43,161 $43,225 $43,361 $43,514 $43,539 $43,615 $43,866 $43,969 $44,403 $44,416 $45,150 $45,175 $45,698 $46,046 $46,987 $47,276 $47,543
$48,975 $49,100
$52,027 $58,034
$59,308 $60,410
$66,958
$0 $10,000 $20,000 $30,000 $40,000 $50,000 $60,000 $70,000 $80,000
Buffalo Providence
Indianapolis Birmingham
Hartford Memphis
Cleveland Milwaukee
Oklahoma City Louisville Nashville
Columbus Philadelphia
Tampa Charlotte Orlando Atlanta Raleigh Phoenix
Kansas City Boston
Portland Detroit Miami Dallas
Cincinnati New Orleans
Salt Lake City Pittsburgh
Minneapolis San Antonio
Las Vegas New York
Houston Austin Denver
Richmond Jacksonville Sacramento
St. Louis Los Angeles
Chicago San Diego
Seattle Riverside
Virginia Beach San Francisco
San Jose Baltimore
Washington
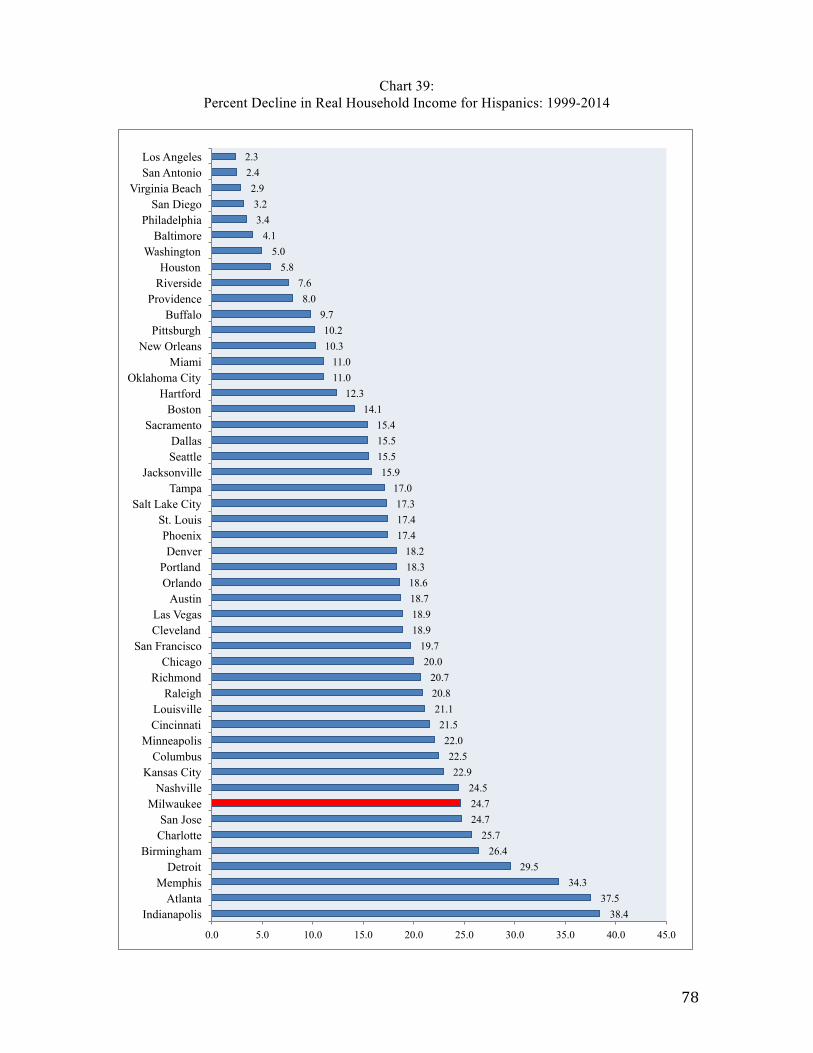
78
Chart 39: Percent Decline in Real Household Income for Hispanics: 1999-2014
38.4 37.5
34.3 29.5
26.4 25.7
24.7 24.7 24.5
22.9 22.5
22.0 21.5
21.1 20.8 20.7
20.0 19.7
18.9 18.9 18.7 18.6
18.3 18.2
17.4 17.4 17.3
17.0 15.9
15.5 15.5 15.4
14.1 12.3
11.0 11.0
10.3 10.2
9.7 8.0
7.6 5.8
5.0 4.1
3.4 3.2
2.9 2.4 2.3
0.0 5.0 10.0 15.0 20.0 25.0 30.0 35.0 40.0 45.0
Indianapolis Atlanta
Memphis Detroit
Birmingham Charlotte San Jose
Milwaukee Nashville
Kansas City Columbus
Minneapolis Cincinnati Louisville
Raleigh Richmond
Chicago San Francisco
Cleveland Las Vegas
Austin Orlando Portland
Denver Phoenix
St. Louis Salt Lake City
Tampa Jacksonville
Seattle Dallas
Sacramento Boston
Hartford Oklahoma City
Miami New Orleans
Pittsburgh Buffalo
Providence Riverside Houston
Washington Baltimore
Philadelphia San Diego
Virginia Beach San Antonio Los Angeles
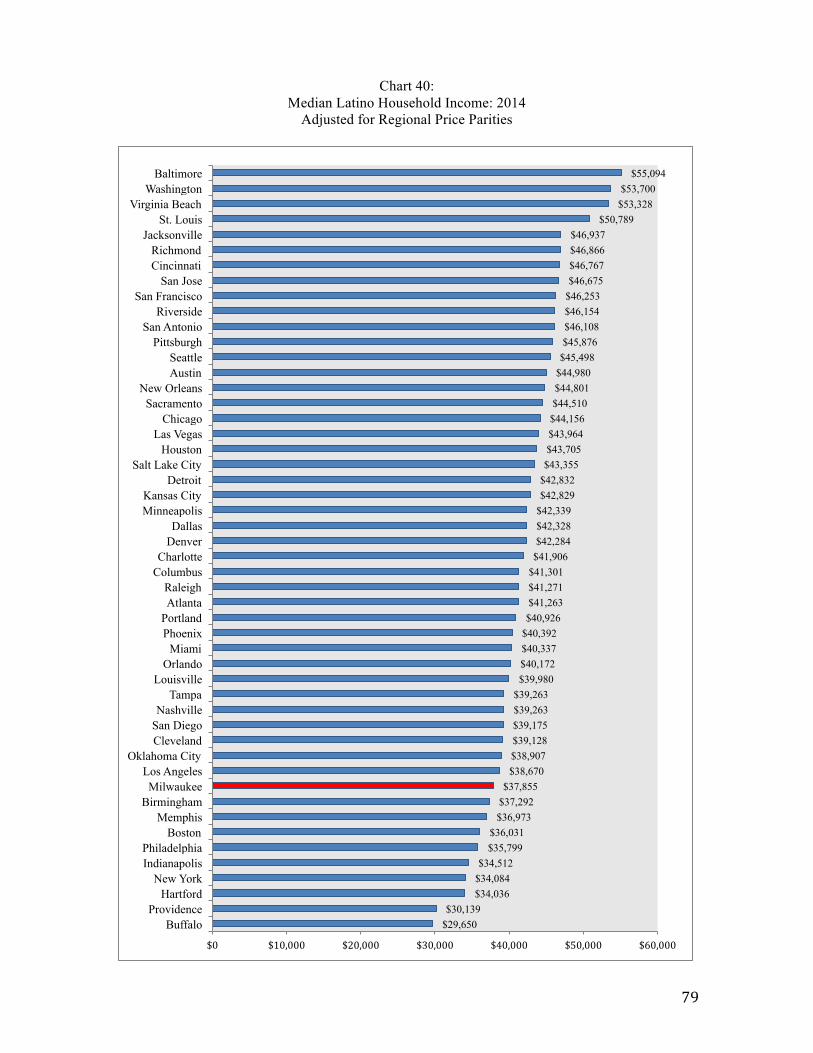
79
Chart 40: Median Latino Household Income: 2014
Adjusted for Regional Price Parities
$29,650 $30,139
$34,036 $34,084 $34,512
$35,799 $36,031
$36,973 $37,292 $37,855
$38,670 $38,907 $39,128 $39,175 $39,263 $39,263 $39,980 $40,172 $40,337 $40,392 $40,926 $41,263 $41,271 $41,301 $41,906 $42,284 $42,328 $42,339 $42,829 $42,832 $43,355 $43,705 $43,964 $44,156 $44,510 $44,801 $44,980 $45,498 $45,876 $46,108 $46,154 $46,253 $46,675 $46,767 $46,866 $46,937
$50,789 $53,328 $53,700
$55,094
$0 $10,000 $20,000 $30,000 $40,000 $50,000 $60,000
Buffalo Providence
Hartford New York
Indianapolis Philadelphia
Boston Memphis
Birmingham Milwaukee
Los Angeles Oklahoma City
Cleveland San Diego Nashville
Tampa Louisville
Orlando Miami
Phoenix Portland Atlanta Raleigh
Columbus Charlotte
Denver Dallas
Minneapolis Kansas City
Detroit Salt Lake City
Houston Las Vegas
Chicago Sacramento
New Orleans Austin Seattle
Pittsburgh San Antonio
Riverside San Francisco
San Jose Cincinnati Richmond
Jacksonville St. Louis
Virginia Beach Washington
Baltimore
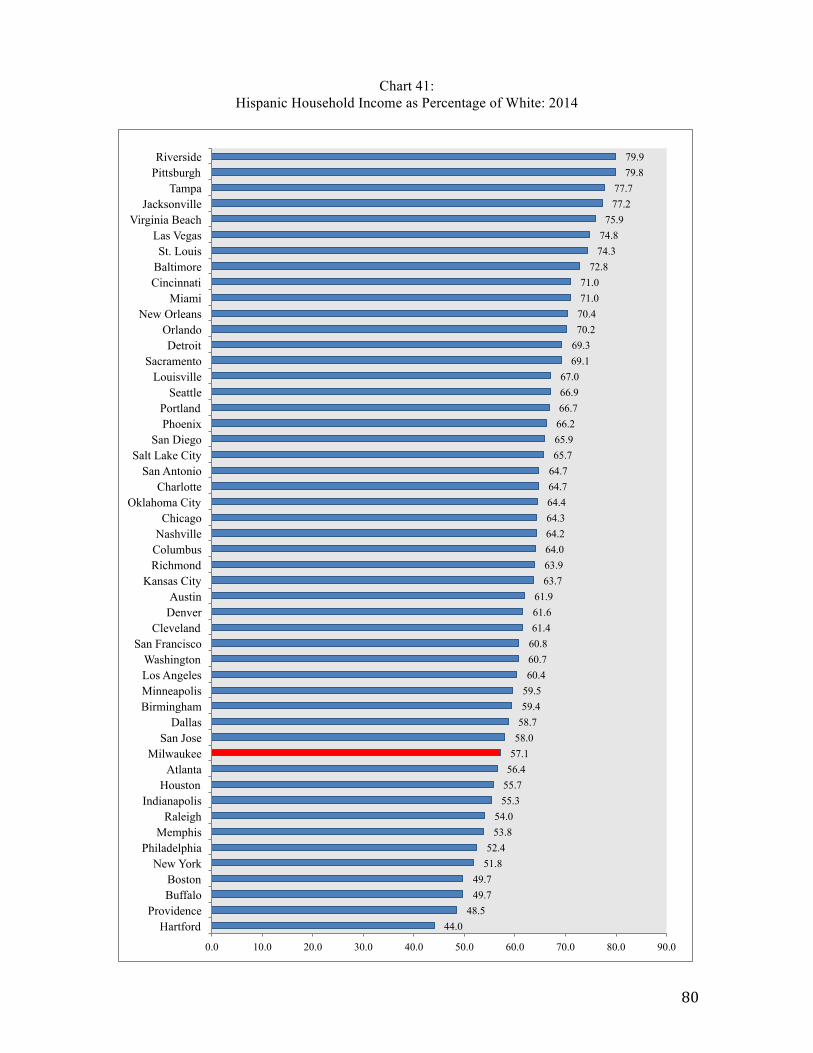
80
Chart 41: Hispanic Household Income as Percentage of White: 2014
44.0 48.5
49.7 49.7
51.8 52.4
53.8 54.0
55.3 55.7 56.4 57.1 58.0 58.7 59.4 59.5 60.4 60.7 60.8 61.4 61.6 61.9
63.7 63.9 64.0 64.2 64.3 64.4 64.7 64.7 65.7 65.9 66.2 66.7 66.9 67.0
69.1 69.3 70.2 70.4 71.0 71.0
72.8 74.3 74.8
75.9 77.2 77.7
79.8 79.9
0.0 10.0 20.0 30.0 40.0 50.0 60.0 70.0 80.0 90.0
Hartford Providence
Buffalo Boston
New York Philadelphia
Memphis Raleigh
Indianapolis Houston
Atlanta Milwaukee
San Jose Dallas
Birmingham Minneapolis Los Angeles Washington
San Francisco Cleveland
Denver Austin
Kansas City Richmond Columbus Nashville Chicago
Oklahoma City Charlotte
San Antonio Salt Lake City
San Diego Phoenix Portland
Seattle Louisville
Sacramento Detroit
Orlando New Orleans
Miami Cincinnati Baltimore St. Louis
Las Vegas Virginia Beach
Jacksonville Tampa
Pittsburgh Riverside
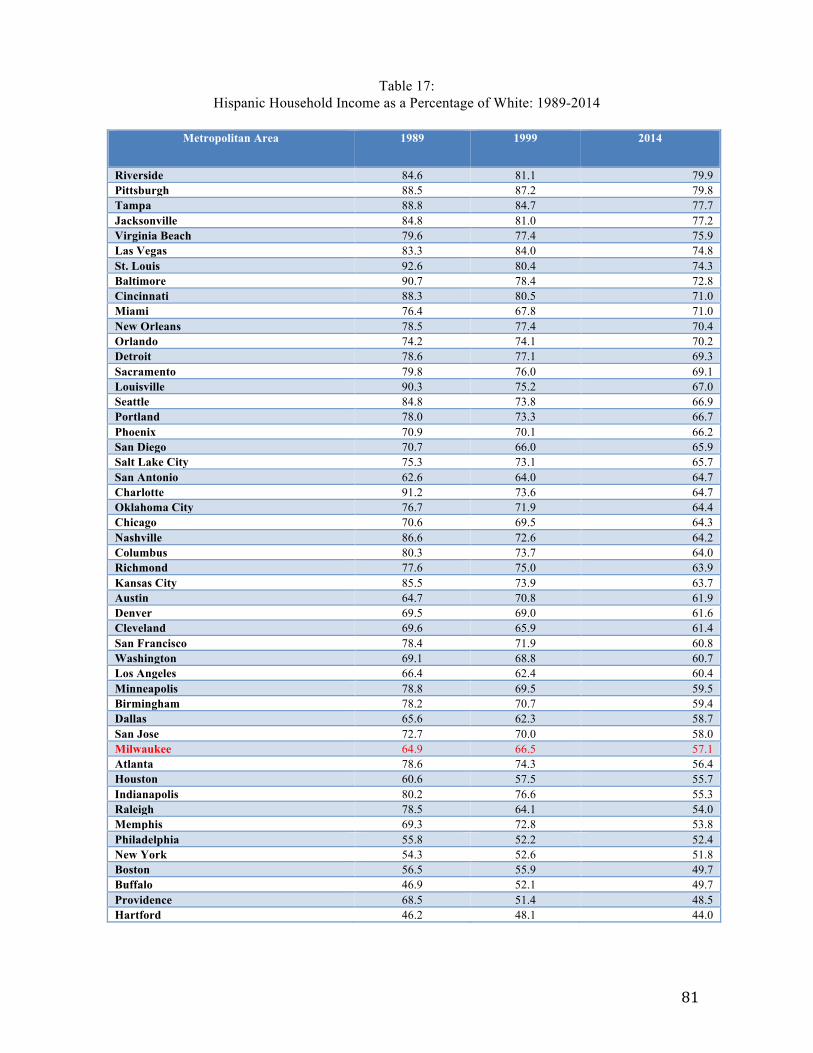
81
Table 17: Hispanic Household Income as a Percentage of White: 1989-2014
Metropolitan Area 1989 1999 2014
Riverside 84.6 81.1 79.9 Pittsburgh 88.5 87.2 79.8 Tampa 88.8 84.7 77.7 Jacksonville 84.8 81.0 77.2 Virginia Beach 79.6 77.4 75.9 Las Vegas 83.3 84.0 74.8 St. Louis 92.6 80.4 74.3 Baltimore 90.7 78.4 72.8 Cincinnati 88.3 80.5 71.0 Miami 76.4 67.8 71.0 New Orleans 78.5 77.4 70.4 Orlando 74.2 74.1 70.2 Detroit 78.6 77.1 69.3 Sacramento 79.8 76.0 69.1 Louisville 90.3 75.2 67.0 Seattle 84.8 73.8 66.9 Portland 78.0 73.3 66.7 Phoenix 70.9 70.1 66.2 San Diego 70.7 66.0 65.9 Salt Lake City 75.3 73.1 65.7 San Antonio 62.6 64.0 64.7 Charlotte 91.2 73.6 64.7 Oklahoma City 76.7 71.9 64.4 Chicago 70.6 69.5 64.3 Nashville 86.6 72.6 64.2 Columbus 80.3 73.7 64.0 Richmond 77.6 75.0 63.9 Kansas City 85.5 73.9 63.7 Austin 64.7 70.8 61.9 Denver 69.5 69.0 61.6 Cleveland 69.6 65.9 61.4 San Francisco 78.4 71.9 60.8 Washington 69.1 68.8 60.7 Los Angeles 66.4 62.4 60.4 Minneapolis 78.8 69.5 59.5 Birmingham 78.2 70.7 59.4 Dallas 65.6 62.3 58.7 San Jose 72.7 70.0 58.0 Milwaukee 64.9 66.5 57.1 Atlanta 78.6 74.3 56.4 Houston 60.6 57.5 55.7 Indianapolis 80.2 76.6 55.3 Raleigh 78.5 64.1 54.0 Memphis 69.3 72.8 53.8 Philadelphia 55.8 52.2 52.4 New York 54.3 52.6 51.8 Boston 56.5 55.9 49.7 Buffalo 46.9 52.1 49.7 Providence 68.5 51.4 48.5 Hartford 46.2 48.1 44.0
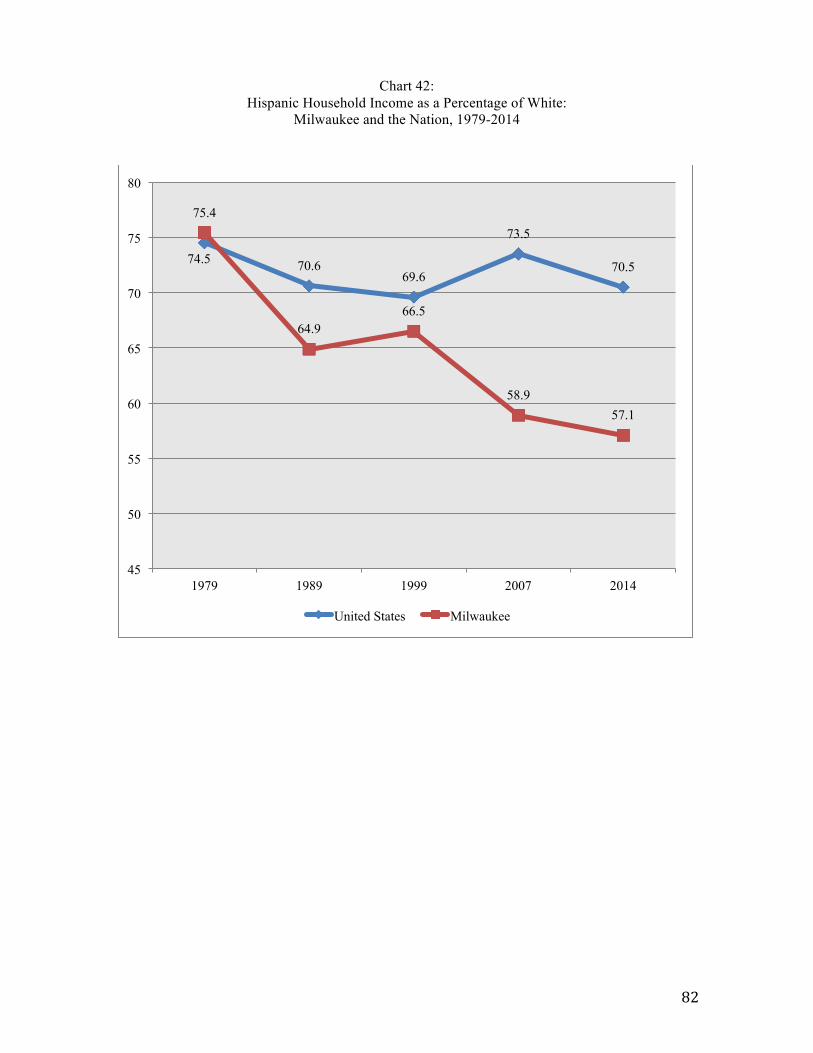
82
Chart 42: Hispanic Household Income as a Percentage of White:
Milwaukee and the Nation, 1979-2014
74.5 70.6 69.6
73.5
70.5
75.4
64.9 66.5
58.9 57.1
45
50
55
60
65
70
75
80
1979 1989 1999 2007 2014
United States Milwaukee
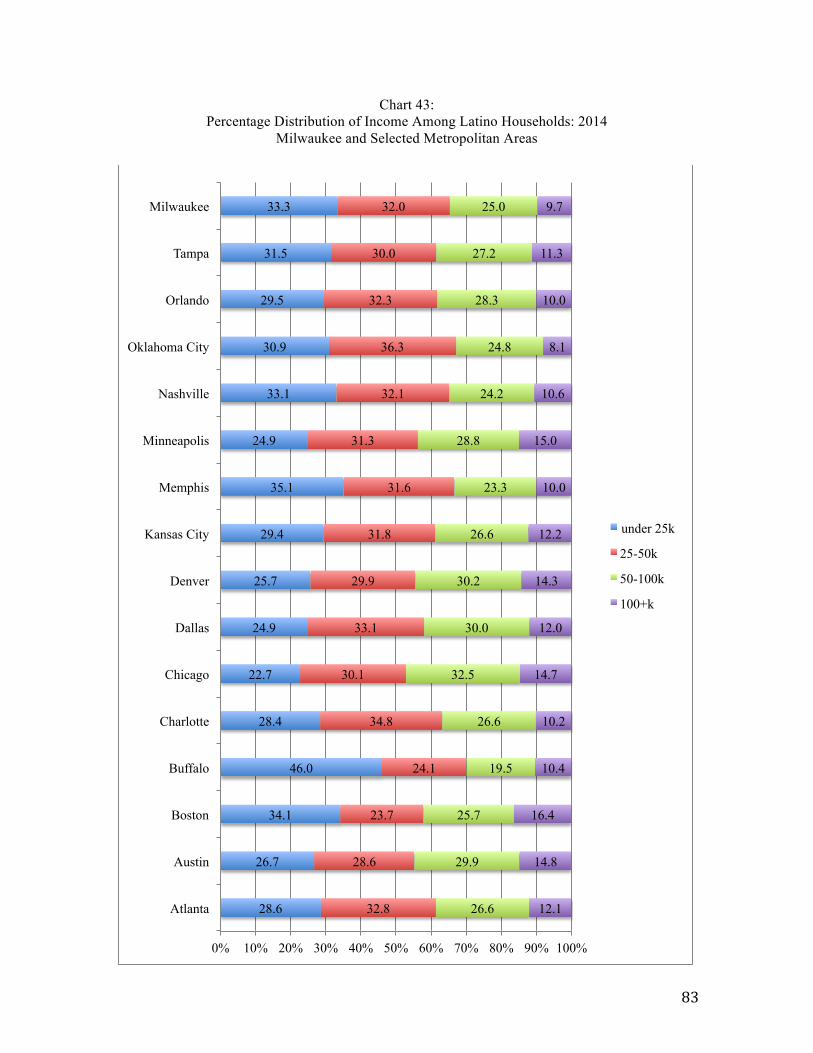
83
Chart 43:
Percentage Distribution of Income Among Latino Households: 2014 Milwaukee and Selected Metropolitan Areas
28.6
26.7
34.1
46.0
28.4
22.7
24.9
25.7
29.4
35.1
24.9
33.1
30.9
29.5
31.5
33.3
32.8
28.6
23.7
24.1
34.8
30.1
33.1
29.9
31.8
31.6
31.3
32.1
36.3
32.3
30.0
32.0
26.6
29.9
25.7
19.5
26.6
32.5
30.0
30.2
26.6
23.3
28.8
24.2
24.8
28.3
27.2
25.0
12.1
14.8
16.4
10.4
10.2
14.7
12.0
14.3
12.2
10.0
15.0
10.6
8.1
10.0
11.3
9.7
0% 10% 20% 30% 40% 50% 60% 70% 80% 90% 100%
Atlanta
Austin
Boston
Buffalo
Charlotte
Chicago
Dallas
Denver
Kansas City
Memphis
Minneapolis
Nashville
Oklahoma City
Orlando
Tampa
Milwaukee
under 25k
25-50k
50-100k
100+k
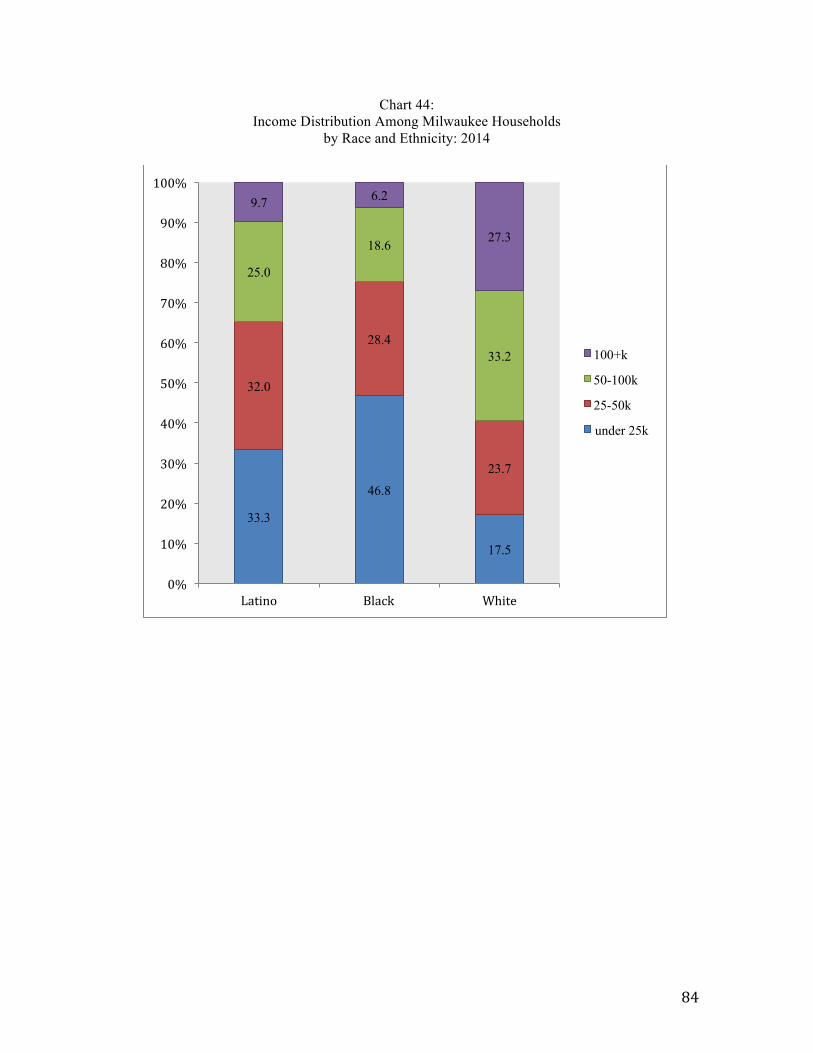
84
Chart 44:
Income Distribution Among Milwaukee Households by Race and Ethnicity: 2014
33.3
46.8
17.5
32.0
28.4
23.7
25.0
18.6
33.2
9.7 6.2
27.3
0%
10%
20%
30%
40%
50%
60%
70%
80%
90%
100%
Latino Black White
100+k
50-100k
25-50k
under 25k
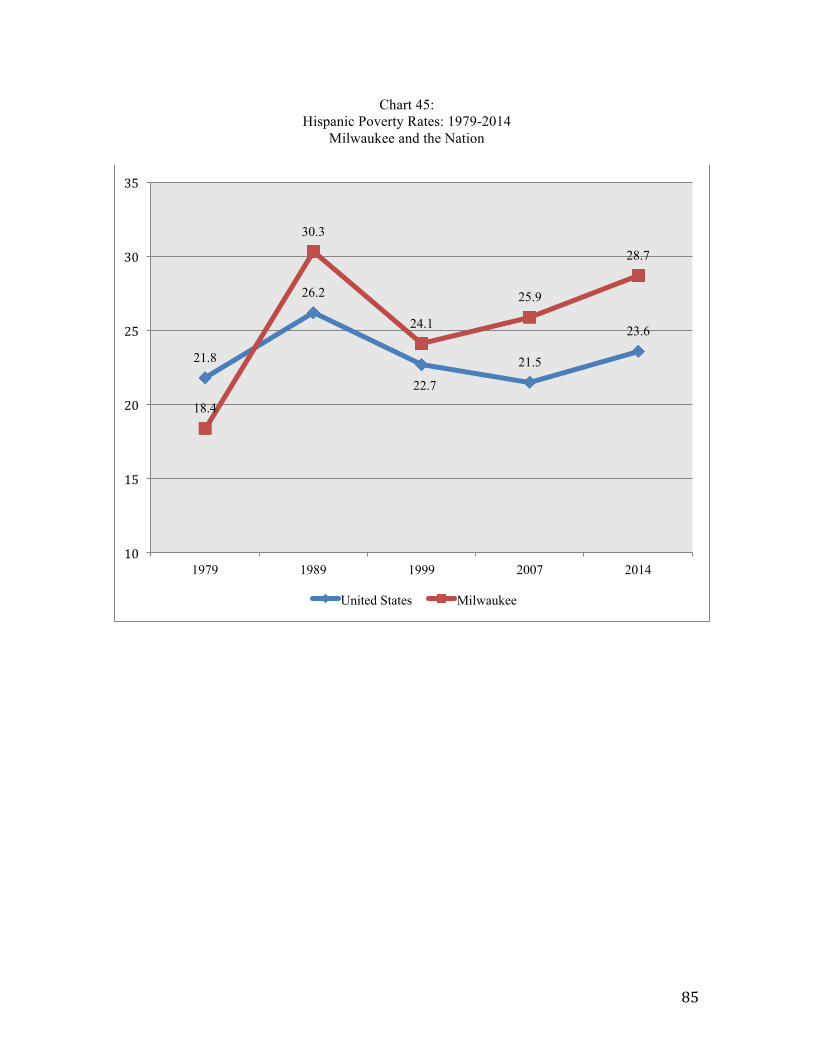
85
Chart 45:
Hispanic Poverty Rates: 1979-2014 Milwaukee and the Nation
21.8
26.2
22.7
21.5
23.6
18.4
30.3
24.1
25.9
28.7
10
15
20
25
30
35
1979 1989 1999 2007 2014
United States Milwaukee
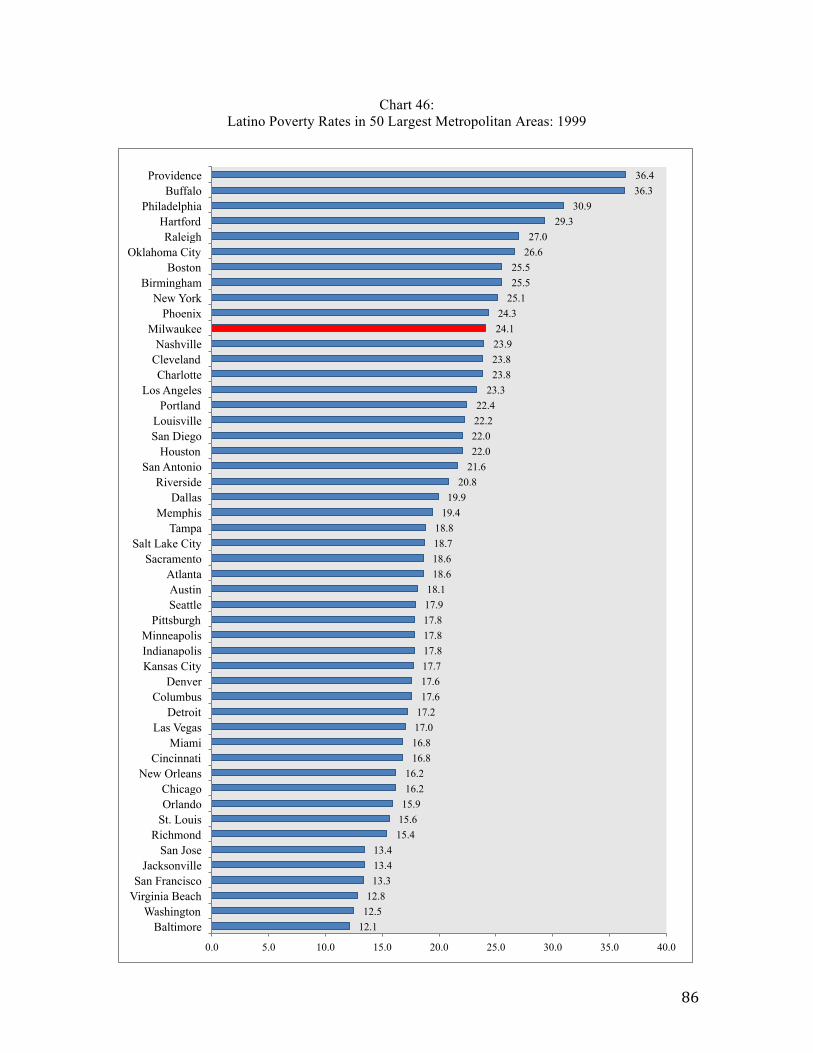
86
Chart 46:
Latino Poverty Rates in 50 Largest Metropolitan Areas: 1999
12.1 12.5 12.8
13.3 13.4 13.4
15.4 15.6 15.9 16.2 16.2
16.8 16.8 17.0 17.2 17.6 17.6 17.7 17.8 17.8 17.8 17.9 18.1
18.6 18.6 18.7 18.8
19.4 19.9
20.8 21.6 22.0 22.0 22.2 22.4
23.3 23.8 23.8 23.9 24.1 24.3
25.1 25.5 25.5
26.6 27.0
29.3 30.9
36.3 36.4
0.0 5.0 10.0 15.0 20.0 25.0 30.0 35.0 40.0
Baltimore Washington
Virginia Beach San Francisco
Jacksonville San Jose
Richmond St. Louis Orlando Chicago
New Orleans Cincinnati
Miami Las Vegas
Detroit Columbus
Denver Kansas City Indianapolis Minneapolis
Pittsburgh Seattle Austin
Atlanta Sacramento
Salt Lake City Tampa
Memphis Dallas
Riverside San Antonio
Houston San Diego Louisville
Portland Los Angeles
Charlotte Cleveland Nashville
Milwaukee Phoenix
New York Birmingham
Boston Oklahoma City
Raleigh Hartford
Philadelphia Buffalo
Providence
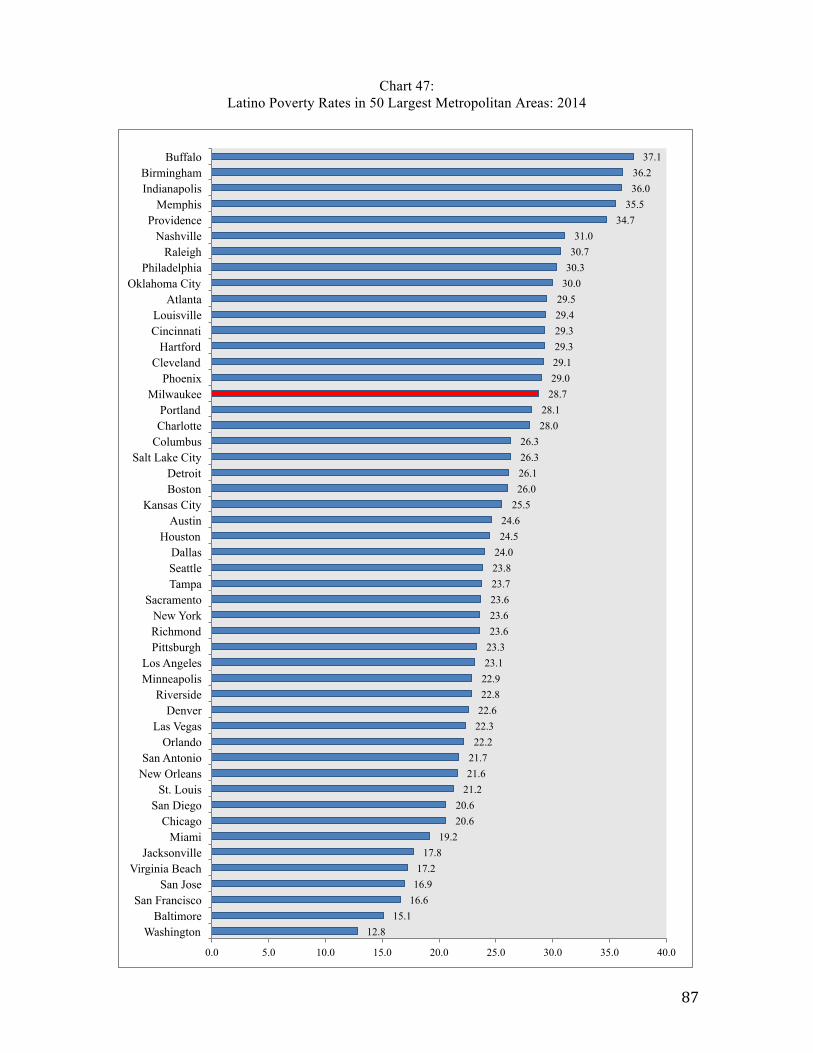
87
Chart 47: Latino Poverty Rates in 50 Largest Metropolitan Areas: 2014
12.8 15.1
16.6 16.9 17.2
17.8 19.2
20.6 20.6
21.2 21.6 21.7 22.2 22.3 22.6 22.8 22.9 23.1 23.3 23.6 23.6 23.6 23.7 23.8 24.0 24.5 24.6
25.5 26.0 26.1 26.3 26.3
28.0 28.1
28.7 29.0 29.1 29.3 29.3 29.4 29.5 30.0 30.3 30.7 31.0
34.7 35.5
36.0 36.2
37.1
0.0 5.0 10.0 15.0 20.0 25.0 30.0 35.0 40.0
Washington Baltimore
San Francisco San Jose
Virginia Beach Jacksonville
Miami Chicago
San Diego St. Louis
New Orleans San Antonio
Orlando Las Vegas
Denver Riverside
Minneapolis Los Angeles
Pittsburgh Richmond New York
Sacramento Tampa Seattle Dallas
Houston Austin
Kansas City Boston Detroit
Salt Lake City Columbus Charlotte Portland
Milwaukee Phoenix
Cleveland Hartford
Cincinnati Louisville
Atlanta Oklahoma City
Philadelphia Raleigh
Nashville Providence
Memphis Indianapolis Birmingham
Buffalo
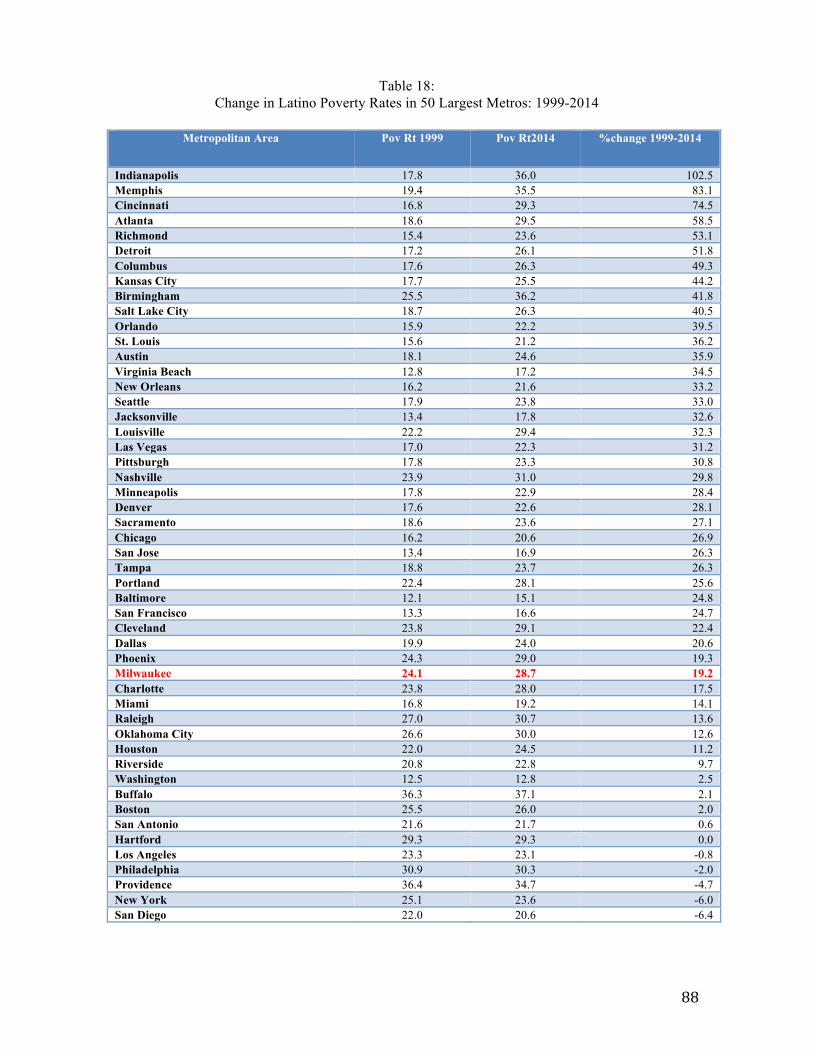
88
Table 18: Change in Latino Poverty Rates in 50 Largest Metros: 1999-2014
Metropolitan Area Pov Rt 1999 Pov Rt2014 %change 1999-2014
Indianapolis 17.8 36.0 102.5 Memphis 19.4 35.5 83.1 Cincinnati 16.8 29.3 74.5 Atlanta 18.6 29.5 58.5 Richmond 15.4 23.6 53.1 Detroit 17.2 26.1 51.8 Columbus 17.6 26.3 49.3 Kansas City 17.7 25.5 44.2 Birmingham 25.5 36.2 41.8 Salt Lake City 18.7 26.3 40.5 Orlando 15.9 22.2 39.5 St. Louis 15.6 21.2 36.2 Austin 18.1 24.6 35.9 Virginia Beach 12.8 17.2 34.5 New Orleans 16.2 21.6 33.2 Seattle 17.9 23.8 33.0 Jacksonville 13.4 17.8 32.6 Louisville 22.2 29.4 32.3 Las Vegas 17.0 22.3 31.2 Pittsburgh 17.8 23.3 30.8 Nashville 23.9 31.0 29.8 Minneapolis 17.8 22.9 28.4 Denver 17.6 22.6 28.1 Sacramento 18.6 23.6 27.1 Chicago 16.2 20.6 26.9 San Jose 13.4 16.9 26.3 Tampa 18.8 23.7 26.3 Portland 22.4 28.1 25.6 Baltimore 12.1 15.1 24.8 San Francisco 13.3 16.6 24.7 Cleveland 23.8 29.1 22.4 Dallas 19.9 24.0 20.6 Phoenix 24.3 29.0 19.3 Milwaukee 24.1 28.7 19.2 Charlotte 23.8 28.0 17.5 Miami 16.8 19.2 14.1 Raleigh 27.0 30.7 13.6 Oklahoma City 26.6 30.0 12.6 Houston 22.0 24.5 11.2 Riverside 20.8 22.8 9.7 Washington 12.5 12.8 2.5 Buffalo 36.3 37.1 2.1 Boston 25.5 26.0 2.0 San Antonio 21.6 21.7 0.6 Hartford 29.3 29.3 0.0 Los Angeles 23.3 23.1 -0.8 Philadelphia 30.9 30.3 -2.0 Providence 36.4 34.7 -4.7 New York 25.1 23.6 -6.0 San Diego 22.0 20.6 -6.4
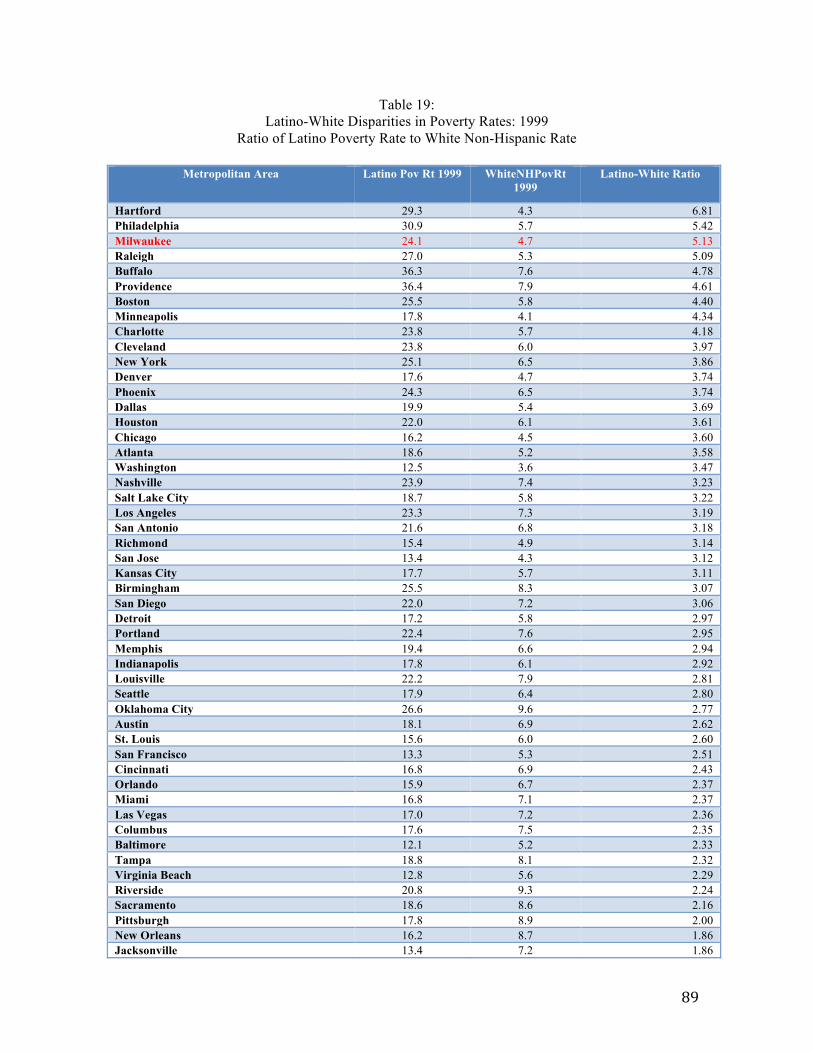
89
Table 19:
Latino-White Disparities in Poverty Rates: 1999 Ratio of Latino Poverty Rate to White Non-Hispanic Rate
Metropolitan Area Latino Pov Rt 1999 WhiteNHPovRt
1999 Latino-White Ratio
Hartford 29.3 4.3 6.81 Philadelphia 30.9 5.7 5.42 Milwaukee 24.1 4.7 5.13 Raleigh 27.0 5.3 5.09 Buffalo 36.3 7.6 4.78 Providence 36.4 7.9 4.61 Boston 25.5 5.8 4.40 Minneapolis 17.8 4.1 4.34 Charlotte 23.8 5.7 4.18 Cleveland 23.8 6.0 3.97 New York 25.1 6.5 3.86 Denver 17.6 4.7 3.74 Phoenix 24.3 6.5 3.74 Dallas 19.9 5.4 3.69 Houston 22.0 6.1 3.61 Chicago 16.2 4.5 3.60 Atlanta 18.6 5.2 3.58 Washington 12.5 3.6 3.47 Nashville 23.9 7.4 3.23 Salt Lake City 18.7 5.8 3.22 Los Angeles 23.3 7.3 3.19 San Antonio 21.6 6.8 3.18 Richmond 15.4 4.9 3.14 San Jose 13.4 4.3 3.12 Kansas City 17.7 5.7 3.11 Birmingham 25.5 8.3 3.07 San Diego 22.0 7.2 3.06 Detroit 17.2 5.8 2.97 Portland 22.4 7.6 2.95 Memphis 19.4 6.6 2.94 Indianapolis 17.8 6.1 2.92 Louisville 22.2 7.9 2.81 Seattle 17.9 6.4 2.80 Oklahoma City 26.6 9.6 2.77 Austin 18.1 6.9 2.62 St. Louis 15.6 6.0 2.60 San Francisco 13.3 5.3 2.51 Cincinnati 16.8 6.9 2.43 Orlando 15.9 6.7 2.37 Miami 16.8 7.1 2.37 Las Vegas 17.0 7.2 2.36 Columbus 17.6 7.5 2.35 Baltimore 12.1 5.2 2.33 Tampa 18.8 8.1 2.32 Virginia Beach 12.8 5.6 2.29 Riverside 20.8 9.3 2.24 Sacramento 18.6 8.6 2.16 Pittsburgh 17.8 8.9 2.00 New Orleans 16.2 8.7 1.86 Jacksonville 13.4 7.2 1.86
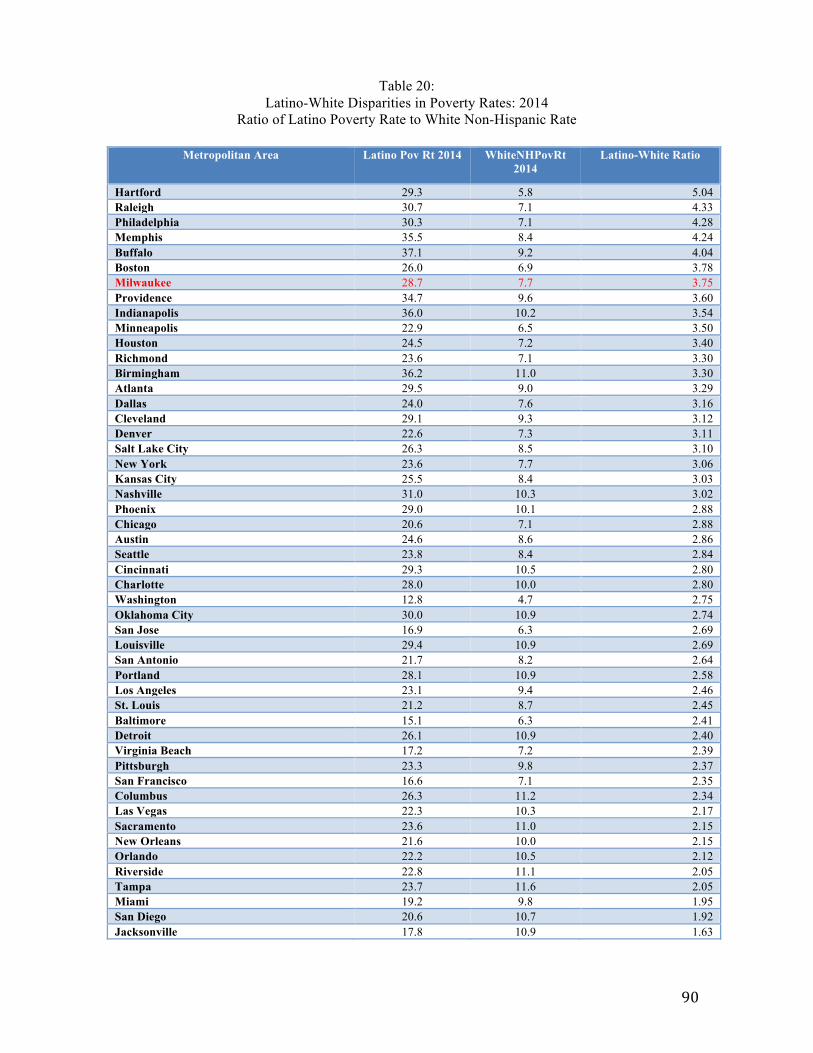
90
Table 20: Latino-White Disparities in Poverty Rates: 2014
Ratio of Latino Poverty Rate to White Non-Hispanic Rate
Metropolitan Area Latino Pov Rt 2014 WhiteNHPovRt 2014
Latino-White Ratio
Hartford 29.3 5.8 5.04 Raleigh 30.7 7.1 4.33 Philadelphia 30.3 7.1 4.28 Memphis 35.5 8.4 4.24 Buffalo 37.1 9.2 4.04 Boston 26.0 6.9 3.78 Milwaukee 28.7 7.7 3.75 Providence 34.7 9.6 3.60 Indianapolis 36.0 10.2 3.54 Minneapolis 22.9 6.5 3.50 Houston 24.5 7.2 3.40 Richmond 23.6 7.1 3.30 Birmingham 36.2 11.0 3.30 Atlanta 29.5 9.0 3.29 Dallas 24.0 7.6 3.16 Cleveland 29.1 9.3 3.12 Denver 22.6 7.3 3.11 Salt Lake City 26.3 8.5 3.10 New York 23.6 7.7 3.06 Kansas City 25.5 8.4 3.03 Nashville 31.0 10.3 3.02 Phoenix 29.0 10.1 2.88 Chicago 20.6 7.1 2.88 Austin 24.6 8.6 2.86 Seattle 23.8 8.4 2.84 Cincinnati 29.3 10.5 2.80 Charlotte 28.0 10.0 2.80 Washington 12.8 4.7 2.75 Oklahoma City 30.0 10.9 2.74 San Jose 16.9 6.3 2.69 Louisville 29.4 10.9 2.69 San Antonio 21.7 8.2 2.64 Portland 28.1 10.9 2.58 Los Angeles 23.1 9.4 2.46 St. Louis 21.2 8.7 2.45 Baltimore 15.1 6.3 2.41 Detroit 26.1 10.9 2.40 Virginia Beach 17.2 7.2 2.39 Pittsburgh 23.3 9.8 2.37 San Francisco 16.6 7.1 2.35 Columbus 26.3 11.2 2.34 Las Vegas 22.3 10.3 2.17 Sacramento 23.6 11.0 2.15 New Orleans 21.6 10.0 2.15 Orlando 22.2 10.5 2.12 Riverside 22.8 11.1 2.05 Tampa 23.7 11.6 2.05 Miami 19.2 9.8 1.95 San Diego 20.6 10.7 1.92 Jacksonville 17.8 10.9 1.63
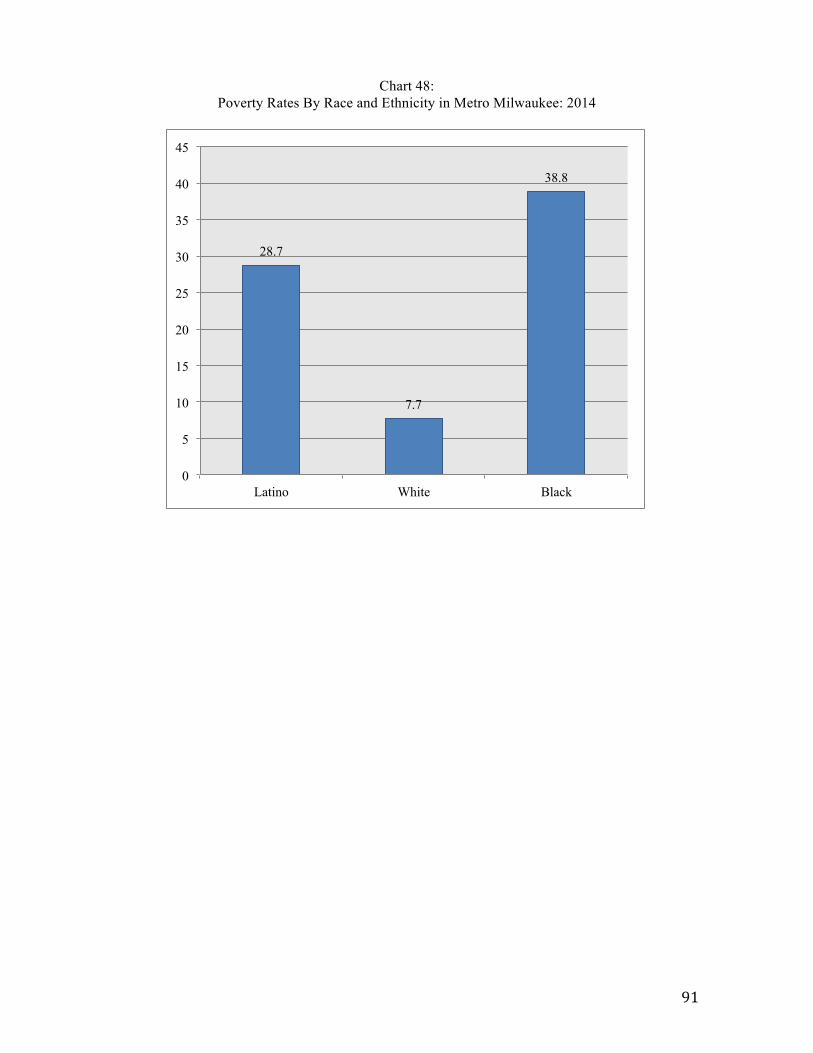
91
Chart 48: Poverty Rates By Race and Ethnicity in Metro Milwaukee: 2014
28.7
7.7
38.8
0
5
10
15
20
25
30
35
40
45
Latino White Black
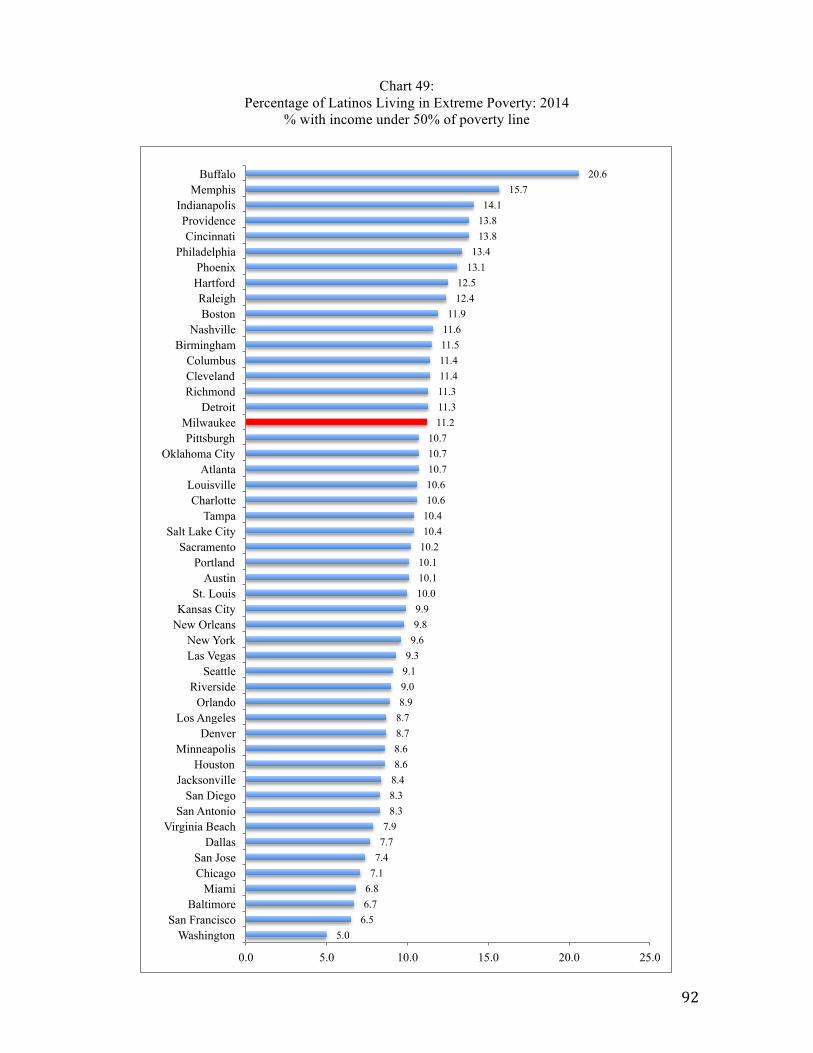
92
Chart 49: Percentage of Latinos Living in Extreme Poverty: 2014
% with income under 50% of poverty line
5.0 6.5 6.7 6.8 7.1 7.4 7.7 7.9
8.3 8.3 8.4 8.6 8.6 8.7 8.7 8.9 9.0 9.1 9.3 9.6 9.8 9.9 10.0 10.1 10.1 10.2 10.4 10.4 10.6 10.6 10.7 10.7 10.7
11.2 11.3 11.3 11.4 11.4 11.5 11.6 11.9
12.4 12.5
13.1 13.4
13.8 13.8 14.1
15.7 20.6
0.0 5.0 10.0 15.0 20.0 25.0
Washington San Francisco
Baltimore Miami
Chicago San Jose
Dallas Virginia Beach
San Antonio San Diego
Jacksonville Houston
Minneapolis Denver
Los Angeles Orlando
Riverside Seattle
Las Vegas New York
New Orleans Kansas City
St. Louis Austin
Portland Sacramento
Salt Lake City Tampa
Charlotte Louisville
Atlanta Oklahoma City
Pittsburgh Milwaukee
Detroit Richmond Cleveland Columbus
Birmingham Nashville
Boston Raleigh
Hartford Phoenix
Philadelphia Cincinnati
Providence Indianapolis
Memphis Buffalo
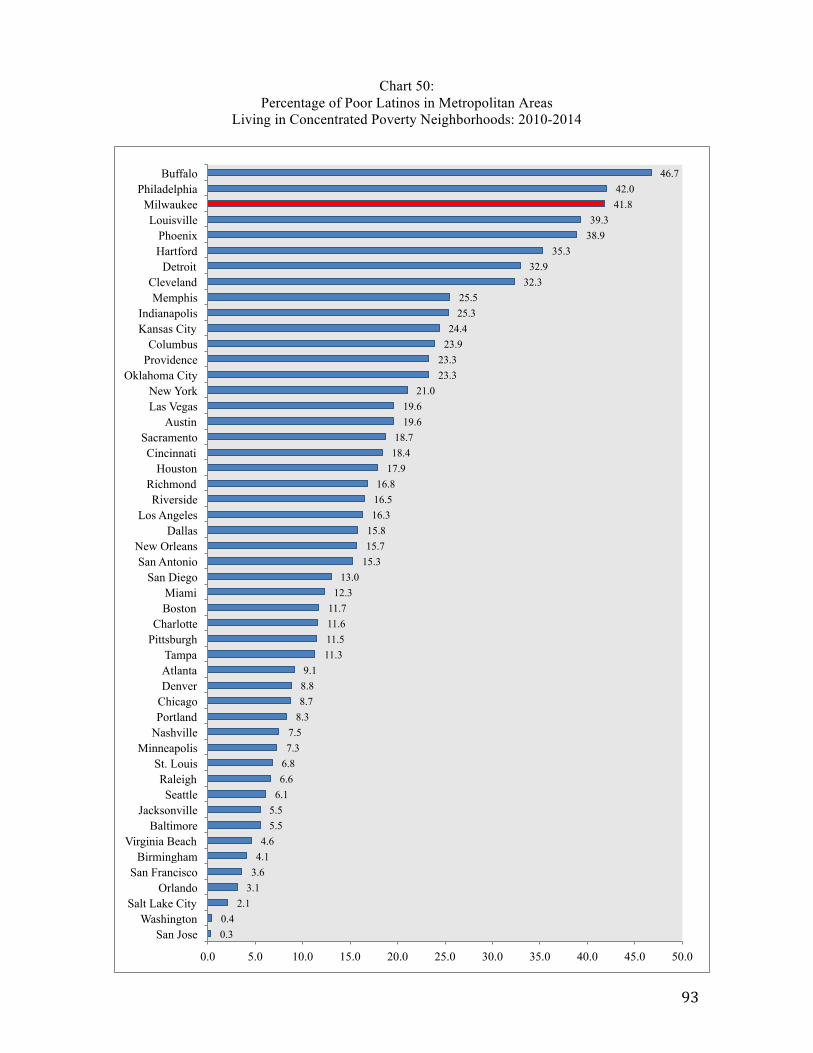
93
Chart 50: Percentage of Poor Latinos in Metropolitan Areas
Living in Concentrated Poverty Neighborhoods: 2010-2014
0.3 0.4
2.1 3.1 3.6 4.1 4.6
5.5 5.5
6.1 6.6 6.8 7.3 7.5
8.3 8.7 8.8 9.1
11.3 11.5 11.6 11.7
12.3 13.0
15.3 15.7 15.8 16.3 16.5 16.8
17.9 18.4 18.7
19.6 19.6
21.0 23.3 23.3
23.9 24.4
25.3 25.5
32.3 32.9
35.3 38.9 39.3
41.8 42.0
46.7
0.0 5.0 10.0 15.0 20.0 25.0 30.0 35.0 40.0 45.0 50.0
San Jose Washington
Salt Lake City Orlando
San Francisco Birmingham
Virginia Beach Baltimore
Jacksonville Seattle
Raleigh St. Louis
Minneapolis Nashville Portland Chicago Denver Atlanta Tampa
Pittsburgh Charlotte
Boston Miami
San Diego San Antonio
New Orleans Dallas
Los Angeles Riverside
Richmond Houston
Cincinnati Sacramento
Austin Las Vegas New York
Oklahoma City Providence Columbus
Kansas City Indianapolis
Memphis Cleveland
Detroit Hartford Phoenix
Louisville Milwaukee
Philadelphia Buffalo
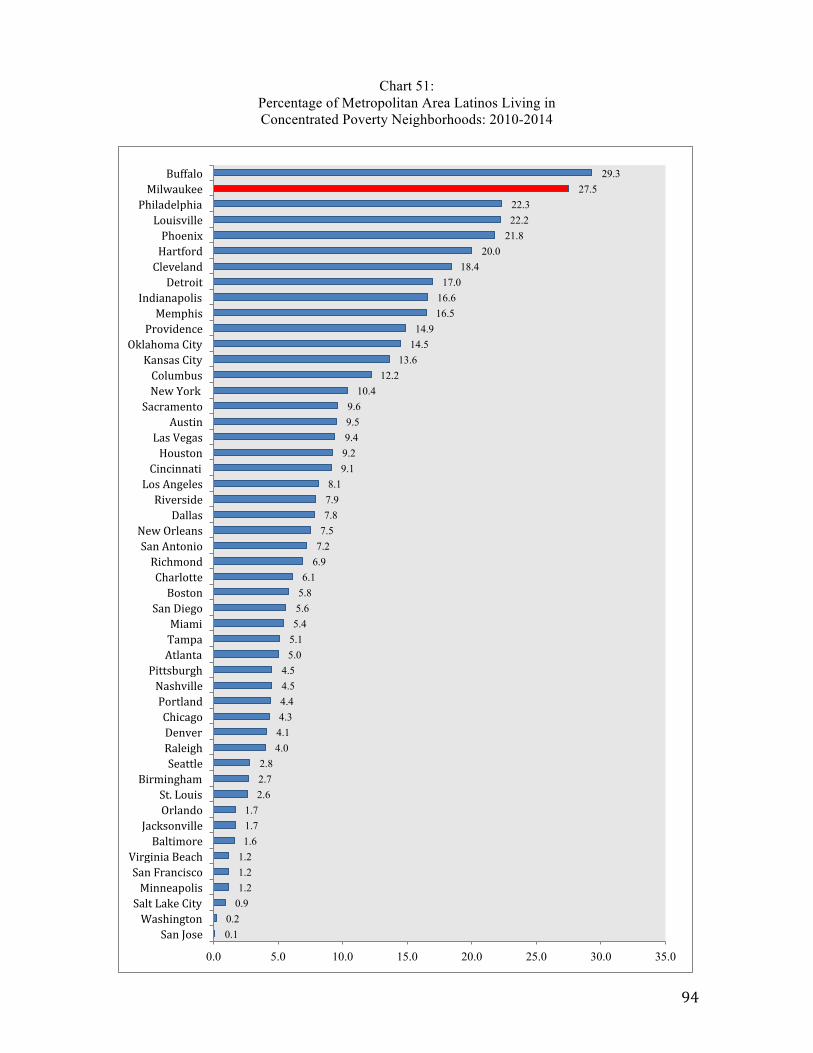
94
Chart 51: Percentage of Metropolitan Area Latinos Living in Concentrated Poverty Neighborhoods: 2010-2014
0.1 0.2
0.9 1.2 1.2 1.2 1.6 1.7 1.7
2.6 2.7 2.8
4.0 4.1 4.3 4.4 4.5 4.5
5.0 5.1 5.4 5.6 5.8 6.1
6.9 7.2 7.5 7.8 7.9 8.1
9.1 9.2 9.4 9.5 9.6
10.4 12.2
13.6 14.5 14.9
16.5 16.6 17.0
18.4 20.0
21.8 22.2 22.3
27.5 29.3
0.0 5.0 10.0 15.0 20.0 25.0 30.0 35.0
San Jose Washington Salt Lake City Minneapolis San Francisco Virginia Beach
Baltimore Jacksonville
Orlando St. Louis
Birmingham Seattle Raleigh Denver Chicago Portland Nashville Pittsburgh
Atlanta Tampa Miami
San Diego Boston
Charlotte Richmond
San Antonio New Orleans
Dallas Riverside
Los Angeles Cincinnati Houston Las Vegas
Austin Sacramento New York Columbus Kansas City
Oklahoma City Providence Memphis
Indianapolis Detroit
Cleveland Hartford Phoenix
Louisville Philadelphia Milwaukee
Buffalo
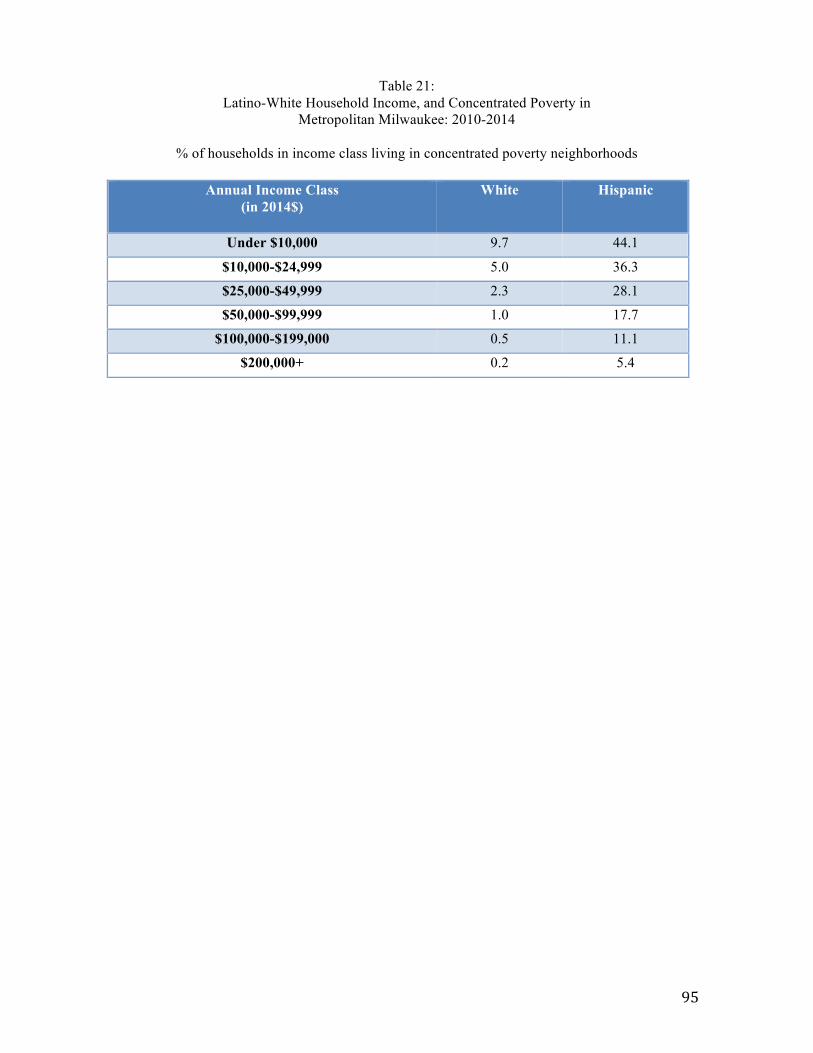
95
Table 21: Latino-White Household Income, and Concentrated Poverty in
Metropolitan Milwaukee: 2010-2014
% of households in income class living in concentrated poverty neighborhoods
Annual Income Class (in 2014$)
White Hispanic
Under $10,000 9.7 44.1
$10,000-$24,999 5.0 36.3
$25,000-$49,999 2.3 28.1
$50,000-$99,999 1.0 17.7
$100,000-$199,000 0.5 11.1
$200,000+ 0.2 5.4
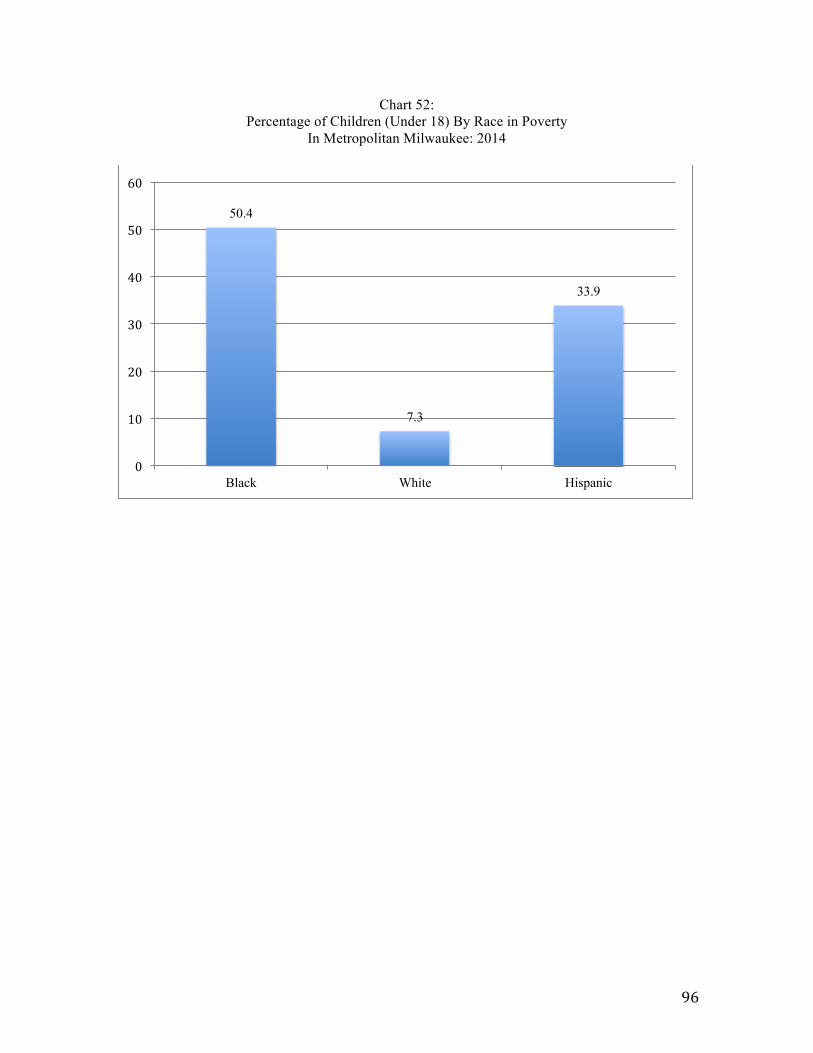
96
Chart 52:
Percentage of Children (Under 18) By Race in Poverty In Metropolitan Milwaukee: 2014
50.4
7.3
33.9
0
10
20
30
40
50
60
Black White Hispanic
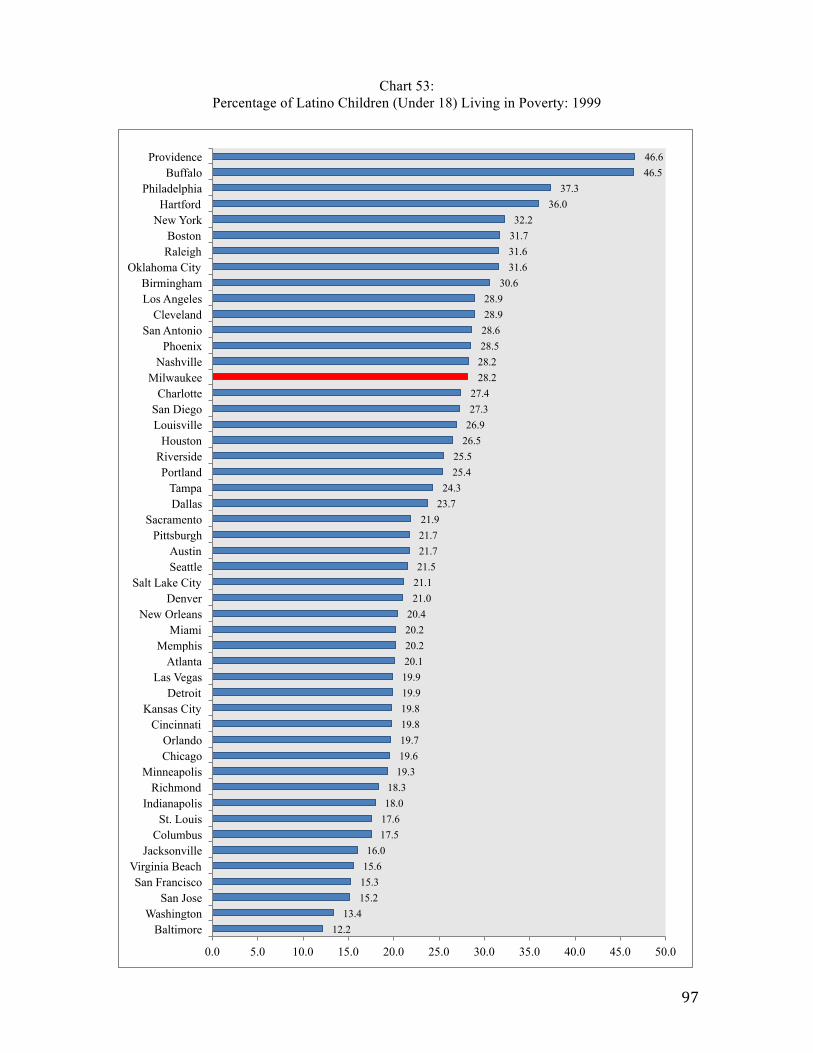
97
Chart 53: Percentage of Latino Children (Under 18) Living in Poverty: 1999
12.2 13.4
15.2 15.3 15.6 16.0
17.5 17.6 18.0 18.3
19.3 19.6 19.7 19.8 19.8 19.9 19.9 20.1 20.2 20.2 20.4
21.0 21.1 21.5 21.7 21.7 21.9
23.7 24.3
25.4 25.5
26.5 26.9 27.3 27.4
28.2 28.2 28.5 28.6 28.9 28.9
30.6 31.6 31.6 31.7 32.2
36.0 37.3
46.5 46.6
0.0 5.0 10.0 15.0 20.0 25.0 30.0 35.0 40.0 45.0 50.0
Baltimore Washington
San Jose San Francisco
Virginia Beach Jacksonville
Columbus St. Louis
Indianapolis Richmond
Minneapolis Chicago Orlando
Cincinnati Kansas City
Detroit Las Vegas
Atlanta Memphis
Miami New Orleans
Denver Salt Lake City
Seattle Austin
Pittsburgh Sacramento
Dallas Tampa
Portland Riverside Houston
Louisville San Diego Charlotte
Milwaukee Nashville
Phoenix San Antonio
Cleveland Los Angeles Birmingham
Oklahoma City Raleigh Boston
New York Hartford
Philadelphia Buffalo
Providence
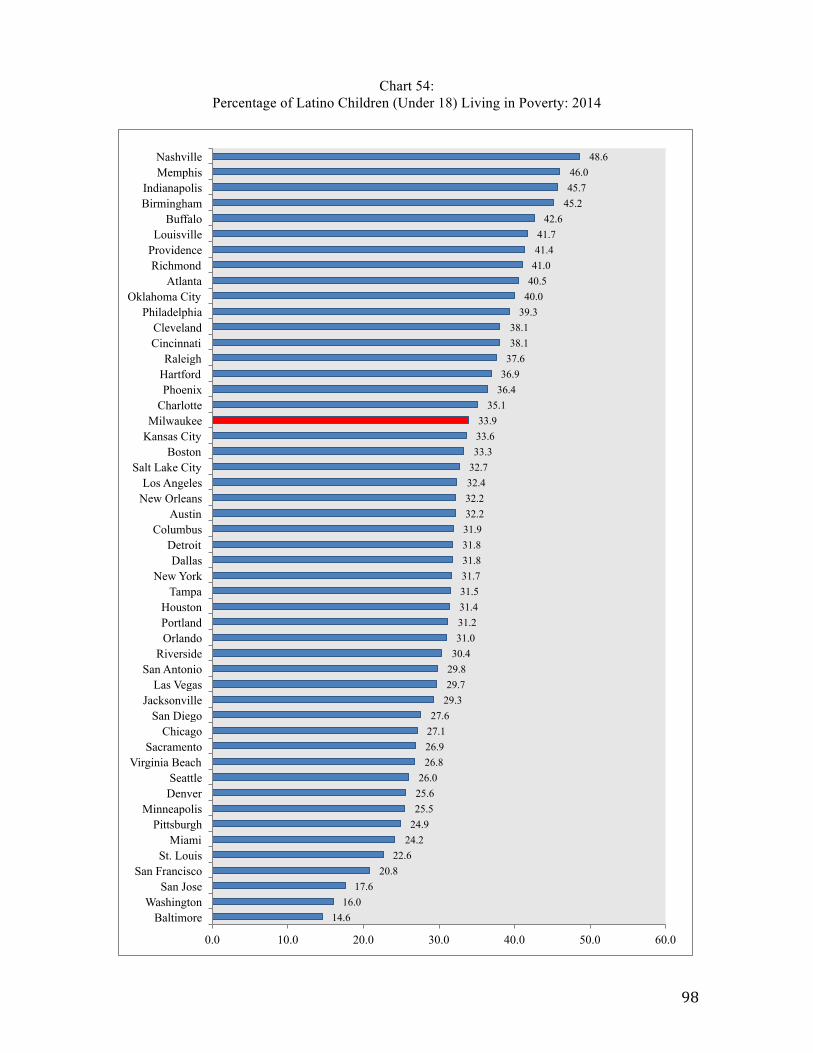
98
Chart 54: Percentage of Latino Children (Under 18) Living in Poverty: 2014
14.6 16.0
17.6 20.8
22.6 24.2 24.9 25.5 25.6 26.0
26.8 26.9 27.1 27.6
29.3 29.7 29.8 30.4 31.0 31.2 31.4 31.5 31.7 31.8 31.8 31.9 32.2 32.2 32.4 32.7 33.3 33.6 33.9
35.1 36.4 36.9 37.6 38.1 38.1
39.3 40.0 40.5 41.0 41.4 41.7
42.6 45.2 45.7 46.0
48.6
0.0 10.0 20.0 30.0 40.0 50.0 60.0
Baltimore Washington
San Jose San Francisco
St. Louis Miami
Pittsburgh Minneapolis
Denver Seattle
Virginia Beach Sacramento
Chicago San Diego
Jacksonville Las Vegas
San Antonio Riverside
Orlando Portland Houston
Tampa New York
Dallas Detroit
Columbus Austin
New Orleans Los Angeles
Salt Lake City Boston
Kansas City Milwaukee
Charlotte Phoenix
Hartford Raleigh
Cincinnati Cleveland
Philadelphia Oklahoma City
Atlanta Richmond
Providence Louisville
Buffalo Birmingham Indianapolis
Memphis Nashville
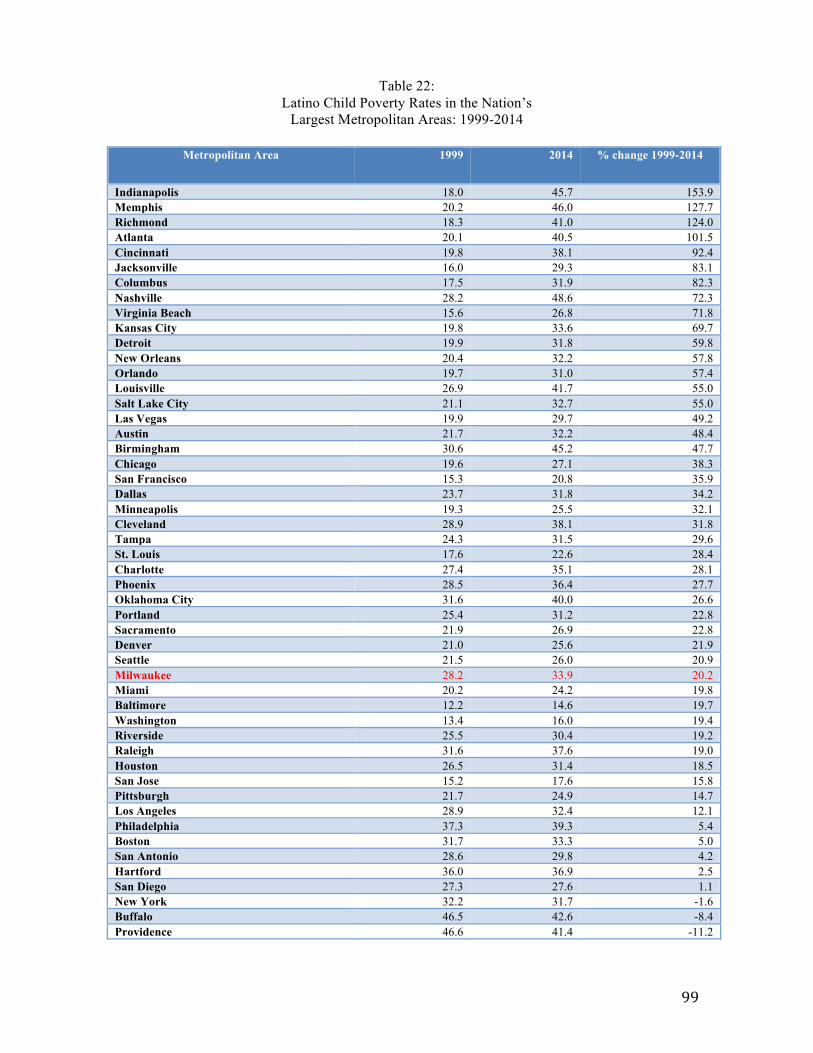
99
Table 22: Latino Child Poverty Rates in the Nation’s
Largest Metropolitan Areas: 1999-2014
Metropolitan Area 1999 2014 % change 1999-2014
Indianapolis 18.0 45.7 153.9 Memphis 20.2 46.0 127.7 Richmond 18.3 41.0 124.0 Atlanta 20.1 40.5 101.5 Cincinnati 19.8 38.1 92.4 Jacksonville 16.0 29.3 83.1 Columbus 17.5 31.9 82.3 Nashville 28.2 48.6 72.3 Virginia Beach 15.6 26.8 71.8 Kansas City 19.8 33.6 69.7 Detroit 19.9 31.8 59.8 New Orleans 20.4 32.2 57.8 Orlando 19.7 31.0 57.4 Louisville 26.9 41.7 55.0 Salt Lake City 21.1 32.7 55.0 Las Vegas 19.9 29.7 49.2 Austin 21.7 32.2 48.4 Birmingham 30.6 45.2 47.7 Chicago 19.6 27.1 38.3 San Francisco 15.3 20.8 35.9 Dallas 23.7 31.8 34.2 Minneapolis 19.3 25.5 32.1 Cleveland 28.9 38.1 31.8 Tampa 24.3 31.5 29.6 St. Louis 17.6 22.6 28.4 Charlotte 27.4 35.1 28.1 Phoenix 28.5 36.4 27.7 Oklahoma City 31.6 40.0 26.6 Portland 25.4 31.2 22.8 Sacramento 21.9 26.9 22.8 Denver 21.0 25.6 21.9 Seattle 21.5 26.0 20.9 Milwaukee 28.2 33.9 20.2 Miami 20.2 24.2 19.8 Baltimore 12.2 14.6 19.7 Washington 13.4 16.0 19.4 Riverside 25.5 30.4 19.2 Raleigh 31.6 37.6 19.0 Houston 26.5 31.4 18.5 San Jose 15.2 17.6 15.8 Pittsburgh 21.7 24.9 14.7 Los Angeles 28.9 32.4 12.1 Philadelphia 37.3 39.3 5.4 Boston 31.7 33.3 5.0 San Antonio 28.6 29.8 4.2 Hartford 36.0 36.9 2.5 San Diego 27.3 27.6 1.1 New York 32.2 31.7 -1.6 Buffalo 46.5 42.6 -8.4 Providence 46.6 41.4 -11.2
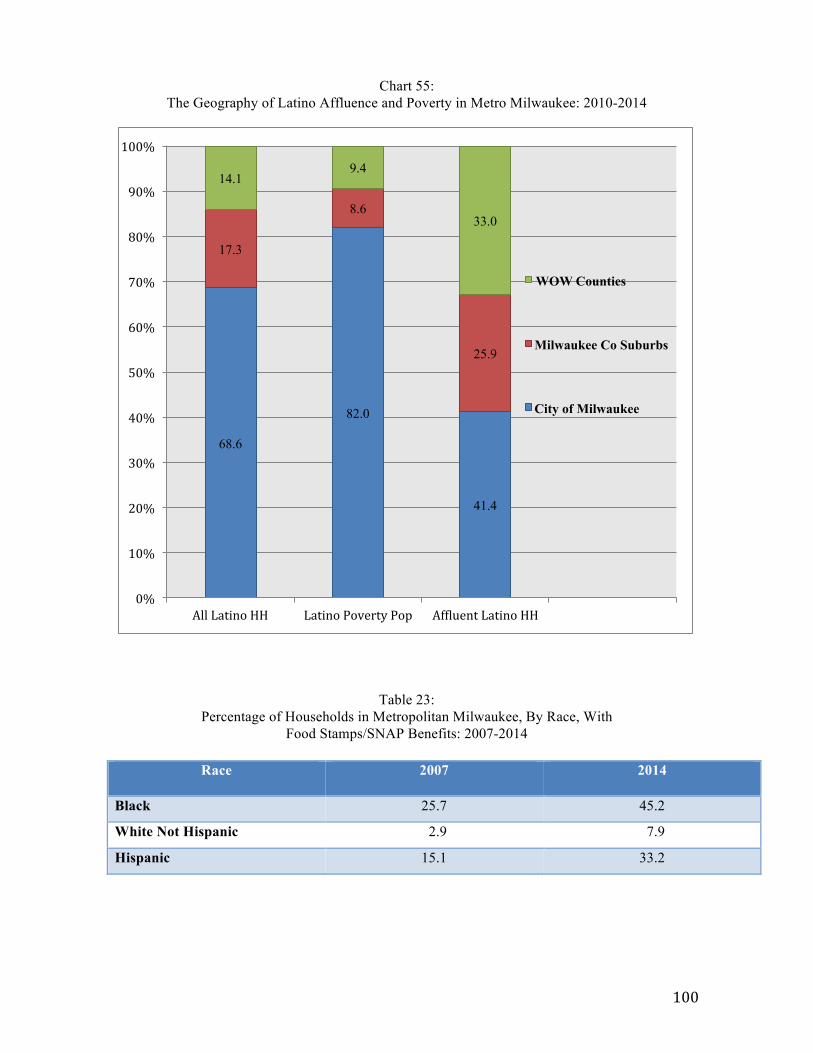
100
Chart 55: The Geography of Latino Affluence and Poverty in Metro Milwaukee: 2010-2014
Table 23: Percentage of Households in Metropolitan Milwaukee, By Race, With
Food Stamps/SNAP Benefits: 2007-2014
Race
2007 2014
Black 25.7 45.2
White Not Hispanic 2.9 7.9
Hispanic 15.1 33.2
68.6
82.0
41.4
17.3
8.6
25.9
14.1 9.4
33.0
0%
10%
20%
30%
40%
50%
60%
70%
80%
90%
100%
All Latino HH Latino Poverty Pop Afdluent Latino HH
WOW Counties
Milwaukee Co Suburbs
City of Milwaukee
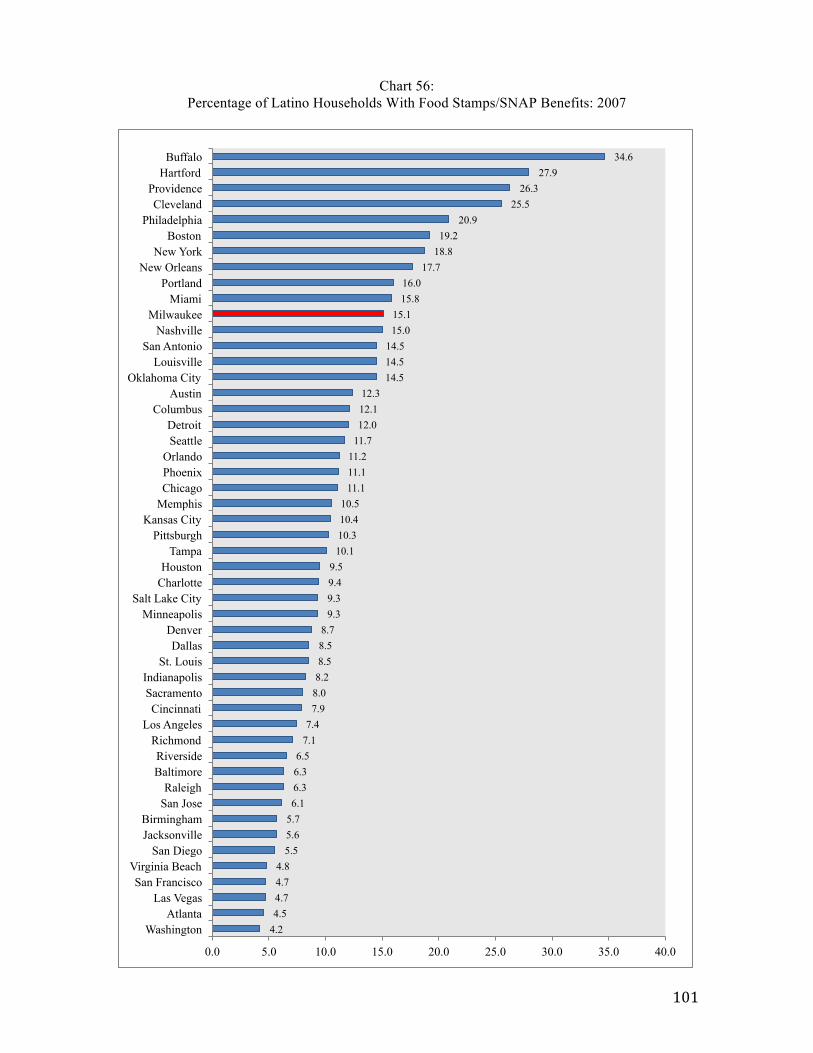
101
Chart 56: Percentage of Latino Households With Food Stamps/SNAP Benefits: 2007
4.2 4.5 4.7 4.7 4.8
5.5 5.6 5.7 6.1 6.3 6.3 6.5
7.1 7.4
7.9 8.0 8.2 8.5 8.5 8.7
9.3 9.3 9.4 9.5
10.1 10.3 10.4 10.5
11.1 11.1 11.2
11.7 12.0 12.1 12.3
14.5 14.5 14.5
15.0 15.1
15.8 16.0
17.7 18.8 19.2
20.9 25.5
26.3 27.9
34.6
0.0 5.0 10.0 15.0 20.0 25.0 30.0 35.0 40.0
Washington Atlanta
Las Vegas San Francisco
Virginia Beach San Diego
Jacksonville Birmingham
San Jose Raleigh
Baltimore Riverside
Richmond Los Angeles
Cincinnati Sacramento Indianapolis
St. Louis Dallas
Denver Minneapolis
Salt Lake City Charlotte Houston
Tampa Pittsburgh
Kansas City Memphis Chicago Phoenix Orlando
Seattle Detroit
Columbus Austin
Oklahoma City Louisville
San Antonio Nashville
Milwaukee Miami
Portland New Orleans
New York Boston
Philadelphia Cleveland
Providence Hartford
Buffalo
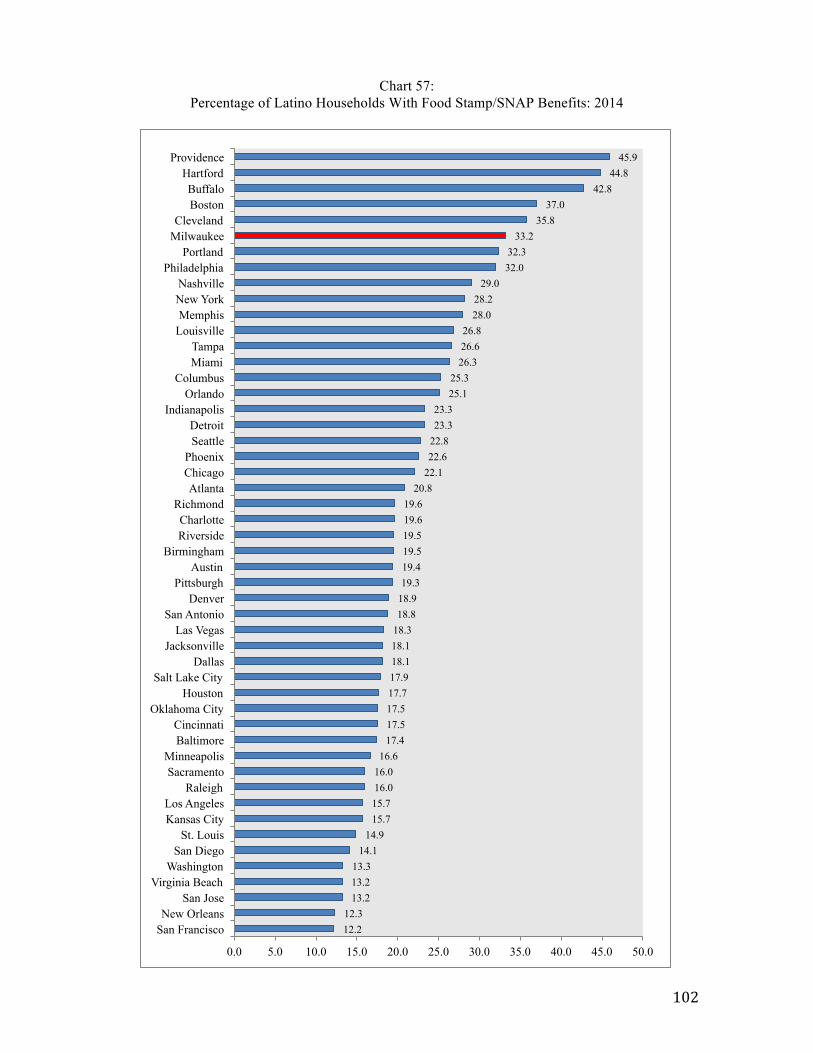
102
Chart 57: Percentage of Latino Households With Food Stamp/SNAP Benefits: 2014
12.2 12.3
13.2 13.2 13.3
14.1 14.9
15.7 15.7 16.0 16.0 16.6
17.4 17.5 17.5 17.7 17.9 18.1 18.1 18.3 18.8 18.9 19.3 19.4 19.5 19.5 19.6 19.6
20.8 22.1 22.6 22.8 23.3 23.3
25.1 25.3
26.3 26.6 26.8
28.0 28.2
29.0 32.0 32.3
33.2 35.8
37.0 42.8
44.8 45.9
0.0 5.0 10.0 15.0 20.0 25.0 30.0 35.0 40.0 45.0 50.0
San Francisco New Orleans
San Jose Virginia Beach
Washington San Diego
St. Louis Kansas City Los Angeles
Raleigh Sacramento
Minneapolis Baltimore Cincinnati
Oklahoma City Houston
Salt Lake City Dallas
Jacksonville Las Vegas
San Antonio Denver
Pittsburgh Austin
Birmingham Riverside Charlotte
Richmond Atlanta
Chicago Phoenix
Seattle Detroit
Indianapolis Orlando
Columbus Miami Tampa
Louisville Memphis
New York Nashville
Philadelphia Portland
Milwaukee Cleveland
Boston Buffalo
Hartford Providence
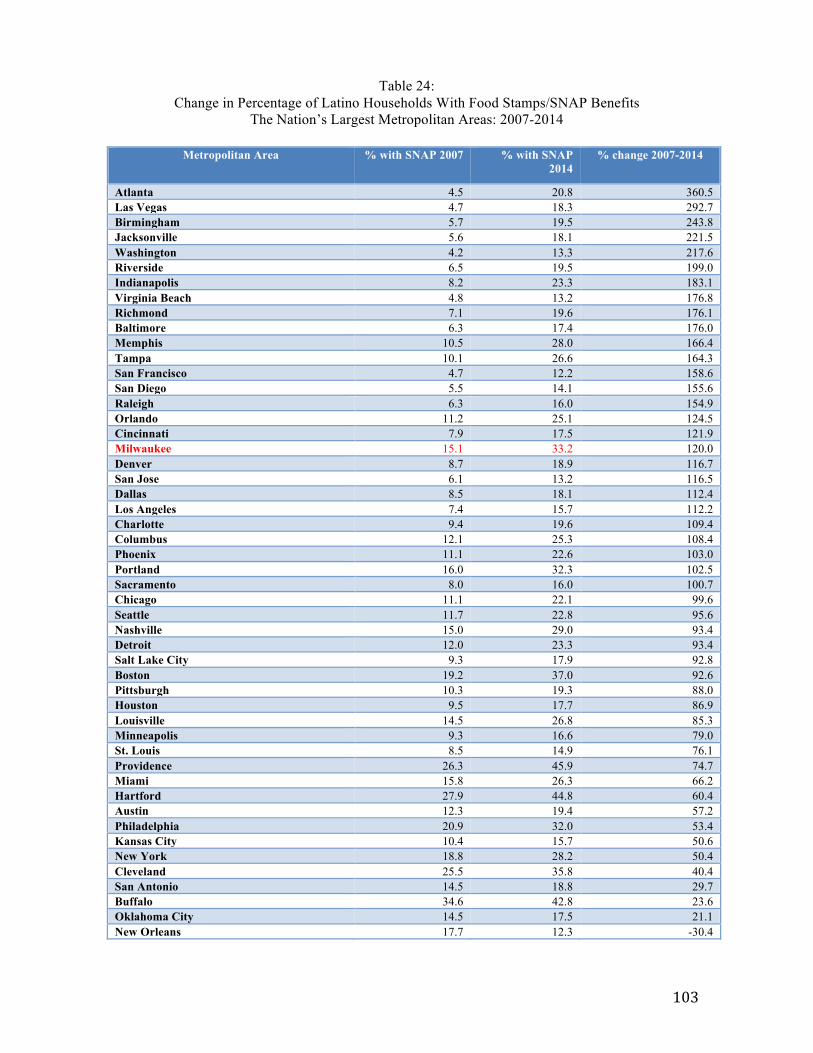
103
Table 24: Change in Percentage of Latino Households With Food Stamps/SNAP Benefits
The Nation’s Largest Metropolitan Areas: 2007-2014
Metropolitan Area % with SNAP 2007 % with SNAP 2014
% change 2007-2014
Atlanta 4.5 20.8 360.5 Las Vegas 4.7 18.3 292.7 Birmingham 5.7 19.5 243.8 Jacksonville 5.6 18.1 221.5 Washington 4.2 13.3 217.6 Riverside 6.5 19.5 199.0 Indianapolis 8.2 23.3 183.1 Virginia Beach 4.8 13.2 176.8 Richmond 7.1 19.6 176.1 Baltimore 6.3 17.4 176.0 Memphis 10.5 28.0 166.4 Tampa 10.1 26.6 164.3 San Francisco 4.7 12.2 158.6 San Diego 5.5 14.1 155.6 Raleigh 6.3 16.0 154.9 Orlando 11.2 25.1 124.5 Cincinnati 7.9 17.5 121.9 Milwaukee 15.1 33.2 120.0 Denver 8.7 18.9 116.7 San Jose 6.1 13.2 116.5 Dallas 8.5 18.1 112.4 Los Angeles 7.4 15.7 112.2 Charlotte 9.4 19.6 109.4 Columbus 12.1 25.3 108.4 Phoenix 11.1 22.6 103.0 Portland 16.0 32.3 102.5 Sacramento 8.0 16.0 100.7 Chicago 11.1 22.1 99.6 Seattle 11.7 22.8 95.6 Nashville 15.0 29.0 93.4 Detroit 12.0 23.3 93.4 Salt Lake City 9.3 17.9 92.8 Boston 19.2 37.0 92.6 Pittsburgh 10.3 19.3 88.0 Houston 9.5 17.7 86.9 Louisville 14.5 26.8 85.3 Minneapolis 9.3 16.6 79.0 St. Louis 8.5 14.9 76.1 Providence 26.3 45.9 74.7 Miami 15.8 26.3 66.2 Hartford 27.9 44.8 60.4 Austin 12.3 19.4 57.2 Philadelphia 20.9 32.0 53.4 Kansas City 10.4 15.7 50.6 New York 18.8 28.2 50.4 Cleveland 25.5 35.8 40.4 San Antonio 14.5 18.8 29.7 Buffalo 34.6 42.8 23.6 Oklahoma City 14.5 17.5 21.1 New Orleans 17.7 12.3 -30.4
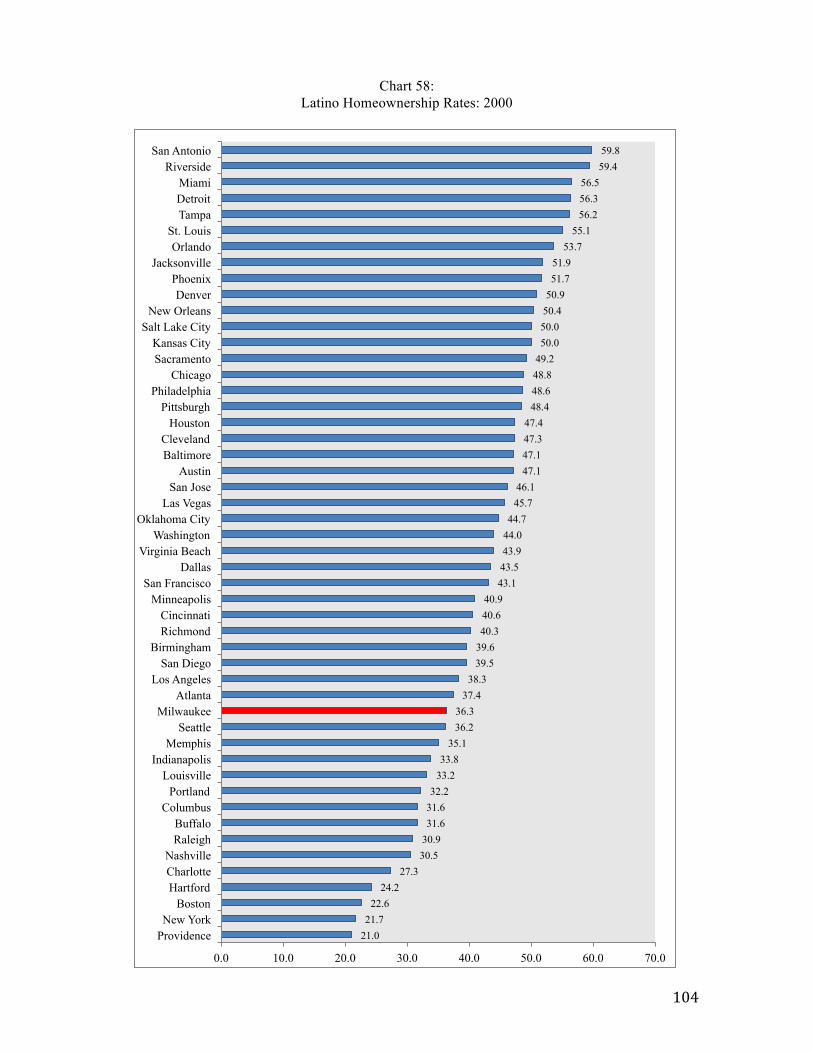
104
Chart 58: Latino Homeownership Rates: 2000
21.0 21.7
22.6 24.2
27.3 30.5 30.9 31.6 31.6 32.2
33.2 33.8
35.1 36.2 36.3
37.4 38.3
39.5 39.6 40.3 40.6 40.9
43.1 43.5 43.9 44.0 44.7
45.7 46.1
47.1 47.1 47.3 47.4
48.4 48.6 48.8 49.2 50.0 50.0 50.4 50.9 51.7 51.9
53.7 55.1
56.2 56.3 56.5
59.4 59.8
0.0 10.0 20.0 30.0 40.0 50.0 60.0 70.0
Providence New York
Boston Hartford Charlotte Nashville
Raleigh Buffalo
Columbus Portland
Louisville Indianapolis
Memphis Seattle
Milwaukee Atlanta
Los Angeles San Diego
Birmingham Richmond Cincinnati
Minneapolis San Francisco
Dallas Virginia Beach
Washington Oklahoma City
Las Vegas San Jose
Austin Baltimore Cleveland
Houston Pittsburgh
Philadelphia Chicago
Sacramento Kansas City
Salt Lake City New Orleans
Denver Phoenix
Jacksonville Orlando
St. Louis Tampa Detroit Miami
Riverside San Antonio
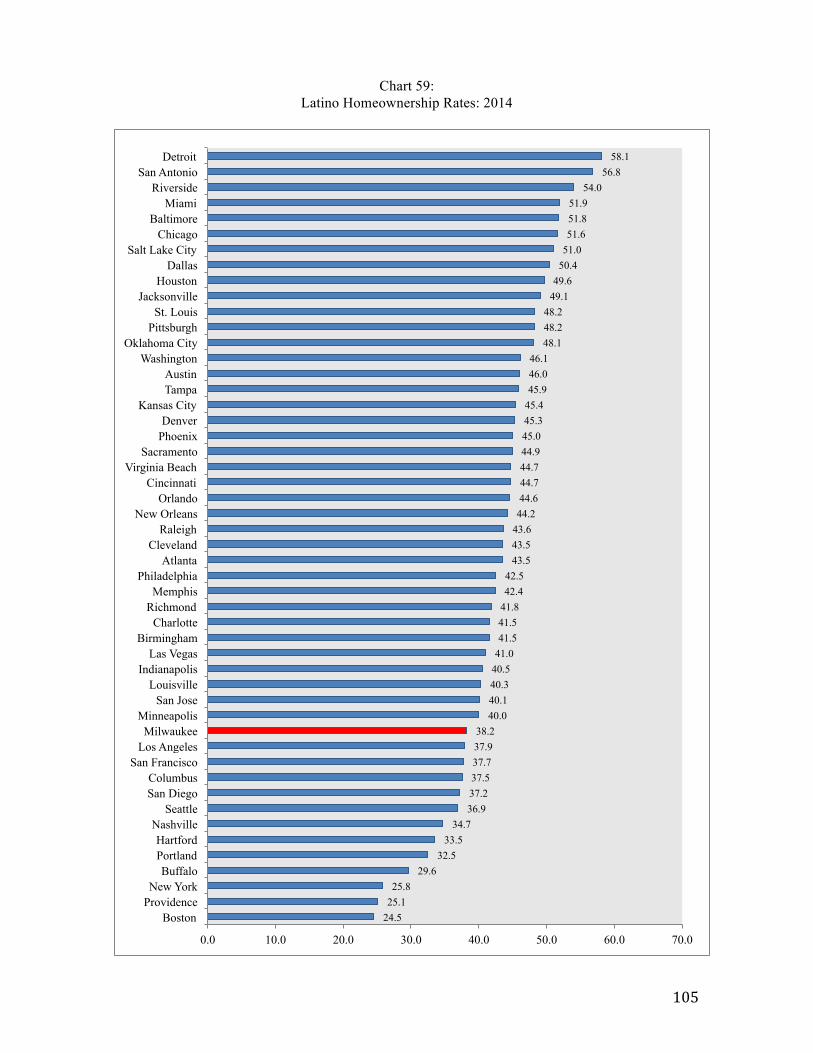
105
Chart 59: Latino Homeownership Rates: 2014
24.5 25.1 25.8
29.6 32.5
33.5 34.7
36.9 37.2 37.5 37.7 37.9 38.2
40.0 40.1 40.3 40.5 41.0 41.5 41.5 41.8 42.4 42.5
43.5 43.5 43.6 44.2 44.6 44.7 44.7 44.9 45.0 45.3 45.4 45.9 46.0 46.1
48.1 48.2 48.2
49.1 49.6
50.4 51.0 51.6 51.8 51.9
54.0 56.8
58.1
0.0 10.0 20.0 30.0 40.0 50.0 60.0 70.0
Boston Providence New York
Buffalo Portland Hartford
Nashville Seattle
San Diego Columbus
San Francisco Los Angeles Milwaukee
Minneapolis San Jose
Louisville Indianapolis
Las Vegas Birmingham
Charlotte Richmond Memphis
Philadelphia Atlanta
Cleveland Raleigh
New Orleans Orlando
Cincinnati Virginia Beach
Sacramento Phoenix Denver
Kansas City Tampa Austin
Washington Oklahoma City
Pittsburgh St. Louis
Jacksonville Houston
Dallas Salt Lake City
Chicago Baltimore
Miami Riverside
San Antonio Detroit
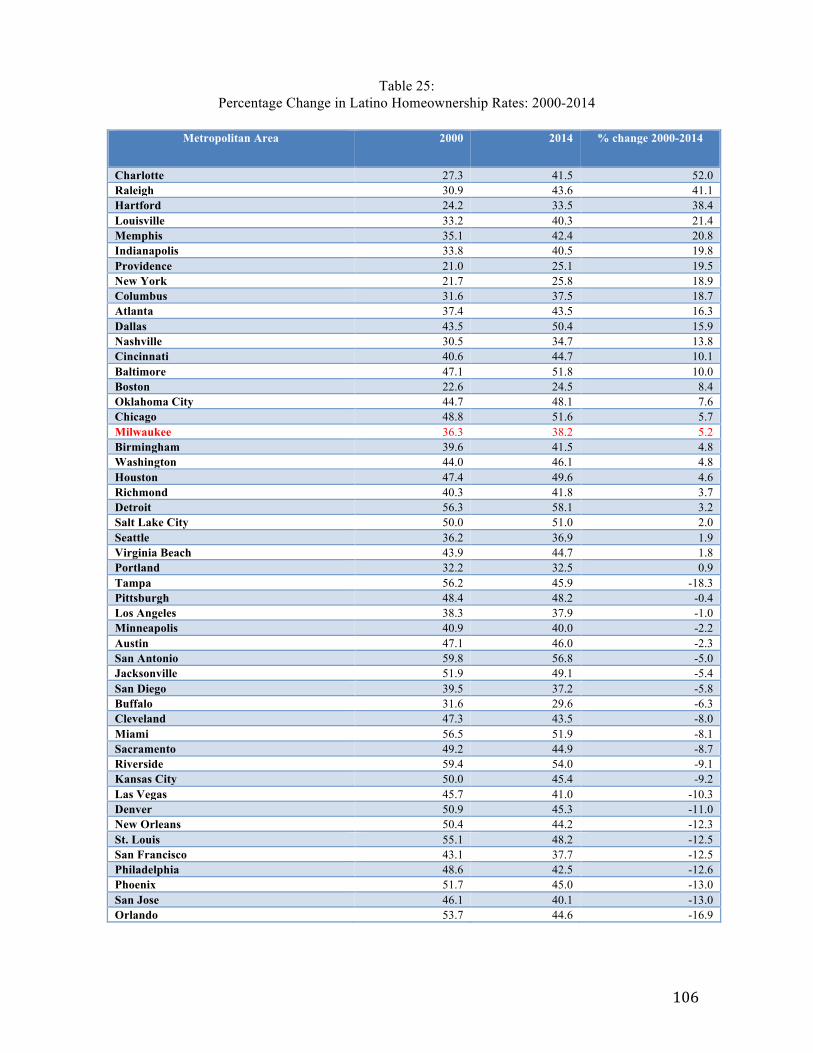
106
Table 25: Percentage Change in Latino Homeownership Rates: 2000-2014
Metropolitan Area 2000 2014 % change 2000-2014
Charlotte 27.3 41.5 52.0 Raleigh 30.9 43.6 41.1 Hartford 24.2 33.5 38.4 Louisville 33.2 40.3 21.4 Memphis 35.1 42.4 20.8 Indianapolis 33.8 40.5 19.8 Providence 21.0 25.1 19.5 New York 21.7 25.8 18.9 Columbus 31.6 37.5 18.7 Atlanta 37.4 43.5 16.3 Dallas 43.5 50.4 15.9 Nashville 30.5 34.7 13.8 Cincinnati 40.6 44.7 10.1 Baltimore 47.1 51.8 10.0 Boston 22.6 24.5 8.4 Oklahoma City 44.7 48.1 7.6 Chicago 48.8 51.6 5.7 Milwaukee 36.3 38.2 5.2 Birmingham 39.6 41.5 4.8 Washington 44.0 46.1 4.8 Houston 47.4 49.6 4.6 Richmond 40.3 41.8 3.7 Detroit 56.3 58.1 3.2 Salt Lake City 50.0 51.0 2.0 Seattle 36.2 36.9 1.9 Virginia Beach 43.9 44.7 1.8 Portland 32.2 32.5 0.9 Tampa 56.2 45.9 -18.3 Pittsburgh 48.4 48.2 -0.4 Los Angeles 38.3 37.9 -1.0 Minneapolis 40.9 40.0 -2.2 Austin 47.1 46.0 -2.3 San Antonio 59.8 56.8 -5.0 Jacksonville 51.9 49.1 -5.4 San Diego 39.5 37.2 -5.8 Buffalo 31.6 29.6 -6.3 Cleveland 47.3 43.5 -8.0 Miami 56.5 51.9 -8.1 Sacramento 49.2 44.9 -8.7 Riverside 59.4 54.0 -9.1 Kansas City 50.0 45.4 -9.2 Las Vegas 45.7 41.0 -10.3 Denver 50.9 45.3 -11.0 New Orleans 50.4 44.2 -12.3 St. Louis 55.1 48.2 -12.5 San Francisco 43.1 37.7 -12.5 Philadelphia 48.6 42.5 -12.6 Phoenix 51.7 45.0 -13.0 San Jose 46.1 40.1 -13.0 Orlando 53.7 44.6 -16.9
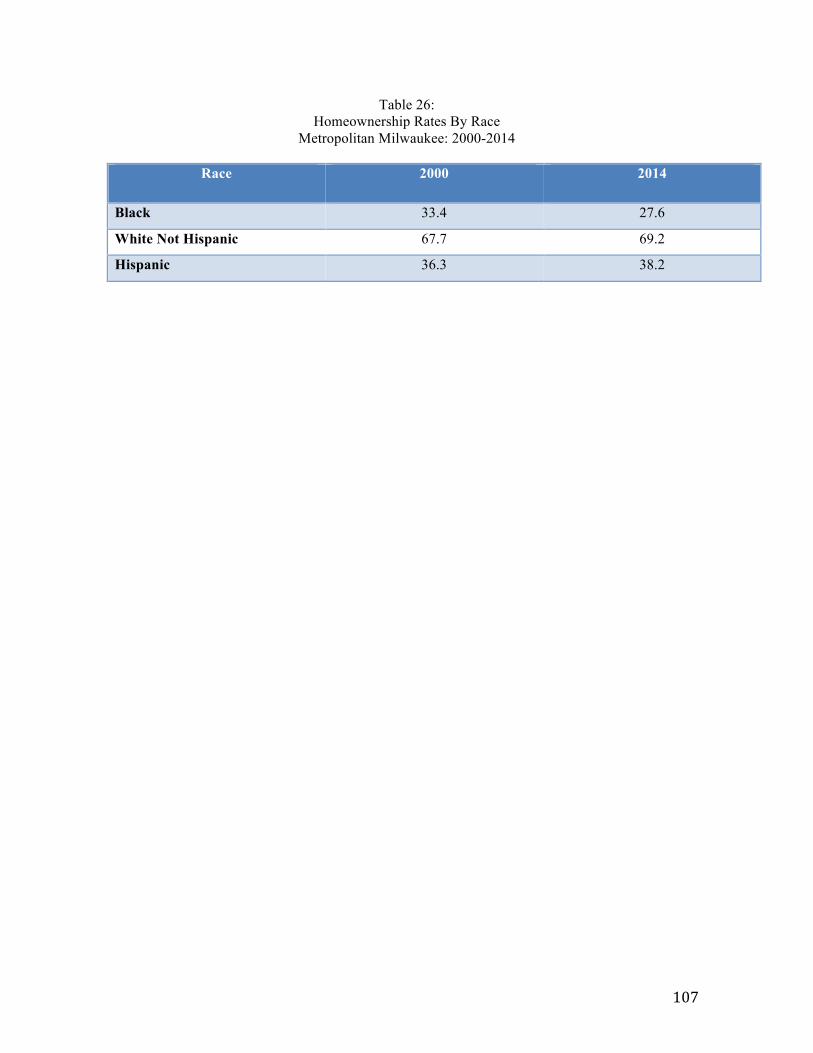
107
Table 26:
Homeownership Rates By Race Metropolitan Milwaukee: 2000-2014
Race
2000 2014
Black 33.4 27.6
White Not Hispanic 67.7 69.2
Hispanic 36.3 38.2
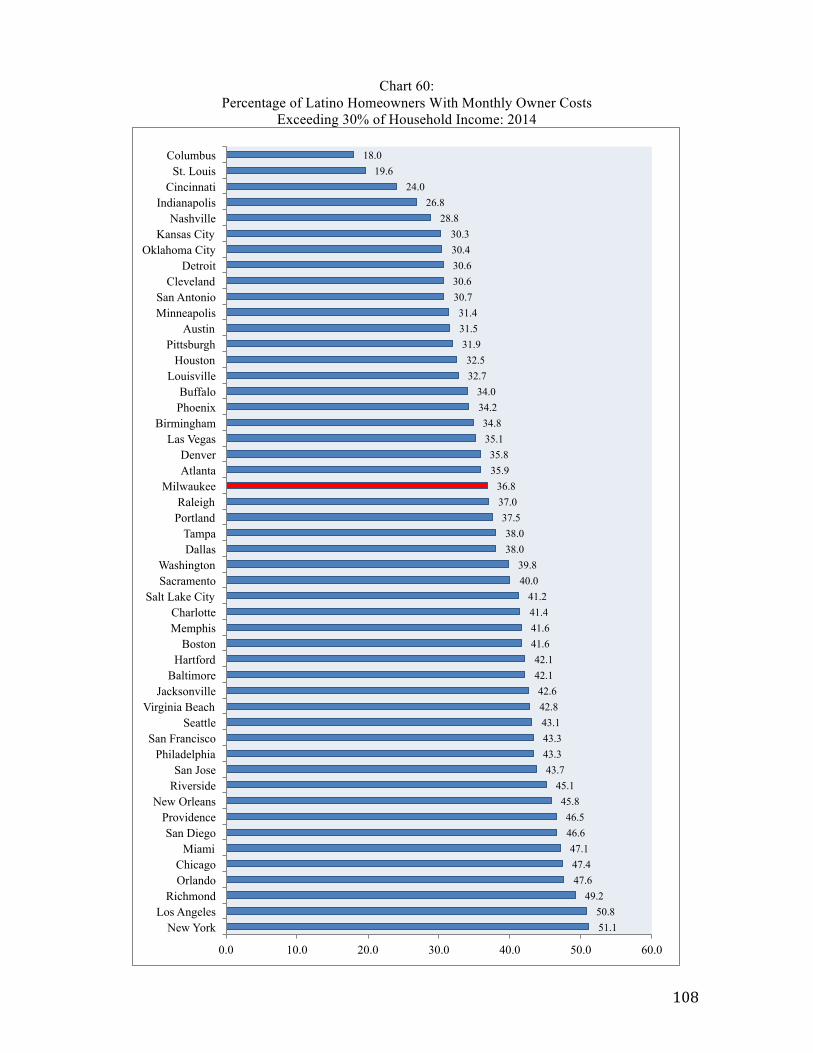
108
Chart 60: Percentage of Latino Homeowners With Monthly Owner Costs
Exceeding 30% of Household Income: 2014
51.1 50.8
49.2 47.6 47.4 47.1
46.6 46.5
45.8 45.1
43.7 43.3 43.3 43.1 42.8 42.6
42.1 42.1
41.6 41.6 41.4 41.2
40.0 39.8
38.0 38.0
37.5 37.0 36.8
35.9 35.8
35.1 34.8
34.2 34.0
32.7 32.5
31.9 31.5 31.4
30.7 30.6 30.6 30.4 30.3
28.8 26.8
24.0 19.6
18.0
0.0 10.0 20.0 30.0 40.0 50.0 60.0
New York Los Angeles
Richmond Orlando Chicago
Miami San Diego
Providence New Orleans
Riverside San Jose
Philadelphia San Francisco
Seattle Virginia Beach
Jacksonville Baltimore
Hartford Boston
Memphis Charlotte
Salt Lake City Sacramento Washington
Dallas Tampa
Portland Raleigh
Milwaukee Atlanta Denver
Las Vegas Birmingham
Phoenix Buffalo
Louisville Houston
Pittsburgh Austin
Minneapolis San Antonio
Cleveland Detroit
Oklahoma City Kansas City
Nashville Indianapolis
Cincinnati St. Louis
Columbus
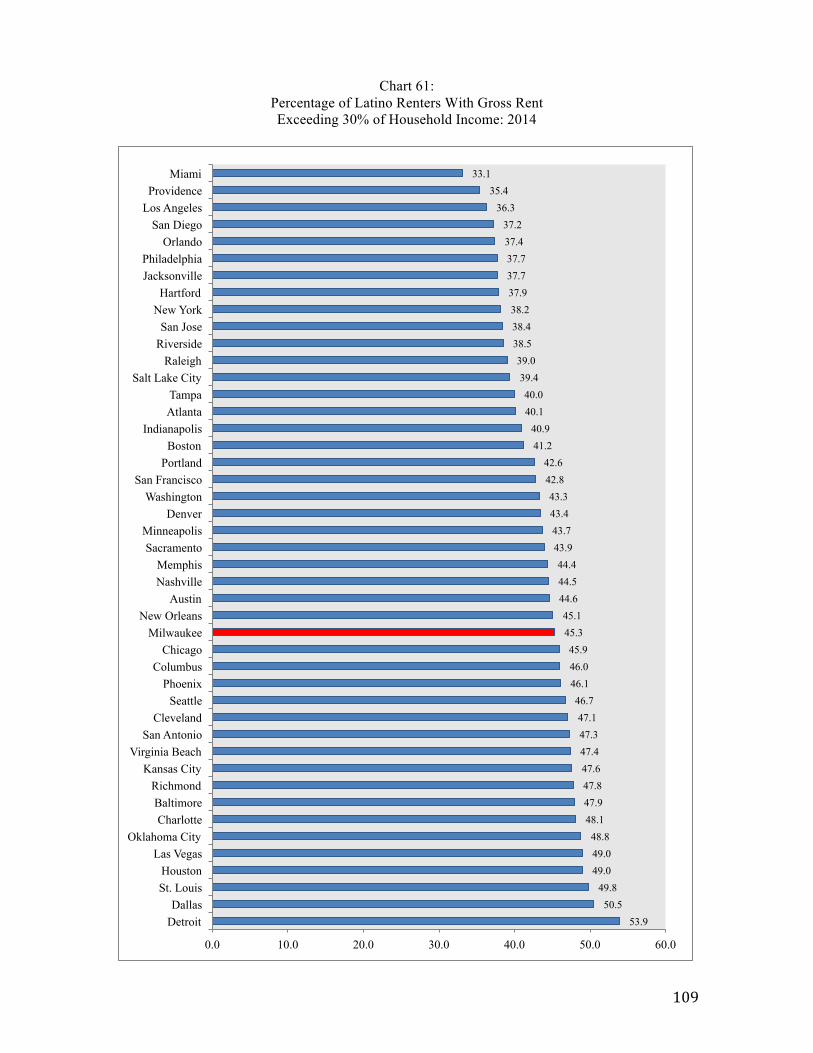
109
Chart 61: Percentage of Latino Renters With Gross Rent Exceeding 30% of Household Income: 2014
53.9 50.5
49.8 49.0 49.0 48.8
48.1 47.9 47.8 47.6 47.4 47.3 47.1
46.7 46.1 46.0 45.9
45.3 45.1
44.6 44.5 44.4
43.9 43.7 43.4 43.3
42.8 42.6
41.2 40.9
40.1 40.0
39.4 39.0
38.5 38.4 38.2 37.9 37.7 37.7 37.4 37.2
36.3 35.4
33.1
0.0 10.0 20.0 30.0 40.0 50.0 60.0
Detroit Dallas
St. Louis Houston
Las Vegas Oklahoma City
Charlotte Baltimore Richmond
Kansas City Virginia Beach
San Antonio Cleveland
Seattle Phoenix
Columbus Chicago
Milwaukee New Orleans
Austin Nashville Memphis
Sacramento Minneapolis
Denver Washington
San Francisco Portland Boston
Indianapolis Atlanta Tampa
Salt Lake City Raleigh
Riverside San Jose
New York Hartford
Jacksonville Philadelphia
Orlando San Diego
Los Angeles Providence
Miami
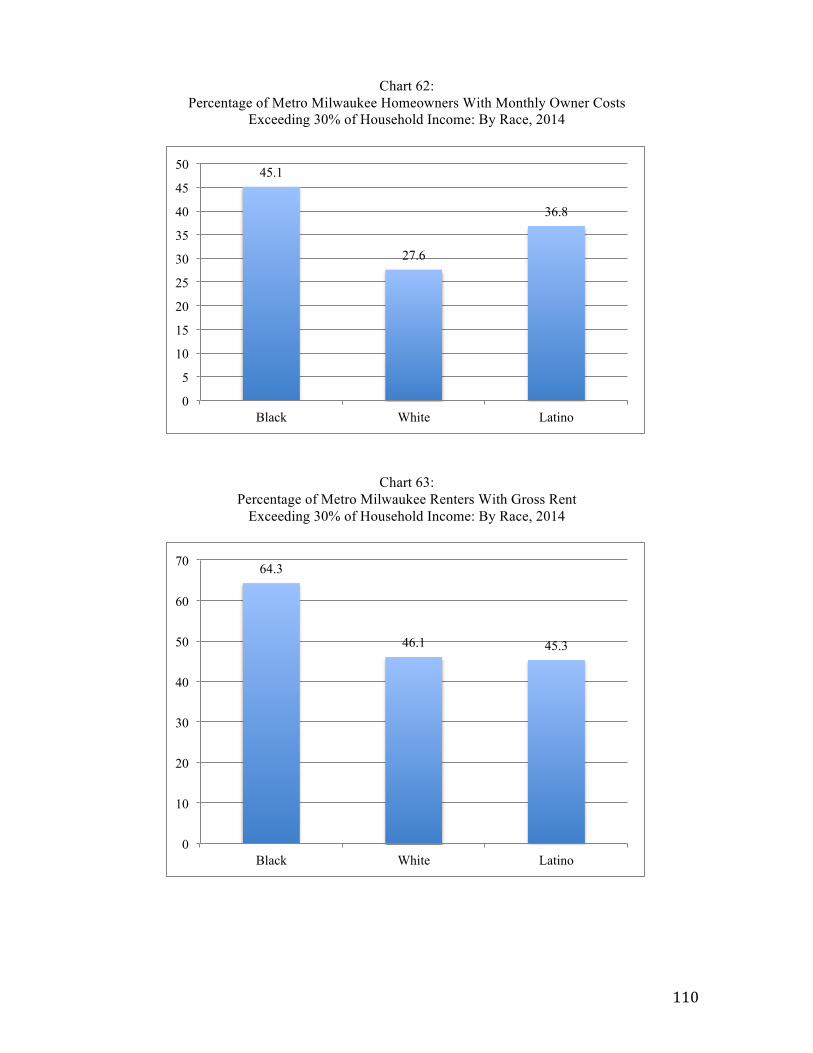
110
Chart 62: Percentage of Metro Milwaukee Homeowners With Monthly Owner Costs
Exceeding 30% of Household Income: By Race, 2014
Chart 63: Percentage of Metro Milwaukee Renters With Gross Rent
Exceeding 30% of Household Income: By Race, 2014
45.1
27.6
36.8
0
5
10
15
20
25
30
35
40
45
50
Black White Latino
64.3
46.1 45.3
0
10
20
30
40
50
60
70
Black White Latino
111
EMPLOYMENT AND EARNINGS
Employment and Non-employment There are various ways to measure labor market conditions: the official unemployment
rate (the percentage of working age persons, in the labor market and actively looking for
work, who are not employed); the employment rate, sometimes also called the
“employment-population” ratio (the percentage of all working age persons, often broken
down into various age cohorts, who are employed); and the non-employment rate
(essentially the flip-side of the employment rate, measuring the percentage of working age
persons who are not employed – whether officially unemployed or not ).3 There are
drawbacks to all of the measures. However, for various reasons, especially given the
number of jobless missed by the official unemployment rate, economists increasingly lean
towards some variant of the employment or non-employment rates as the best way of
measuring the extent to which the working age population in a community, or among
certain racial or ethnic groups is, in fact, working –which, in the end, is what we really
want to know about the health of a labor market.
We examine the Latino non-employment rate –the percentage of adults who are either
unemployed or not in the labor force-- for males and females, and for two key age cohorts:
young adults (ages 20-24) and prime working years adults (ages 25-54).
• Among the nation’s 50 largest metropolitan areas in 2014, the non-employment
rate for Latino young adult males in Milwaukee (22.5 percent) ranked relatively
low (the 18th lowest rate). (Chart 64). [Note: On all the “non-employment” charts
and tables, a better performance means a lower rate and a ranking towards the
bottom of the chart]. For prime working years Latino males (ages 25-54),
Milwaukee’s non-employment rate of 13.7 percent in 2014 ranked towards the
middle-of-the-pack. Buffalo (38.3 percent) and Hartford (29.9 percent) posted, by
far, the worst prime age Latino male non-employment rates (Chart 65).
• The non-employment rates for Latino females in Milwaukee, for both young
adults (29.0 percent) and prime age adults (32.2 percent) ranked among the best
among the nation’s 50 largest metropolitan areas (Charts 66 and 67).
3 For a discussion of the various ways of measuring “joblessness,” see Marc V. Levine, Race and Male Employment in the Wake of the Great Recession (Milwaukee: UWM Center for Economic Development Working Paper, 2012), pp. 3-5.
112
• Looking at racial groups in Milwaukee, the Latino male non-employment rate in
2014 for both young adults and prime age adults was comparable to the rate for
white non-Hispanics, and substantially lower than the rates for black males. 37.0
percent of black males in Milwaukee between the ages of 25-54 are non-
employed; for prime age Latino males, that figure is 13.7 percent (Charts 68-69).
• On the other hand, for Latino females in Milwaukee, the non-employment rate for
prime age adults (32.2 percent) is comparable to the black rate (33.5 percent) and
much higher than the WNH rate (18.1 percent) (Chart 70). For young adults, the
Latino rate (29.0 percent) stands halfway between the black and WNH rates
(Chart 71).
• (Tables 27- 30) show the trend since 1990 in Latino non-employment rates for
young adults and prime age workers –both male and female—in Milwaukee and
the 50 largest metropolitan areas. As the tables make clear, for both genders and
for both age cohorts, the trend in Latino non-employment has varied across the
country, but in Milwaukee, Latino non-employment was markedly lower in 2014
than it was in 1990. Among prime working age Latino males, for example, the
non-employment rate dropped from 21.4 to 13.7 percent between 1990-2014; the
rate dropped by 10 percentage points for Latino young adult males during that
period (Tables 27-28). For Latino females, the decline in non-employment has
been even more pronounced, as Latino women, many of whom previously had
not been in the labor force, entered the labor market and secured employment
between 1990-2014 (Tables 29-30). Thus, for example, the non-employment rate
for young adult Milwaukee Latinas declined from 50.0 percent in 1990 to 29.0
percent in 2014. Even taking into account the large error margins in the
employment data for 20-24 year olds in 2014, that is a statistically significant
change.
The “Latinoisation” of Urban Labor Markets
Earlier, we analyzed how the surge in Latino immigration to U.S. metropolitan areas has
profoundly transformed the demographic fabric of cities and regions. Similarly, the
growing number of Latino workers has dramatically reshaped urban labor markets. (Tables
31-36) array trends in employment between 1990-2014 in a cross-section of 14
113
metropolitan areas from across the country. In all metro areas, for both genders and for
both the young adult and prime age cohorts, the growth in Latino employment has far
outstripped the growth of non-Hispanic employment. Put another way, in metro area after
metro area, Latino employment growth is driving the local labor market and Latino
workers represent an ever-growing share of metropolitan workforces. In metro Milwaukee,
because the total number of employed non-Hispanics has declined for both genders and
age cohorts, Latino workers account for all of the net employment growth in the
metropolitan area since 1990. This is partially an artifact of the overall stagnation in
employment growth in metro Milwaukee over the past quarter century, but even in rapidly
growing metropolitan areas such as Houston, Orlando, or Las Vegas, Latino workers
account for a major share of total employment growth. Among young adult males, for
example, Latino workers accounted for 72.3 percent of total employment growth in
Houston between 1990-2014; among prime age males, Latinos accounted for 65.9 percent
of Houston’s total growth in employment during that period. (Tables 35-38) in particular
show the staggering differences in the rate of employment growth among Latinos and non-
Hispanics, and all of these tables underscore the degree to which metropolitan labor
markets across the U.S. have become increasingly reliant on Latino workers.
A Cultural Division of Labor? Occupational Concentration Among Latino Workers
Latino workers are not only a growing element in the overall labor market in urban
America, but they are particularly prominent, even dominant, in certain occupations. The
way we measure whether a group is disproportionately employed in certain occupations is
to construct an index of labor market concentration. Simply put, the index measures the
degree to which a group is employed in a particular occupation at a percentage greater
than, or less than, their percentage of total employment. Thus, in a stylized case, if Latino
males make up 25 percent of a metro area’s total male workforce, but make up 50 percent
of a metro area’s male construction workforce, we would calculate the “index of
construction” for Latinos in construction as 200 percent (50/25). For any occupation, then,
an index of 100 means that the group is found in that occupation roughly in proportion to
their presence in the overall labor market; an index below 100 means the group is
“underrepresented;” and an index over 100 means the group is concentrated, to a greater or
lesser degree, in that occupation.
114
As Charts 72-78 show, there are several occupations in which Latino males and females
were highly concentrated in U.S. metropolitan areas in 2014.
• For Latino males: building and grounds cleaning and maintenance occupations;
construction and extraction occupations; production occupations; and materials
moving occupations.
• For Latino females: food preparation and service occupations; building and
grounds cleaning and maintenance occupations; and personal care service
occupations.
• In some occupations, the Latino concentration is consistently high across all large
metropolitan areas. In every metropolitan area in the U.S., for example, the index
of concentration for Latino males and females in building and grounds cleaning
and maintenance occupations is well above 100 (with astoundingly high indexes
above 500 for Latino females in metros such as Columbus, Raleigh, Oklahoma
City, Washington, D.C., Minneapolis, Charlotte, and Baltimore). In construction,
all but two metro areas post Latino male indexes of concentration above 100
(topped by the remarkably high, but unsurprising, indexes above 350 for
Nashville, Raleigh, and Atlanta, where Latino workers increasingly dominate the
construction sector).
• In all of the occupations examined here, for both Latino males and females in
Milwaukee, the index of concentration is 100 or greater. Compared to other metro
areas, Latino males in Milwaukee are especially concentrated in production and
materials moving occupations. For Latino males, Milwaukee ranks 29th among
the 50 largest metros in the degree of concentration in building and grounds
cleaning and maintenance; 49th out of 50 in concentration in construction
occupations; 1st out of 50 in concentration in production occupations; and 2nd out
of 50 in concentration in materials moving occupations. For Latino females, the
Milwaukee index of concentration, while over 100 in all occupations examined,
ranks towards the middle-of-the-pack compared to other metros in food
preparation occupations and buildings and grounds occupations. However,
Milwaukee Latinas are the 5th most concentrated in personal care service
occupations among the nation’s largest metropolitan areas.
115
• (Charts 79-83) compare the Latino indexes of concentration in selected
occupations in Milwaukee to other racial groups. Again, the concentration of
Latino males in building and grounds occupations and production occupations is
striking (Milwaukee is an exception to the national trend of the Latinoisation of
the construction labor force in metro areas). For Latino females in Milwaukee,
comparative concentration in cleaning and maintenance occupations is apparent;
in personal care service occupations, although the Milwaukee Latina index of
concentration is high (143.4) it is lower than that of black females (174.7).
Earnings
Although, as we saw earlier, non-employment rates for Latinos in Milwaukee are
relatively comparable to WNHs and much lower than African Americans, Latinos in
Milwaukee – as is the case nationally—are concentrated in lower-wage occupations (such
as building cleaning and personal care services) and in the low-wage segments of higher-
wage occupations (such as production occupations).
(Charts 84 and 85) show the distribution of earnings by race in Milwaukee, by race, for
males and females. For Latinos, we have broken out “citizens” and “non-citizens”
(generally, more recent immigrants) to get a more refined sense of the Latino earnings
distribution. Among males and females, the earnings distribution for Latino citizens is
about comparable to that of African Americans, with comparable percentages of both
groups, for example, earning under $25,000 annually. Among Latino non-citizens,
however, the earnings distribution is skewed strongly to the lower end: 62.5 percent of
non-citizen male Latinos and 82.6 of non-citizen female Latinos in Milwaukee earn under
$25,000 a year. Other key findings:
• Latino male production workers are skewed to lower-end of that occupation’s
earnings distribution in Milwaukee (Chart 86).
• Milwaukee ranks towards the middle of a cross-section of 20 large metro areas in
the percentage of Latino low-wage male workers (earning under $25,000
annually). About half of Milwaukee Latino males earn under $25,0000 a year
(Chart 87). 61.9 percent of Latino Milwaukee females earn under $25,000 a year,
which is the 8th highest percentage of low-wage workers among the 20 metros
surveyed (Chart 88).
116
• (Charts 89 and 90) examine the differences in Latino “citizen” and “non-citizen”
earnings in selected metro areas. As we saw earlier, for both males and females,
low-wage employment is especially prevalent among Latino non-citizens. In
every metro analyzed, a much higher percentage of Latino non-citizens than
citizens earns less than $25,000 annually.
• Since citizenship is a crucial factor in the Latino earnings picture, Charts 91 and
92 compare Milwaukee to the other largest metropolitan areas in the percentage
of male and female Latino workers who are not citizens. Milwaukee has the 33rd
highest level of the 50 largest metro areas in the percentage of Latino male
workers who are not citizens (43.7 percent); for females, Latino Milwaukee ranks
34th of the 50, with 27.6 percent of Latina workers in the metro area who are not
citizens. Unsurprisingly, in light of our earlier tables on immigration and
demography, it is the emerging gateway metropolitan areas such as Raleigh,
Charlotte, Atlanta, Nashville, Birmingham, Memphis, and Indianapolis that have
the highest percentage of “non-citizens” among their Latino workers (for both
males and females).
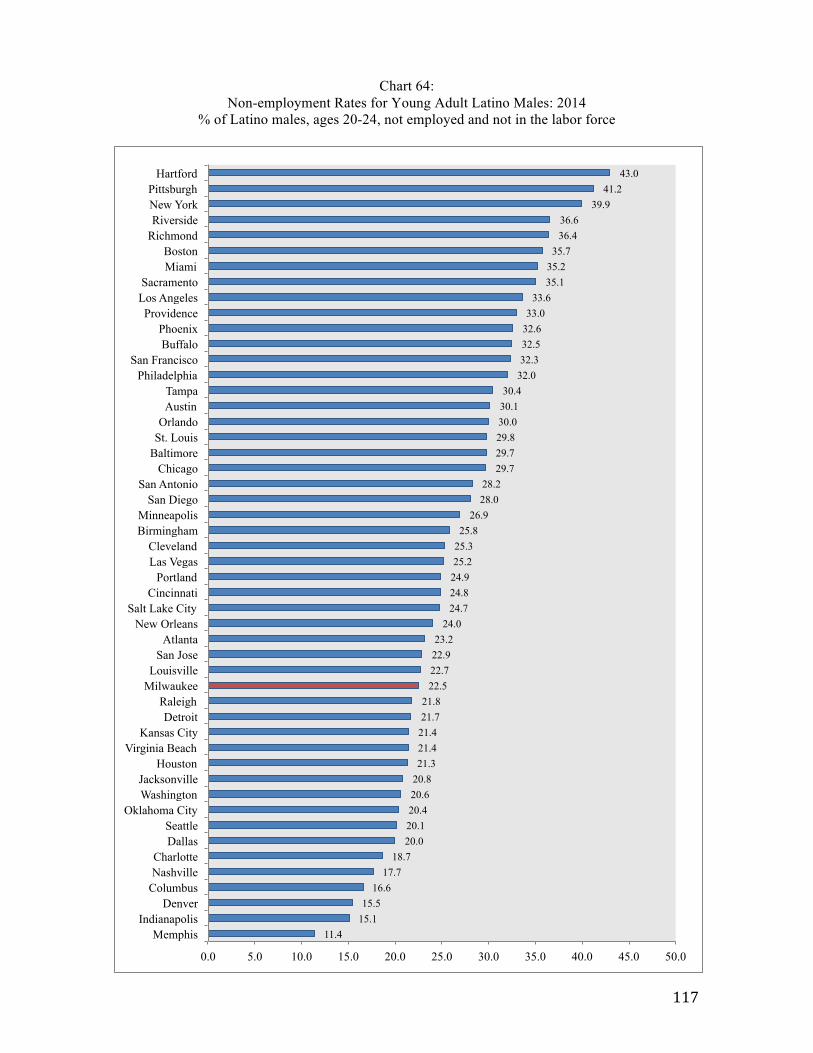
117
Chart 64: Non-employment Rates for Young Adult Latino Males: 2014
% of Latino males, ages 20-24, not employed and not in the labor force
11.4 15.1 15.5
16.6 17.7
18.7 20.0 20.1 20.4 20.6 20.8 21.3 21.4 21.4 21.7 21.8
22.5 22.7 22.9 23.2
24.0 24.7 24.8 24.9 25.2 25.3 25.8
26.9 28.0 28.2
29.7 29.7 29.8 30.0 30.1 30.4
32.0 32.3 32.5 32.6 33.0
33.6 35.1 35.2 35.7
36.4 36.6
39.9 41.2
43.0
0.0 5.0 10.0 15.0 20.0 25.0 30.0 35.0 40.0 45.0 50.0
Memphis Indianapolis
Denver Columbus Nashville Charlotte
Dallas Seattle
Oklahoma City Washington Jacksonville
Houston Virginia Beach
Kansas City Detroit
Raleigh Milwaukee Louisville
San Jose Atlanta
New Orleans Salt Lake City
Cincinnati Portland
Las Vegas Cleveland
Birmingham Minneapolis
San Diego San Antonio
Chicago Baltimore St. Louis Orlando
Austin Tampa
Philadelphia San Francisco
Buffalo Phoenix
Providence Los Angeles Sacramento
Miami Boston
Richmond Riverside New York Pittsburgh
Hartford
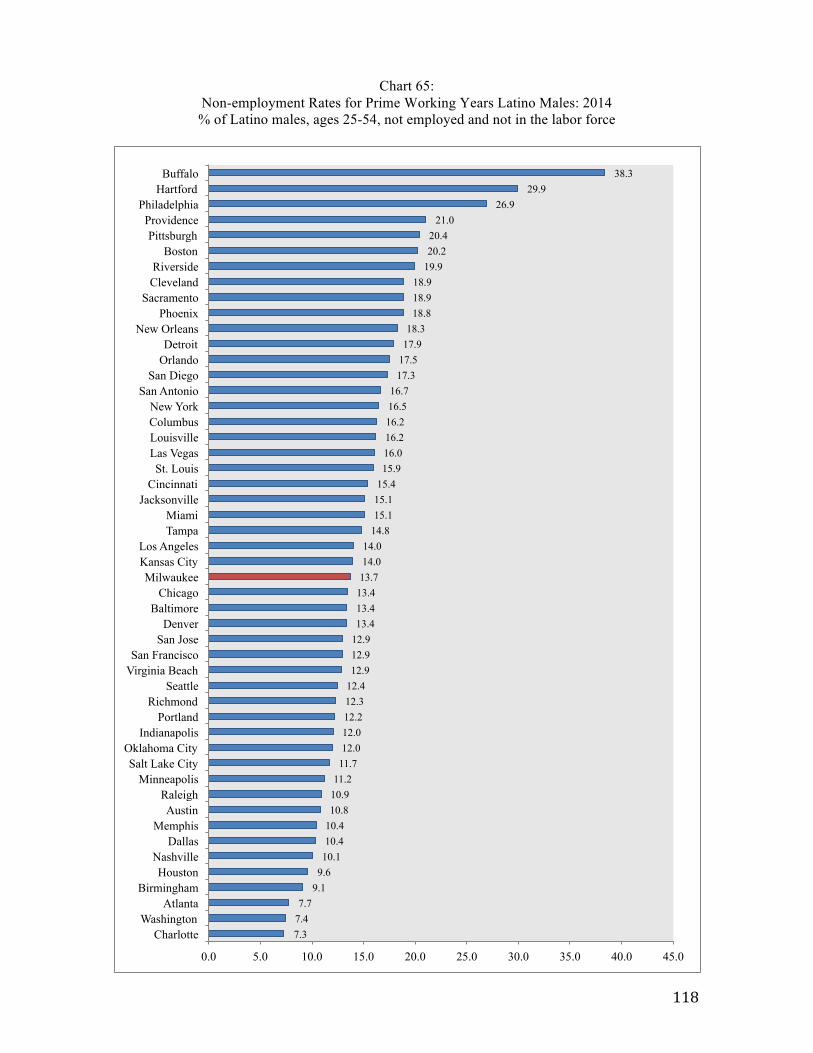
118
Chart 65: Non-employment Rates for Prime Working Years Latino Males: 2014 % of Latino males, ages 25-54, not employed and not in the labor force
7.3 7.4 7.7
9.1 9.6 10.1 10.4 10.4 10.8 10.9 11.2 11.7 12.0 12.0 12.2 12.3 12.4 12.9 12.9 12.9 13.4 13.4 13.4 13.7 14.0 14.0
14.8 15.1 15.1 15.4 15.9 16.0 16.2 16.2 16.5 16.7
17.3 17.5 17.9 18.3
18.8 18.9 18.9
19.9 20.2 20.4
21.0 26.9
29.9 38.3
0.0 5.0 10.0 15.0 20.0 25.0 30.0 35.0 40.0 45.0
Charlotte Washington
Atlanta Birmingham
Houston Nashville
Dallas Memphis
Austin Raleigh
Minneapolis Salt Lake City
Oklahoma City Indianapolis
Portland Richmond
Seattle Virginia Beach San Francisco
San Jose Denver
Baltimore Chicago
Milwaukee Kansas City Los Angeles
Tampa Miami
Jacksonville Cincinnati
St. Louis Las Vegas Louisville Columbus New York
San Antonio San Diego
Orlando Detroit
New Orleans Phoenix
Sacramento Cleveland Riverside
Boston Pittsburgh
Providence Philadelphia
Hartford Buffalo
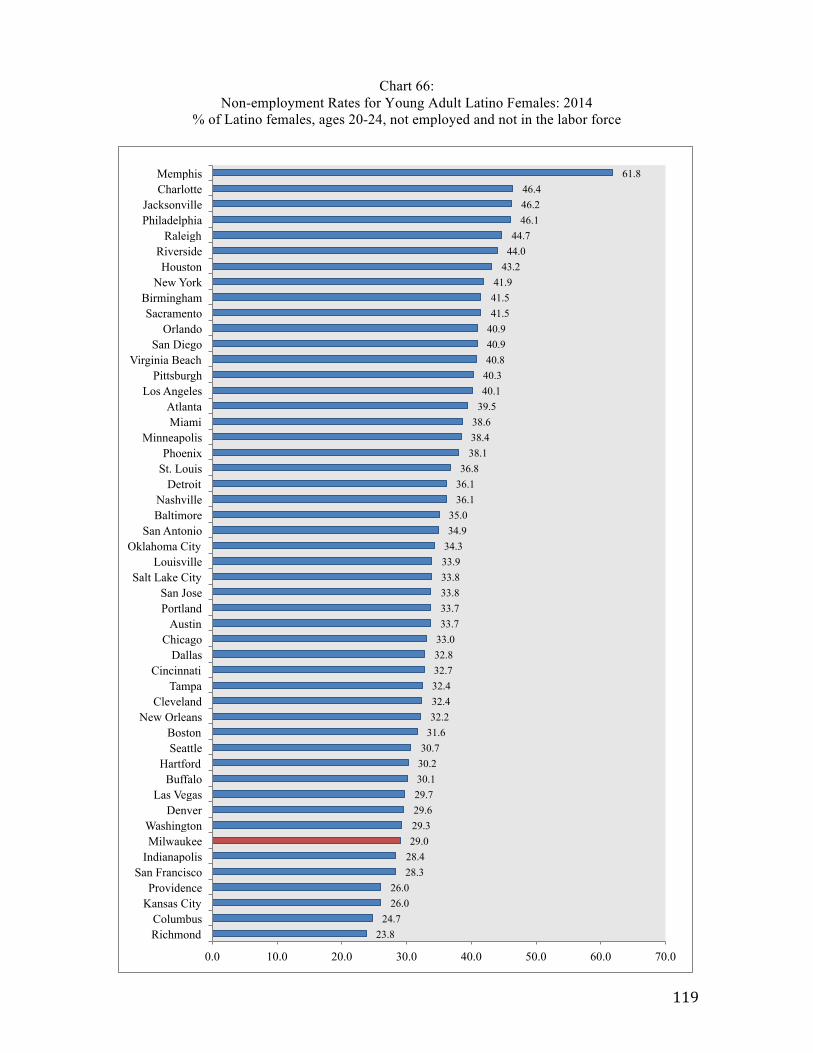
119
Chart 66: Non-employment Rates for Young Adult Latino Females: 2014
% of Latino females, ages 20-24, not employed and not in the labor force
23.8 24.7
26.0 26.0
28.3 28.4 29.0 29.3 29.6 29.7 30.1 30.2 30.7
31.6 32.2 32.4 32.4 32.7 32.8 33.0 33.7 33.7 33.8 33.8 33.9 34.3 34.9 35.0
36.1 36.1 36.8
38.1 38.4 38.6
39.5 40.1 40.3 40.8 40.9 40.9 41.5 41.5 41.9
43.2 44.0 44.7
46.1 46.2 46.4
61.8
0.0 10.0 20.0 30.0 40.0 50.0 60.0 70.0
Richmond Columbus
Kansas City Providence
San Francisco Indianapolis Milwaukee
Washington Denver
Las Vegas Buffalo
Hartford Seattle Boston
New Orleans Cleveland
Tampa Cincinnati
Dallas Chicago
Austin Portland San Jose
Salt Lake City Louisville
Oklahoma City San Antonio
Baltimore Nashville
Detroit St. Louis Phoenix
Minneapolis Miami Atlanta
Los Angeles Pittsburgh
Virginia Beach San Diego
Orlando Sacramento
Birmingham New York
Houston Riverside
Raleigh Philadelphia Jacksonville
Charlotte Memphis

120
Chart 67: Non-employment Rates for Prime Working Years Latino Females: 2014 % of Latino females, ages 25-54, not employed and not in the labor force
24.4 26.9
27.9 28.1
28.7 29.2
30.7 30.8 30.8
31.6 32.0 32.2 32.2 32.5 32.8 32.9 33.0 33.0 33.1 33.5 33.6
34.7 34.8 34.8 34.9 35.1
35.9 36.1 36.3 36.5
37.1 37.1
38.4 38.5
39.1 39.3 39.4 39.7 39.7 39.7 39.9 40.2 40.7 41.1 41.3 41.7 41.9 42.5
44.1 46.4
0.0 5.0 10.0 15.0 20.0 25.0 30.0 35.0 40.0 45.0 50.0
Baltimore Washington Minneapolis
Columbus Miami
Virginia Beach San Jose
New Orleans Hartford
San Antonio San Francisco
Milwaukee Denver
Indianapolis Boston Tampa
Las Vegas New York
Austin Orlando
Salt Lake City Kansas City
St. Louis Sacramento
Chicago Seattle
Los Angeles Jacksonville
Portland Cleveland San Diego
Providence Dallas
Louisville Nashville
Philadelphia Charlotte
Atlanta Pittsburgh
Phoenix Houston Buffalo Raleigh
Richmond Riverside
Oklahoma City Detroit
Cincinnati Birmingham
Memphis
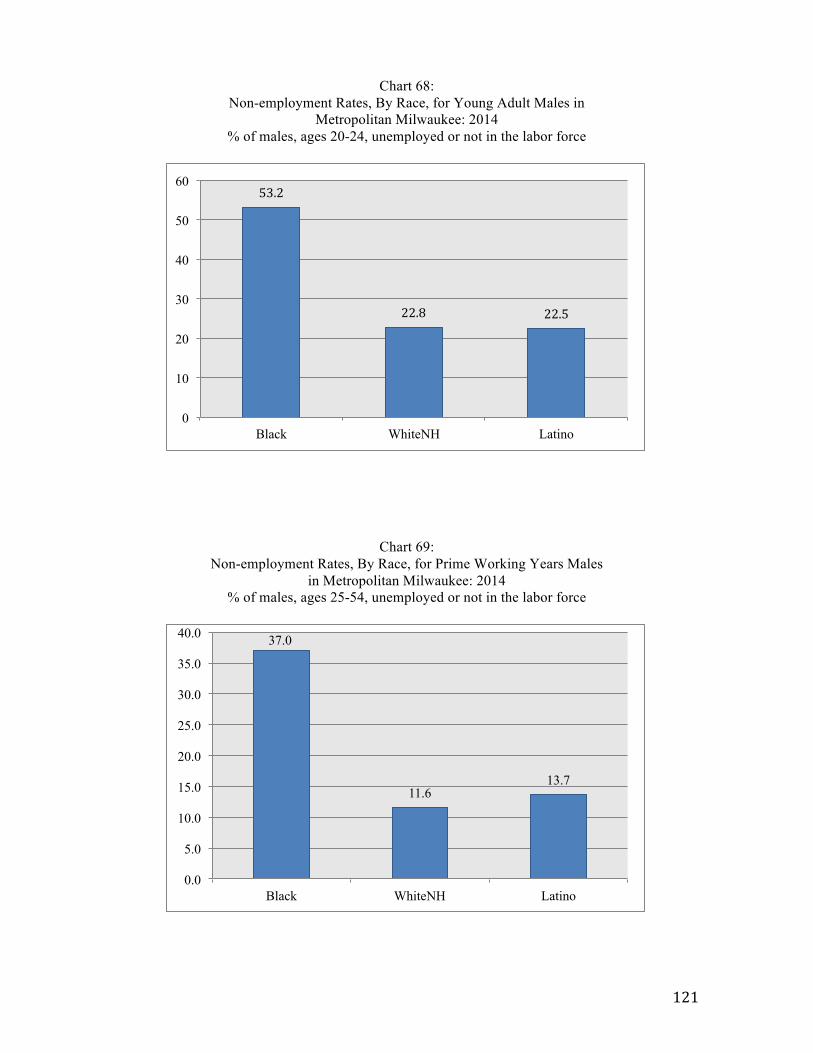
121
Chart 68: Non-employment Rates, By Race, for Young Adult Males in
Metropolitan Milwaukee: 2014 % of males, ages 20-24, unemployed or not in the labor force
Chart 69:
Non-employment Rates, By Race, for Prime Working Years Males in Metropolitan Milwaukee: 2014
% of males, ages 25-54, unemployed or not in the labor force
53.2
22.8 22.5
0
10
20
30
40
50
60
Black WhiteNH Latino
37.0
11.6 13.7
0.0
5.0
10.0
15.0
20.0
25.0
30.0
35.0
40.0
Black WhiteNH Latino
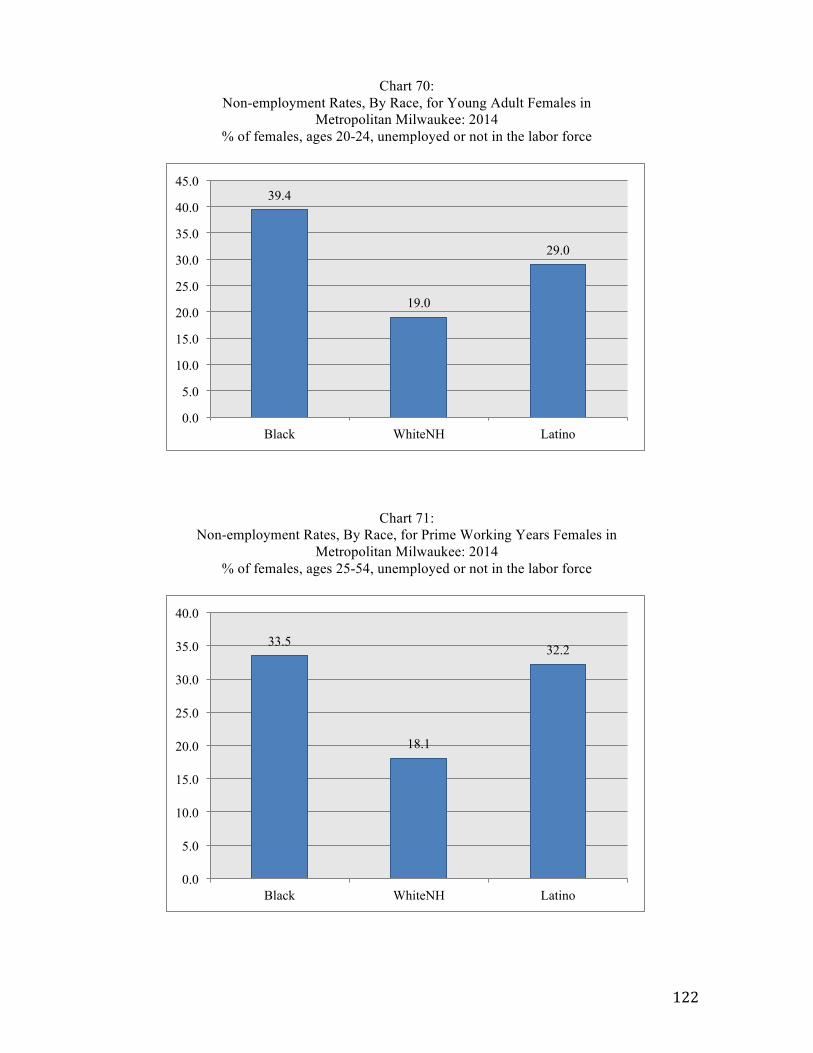
122
Chart 70: Non-employment Rates, By Race, for Young Adult Females in
Metropolitan Milwaukee: 2014 % of females, ages 20-24, unemployed or not in the labor force
Chart 71: Non-employment Rates, By Race, for Prime Working Years Females in
Metropolitan Milwaukee: 2014 % of females, ages 25-54, unemployed or not in the labor force
39.4
19.0
29.0
0.0
5.0
10.0
15.0
20.0
25.0
30.0
35.0
40.0
45.0
Black WhiteNH Latino
33.5
18.1
32.2
0.0
5.0
10.0
15.0
20.0
25.0
30.0
35.0
40.0
Black WhiteNH Latino

123
Table 27: Non-employment Rates for Young Adult Latino Males: 1990-2014
% of Latino males, ages 20-24, unemployed or not in the labor force
Metropolitan Area 1990 2014
Atlanta 15.5 23.2 Austin 25.3 30.1 Baltimore 19.6 29.7 Birmingham 22.0 25.8 Boston 33.7 35.7 Buffalo 47.7 32.5 Charlotte 14.9 18.7 Chicago 20.5 29.7 Cincinnati 24.4 24.8 Cleveland 30.2 25.3 Columbus 32.3 16.6 Dallas 16.7 20.0 Denver 23.0 15.5 Detroit 31.0 21.7 Hartford 44.6 43.0 Houston 21.1 21.3 Indianapolis 13.8 15.1 Jacksonville 14.3 20.8 Kansas City 22.2 21.4 Las Vegas 15.1 25.2 Los Angeles 22.2 33.6 Louisville 34.1 22.7 Memphis 28.7 11.4 Miami 24.3 35.2 Milwaukee 32.4 22.5 Minneapolis 26.7 26.9 Nashville 19.5 17.7 New Orleans 29.4 24.0 New York 37.7 39.9 Oklahoma City 24.3 20.4 Orlando 17.4 30.0 Philadelphia 39.3 32.0 Phoenix 20.9 32.6 Pittsburgh 26.6 41.2 Portland 20.1 24.9 Providence 34.5 33.0 Raleigh 30.0 21.8 Richmond 21.6 36.4 Riverside 26.3 36.6 Sacramento 28.1 35.1 Salt Lake City 25.5 24.7 San Antonio 27.7 28.2 San Diego 21.8 28.0 San Francisco 21.7 32.3 San Jose 21.3 22.9 Seattle 25.7 20.1 St. Louis 36.3 29.8 Tampa 17.4 30.4 Virginia Beach 8.8 21.4 Washington DC 17.6 20.6
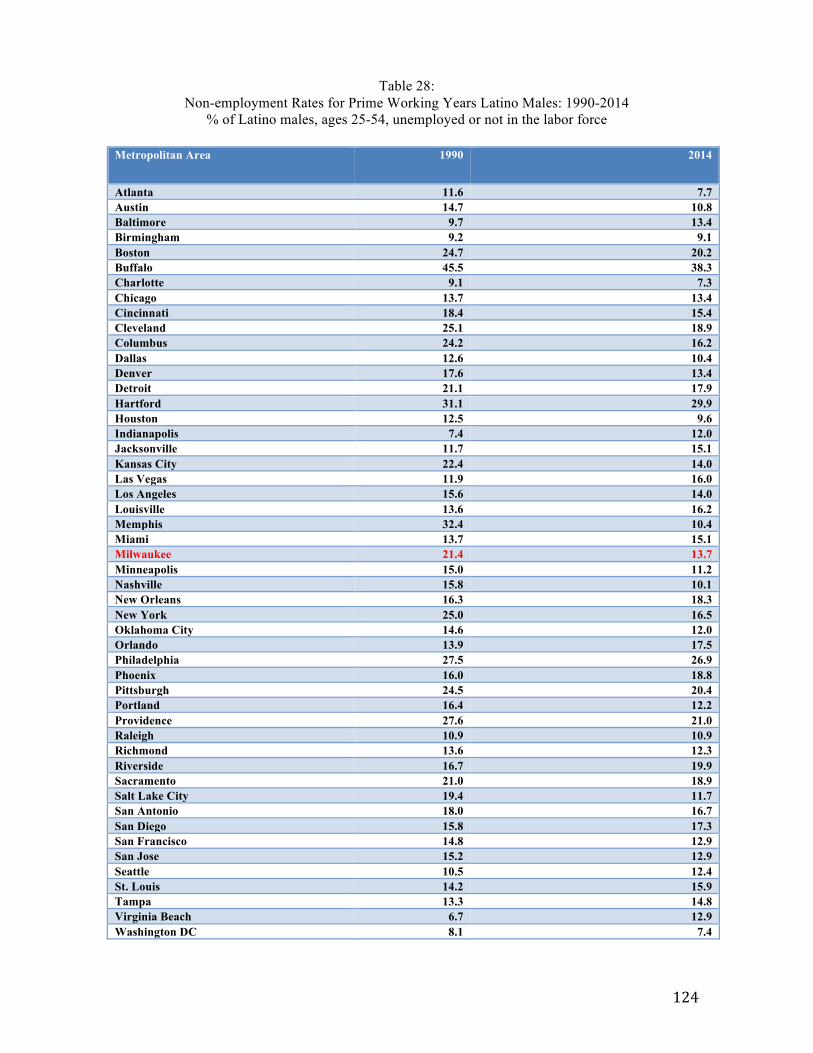
124
Table 28: Non-employment Rates for Prime Working Years Latino Males: 1990-2014
% of Latino males, ages 25-54, unemployed or not in the labor force
Metropolitan Area 1990 2014
Atlanta 11.6 7.7 Austin 14.7 10.8 Baltimore 9.7 13.4 Birmingham 9.2 9.1 Boston 24.7 20.2 Buffalo 45.5 38.3 Charlotte 9.1 7.3 Chicago 13.7 13.4 Cincinnati 18.4 15.4 Cleveland 25.1 18.9 Columbus 24.2 16.2 Dallas 12.6 10.4 Denver 17.6 13.4 Detroit 21.1 17.9 Hartford 31.1 29.9 Houston 12.5 9.6 Indianapolis 7.4 12.0 Jacksonville 11.7 15.1 Kansas City 22.4 14.0 Las Vegas 11.9 16.0 Los Angeles 15.6 14.0 Louisville 13.6 16.2 Memphis 32.4 10.4 Miami 13.7 15.1 Milwaukee 21.4 13.7 Minneapolis 15.0 11.2 Nashville 15.8 10.1 New Orleans 16.3 18.3 New York 25.0 16.5 Oklahoma City 14.6 12.0 Orlando 13.9 17.5 Philadelphia 27.5 26.9 Phoenix 16.0 18.8 Pittsburgh 24.5 20.4 Portland 16.4 12.2 Providence 27.6 21.0 Raleigh 10.9 10.9 Richmond 13.6 12.3 Riverside 16.7 19.9 Sacramento 21.0 18.9 Salt Lake City 19.4 11.7 San Antonio 18.0 16.7 San Diego 15.8 17.3 San Francisco 14.8 12.9 San Jose 15.2 12.9 Seattle 10.5 12.4 St. Louis 14.2 15.9 Tampa 13.3 14.8 Virginia Beach 6.7 12.9 Washington DC 8.1 7.4
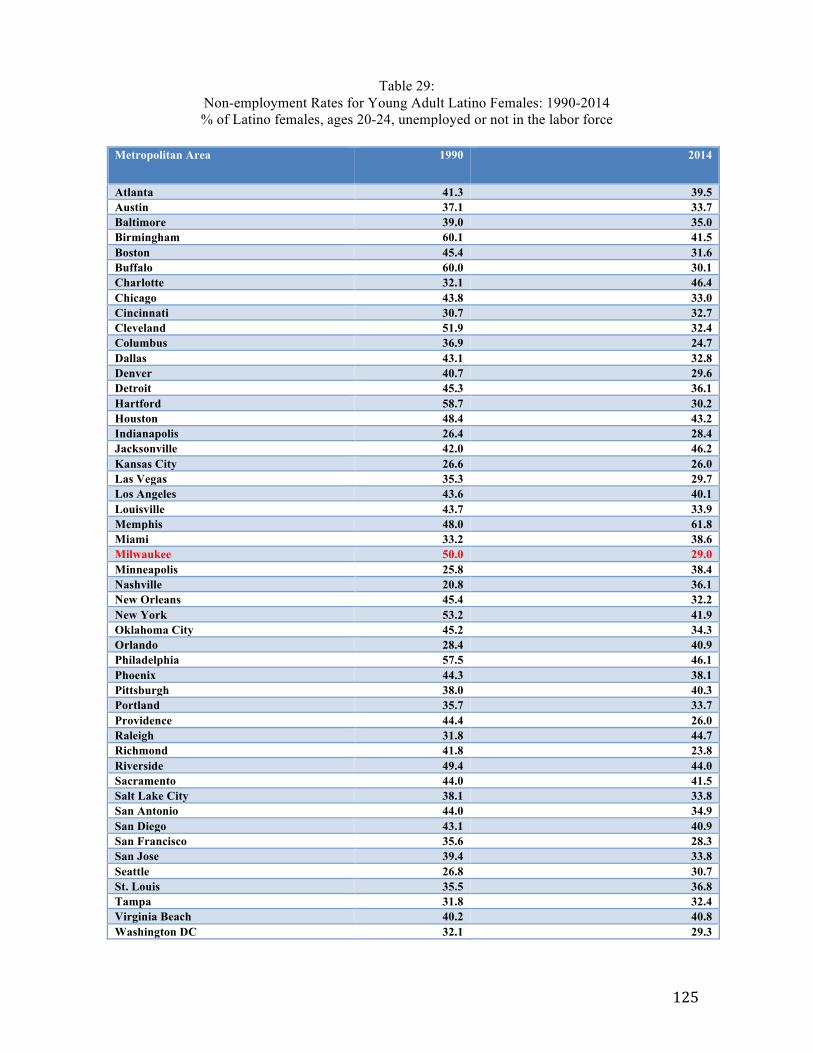
125
Table 29: Non-employment Rates for Young Adult Latino Females: 1990-2014 % of Latino females, ages 20-24, unemployed or not in the labor force
Metropolitan Area 1990 2014
Atlanta 41.3 39.5 Austin 37.1 33.7 Baltimore 39.0 35.0 Birmingham 60.1 41.5 Boston 45.4 31.6 Buffalo 60.0 30.1 Charlotte 32.1 46.4 Chicago 43.8 33.0 Cincinnati 30.7 32.7 Cleveland 51.9 32.4 Columbus 36.9 24.7 Dallas 43.1 32.8 Denver 40.7 29.6 Detroit 45.3 36.1 Hartford 58.7 30.2 Houston 48.4 43.2 Indianapolis 26.4 28.4 Jacksonville 42.0 46.2 Kansas City 26.6 26.0 Las Vegas 35.3 29.7 Los Angeles 43.6 40.1 Louisville 43.7 33.9 Memphis 48.0 61.8 Miami 33.2 38.6 Milwaukee 50.0 29.0 Minneapolis 25.8 38.4 Nashville 20.8 36.1 New Orleans 45.4 32.2 New York 53.2 41.9 Oklahoma City 45.2 34.3 Orlando 28.4 40.9 Philadelphia 57.5 46.1 Phoenix 44.3 38.1 Pittsburgh 38.0 40.3 Portland 35.7 33.7 Providence 44.4 26.0 Raleigh 31.8 44.7 Richmond 41.8 23.8 Riverside 49.4 44.0 Sacramento 44.0 41.5 Salt Lake City 38.1 33.8 San Antonio 44.0 34.9 San Diego 43.1 40.9 San Francisco 35.6 28.3 San Jose 39.4 33.8 Seattle 26.8 30.7 St. Louis 35.5 36.8 Tampa 31.8 32.4 Virginia Beach 40.2 40.8 Washington DC 32.1 29.3
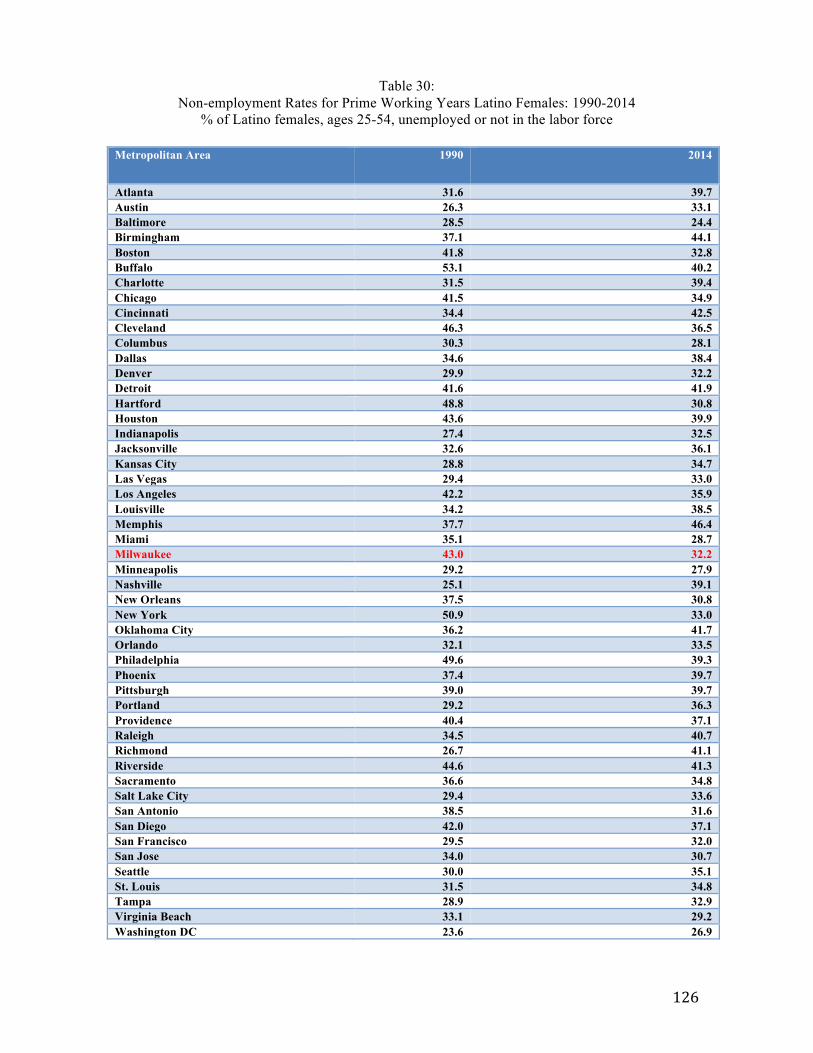
126
Table 30: Non-employment Rates for Prime Working Years Latino Females: 1990-2014
% of Latino females, ages 25-54, unemployed or not in the labor force
Metropolitan Area 1990 2014
Atlanta 31.6 39.7 Austin 26.3 33.1 Baltimore 28.5 24.4 Birmingham 37.1 44.1 Boston 41.8 32.8 Buffalo 53.1 40.2 Charlotte 31.5 39.4 Chicago 41.5 34.9 Cincinnati 34.4 42.5 Cleveland 46.3 36.5 Columbus 30.3 28.1 Dallas 34.6 38.4 Denver 29.9 32.2 Detroit 41.6 41.9 Hartford 48.8 30.8 Houston 43.6 39.9 Indianapolis 27.4 32.5 Jacksonville 32.6 36.1 Kansas City 28.8 34.7 Las Vegas 29.4 33.0 Los Angeles 42.2 35.9 Louisville 34.2 38.5 Memphis 37.7 46.4 Miami 35.1 28.7 Milwaukee 43.0 32.2 Minneapolis 29.2 27.9 Nashville 25.1 39.1 New Orleans 37.5 30.8 New York 50.9 33.0 Oklahoma City 36.2 41.7 Orlando 32.1 33.5 Philadelphia 49.6 39.3 Phoenix 37.4 39.7 Pittsburgh 39.0 39.7 Portland 29.2 36.3 Providence 40.4 37.1 Raleigh 34.5 40.7 Richmond 26.7 41.1 Riverside 44.6 41.3 Sacramento 36.6 34.8 Salt Lake City 29.4 33.6 San Antonio 38.5 31.6 San Diego 42.0 37.1 San Francisco 29.5 32.0 San Jose 34.0 30.7 Seattle 30.0 35.1 St. Louis 31.5 34.8 Tampa 28.9 32.9 Virginia Beach 33.1 29.2 Washington DC 23.6 26.9
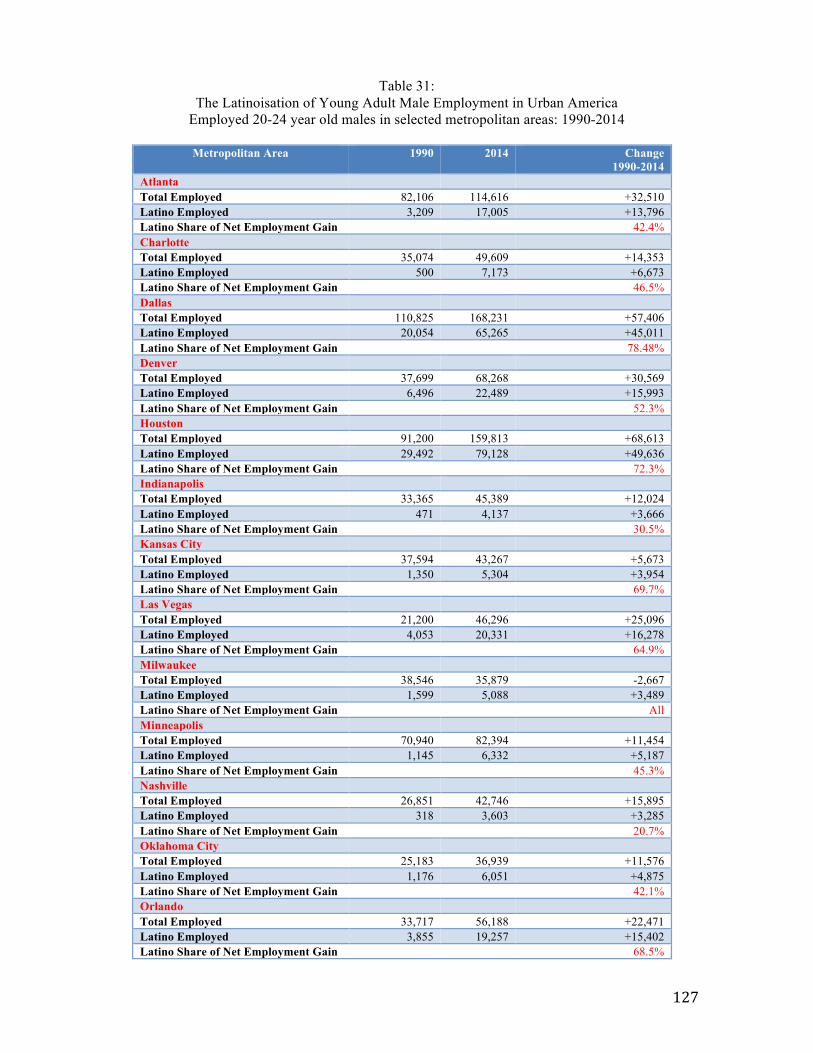
127
Table 31: The Latinoisation of Young Adult Male Employment in Urban America
Employed 20-24 year old males in selected metropolitan areas: 1990-2014
Metropolitan Area 1990 2014 Change 1990-2014
Atlanta Total Employed 82,106 114,616 +32,510 Latino Employed 3,209 17,005 +13,796 Latino Share of Net Employment Gain 42.4% Charlotte Total Employed 35,074 49,609 +14,353 Latino Employed 500 7,173 +6,673 Latino Share of Net Employment Gain 46.5% Dallas Total Employed 110,825 168,231 +57,406 Latino Employed 20,054 65,265 +45,011 Latino Share of Net Employment Gain 78.48% Denver Total Employed 37,699 68,268 +30,569 Latino Employed 6,496 22,489 +15,993 Latino Share of Net Employment Gain 52.3% Houston Total Employed 91,200 159,813 +68,613 Latino Employed 29,492 79,128 +49,636 Latino Share of Net Employment Gain 72.3% Indianapolis Total Employed 33,365 45,389 +12,024 Latino Employed 471 4,137 +3,666 Latino Share of Net Employment Gain 30.5% Kansas City Total Employed 37,594 43,267 +5,673 Latino Employed 1,350 5,304 +3,954 Latino Share of Net Employment Gain 69.7% Las Vegas Total Employed 21,200 46,296 +25,096 Latino Employed 4,053 20,331 +16,278 Latino Share of Net Employment Gain 64.9% Milwaukee Total Employed 38,546 35,879 -2,667 Latino Employed 1,599 5,088 +3,489 Latino Share of Net Employment Gain All Minneapolis Total Employed 70,940 82,394 +11,454 Latino Employed 1,145 6,332 +5,187 Latino Share of Net Employment Gain 45.3% Nashville Total Employed 26,851 42,746 +15,895 Latino Employed 318 3,603 +3,285 Latino Share of Net Employment Gain 20.7% Oklahoma City Total Employed 25,183 36,939 +11,576 Latino Employed 1,176 6,051 +4,875 Latino Share of Net Employment Gain 42.1% Orlando Total Employed 33,717 56,188 +22,471 Latino Employed 3,855 19,257 +15,402 Latino Share of Net Employment Gain 68.5%
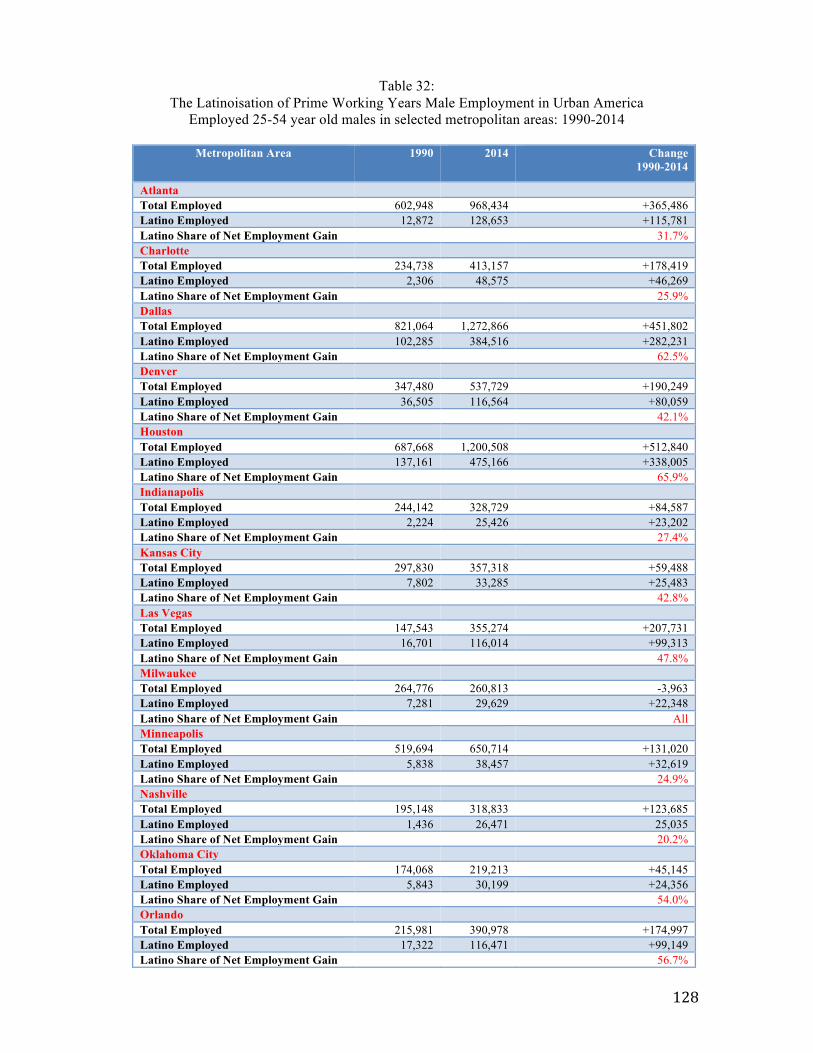
128
Table 32: The Latinoisation of Prime Working Years Male Employment in Urban America
Employed 25-54 year old males in selected metropolitan areas: 1990-2014
Metropolitan Area 1990 2014 Change 1990-2014
Atlanta Total Employed 602,948 968,434 +365,486 Latino Employed 12,872 128,653 +115,781 Latino Share of Net Employment Gain 31.7% Charlotte Total Employed 234,738 413,157 +178,419 Latino Employed 2,306 48,575 +46,269 Latino Share of Net Employment Gain 25.9% Dallas Total Employed 821,064 1,272,866 +451,802 Latino Employed 102,285 384,516 +282,231 Latino Share of Net Employment Gain 62.5% Denver Total Employed 347,480 537,729 +190,249 Latino Employed 36,505 116,564 +80,059 Latino Share of Net Employment Gain 42.1% Houston Total Employed 687,668 1,200,508 +512,840 Latino Employed 137,161 475,166 +338,005 Latino Share of Net Employment Gain 65.9% Indianapolis Total Employed 244,142 328,729 +84,587 Latino Employed 2,224 25,426 +23,202 Latino Share of Net Employment Gain 27.4% Kansas City Total Employed 297,830 357,318 +59,488 Latino Employed 7,802 33,285 +25,483 Latino Share of Net Employment Gain 42.8% Las Vegas Total Employed 147,543 355,274 +207,731 Latino Employed 16,701 116,014 +99,313 Latino Share of Net Employment Gain 47.8% Milwaukee Total Employed 264,776 260,813 -3,963 Latino Employed 7,281 29,629 +22,348 Latino Share of Net Employment Gain All Minneapolis Total Employed 519,694 650,714 +131,020 Latino Employed 5,838 38,457 +32,619 Latino Share of Net Employment Gain 24.9% Nashville Total Employed 195,148 318,833 +123,685 Latino Employed 1,436 26,471 25,035 Latino Share of Net Employment Gain 20.2% Oklahoma City Total Employed 174,068 219,213 +45,145 Latino Employed 5,843 30,199 +24,356 Latino Share of Net Employment Gain 54.0% Orlando Total Employed 215,981 390,978 +174,997 Latino Employed 17,322 116,471 +99,149 Latino Share of Net Employment Gain 56.7%
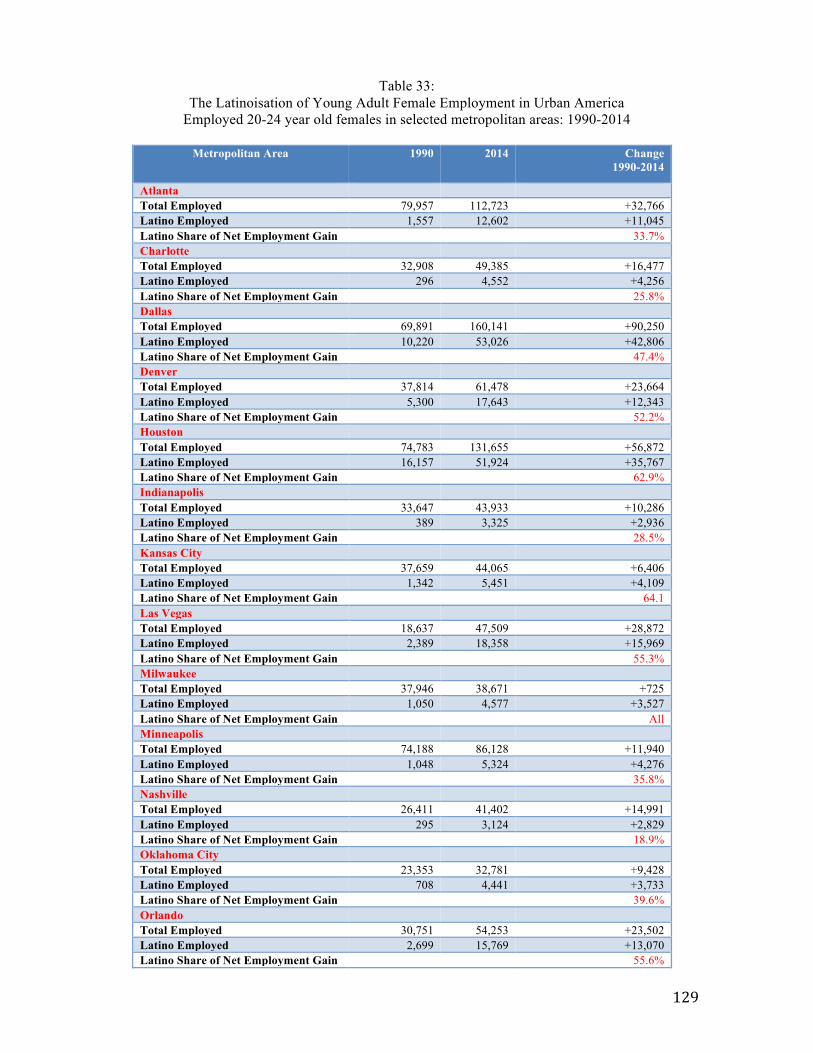
129
Table 33: The Latinoisation of Young Adult Female Employment in Urban America
Employed 20-24 year old females in selected metropolitan areas: 1990-2014
Metropolitan Area 1990 2014 Change 1990-2014
Atlanta Total Employed 79,957 112,723 +32,766 Latino Employed 1,557 12,602 +11,045 Latino Share of Net Employment Gain 33.7% Charlotte Total Employed 32,908 49,385 +16,477 Latino Employed 296 4,552 +4,256 Latino Share of Net Employment Gain 25.8% Dallas Total Employed 69,891 160,141 +90,250 Latino Employed 10,220 53,026 +42,806 Latino Share of Net Employment Gain 47.4% Denver Total Employed 37,814 61,478 +23,664 Latino Employed 5,300 17,643 +12,343 Latino Share of Net Employment Gain 52.2% Houston Total Employed 74,783 131,655 +56,872 Latino Employed 16,157 51,924 +35,767 Latino Share of Net Employment Gain 62.9% Indianapolis Total Employed 33,647 43,933 +10,286 Latino Employed 389 3,325 +2,936 Latino Share of Net Employment Gain 28.5% Kansas City Total Employed 37,659 44,065 +6,406 Latino Employed 1,342 5,451 +4,109 Latino Share of Net Employment Gain 64.1 Las Vegas Total Employed 18,637 47,509 +28,872 Latino Employed 2,389 18,358 +15,969 Latino Share of Net Employment Gain 55.3% Milwaukee Total Employed 37,946 38,671 +725 Latino Employed 1,050 4,577 +3,527 Latino Share of Net Employment Gain All Minneapolis Total Employed 74,188 86,128 +11,940 Latino Employed 1,048 5,324 +4,276 Latino Share of Net Employment Gain 35.8% Nashville Total Employed 26,411 41,402 +14,991 Latino Employed 295 3,124 +2,829 Latino Share of Net Employment Gain 18.9% Oklahoma City Total Employed 23,353 32,781 +9,428 Latino Employed 708 4,441 +3,733 Latino Share of Net Employment Gain 39.6% Orlando Total Employed 30,751 54,253 +23,502 Latino Employed 2,699 15,769 +13,070 Latino Share of Net Employment Gain 55.6%
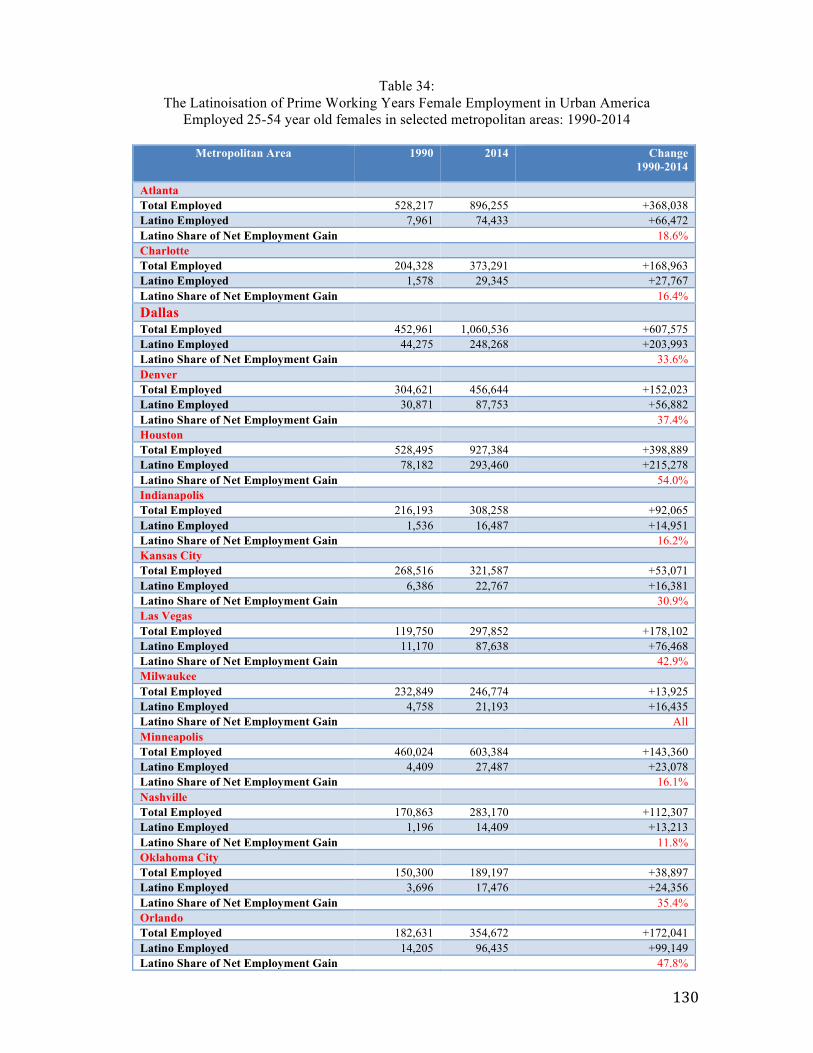
130
Table 34: The Latinoisation of Prime Working Years Female Employment in Urban America
Employed 25-54 year old females in selected metropolitan areas: 1990-2014
Metropolitan Area 1990 2014 Change 1990-2014
Atlanta Total Employed 528,217 896,255 +368,038 Latino Employed 7,961 74,433 +66,472 Latino Share of Net Employment Gain 18.6% Charlotte Total Employed 204,328 373,291 +168,963 Latino Employed 1,578 29,345 +27,767 Latino Share of Net Employment Gain 16.4% Dallas Total Employed 452,961 1,060,536 +607,575 Latino Employed 44,275 248,268 +203,993 Latino Share of Net Employment Gain 33.6% Denver Total Employed 304,621 456,644 +152,023 Latino Employed 30,871 87,753 +56,882 Latino Share of Net Employment Gain 37.4% Houston Total Employed 528,495 927,384 +398,889 Latino Employed 78,182 293,460 +215,278 Latino Share of Net Employment Gain 54.0% Indianapolis Total Employed 216,193 308,258 +92,065 Latino Employed 1,536 16,487 +14,951 Latino Share of Net Employment Gain 16.2% Kansas City Total Employed 268,516 321,587 +53,071 Latino Employed 6,386 22,767 +16,381 Latino Share of Net Employment Gain 30.9% Las Vegas Total Employed 119,750 297,852 +178,102 Latino Employed 11,170 87,638 +76,468 Latino Share of Net Employment Gain 42.9% Milwaukee Total Employed 232,849 246,774 +13,925 Latino Employed 4,758 21,193 +16,435 Latino Share of Net Employment Gain All Minneapolis Total Employed 460,024 603,384 +143,360 Latino Employed 4,409 27,487 +23,078 Latino Share of Net Employment Gain 16.1% Nashville Total Employed 170,863 283,170 +112,307 Latino Employed 1,196 14,409 +13,213 Latino Share of Net Employment Gain 11.8% Oklahoma City Total Employed 150,300 189,197 +38,897 Latino Employed 3,696 17,476 +24,356 Latino Share of Net Employment Gain 35.4% Orlando Total Employed 182,631 354,672 +172,041 Latino Employed 14,205 96,435 +99,149 Latino Share of Net Employment Gain 47.8%
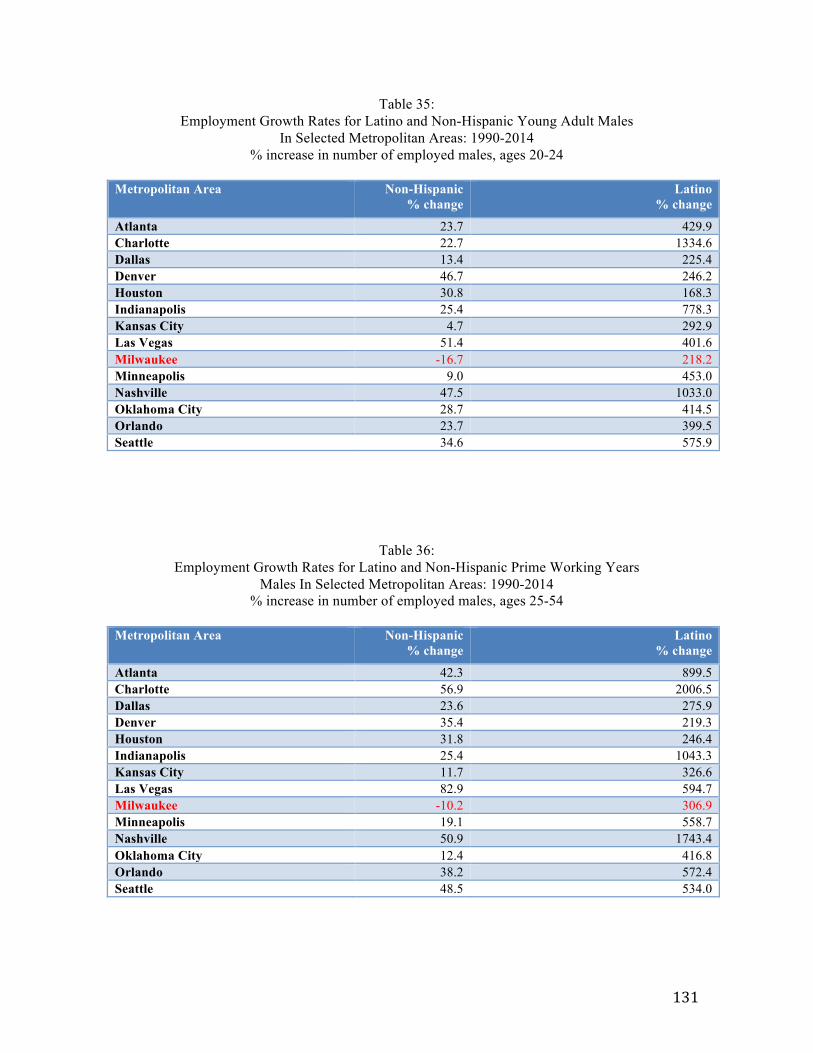
131
Table 35:
Employment Growth Rates for Latino and Non-Hispanic Young Adult Males In Selected Metropolitan Areas: 1990-2014
% increase in number of employed males, ages 20-24
Metropolitan Area Non-Hispanic % change
Latino % change
Atlanta 23.7 429.9 Charlotte 22.7 1334.6 Dallas 13.4 225.4 Denver 46.7 246.2 Houston 30.8 168.3 Indianapolis 25.4 778.3 Kansas City 4.7 292.9 Las Vegas 51.4 401.6 Milwaukee -16.7 218.2 Minneapolis 9.0 453.0 Nashville 47.5 1033.0 Oklahoma City 28.7 414.5 Orlando 23.7 399.5 Seattle 34.6 575.9
Table 36: Employment Growth Rates for Latino and Non-Hispanic Prime Working Years
Males In Selected Metropolitan Areas: 1990-2014 % increase in number of employed males, ages 25-54
Metropolitan Area Non-Hispanic
% change Latino
% change
Atlanta 42.3 899.5 Charlotte 56.9 2006.5 Dallas 23.6 275.9 Denver 35.4 219.3 Houston 31.8 246.4 Indianapolis 25.4 1043.3 Kansas City 11.7 326.6 Las Vegas 82.9 594.7 Milwaukee -10.2 306.9 Minneapolis 19.1 558.7 Nashville 50.9 1743.4 Oklahoma City 12.4 416.8 Orlando 38.2 572.4 Seattle 48.5 534.0
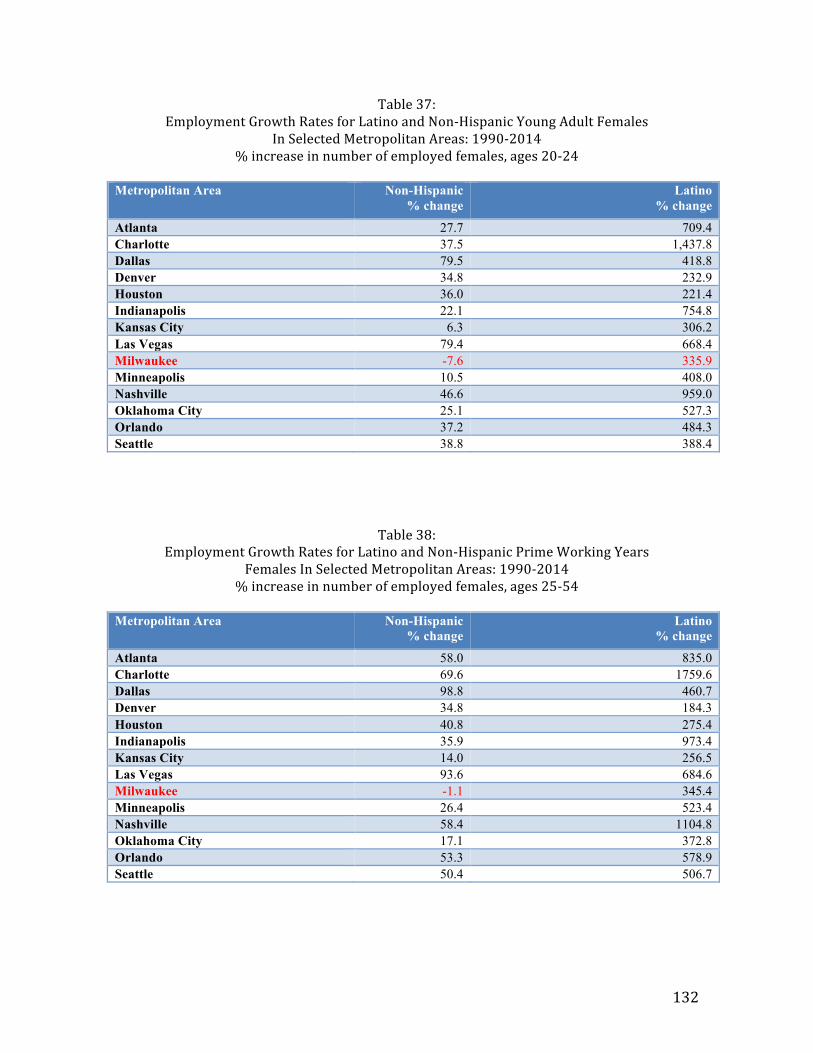
132
Table 37:
Employment Growth Rates for Latino and Non-‐Hispanic Young Adult Females In Selected Metropolitan Areas: 1990-‐2014
% increase in number of employed females, ages 20-‐24
Metropolitan Area Non-Hispanic % change
Latino % change
Atlanta 27.7 709.4 Charlotte 37.5 1,437.8 Dallas 79.5 418.8 Denver 34.8 232.9 Houston 36.0 221.4 Indianapolis 22.1 754.8 Kansas City 6.3 306.2 Las Vegas 79.4 668.4 Milwaukee -7.6 335.9 Minneapolis 10.5 408.0 Nashville 46.6 959.0 Oklahoma City 25.1 527.3 Orlando 37.2 484.3 Seattle 38.8 388.4
Table 38: Employment Growth Rates for Latino and Non-‐Hispanic Prime Working Years
Females In Selected Metropolitan Areas: 1990-‐2014 % increase in number of employed females, ages 25-‐54
Metropolitan Area Non-Hispanic
% change Latino
% change
Atlanta 58.0 835.0 Charlotte 69.6 1759.6 Dallas 98.8 460.7 Denver 34.8 184.3 Houston 40.8 275.4 Indianapolis 35.9 973.4 Kansas City 14.0 256.5 Las Vegas 93.6 684.6 Milwaukee -1.1 345.4 Minneapolis 26.4 523.4 Nashville 58.4 1104.8 Oklahoma City 17.1 372.8 Orlando 53.3 578.9 Seattle 50.4 506.7
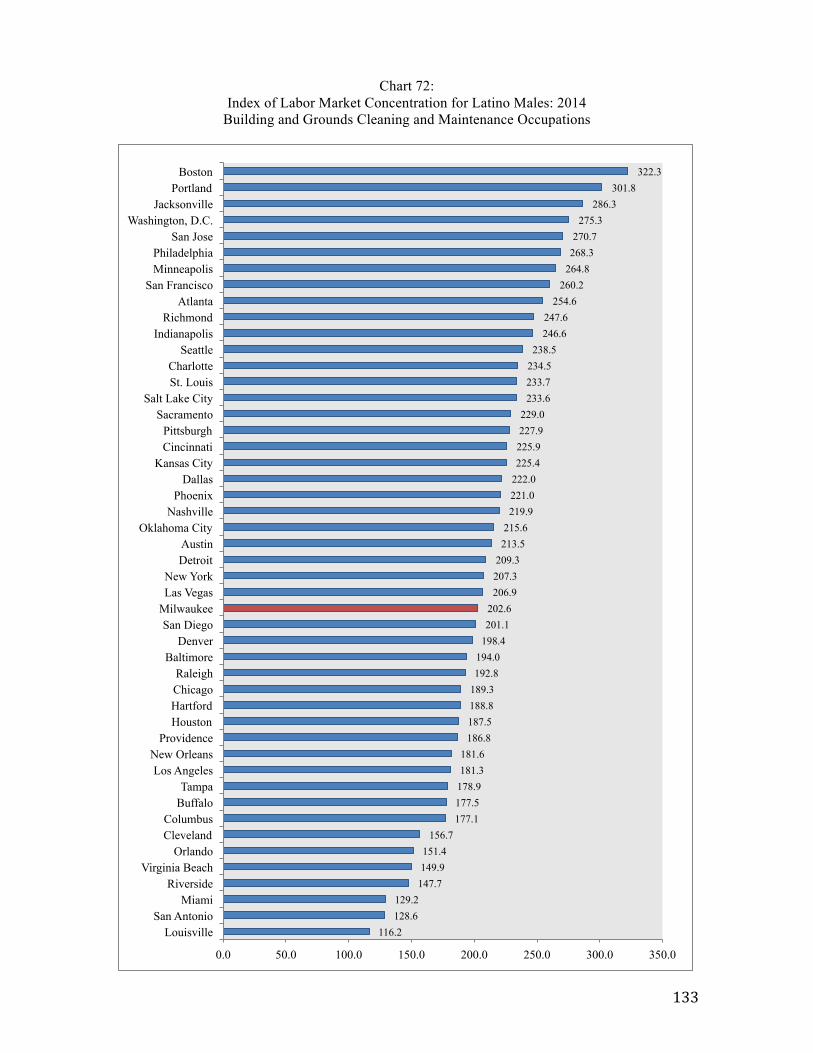
133
Chart 72: Index of Labor Market Concentration for Latino Males: 2014
Building and Grounds Cleaning and Maintenance Occupations
116.2 128.6 129.2
147.7 149.9 151.4
156.7 177.1 177.5 178.9 181.3 181.6
186.8 187.5 188.8 189.3 192.8 194.0
198.4 201.1 202.6
206.9 207.3 209.3 213.5 215.6
219.9 221.0 222.0 225.4 225.9 227.9 229.0
233.6 233.7 234.5 238.5
246.6 247.6
254.6 260.2
264.8 268.3 270.7
275.3 286.3
301.8 322.3
0.0 50.0 100.0 150.0 200.0 250.0 300.0 350.0
Louisville San Antonio
Miami Riverside
Virginia Beach Orlando
Cleveland Columbus
Buffalo Tampa
Los Angeles New Orleans
Providence Houston Hartford Chicago Raleigh
Baltimore Denver
San Diego Milwaukee Las Vegas New York
Detroit Austin
Oklahoma City Nashville
Phoenix Dallas
Kansas City Cincinnati Pittsburgh
Sacramento Salt Lake City
St. Louis Charlotte
Seattle Indianapolis
Richmond Atlanta
San Francisco Minneapolis Philadelphia
San Jose Washington, D.C.
Jacksonville Portland
Boston
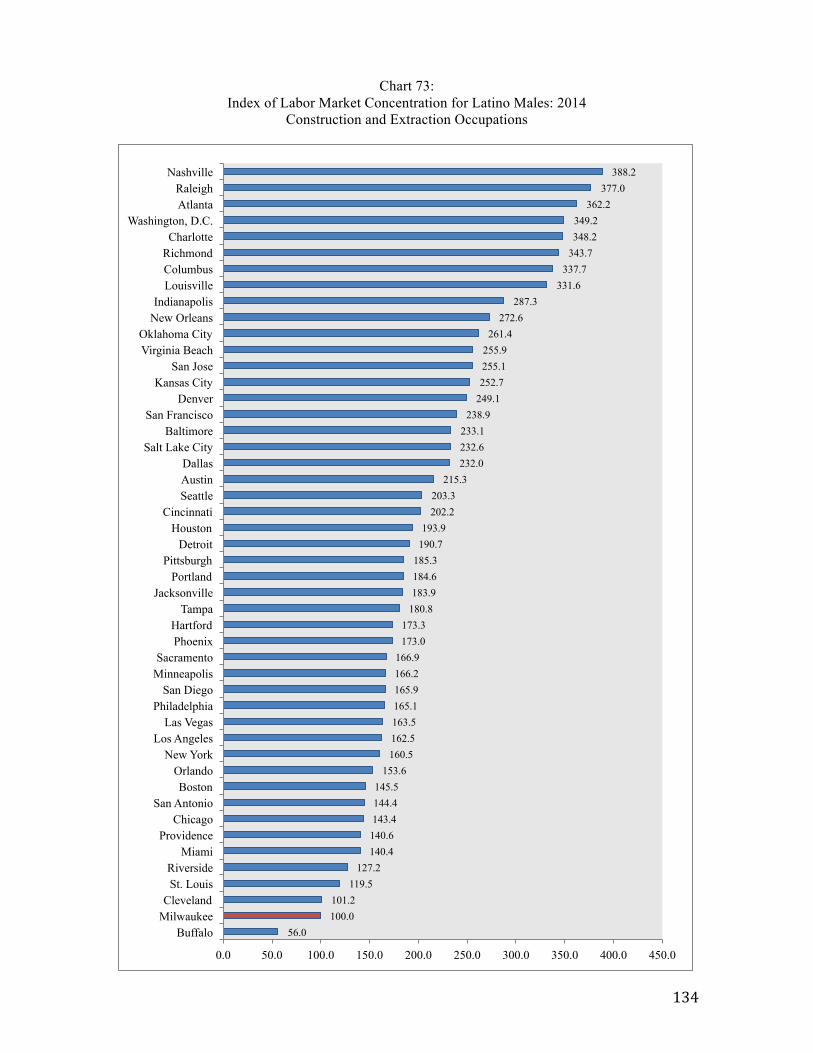
134
Chart 73: Index of Labor Market Concentration for Latino Males: 2014
Construction and Extraction Occupations
56.0 100.0 101.2
119.5 127.2
140.4 140.6 143.4 144.4 145.5
153.6 160.5 162.5 163.5 165.1 165.9 166.2 166.9
173.0 173.3
180.8 183.9 184.6 185.3 190.7 193.9
202.2 203.3
215.3 232.0 232.6 233.1
238.9 249.1 252.7 255.1 255.9
261.4 272.6
287.3 331.6
337.7 343.7 348.2 349.2
362.2 377.0
388.2
0.0 50.0 100.0 150.0 200.0 250.0 300.0 350.0 400.0 450.0
Buffalo Milwaukee Cleveland
St. Louis Riverside
Miami Providence
Chicago San Antonio
Boston Orlando
New York Los Angeles
Las Vegas Philadelphia
San Diego Minneapolis Sacramento
Phoenix Hartford
Tampa Jacksonville
Portland Pittsburgh
Detroit Houston
Cincinnati Seattle Austin Dallas
Salt Lake City Baltimore
San Francisco Denver
Kansas City San Jose
Virginia Beach Oklahoma City
New Orleans Indianapolis
Louisville Columbus Richmond Charlotte
Washington, D.C. Atlanta Raleigh
Nashville
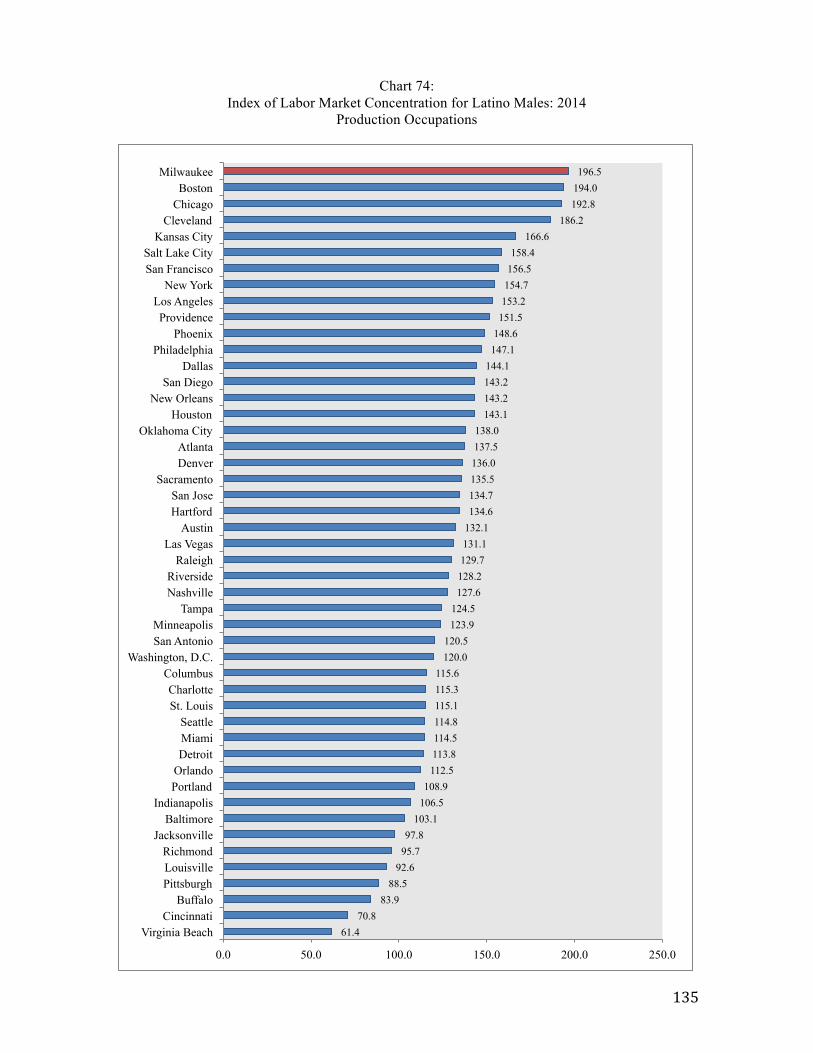
135
Chart 74: Index of Labor Market Concentration for Latino Males: 2014
Production Occupations
61.4 70.8
83.9 88.5
92.6 95.7 97.8
103.1 106.5 108.9
112.5 113.8 114.5 114.8 115.1 115.3 115.6
120.0 120.5
123.9 124.5
127.6 128.2 129.7 131.1 132.1 134.6 134.7 135.5 136.0 137.5 138.0
143.1 143.2 143.2 144.1 147.1 148.6 151.5 153.2 154.7 156.5 158.4
166.6 186.2
192.8 194.0 196.5
0.0 50.0 100.0 150.0 200.0 250.0
Virginia Beach Cincinnati
Buffalo Pittsburgh Louisville Richmond
Jacksonville Baltimore
Indianapolis Portland Orlando Detroit Miami Seattle
St. Louis Charlotte
Columbus Washington, D.C.
San Antonio Minneapolis
Tampa Nashville Riverside
Raleigh Las Vegas
Austin Hartford San Jose
Sacramento Denver Atlanta
Oklahoma City Houston
New Orleans San Diego
Dallas Philadelphia
Phoenix Providence
Los Angeles New York
San Francisco Salt Lake City
Kansas City Cleveland
Chicago Boston
Milwaukee
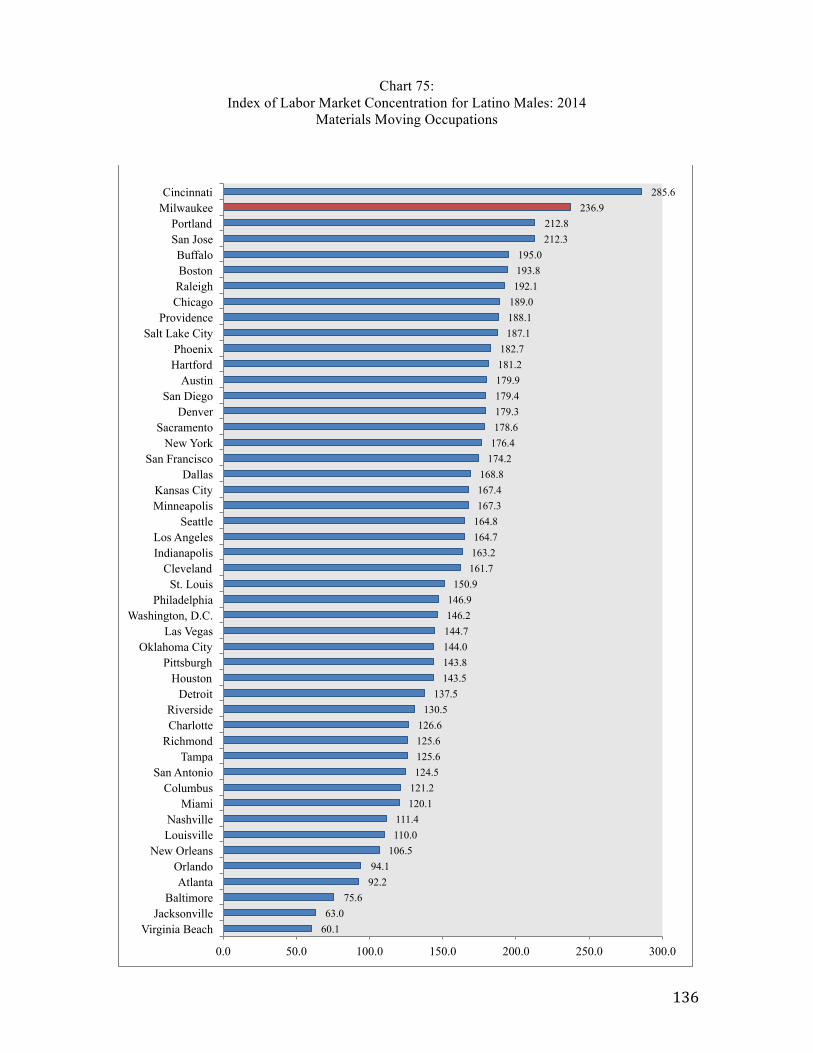
136
Chart 75: Index of Labor Market Concentration for Latino Males: 2014
Materials Moving Occupations
60.1 63.0
75.6 92.2 94.1
106.5 110.0 111.4
120.1 121.2 124.5 125.6 125.6 126.6
130.5 137.5
143.5 143.8 144.0 144.7 146.2 146.9
150.9 161.7 163.2 164.7 164.8 167.3 167.4 168.8
174.2 176.4 178.6 179.3 179.4 179.9 181.2 182.7
187.1 188.1 189.0 192.1 193.8 195.0
212.3 212.8
236.9 285.6
0.0 50.0 100.0 150.0 200.0 250.0 300.0
Virginia Beach Jacksonville
Baltimore Atlanta
Orlando New Orleans
Louisville Nashville
Miami Columbus
San Antonio Tampa
Richmond Charlotte Riverside
Detroit Houston
Pittsburgh Oklahoma City
Las Vegas Washington, D.C.
Philadelphia St. Louis
Cleveland Indianapolis Los Angeles
Seattle Minneapolis Kansas City
Dallas San Francisco
New York Sacramento
Denver San Diego
Austin Hartford Phoenix
Salt Lake City Providence
Chicago Raleigh Boston Buffalo
San Jose Portland
Milwaukee Cincinnati
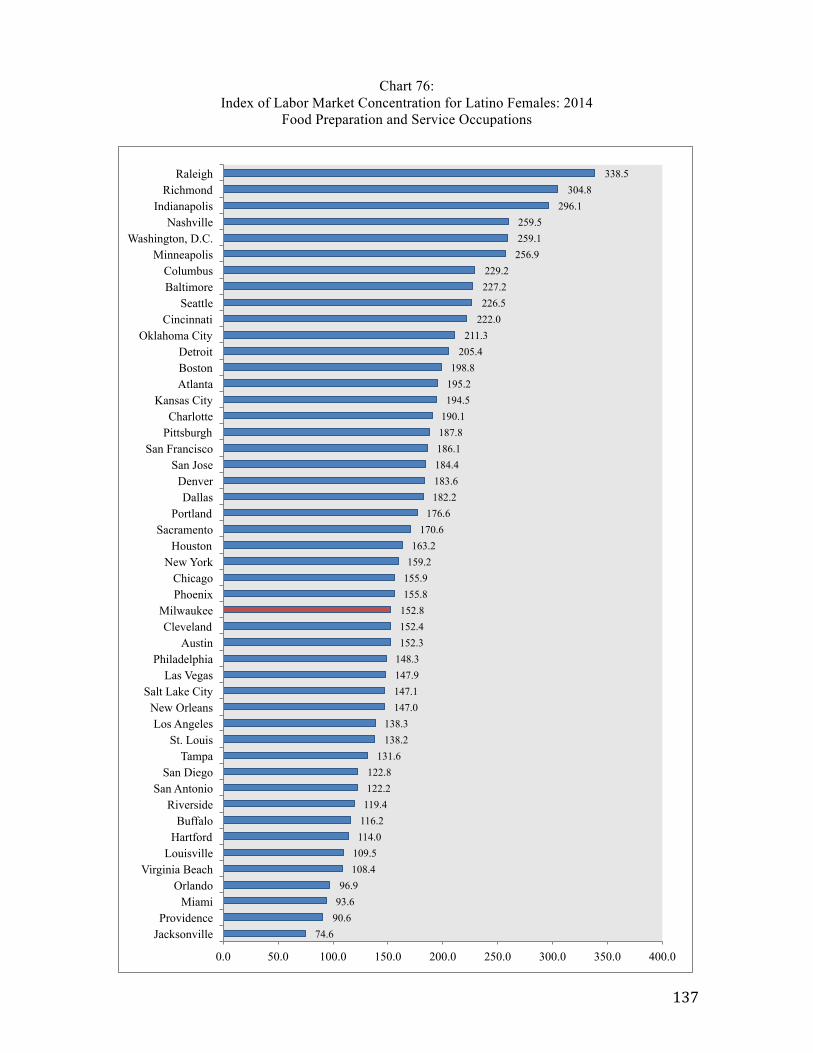
137
Chart 76: Index of Labor Market Concentration for Latino Females: 2014
Food Preparation and Service Occupations
74.6 90.6 93.6 96.9
108.4 109.5 114.0 116.2 119.4 122.2 122.8
131.6 138.2 138.3
147.0 147.1 147.9 148.3 152.3 152.4 152.8 155.8 155.9 159.2 163.2
170.6 176.6
182.2 183.6 184.4 186.1 187.8 190.1 194.5 195.2 198.8
205.4 211.3
222.0 226.5 227.2 229.2
256.9 259.1 259.5
296.1 304.8
338.5
0.0 50.0 100.0 150.0 200.0 250.0 300.0 350.0 400.0
Jacksonville Providence
Miami Orlando
Virginia Beach Louisville
Hartford Buffalo
Riverside San Antonio
San Diego Tampa
St. Louis Los Angeles
New Orleans Salt Lake City
Las Vegas Philadelphia
Austin Cleveland
Milwaukee Phoenix Chicago
New York Houston
Sacramento Portland
Dallas Denver
San Jose San Francisco
Pittsburgh Charlotte
Kansas City Atlanta Boston Detroit
Oklahoma City Cincinnati
Seattle Baltimore Columbus
Minneapolis Washington, D.C.
Nashville Indianapolis
Richmond Raleigh
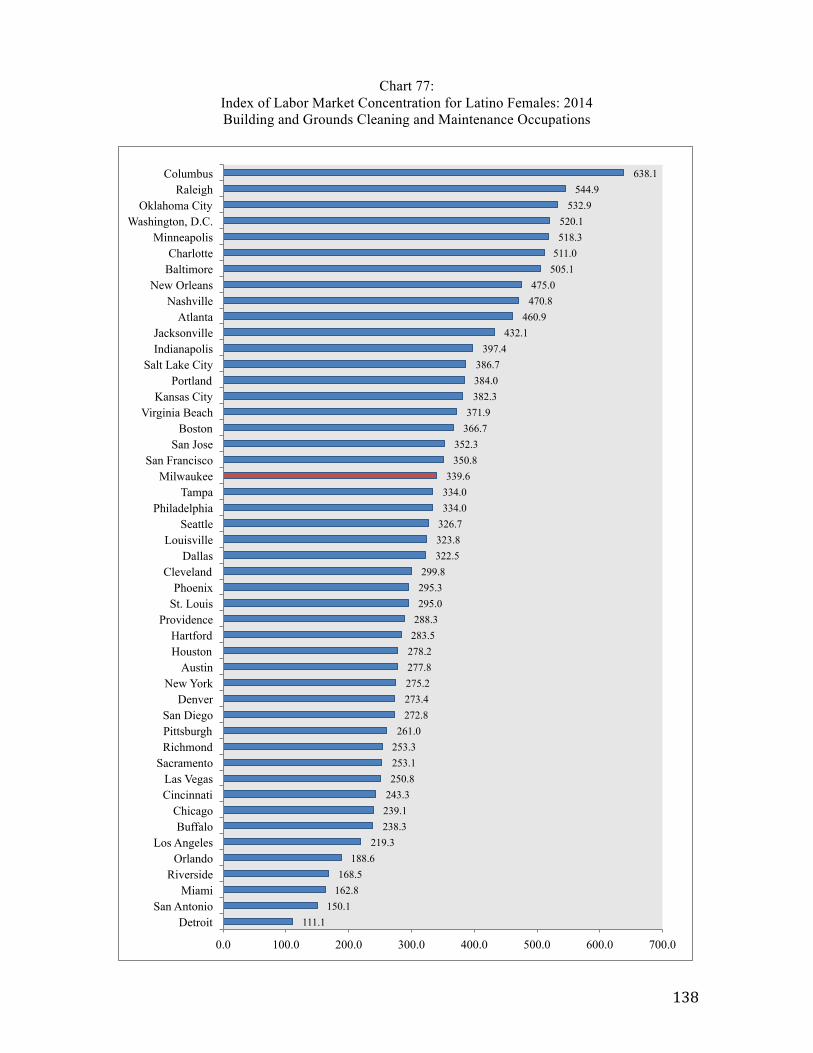
138
Chart 77: Index of Labor Market Concentration for Latino Females: 2014 Building and Grounds Cleaning and Maintenance Occupations
111.1 150.1
162.8 168.5
188.6 219.3
238.3 239.1 243.3 250.8 253.1 253.3 261.0
272.8 273.4 275.2 277.8 278.2 283.5 288.3 295.0 295.3 299.8
322.5 323.8 326.7 334.0 334.0 339.6
350.8 352.3
366.7 371.9
382.3 384.0 386.7
397.4 432.1
460.9 470.8 475.0
505.1 511.0 518.3 520.1
532.9 544.9
638.1
0.0 100.0 200.0 300.0 400.0 500.0 600.0 700.0
Detroit San Antonio
Miami Riverside
Orlando Los Angeles
Buffalo Chicago
Cincinnati Las Vegas
Sacramento Richmond Pittsburgh San Diego
Denver New York
Austin Houston Hartford
Providence St. Louis Phoenix
Cleveland Dallas
Louisville Seattle
Philadelphia Tampa
Milwaukee San Francisco
San Jose Boston
Virginia Beach Kansas City
Portland Salt Lake City
Indianapolis Jacksonville
Atlanta Nashville
New Orleans Baltimore Charlotte
Minneapolis Washington, D.C.
Oklahoma City Raleigh
Columbus
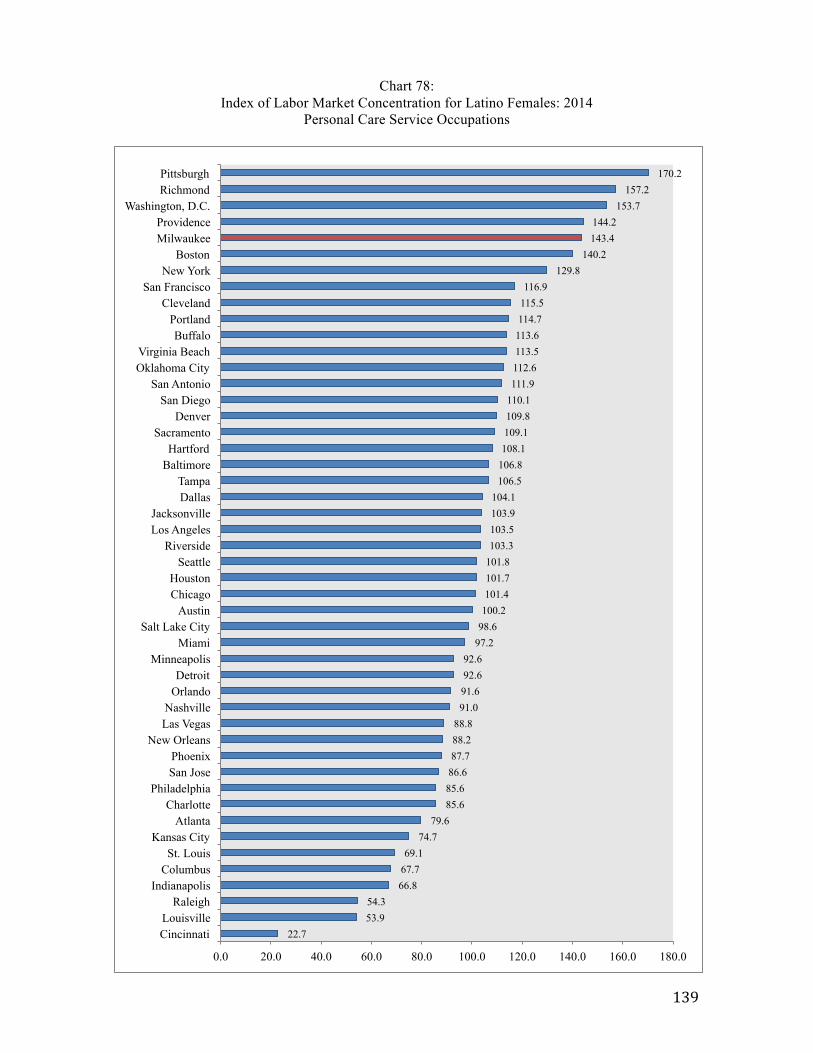
139
Chart 78: Index of Labor Market Concentration for Latino Females: 2014
Personal Care Service Occupations
22.7 53.9 54.3
66.8 67.7 69.1
74.7 79.6
85.6 85.6 86.6 87.7 88.2 88.8
91.0 91.6 92.6 92.6
97.2 98.6 100.2 101.4 101.7 101.8 103.3 103.5 103.9 104.1
106.5 106.8 108.1 109.1 109.8 110.1 111.9 112.6 113.5 113.6 114.7 115.5 116.9
129.8 140.2
143.4 144.2
153.7 157.2
170.2
0.0 20.0 40.0 60.0 80.0 100.0 120.0 140.0 160.0 180.0
Cincinnati Louisville
Raleigh Indianapolis
Columbus St. Louis
Kansas City Atlanta
Charlotte Philadelphia
San Jose Phoenix
New Orleans Las Vegas Nashville
Orlando Detroit
Minneapolis Miami
Salt Lake City Austin
Chicago Houston
Seattle Riverside
Los Angeles Jacksonville
Dallas Tampa
Baltimore Hartford
Sacramento Denver
San Diego San Antonio
Oklahoma City Virginia Beach
Buffalo Portland
Cleveland San Francisco
New York Boston
Milwaukee Providence
Washington, D.C. Richmond Pittsburgh
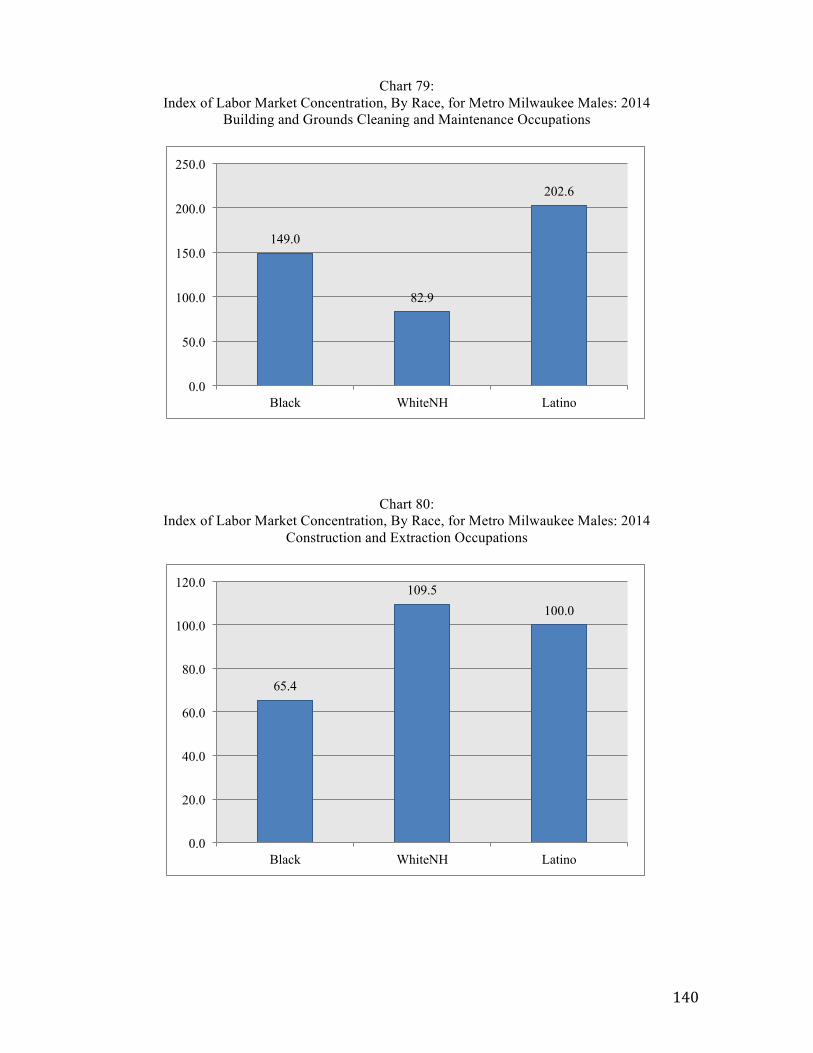
140
Chart 79: Index of Labor Market Concentration, By Race, for Metro Milwaukee Males: 2014
Building and Grounds Cleaning and Maintenance Occupations
Chart 80: Index of Labor Market Concentration, By Race, for Metro Milwaukee Males: 2014
Construction and Extraction Occupations
149.0
82.9
202.6
0.0
50.0
100.0
150.0
200.0
250.0
Black WhiteNH Latino
65.4
109.5 100.0
0.0
20.0
40.0
60.0
80.0
100.0
120.0
Black WhiteNH Latino
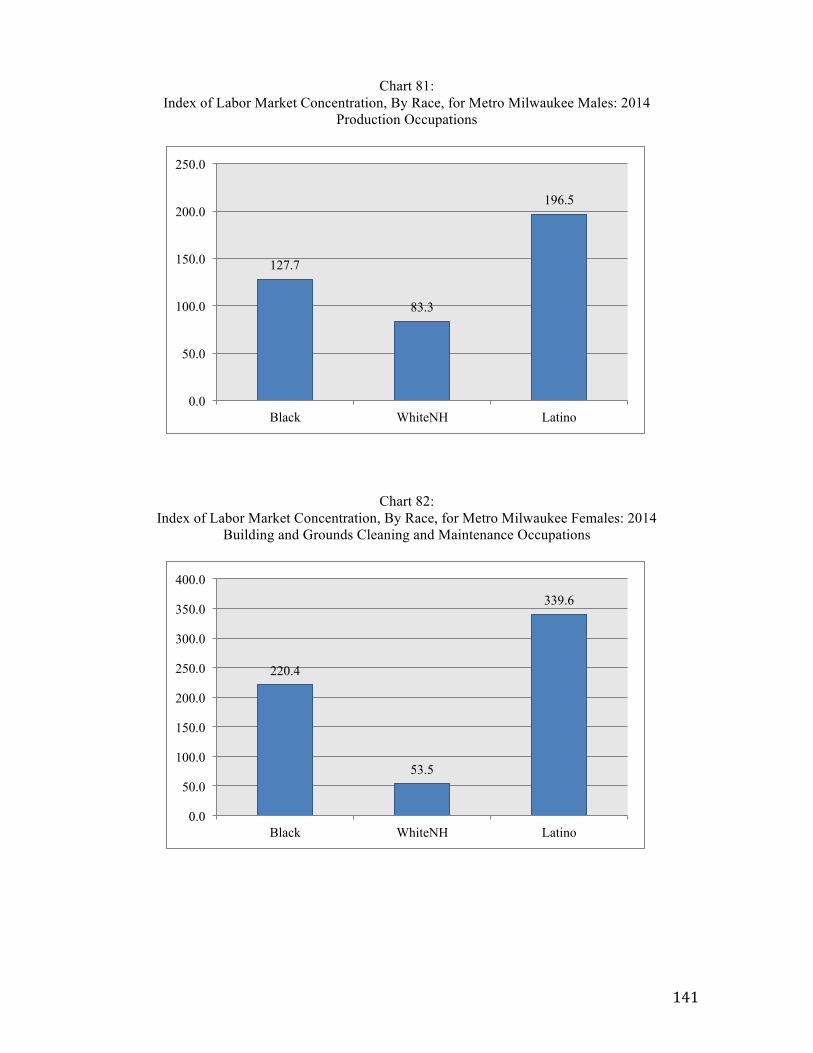
141
Chart 81: Index of Labor Market Concentration, By Race, for Metro Milwaukee Males: 2014
Production Occupations
Chart 82: Index of Labor Market Concentration, By Race, for Metro Milwaukee Females: 2014
Building and Grounds Cleaning and Maintenance Occupations
127.7
83.3
196.5
0.0
50.0
100.0
150.0
200.0
250.0
Black WhiteNH Latino
220.4
53.5
339.6
0.0
50.0
100.0
150.0
200.0
250.0
300.0
350.0
400.0
Black WhiteNH Latino
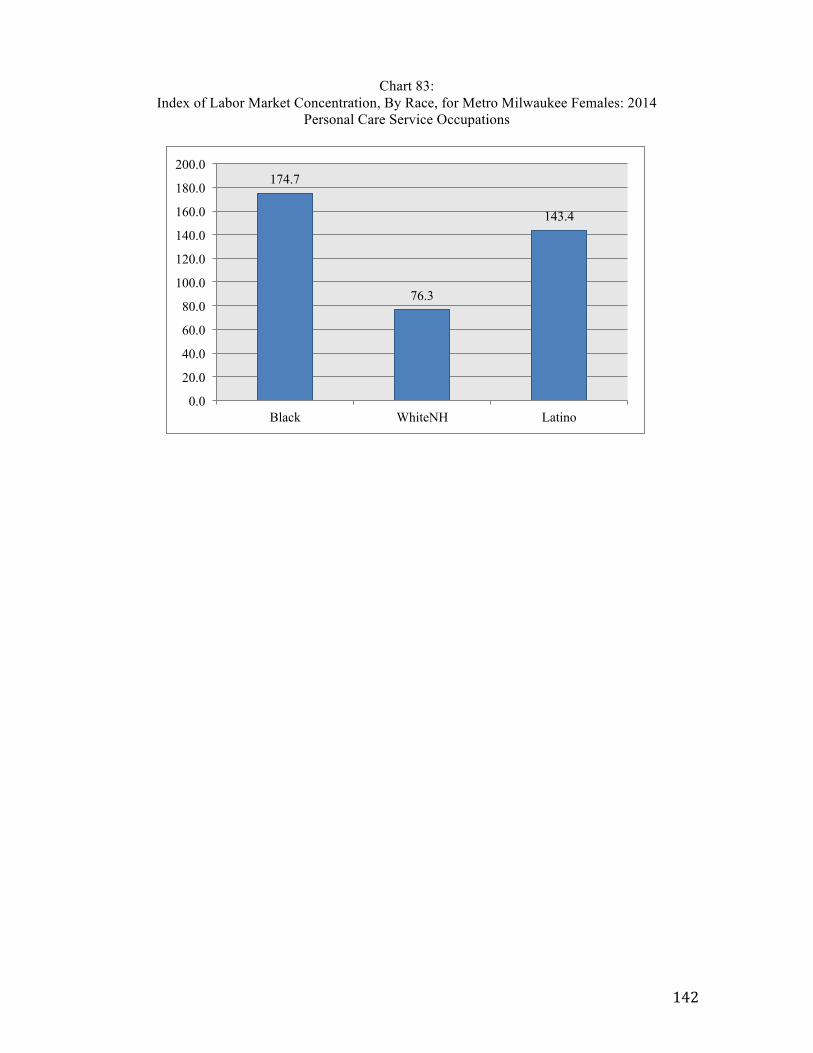
142
Chart 83: Index of Labor Market Concentration, By Race, for Metro Milwaukee Females: 2014
Personal Care Service Occupations
174.7
76.3
143.4
0.0
20.0
40.0
60.0
80.0
100.0
120.0
140.0
160.0
180.0
200.0
Black WhiteNH Latino
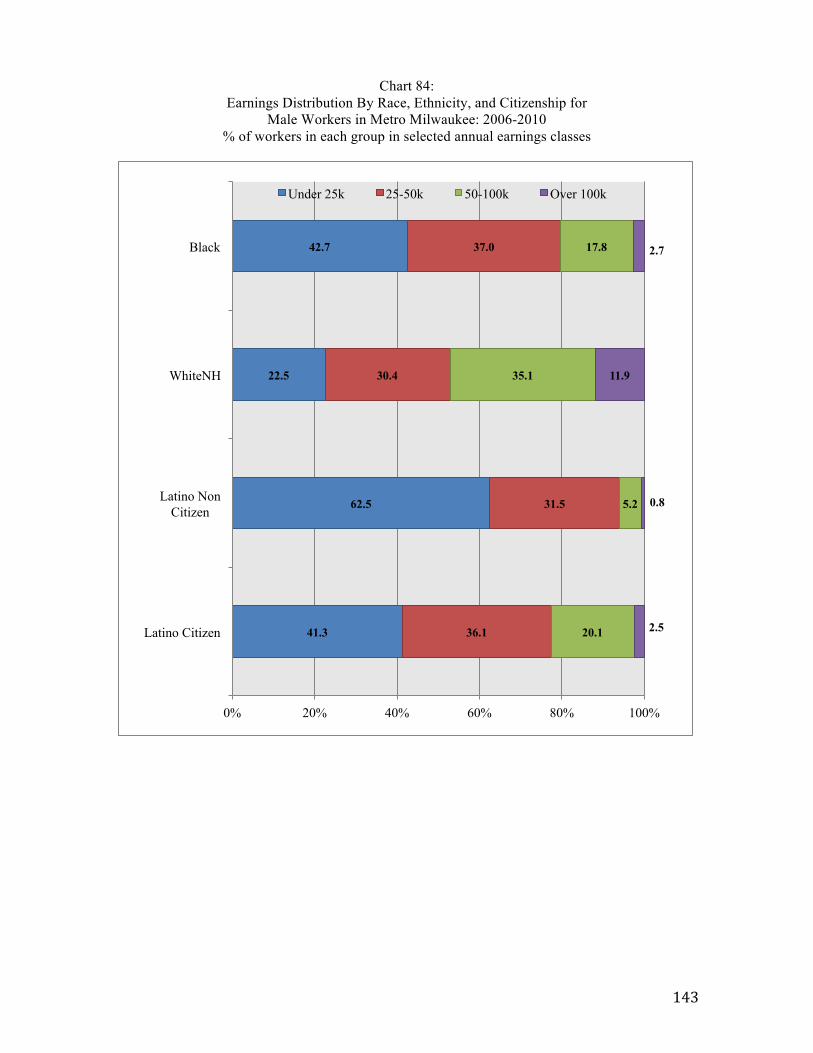
143
Chart 84: Earnings Distribution By Race, Ethnicity, and Citizenship for
Male Workers in Metro Milwaukee: 2006-2010 % of workers in each group in selected annual earnings classes
41.3
62.5
22.5
42.7
36.1
31.5
30.4
37.0
20.1
5.2
35.1
17.8
2.5
0.8
11.9
2.7
0% 20% 40% 60% 80% 100%
Latino Citizen
Latino Non Citizen
WhiteNH
Black
Under 25k 25-50k 50-100k Over 100k
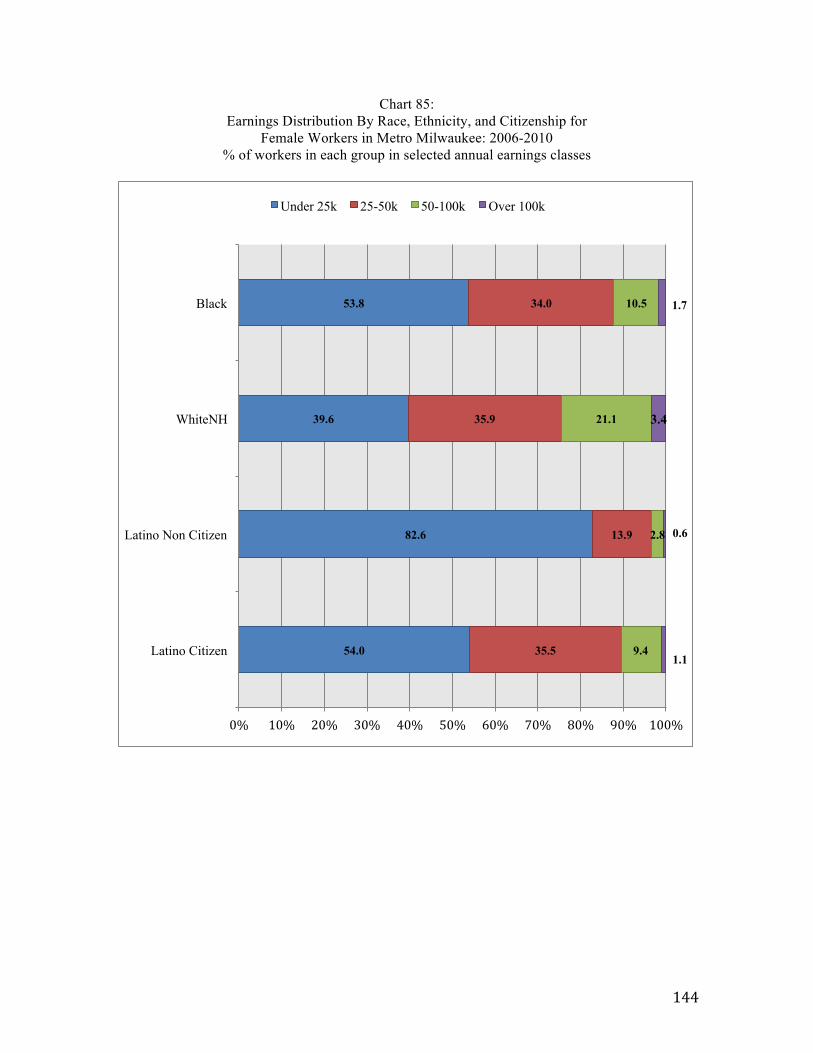
144
Chart 85:
Earnings Distribution By Race, Ethnicity, and Citizenship for Female Workers in Metro Milwaukee: 2006-2010
% of workers in each group in selected annual earnings classes
54.0
82.6
39.6
53.8
35.5
13.9
35.9
34.0
9.4
2.8
21.1
10.5
1.1
0.6
3.4
1.7
0% 10% 20% 30% 40% 50% 60% 70% 80% 90% 100%
Latino Citizen
Latino Non Citizen
WhiteNH
Black
Under 25k 25-50k 50-100k Over 100k
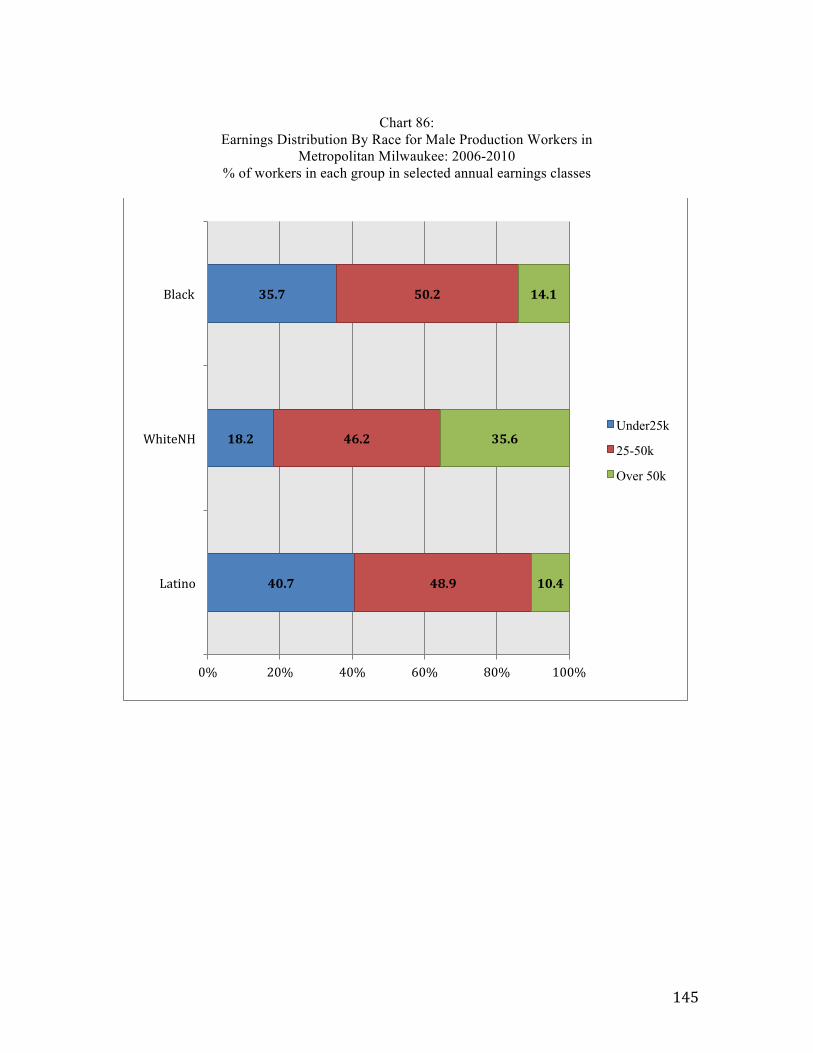
145
Chart 86: Earnings Distribution By Race for Male Production Workers in
Metropolitan Milwaukee: 2006-2010 % of workers in each group in selected annual earnings classes
40.7
18.2
35.7
48.9
46.2
50.2
10.4
35.6
14.1
0% 20% 40% 60% 80% 100%
Latino
WhiteNH
Black
Under25k
25-50k
Over 50k
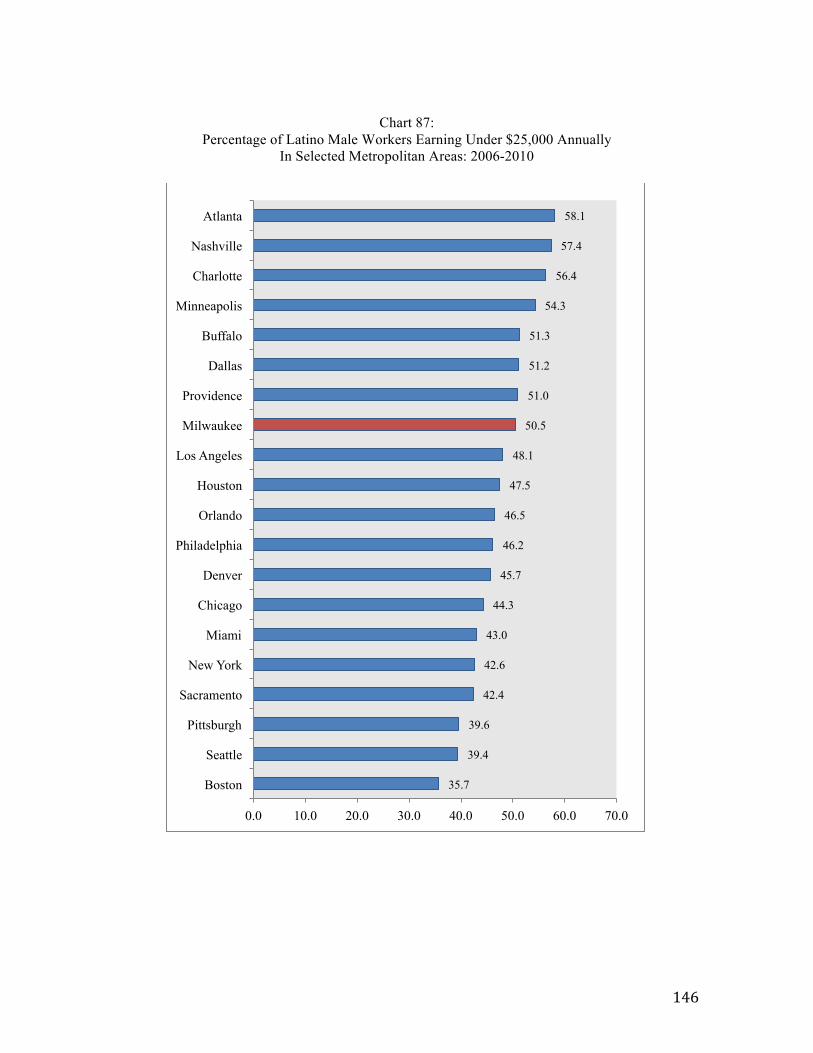
146
Chart 87: Percentage of Latino Male Workers Earning Under $25,000 Annually
In Selected Metropolitan Areas: 2006-2010
35.7
39.4
39.6
42.4
42.6
43.0
44.3
45.7
46.2
46.5
47.5
48.1
50.5
51.0
51.2
51.3
54.3
56.4
57.4
58.1
0.0 10.0 20.0 30.0 40.0 50.0 60.0 70.0
Boston
Seattle
Pittsburgh
Sacramento
New York
Miami
Chicago
Denver
Philadelphia
Orlando
Houston
Los Angeles
Milwaukee
Providence
Dallas
Buffalo
Minneapolis
Charlotte
Nashville
Atlanta
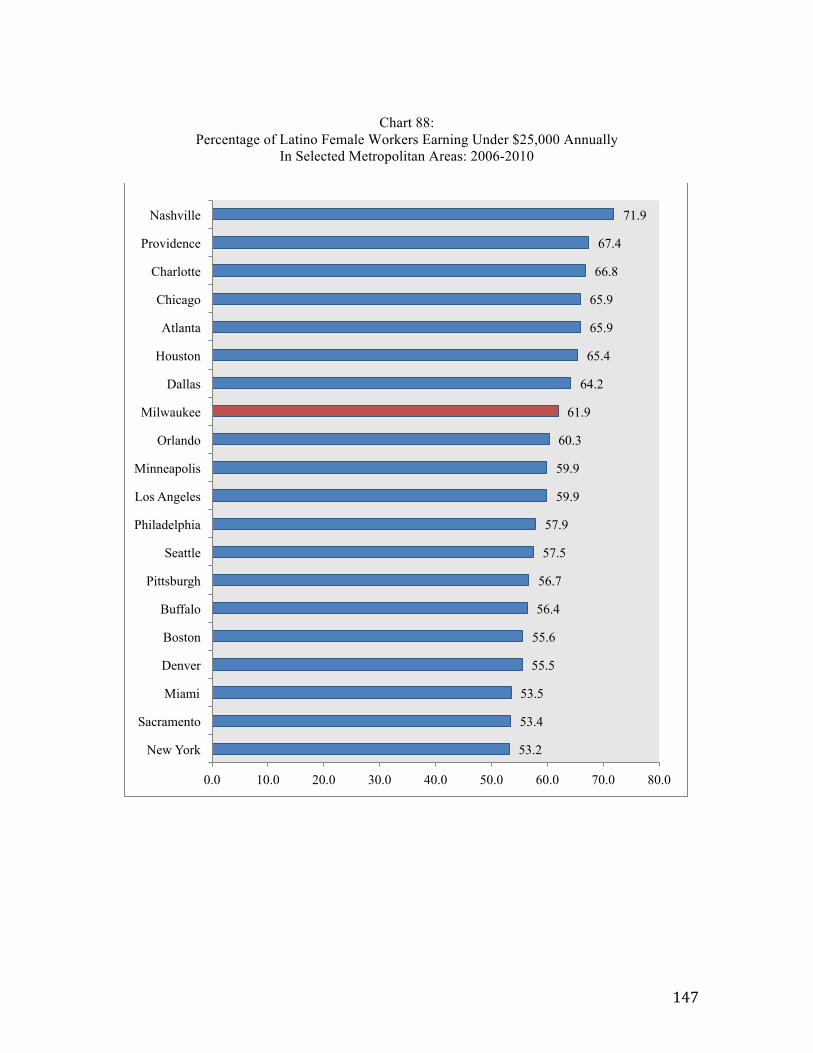
147
Chart 88: Percentage of Latino Female Workers Earning Under $25,000 Annually
In Selected Metropolitan Areas: 2006-2010
53.2
53.4
53.5
55.5
55.6
56.4
56.7
57.5
57.9
59.9
59.9
60.3
61.9
64.2
65.4
65.9
65.9
66.8
67.4
71.9
0.0 10.0 20.0 30.0 40.0 50.0 60.0 70.0 80.0
New York
Sacramento
Miami
Denver
Boston
Buffalo
Pittsburgh
Seattle
Philadelphia
Los Angeles
Minneapolis
Orlando
Milwaukee
Dallas
Houston
Atlanta
Chicago
Charlotte
Providence
Nashville
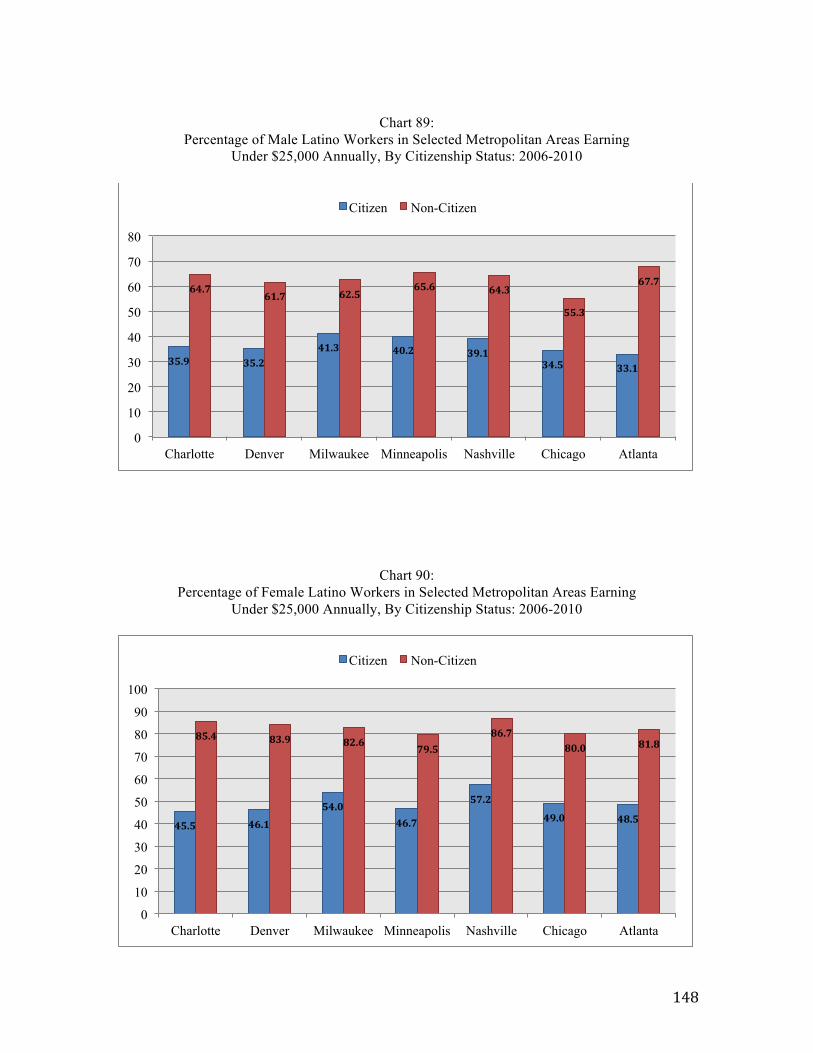
148
Chart 89: Percentage of Male Latino Workers in Selected Metropolitan Areas Earning
Under $25,000 Annually, By Citizenship Status: 2006-2010
Chart 90: Percentage of Female Latino Workers in Selected Metropolitan Areas Earning
Under $25,000 Annually, By Citizenship Status: 2006-2010
35.9 35.2 41.3 40.2 39.1
34.5 33.1
64.7 61.7 62.5
65.6 64.3
55.3
67.7
0
10
20
30
40
50
60
70
80
Charlotte Denver Milwaukee Minneapolis Nashville Chicago Atlanta
Citizen Non-Citizen
45.5 46.1
54.0 46.7
57.2
49.0 48.5
85.4 83.9 82.6 79.5 86.7
80.0 81.8
0
10
20
30
40
50
60
70
80
90
100
Charlotte Denver Milwaukee Minneapolis Nashville Chicago Atlanta
Citizen Non-Citizen
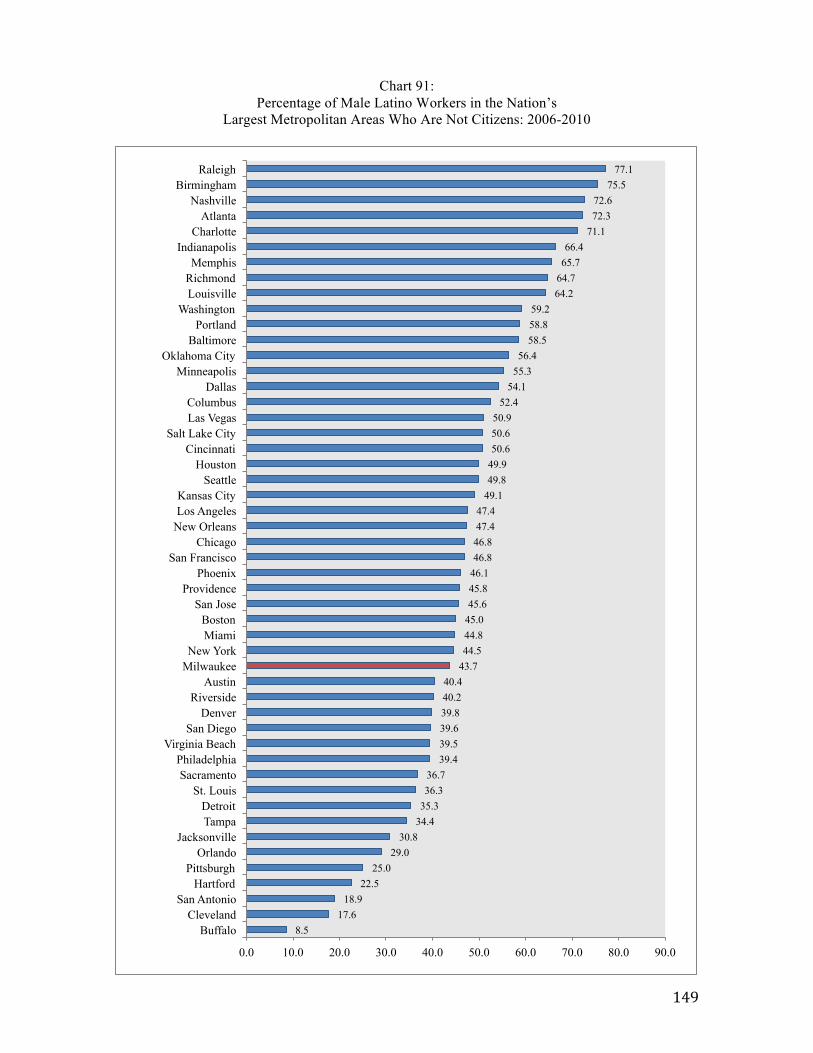
149
Chart 91: Percentage of Male Latino Workers in the Nation’s
Largest Metropolitan Areas Who Are Not Citizens: 2006-2010
8.5 17.6
18.9 22.5
25.0 29.0
30.8 34.4 35.3 36.3 36.7
39.4 39.5 39.6 39.8 40.2 40.4
43.7 44.5 44.8 45.0 45.6 45.8 46.1 46.8 46.8 47.4 47.4
49.1 49.8 49.9 50.6 50.6 50.9
52.4 54.1
55.3 56.4
58.5 58.8 59.2
64.2 64.7 65.7 66.4
71.1 72.3 72.6
75.5 77.1
0.0 10.0 20.0 30.0 40.0 50.0 60.0 70.0 80.0 90.0
Buffalo Cleveland
San Antonio Hartford
Pittsburgh Orlando
Jacksonville Tampa Detroit
St. Louis Sacramento
Philadelphia Virginia Beach
San Diego Denver
Riverside Austin
Milwaukee New York
Miami Boston
San Jose Providence
Phoenix San Francisco
Chicago New Orleans Los Angeles Kansas City
Seattle Houston
Cincinnati Salt Lake City
Las Vegas Columbus
Dallas Minneapolis
Oklahoma City Baltimore
Portland Washington
Louisville Richmond Memphis
Indianapolis Charlotte
Atlanta Nashville
Birmingham Raleigh
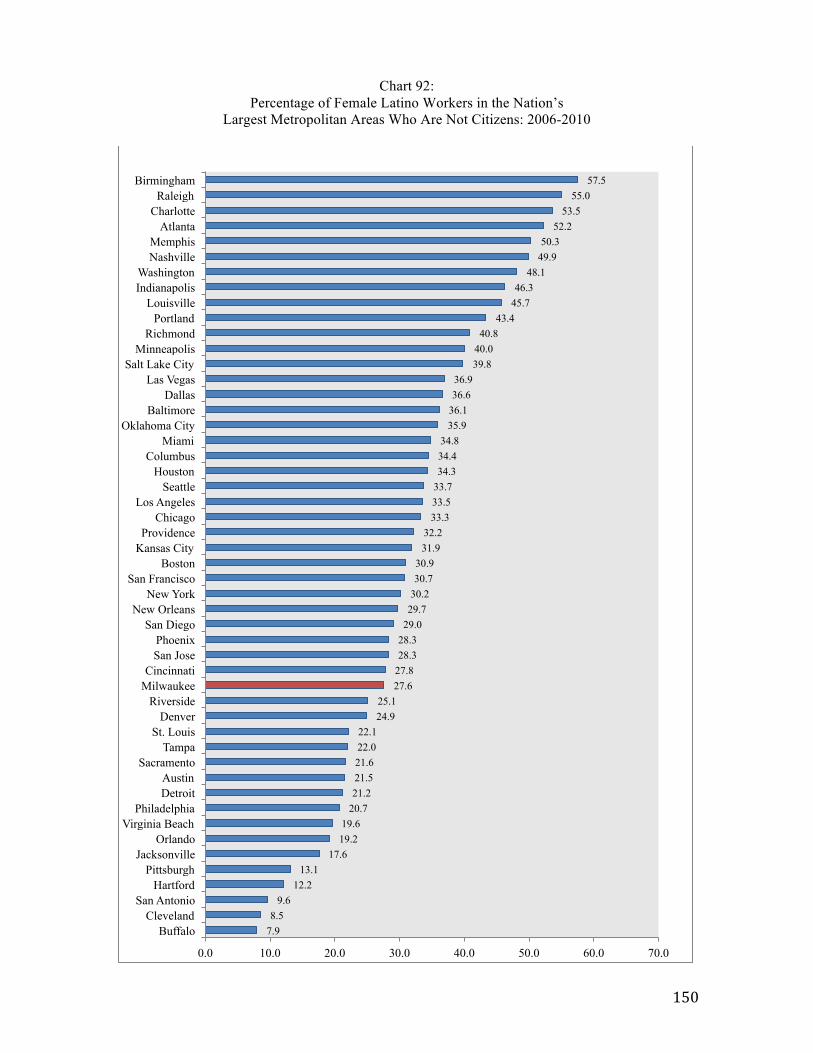
150
Chart 92: Percentage of Female Latino Workers in the Nation’s
Largest Metropolitan Areas Who Are Not Citizens: 2006-2010
7.9 8.5
9.6 12.2
13.1 17.6
19.2 19.6
20.7 21.2 21.5 21.6 22.0 22.1
24.9 25.1
27.6 27.8 28.3 28.3 29.0 29.7 30.2 30.7 30.9
31.9 32.2
33.3 33.5 33.7 34.3 34.4 34.8
35.9 36.1 36.6 36.9
39.8 40.0 40.8
43.4 45.7 46.3
48.1 49.9 50.3
52.2 53.5
55.0 57.5
0.0 10.0 20.0 30.0 40.0 50.0 60.0 70.0
Buffalo Cleveland
San Antonio Hartford
Pittsburgh Jacksonville
Orlando Virginia Beach
Philadelphia Detroit Austin
Sacramento Tampa
St. Louis Denver
Riverside Milwaukee Cincinnati
San Jose Phoenix
San Diego New Orleans
New York San Francisco
Boston Kansas City Providence
Chicago Los Angeles
Seattle Houston
Columbus Miami
Oklahoma City Baltimore
Dallas Las Vegas
Salt Lake City Minneapolis
Richmond Portland
Louisville Indianapolis Washington
Nashville Memphis
Atlanta Charlotte
Raleigh Birmingham
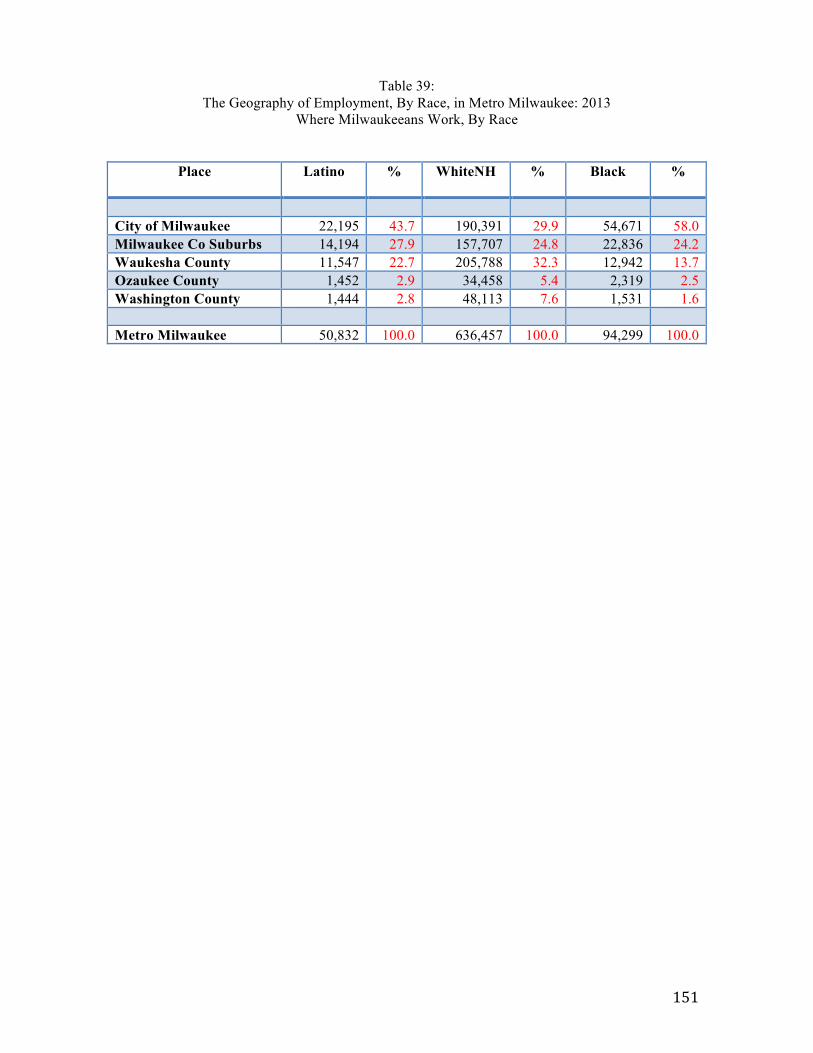
151
Table 39: The Geography of Employment, By Race, in Metro Milwaukee: 2013
Where Milwaukeeans Work, By Race
Place Latino % WhiteNH % Black %
City of Milwaukee 22,195 43.7 190,391 29.9 54,671 58.0 Milwaukee Co Suburbs 14,194 27.9 157,707 24.8 22,836 24.2 Waukesha County 11,547 22.7 205,788 32.3 12,942 13.7 Ozaukee County 1,452 2.9 34,458 5.4 2,319 2.5 Washington County 1,444 2.8 48,113 7.6 1,531 1.6 Metro Milwaukee 50,832 100.0 636,457 100.0 94,299 100.0
152
BUSINESS OWNERSHIP
At first glance, the most recent reliable data on minority business ownership reveal
impressive growth in Hispanic-owned businesses in the Milwaukee metropolitan area.
Between 2007-2012, the number of Hispanic-owned businesses in Milwaukee grew from
2,296 to 4,185 (Table 40). This represents an increase of 82.3 percent in the number of
Latino-owned businesses in the region, the 10th highest rate of increase in Latino business
ownership among the nation’s 50 largest metropolitan areas (Chart 93). The number of
employees working in Hispanic-owned firms in metro Milwaukee grew from 4,748 to
8,213 between 2007-12, an increase of 72.9 percent (which was the 8th highest percentage
increase among the 50 largest metros). (Table 41)
Yet, relative to the size of the metro area’s Latino population, Latino business ownership
in Milwaukee lags significantly behind other large metropolitan areas. In 2007, as Chart 94
shows Milwaukee ranked dead last among the nation’s 50 largest metropolitan areas in the
number of Hispanic-owned businesses per 1,000 Hispanic population, a standard measure
of minority-group business participation. By 2012, although the rate of Latino business
ownership increased in Milwaukee compared to 2007 –as we would expect in light of the
increase in the number of Hispanic-owned firms noted above—Milwaukee’s rate of Latino
ownership per 1,000 population nevertheless remained at the bottom of the nation’s largest
metropolitan areas (Chart 95). The hotbeds of Latino business development remain
established centers of Hispanic enterprise: Miami, Tampa, New York, Houston, Los
Angeles, San Antonio, and Dallas. But Latino enterprise is also percolating in newer
gateway metropolises, places like Orlando, New Orleans, Atlanta, Jacksonville, and
Richmond. All of these metro areas have rates of Latino business ownership at least twice
as high as Milwaukee’s (and in the case of Miami, over six times the rate of Latino
Milwaukee). Indeed, 19 of the nation’s 50 largest metropolitan areas have Hispanic
business ownership rates over twice that of Milwaukee.
(Tables 42-43 and Chart 96) underscore how underdeveloped and marginalized,
compared to other large metro areas, Latino business is in Milwaukee. Although the
Hispanic-owned share of total businesses in metro Milwaukee grew markedly between
2007-2012, it remains a very low 3.6 percent, well below the Hispanic-share of the
region’s population. The percentage of total metro Milwaukee private-sector employment
in Latino-owned firms was even less in 2012: only 1.1 percent. Hispanic-owned businesses

153
in Milwaukee remain small enterprises, generally with few or no employees, and
concentrated in lower value-added sectors of the economy (Table 43). Despite encouraging
growth in Hispanic-owned enterprises in Milwaukee between 2007-2012, the official data
suggest that media accounts, consultant reports, and anecdotes on the explosion of Latino
businesses in Milwaukee have been exaggerated,4 and that Latino business development in
Milwaukee remains very much a “work in progress.”
4 For an example of a story exaggerating the rise in Latino enterprise in Milwaukee, see: “Hispanic-owned business growth in Milwaukee on rise,” Milwaukee Business Journal, 30 October 2015.
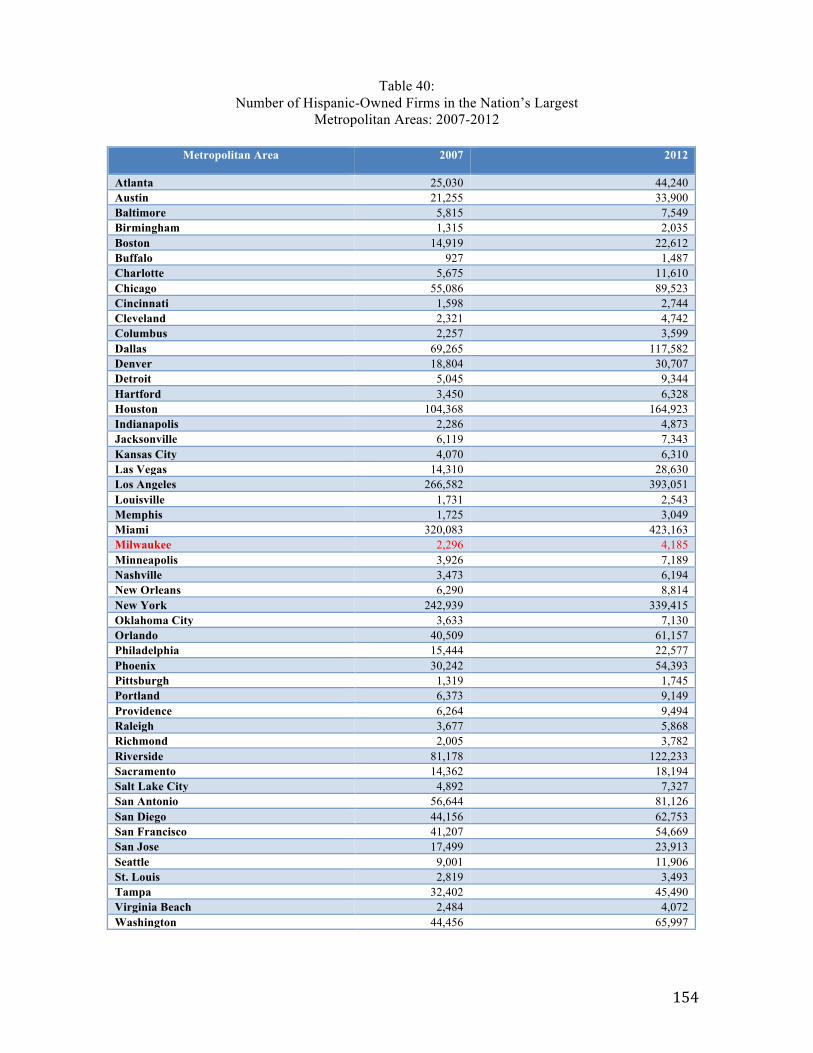
154
Table 40: Number of Hispanic-Owned Firms in the Nation’s Largest
Metropolitan Areas: 2007-2012
Metropolitan Area 2007 2012
Atlanta 25,030 44,240 Austin 21,255 33,900 Baltimore 5,815 7,549 Birmingham 1,315 2,035 Boston 14,919 22,612 Buffalo 927 1,487 Charlotte 5,675 11,610 Chicago 55,086 89,523 Cincinnati 1,598 2,744 Cleveland 2,321 4,742 Columbus 2,257 3,599 Dallas 69,265 117,582 Denver 18,804 30,707 Detroit 5,045 9,344 Hartford 3,450 6,328 Houston 104,368 164,923 Indianapolis 2,286 4,873 Jacksonville 6,119 7,343 Kansas City 4,070 6,310 Las Vegas 14,310 28,630 Los Angeles 266,582 393,051 Louisville 1,731 2,543 Memphis 1,725 3,049 Miami 320,083 423,163 Milwaukee 2,296 4,185 Minneapolis 3,926 7,189 Nashville 3,473 6,194 New Orleans 6,290 8,814 New York 242,939 339,415 Oklahoma City 3,633 7,130 Orlando 40,509 61,157 Philadelphia 15,444 22,577 Phoenix 30,242 54,393 Pittsburgh 1,319 1,745 Portland 6,373 9,149 Providence 6,264 9,494 Raleigh 3,677 5,868 Richmond 2,005 3,782 Riverside 81,178 122,233 Sacramento 14,362 18,194 Salt Lake City 4,892 7,327 San Antonio 56,644 81,126 San Diego 44,156 62,753 San Francisco 41,207 54,669 San Jose 17,499 23,913 Seattle 9,001 11,906 St. Louis 2,819 3,493 Tampa 32,402 45,490 Virginia Beach 2,484 4,072 Washington 44,456 65,997
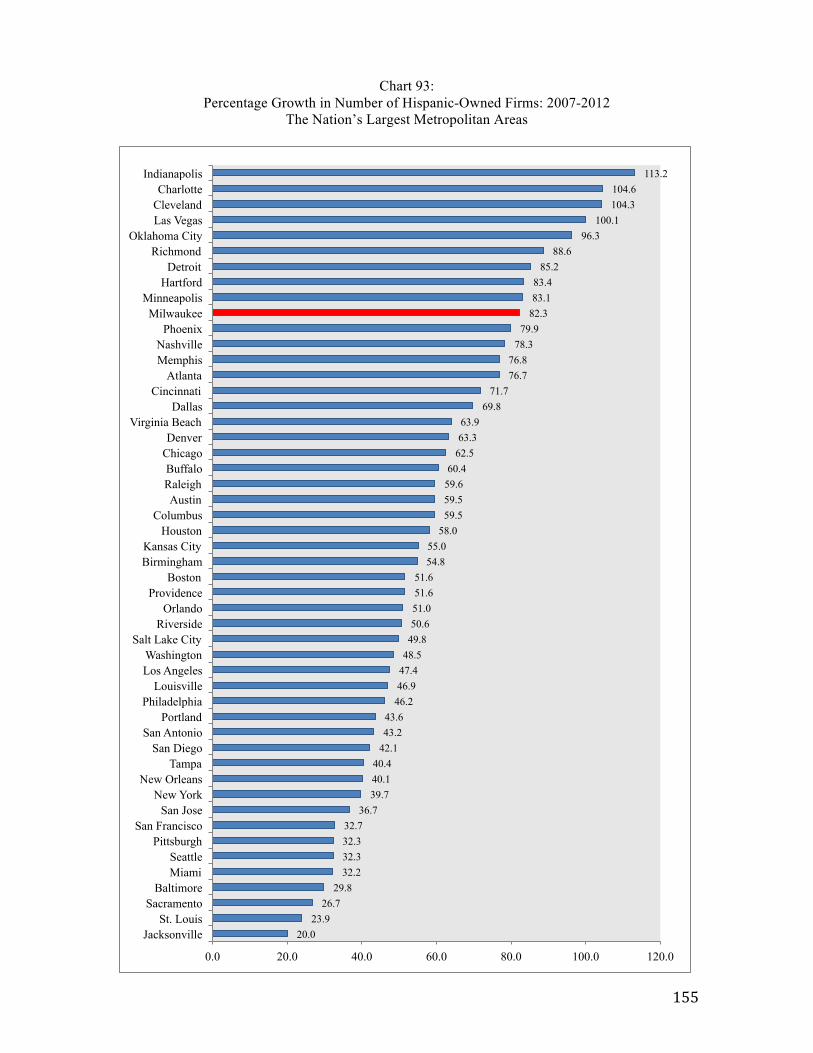
155
Chart 93: Percentage Growth in Number of Hispanic-Owned Firms: 2007-2012
The Nation’s Largest Metropolitan Areas
20.0 23.9
26.7 29.8
32.2 32.3 32.3 32.7
36.7 39.7 40.1 40.4
42.1 43.2 43.6
46.2 46.9 47.4 48.5 49.8 50.6 51.0 51.6 51.6
54.8 55.0
58.0 59.5 59.5 59.6 60.4
62.5 63.3 63.9
69.8 71.7
76.7 76.8
78.3 79.9
82.3 83.1 83.4
85.2 88.6
96.3 100.1
104.3 104.6
113.2
0.0 20.0 40.0 60.0 80.0 100.0 120.0
Jacksonville St. Louis
Sacramento Baltimore
Miami Seattle
Pittsburgh San Francisco
San Jose New York
New Orleans Tampa
San Diego San Antonio
Portland Philadelphia
Louisville Los Angeles Washington
Salt Lake City Riverside
Orlando Providence
Boston Birmingham Kansas City
Houston Columbus
Austin Raleigh Buffalo
Chicago Denver
Virginia Beach Dallas
Cincinnati Atlanta
Memphis Nashville
Phoenix Milwaukee
Minneapolis Hartford
Detroit Richmond
Oklahoma City Las Vegas Cleveland Charlotte
Indianapolis
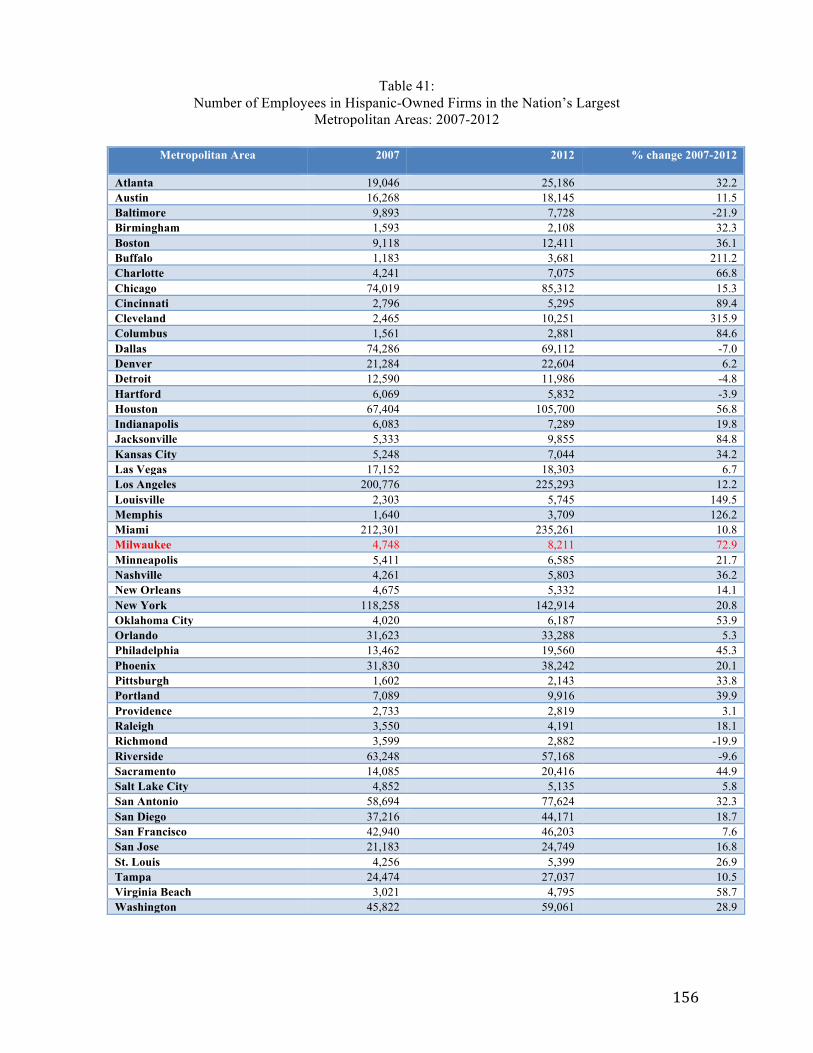
156
Table 41: Number of Employees in Hispanic-Owned Firms in the Nation’s Largest
Metropolitan Areas: 2007-2012
Metropolitan Area 2007 2012 % change 2007-2012
Atlanta 19,046 25,186 32.2 Austin 16,268 18,145 11.5 Baltimore 9,893 7,728 -21.9 Birmingham 1,593 2,108 32.3 Boston 9,118 12,411 36.1 Buffalo 1,183 3,681 211.2 Charlotte 4,241 7,075 66.8 Chicago 74,019 85,312 15.3 Cincinnati 2,796 5,295 89.4 Cleveland 2,465 10,251 315.9 Columbus 1,561 2,881 84.6 Dallas 74,286 69,112 -7.0 Denver 21,284 22,604 6.2 Detroit 12,590 11,986 -4.8 Hartford 6,069 5,832 -3.9 Houston 67,404 105,700 56.8 Indianapolis 6,083 7,289 19.8 Jacksonville 5,333 9,855 84.8 Kansas City 5,248 7,044 34.2 Las Vegas 17,152 18,303 6.7 Los Angeles 200,776 225,293 12.2 Louisville 2,303 5,745 149.5 Memphis 1,640 3,709 126.2 Miami 212,301 235,261 10.8 Milwaukee 4,748 8,211 72.9 Minneapolis 5,411 6,585 21.7 Nashville 4,261 5,803 36.2 New Orleans 4,675 5,332 14.1 New York 118,258 142,914 20.8 Oklahoma City 4,020 6,187 53.9 Orlando 31,623 33,288 5.3 Philadelphia 13,462 19,560 45.3 Phoenix 31,830 38,242 20.1 Pittsburgh 1,602 2,143 33.8 Portland 7,089 9,916 39.9 Providence 2,733 2,819 3.1 Raleigh 3,550 4,191 18.1 Richmond 3,599 2,882 -19.9 Riverside 63,248 57,168 -9.6 Sacramento 14,085 20,416 44.9 Salt Lake City 4,852 5,135 5.8 San Antonio 58,694 77,624 32.3 San Diego 37,216 44,171 18.7 San Francisco 42,940 46,203 7.6 San Jose 21,183 24,749 16.8 St. Louis 4,256 5,399 26.9 Tampa 24,474 27,037 10.5 Virginia Beach 3,021 4,795 58.7 Washington 45,822 59,061 28.9
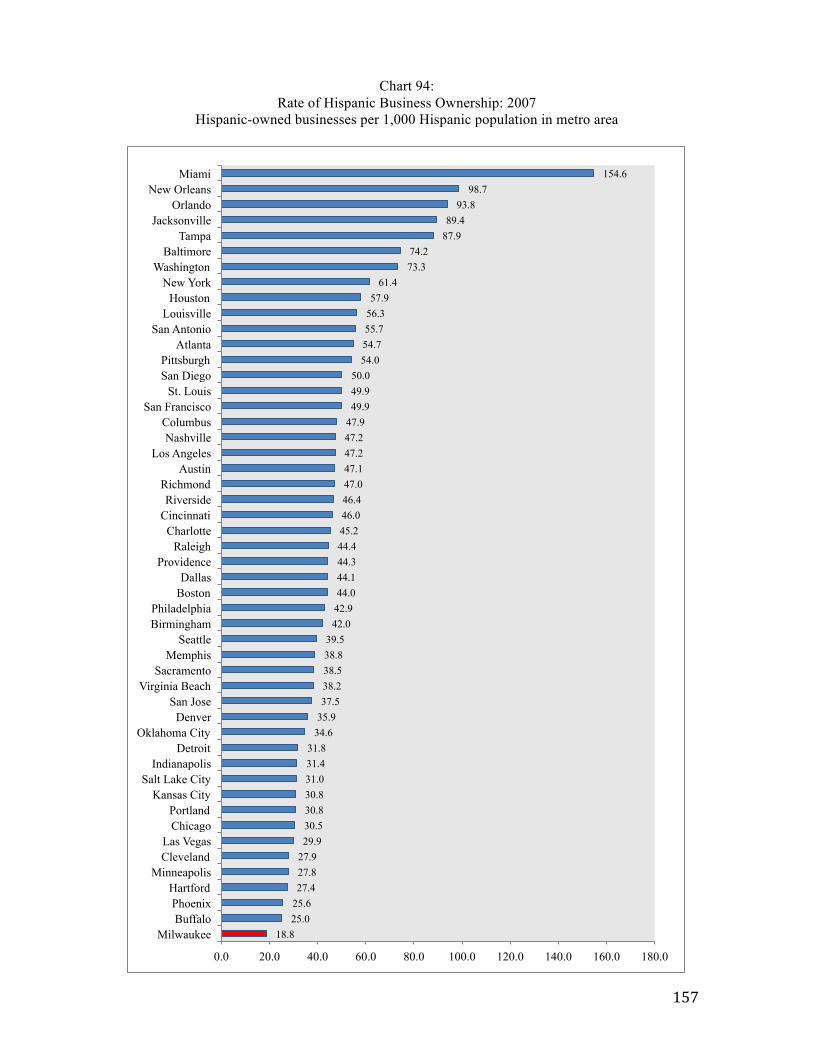
157
Chart 94: Rate of Hispanic Business Ownership: 2007
Hispanic-owned businesses per 1,000 Hispanic population in metro area
18.8 25.0 25.6 27.4 27.8 27.9 29.9 30.5 30.8 30.8 31.0 31.4 31.8
34.6 35.9 37.5 38.2 38.5 38.8 39.5
42.0 42.9 44.0 44.1 44.3 44.4 45.2 46.0 46.4 47.0 47.1 47.2 47.2 47.9 49.9 49.9 50.0
54.0 54.7 55.7 56.3 57.9
61.4 73.3 74.2
87.9 89.4
93.8 98.7
154.6
0.0 20.0 40.0 60.0 80.0 100.0 120.0 140.0 160.0 180.0
Milwaukee Buffalo Phoenix Hartford
Minneapolis Cleveland Las Vegas
Chicago Portland
Kansas City Salt Lake City
Indianapolis Detroit
Oklahoma City Denver
San Jose Virginia Beach
Sacramento Memphis
Seattle Birmingham Philadelphia
Boston Dallas
Providence Raleigh
Charlotte Cincinnati Riverside
Richmond Austin
Los Angeles Nashville
Columbus San Francisco
St. Louis San Diego Pittsburgh
Atlanta San Antonio
Louisville Houston
New York Washington
Baltimore Tampa
Jacksonville Orlando
New Orleans Miami
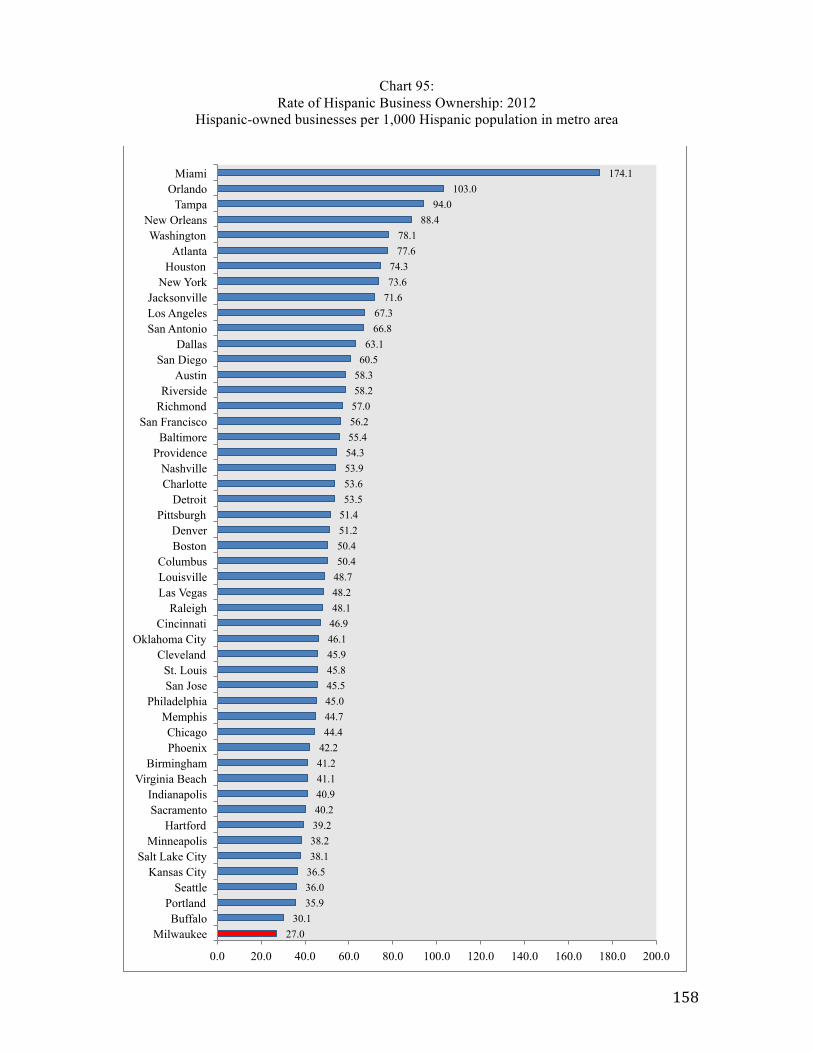
158
Chart 95: Rate of Hispanic Business Ownership: 2012
Hispanic-owned businesses per 1,000 Hispanic population in metro area
27.0 30.1
35.9 36.0 36.5 38.1 38.2 39.2 40.2 40.9 41.1 41.2 42.2 44.4 44.7 45.0 45.5 45.8 45.9 46.1 46.9 48.1 48.2 48.7 50.4 50.4 51.2 51.4 53.5 53.6 53.9 54.3 55.4 56.2 57.0 58.2 58.3 60.5
63.1 66.8 67.3
71.6 73.6 74.3
77.6 78.1
88.4 94.0
103.0 174.1
0.0 20.0 40.0 60.0 80.0 100.0 120.0 140.0 160.0 180.0 200.0
Milwaukee Buffalo
Portland Seattle
Kansas City Salt Lake City
Minneapolis Hartford
Sacramento Indianapolis
Virginia Beach Birmingham
Phoenix Chicago
Memphis Philadelphia
San Jose St. Louis
Cleveland Oklahoma City
Cincinnati Raleigh
Las Vegas Louisville Columbus
Boston Denver
Pittsburgh Detroit
Charlotte Nashville
Providence Baltimore
San Francisco Richmond Riverside
Austin San Diego
Dallas San Antonio Los Angeles Jacksonville
New York Houston
Atlanta Washington
New Orleans Tampa
Orlando Miami
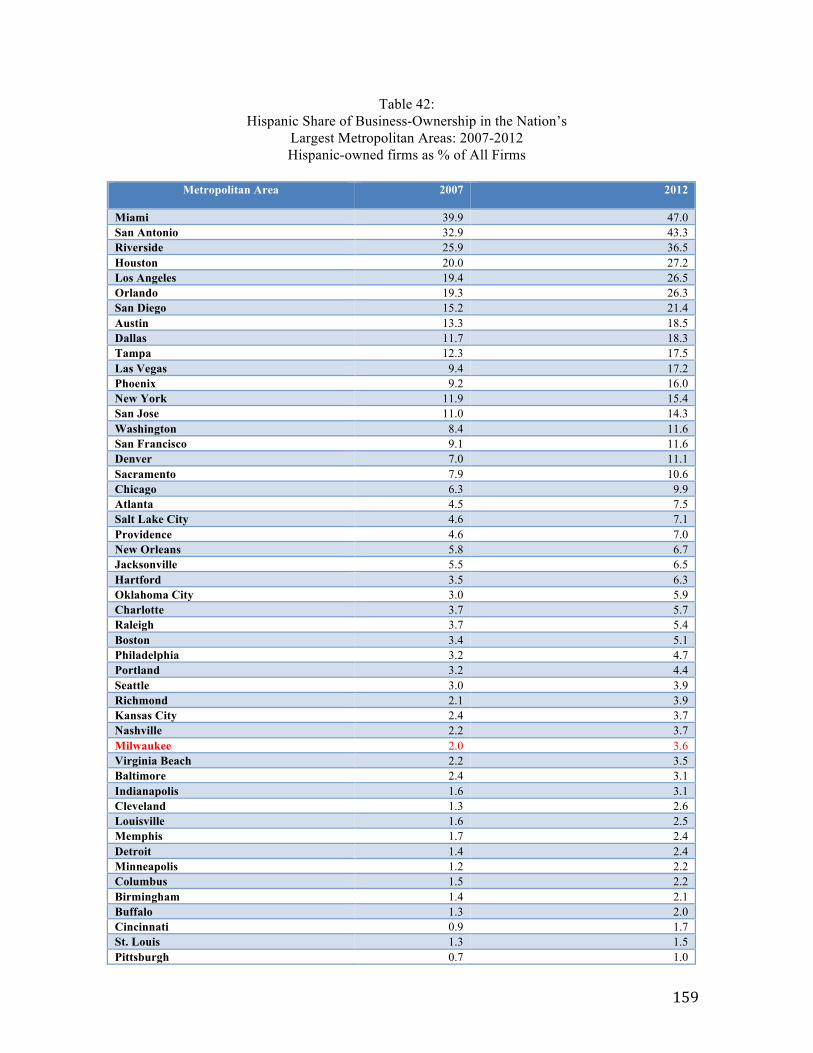
159
Table 42:
Hispanic Share of Business-Ownership in the Nation’s Largest Metropolitan Areas: 2007-2012 Hispanic-owned firms as % of All Firms
Metropolitan Area 2007 2012
Miami 39.9 47.0 San Antonio 32.9 43.3 Riverside 25.9 36.5 Houston 20.0 27.2 Los Angeles 19.4 26.5 Orlando 19.3 26.3 San Diego 15.2 21.4 Austin 13.3 18.5 Dallas 11.7 18.3 Tampa 12.3 17.5 Las Vegas 9.4 17.2 Phoenix 9.2 16.0 New York 11.9 15.4 San Jose 11.0 14.3 Washington 8.4 11.6 San Francisco 9.1 11.6 Denver 7.0 11.1 Sacramento 7.9 10.6 Chicago 6.3 9.9 Atlanta 4.5 7.5 Salt Lake City 4.6 7.1 Providence 4.6 7.0 New Orleans 5.8 6.7 Jacksonville 5.5 6.5 Hartford 3.5 6.3 Oklahoma City 3.0 5.9 Charlotte 3.7 5.7 Raleigh 3.7 5.4 Boston 3.4 5.1 Philadelphia 3.2 4.7 Portland 3.2 4.4 Seattle 3.0 3.9 Richmond 2.1 3.9 Kansas City 2.4 3.7 Nashville 2.2 3.7 Milwaukee 2.0 3.6 Virginia Beach 2.2 3.5 Baltimore 2.4 3.1 Indianapolis 1.6 3.1 Cleveland 1.3 2.6 Louisville 1.6 2.5 Memphis 1.7 2.4 Detroit 1.4 2.4 Minneapolis 1.2 2.2 Columbus 1.5 2.2 Birmingham 1.4 2.1 Buffalo 1.3 2.0 Cincinnati 0.9 1.7 St. Louis 1.3 1.5 Pittsburgh 0.7 1.0
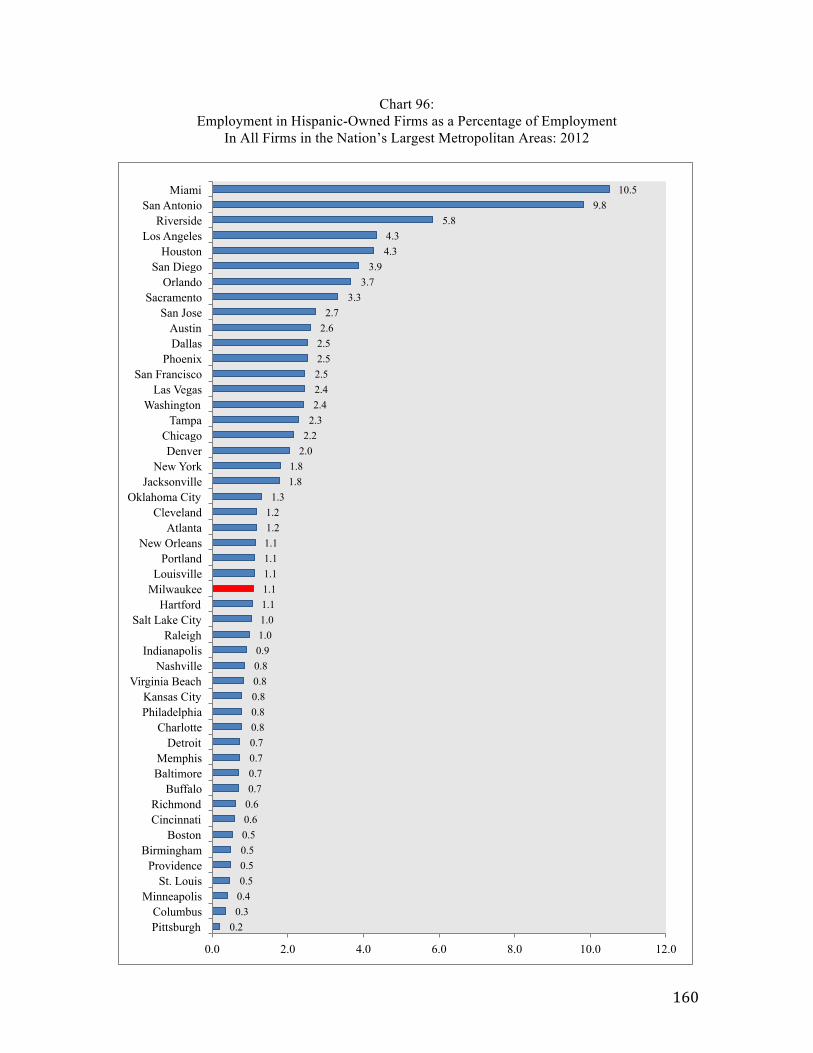
160
Chart 96:
Employment in Hispanic-Owned Firms as a Percentage of Employment In All Firms in the Nation’s Largest Metropolitan Areas: 2012
0.2 0.3 0.4 0.5 0.5 0.5 0.5 0.6 0.6 0.7 0.7 0.7 0.7 0.8 0.8 0.8 0.8 0.8 0.9 1.0 1.0 1.1 1.1 1.1 1.1 1.1 1.2 1.2 1.3
1.8 1.8
2.0 2.2
2.3 2.4 2.4 2.5 2.5 2.5 2.6 2.7
3.3 3.7
3.9 4.3 4.3
5.8 9.8
10.5
0.0 2.0 4.0 6.0 8.0 10.0 12.0
Pittsburgh Columbus
Minneapolis St. Louis
Providence Birmingham
Boston Cincinnati Richmond
Buffalo Baltimore Memphis
Detroit Charlotte
Philadelphia Kansas City
Virginia Beach Nashville
Indianapolis Raleigh
Salt Lake City Hartford
Milwaukee Louisville
Portland New Orleans
Atlanta Cleveland
Oklahoma City Jacksonville
New York Denver
Chicago Tampa
Washington Las Vegas
San Francisco Phoenix
Dallas Austin
San Jose Sacramento
Orlando San Diego
Houston Los Angeles
Riverside San Antonio
Miami
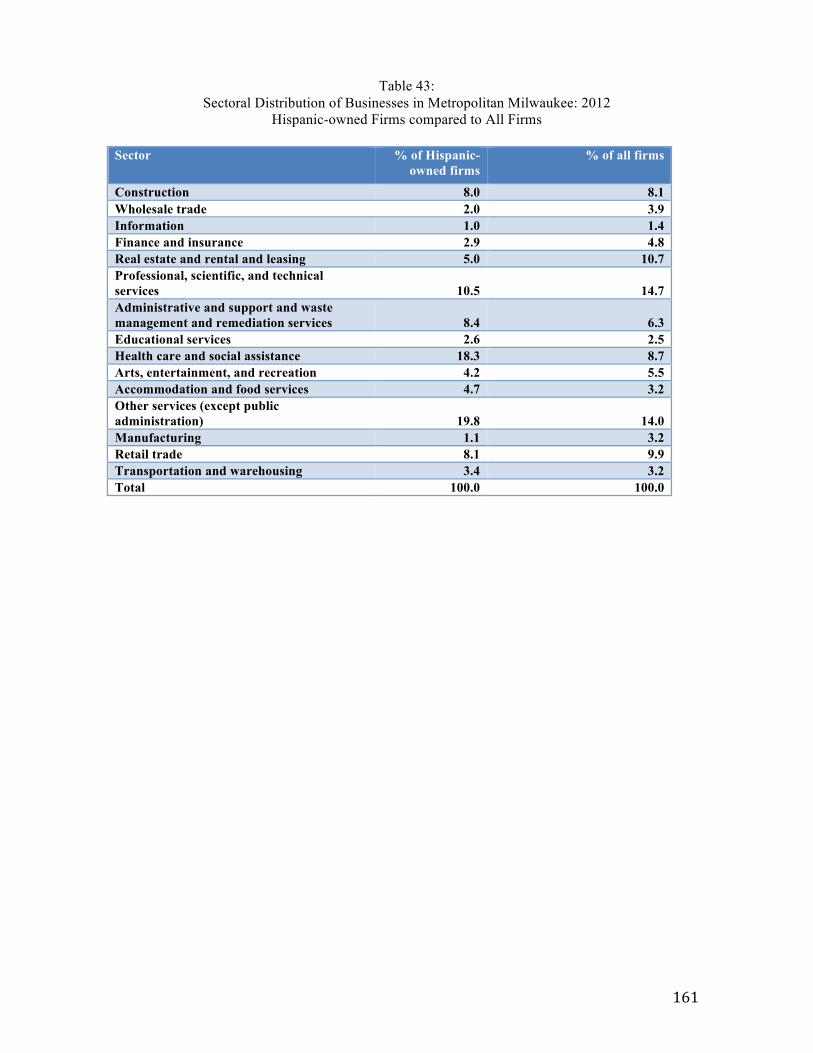
161
Table 43: Sectoral Distribution of Businesses in Metropolitan Milwaukee: 2012
Hispanic-owned Firms compared to All Firms
Sector % of Hispanic-owned firms
% of all firms
Construction 8.0 8.1 Wholesale trade 2.0 3.9 Information 1.0 1.4 Finance and insurance 2.9 4.8 Real estate and rental and leasing 5.0 10.7 Professional, scientific, and technical services 10.5 14.7 Administrative and support and waste management and remediation services 8.4 6.3 Educational services 2.6 2.5 Health care and social assistance 18.3 8.7 Arts, entertainment, and recreation 4.2 5.5 Accommodation and food services 4.7 3.2 Other services (except public administration) 19.8 14.0 Manufacturing 1.1 3.2 Retail trade 8.1 9.9 Transportation and warehousing 3.4 3.2 Total 100.0 100.0
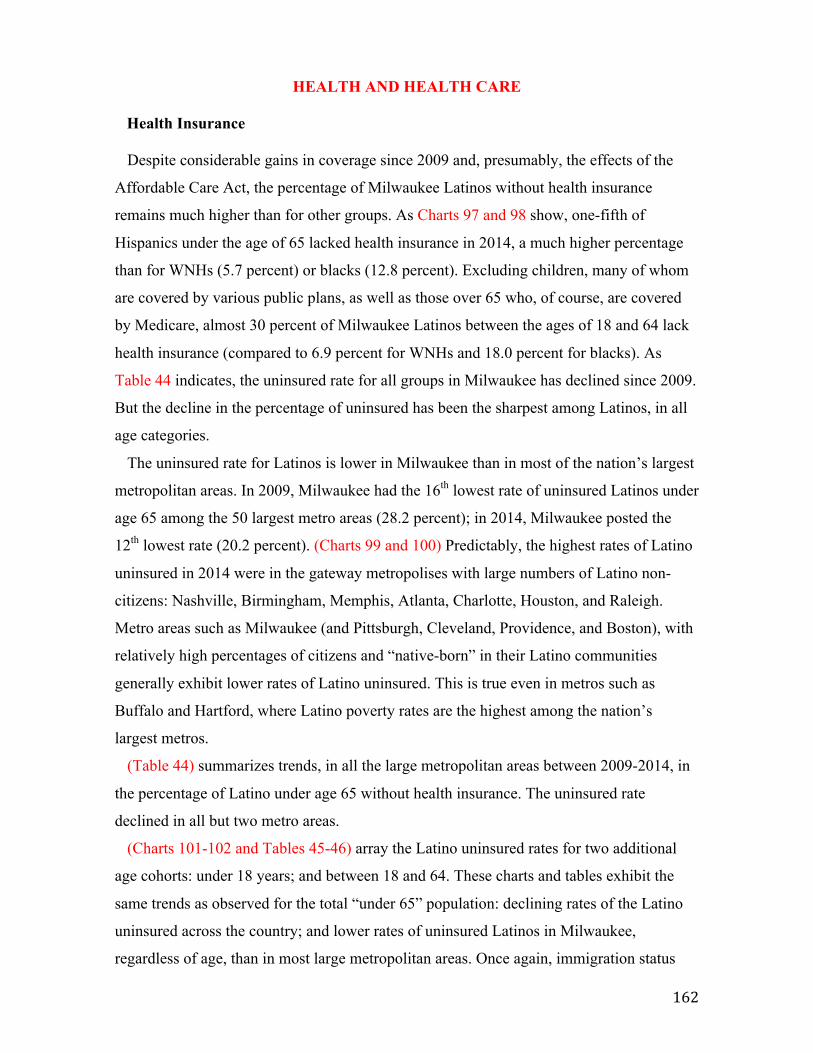
162
HEALTH AND HEALTH CARE
Health Insurance
Despite considerable gains in coverage since 2009 and, presumably, the effects of the
Affordable Care Act, the percentage of Milwaukee Latinos without health insurance
remains much higher than for other groups. As Charts 97 and 98 show, one-fifth of
Hispanics under the age of 65 lacked health insurance in 2014, a much higher percentage
than for WNHs (5.7 percent) or blacks (12.8 percent). Excluding children, many of whom
are covered by various public plans, as well as those over 65 who, of course, are covered
by Medicare, almost 30 percent of Milwaukee Latinos between the ages of 18 and 64 lack
health insurance (compared to 6.9 percent for WNHs and 18.0 percent for blacks). As
Table 44 indicates, the uninsured rate for all groups in Milwaukee has declined since 2009.
But the decline in the percentage of uninsured has been the sharpest among Latinos, in all
age categories.
The uninsured rate for Latinos is lower in Milwaukee than in most of the nation’s largest
metropolitan areas. In 2009, Milwaukee had the 16th lowest rate of uninsured Latinos under
age 65 among the 50 largest metro areas (28.2 percent); in 2014, Milwaukee posted the
12th lowest rate (20.2 percent). (Charts 99 and 100) Predictably, the highest rates of Latino
uninsured in 2014 were in the gateway metropolises with large numbers of Latino non-
citizens: Nashville, Birmingham, Memphis, Atlanta, Charlotte, Houston, and Raleigh.
Metro areas such as Milwaukee (and Pittsburgh, Cleveland, Providence, and Boston), with
relatively high percentages of citizens and “native-born” in their Latino communities
generally exhibit lower rates of Latino uninsured. This is true even in metros such as
Buffalo and Hartford, where Latino poverty rates are the highest among the nation’s
largest metros.
(Table 44) summarizes trends, in all the large metropolitan areas between 2009-2014, in
the percentage of Latino under age 65 without health insurance. The uninsured rate
declined in all but two metro areas.
(Charts 101-102 and Tables 45-46) array the Latino uninsured rates for two additional
age cohorts: under 18 years; and between 18 and 64. These charts and tables exhibit the
same trends as observed for the total “under 65” population: declining rates of the Latino
uninsured across the country; and lower rates of uninsured Latinos in Milwaukee,
regardless of age, than in most large metropolitan areas. Once again, immigration status
163
and citizenship appear to be the key variables in explaining differences between metro
areas in the rate of Latinos without health insurance. New immigration magnets like
Birmingham, Atlanta, Memphis, Nashville, and Charlotte lead the way in uninsured
Latinos, in all age categories. In 2014, over 50 percent of Latinos between ages 18 and 64
were without health insurance in those metropolitan areas. By contrast, in metros with
larger “citizen” Latino populations, such as Boston, Buffalo, and Hartford, the uninsured
percentage was much lower, under 15 percent in all those cases for the 18-64 age cohort. In
Milwaukee, the rate in 2014 was 29.6 percent.
Health Indicators
(Charts 103-113) present data on several indicators of the health of Latino Milwaukee.
We compare health outcomes for Milwaukee Latinos to other metropolitan areas and to
other groups in metro Milwaukee, on indicators such as: mortality rates from heart disease;
infant mortality rates; teenage mothers; and low birthweight babies. These data are
available at the county level, so for most charts we present data on the central counties of
the nation’s 50 largest metropolitan areas.
• Latino Milwaukee ranks towards the middle (27th among the 50 largest metros)
on mortality rates from heart disease (Chart 103). In Milwaukee itself, the Latino
mortality rate from heart disease is substantially below the black and WNH rates
(Chart 104).
• The infant mortality rate of Latinos in Milwaukee County ranks 13th among the
central counties of the nation’s 50 largest metropolitan areas (Chart 105). In
Milwaukee County, the Latino infant mortality rate is slightly higher than the
WNH rate, and less than half the rate for African Americans (Chart 106). This
chart also presents data on non-Hispanic whites in Waukesha County, whose rate
is lower than the WNH rate in Milwaukee.
• Metro Milwaukee ranks 15th among the nation’s 50 largest metropolitan areas in
the percentage of all births among Latinos to teenage mothers (Chart 107). (Note:
for this indicator, we were able to aggregate all counties in metro areas create a
metropolitan area statistic). In Milwaukee County, the Latino teen birth
percentage is four times as high as the WNH percentage, but lower than the
figure for African Americans (Chart 108). The rates for all groups are lower in

164
Waukesha County (Chart 109), although the number of Latinos and African
Americans living in Waukesha County is, as we know, relatively small.
• (Charts 110-111) show the trend in teen births for Latinos, WNH, and blacks in
Milwaukee County between 2009-2013, and for Latinos and non-Hispanic whites
in Waukesha County during those years. The percentage of births to teenage
mothers for all groups, in both jurisdictions, has declined markedly since 2009.
• (Charts 112-113) compares the percentage of low birthweight babies for all
groups in Milwaukee and Waukesha counties. In both jurisdictions, the Latino
percentage is comparable to the WNH figure, and half the percentage for African
Americans.
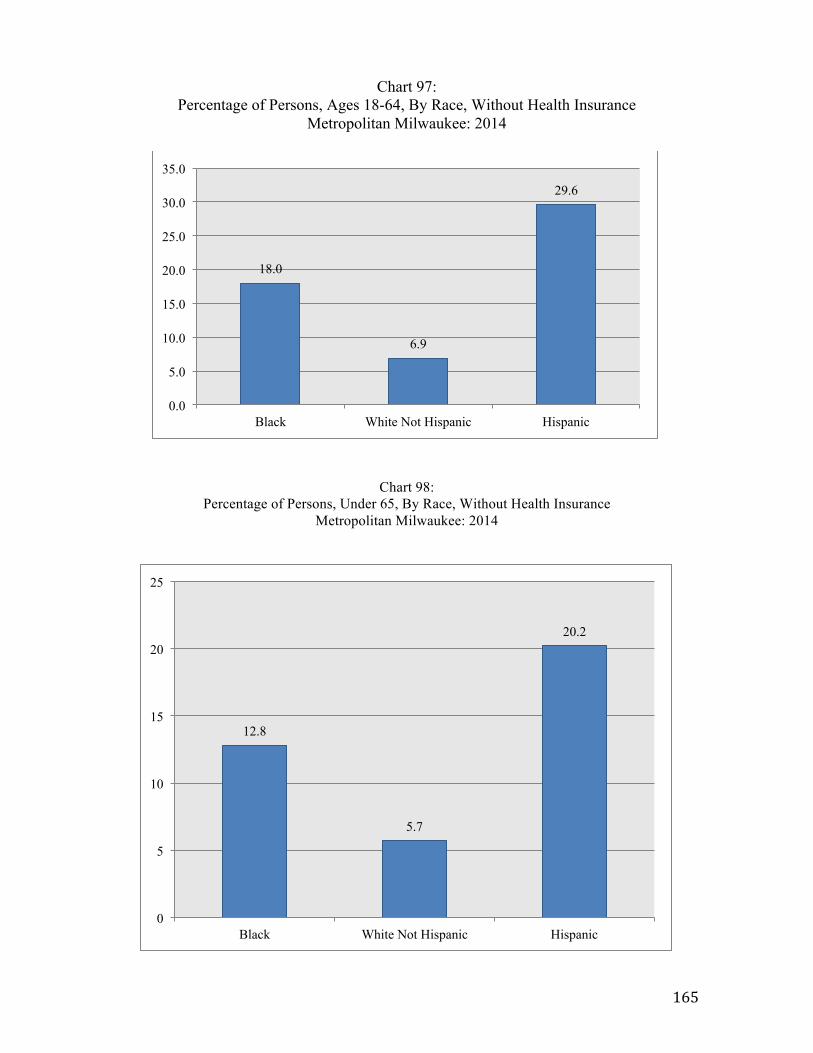
165
Chart 97: Percentage of Persons, Ages 18-64, By Race, Without Health Insurance
Metropolitan Milwaukee: 2014
Chart 98: Percentage of Persons, Under 65, By Race, Without Health Insurance
Metropolitan Milwaukee: 2014
18.0
6.9
29.6
0.0
5.0
10.0
15.0
20.0
25.0
30.0
35.0
Black White Not Hispanic Hispanic
12.8
5.7
20.2
0
5
10
15
20
25
Black White Not Hispanic Hispanic
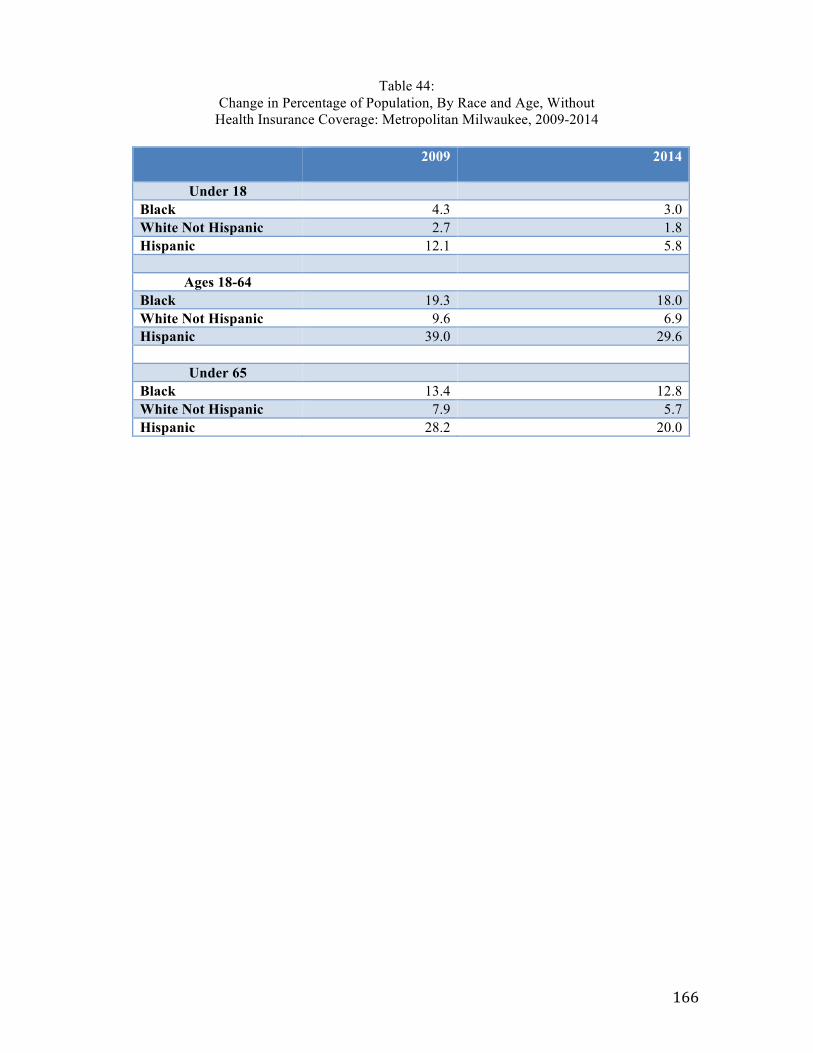
166
Table 44: Change in Percentage of Population, By Race and Age, Without
Health Insurance Coverage: Metropolitan Milwaukee, 2009-2014
2009 2014
Under 18 Black 4.3 3.0 White Not Hispanic 2.7 1.8 Hispanic 12.1 5.8
Ages 18-64 Black 19.3 18.0 White Not Hispanic 9.6 6.9 Hispanic 39.0 29.6
Under 65 Black 13.4 12.8 White Not Hispanic 7.9 5.7 Hispanic 28.2 20.0
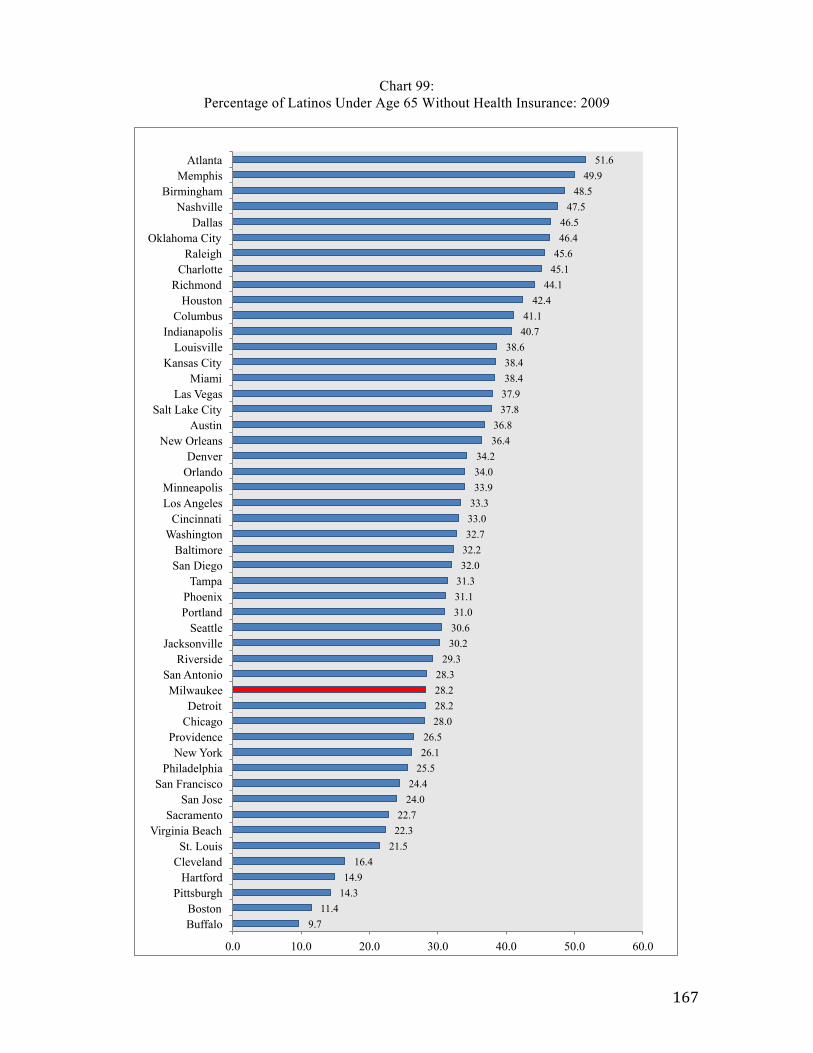
167
Chart 99: Percentage of Latinos Under Age 65 Without Health Insurance: 2009
9.7 11.4
14.3 14.9
16.4 21.5
22.3 22.7
24.0 24.4
25.5 26.1 26.5
28.0 28.2 28.2 28.3
29.3 30.2 30.6 31.0 31.1 31.3 32.0 32.2 32.7 33.0 33.3 33.9 34.0 34.2
36.4 36.8
37.8 37.9 38.4 38.4 38.6
40.7 41.1
42.4 44.1
45.1 45.6 46.4 46.5
47.5 48.5
49.9 51.6
0.0 10.0 20.0 30.0 40.0 50.0 60.0
Buffalo Boston
Pittsburgh Hartford
Cleveland St. Louis
Virginia Beach Sacramento
San Jose San Francisco
Philadelphia New York
Providence Chicago Detroit
Milwaukee San Antonio
Riverside Jacksonville
Seattle Portland Phoenix
Tampa San Diego Baltimore
Washington Cincinnati
Los Angeles Minneapolis
Orlando Denver
New Orleans Austin
Salt Lake City Las Vegas
Miami Kansas City
Louisville Indianapolis
Columbus Houston
Richmond Charlotte
Raleigh Oklahoma City
Dallas Nashville
Birmingham Memphis
Atlanta
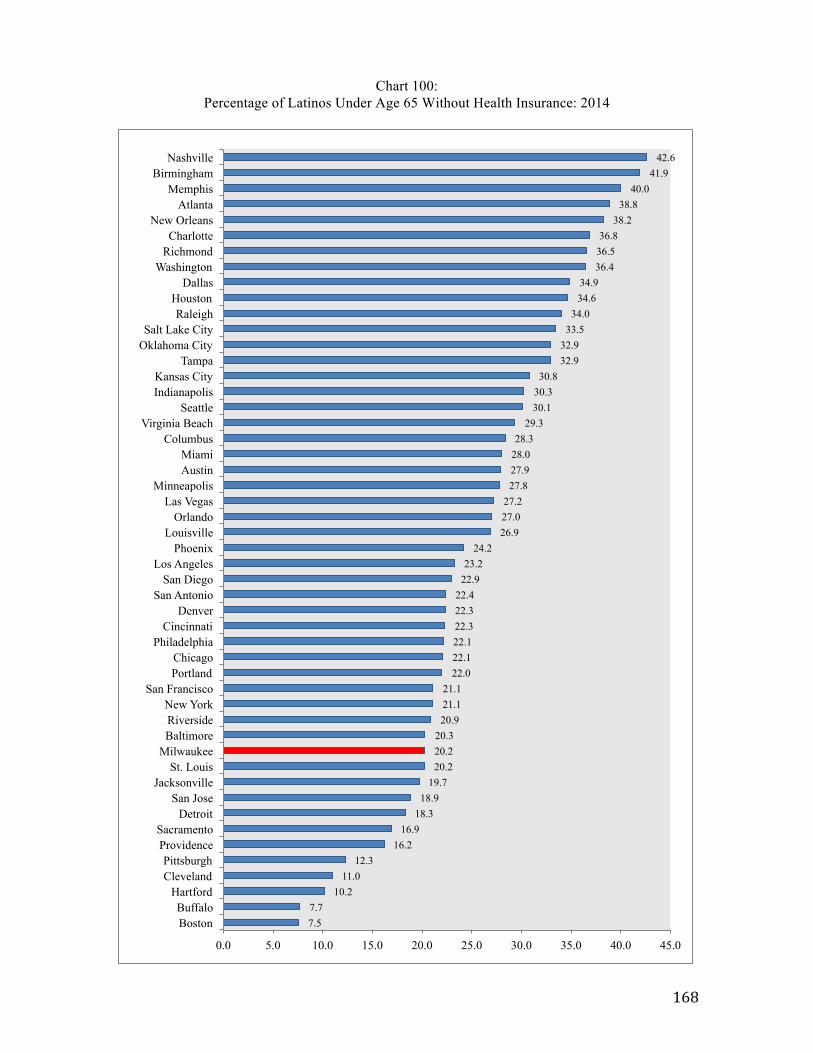
168
Chart 100: Percentage of Latinos Under Age 65 Without Health Insurance: 2014
7.5 7.7
10.2 11.0
12.3 16.2
16.9 18.3
18.9 19.7
20.2 20.2 20.3
20.9 21.1 21.1
22.0 22.1 22.1 22.3 22.3 22.4
22.9 23.2
24.2 26.9 27.0 27.2
27.8 27.9 28.0 28.3
29.3 30.1 30.3 30.8
32.9 32.9
33.5 34.0
34.6 34.9
36.4 36.5 36.8
38.2 38.8
40.0 41.9
42.6
0.0 5.0 10.0 15.0 20.0 25.0 30.0 35.0 40.0 45.0
Boston Buffalo
Hartford Cleveland Pittsburgh
Providence Sacramento
Detroit San Jose
Jacksonville St. Louis
Milwaukee Baltimore Riverside New York
San Francisco Portland Chicago
Philadelphia Cincinnati
Denver San Antonio
San Diego Los Angeles
Phoenix Louisville
Orlando Las Vegas
Minneapolis Austin Miami
Columbus Virginia Beach
Seattle Indianapolis Kansas City
Tampa Oklahoma City Salt Lake City
Raleigh Houston
Dallas Washington
Richmond Charlotte
New Orleans Atlanta
Memphis Birmingham
Nashville
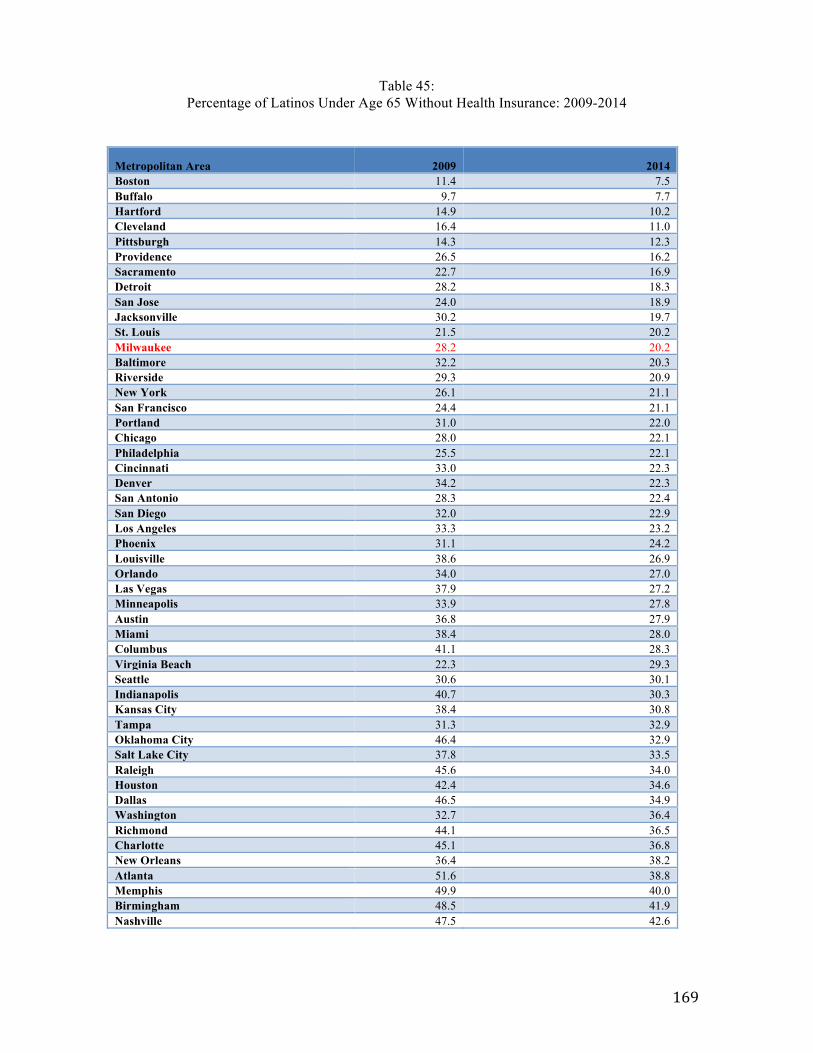
169
Table 45: Percentage of Latinos Under Age 65 Without Health Insurance: 2009-2014
Metropolitan Area 2009 2014 Boston 11.4 7.5 Buffalo 9.7 7.7 Hartford 14.9 10.2 Cleveland 16.4 11.0 Pittsburgh 14.3 12.3 Providence 26.5 16.2 Sacramento 22.7 16.9 Detroit 28.2 18.3 San Jose 24.0 18.9 Jacksonville 30.2 19.7 St. Louis 21.5 20.2 Milwaukee 28.2 20.2 Baltimore 32.2 20.3 Riverside 29.3 20.9 New York 26.1 21.1 San Francisco 24.4 21.1 Portland 31.0 22.0 Chicago 28.0 22.1 Philadelphia 25.5 22.1 Cincinnati 33.0 22.3 Denver 34.2 22.3 San Antonio 28.3 22.4 San Diego 32.0 22.9 Los Angeles 33.3 23.2 Phoenix 31.1 24.2 Louisville 38.6 26.9 Orlando 34.0 27.0 Las Vegas 37.9 27.2 Minneapolis 33.9 27.8 Austin 36.8 27.9 Miami 38.4 28.0 Columbus 41.1 28.3 Virginia Beach 22.3 29.3 Seattle 30.6 30.1 Indianapolis 40.7 30.3 Kansas City 38.4 30.8 Tampa 31.3 32.9 Oklahoma City 46.4 32.9 Salt Lake City 37.8 33.5 Raleigh 45.6 34.0 Houston 42.4 34.6 Dallas 46.5 34.9 Washington 32.7 36.4 Richmond 44.1 36.5 Charlotte 45.1 36.8 New Orleans 36.4 38.2 Atlanta 51.6 38.8 Memphis 49.9 40.0 Birmingham 48.5 41.9 Nashville 47.5 42.6
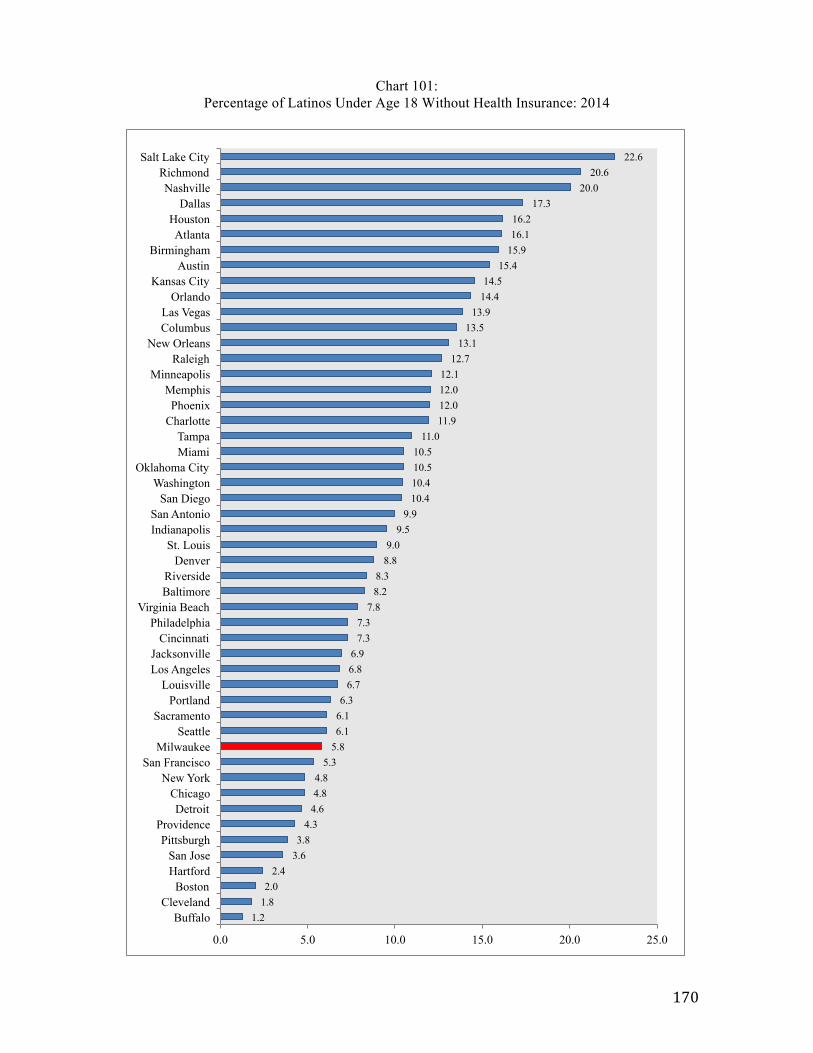
170
Chart 101: Percentage of Latinos Under Age 18 Without Health Insurance: 2014
1.2 1.8 2.0
2.4 3.6 3.8
4.3 4.6 4.8 4.8
5.3 5.8 6.1 6.1 6.3
6.7 6.8 6.9
7.3 7.3
7.8 8.2 8.3
8.8 9.0
9.5 9.9
10.4 10.4 10.5 10.5
11.0 11.9 12.0 12.0 12.1
12.7 13.1
13.5 13.9
14.4 14.5
15.4 15.9 16.1 16.2
17.3 20.0
20.6 22.6
0.0 5.0 10.0 15.0 20.0 25.0
Buffalo Cleveland
Boston Hartford San Jose
Pittsburgh Providence
Detroit Chicago
New York San Francisco
Milwaukee Seattle
Sacramento Portland
Louisville Los Angeles Jacksonville
Cincinnati Philadelphia
Virginia Beach Baltimore Riverside
Denver St. Louis
Indianapolis San Antonio
San Diego Washington
Oklahoma City Miami Tampa
Charlotte Phoenix
Memphis Minneapolis
Raleigh New Orleans
Columbus Las Vegas
Orlando Kansas City
Austin Birmingham
Atlanta Houston
Dallas Nashville
Richmond Salt Lake City
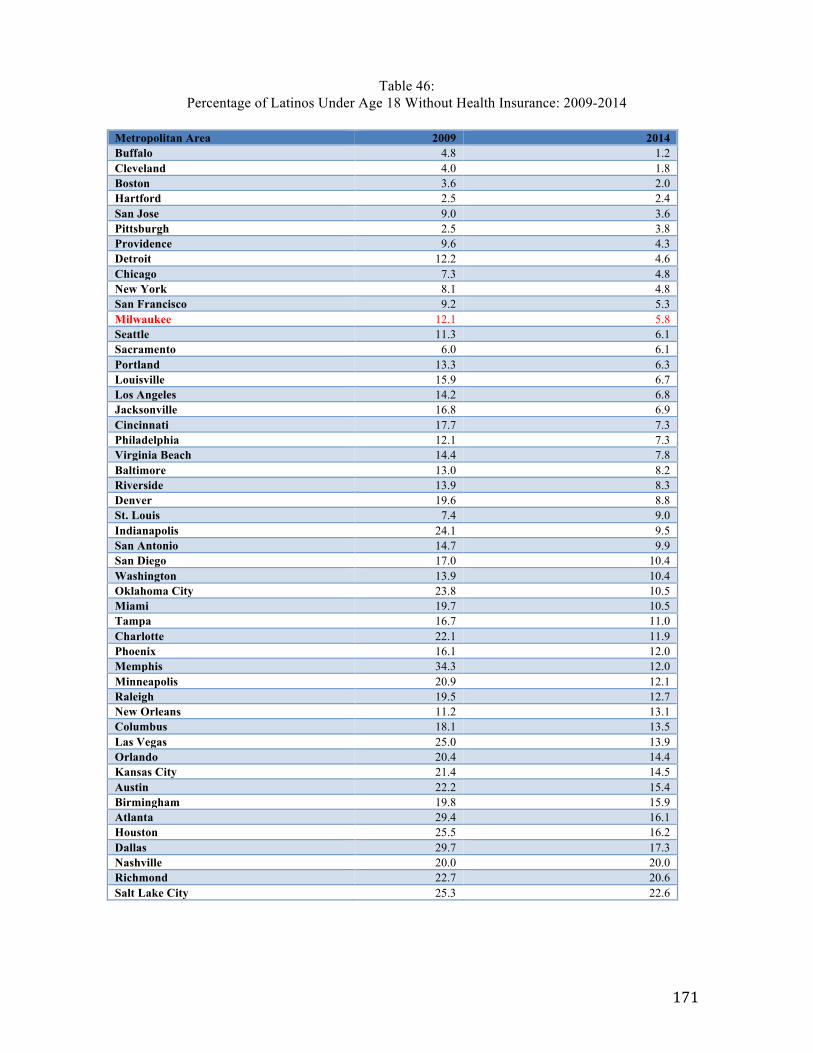
171
Table 46: Percentage of Latinos Under Age 18 Without Health Insurance: 2009-2014
Metropolitan Area 2009 2014 Buffalo 4.8 1.2 Cleveland 4.0 1.8 Boston 3.6 2.0 Hartford 2.5 2.4 San Jose 9.0 3.6 Pittsburgh 2.5 3.8 Providence 9.6 4.3 Detroit 12.2 4.6 Chicago 7.3 4.8 New York 8.1 4.8 San Francisco 9.2 5.3 Milwaukee 12.1 5.8 Seattle 11.3 6.1 Sacramento 6.0 6.1 Portland 13.3 6.3 Louisville 15.9 6.7 Los Angeles 14.2 6.8 Jacksonville 16.8 6.9 Cincinnati 17.7 7.3 Philadelphia 12.1 7.3 Virginia Beach 14.4 7.8 Baltimore 13.0 8.2 Riverside 13.9 8.3 Denver 19.6 8.8 St. Louis 7.4 9.0 Indianapolis 24.1 9.5 San Antonio 14.7 9.9 San Diego 17.0 10.4 Washington 13.9 10.4 Oklahoma City 23.8 10.5 Miami 19.7 10.5 Tampa 16.7 11.0 Charlotte 22.1 11.9 Phoenix 16.1 12.0 Memphis 34.3 12.0 Minneapolis 20.9 12.1 Raleigh 19.5 12.7 New Orleans 11.2 13.1 Columbus 18.1 13.5 Las Vegas 25.0 13.9 Orlando 20.4 14.4 Kansas City 21.4 14.5 Austin 22.2 15.4 Birmingham 19.8 15.9 Atlanta 29.4 16.1 Houston 25.5 16.2 Dallas 29.7 17.3 Nashville 20.0 20.0 Richmond 22.7 20.6 Salt Lake City 25.3 22.6
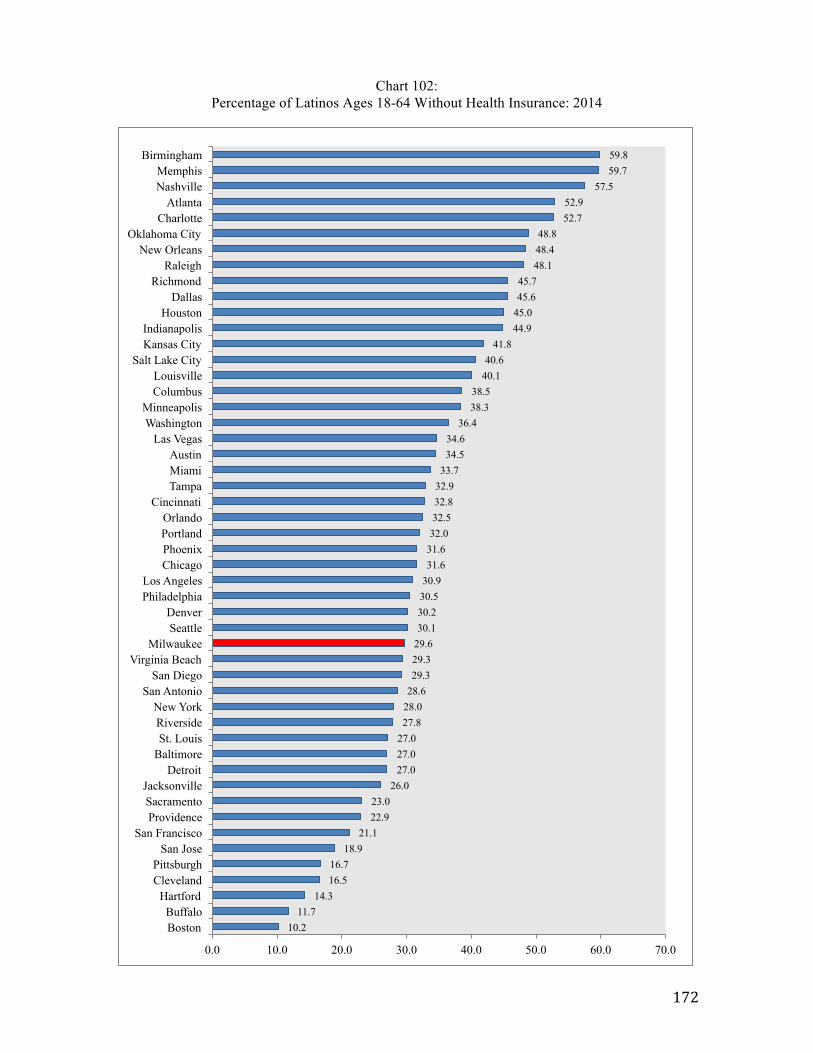
172
Chart 102: Percentage of Latinos Ages 18-64 Without Health Insurance: 2014
10.2 11.7
14.3 16.5 16.7
18.9 21.1
22.9 23.0
26.0 27.0 27.0 27.0 27.8 28.0 28.6 29.3 29.3 29.6 30.1 30.2 30.5 30.9 31.6 31.6 32.0 32.5 32.8 32.9 33.7
34.5 34.6
36.4 38.3 38.5
40.1 40.6
41.8 44.9 45.0 45.6 45.7
48.1 48.4 48.8
52.7 52.9
57.5 59.7 59.8
0.0 10.0 20.0 30.0 40.0 50.0 60.0 70.0
Boston Buffalo
Hartford Cleveland Pittsburgh
San Jose San Francisco
Providence Sacramento Jacksonville
Detroit Baltimore St. Louis Riverside New York
San Antonio San Diego
Virginia Beach Milwaukee
Seattle Denver
Philadelphia Los Angeles
Chicago Phoenix Portland Orlando
Cincinnati Tampa Miami Austin
Las Vegas Washington Minneapolis
Columbus Louisville
Salt Lake City Kansas City Indianapolis
Houston Dallas
Richmond Raleigh
New Orleans Oklahoma City
Charlotte Atlanta
Nashville Memphis
Birmingham
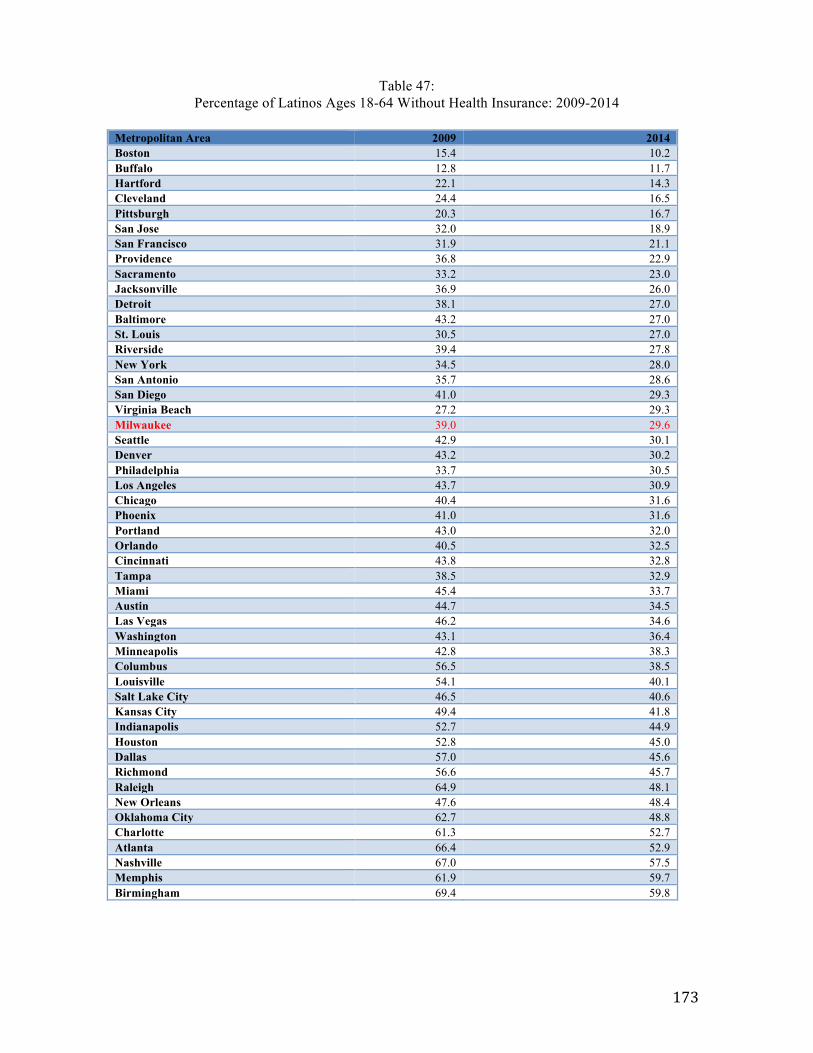
173
Table 47: Percentage of Latinos Ages 18-64 Without Health Insurance: 2009-2014
Metropolitan Area 2009 2014 Boston 15.4 10.2 Buffalo 12.8 11.7 Hartford 22.1 14.3 Cleveland 24.4 16.5 Pittsburgh 20.3 16.7 San Jose 32.0 18.9 San Francisco 31.9 21.1 Providence 36.8 22.9 Sacramento 33.2 23.0 Jacksonville 36.9 26.0 Detroit 38.1 27.0 Baltimore 43.2 27.0 St. Louis 30.5 27.0 Riverside 39.4 27.8 New York 34.5 28.0 San Antonio 35.7 28.6 San Diego 41.0 29.3 Virginia Beach 27.2 29.3 Milwaukee 39.0 29.6 Seattle 42.9 30.1 Denver 43.2 30.2 Philadelphia 33.7 30.5 Los Angeles 43.7 30.9 Chicago 40.4 31.6 Phoenix 41.0 31.6 Portland 43.0 32.0 Orlando 40.5 32.5 Cincinnati 43.8 32.8 Tampa 38.5 32.9 Miami 45.4 33.7 Austin 44.7 34.5 Las Vegas 46.2 34.6 Washington 43.1 36.4 Minneapolis 42.8 38.3 Columbus 56.5 38.5 Louisville 54.1 40.1 Salt Lake City 46.5 40.6 Kansas City 49.4 41.8 Indianapolis 52.7 44.9 Houston 52.8 45.0 Dallas 57.0 45.6 Richmond 56.6 45.7 Raleigh 64.9 48.1 New Orleans 47.6 48.4 Oklahoma City 62.7 48.8 Charlotte 61.3 52.7 Atlanta 66.4 52.9 Nashville 67.0 57.5 Memphis 61.9 59.7 Birmingham 69.4 59.8
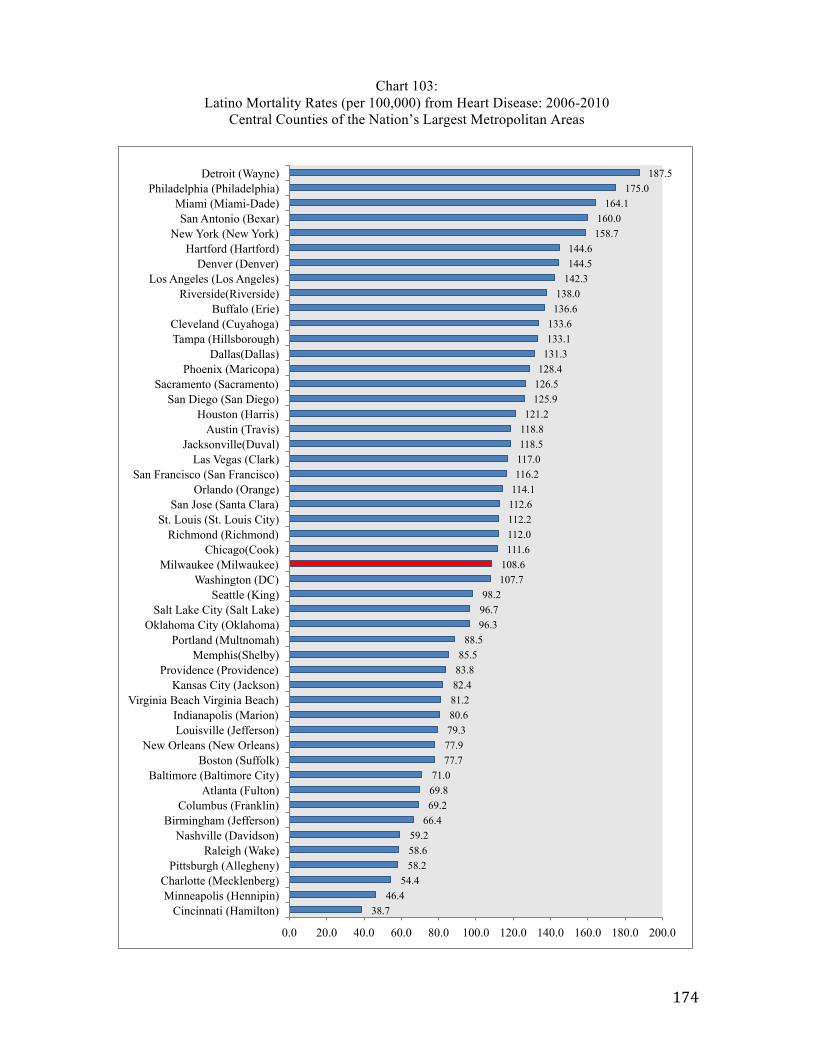
174
Chart 103: Latino Mortality Rates (per 100,000) from Heart Disease: 2006-2010
Central Counties of the Nation’s Largest Metropolitan Areas
38.7 46.4
54.4 58.2 58.6 59.2
66.4 69.2 69.8 71.0
77.7 77.9 79.3 80.6 81.2 82.4 83.8 85.5
88.5 96.3 96.7 98.2
107.7 108.6
111.6 112.0 112.2 112.6 114.1 116.2 117.0 118.5 118.8 121.2
125.9 126.5 128.4 131.3 133.1 133.6
136.6 138.0
142.3 144.5 144.6
158.7 160.0
164.1 175.0
187.5
0.0 20.0 40.0 60.0 80.0 100.0 120.0 140.0 160.0 180.0 200.0
Cincinnati (Hamilton) Minneapolis (Hennipin)
Charlotte (Mecklenberg) Pittsburgh (Allegheny)
Raleigh (Wake) Nashville (Davidson)
Birmingham (Jefferson) Columbus (Franklin)
Atlanta (Fulton) Baltimore (Baltimore City)
Boston (Suffolk) New Orleans (New Orleans)
Louisville (Jefferson) Indianapolis (Marion)
Virginia Beach Virginia Beach) Kansas City (Jackson)
Providence (Providence) Memphis(Shelby)
Portland (Multnomah) Oklahoma City (Oklahoma)
Salt Lake City (Salt Lake) Seattle (King)
Washington (DC) Milwaukee (Milwaukee)
Chicago(Cook) Richmond (Richmond)
St. Louis (St. Louis City) San Jose (Santa Clara)
Orlando (Orange) San Francisco (San Francisco)
Las Vegas (Clark) Jacksonville(Duval)
Austin (Travis) Houston (Harris)
San Diego (San Diego) Sacramento (Sacramento)
Phoenix (Maricopa) Dallas(Dallas)
Tampa (Hillsborough) Cleveland (Cuyahoga)
Buffalo (Erie) Riverside(Riverside)
Los Angeles (Los Angeles) Denver (Denver)
Hartford (Hartford) New York (New York)
San Antonio (Bexar) Miami (Miami-Dade)
Philadelphia (Philadelphia) Detroit (Wayne)
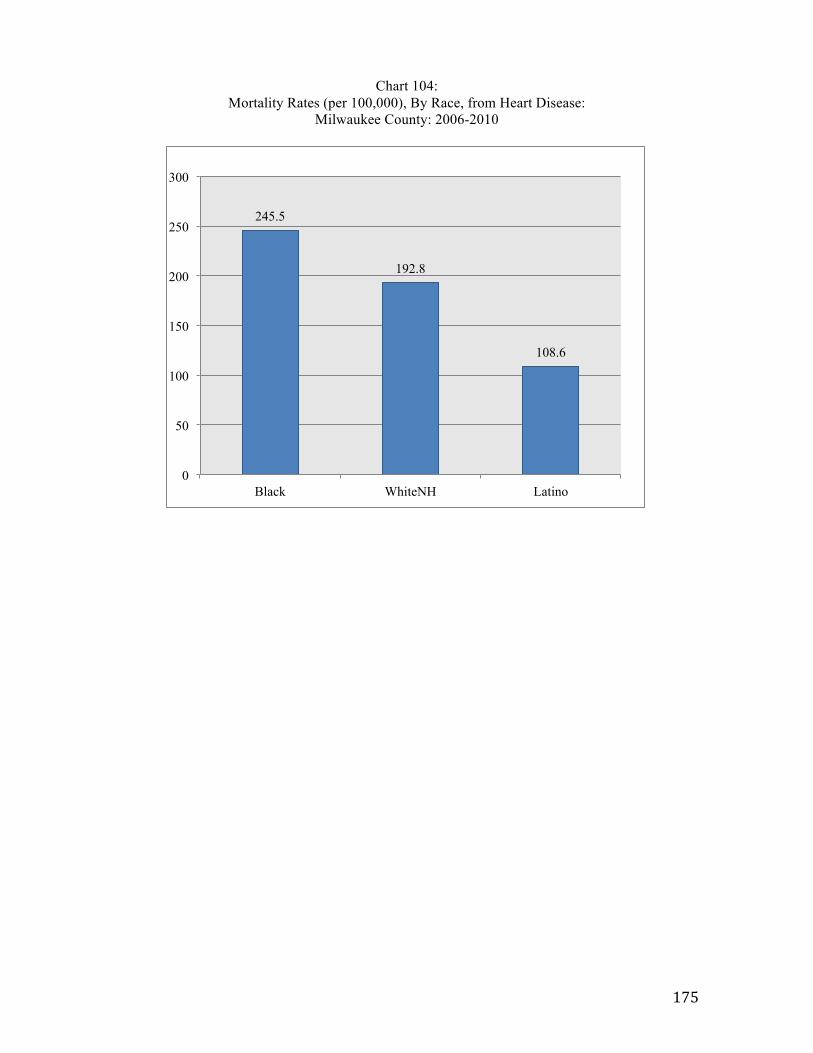
175
Chart 104: Mortality Rates (per 100,000), By Race, from Heart Disease:
Milwaukee County: 2006-2010
245.5
192.8
108.6
0
50
100
150
200
250
300
Black WhiteNH Latino
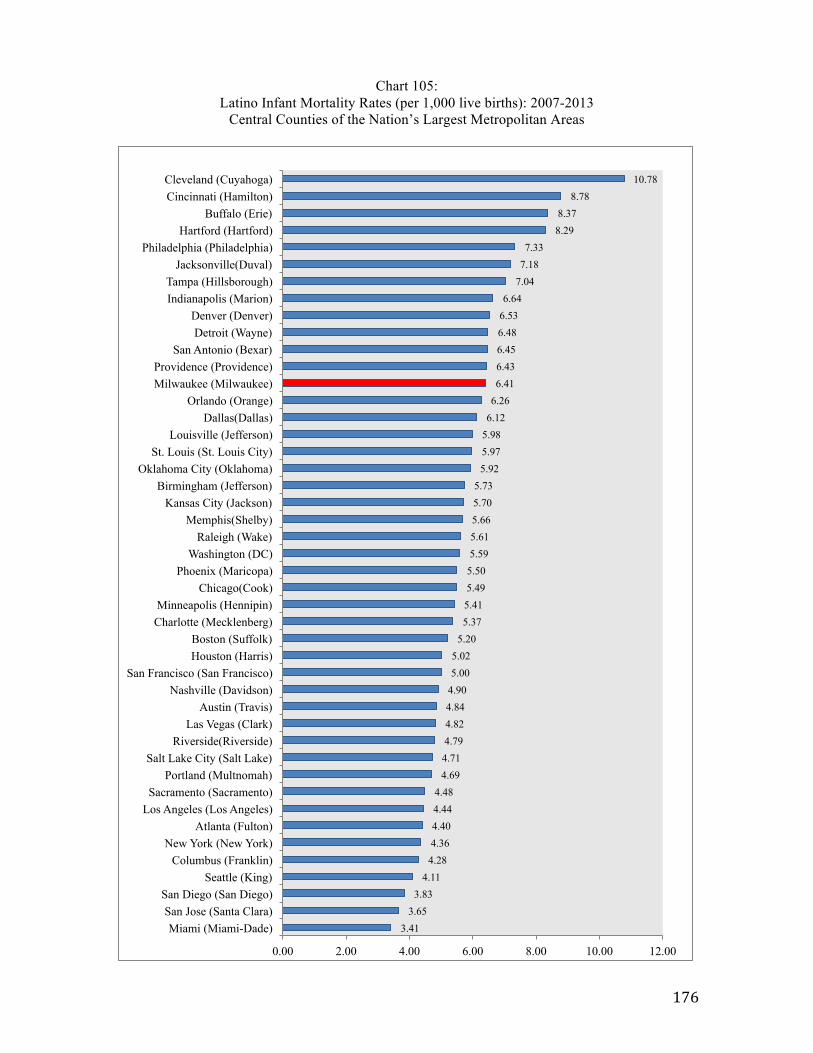
176
Chart 105: Latino Infant Mortality Rates (per 1,000 live births): 2007-2013
Central Counties of the Nation’s Largest Metropolitan Areas
3.41 3.65
3.83 4.11
4.28 4.36 4.40 4.44 4.48
4.69 4.71 4.79 4.82 4.84 4.90 5.00 5.02
5.20 5.37 5.41 5.49 5.50 5.59 5.61 5.66 5.70 5.73
5.92 5.97 5.98 6.12 6.26 6.41 6.43 6.45 6.48 6.53 6.64
7.04 7.18 7.33
8.29 8.37
8.78 10.78
0.00 2.00 4.00 6.00 8.00 10.00 12.00
Miami (Miami-Dade) San Jose (Santa Clara)
San Diego (San Diego) Seattle (King)
Columbus (Franklin) New York (New York)
Atlanta (Fulton) Los Angeles (Los Angeles) Sacramento (Sacramento)
Portland (Multnomah) Salt Lake City (Salt Lake)
Riverside(Riverside) Las Vegas (Clark)
Austin (Travis) Nashville (Davidson)
San Francisco (San Francisco) Houston (Harris) Boston (Suffolk)
Charlotte (Mecklenberg) Minneapolis (Hennipin)
Chicago(Cook) Phoenix (Maricopa)
Washington (DC) Raleigh (Wake)
Memphis(Shelby) Kansas City (Jackson)
Birmingham (Jefferson) Oklahoma City (Oklahoma)
St. Louis (St. Louis City) Louisville (Jefferson)
Dallas(Dallas) Orlando (Orange)
Milwaukee (Milwaukee) Providence (Providence)
San Antonio (Bexar) Detroit (Wayne)
Denver (Denver) Indianapolis (Marion) Tampa (Hillsborough)
Jacksonville(Duval) Philadelphia (Philadelphia)
Hartford (Hartford) Buffalo (Erie)
Cincinnati (Hamilton) Cleveland (Cuyahoga)
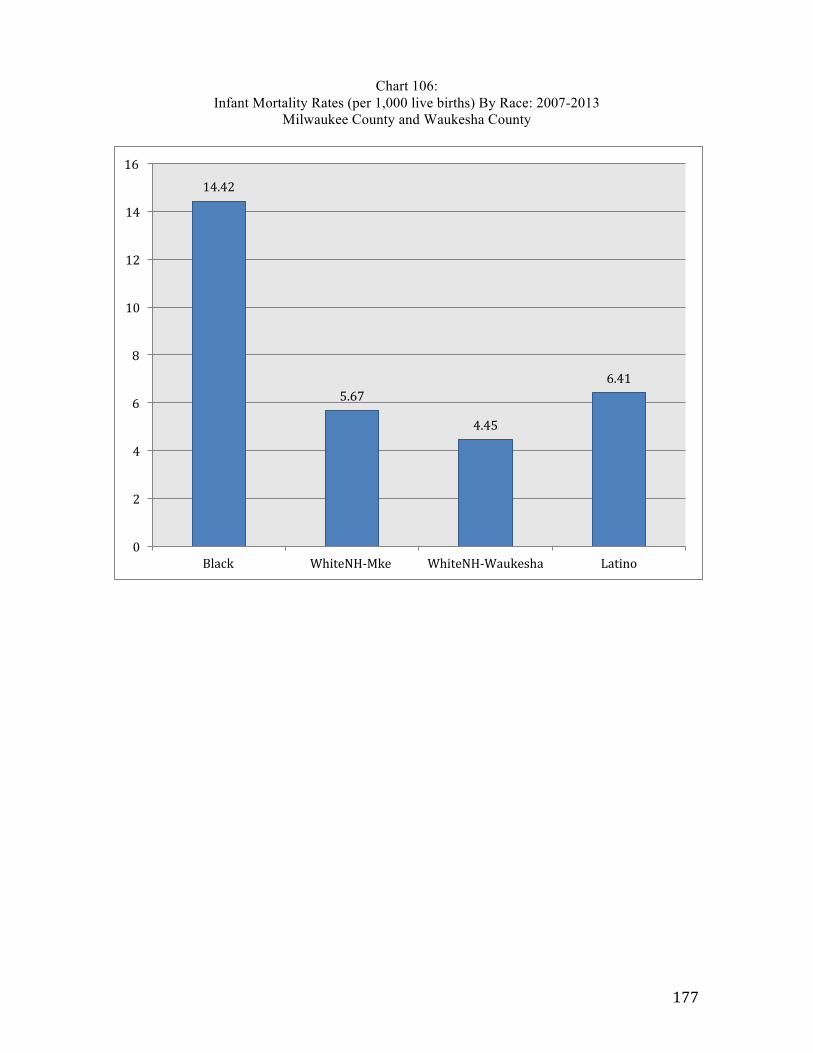
177
Chart 106: Infant Mortality Rates (per 1,000 live births) By Race: 2007-2013
Milwaukee County and Waukesha County
14.42
5.67
4.45
6.41
0
2
4
6
8
10
12
14
16
Black WhiteNH-‐Mke WhiteNH-‐Waukesha Latino
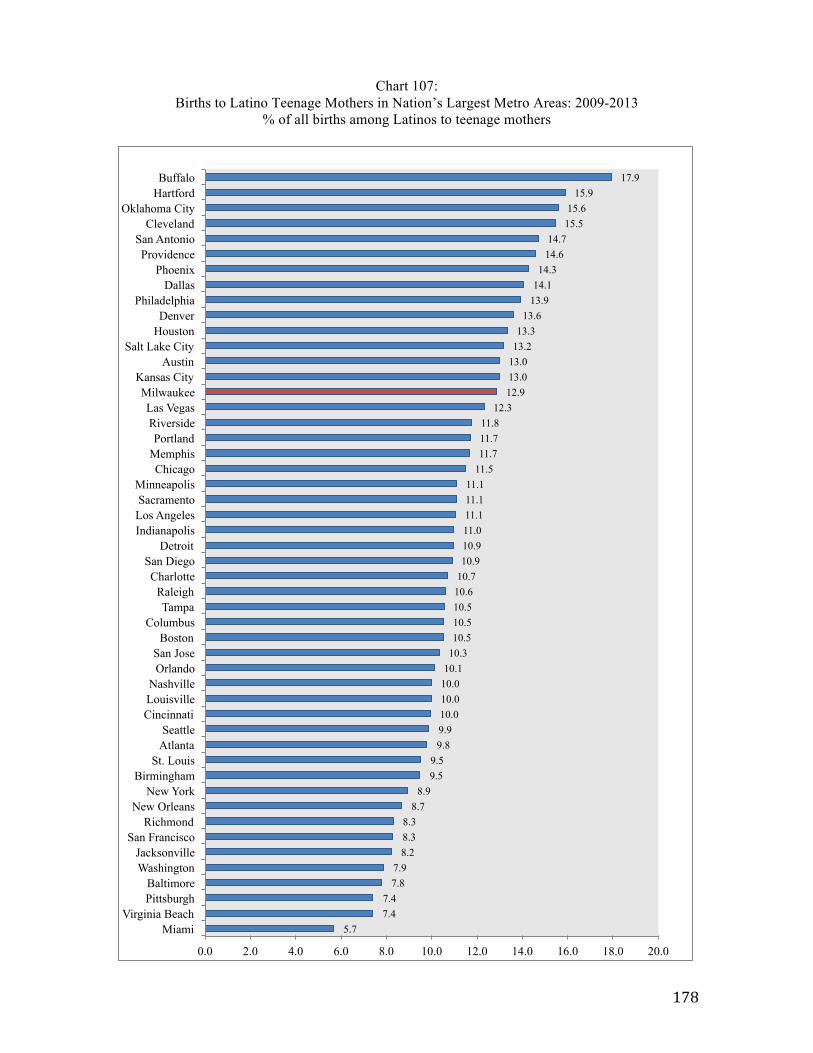
178
Chart 107: Births to Latino Teenage Mothers in Nation’s Largest Metro Areas: 2009-2013
% of all births among Latinos to teenage mothers
5.7 7.4 7.4
7.8 7.9
8.2 8.3 8.3
8.7 8.9
9.5 9.5
9.8 9.9 10.0 10.0 10.0 10.1 10.3 10.5 10.5 10.5 10.6 10.7 10.9 10.9 11.0 11.1 11.1 11.1
11.5 11.7 11.7 11.8
12.3 12.9 13.0 13.0 13.2 13.3
13.6 13.9 14.1 14.3
14.6 14.7
15.5 15.6
15.9 17.9
0.0 2.0 4.0 6.0 8.0 10.0 12.0 14.0 16.0 18.0 20.0
Miami Virginia Beach
Pittsburgh Baltimore
Washington Jacksonville
San Francisco Richmond
New Orleans New York
Birmingham St. Louis
Atlanta Seattle
Cincinnati Louisville Nashville
Orlando San Jose
Boston Columbus
Tampa Raleigh
Charlotte San Diego
Detroit Indianapolis Los Angeles Sacramento
Minneapolis Chicago
Memphis Portland
Riverside Las Vegas
Milwaukee Kansas City
Austin Salt Lake City
Houston Denver
Philadelphia Dallas
Phoenix Providence
San Antonio Cleveland
Oklahoma City Hartford Buffalo
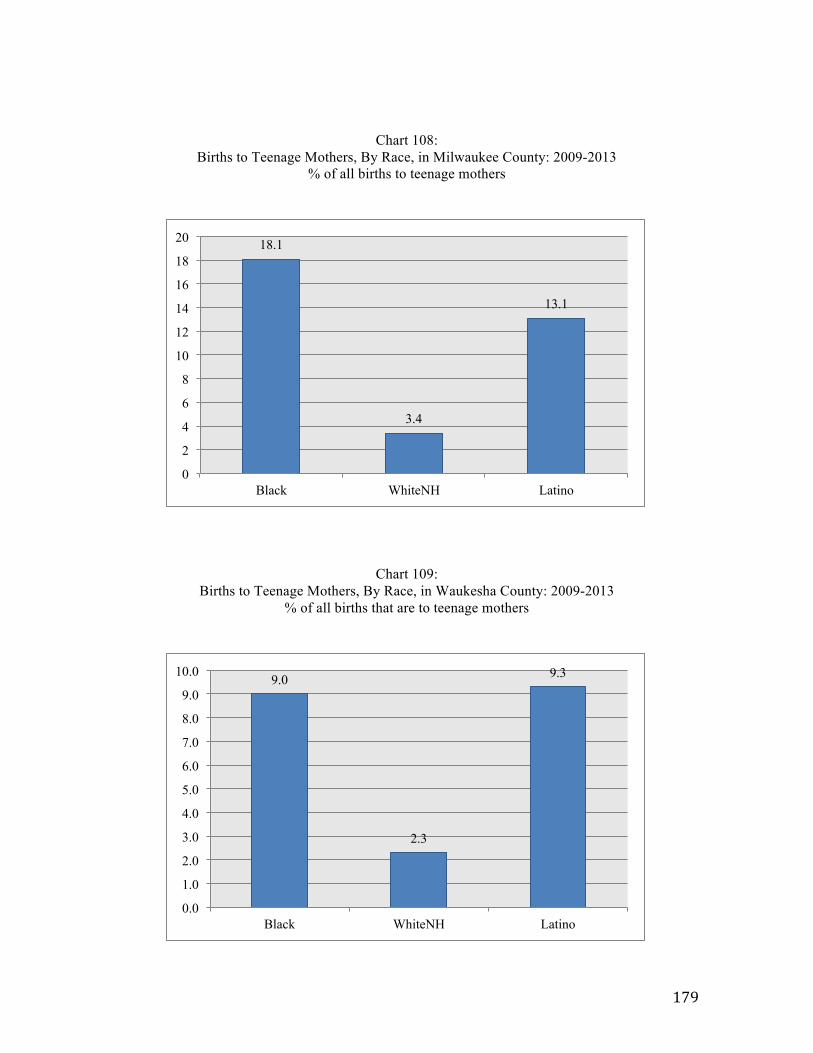
179
Chart 108: Births to Teenage Mothers, By Race, in Milwaukee County: 2009-2013
% of all births to teenage mothers
Chart 109: Births to Teenage Mothers, By Race, in Waukesha County: 2009-2013
% of all births that are to teenage mothers
18.1
3.4
13.1
0
2
4
6
8
10
12
14
16
18
20
Black WhiteNH Latino
9.0
2.3
9.3
0.0
1.0
2.0
3.0
4.0
5.0
6.0
7.0
8.0
9.0
10.0
Black WhiteNH Latino
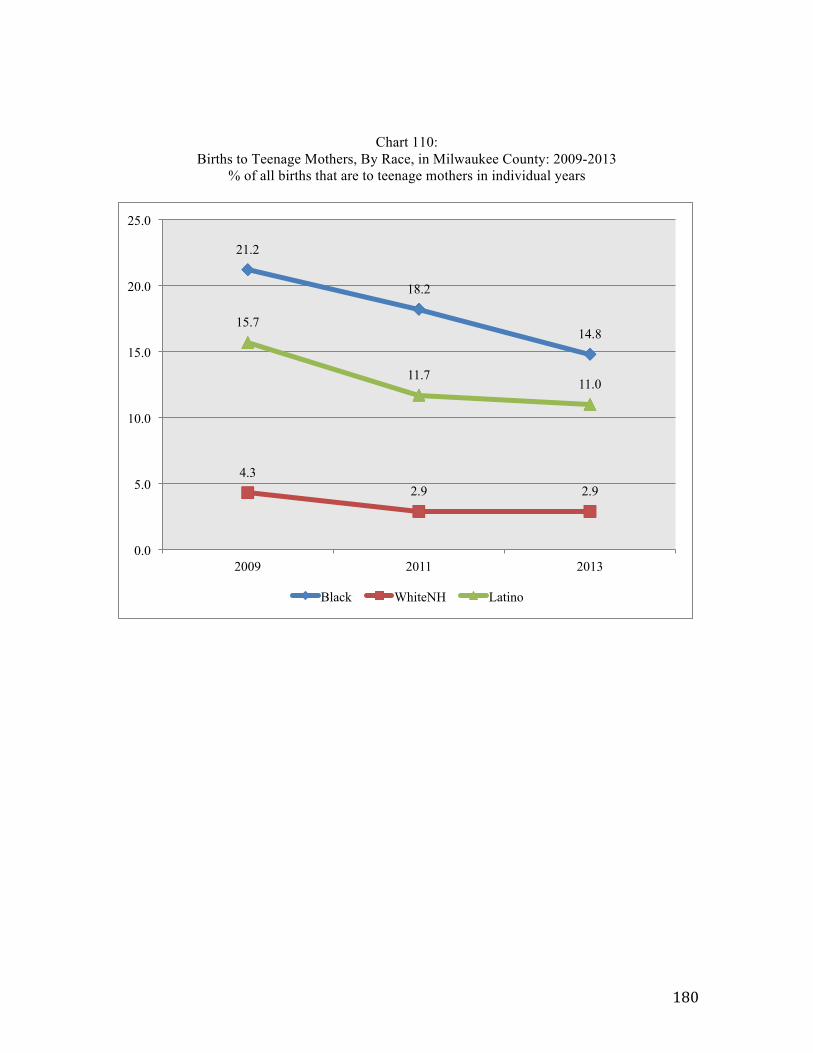
180
Chart 110:
Births to Teenage Mothers, By Race, in Milwaukee County: 2009-2013 % of all births that are to teenage mothers in individual years
21.2
18.2
14.8
4.3 2.9 2.9
15.7
11.7 11.0
0.0
5.0
10.0
15.0
20.0
25.0
2009 2011 2013
Black WhiteNH Latino
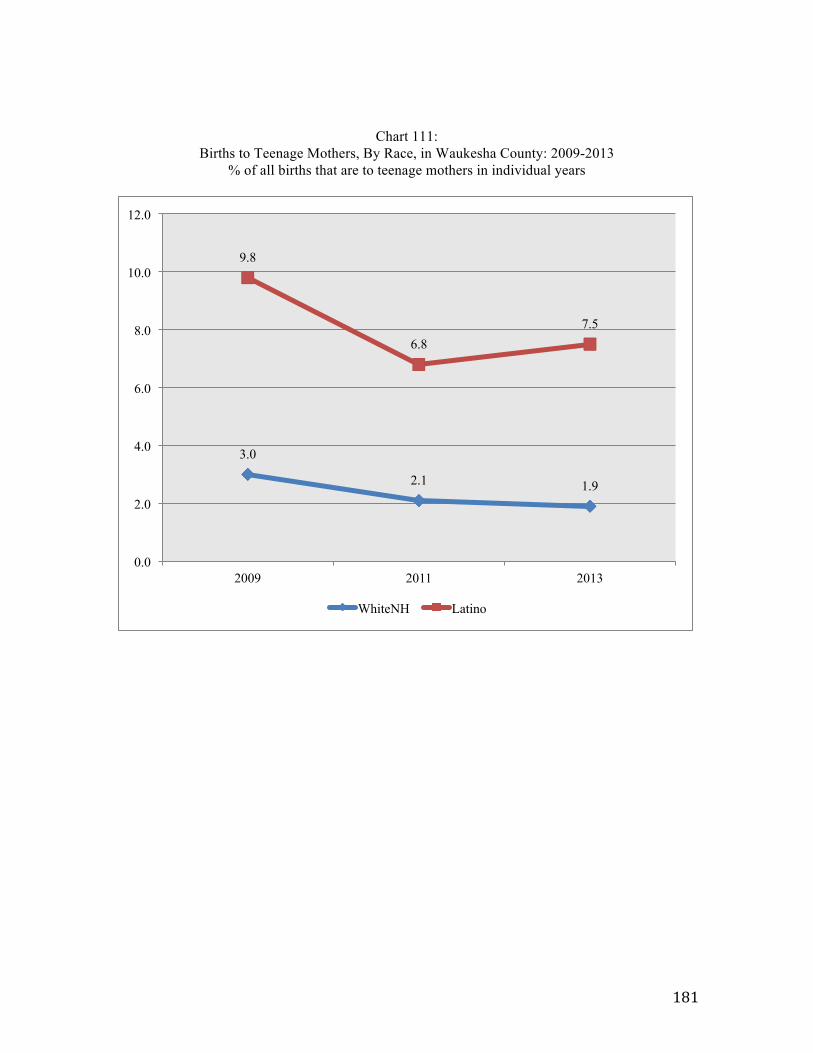
181
Chart 111: Births to Teenage Mothers, By Race, in Waukesha County: 2009-2013
% of all births that are to teenage mothers in individual years
3.0
2.1 1.9
9.8
6.8 7.5
0.0
2.0
4.0
6.0
8.0
10.0
12.0
2009 2011 2013
WhiteNH Latino
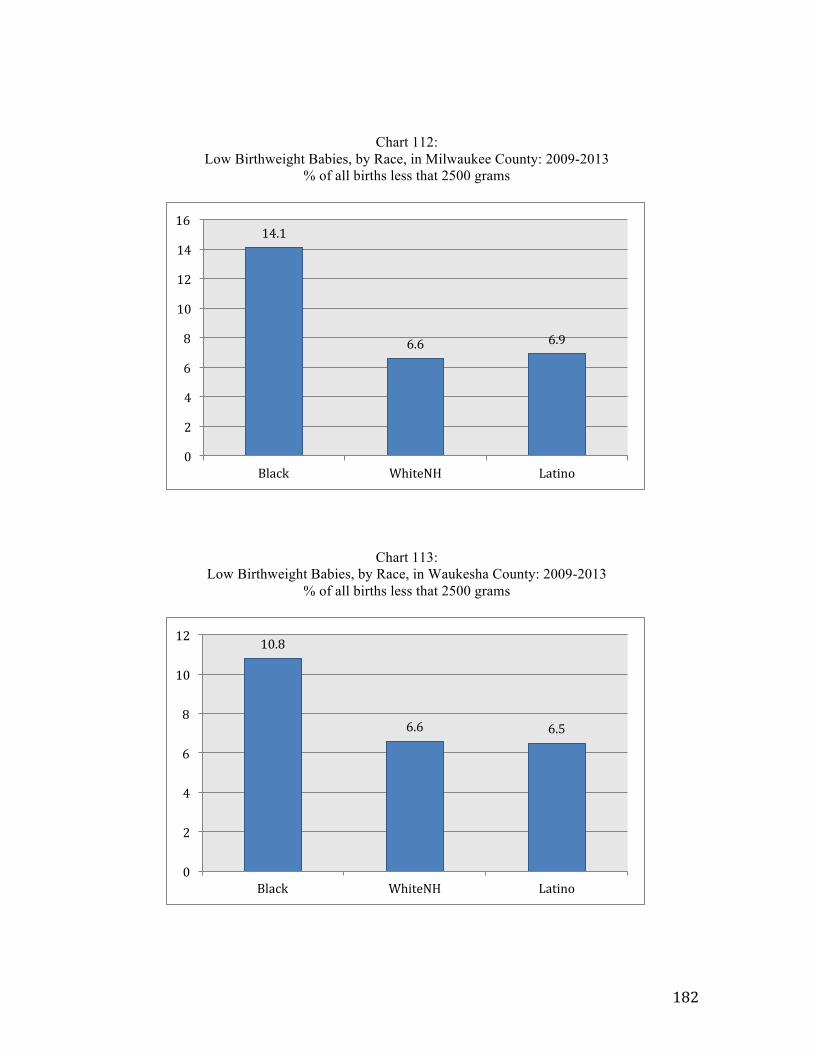
182
Chart 112: Low Birthweight Babies, by Race, in Milwaukee County: 2009-2013
% of all births less that 2500 grams
Chart 113: Low Birthweight Babies, by Race, in Waukesha County: 2009-2013
% of all births less that 2500 grams
14.1
6.6 6.9
0
2
4
6
8
10
12
14
16
Black WhiteNH Latino
10.8
6.6 6.5
0
2
4
6
8
10
12
Black WhiteNH Latino
183
EDUCATION AND SCHOOLING
Educational Attainment
Milwaukee Latinos continue to lag, especially behind the WNH population, in
educational attainment. As Chart 114 shows, while virtually all WNH adults (over age 25)
in metro Milwaukee hold at least a high school degree (94.9 percent), fewer than two-
thirds of Latinos in the region are similarly credentialed. The percentage of Latino high
school graduates also lags well behind the figure for black Milwaukeeans (80.7 percent).
Similarly, the percentage of Milwaukee Latinos who are college graduates is very low – at
13.6 percent, it is barely one-third of the WNH rate (Chart 115). Latino-white disparities in
educational attainment remain deeply entrenched in Milwaukee.
However, notwithstanding these low rates and wide disparities, the educational
attainment of Milwaukee Latinos has been increasing since 2000. As Tables 48-49 show,
the percentage of Milwaukee Latinos over age 25 with at least a high school degree
increased from 52.3 percent in 2000 to 66.4 percent in 2014. This was the 10th highest rate
of increase among the nation’s 50 largest metropolitan areas during this period. Between
2000-2014, the percentage of Milwaukee Latinos with at least a bachelor’s degree also
increased, from 10.4 percent to 13.6 percent. This was the 18th highest rate of increase
among the nation’s 50 largest metropolitan areas during this period.
(Charts 116-119) array the rates of educational attainment for Latinos in the nation’s 50
largest metropolitan areas, in 2000 and in 2014. The key findings:
• In 2000, Milwaukee ranked 37th in the percentage of Latinos over 25 years old
with at least a high school degree. By 2014, Latino Milwaukee had improved to
27th.
• In 2000, Milwaukee ranked 39th in the percentage of Latinos over age 25 with at
least a bachelor’s degree. In 2014, that ranking remained essentially unchanged:
Milwaukee ranked 38th among the 50 large metros.
Educational attainment in Latino Milwaukee, then, is a mixed bag: low overall rates in
2014, especially compared to the white non-Hispanic majority; clear improvement between
2000-2014 in educational attainment, especially in the percentage of high school degree
holders; and modest improvements in Latino Milwaukee’s level of educational attainment
compared to Latino communities in big metros around the country.
184
The Latinoisation of Milwaukee School Enrollments
As we examined in the section of this study on demographic trends, the growing
Milwaukee Latino community accounts for lion’s share of the metro area’s net population
growth since 2000, and all of the city of Milwaukee’s net population growth since then.
Therefore, it is not surprising that growth in the number Latino schoolchildren in
Milwaukee accounts for all of the net growth in K-12 enrollments in the region.
• Table 50 shows trends in enrollment in metro Milwaukee K-12 schools between
1997 and 2014. Total non-Hispanic enrollment declined by over 32,000 during
this period, while Latino enrollment grew by almost 22,000. The trends are
almost identical in public and private schools.
• Table 51 breaks down these enrollment trends (in public and private schools) for
the four counties of metro Milwaukee. The same pattern – rapid Latino growth,
shrinking non-Hispanic enrollment—occurred in each county (although the
pattern was most pronounced in Milwaukee County).
• Table 52 arrays enrollment trends in public schools, for WNH and Hispanic
students, in the City of Milwaukee, Milwaukee County Suburbs, and the WOW
Counties (Waukesha, Ozaukee, and Washington), between 1987-2016. In all
jurisdictions, there has been a huge percentage increase in Latino enrollments,
although the numerical increases in the suburbs have been relatively modest,
especially compared to the city. White non-Hispanic enrollments have dropped
in all three jurisdictions over the past twenty years.
• The upshot of these trends, as shown graphically in Charts 120-122, has been a
dramatic Latinoisation of school enrollments in all of the major Milwaukee
jurisdictions over the past thirty years. Between 1987-2016, the Latino share of
total City of Milwaukee enrollments grew from 8.0 percent to 25.3 percent; in
the Milwaukee County suburbs, the Latino percentage grew from 1.8 percent to
13.6 percent of the total; and in the WOW counties, Latino enrollments grew
from 1.4 percent to 7.3 percent of the total.
• Although metro Milwaukee’s Latino students remain highly concentrated in City
of Milwaukee schools, a marked spatial decentralization of regional enrollments
has occurred over the past decade. As Table 53 shows, as recently as 2006-07,
almost 75 percent of all metro Milwaukee Latino students attended K-12 schools
185
in the City of Milwaukee. By 2015-16, that percentage has dropped to 65.0
percent, with discernible increases in both the Milwaukee County and WOW
suburbs. The change over the past thirty years, from 1987-2016, is graphically
displayed in Charts 123-124.
Latino Segregation in Metro Milwaukee Schools
Despite the evidence of growing suburbanization of Latino enrollments in metro
Milwaukee over the past decade (Table 53), a high percentage of Latino schoolchildren
attend schools that sociologists of education call “hypersegregated”: schools in which 90
percent or more of the students are non-white minorities. As Chart 125 shows, 41.8 percent
of Latino students attended hypersegregated schools in Milwaukee in 2013-14, a level that
placed 12th among the nation’s 50 largest metropolitan areas in the percentage of Latino
students attending such schools. Again, this is not surprising, given the indexes of
residential segregation discussed earlier and the fact that school assignments, with the
abandonment of system-wide desegregation policies such as busing, are made on the basis
of (segregated) neighborhoods. Indeed, as Chart 126 shows, using the index of
dissimilarity as a measure of Latino-WNH student segregation, Milwaukee ranks 9th
among the 50 metros in segregation – virtually the same ranking as on overall measures of
population segregation presented earlier.
Table 54 offers data on the percentage of Latino students attending hypersegregated
schools in the City of Milwaukee’s three main school networks: the Milwaukee Parent
Choice Program (MPCP) voucher schools; the Non-District Charter schools; and
Milwaukee Public Schools. Latino segregation is high in all three types of schools, but
highest in the non-MPS institutions.
The Privatization of Latino Schooling in Milwaukee
Chart 127 shows the degree to which metro Milwaukee Latino students, to a greater
extent than Latino students in any other large metropolitan area in the U.S., attend private
schools. By 2011-12, the most recent data available for all metro areas, 16.8 percent of all
metro Milwaukee Latino students attended private schools. Given the expansion of
voucher schools in the city over the past five years, this percentage has undoubtedly
increased since then.

186
Latino Student Achievement: Comparative NAEP Scores
The “National Assessment of Educational Progress” (NAEP) is “the largest nationally
representative and continuing assessment of what America’s students know and can do in
various subject areas.”5 Unfortunately, comparative NAEP scores are available for only a
limited number of “urban school districts” and only for public school districts, so the data
do not encompass entire metropolitan areas, nor do they cover the variety of school
settings in which Milwaukee Latino children are increasingly educated. In addition,
Milwaukee has not yet reported its 2015 NAEP scores to the National Center on
Educational Statistics, so comparisons for Milwaukee Latino students are limited to a few
other urban public school districts and to 2013.
These Latino student NAEP scores (and their error margins), for 4th and 8th grade reading
and math, are presented in Tables 55-58, and comparative scores for white, black, and
Hispanic students in MPS are presented in Table 59.
5 See National Center for Educational Statistics description of NAEP, accessed at: http://nces.ed.gov/nationsreportcard/about/
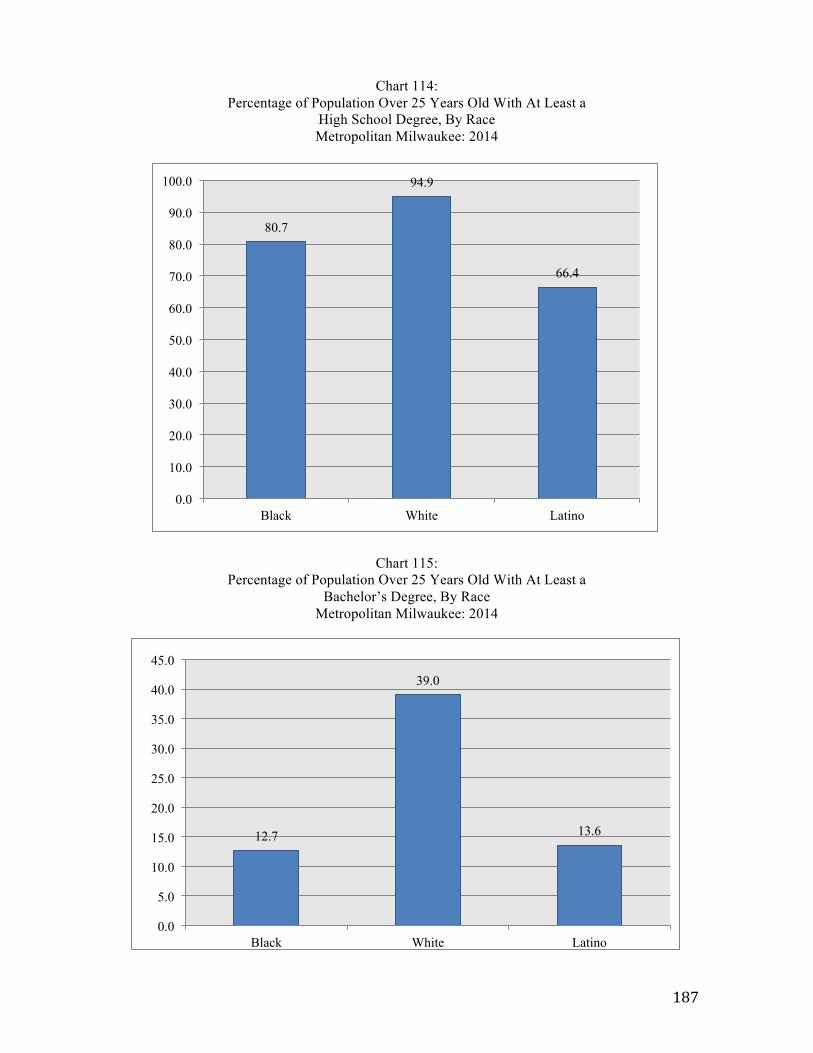
187
Chart 114: Percentage of Population Over 25 Years Old With At Least a
High School Degree, By Race Metropolitan Milwaukee: 2014
Chart 115: Percentage of Population Over 25 Years Old With At Least a
Bachelor’s Degree, By Race Metropolitan Milwaukee: 2014
80.7
94.9
66.4
0.0
10.0
20.0
30.0
40.0
50.0
60.0
70.0
80.0
90.0
100.0
Black White Latino
12.7
39.0
13.6
0.0
5.0
10.0
15.0
20.0
25.0
30.0
35.0
40.0
45.0
Black White Latino
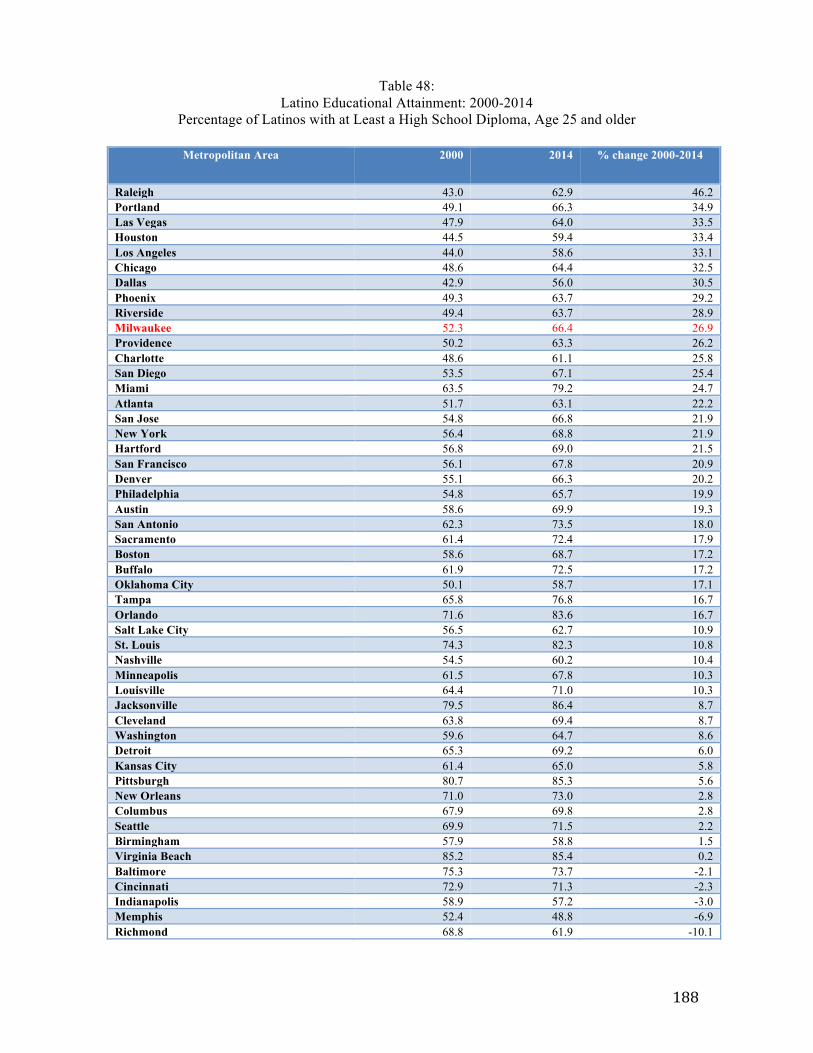
188
Table 48: Latino Educational Attainment: 2000-2014
Percentage of Latinos with at Least a High School Diploma, Age 25 and older
Metropolitan Area 2000 2014 % change 2000-2014
Raleigh 43.0 62.9 46.2 Portland 49.1 66.3 34.9 Las Vegas 47.9 64.0 33.5 Houston 44.5 59.4 33.4 Los Angeles 44.0 58.6 33.1 Chicago 48.6 64.4 32.5 Dallas 42.9 56.0 30.5 Phoenix 49.3 63.7 29.2 Riverside 49.4 63.7 28.9 Milwaukee 52.3 66.4 26.9 Providence 50.2 63.3 26.2 Charlotte 48.6 61.1 25.8 San Diego 53.5 67.1 25.4 Miami 63.5 79.2 24.7 Atlanta 51.7 63.1 22.2 San Jose 54.8 66.8 21.9 New York 56.4 68.8 21.9 Hartford 56.8 69.0 21.5 San Francisco 56.1 67.8 20.9 Denver 55.1 66.3 20.2 Philadelphia 54.8 65.7 19.9 Austin 58.6 69.9 19.3 San Antonio 62.3 73.5 18.0 Sacramento 61.4 72.4 17.9 Boston 58.6 68.7 17.2 Buffalo 61.9 72.5 17.2 Oklahoma City 50.1 58.7 17.1 Tampa 65.8 76.8 16.7 Orlando 71.6 83.6 16.7 Salt Lake City 56.5 62.7 10.9 St. Louis 74.3 82.3 10.8 Nashville 54.5 60.2 10.4 Minneapolis 61.5 67.8 10.3 Louisville 64.4 71.0 10.3 Jacksonville 79.5 86.4 8.7 Cleveland 63.8 69.4 8.7 Washington 59.6 64.7 8.6 Detroit 65.3 69.2 6.0 Kansas City 61.4 65.0 5.8 Pittsburgh 80.7 85.3 5.6 New Orleans 71.0 73.0 2.8 Columbus 67.9 69.8 2.8 Seattle 69.9 71.5 2.2 Birmingham 57.9 58.8 1.5 Virginia Beach 85.2 85.4 0.2 Baltimore 75.3 73.7 -2.1 Cincinnati 72.9 71.3 -2.3 Indianapolis 58.9 57.2 -3.0 Memphis 52.4 48.8 -6.9 Richmond 68.8 61.9 -10.1
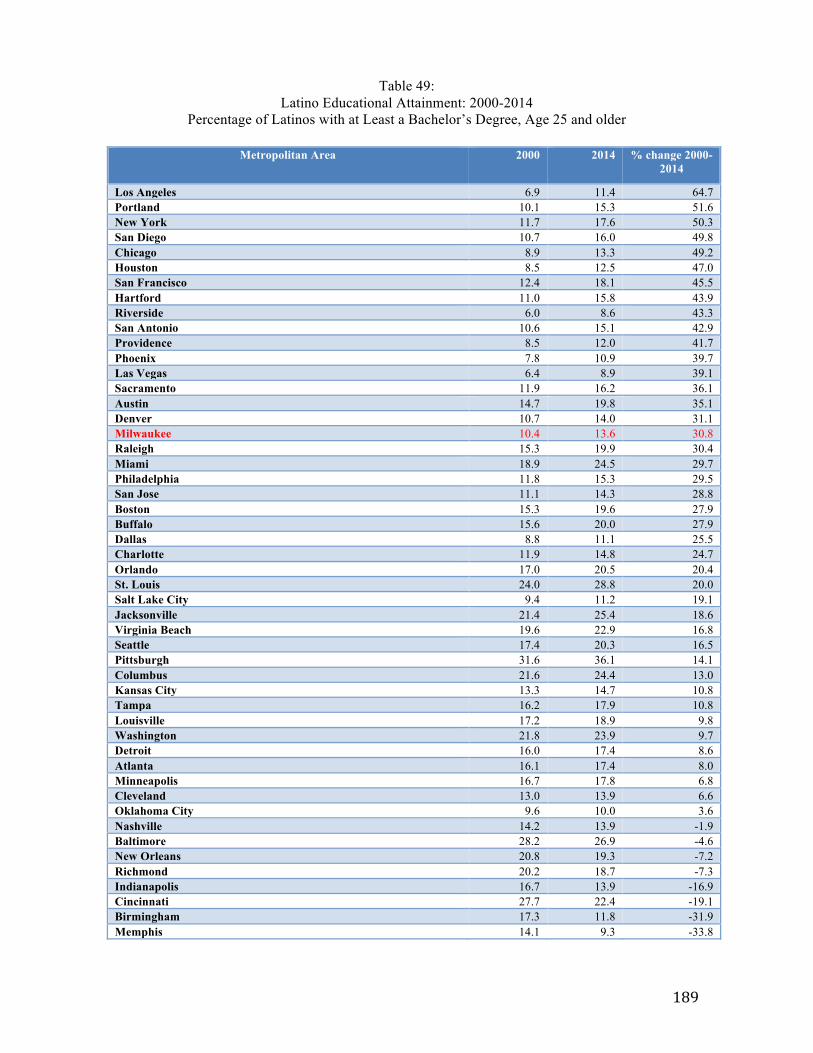
189
Table 49: Latino Educational Attainment: 2000-2014
Percentage of Latinos with at Least a Bachelor’s Degree, Age 25 and older
Metropolitan Area 2000 2014 % change 2000-2014
Los Angeles 6.9 11.4 64.7 Portland 10.1 15.3 51.6 New York 11.7 17.6 50.3 San Diego 10.7 16.0 49.8 Chicago 8.9 13.3 49.2 Houston 8.5 12.5 47.0 San Francisco 12.4 18.1 45.5 Hartford 11.0 15.8 43.9 Riverside 6.0 8.6 43.3 San Antonio 10.6 15.1 42.9 Providence 8.5 12.0 41.7 Phoenix 7.8 10.9 39.7 Las Vegas 6.4 8.9 39.1 Sacramento 11.9 16.2 36.1 Austin 14.7 19.8 35.1 Denver 10.7 14.0 31.1 Milwaukee 10.4 13.6 30.8 Raleigh 15.3 19.9 30.4 Miami 18.9 24.5 29.7 Philadelphia 11.8 15.3 29.5 San Jose 11.1 14.3 28.8 Boston 15.3 19.6 27.9 Buffalo 15.6 20.0 27.9 Dallas 8.8 11.1 25.5 Charlotte 11.9 14.8 24.7 Orlando 17.0 20.5 20.4 St. Louis 24.0 28.8 20.0 Salt Lake City 9.4 11.2 19.1 Jacksonville 21.4 25.4 18.6 Virginia Beach 19.6 22.9 16.8 Seattle 17.4 20.3 16.5 Pittsburgh 31.6 36.1 14.1 Columbus 21.6 24.4 13.0 Kansas City 13.3 14.7 10.8 Tampa 16.2 17.9 10.8 Louisville 17.2 18.9 9.8 Washington 21.8 23.9 9.7 Detroit 16.0 17.4 8.6 Atlanta 16.1 17.4 8.0 Minneapolis 16.7 17.8 6.8 Cleveland 13.0 13.9 6.6 Oklahoma City 9.6 10.0 3.6 Nashville 14.2 13.9 -1.9 Baltimore 28.2 26.9 -4.6 New Orleans 20.8 19.3 -7.2 Richmond 20.2 18.7 -7.3 Indianapolis 16.7 13.9 -16.9 Cincinnati 27.7 22.4 -19.1 Birmingham 17.3 11.8 -31.9 Memphis 14.1 9.3 -33.8
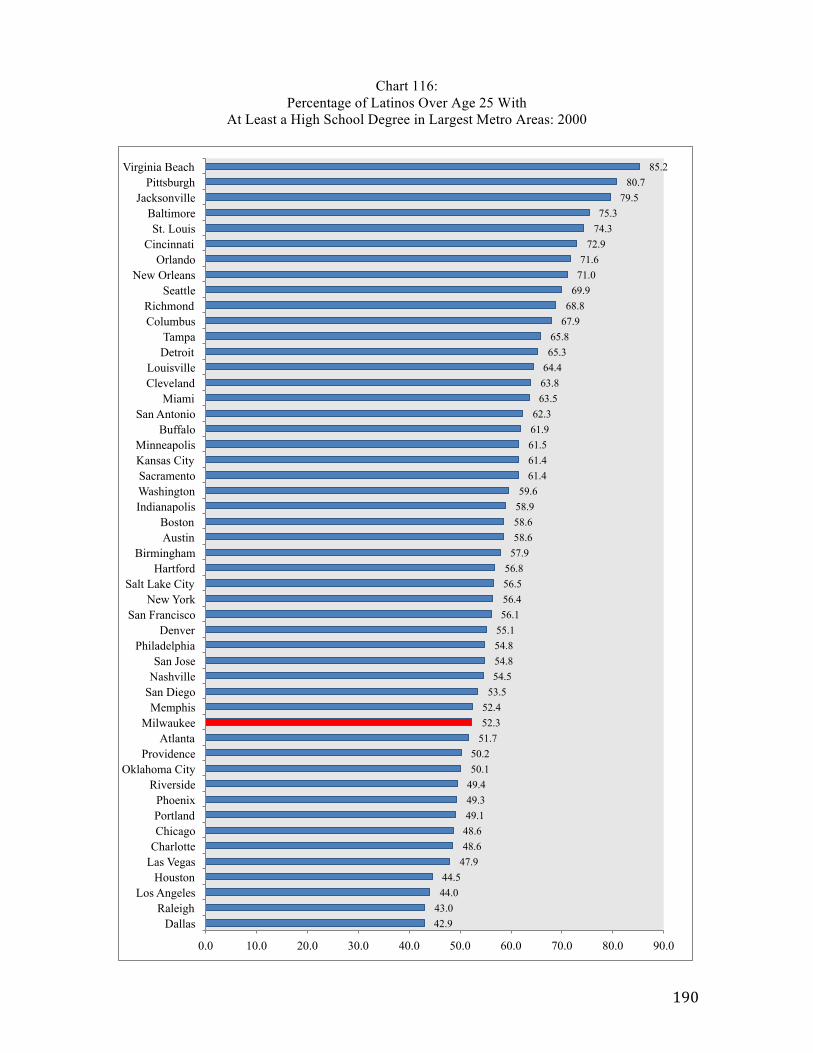
190
Chart 116: Percentage of Latinos Over Age 25 With
At Least a High School Degree in Largest Metro Areas: 2000
42.9 43.0 44.0 44.5
47.9 48.6 48.6 49.1 49.3 49.4 50.1 50.2
51.7 52.3 52.4
53.5 54.5 54.8 54.8 55.1 56.1 56.4 56.5 56.8
57.9 58.6 58.6 58.9 59.6
61.4 61.4 61.5 61.9 62.3
63.5 63.8 64.4 65.3 65.8
67.9 68.8
69.9 71.0 71.6
72.9 74.3 75.3
79.5 80.7
85.2
0.0 10.0 20.0 30.0 40.0 50.0 60.0 70.0 80.0 90.0
Dallas Raleigh
Los Angeles Houston
Las Vegas Charlotte Chicago Portland Phoenix
Riverside Oklahoma City
Providence Atlanta
Milwaukee Memphis
San Diego Nashville San Jose
Philadelphia Denver
San Francisco New York
Salt Lake City Hartford
Birmingham Austin Boston
Indianapolis Washington Sacramento Kansas City Minneapolis
Buffalo San Antonio
Miami Cleveland Louisville
Detroit Tampa
Columbus Richmond
Seattle New Orleans
Orlando Cincinnati
St. Louis Baltimore
Jacksonville Pittsburgh
Virginia Beach
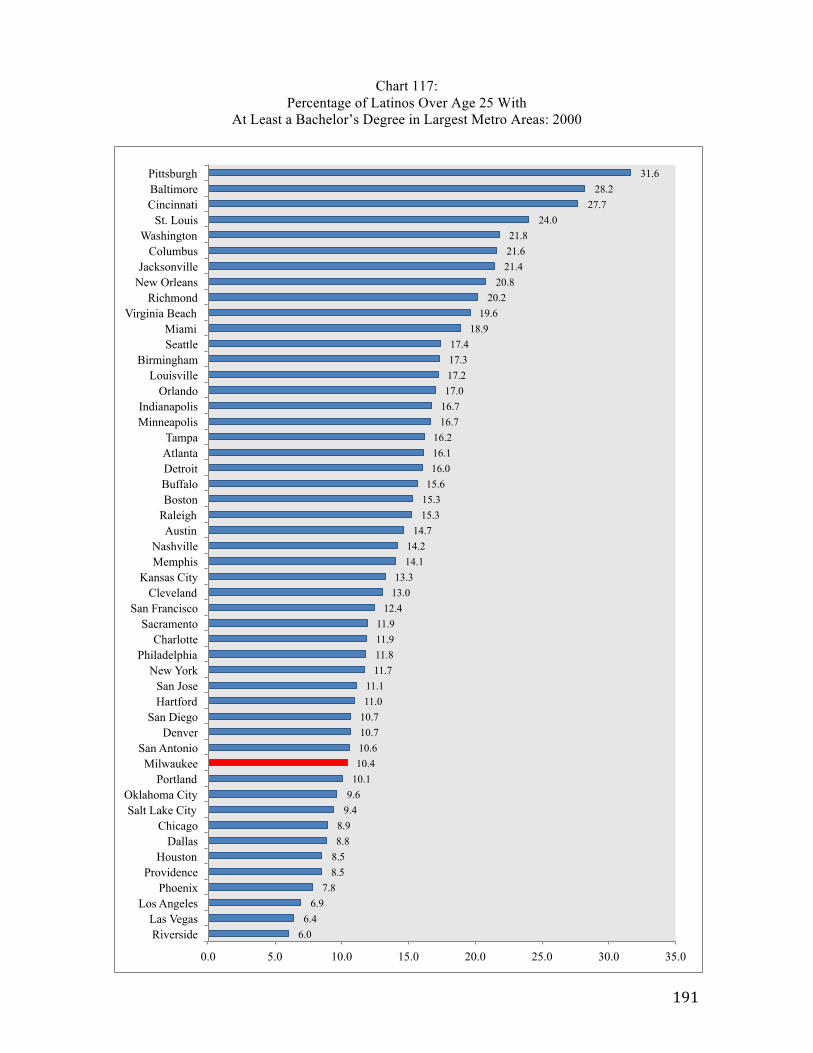
191
Chart 117: Percentage of Latinos Over Age 25 With
At Least a Bachelor’s Degree in Largest Metro Areas: 2000
6.0 6.4
6.9 7.8
8.5 8.5 8.8 8.9
9.4 9.6 10.1 10.4 10.6 10.7 10.7 11.0 11.1
11.7 11.8 11.9 11.9
12.4 13.0 13.3
14.1 14.2
14.7 15.3 15.3 15.6 16.0 16.1 16.2
16.7 16.7 17.0 17.2 17.3 17.4
18.9 19.6
20.2 20.8
21.4 21.6 21.8
24.0 27.7
28.2 31.6
0.0 5.0 10.0 15.0 20.0 25.0 30.0 35.0
Riverside Las Vegas
Los Angeles Phoenix
Providence Houston
Dallas Chicago
Salt Lake City Oklahoma City
Portland Milwaukee
San Antonio Denver
San Diego Hartford San Jose
New York Philadelphia
Charlotte Sacramento
San Francisco Cleveland
Kansas City Memphis Nashville
Austin Raleigh Boston Buffalo Detroit Atlanta Tampa
Minneapolis Indianapolis
Orlando Louisville
Birmingham Seattle Miami
Virginia Beach Richmond
New Orleans Jacksonville
Columbus Washington
St. Louis Cincinnati Baltimore Pittsburgh
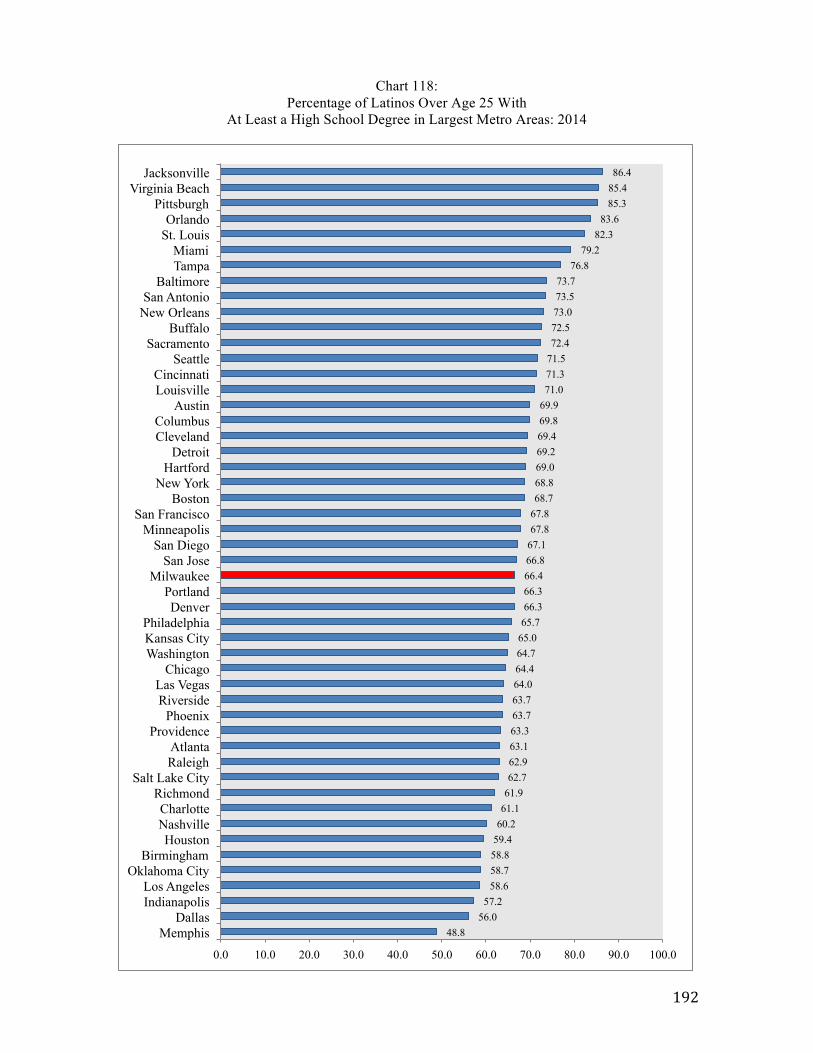
192
Chart 118: Percentage of Latinos Over Age 25 With
At Least a High School Degree in Largest Metro Areas: 2014
48.8 56.0 57.2
58.6 58.7 58.8 59.4 60.2 61.1 61.9 62.7 62.9 63.1 63.3 63.7 63.7 64.0 64.4 64.7 65.0 65.7 66.3 66.3 66.4 66.8 67.1 67.8 67.8 68.7 68.8 69.0 69.2 69.4 69.8 69.9 71.0 71.3 71.5 72.4 72.5 73.0 73.5 73.7
76.8 79.2
82.3 83.6
85.3 85.4 86.4
0.0 10.0 20.0 30.0 40.0 50.0 60.0 70.0 80.0 90.0 100.0
Memphis Dallas
Indianapolis Los Angeles
Oklahoma City Birmingham
Houston Nashville Charlotte
Richmond Salt Lake City
Raleigh Atlanta
Providence Phoenix
Riverside Las Vegas
Chicago Washington Kansas City Philadelphia
Denver Portland
Milwaukee San Jose
San Diego Minneapolis
San Francisco Boston
New York Hartford
Detroit Cleveland Columbus
Austin Louisville Cincinnati
Seattle Sacramento
Buffalo New Orleans San Antonio
Baltimore Tampa Miami
St. Louis Orlando
Pittsburgh Virginia Beach
Jacksonville
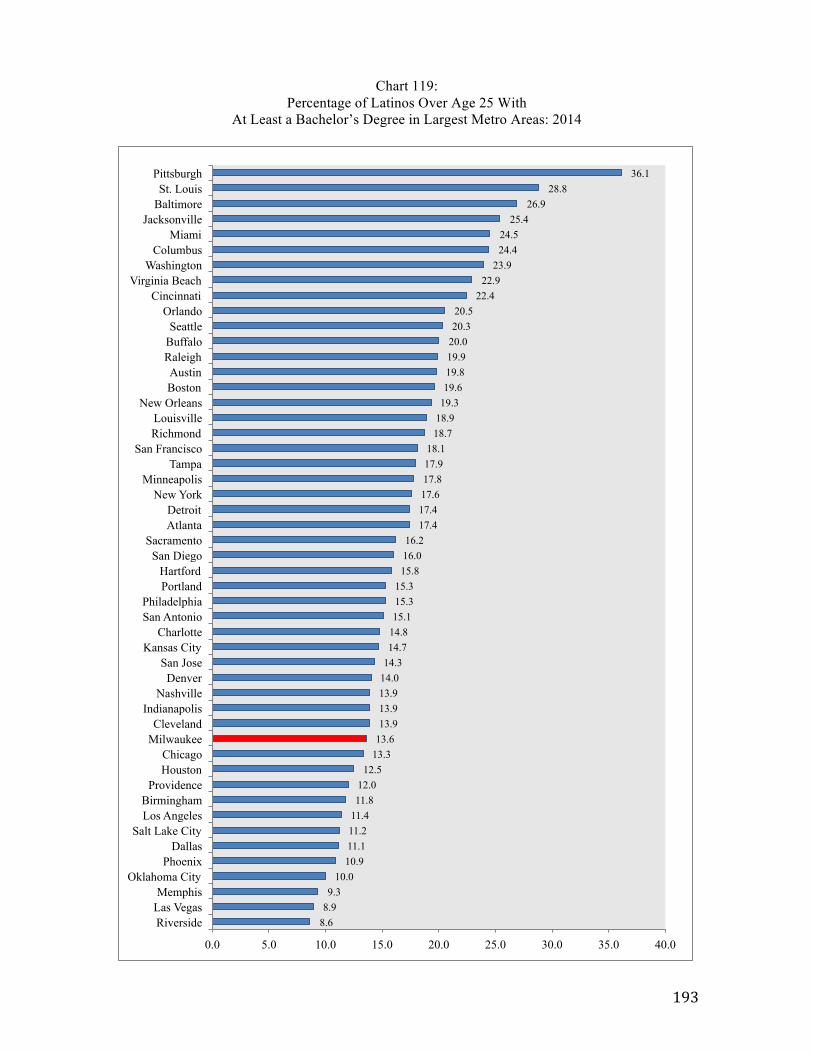
193
Chart 119: Percentage of Latinos Over Age 25 With
At Least a Bachelor’s Degree in Largest Metro Areas: 2014
8.6 8.9 9.3
10.0 10.9 11.1 11.2 11.4 11.8 12.0
12.5 13.3 13.6 13.9 13.9 13.9 14.0 14.3 14.7 14.8 15.1 15.3 15.3
15.8 16.0 16.2
17.4 17.4 17.6 17.8 17.9 18.1
18.7 18.9 19.3 19.6 19.8 19.9 20.0 20.3 20.5
22.4 22.9
23.9 24.4 24.5
25.4 26.9
28.8 36.1
0.0 5.0 10.0 15.0 20.0 25.0 30.0 35.0 40.0
Riverside Las Vegas Memphis
Oklahoma City Phoenix
Dallas Salt Lake City
Los Angeles Birmingham
Providence Houston Chicago
Milwaukee Cleveland
Indianapolis Nashville
Denver San Jose
Kansas City Charlotte
San Antonio Philadelphia
Portland Hartford
San Diego Sacramento
Atlanta Detroit
New York Minneapolis
Tampa San Francisco
Richmond Louisville
New Orleans Boston Austin
Raleigh Buffalo Seattle
Orlando Cincinnati
Virginia Beach Washington
Columbus Miami
Jacksonville Baltimore St. Louis
Pittsburgh
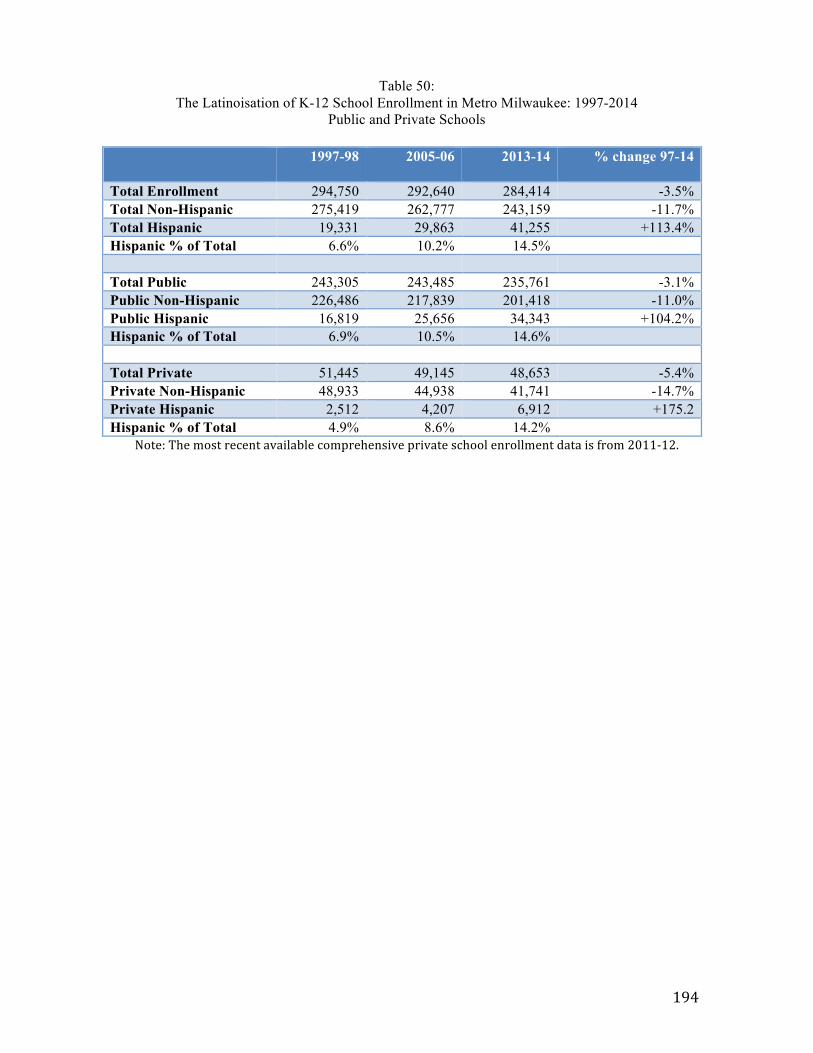
194
Table 50: The Latinoisation of K-12 School Enrollment in Metro Milwaukee: 1997-2014
Public and Private Schools
1997-98 2005-06 2013-14 % change 97-14
Total Enrollment 294,750 292,640 284,414 -3.5% Total Non-Hispanic 275,419 262,777 243,159 -11.7% Total Hispanic 19,331 29,863 41,255 +113.4% Hispanic % of Total 6.6% 10.2% 14.5% Total Public 243,305 243,485 235,761 -3.1% Public Non-Hispanic 226,486 217,839 201,418 -11.0% Public Hispanic 16,819 25,656 34,343 +104.2% Hispanic % of Total 6.9% 10.5% 14.6% Total Private 51,445 49,145 48,653 -5.4% Private Non-Hispanic 48,933 44,938 41,741 -14.7% Private Hispanic 2,512 4,207 6,912 +175.2 Hispanic % of Total 4.9% 8.6% 14.2%
Note: The most recent available comprehensive private school enrollment data is from 2011-‐12.
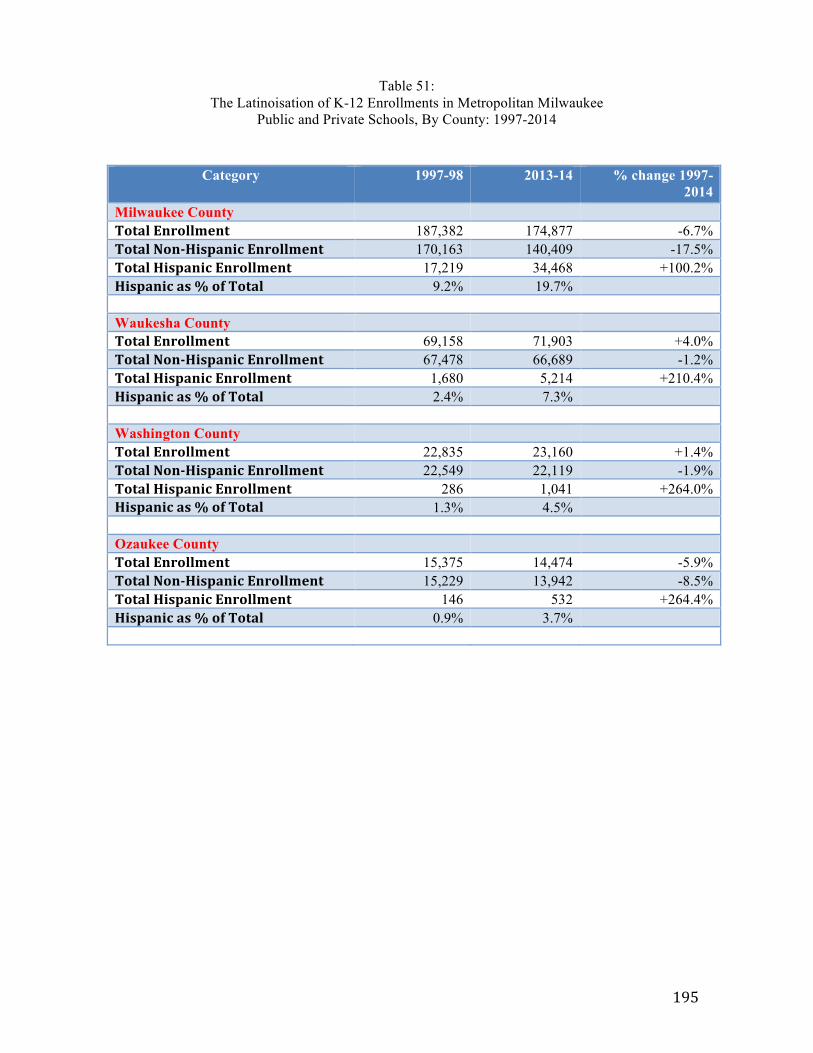
195
Table 51: The Latinoisation of K-12 Enrollments in Metropolitan Milwaukee
Public and Private Schools, By County: 1997-2014
Category 1997-98 2013-14 % change 1997-2014
Milwaukee County Total Enrollment 187,382 174,877 -6.7% Total Non-‐Hispanic Enrollment 170,163 140,409 -17.5% Total Hispanic Enrollment 17,219 34,468 +100.2% Hispanic as % of Total 9.2% 19.7% Waukesha County Total Enrollment 69,158 71,903 +4.0% Total Non-‐Hispanic Enrollment 67,478 66,689 -1.2% Total Hispanic Enrollment 1,680 5,214 +210.4% Hispanic as % of Total 2.4% 7.3% Washington County Total Enrollment 22,835 23,160 +1.4% Total Non-‐Hispanic Enrollment 22,549 22,119 -1.9% Total Hispanic Enrollment 286 1,041 +264.0% Hispanic as % of Total 1.3% 4.5% Ozaukee County Total Enrollment 15,375 14,474 -5.9% Total Non-‐Hispanic Enrollment 15,229 13,942 -8.5% Total Hispanic Enrollment 146 532 +264.4% Hispanic as % of Total 0.9% 3.7%
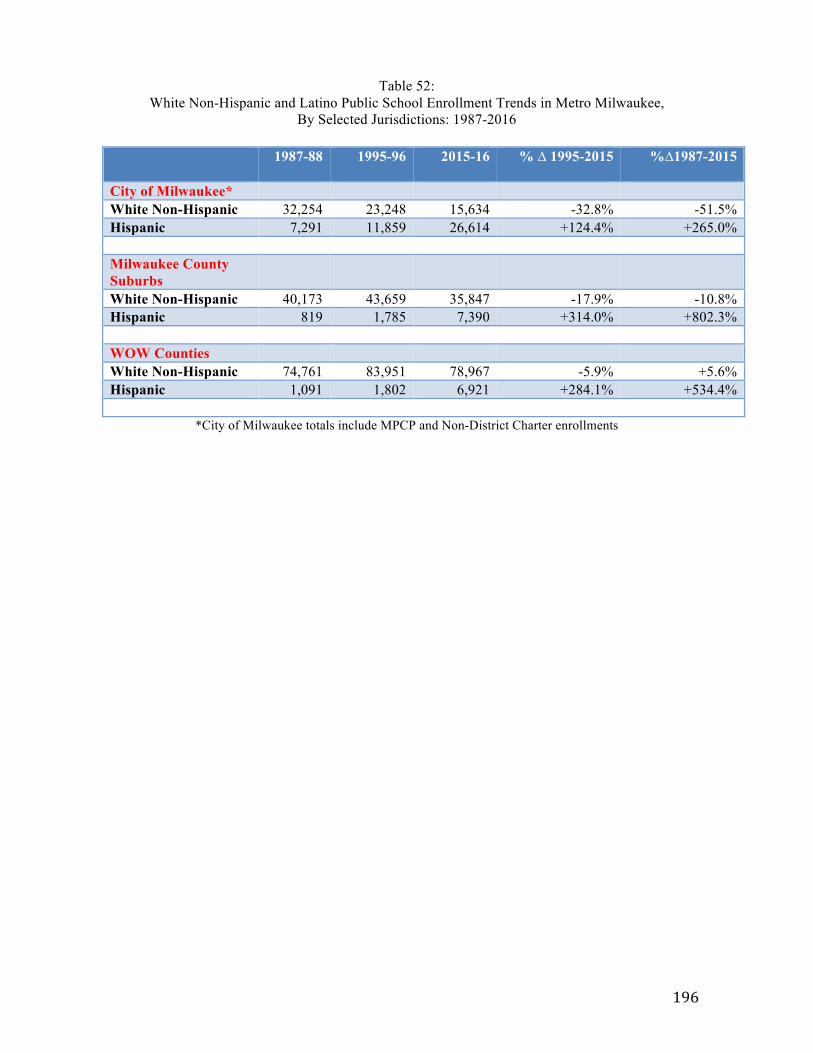
196
Table 52: White Non-Hispanic and Latino Public School Enrollment Trends in Metro Milwaukee,
By Selected Jurisdictions: 1987-2016
1987-88 1995-96 2015-16 % ∆ 1995-2015
%∆1987-2015
City of Milwaukee* White Non-Hispanic 32,254 23,248 15,634 -32.8% -51.5% Hispanic 7,291 11,859 26,614 +124.4% +265.0% Milwaukee County Suburbs
White Non-Hispanic 40,173 43,659 35,847 -17.9% -10.8% Hispanic 819 1,785 7,390 +314.0% +802.3% WOW Counties White Non-Hispanic 74,761 83,951 78,967 -5.9% +5.6% Hispanic 1,091 1,802 6,921 +284.1% +534.4%
*City of Milwaukee totals include MPCP and Non-District Charter enrollments
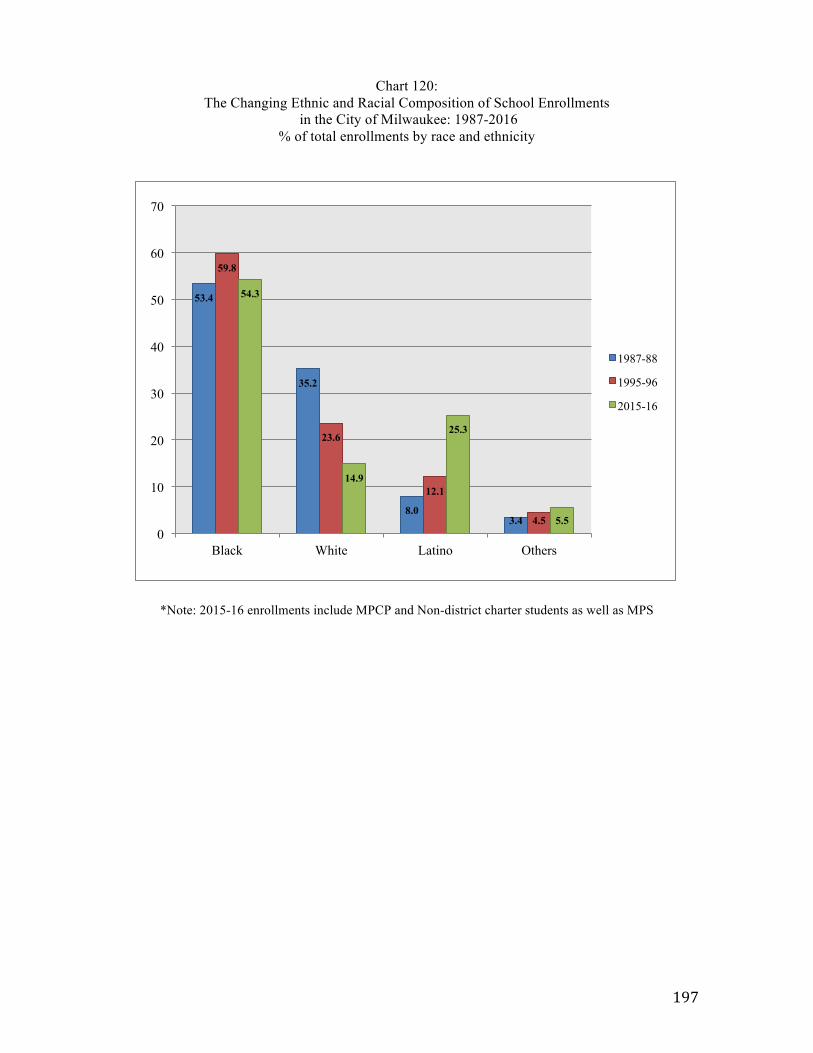
197
Chart 120: The Changing Ethnic and Racial Composition of School Enrollments
in the City of Milwaukee: 1987-2016 % of total enrollments by race and ethnicity
*Note: 2015-16 enrollments include MPCP and Non-district charter students as well as MPS
53.4
35.2
8.0 3.4
59.8
23.6
12.1
4.5
54.3
14.9
25.3
5.5 0
10
20
30
40
50
60
70
Black White Latino Others
1987-88
1995-96
2015-16
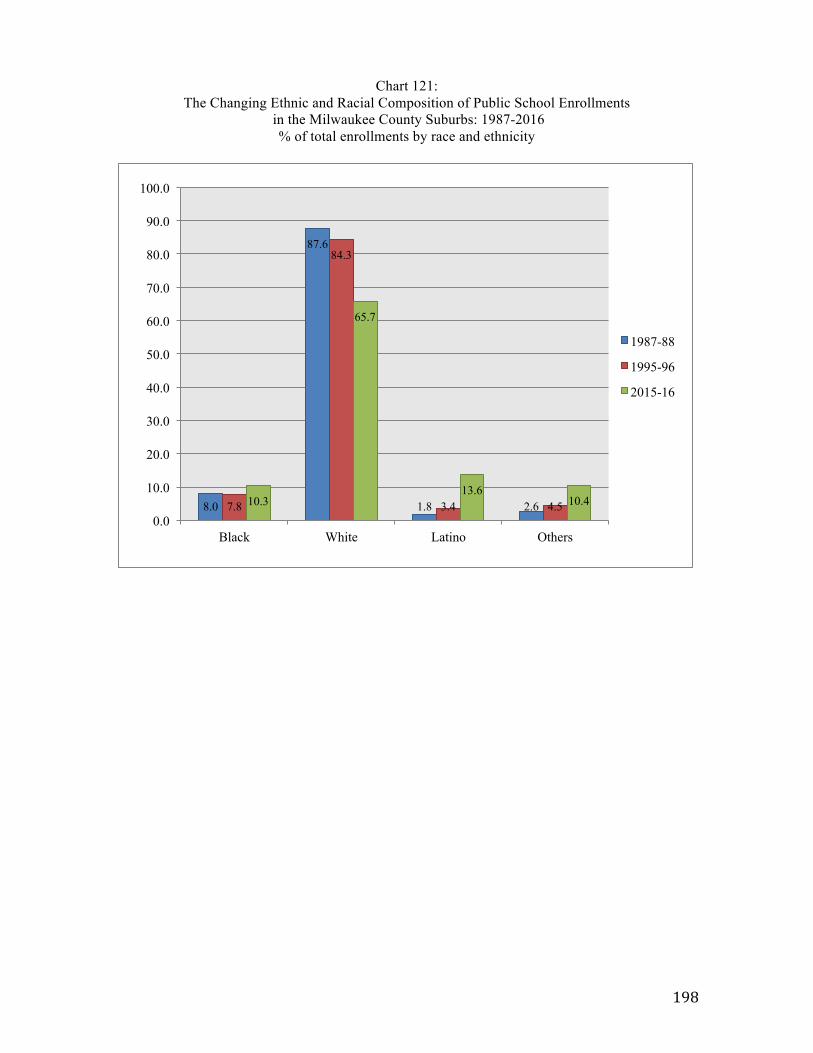
198
Chart 121: The Changing Ethnic and Racial Composition of Public School Enrollments
in the Milwaukee County Suburbs: 1987-2016 % of total enrollments by race and ethnicity
8.0
87.6
1.8 2.6 7.8
84.3
3.4 4.5 10.3
65.7
13.6 10.4
0.0
10.0
20.0
30.0
40.0
50.0
60.0
70.0
80.0
90.0
100.0
Black White Latino Others
1987-88
1995-96
2015-16
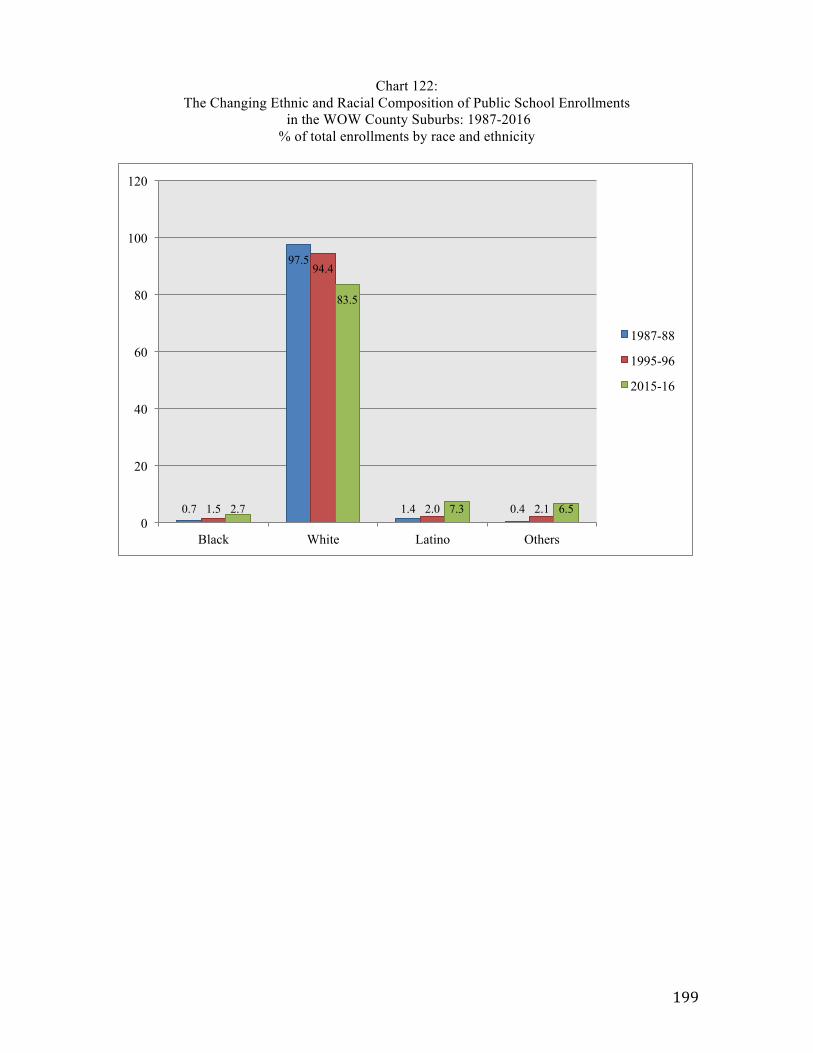
199
Chart 122: The Changing Ethnic and Racial Composition of Public School Enrollments
in the WOW County Suburbs: 1987-2016 % of total enrollments by race and ethnicity
0.7
97.5
1.4 0.4 1.5
94.4
2.0 2.1 2.7
83.5
7.3 6.5 0
20
40
60
80
100
120
Black White Latino Others
1987-88
1995-96
2015-16
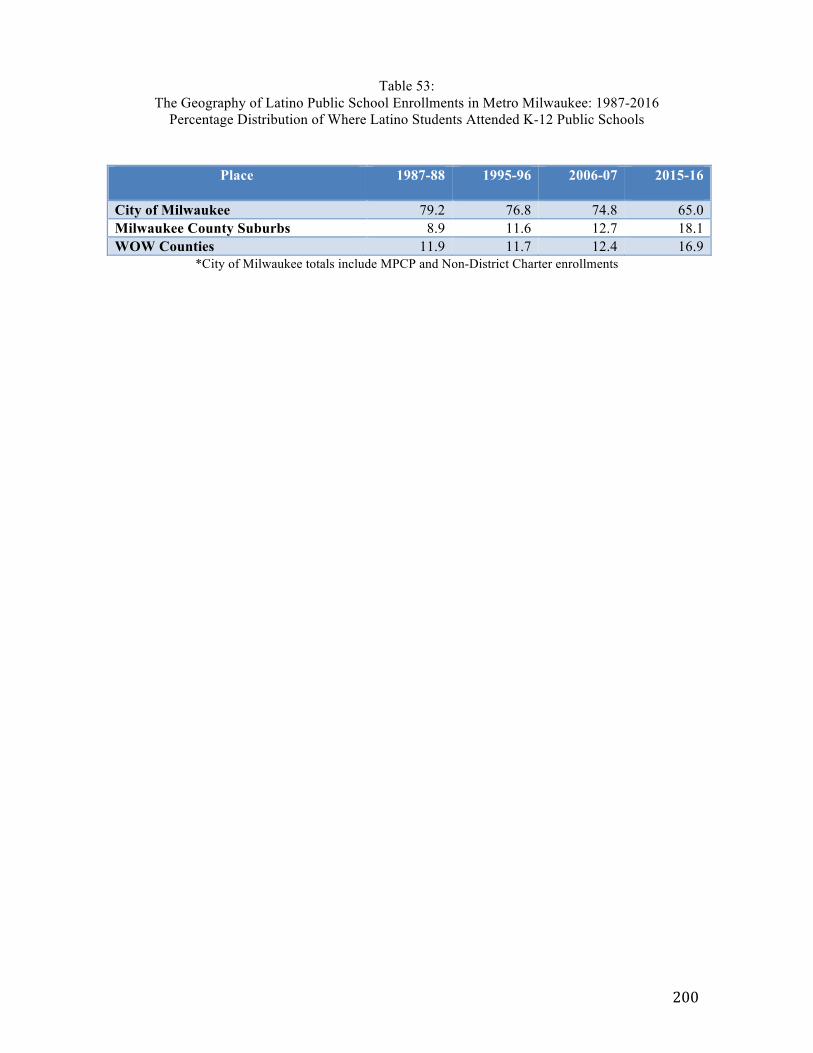
200
Table 53: The Geography of Latino Public School Enrollments in Metro Milwaukee: 1987-2016
Percentage Distribution of Where Latino Students Attended K-12 Public Schools
Place 1987-88 1995-96 2006-07 2015-16
City of Milwaukee 79.2 76.8 74.8 65.0 Milwaukee County Suburbs 8.9 11.6 12.7 18.1 WOW Counties 11.9 11.7 12.4 16.9
*City of Milwaukee totals include MPCP and Non-District Charter enrollments
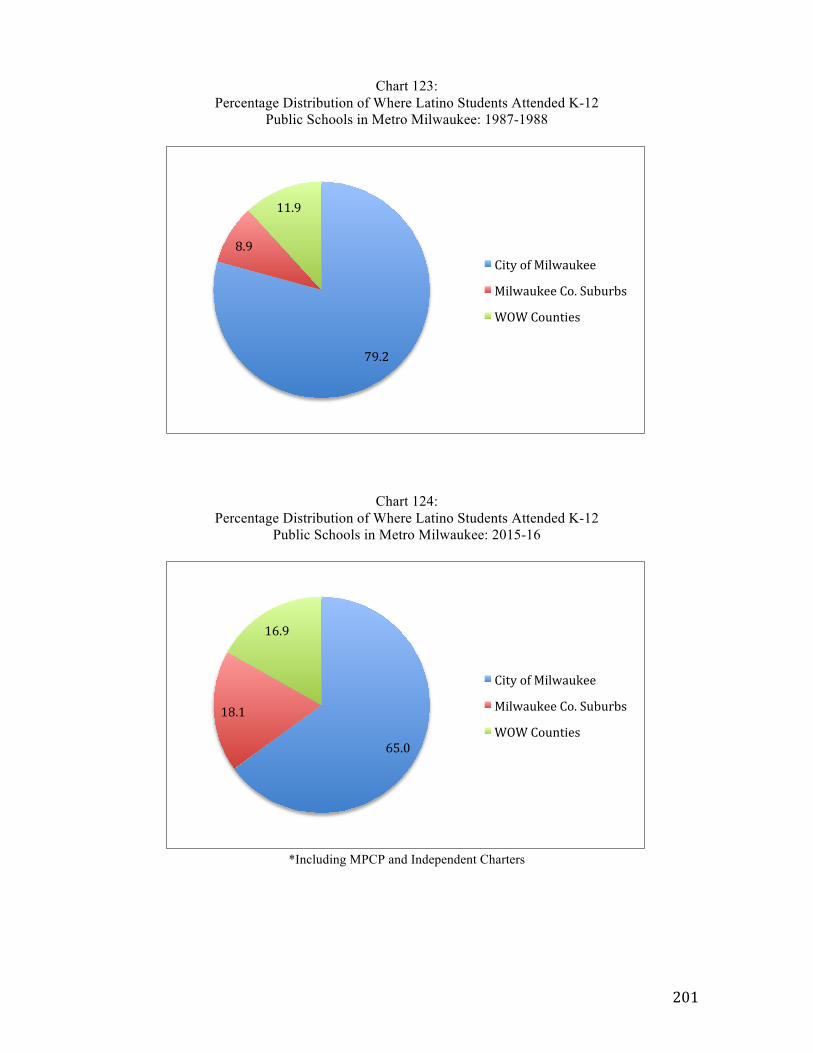
201
Chart 123: Percentage Distribution of Where Latino Students Attended K-12
Public Schools in Metro Milwaukee: 1987-1988
Chart 124: Percentage Distribution of Where Latino Students Attended K-12
Public Schools in Metro Milwaukee: 2015-16
*Including MPCP and Independent Charters
79.2
8.9
11.9
City of Milwaukee
Milwaukee Co. Suburbs
WOW Counties
65.0
18.1
16.9
City of Milwaukee
Milwaukee Co. Suburbs
WOW Counties
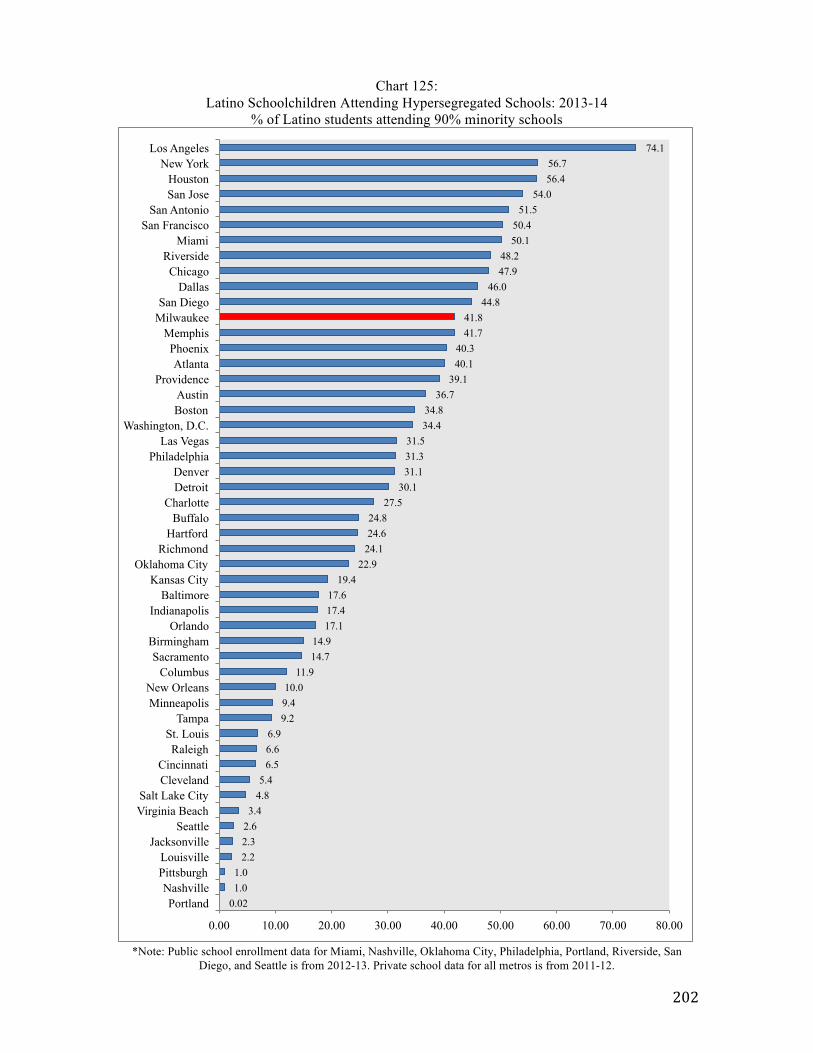
202
Chart 125: Latino Schoolchildren Attending Hypersegregated Schools: 2013-14
% of Latino students attending 90% minority schools
*Note: Public school enrollment data for Miami, Nashville, Oklahoma City, Philadelphia, Portland, Riverside, San
Diego, and Seattle is from 2012-13. Private school data for all metros is from 2011-12.
0.02 1.0 1.0
2.2 2.3 2.6 3.4
4.8 5.4
6.5 6.6 6.9
9.2 9.4 10.0
11.9 14.7 14.9
17.1 17.4 17.6
19.4 22.9
24.1 24.6 24.8
27.5 30.1
31.1 31.3 31.5
34.4 34.8
36.7 39.1
40.1 40.3
41.7 41.8
44.8 46.0
47.9 48.2
50.1 50.4
51.5 54.0
56.4 56.7
74.1
0.00 10.00 20.00 30.00 40.00 50.00 60.00 70.00 80.00
Portland Nashville
Pittsburgh Louisville
Jacksonville Seattle
Virginia Beach Salt Lake City
Cleveland Cincinnati
Raleigh St. Louis
Tampa Minneapolis New Orleans
Columbus Sacramento
Birmingham Orlando
Indianapolis Baltimore
Kansas City Oklahoma City
Richmond Hartford
Buffalo Charlotte
Detroit Denver
Philadelphia Las Vegas
Washington, D.C. Boston Austin
Providence Atlanta
Phoenix Memphis
Milwaukee San Diego
Dallas Chicago
Riverside Miami
San Francisco San Antonio
San Jose Houston
New York Los Angeles
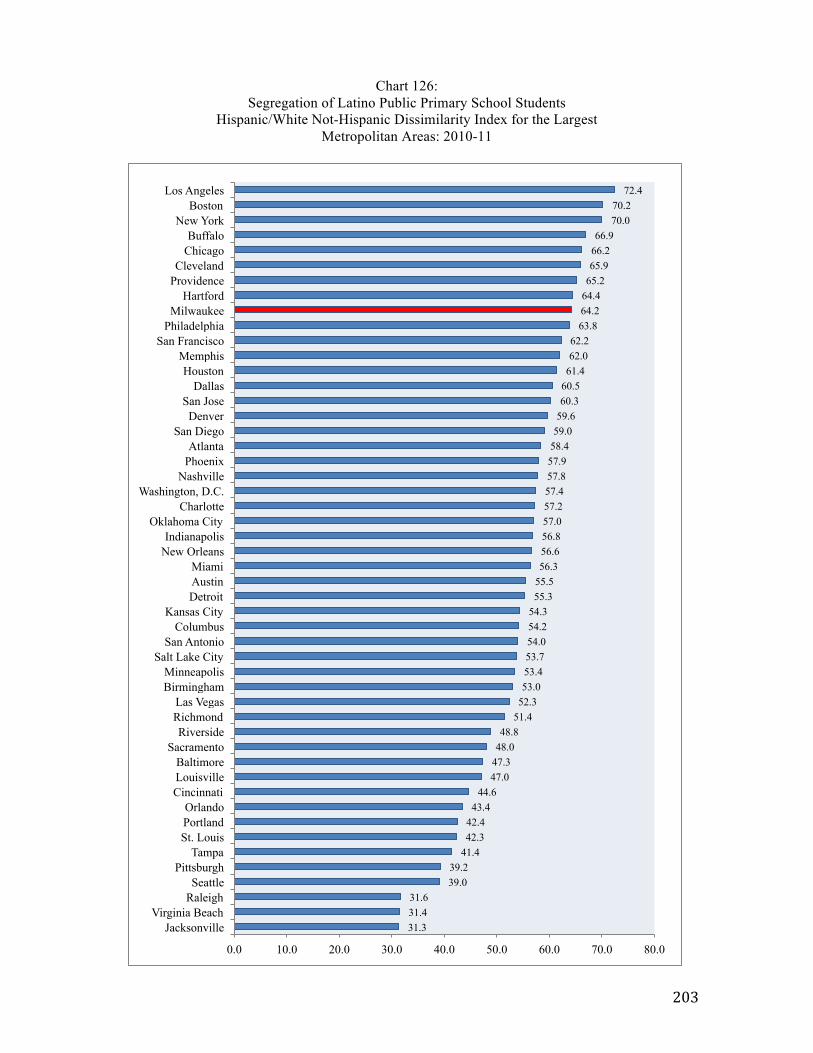
203
Chart 126: Segregation of Latino Public Primary School Students
Hispanic/White Not-Hispanic Dissimilarity Index for the Largest Metropolitan Areas: 2010-11
31.3 31.4 31.6
39.0 39.2
41.4 42.3 42.4 43.4
44.6 47.0 47.3 48.0 48.8
51.4 52.3 53.0 53.4 53.7 54.0 54.2 54.3 55.3 55.5 56.3 56.6 56.8 57.0 57.2 57.4 57.8 57.9 58.4 59.0 59.6 60.3 60.5 61.4 62.0 62.2
63.8 64.2 64.4 65.2 65.9 66.2 66.9
70.0 70.2
72.4
0.0 10.0 20.0 30.0 40.0 50.0 60.0 70.0 80.0
Jacksonville Virginia Beach
Raleigh Seattle
Pittsburgh Tampa
St. Louis Portland Orlando
Cincinnati Louisville Baltimore
Sacramento Riverside
Richmond Las Vegas
Birmingham Minneapolis
Salt Lake City San Antonio
Columbus Kansas City
Detroit Austin Miami
New Orleans Indianapolis
Oklahoma City Charlotte
Washington, D.C. Nashville
Phoenix Atlanta
San Diego Denver
San Jose Dallas
Houston Memphis
San Francisco Philadelphia
Milwaukee Hartford
Providence Cleveland
Chicago Buffalo
New York Boston
Los Angeles
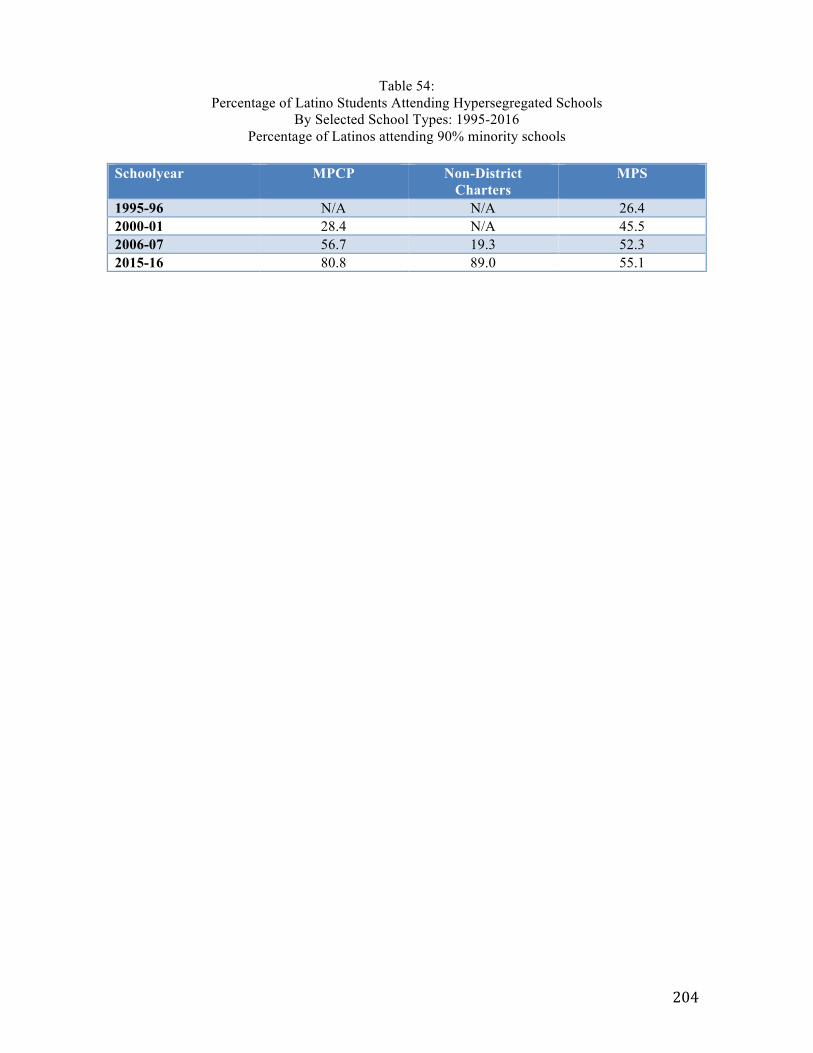
204
Table 54: Percentage of Latino Students Attending Hypersegregated Schools
By Selected School Types: 1995-2016 Percentage of Latinos attending 90% minority schools
Schoolyear MPCP Non-District
Charters MPS
1995-96 N/A N/A 26.4 2000-01 28.4 N/A 45.5 2006-07 56.7 19.3 52.3 2015-16 80.8 89.0 55.1
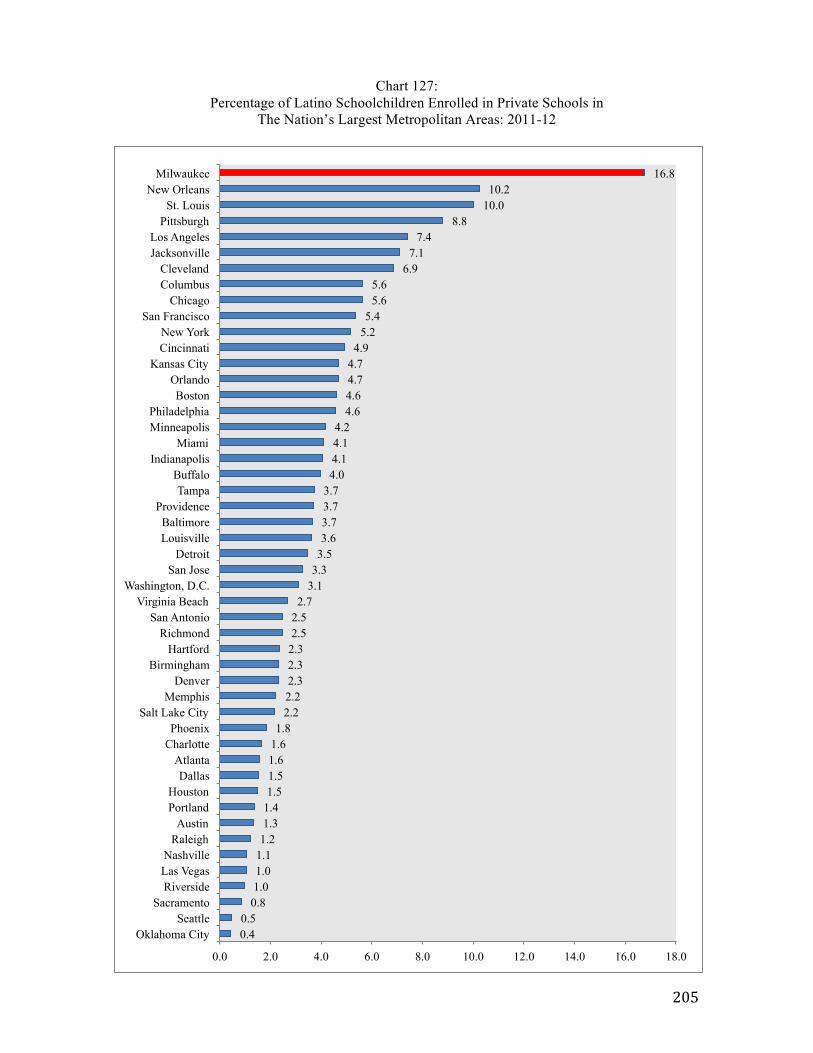
205
Chart 127: Percentage of Latino Schoolchildren Enrolled in Private Schools in
The Nation’s Largest Metropolitan Areas: 2011-12
0.4 0.5
0.8 1.0 1.0 1.1 1.2 1.3 1.4 1.5 1.5 1.6 1.6 1.8
2.2 2.2 2.3 2.3 2.3 2.5 2.5 2.7
3.1 3.3 3.5 3.6 3.7 3.7 3.7 4.0 4.1 4.1 4.2
4.6 4.6 4.7 4.7 4.9
5.2 5.4
5.6 5.6
6.9 7.1
7.4 8.8
10.0 10.2
16.8
0.0 2.0 4.0 6.0 8.0 10.0 12.0 14.0 16.0 18.0
Oklahoma City Seattle
Sacramento Riverside Las Vegas Nashville
Raleigh Austin
Portland Houston
Dallas Atlanta
Charlotte Phoenix
Salt Lake City Memphis
Denver Birmingham
Hartford Richmond
San Antonio Virginia Beach
Washington, D.C. San Jose
Detroit Louisville Baltimore
Providence Tampa
Buffalo Indianapolis
Miami Minneapolis Philadelphia
Boston Orlando
Kansas City Cincinnati New York
San Francisco Chicago
Columbus Cleveland
Jacksonville Los Angeles
Pittsburgh St. Louis
New Orleans Milwaukee
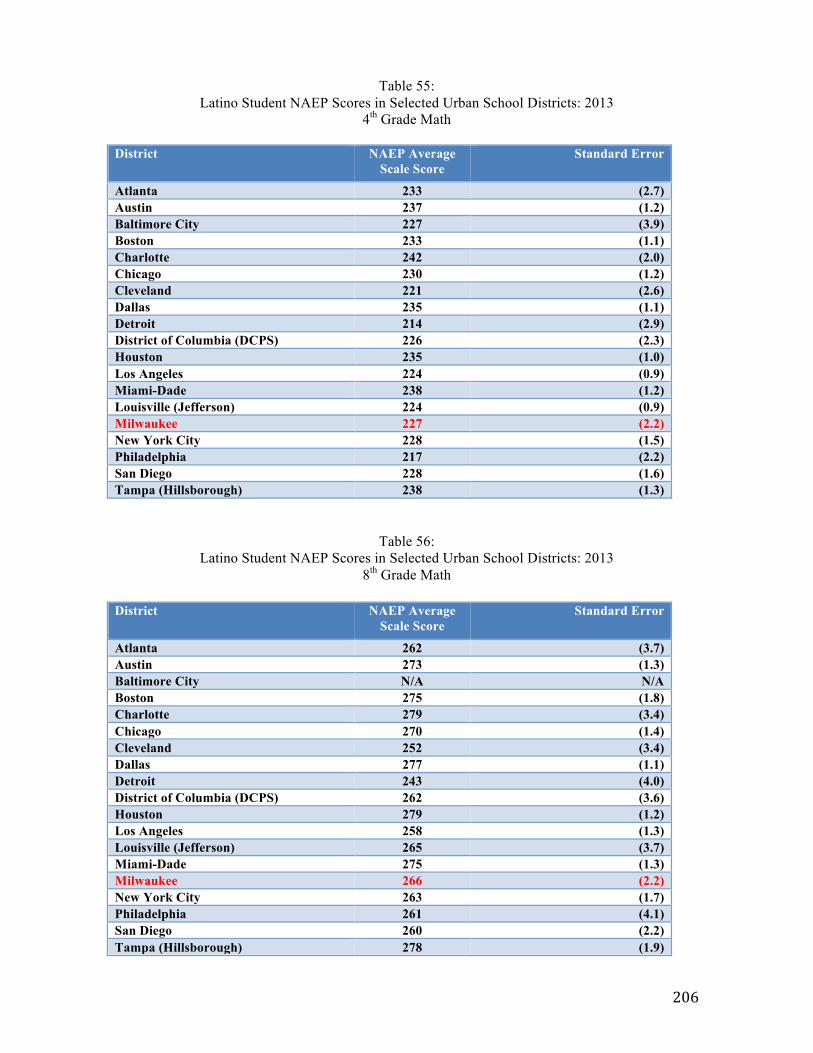
206
Table 55: Latino Student NAEP Scores in Selected Urban School Districts: 2013
4th Grade Math District NAEP Average
Scale Score Standard Error
Atlanta 233 (2.7) Austin 237 (1.2) Baltimore City 227 (3.9) Boston 233 (1.1) Charlotte 242 (2.0) Chicago 230 (1.2) Cleveland 221 (2.6) Dallas 235 (1.1) Detroit 214 (2.9) District of Columbia (DCPS) 226 (2.3) Houston 235 (1.0) Los Angeles 224 (0.9) Miami-Dade 238 (1.2) Louisville (Jefferson) 224 (0.9) Milwaukee 227 (2.2) New York City 228 (1.5) Philadelphia 217 (2.2) San Diego 228 (1.6) Tampa (Hillsborough) 238 (1.3)
Table 56: Latino Student NAEP Scores in Selected Urban School Districts: 2013
8th Grade Math District NAEP Average
Scale Score Standard Error
Atlanta 262 (3.7) Austin 273 (1.3) Baltimore City N/A N/A Boston 275 (1.8) Charlotte 279 (3.4) Chicago 270 (1.4) Cleveland 252 (3.4) Dallas 277 (1.1) Detroit 243 (4.0) District of Columbia (DCPS) 262 (3.6) Houston 279 (1.2) Los Angeles 258 (1.3) Louisville (Jefferson) 265 (3.7) Miami-Dade 275 (1.3) Milwaukee 266 (2.2) New York City 263 (1.7) Philadelphia 261 (4.1) San Diego 260 (2.2) Tampa (Hillsborough) 278 (1.9)
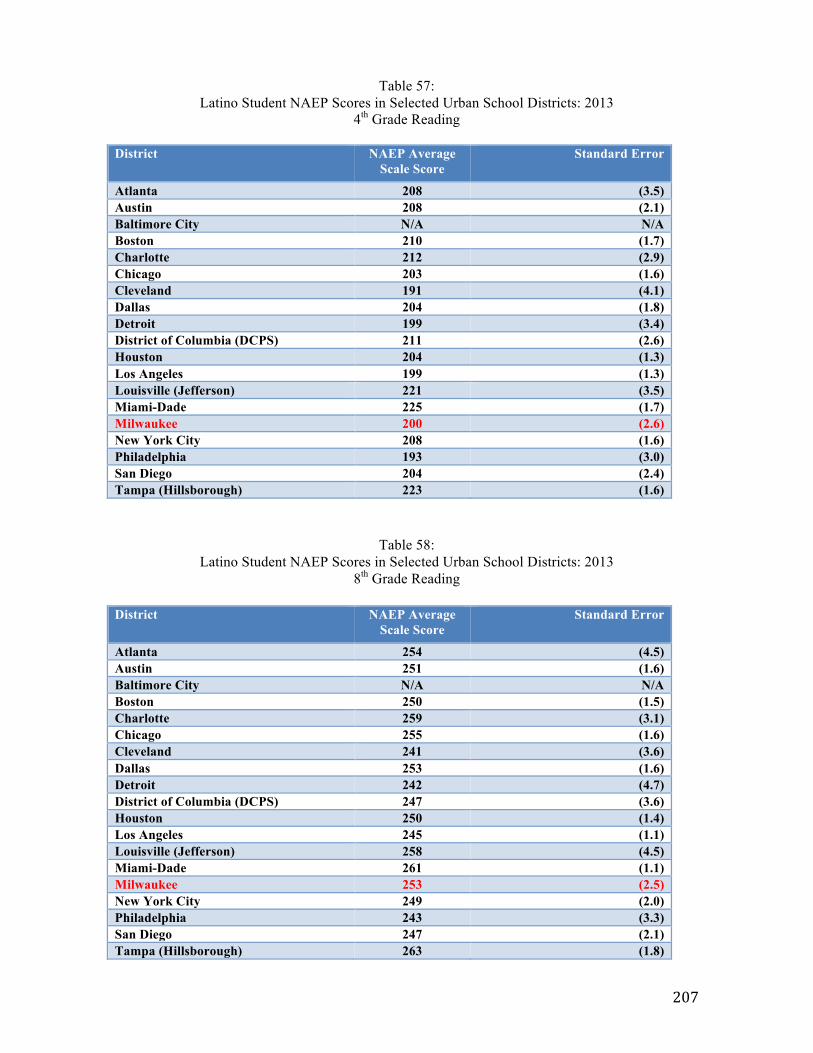
207
Table 57: Latino Student NAEP Scores in Selected Urban School Districts: 2013
4th Grade Reading District NAEP Average
Scale Score Standard Error
Atlanta 208 (3.5) Austin 208 (2.1) Baltimore City N/A N/A Boston 210 (1.7) Charlotte 212 (2.9) Chicago 203 (1.6) Cleveland 191 (4.1) Dallas 204 (1.8) Detroit 199 (3.4) District of Columbia (DCPS) 211 (2.6) Houston 204 (1.3) Los Angeles 199 (1.3) Louisville (Jefferson) 221 (3.5) Miami-Dade 225 (1.7) Milwaukee 200 (2.6) New York City 208 (1.6) Philadelphia 193 (3.0) San Diego 204 (2.4) Tampa (Hillsborough) 223 (1.6)
Table 58: Latino Student NAEP Scores in Selected Urban School Districts: 2013
8th Grade Reading District NAEP Average
Scale Score Standard Error
Atlanta 254 (4.5) Austin 251 (1.6) Baltimore City N/A N/A Boston 250 (1.5) Charlotte 259 (3.1) Chicago 255 (1.6) Cleveland 241 (3.6) Dallas 253 (1.6) Detroit 242 (4.7) District of Columbia (DCPS) 247 (3.6) Houston 250 (1.4) Los Angeles 245 (1.1) Louisville (Jefferson) 258 (4.5) Miami-Dade 261 (1.1) Milwaukee 253 (2.5) New York City 249 (2.0) Philadelphia 243 (3.3) San Diego 247 (2.1) Tampa (Hillsborough) 263 (1.8)
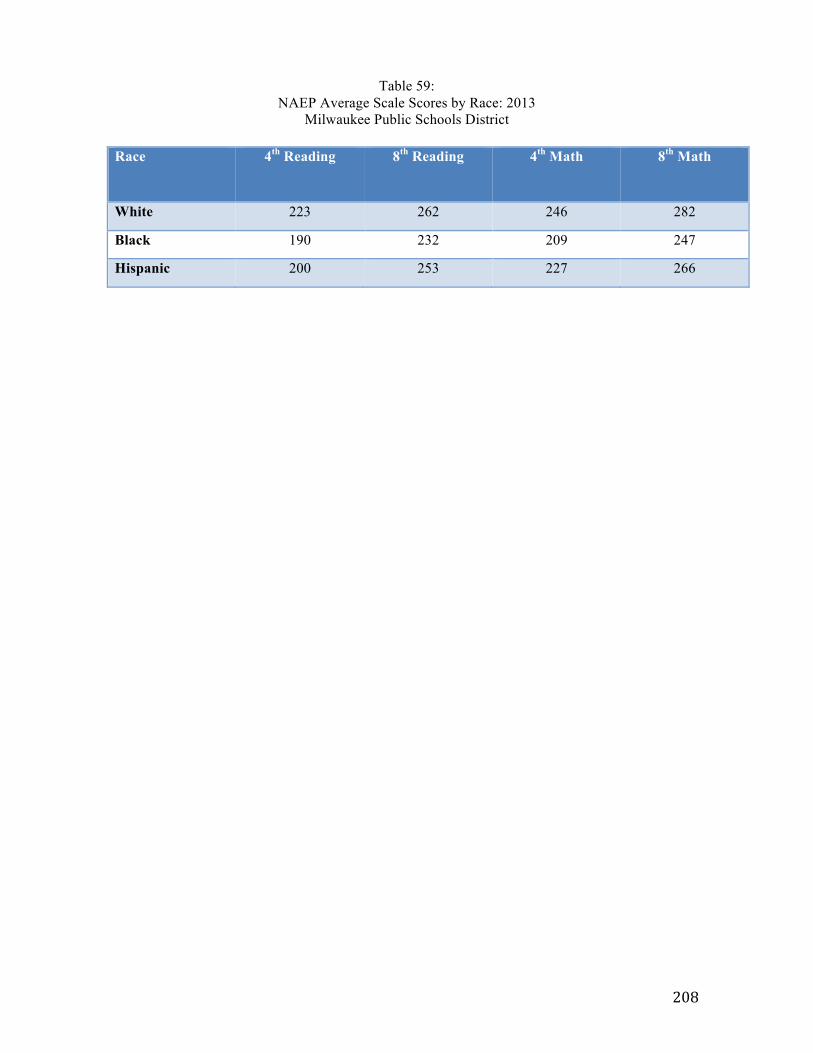
208
Table 59: NAEP Average Scale Scores by Race: 2013
Milwaukee Public Schools District
Race
4th Reading 8th Reading 4th Math 8th Math
White 223 262 246 282
Black 190 232 209 247
Hispanic 200 253 227 266
209
INCARCERATION TRENDS
Mass incarceration –in particular, the stunning rates of imprisonment for African
American males-- has become a major issue in the United States. Unfortunately, it is very
difficult to get reliable data on incarceration rates in cities or metropolitan areas across the
country. For the purposes of comparison, we present here data, drawn from the U.S.
Census Bureau as well as the State of Wisconsin Department of Corrections, on Latino
incarceration rates in the state. Although these are statewide data, in light of the heavy
concentration of Latinos in the Milwaukee metropolitan area, it is likely, though obviously
not certain, that Milwaukee trends mirror the state pattern.
Charts 128 and 129 show the incarceration rates for Latino males and females, ages 20-
64, in all fifty states. 1.95 percent of Latino males in Wisconsin were incarcerated in 2010,
which ranked as the 34th highest level among the 50 states (a far cry from the highest in the
nation ranking for black male incarceration in Wisconsin in 2010). Fewer than one-tenth of
one percent of Wisconsin Latinas were incarcerated in 2010, placing Wisconsin 38th on
this measure.
Table 60 reveals how male incarceration rates have grown in Wisconsin since 1970, for
all three racial groups, but especially, as is well known, for African America males. Latino
male incarceration rates grew rapidly between 1980 and 1990, but have declined since
then. The Latino male incarceration in Wisconsin in 2010 was one-sixth as high as the rate
for African American males.
Finally, Table 61 arrays, for all racial groups in Wisconsin in 2013, the percentage of
males in selected age cohorts who were in prison or under the supervision of the State
Department of Corrections; in other words, “in the system.” The rates for all three racial
groups are the highest in the cohorts between 25-44, with the Latino male rates higher than
WNH male rates, but substantially lower than the African American male rates. The
highest rate of being “in the system” for Latino males is in the 35-44 age cohort (7.1
percent); for African American males between 30-34, by contrast, over one-third are in
prison, on parole, or on probation; and for non-Hispanic white males, the highest “in the
system” cohort is 25-29 year olds, with a rate of 5.1 percent.
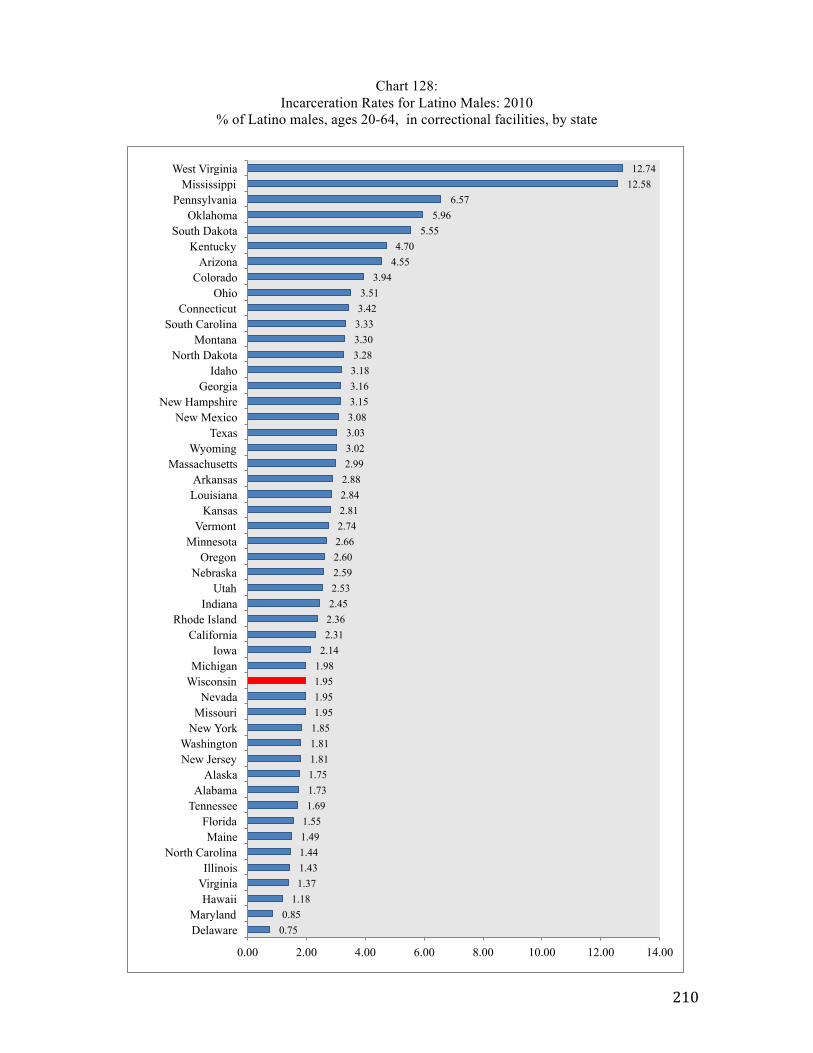
210
Chart 128: Incarceration Rates for Latino Males: 2010
% of Latino males, ages 20-64, in correctional facilities, by state
0.75 0.85
1.18 1.37 1.43 1.44 1.49 1.55 1.69 1.73 1.75 1.81 1.81 1.85 1.95 1.95 1.95 1.98 2.14 2.31 2.36 2.45 2.53 2.59 2.60 2.66 2.74 2.81 2.84 2.88 2.99 3.02 3.03 3.08 3.15 3.16 3.18 3.28 3.30 3.33 3.42 3.51
3.94 4.55 4.70
5.55 5.96
6.57 12.58 12.74
0.00 2.00 4.00 6.00 8.00 10.00 12.00 14.00
Delaware Maryland
Hawaii Virginia Illinois
North Carolina Maine
Florida Tennessee Alabama
Alaska New Jersey Washington
New York Missouri
Nevada Wisconsin Michigan
Iowa California
Rhode Island Indiana
Utah Nebraska
Oregon Minnesota
Vermont Kansas
Louisiana Arkansas
Massachusetts Wyoming
Texas New Mexico
New Hampshire Georgia
Idaho North Dakota
Montana South Carolina
Connecticut Ohio
Colorado Arizona
Kentucky South Dakota
Oklahoma Pennsylvania
Mississippi West Virginia
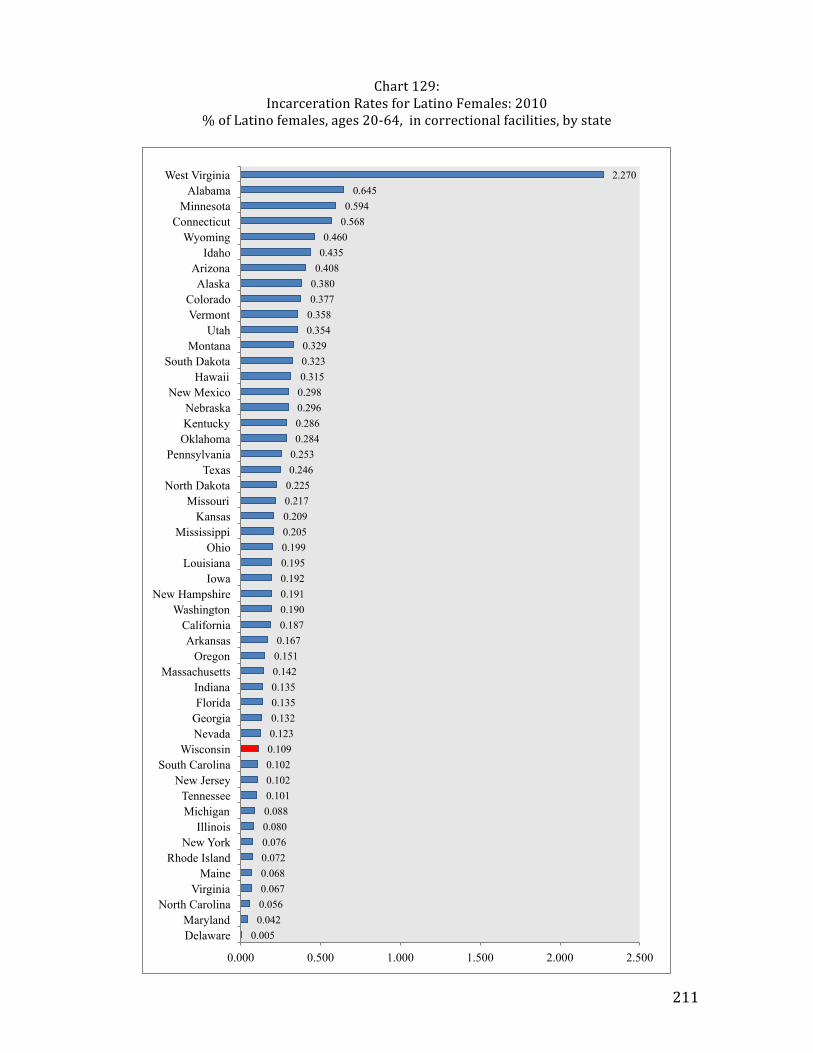
211
Chart 129: Incarceration Rates for Latino Females: 2010
% of Latino females, ages 20-‐64, in correctional facilities, by state
0.005 0.042 0.056 0.067 0.068 0.072 0.076 0.080 0.088 0.101 0.102 0.102 0.109 0.123 0.132 0.135 0.135 0.142 0.151 0.167 0.187 0.190 0.191 0.192 0.195 0.199 0.205 0.209 0.217 0.225 0.246 0.253 0.284 0.286 0.296 0.298 0.315 0.323 0.329 0.354 0.358 0.377 0.380 0.408 0.435 0.460
0.568 0.594
0.645 2.270
0.000 0.500 1.000 1.500 2.000 2.500
Delaware Maryland
North Carolina Virginia
Maine Rhode Island
New York Illinois
Michigan Tennessee
New Jersey South Carolina
Wisconsin Nevada Georgia Florida Indiana
Massachusetts Oregon
Arkansas California
Washington New Hampshire
Iowa Louisiana
Ohio Mississippi
Kansas Missouri
North Dakota Texas
Pennsylvania Oklahoma Kentucky Nebraska
New Mexico Hawaii
South Dakota Montana
Utah Vermont Colorado
Alaska Arizona
Idaho Wyoming
Connecticut Minnesota
Alabama West Virginia
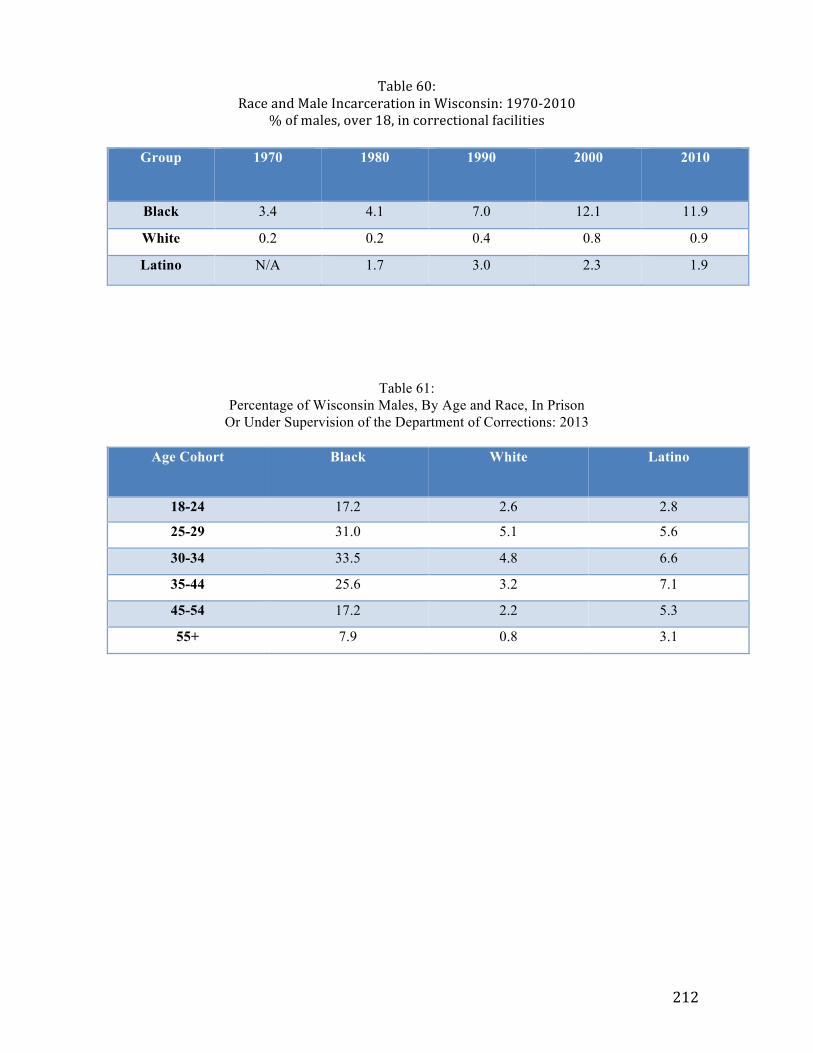
212
Table 60: Race and Male Incarceration in Wisconsin: 1970-‐2010
% of males, over 18, in correctional facilities
Group 1970 1980 1990 2000 2010
Black 3.4 4.1 7.0 12.1 11.9
White 0.2 0.2 0.4 0.8 0.9
Latino N/A 1.7 3.0 2.3 1.9
Table 61: Percentage of Wisconsin Males, By Age and Race, In Prison
Or Under Supervision of the Department of Corrections: 2013
Age Cohort Black White Latino
18-24 17.2 2.6 2.8
25-29 31.0 5.1 5.6
30-34 33.5 4.8 6.6
35-44 25.6 3.2 7.1
45-54 17.2 2.2 5.3
55+ 7.9 0.8 3.1
213
POLITICS
If “demography is destiny,” the trends in Latino population growth in metropolitan areas
across the country hint at profound impacts on local (and national) politics. Questions of
immigration, labor market impacts, borders, voting rights, and “sanctuary cities,” to name
just a few issues flowing from the growing Latino presence in metro areas, are already
generating considerable political heat and likely to continue growing in salience.6
The charts below present some baseline data on Latino partisanship, voter turnout, and
estimates of the Latino share of voters in city electorates. Our data is on the big cities at the
center of America’s largest metropolitan area.
In terms of partisan affiliation, as Chart 130 shows, 98 percent of Latinos are registered
as Democrats in Milwaukee, tied with Minneapolis for the highest rate of urban Latino
Democratic party registration in the country.
Estimates are that 56 percent of registered Latino voters turned out in Milwaukee in the
2012 presidential election (Chart 131), ranking Milwaukee toward the middle (28th) of the
50 big cities analyzed here. Milwaukee’s Latino turnout was much higher than low Latino
turnout cities like Dallas (21 percent), Houston (24 percent), or San Antonio (29 percent);
on par with New Orleans, Phoenix, and Columbus (all at 56 percent); and less than high
Latino turnout cities like Minneapolis (78 percent); San Francisco (77 percent); and
Denver (71 percent).
Finally, Latino voters represent a relatively small share of the Milwaukee city electorate
(only 9 percent), and, by extrapolation, a much lower portion of the metro Milwaukee
electorate (Chart 132). In emerging gateway cities such as Birmingham, Memphis, Atlanta,
and Nashville –with burgeoning Latino communities but large numbers of non-citizens
among them—Latinos represent a tiny fraction of the city electorate, less than three percent
in all those cases. Thus, the relative size of Milwaukee’s Latino electorate places it in the
middle of the 50 cities analyzed here: far smaller than places like Miami, San Antonio,
Hartford, Riverside, Providence, or Los Angeles, where Latinos make up over one-third of
the city’s electorate, but far larger than a host of gateway cities where immigrants have yet
to be incorporated into the formal political process.
6 For an important analysis of these political trends, see Marisa Abrajano and Zoltan L. Hajnal, White Backlash: Immigration, Race, and American Politics (Princeton: Princeton University Press, 2015).
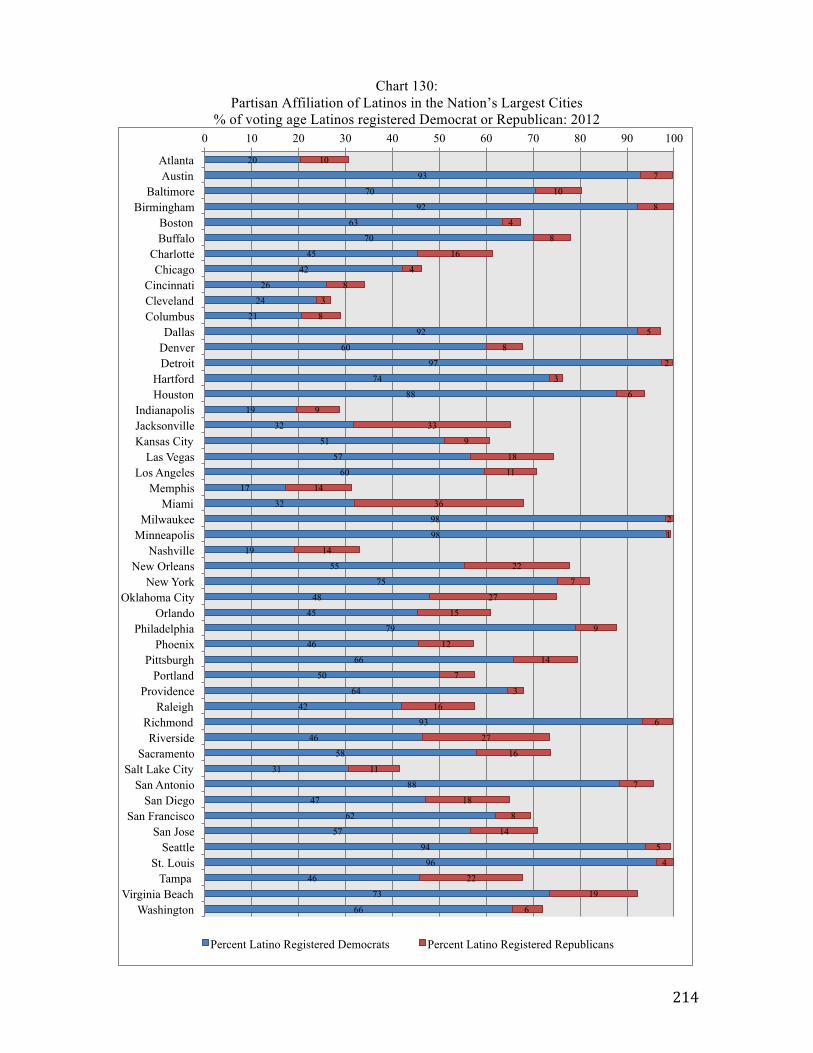
214
Chart 130: Partisan Affiliation of Latinos in the Nation’s Largest Cities
% of voting age Latinos registered Democrat or Republican: 2012
20
93
70
92
63
70
45
42
26
24
21
92
60
97
74
88
19
32
51
57
60
17
32
98
98
19
55
75
48
45
79
46
66
50
64
42
93
46
58
31
88
47
62
57
94
96
46
73
66
10
7
10
8
4
8
16
4
8
3
8
5
8
2
3
6
9
33
9
18
11
14
36
2
1
14
22
7
27
15
9
12
14
7
3
16
6
27
16
11
7
18
8
14
5
4
22
19
6
0 10 20 30 40 50 60 70 80 90 100
Atlanta Austin
Baltimore Birmingham
Boston Buffalo
Charlotte Chicago
Cincinnati Cleveland Columbus
Dallas Denver Detroit
Hartford Houston
Indianapolis Jacksonville Kansas City
Las Vegas Los Angeles
Memphis Miami
Milwaukee Minneapolis
Nashville New Orleans
New York Oklahoma City
Orlando Philadelphia
Phoenix Pittsburgh
Portland Providence
Raleigh Richmond Riverside
Sacramento Salt Lake City
San Antonio San Diego
San Francisco San Jose
Seattle St. Louis
Tampa Virginia Beach
Washington
Percent Latino Registered Democrats Percent Latino Registered Republicans
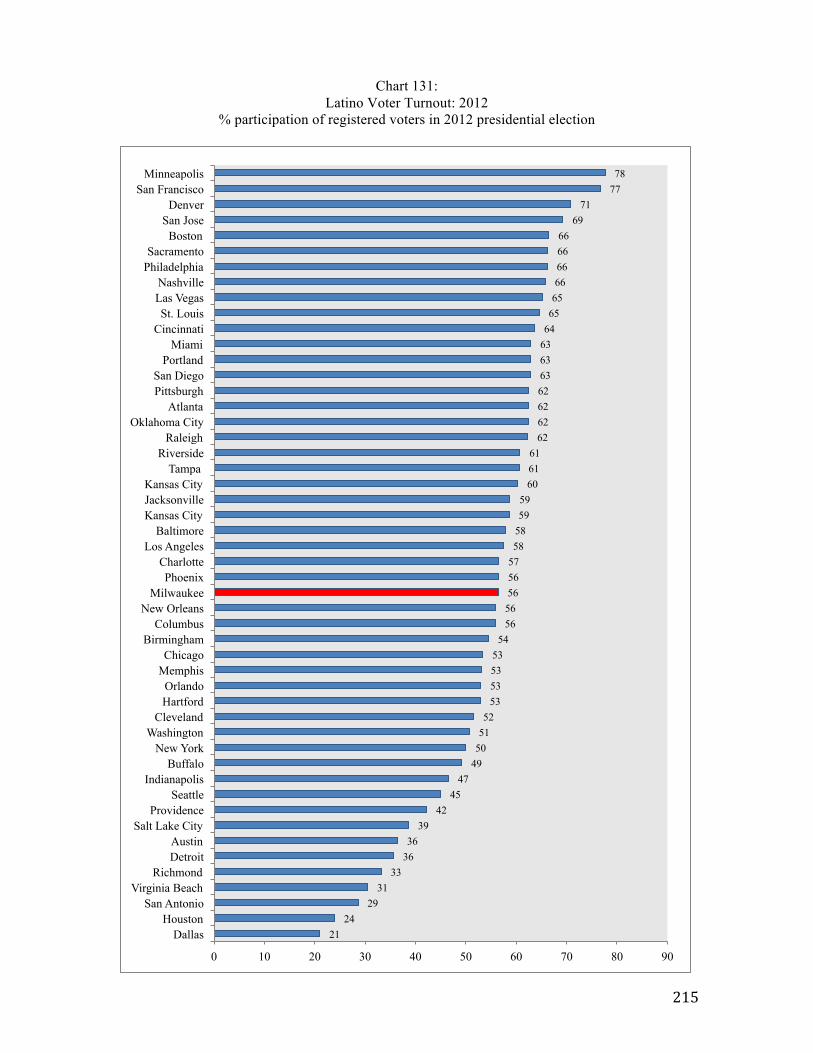
215
Chart 131: Latino Voter Turnout: 2012
% participation of registered voters in 2012 presidential election
21 24
29 31
33 36 36
39 42
45 47
49 50 51 52
53 53 53 53
54 56 56 56 56 57 58 58 59 59
60 61 61
62 62 62 62 63 63 63 64 65 65 66 66 66 66
69 71
77 78
0 10 20 30 40 50 60 70 80 90
Dallas Houston
San Antonio Virginia Beach
Richmond Detroit Austin
Salt Lake City Providence
Seattle Indianapolis
Buffalo New York
Washington Cleveland
Hartford Orlando
Memphis Chicago
Birmingham Columbus
New Orleans Milwaukee
Phoenix Charlotte
Los Angeles Baltimore
Kansas City Jacksonville Kansas City
Tampa Riverside
Raleigh Oklahoma City
Atlanta Pittsburgh San Diego
Portland Miami
Cincinnati St. Louis
Las Vegas Nashville
Philadelphia Sacramento
Boston San Jose
Denver San Francisco
Minneapolis
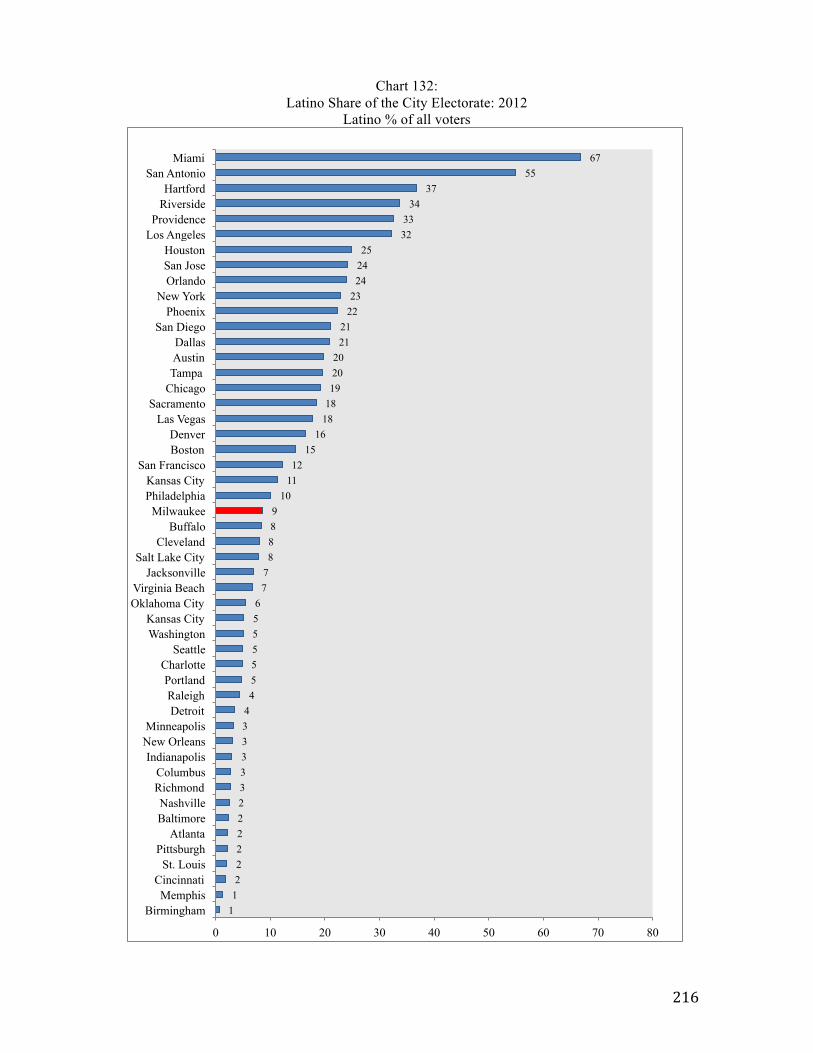
216
Chart 132: Latino Share of the City Electorate: 2012
Latino % of all voters
1 1 2 2 2 2 2 2 3 3 3 3 3 4 4 5 5 5 5 5 6
7 7 8 8 8 9
10 11 12
15 16
18 18 19 20 20
21 21
22 23 24 24 25
32 33
34 37
55 67
0 10 20 30 40 50 60 70 80
Birmingham Memphis
Cincinnati St. Louis
Pittsburgh Atlanta
Baltimore Nashville
Richmond Columbus
Indianapolis New Orleans Minneapolis
Detroit Raleigh
Portland Charlotte
Seattle Washington Kansas City
Oklahoma City Virginia Beach
Jacksonville Salt Lake City
Cleveland Buffalo
Milwaukee Philadelphia Kansas City
San Francisco Boston Denver
Las Vegas Sacramento
Chicago Tampa Austin Dallas
San Diego Phoenix
New York Orlando San Jose Houston
Los Angeles Providence
Riverside Hartford
San Antonio Miami
217
SOURCES
Tables 1-9; Charts 1-11: National Historic Geographical Information System (hereafter cited as NHGIS). 1990 and 2000 U.S. Census, SF3. Accessed at: https://www.nhgis.org/documentation/tabular-data; U.S. Bureau of the Census, American Community Survey, Tables B01001; B01001i; B01001h, 2014. (Hereafter cited as ACS). Chart 12: ACS, Table B05002i, 2010-2014. Chart 13: ACS, Table B03001, 2010-2014. Chart 14: ACS, Table B05006, 2010-2014. Tables 10-12: ACS, Table B05005, 2006-2010; Table S0502. Charts 15-16: ACS Table B05006, 2006-2010. Charts 17-18: ACS Table B05003i, 2014. Charts 19-21: ACS Table S0201, 2014. For Birmingham, Buffalo, Cincinnati, Cleveland, Louisville, and Pittsburgh, 2014 data not available; data drawn from ACS Table S0201, 2011-13. Charts 22-23: Estimates of the number of unauthorized Latinos in counties by the Migration Policy Institute, “Unauthorized Immigrant Population Profiles.” Accessed at: http://www.migrationpolicy.org/programs/us-immigration-policy-program-data-hub/unauthorized-immigrant-population-profiles. Total foreign-born Latino population from ACS, Table S0201, 2009-2013. Charts 24-25: County-to-County migration flows calculated from U.S. Bureau of the Census, “Census Flows Mapper.” Accessed at: http://flowsmapper.geo.census.gov/map.html. Chart 26; Table 13: William H. Frey, “New Racial Segregation Measures for Large Metropolitan Areas: Analysis of the 1990-2010 Decennial Censuses.” Accessed at: http://www.psc.isr.umich.edu/dis/census/segregation2010.html Chart 27: ACS, Table S1602, 2014. Table 14: NHGIS (data on linguistic isolation, 1990, 2000); ACS Table S1602, 2014. Chart 28-31: ACS Table B16006, 2014; ACS Table B16006, 2009-2013 Table 16: ACS, Table B16004, 2006-2010. Charts 32-35: ACS Table S0201, 2014; ACS Table S0201, 2011-13. Chart 36: U.S. Bureau of the Census, 1990 Census of Population: Social and Economic Characteristics, Metropolitan Areas, Section 5 of 6. (1990 CP-2-1B). Inflation adjustments
218
made via CPI calculator of Bureau of Labor Statistics, accessed at: http://www.bls.gov/data/inflation_calculator.htm Chart 37: Brown University, US2010. Data accessed at: http://www.s4.brown.edu/us2010/su2/SuMsaIncD.aspx?metroid=33340 Chart 38: ACS, Table B19001i, 2014. Chart 39: Same as Charts 37 and 38. Chart 40: ACS, Table B19001i, 2014. Metro area Latino median household income then adjusted using U.S. Department of Commerce, Regional Price Parities. Accessed at: http://www.bea.gov/iTable/iTable.cfm?reqid=70&step=1&isuri=1#reqid=70&step=1&isuri=1 Chart 41: ACS, Table B19001i and Table B19001h, 2014. Table 17: U.S. Bureau of the Census, 1990 Census of Population: Social and Economic Characteristics, Metropolitan Areas; Brown University, US2010. Data accessed at: http://www.s4.brown.edu/us2010/su2/SuMsaIncD.aspx?metroid=33340; ACS, Table B19001i and Table B19001h, 2014. Chart 42: U.S. Bureau of the Census, Income and Poverty in the United States: 2014. Table A-1, p. 29. Accessed at: https://www.census.gov/content/dam/Census/library/publications/2015/demo/p60-252.pdf. U.S. Bureau of the Census, Census of Population and Housing Milwaukee, WI MSA, 1980, 1990, and 2000; ACS, Table 19001i, 2014. Chart 43: ACS, Table 19001i, 2014. Chart 44: ACS, Table 19001b; Table 19001i; Table 19001h, 2014. Chart 45: U.S. Bureau of the Census, Income and Poverty in the United States: 2014. Table B-1, p. 43. Accessed at: https://www.census.gov/content/dam/Census/library/publications/2015/demo/p60-252.pdf. U.S. Bureau of the Census, Census of Population and Housing Milwaukee, WI MSA, 1980, 1990, and 2000; ACS, Table S0201, 2014. Chart 46, Table 19: Brandeis University, diversitydata.org. Accessed at: http://diversitydata.org/Data/Rankings/Show.aspx?ind=217&sortby=Name Chart 47-48, Table 20: ACS, Table S0201, 2014; Table S1701, 2014; and Table S0201, 2011-13. Table 18: Same as Charts 46 and 47. Chart 49: ACS, Table S1703, 2014. Chart 50: ACS, Table S1703, 2010-2014.

219
Chart 51: ACS, Table S1703; ACS Table S0201. Table 21: ACS, Table DP03, 2010-2014; ACS Table 1703, 2010-2014. Chart 52: ACS, Table S0201, 2014. Chart 53: Brandeis University, diversitydata.org. Accessed at: http://diversitydata.org/Data/Rankings/Show.aspx?ind=217&sortby=Name Chart 54: Same as Chart 52. Table 22: Brandeis University, diversitydata.org; ACS, Table S0201, 2014. Chart 55: ACS, Table DP03, 2010-2014. Table 23: ACS, Table S0201, 2014; ACS Table B22005i, 2014; ACS Table B22005b, 2014; ACS Table B22005h, 2014. Chart 56: ACS Table S0201, 2007; ACS Table B22005i, 2007. Chart 57: ACS Table S0201, 2014; ACS Table S0201, 2011-13 (for missing 2014 metros). Table 24: Same as Charts 56 and 57 Chart 58: Brandeis University, diversitydata.org. Accessed at: http://diversitydata.org/Data/Rankings/Show.aspx?ind=217&sortby=Name Chart 59: ACS, Table S0201, 2014; ACS Table S0201, 2011-13 (for missing 2014 metros). Tables 25-26: Same as Charts 58-59. Charts 60-63: ACS, Table S0201, 2014; ACS, Table S0201, 2011-13 (for missing 2014 metros). Charts 64-67: ACS, Table B23002i, 2014 Charts 68-71: ACS, Tables B23002i, B23002b, and B23002h, 2014. Tables 27-38: U.S. Bureau of the Census, 1990 Census of Population: Social and Economic Characteristics, Metropolitan Areas, Section 4 of 6 (1990-CP-2-1B); ACS, Tables B23001, B23002i, 2014. Charts 72-78: ACS, Table B24010, 2014; Table B24010i, 2014. Charts 79-83: ACS, Tables B24010, B24010i, B24010b, and B24010h, 2014.
220
Charts 84-85: ACS/EEOC Tabulation, Detailed Census Occupation by Earnings, Sex, and Race/Ethnicity for Worksite Geography: Civilians employed at work 16 years and over, 2006-2010; Tables EEO-ALL11W; EEO-CIT11W; and EEO-NCIT11W. Hereafter cited as EEOC Tabulation. Accessed at: http://factfinder.census.gov/faces/tableservices/jsf/pages/productview.xhtml?pid=EEO_10_5YR_EEOALL11W&prodType=table Chart 86: EEOC Tabulation, 2006-2010, Table EEO-ALL11W; Filtered for production occupations; all aggregated. Charts 87-88: EEOC Tabulation, 2006-2010, Table EEO-ALL11W for all occupations. Charts 89-90: EEOC Tabulation, 2006-2010, Tables EEO-CIT11W, and EEO-NCIT11W. Charts 91-92: Same as Charts 84-85. Table 39: U.S. Bureau of the Census, “Longitudinal Employer-Household Dynamics.” Employment by place of Work. Accessed at: http://onthemap.ces.census.gov/ Tables 40-43; Charts 93-96: U.S. Bureau of the Census, “Survey of Business Owners,” 2007 and 2012. Accessed at: http://factfinder.census.gov/faces/nav/jsf/pages/searchresults.xhtml?refresh=t Charts 97-98: ACS, Tables C27001i, C27001b; and C27001h, 2014. Table 44: ACS, Tables C27001i, C27001b; and C27001h, 2009; and ACS, Tables C27001i, C27001b; and C27001h, 2014. Chart 99: ACS, Table C27001i, 2009. Charts 100-102: ACS, Table C27001i, 2014. Tables 45-47: ACS, Table C27001i, 2009 and 2014. Charts 103-113: County population figures and death statistics compiled from the Centers for Disease Control and Prevention (CDC) National Center for Health Statistics (NCHS) and accessed via the CDC WONDER data warehouse. Accessed at: http://wonder.cdc.gov/ Charts 114-115: ACS, Table S0201, 2014; ACS, Table S0201, 2011-13; ACS, Table B15001, 2014. Table 48-49: Same as Charts 114-115; Brandeis University, diversitydata.org. Accessed at: http://diversitydata.org/Data/Rankings/Show.aspx?ind=235&sortby=Name Charts 116-117: Brandeis University, diversitydata.org: Accessed at: http://diversitydata.org/Data/Rankings/Show.aspx?ind=235&sortby=Name Charts 118-119: Same as Charts 114-115.

221
Table 50-51: National Center for Educational Statistics (NCES), ElSi express tables, Public and Private School Enrollments by Race/Ethnicity. Accessed at: http://nces.ed.gov/ccd/elsi/expressTables.aspx Table 52: Same as Tables 50-51; Wisconsin Department of Public Instruction, WISEdash Data Files by Topic, Enrollments by Race/Ethnicity, 2015-16. Accessed at: http://dpi.wi.gov/wisedash/download-files Chart 120: Same as Table 52. Milwaukee Parent Choice Program (MPCP) enrollments by race and ethnicity graciously shared by researchers at the Public Policy Forum (Milwaukee), compiled from their annual survey of MPCP schools. Charts 121-124; Table 53: Same as Tables 50-51; Wisconsin Department of Public Instruction, WISEdash Data Files by Topic, Enrollments by Race/Ethnicity, 2015-16. Accessed at: http://dpi.wi.gov/wisedash/download-files Chart 125: National Center for Educational Statistics (NCES), ElSi express tables, Public and Private School Enrollments by Race/Ethnicity. Accessed at: http://nces.ed.gov/ccd/elsi/expressTables.aspx Chart 126: Brandeis University, diversitydata.org: Accessed at: http://diversitydata.org/Data/Rankings/Show.aspx?ind=37&sortby=Name Table 54: National Center for Educational Statistics (NCES), ElSi express tables, Public and Private School Enrollments by Race/Ethnicity. Accessed at: http://nces.ed.gov/ccd/elsi/expressTables.aspx; Wisconsin Department of Public Instruction, WISEdash Data Files by Topic, Enrollments by Race/Ethnicity, 2015-16. Accessed at: http://dpi.wi.gov/wisedash/download-files; MPCP raw data shared by Public Policy Forum. Chart 127: National Center for Educational Statistics (NCES), ElSi express tables, Public and Private School Enrollments by Race/Ethnicity. Accessed at: http://nces.ed.gov/ccd/elsi/expressTables.aspx Tables 55-59: National Center for Educational Statistics (NCES), NAEP Data Explorer. Accessed at: http://nces.ed.gov/nationsreportcard/naepdata/dataset.aspx Charts 128-129: U.S. Bureau of the Census, 2010 Decennial Census, Table PC03. Table 60: U.S. Bureau of the Census, Decennial Census, 1970, 1980, 1990, 2000, and 2010, Table PC03. Table 61: State of Wisconsin, Department of Corrections, Special Compilation of Inmate, Parole, and Probation Data: 2013. Charts 130-132: Compiled from: L2. "Votermapping." Bellevue, WA. Accessed from http://www.l2political.com/products/technology/votermapping/ August 2015.