Embed Size (px)
Citation preview

Jean Acquatella PhD Energy and Natural Resources Unit
United Nations ECLAC Economic Commission for Latin America and the Caribbean
Santiago, Chile
UNECE – IAEA UNFC Workshop, 9-12 July 2013, Santiago, Chile
Latin American Mining Sector: Review of Current Trends and Prospects.
2013

1. Production, Reserves, Exploration investments.
2. Increase of Mining Rents during the 2003-2012 price cycle, and State participation ( %, govt. take ).
3. How did governments share in mining wealth?
4. Analysis and comments. – Different responses of mining and oil sector to price boom. – Fiscal treatment of mining. – Discussion of prospects.
2013 CONTENTS

In Latin America the productive structure remains concentrated in primary sectors
LATIN AMERICA AND THE CARIBBEAN: EXPORT STRUCTURE BY TECHNOLOGY INTENSITY, 1981-2010 a
(Percentages of the total)
Source: ECLAC, on the basis of United Nations Commodity Trade Database (COMTRADE). a Cuba and Haiti not included. Data for Antigua and Barbuda refer only to 2007, and data for the Bolivarian Republic of Venezuela only to 2008; data for Honduras do not include 2008; data for Belize, Dominican Republic, Saint Kitts and Nevis, Saint Lucia, Suriname and Grenada (exports only) do not include 2009.

FDI trends reinforces productive specialization in primary sectors ( except. Mexico and Brazil)
LATIN AMERICA AND THE CARIBBEAN: FDI BY DESTINY SECTORS AND REGION 2007-2012 a/ (Percentages)
Source: Economic Commission for Latin America and the Caribbean (ECLAC), based on official figures. a/ Estimate
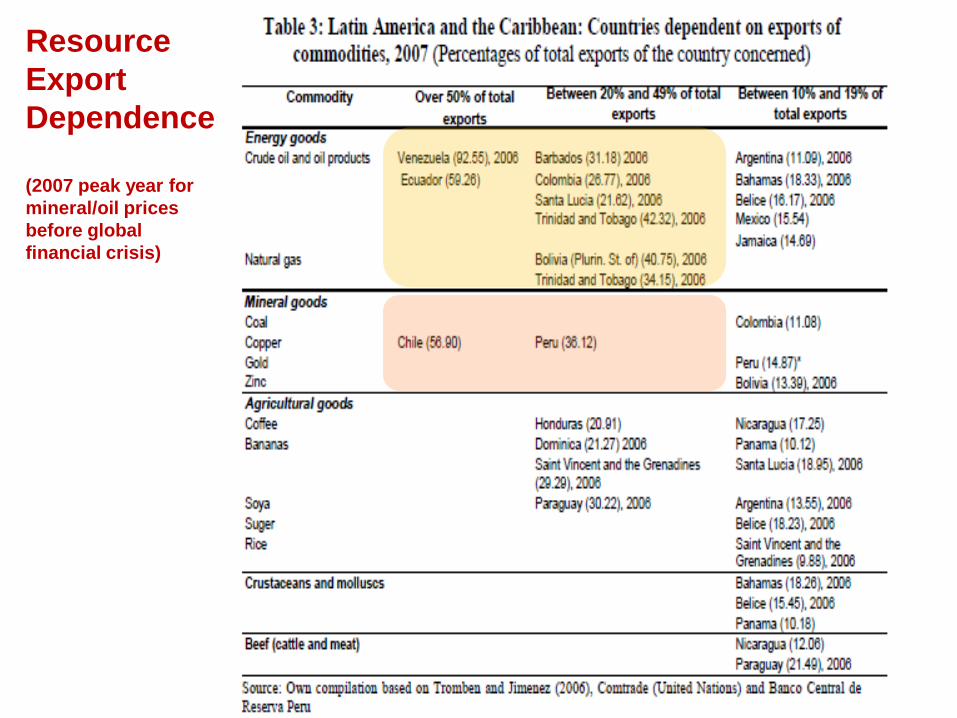
Resource Export Dependence (2007 peak year for mineral/oil prices before global financial crisis)

Fiscal Dependence on Resource Revenues
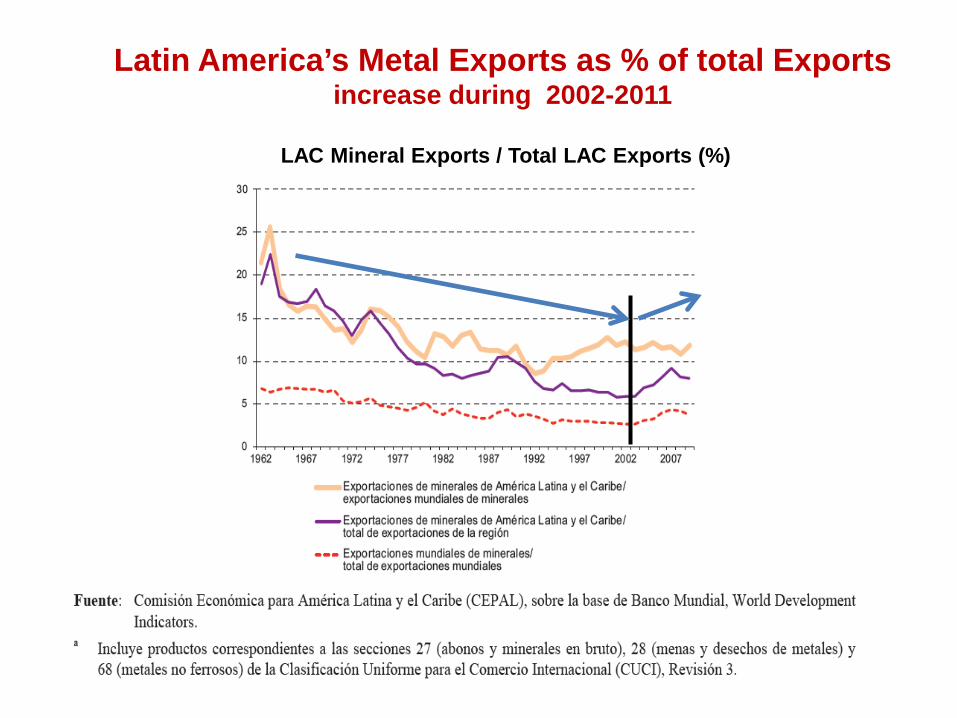
Latin America’s Metal Exports as % of total Exports increase during 2002-2011
LAC Mineral Exports / Total LAC Exports (%)

Metal 2000 2005 2010 2012 Top 3 producers Bauxite 26 27.5 21.5 19.6 Brasil, Jamaica y Suriname
Aluminum primar. 8.9 7.5 5.5 4.4 Brasil, Argentina, RBVenezuela Copper mine 43 46.5 45.2 44.6 Chile, Perú y México Copper refined 25.1 23.7 21.5 19.0 Chile, México y Perú Gold [Ton] 14.4 18.1 19.2 21.4 Peru, México y Colombia Silver [Ton] 38.5 41.8 48.7 47.7 México, Perú y Chile Tin mine 26 21.2 19.5 20.5 Perú, E.P Bolivia y Brasil Tin refined 14.9 18 16.6 13.7 Perú, EP Bolivia y Brasil
Iron [Mton] 26.1 26 22.6 21.1 Brasil, México, RB Venezuela Molibdenum mine 35.2 37.3 31.8 23.8 Chile, Perú y México Nickel mine 14.1 15.1 12.9 11.7 Brasil, Cuba y Colombia Nickel refined 10.7 13.4 11.6 8.6 Brasil, Colombia y Cuba Lead mine 14.7 14.6 14.5 11.6 Perú, México,EP Bolivia Lead refined 8.4 7.2 7.4 5.0 México, Brasil y Argentina Zinc mine 19 21 21.7 19.4 Perú, México, EP Bolivia Zinc refined 7.3 7.9 7 7.4 México, Perú y Brasil
Source: World Bureau of Metal Statistics, Gold Fields Mineral Services, Intierra Raw Material Database , UNCTAD.
LAC countries share (%) in world production of metals: 2000 - 2012

Metal 2000 2005 2010 2012 Top 3 producers Bauxite 26 27.5 21.5 19.6 Brasil, Jamaica y Suriname
Aluminum primar. 8.9 7.5 5.5 4.4 Brasil, Argentina, RBVenezuela Copper mine 43 46.5 45.2 44.6 Chile, Perú y México Copper refined 25.1 23.7 21.5 19.0 Chile, México y Perú Gold [Ton] 14.4 18.1 19.2 21.4 Peru, México y Colombia Silver [Ton] 38.5 41.8 48.7 47.7 México, Perú y Chile Tin mine 26 21.2 19.5 20.5 Perú, E.P Bolivia y Brasil Tin refined 14.9 18 16.6 13.7 Perú, EP Bolivia y Brasil
Iron [Mton] 26.1 26 22.6 21.1 Brasil, México, RB Venezuela Molibdnum mine 35.2 37.3 31.8 23.8 Chile, Perú y México Nickel mine 14.1 15.1 12.9 11.7 Brasil, Cuba y Colombia Nickel refined 10.7 13.4 11.6 8.6 Brasil, Colombia y Cuba Lead mine 14.7 14.6 14.5 11.6 Perú, México,EP Bolivia Lead refined 8.4 7.2 7.4 5.0 México, Brasil y Argentina Zinc mine 19 21 21.7 19.4 Perú, México, EP Bolivia
Zinc refined 7.3 7.9 7 7.4 México, Perú y Brasil
Source: World Bureau of Metal Statistics, Gold Fields Mineral Services, Intierra Raw Material Database , UNCTAD.
LAC countries share (%) in world production of metals: 2000 - 2012

LAC countries share (%) in world production of metals: 2000 - 2012
Metal 2000 2005 2010 2012 Top 3 producers Bauxite 26 27.5 21.5 19.6 Brasil, Jamaica y Suriname
Aluminum primar. 8.9 7.5 5.5 4.4 Brasil, Argentina, RBVenezuela Copper mine 43 46.5 45.2 44.6 Chile, Perú y México Copper refined 25.1 23.7 21.5 19.0 Chile, México y Perú Gold [Ton] 14.4 18.1 19.2 21.4 Peru, México y Colombia Silver [Ton] 38.5 41.8 48.7 47.7 México, Perú y Chile Tin mine 26 21.2 19.5 20.5 Perú, E.P Bolivia y Brasil Tin refined 14.9 18 16.6 13.7 Perú, EP Bolivia y Brasil
Iron [Mton] 26.1 26 22.6 21.1 Brasil, México, RB Venezuela Molibdnum mine 35.2 37.3 31.8 23.8 Chile, Perú y México Nickel mine 14.1 15.1 12.9 11.7 Brasil, Cuba y Colombia Nickel refined 10.7 13.4 11.6 8.6 Brasil, Colombia y Cuba Lead mine 14.7 14.6 14.5 11.6 Perú, México,EP Bolivia Lead refined 8.4 7.2 7.4 5.0 México, Brasil y Argentina Zinc mine 19 21 21.7 19.4 Perú, México, EP Bolivia Zinc refined 7.3 7.9 7 7.4 México, Perú y Brasil
Source: World Bureau of Metal Statistics, Gold Fields Mineral Services, Intierra Raw Material Database , UNCTAD.

0
20
40
60
80
100
120
2000 2010 2012
BOL
BRA JAM GUY SUR VEN CHL
PER ARG
MEX PER
CUB BRA
CHL PER MEX
PER BRA BOL BRA
VEN MEX
CHL ARG BRA BOL
BRA MEX
CHL PER MEX
BRA
BRA CUB COL DOM VEN
CHL BRA PER MEX
PER CHL MEX BOL
PER MEX BOL
MEX BRA CHL
CHL PER
MEX
PER MEX BOL
LAC metal reserves as % of world reserves: 2000 - 2012
Source: USGS Geological Service data, with elaboration from DRNI – ECLAC.

Regional share (%) in total world investment in Mining Exploration
Investment by Region 2000 2010 2012 MM US$
Europe 5.7% 11.0% 10.5% $ 77.0
Latin America 29.5% 32.0% 28.6% $ 210.0
North America 12.6% 15.3% 19.9% $ 146.0
Oceania 18.6% 14.4% 16.5% $ 121.0
Africa 18.6% 14.2% 14.4% $ 106.0
Asia 15.0% 13.0% 10.2% $ 75.0
Total 100.0% 99.9% 100.0%
Total [MMUS$] $ 86.0 $ 562.0 $ 735.0
Source: Economic Commission for Latin America and the Caribbean (ECLAC), based on official figures, and data from Trends in Worldwide Exploration
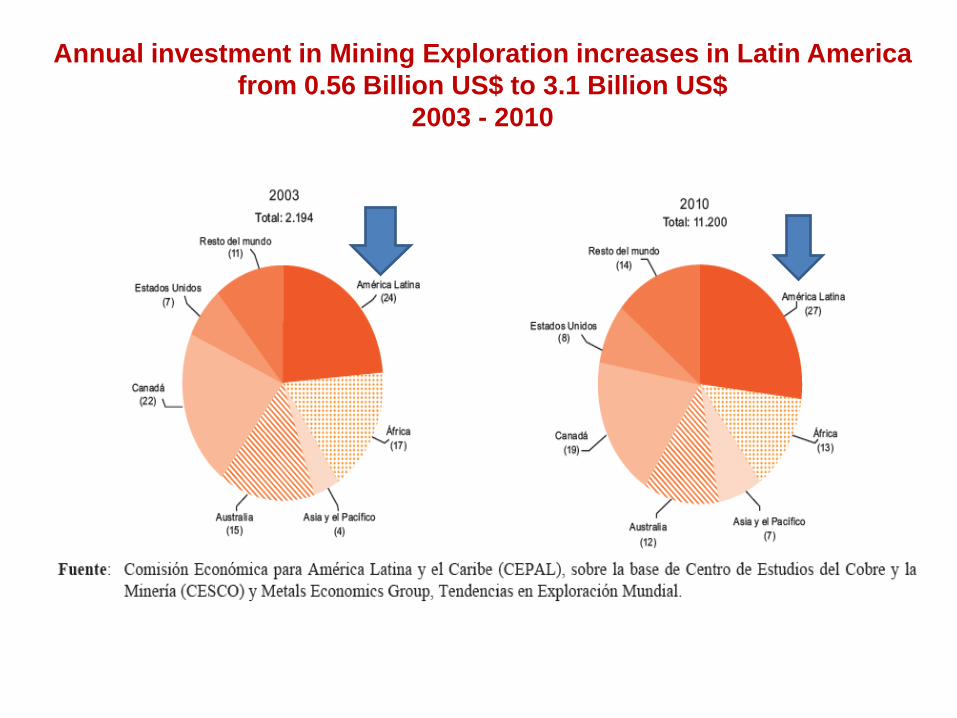
Annual investment in Mining Exploration increases in Latin America from 0.56 Billion US$ to 3.1 Billion US$
2003 - 2010

Major countries capturing the new investments in Mining Exploration within Latin America.
Country shares as percentage of total Mining Exploration Investment in the region (%)

1. Production, Reserves, Exploration investments.
2. Increase of Mining Rents during the 2003-2012 price cycle, and State participation ( %, govt. take ).
2013 CONTENTS

State participation (govt. take) in Mining Sector Rents during the 2003-2012 price cycle
0
50
100
150
200
250
300
350
400
450
500
Petróleo, gas natural y carbón Metales
Different performance : sector rents and % State appropriation, investment and production dynamics are different across sectors and countries.
PRIMARY COMMODITY PRICE INDEX, 2003-2011 (January 2003=1)

Mining Sector : Economic Rent
Source : based on data from COCHILCO* Average production costs refers to direct and indirect mining costs, interest payments and depreciation , minus proceeds from sale of indirect products, (C3, according to Brook Hunt terminology), ** Costs for period 1992-1996 reflect only Chile.. ** World Bank ( WDI) World Development Indicators Database Mineral Rent ( % GDP)
Refined cooper prices London Metals Exchange and average production costs LAC * ( USD cents per lb.)
0
50
100
150
200
250
300
350
400
1990 1992 1994 1996 1998 2000 2002 2004 2006 2008 2010
Precio Cu (BML) Costo de producción (promedio América Latina)**
International Price
Extraction Cost At mine head.
Tax payments (appropriated by States) Factor payments beyond extraction phase (labor, sale costs, debt service.)
Net profits (appropriated by mining industry)
0
5,000
10,000
15,000
20,000
25,000
30,000
35,000
40,000
45,000
50,000Mining sector Economic Rent for selected countries
(Millions US$, year 2009)**

Source:ECLAC based on, World Development Indicators. Statistic: Mineral Rent ( % GDP) defined as international price – unitary cost of production for a basket of 10 minerals.
Mining Sector Rents increase in Latin America vs. world
Mining Sector Rent: 1990-2003 0.54% GDP regional avg. rises 4 x to 2004-2009 2.08 % GDP regional avg.
0
10,000
20,000
30,000
40,000
50,000
60,000
70,000
80,000
90,000
100,000
1990-1992 1999-2001 2003-2005 2007-2009
Norteamérica Asia del Este y el Pacífico* America Latina y el Caribe
Mining Sector Rent by region, 1990-2009 (US$ Millions 2005)
LAC
LAC
East Asia & Pacific
East Asia & Pacific
North America
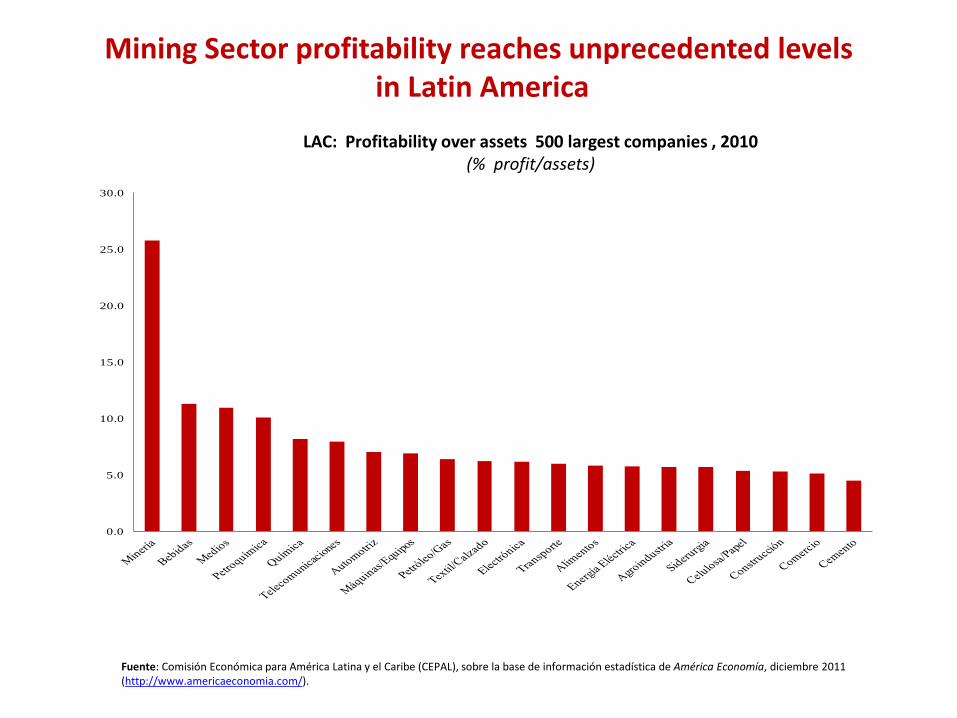
LAC: Profitability over assets 500 largest companies , 2010 (% profit/assets)
0.0
5.0
10.0
15.0
20.0
25.0
30.0
Fuente: Comisión Económica para América Latina y el Caribe (CEPAL), sobre la base de información estadística de América Economía, diciembre 2011 (http://www.americaeconomia.com/).
Mining Sector profitability reaches unprecedented levels in Latin America

Latin America (selected countries ): Mining and Hidrocarbon ( Oil/Gas) rents (% GDP)
Fuente: Comisión Económica para América Latina y el Caribe (CEPAL), sobre la base de información del Banco Mundial, World Development Indicators. Nota: *El dato del año 2009 de Asia del Este y el Pacífico corresponde al año 2006.
Extractive Sector combined rents (% GDP ) in individual countries.
0
5
10
15
20
25
30
35
1990-2003
2004-2009
1990-2003
2004-2009
1990-2003
2004-2009
1990-2003
2004-2009
1990-2003
2004-2009
1990-2003
2004-2009
1990-2003
2004-2009
1990-2003
2004-2009
1990-2003
2004-2009
Bolivia(Est.Plur.de)
Brasil Chile Colombia Ecuador Honduras México Perú Venezuela(Rep.Bol.de)
Hidrocarburos Minería Fuente: Banco Mundial
x 3 renta x 10

País
MINING SECTOR RENTS
(% GDP) OIL& GAS
RENTS (% GDP)
MINING FISCAL REVENUE
(% total Fiscal revenue)
OIL& GAS FISCAL REVENUE (% total
Fiscal revenue)
1990-2003
2004-2009
1990-2003
2004-2009
1990-2003
2004-2009 1990-2003 2004-2009
Argentina 0.05 0.48 3.30 9.85 Bolivia 0.30 2.28 6.32 28.87 n.d. 2.2 11.5 27.4 Brasil 0.64 2.24 1.03 3.06 8.2 9.0 Chile (GMP-10+CODELCO) 6.47 17.29 0.31 0.28 8.1 35.1 Chile (sólo minería privada GMP-10) 1.4 13.1
Colombia 0.17 0.91 4.97 7.11 0.9 2.1 9.4 14.2 Ecuador 0.01 0.03 13.00 24.22 30.7 29.4 Guatemala1/ n.d. n.d. 0.54 1.08 n.d. 0.3 Guyana 5.62 5.34 Honduras 0.25 0.69 0.05 0.5 Jamaica 3.43 1.67 México 0.14 0.34 4.83 7.71 30.0 35.8 Nicaragua 0.07 0.63 Perú 0.79 7.16 1.61 1.99 2.9 13.4 4.4 3.8 República Dominicana 0.69 1.96 Suriname 7.26 5.07 4.08 Venezuela, RB 0.32 0.83 26.89 31.00 56.3 44.9 América Latina 0.54 2.08 3.61 7.11 Australia 1.17 4.12 Canadá 0.2 0.69 Estados Unidos 0.0 0.08 Sudáfrica 0.9 2.47 Fuente: Elaborado sobre la base de datos de COMTRADE, UNCTAD, Banco mundial y CEPAL.
x8 x4
x3 x5
x3 x2 x9
x4 x2
x4 x3
x.4 x2 x.5
Relative performance Mining vs. Oil/Gas:
Economic weight of Oil & Gas (% GDP) continues to be larger than Mining Sector. But Mining Sector rents are increasing much faster ( high profitability). Oil & Gas Sector facing investment lags and reduced profitability, due to rising Production costs.
Oil/Gas rents are larger in absolute terms, but Mining sector rents are growing much faster.
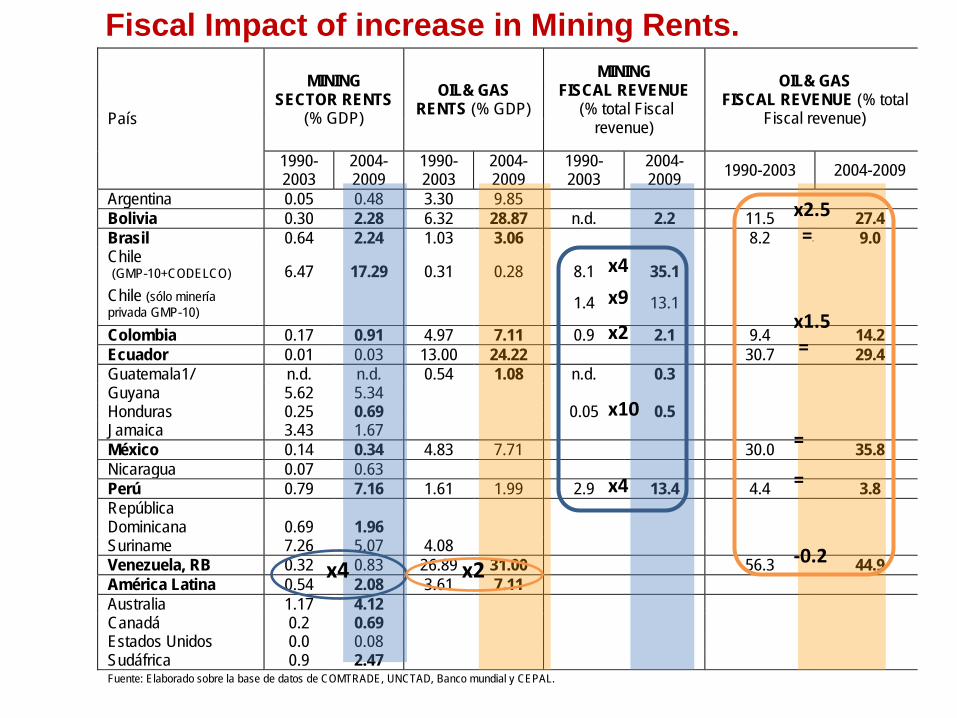
País
MINING SECTOR RENTS
(% GDP) OIL& GAS
RENTS (% GDP)
MINING FISCAL REVENUE
(% total Fiscal revenue)
OIL& GAS FISCAL REVENUE (% total
Fiscal revenue)
1990-2003
2004-2009
1990-2003
2004-2009
1990-2003
2004-2009 1990-2003 2004-2009
Argentina 0.05 0.48 3.30 9.85 Bolivia 0.30 2.28 6.32 28.87 n.d. 2.2 11.5 27.4 Brasil 0.64 2.24 1.03 3.06 8.2 9.0 Chile (GMP-10+CODELCO) 6.47 17.29 0.31 0.28 8.1 35.1 Chile (sólo minería privada GMP-10) 1.4 13.1
Colombia 0.17 0.91 4.97 7.11 0.9 2.1 9.4 14.2 Ecuador 0.01 0.03 13.00 24.22 30.7 29.4 Guatemala1/ n.d. n.d. 0.54 1.08 n.d. 0.3 Guyana 5.62 5.34 Honduras 0.25 0.69 0.05 0.5 Jamaica 3.43 1.67 México 0.14 0.34 4.83 7.71 30.0 35.8 Nicaragua 0.07 0.63 Perú 0.79 7.16 1.61 1.99 2.9 13.4 4.4 3.8 República Dominicana 0.69 1.96 Suriname 7.26 5.07 4.08 Venezuela, RB 0.32 0.83 26.89 31.00 56.3 44.9 América Latina 0.54 2.08 3.61 7.11 Australia 1.17 4.12 Canadá 0.2 0.69 Estados Unidos 0.0 0.08 Sudáfrica 0.9 2.47 Fuente: Elaborado sobre la base de datos de COMTRADE, UNCTAD, Banco mundial y CEPAL.
x4 x2
x4
x9
x2 x10 x4
x2.5 ==
x1.5 = =
= -0.2
Fiscal Impact of increase in Mining Rents.
• Mining Rents increase during the 2003-2011 price cycle. • How did governments perform? • State share (%) in Mining Rents during 2003-2011:
2013

State share in sector rents Countries included the analysis
• Metals Mining Sector – Bolivia, Chile, Colombia, Guatemala, Honduras, Perú
• Oil and Gas Sector – Brasil, Ecuador, Colombia, México, y Venezuela
Countries selected based on availability of information: in particular
disaggregated fiscal revenue payments at sector level.

Chile Taxes and other fiscal revenue paid by Mining companies* , relative to Mining
Sector rent. absolute values (US$ millions each year)
0
5,000
10,000
15,000
20,000
25,000
30,000
35,000
40,000
1994 1995 1996 1997 1998 1999 2000 2001 2002 2003 2004 2005 2006 2007 2008 2009 2010
Ingresos tributarios totales (Gobierno central)Rentas mineras totalesTributación y aportes totales de la minería (sin impuesto específico)Impuesto específico declarado por GMP-10
Fuente: Elaboración propia sobre la base de datos de COCHILCO, CEPAL, Banco Mundial, FMI y Banco Central de Chile. Notas: * Los ingresos tributarios son del Gobierno Central. Los datos fueron tomados de CEPAL y del Banco de Chile. ** La tributación y aportes totales de la minera incluye los dividendos de CODELCO y los excedentes de ENAMI.
14,000 M
35,000 M
8% >
35%
0%
5%
10%
15%
20%
25%
30%
35%
40%
45%
1994 1995 1996 1997 1998 1999 2000 2001 2002 2003 2004 2005 2006 2007 2008 2009
Aportes de las empresas privadas CODELCO ENAMI Tributación minera total (incluye royalty)
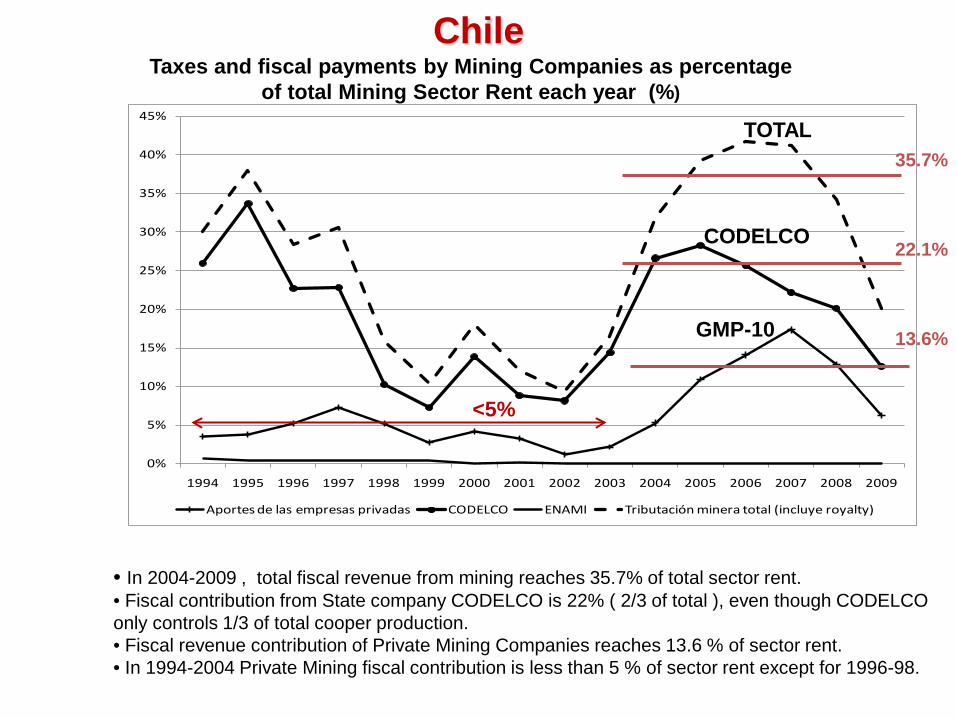
Chile Taxes and fiscal payments by Mining Companies as percentage
of total Mining Sector Rent each year (%)
• In 2004-2009 , total fiscal revenue from mining reaches 35.7% of total sector rent. • Fiscal contribution from State company CODELCO is 22% ( 2/3 of total ), even though CODELCO only controls 1/3 of total cooper production. • Fiscal revenue contribution of Private Mining Companies reaches 13.6 % of sector rent. • In 1994-2004 Private Mining fiscal contribution is less than 5 % of sector rent except for 1996-98.
CODELCO
GMP-10
TOTAL 35.7% 22.1% 13.6%
<5%

Perú
0
5,000
10,000
15,000
20,000
25,000
1998 1999 2000 2001 2002 2003 2004 2005 2006 2007 2008 2009 2010
Ingresos tributarios Tributación minera total Rentas mineras Regalías Fuente: Elaboración propia sobre la base de datos de Superintendencia Nacional de Administración Tributaria (SUNAT), Banco Mundial y FMI. Notas: * Los ingresos tributarios son los del Gobierno Central. Incluyen: Impuestos a la renta, a la producción y consumo, a la importación y otros ingresos como impuesto a las transacciones financieras, temporal a los activos netos, a las acciones del Estado, etc. ** Los impuestos pagados por las empresas mineras incluyen el 100% del impuesto a la renta minera.
12,000 M
3,500 M
2.9% > 14.2%
Taxes and other fiscal revenue paid by Mining companies* , relative to Mining Sector rent. absolute values (US$ millions each year)

Peru
• State rent appropriation has been decreasing from 35% in 2004 to 19.5% en 2009. • Fiscal contribution from Mining Companies during peak price year ( 2007) reached 29% of sector rent. • In 2007 the contribution of Mining to total Fiscal Revenue in Perú peaked at 19.4%.
0
5
10
15
20
25
30
35
40
2004 2005 2006 2007 2008 2009
Tributación + Regalías Tributación Regalías
19.5%
35%
29%
Taxes and fiscal payments by Mining Companies as percentage of total Mining Sector Rent each year (%)

Guatemala
0
50
100
150
200
250
300
350
400
2005 2006 2007 2008 2009 2010
Rentas mineras totales Impuestos sobre la Renta Regalías Gob/Mun
Fuente: Elaboración propia sobre la base de datos de http://goldcorpguatemala.com/, Instituto de Desarrollo Global y Medio Ambiente, FMI y World Bureau of Metal Statistics.
Taxes and other fiscal revenue paid by Marlin Gold Mine, relative to Mining Sector rent. absolute values (US$ millions each year)

0
2
4
6
8
10
12
14
16
18
20
2006 2007 2008 2009 2010
Total de aportes mineros al fisco Impuestos sobre la Renta Regalías Gob/Mun
Guatemala
Fuente: Elaboración propia sobre la base de datos de http://goldcorpguatemala.com/, Instituto de Desarrollo Global y Medio Ambiente, FMI y World Bureau of Metal Statistics.
Taxes and fiscal payments by Mining Companies as percentage of total Mining Sector Rent each year (%)
12 %

Honduras
0
20,000
40,000
60,000
80,000
100,000
120,000
140,000
160,000
2000 2001 2002 2003 2004 2005 2006 2007 2008 2009
Rentas mineras Impuestos a la renta (estimación propia) Regalías
Estimación
Fuente: Elaboración propia sobre la base de datos de la Secretaría de Finanzas de Honduras, Banco Central de Honduras, Banco Mundial y CEPAL. Nota: * Estimación propia según el impuesto empresarial del 10%, sobre las cifras de rentas mineras del Banco Mundial.
Taxes and other fiscal revenue paid by Mining companies* , relative to Mining Sector rent. absolute values (US$ millions each year)
10 %

Mining : State appropriation of sector rent 1990-2003 vs. 2004-2010 State participation in sector rents, and fiscal contribution of mining as % of total fiscal revenue
País State participation (%) Mining sector rent
(anual avg. for period) Fiscal contribution Mining Sector (%)
total fiscal revenues (anual avg. for period)
Before 2004 2004-2009 Total period Before
2004 2004-2009 Total Period
Bolivia (datos CEPAL) (*) (*) (*) 0,9 3,0 2,6 Bolivia (datos PIEB) 57.7 2.2 Bolivia (sin COMIBOL, datos PIEB) 34.6 1.3 Chile (cobre, GMP-10+CODELCO) 21.8 35.7 32.1 8.2 37.5 23.0
Chile (CODELCO with dividends) 17.1 22.1 21.0 6.6 30.4 18.7
Chile (10 largest private mining GMP-10) 3.9 13.6 11.1 1.5 14.3 8.0
Colombia 48.9 37.1 1.9 Guatemala 12.2 0.4 Honduras 10.3 10.0 10.1 0.05 0.5 0.4 Perú (*) 27.4 (*) 2.9 14.2 10.1 Australia (minería metálica) 17.9 26.1 20.2 Canadá 38,6 10 largest Mining multinationals Taxes paid globally (% gross rents.) 33.6 33.2
Fuente: Elaborado sobre la base de datos de COMTRADE, Banco mundial y CEPAL. Calculado como el promedio de los porcentajes de participación anuales (utilizando precios nominales). Los datos PIEB para Bolivia se tomaron del estudio de Rolando Jordán (PIEB, 2010). (*) No se pudo calcular el porcentaje de participación en estos períodos por errores estadísticos.
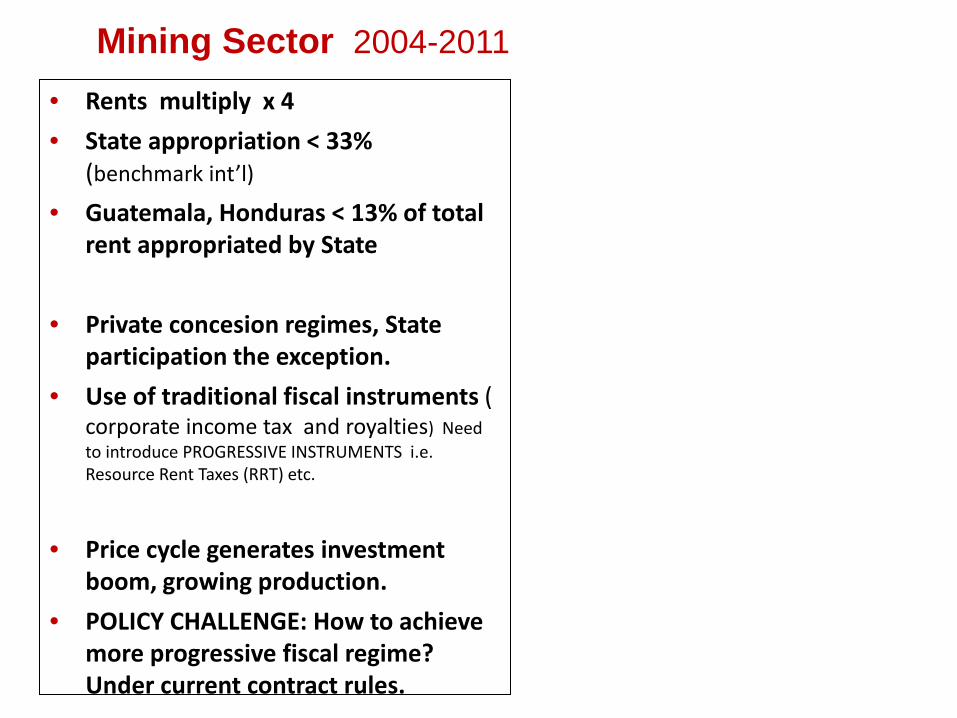
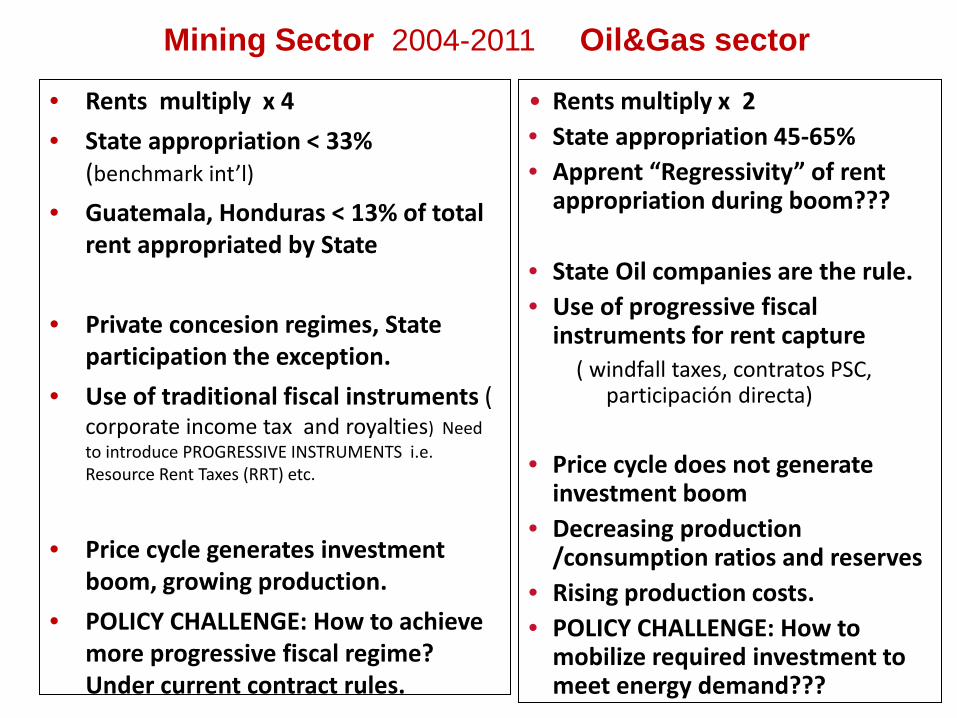
Mining Sector 2004-2011
• Rents multiply x 4 • State appropriation < 33%
(benchmark int’l)
• Guatemala, Honduras < 13% of total rent appropriated by State
• Private concesion regimes, State participation the exception.
• Use of traditional fiscal instruments ( corporate income tax and royalties) Need to introduce PROGRESSIVE INSTRUMENTS i.e. Resource Rent Taxes (RRT) etc.
• Price cycle generates investment
boom, growing production. • POLICY CHALLENGE: How to achieve
more progressive fiscal regime? Under current contract rules.

Mining Sector 2004-2011 Oil&Gas sector • Rents multiply x 2
• State appropriation 45-65% • Aparent “Regressivity” of rent
appropriation during boom???
• State Oil companies are the rule. • Use of progressive fiscal
instruments for rent capture ( windfall taxes, contratos PSC,
participación directa) • Price cycle does not generate
investment boom • Decreasing production
/consumption ratios and reserves
• Rising production costs. • POLICY CHALLENGE: How to
mobilize required investment to meet energy demand???
• Rents multiply x 4 • State appropriation < 33%
(benchmark int’l)
• Guatemala, Honduras < 13% of total rent appropriated by State
• Private concesion regimes, State participation the exception.
• Use of traditional fiscal instruments ( corporate income tax and royalties) Need to introduce PROGRESSIVE INSTRUMENTS i.e. Resource Rent Taxes (RRT) etc.
• Price cycle generates investment
boom, growing production. • POLICY CHALLENGE: How to achieve
more progressive fiscal regime? Under current contract rules.

2001 – 2011 international metal price cycle broke the previous trend of decreasing real prices between 1980 – 2000. Persistency of current price cycle???

Fiscal competition between Mining exporting countries: reduction of Corporate Income Tax rates 1980 – 2010

Source: own elaboration with World Bureau of Metal Statistics, and UNCTAD data.
0
1000
2000
3000
4000
5000
6000
1946 1950 1954 1958 1962 1966 1970 1974 1978 1982 1986 1990 1994 1998 2002 2006 2010
Chile Peru China U.S.A. Indonesia Australia
Remarkable rise of Chile as major world producer of Copper
1946 – 2010 Mine Copper production by major producing countries (Thousand Tons per year )
Chile
USA
Peru

1. Production, Reserves, Exploration investments.
2. Increase of Mining Rents during the 2003-2012 price cycle, and State participation ( %, govt. take ).
3. How did governments share in mining wealth?
4. Analysis and comments. – Different responses of mining and oil sector to price boom. – Fiscal treatment of mining. – Discussion of prospects.
2013 CONTENTS
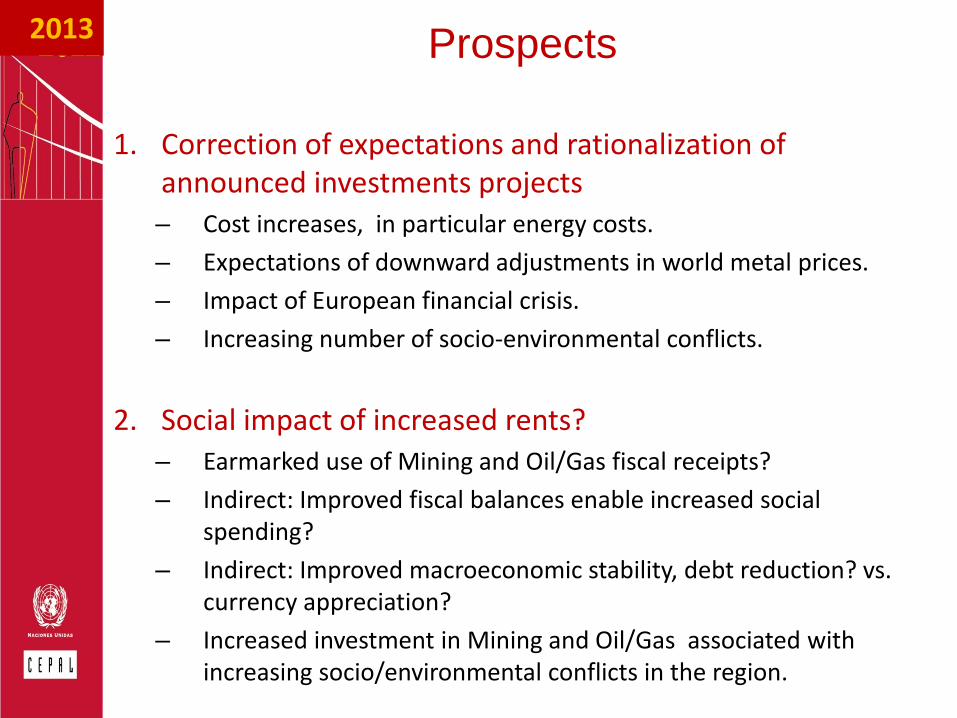
Prospects
1. Correction of expectations and rationalization of announced investments projects – Cost increases, in particular energy costs. – Expectations of downward adjustments in world metal prices. – Impact of European financial crisis. – Increasing number of socio-environmental conflicts.
2. Social impact of increased rents? – Earmarked use of Mining and Oil/Gas fiscal receipts? – Indirect: Improved fiscal balances enable increased social
spending? – Indirect: Improved macroeconomic stability, debt reduction? vs.
currency appreciation? – Increased investment in Mining and Oil/Gas associated with
increasing socio/environmental conflicts in the region.
2013
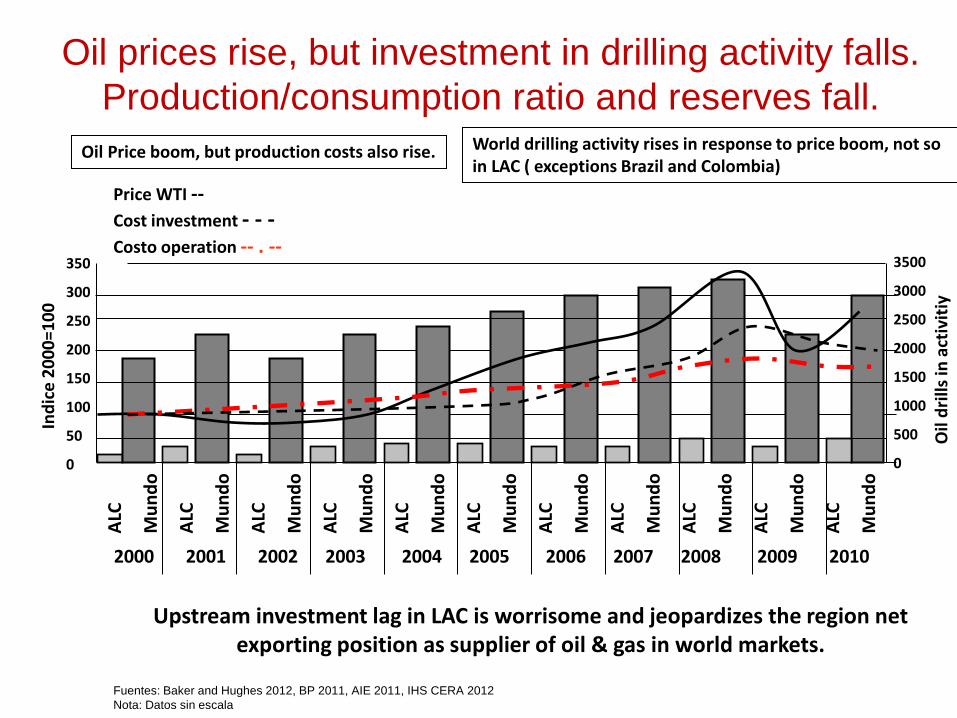
Oil prices rise, but investment in drilling activity falls. Production/consumption ratio and reserves fall.
Price WTI --
ALC
Mun
do
ALC
Mun
do
ALC
Mun
do
ALC
Mun
do
ALC
Mun
do
ALC
Mun
do
ALC
Mun
do
ALC
Mun
do
ALC
Mun
do
ALC
Mun
do
ALC
Mun
do
2000 2001 2002 2003 2004 2005 2006 2007 2008 2009 2010
350
300
250
200
150
100
50
0
3500
3000
2500
2000
1500
1000
500
0
Oil
drill
s in
activ
itiy
Indi
ce 2
000=
100
Cost investment - - - Costo operation -- . --
Fuentes: Baker and Hughes 2012, BP 2011, AIE 2011, IHS CERA 2012 Nota: Datos sin escala
Oil Price boom, but production costs also rise. World drilling activity rises in response to price boom, not so in LAC ( exceptions Brazil and Colombia)
Upstream investment lag in LAC is worrisome and jeopardizes the region net exporting position as supplier of oil & gas in world markets.
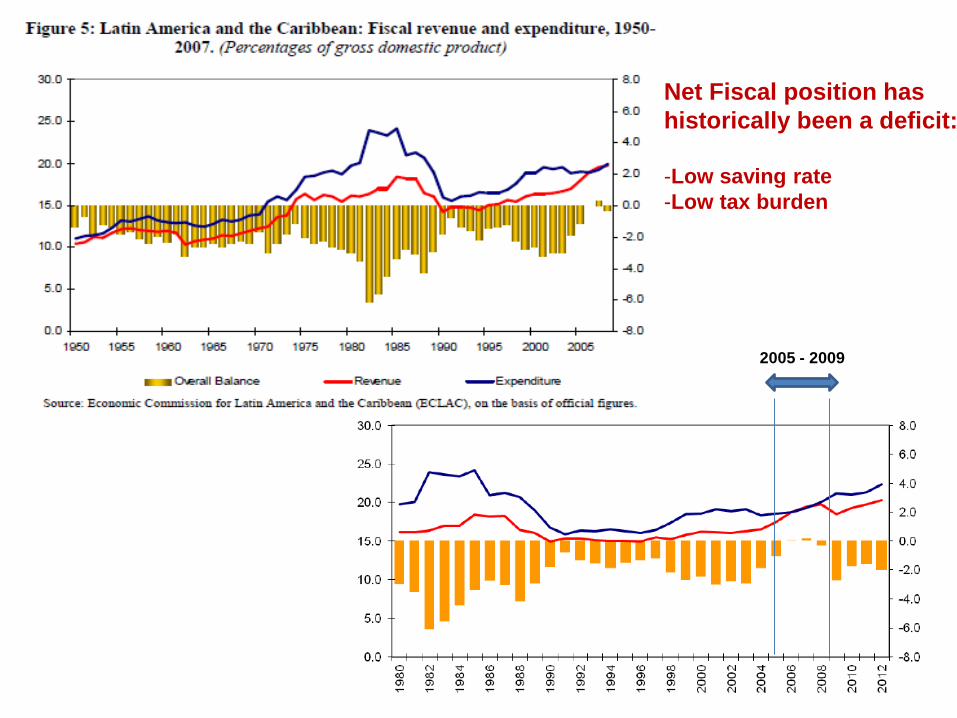
2005 - 2009
Net Fiscal position has historically been a deficit: -Low saving rate -Low tax burden
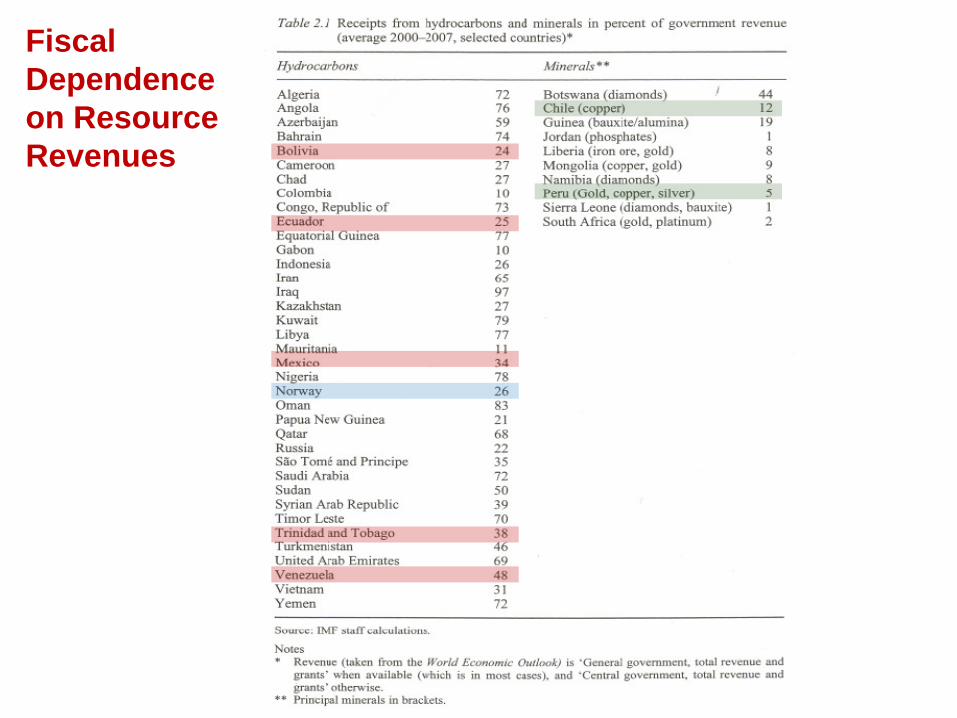
Fiscal Dependence on Resource Revenues

Resource Export Dependence (2007 peak year for mineral/oil prices before global financial crisis)

Lower tax burden relative to other regions. Within Lat. America resource exporters tend to lower tax burdens.

2005 - 2009
Back to business as usual after 2009?

Reserves / Production ratio is falling accross the region, except in Venezuela ( shows decreased investment in upstream
exploration)
0
10
20
30
40
50
60
70
80Ga
s Natu
ral
Petró
leo
Petro
leo&G
asNa
tura
l
Gas N
atura
l
Petró
leo
Petro
leo&G
asNa
tura
l
Total ALC Total ALC s/Venezuela
19952000200520092010
Gas Reserves fall 4x
Oil Reserves fall 2.5 x VEN VEN
Fuente: Comisión Económica para América Latina y el Caribe (CEPAL), sobre la base de BP2011.
Lat. Am. w/o Venezuela Lat. America

Mineral and Metal price index after 2009
Source: World Bank commodity indexes 2011
Mining Sector 2004-2011 Oil&Gas sector • Rents multiply x 2
• State appropriation 45-65% • Apprent “Regressivity” of rent
appropriation during boom???
• State Oil companies are the rule. • Use of progressive fiscal
instruments for rent capture ( windfall taxes, contratos PSC,
participación directa)
• Price cycle does not generate investment boom
• Decreasing production /consumption ratios and reserves
• Rising production costs. • POLICY CHALLENGE: How to
mobilize required investment to meet energy demand???
• Rents multiply x 4 • State appropriation < 33%
(benchmark int’l)
• Guatemala, Honduras < 13% of total rent appropriated by State
• Private concesion regimes, State participation the exception.
• Use of traditional fiscal instruments ( corporate income tax and royalties) Need to introduce PROGRESSIVE INSTRUMENTS i.e. Resource Rent Taxes (RRT) etc.
• Price cycle generates investment
boom, growing production. • POLICY CHALLENGE: How to achieve
more progressive fiscal regime? Under current contract rules.

Increasing socio-environmental conflicts to project development
90%
3% 3% 2% 2%
AGRICULTURA
PESCA
GANADERIA
COMERCIO
TURISMO
Elaborado con la información del Observatorio de Conflictos Socio-Ambientales en América Latina (OLCA)
Economic sector impacted

Thank you very much!!!!
ANNEXES
Jean Acquatella Ph.D. Energy and Natural Resources Unit
United Nations ECLAC Economic Commission for Latin America and the
Caribbean Santiago, Chile.
2013