Embed Size (px)
Citation preview

www.securities.com
Latin America and the Caribbean M&A report Q1 2014
www.emis.com
Latin America
Overview 3
Number of Deals 4
Number of Deals vs EBITDA Multiple 5
Deals by Sector 6
Deals by Country 8
Top 20 M&A Deals 9
Top 3 IPOs 11
LeagueBoard 12
DealMonitor 14
Key countries
Brazil 15
Mexico 17
Argentina 19
Colombia 21
Chile 23
Notes & Disclaimer
Latin America and the Caribbean: Q1 2014

› In Q1 2014, the volume of M&A activity in Latin America and the Caribbean was up by 12% y/y, while
the total value of negotiated deals rose by 22% to USD 22.9bn.
› Brazil was the hottest market, accounting for more than 50% of the total number of deals and of their
total value.
› The median EV/EBITDA multiple recovered y/y to 10.8x.
› The Services and Manufacturing sectors were the busiest in terms of number of deals.
› The largest transactions were registered in Transportation & Warehousing and Finance & Insurance.
› BTG Pactual and Mattos Filho, Veiga Filho, Marrey Jr. e Quiroga topped our LeagueBoard by deal value
for financial and legal advisors, respectively.
M&A volume, value increases y/y in first three months of 2014
Latin America and the Caribbean: Q1 2014
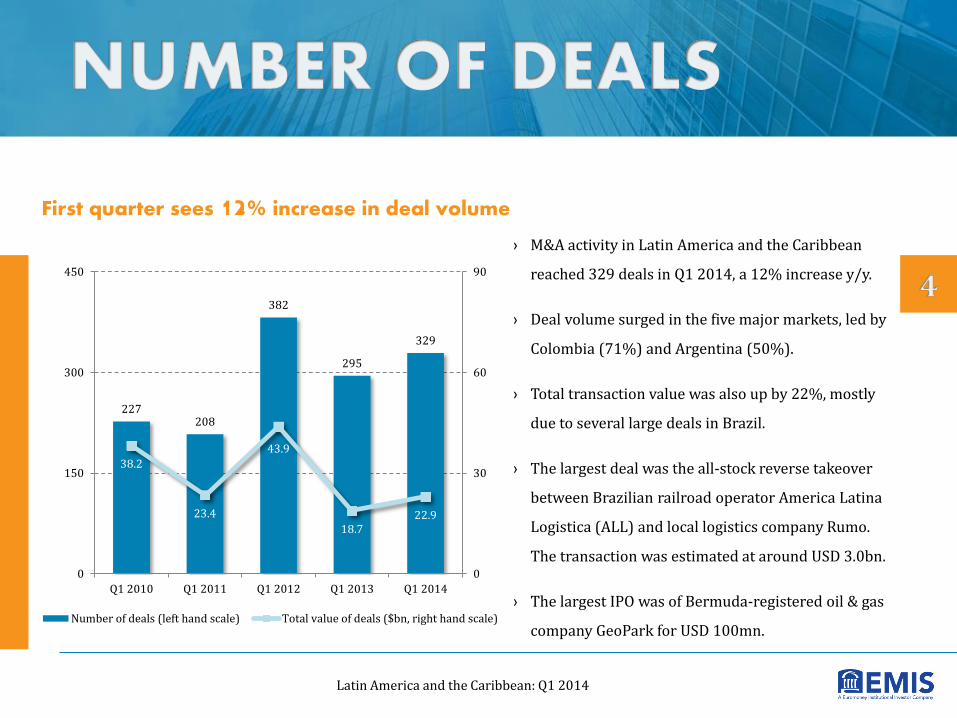
› M&A activity in Latin America and the Caribbean
reached 329 deals in Q1 2014, a 12% increase y/y.
› Deal volume surged in the five major markets, led by
Colombia (71%) and Argentina (50%).
› Total transaction value was also up by 22%, mostly
due to several large deals in Brazil.
› The largest deal was the all-stock reverse takeover
between Brazilian railroad operator America Latina
Logistica (ALL) and local logistics company Rumo.
The transaction was estimated at around USD 3.0bn.
› The largest IPO was of Bermuda-registered oil & gas
company GeoPark for USD 100mn.
First quarter sees 12% increase in deal volume
Latin America and the Caribbean: Q1 2014
227 208
382
295
329
38.2
23.4
43.9
18.7 22.9
0
30
60
90
0
150
300
450
Q1 2010 Q1 2011 Q1 2012 Q1 2013 Q1 2014
Number of deals (left hand scale) Total value of deals ($bn, right hand scale)
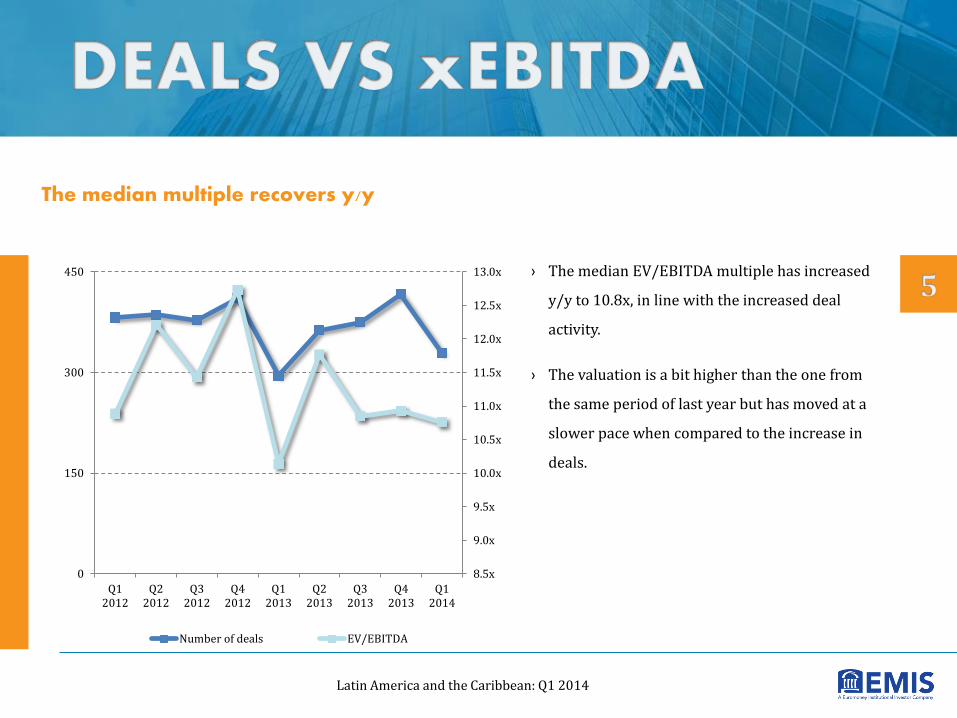
› The median EV/EBITDA multiple has increased
y/y to 10.8x, in line with the increased deal
activity.
› The valuation is a bit higher than the one from
the same period of last year but has moved at a
slower pace when compared to the increase in
deals.
The median multiple recovers y/y
Latin America and the Caribbean: Q1 2014
8.5x
9.0x
9.5x
10.0x
10.5x
11.0x
11.5x
12.0x
12.5x
13.0x
0
150
300
450
Q12012
Q22012
Q32012
Q42012
Q12013
Q22013
Q32013
Q42013
Q12014
Number of deals EV/EBITDA
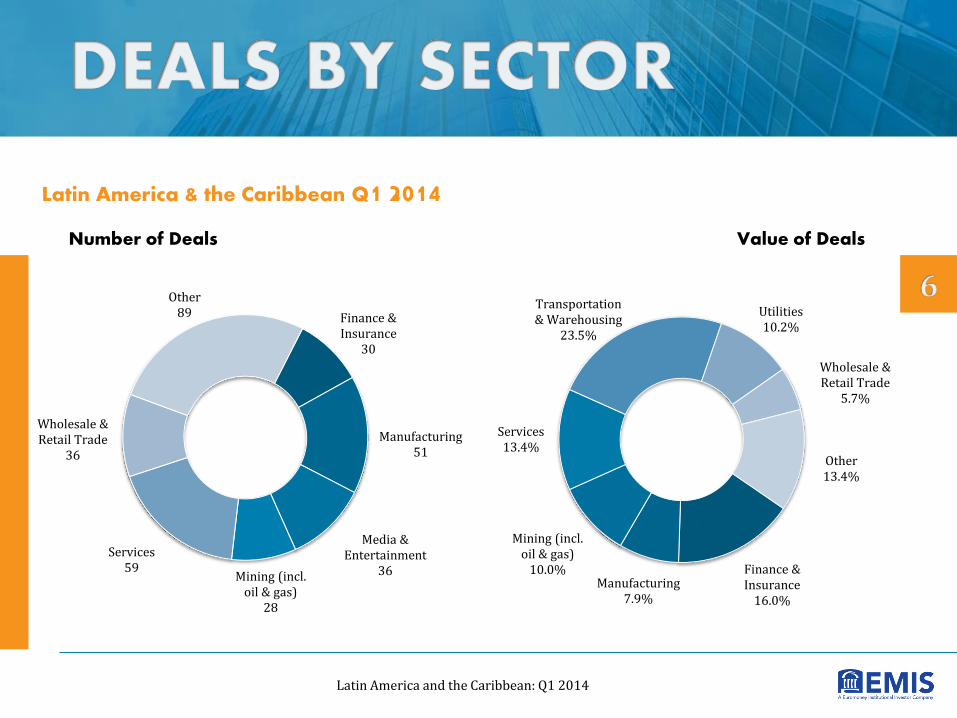
Number of Deals Value of Deals
Latin America & the Caribbean Q1 2014
Latin America and the Caribbean: Q1 2014
Finance & Insurance
30
Manufacturing 51
Media & Entertainment
36 Mining (incl. oil & gas)
28
Services 59
Wholesale & Retail Trade
36
Other 89
Finance & Insurance
16.0%
Manufacturing 7.9%
Mining (incl. oil & gas)
10.0%
Services 13.4%
Transportation & Warehousing
23.5%
Utilities 10.2%
Wholesale & Retail Trade
5.7%
Other 13.4%
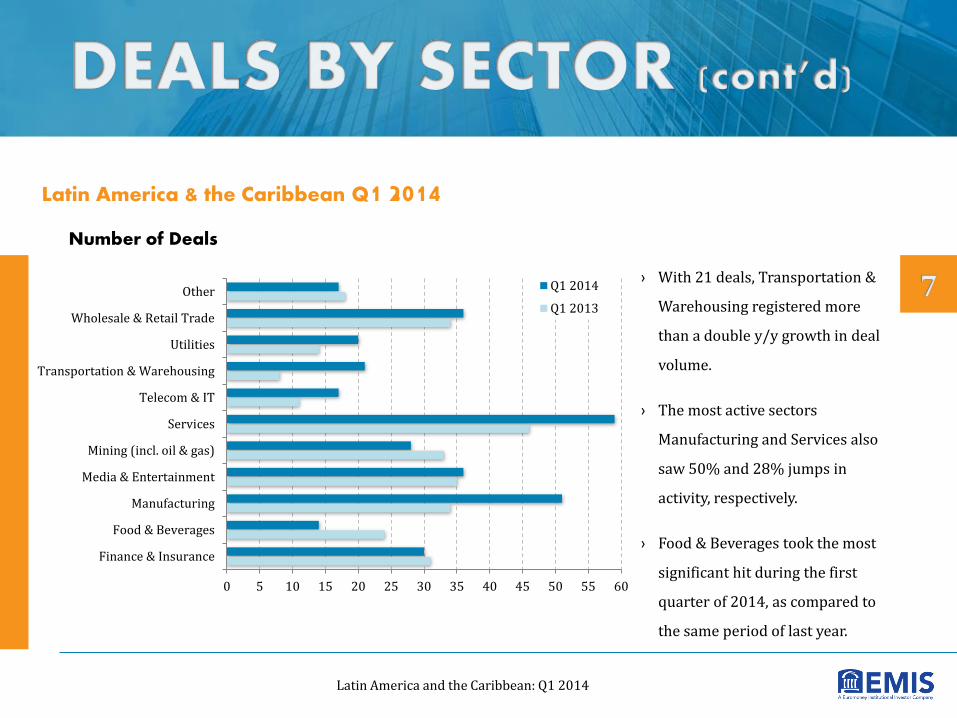
Number of Deals
› With 21 deals, Transportation &
Warehousing registered more
than a double y/y growth in deal
volume.
› The most active sectors
Manufacturing and Services also
saw 50% and 28% jumps in
activity, respectively.
› Food & Beverages took the most
significant hit during the first
quarter of 2014, as compared to
the same period of last year.
Latin America and the Caribbean: Q1 2014
Latin America & the Caribbean Q1 2014
0 5 10 15 20 25 30 35 40 45 50 55 60
Finance & Insurance
Food & Beverages
Manufacturing
Media & Entertainment
Mining (incl. oil & gas)
Services
Telecom & IT
Transportation & Warehousing
Utilities
Wholesale & Retail Trade
Other Q1 2014
Q1 2013
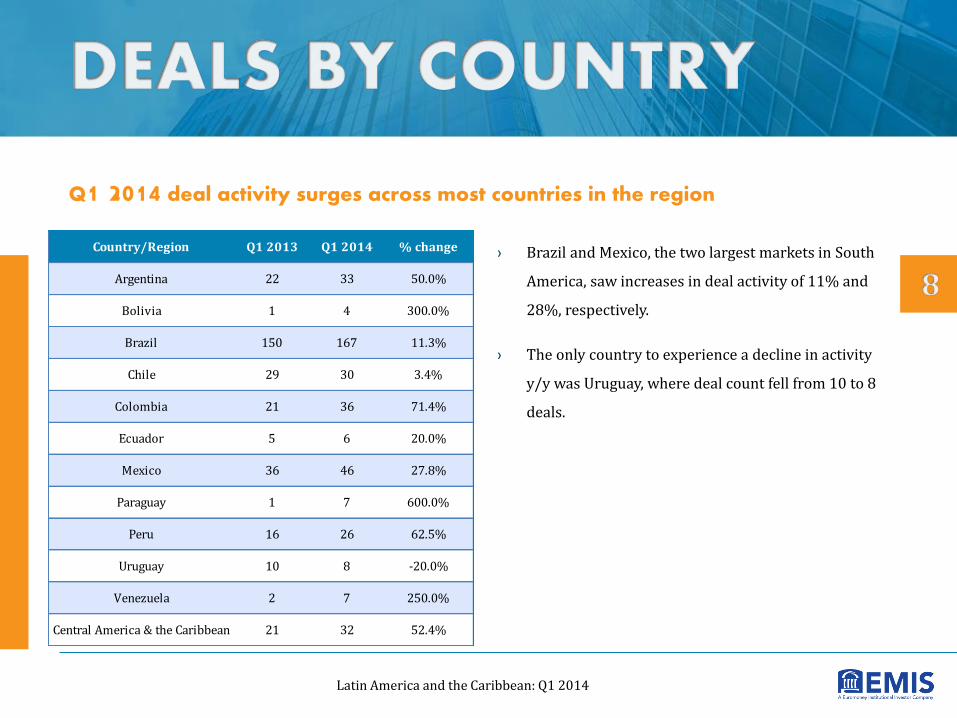
Q1 2014 deal activity surges across most countries in the region
› Brazil and Mexico, the two largest markets in South
America, saw increases in deal activity of 11% and
28%, respectively.
› The only country to experience a decline in activity
y/y was Uruguay, where deal count fell from 10 to 8
deals.
Latin America and the Caribbean: Q1 2014
Country/Region Q1 2013 Q1 2014 % change
Argentina 22 33 50.0%
Bolivia 1 4 300.0%
Brazil 150 167 11.3%
Chile 29 30 3.4%
Colombia 21 36 71.4%
Ecuador 5 6 20.0%
Mexico 36 46 27.8%
Paraguay 1 7 600.0%
Peru 16 26 62.5%
Uruguay 10 8 -20.0%
Venezuela 2 7 250.0%
Central America & the Caribbean 21 32 52.4%

Target Company Country of Target
Industry Deal Type Buyer Country of Buyer
Deal Value (USD mn)
1. ALL - America Latina Logistica SA
Brazil Transportation & Warehousing
Acquisition (100%)
Rumo Logistica Operadora Multimodal SA
Brazil 2,973.1 (Official data)
2. CorpBanca SA Chile Finance & Insurance
Minority stake purchase (33.6%)
Itau Unibanco Holding SA Brazil 2,205.0 (DW estimate)
3. 34 properties in Brazil Brazil Services Acquisition (100%)
Global Logistic Properties Ltd Singapore 1,359.1 (Official data)
4. Block BC-10 in Campos Basin
Brazil Mining (incl. oil & gas)
Minority stake purchase (23%)
Qatar Petroleum Co Qatar 1,000.0 (Official data)
5. Grupo Notre Dame Intermedica
Brazil Finance & Insurance
Acquisition (100%)
Bain Capital LLC United States 861.2 (Market estimate)
6. Argentinean operations of Apache Corp
Argentina Mining (incl. oil & gas)
Acquisition (100%)
YPF SA Argentina 800.0 (Official data)
7. Grupo Fermaca SA de CV Mexico Transportation & Warehousing
Acquisition (n.a. %)
Partners Group AG; private investors
Switzerland 750.0 (Official data)
8. Empresa Electrica Guacolda SA
Chile Utilities Acquisition (50%)
AES Gener SA Chile 728.0 (Official data)
9. Siderurgica del Orinoco CA (Sidor)
Venezuela Manufacturing Minority stake purchase (20%)
Government of Venezuela Venezuela 668.0 (Market estimate)
10. BRF SA Brazil Food & Beverages
Minority stake purchase (3.8%)
GIC Pvt Ltd Singapore 644.7 (DW estimate)
Latin America and the Caribbean: Q1 2014
The largest deal in Q1 2014 was the reverse takeover between Brazilian
logistics companies ALL and Rumo
The list does not include the alleged sale to Batista family of the equity interest held by Bertin family in Brazilian meat producer JBS SA, estimated to be worth some USD 2bn.
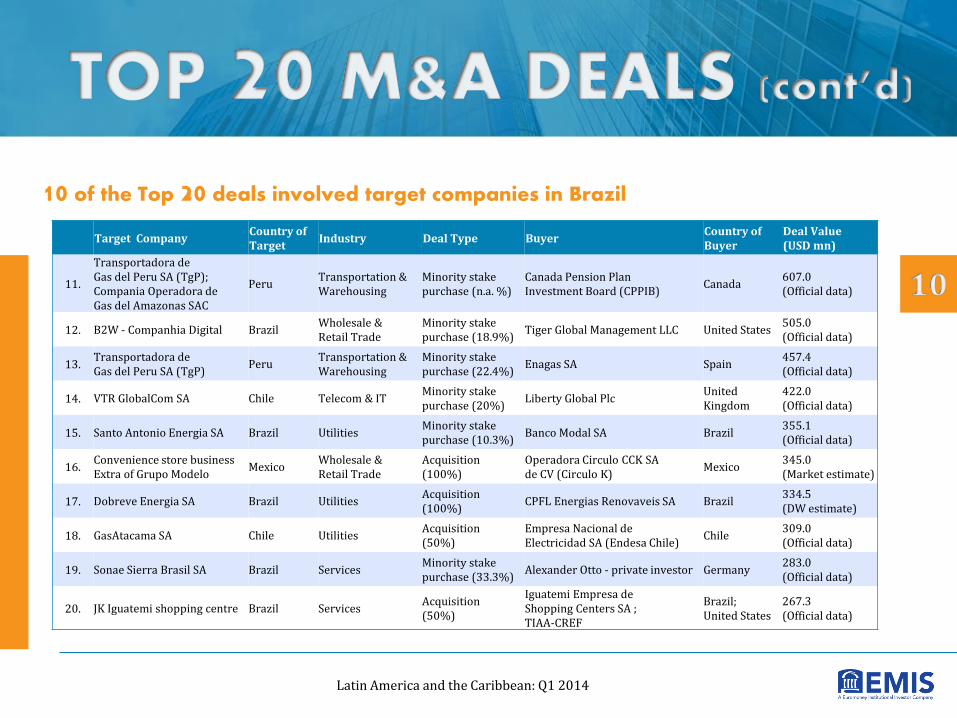
10 of the Top 20 deals involved target companies in Brazil
Target Company Country of Target
Industry Deal Type Buyer Country of Buyer
Deal Value (USD mn)
11.
Transportadora de Gas del Peru SA (TgP); Compania Operadora de Gas del Amazonas SAC
Peru Transportation & Warehousing
Minority stake purchase (n.a. %)
Canada Pension Plan Investment Board (CPPIB)
Canada 607.0 (Official data)
12. B2W - Companhia Digital Brazil Wholesale & Retail Trade
Minority stake purchase (18.9%)
Tiger Global Management LLC United States 505.0 (Official data)
13. Transportadora de Gas del Peru SA (TgP)
Peru Transportation & Warehousing
Minority stake purchase (22.4%)
Enagas SA Spain 457.4 (Official data)
14. VTR GlobalCom SA Chile Telecom & IT Minority stake purchase (20%)
Liberty Global Plc United Kingdom
422.0 (Official data)
15. Santo Antonio Energia SA Brazil Utilities Minority stake purchase (10.3%)
Banco Modal SA Brazil 355.1 (Official data)
16. Convenience store business Extra of Grupo Modelo
Mexico Wholesale & Retail Trade
Acquisition (100%)
Operadora Circulo CCK SA de CV (Circulo K)
Mexico 345.0 (Market estimate)
17. Dobreve Energia SA Brazil Utilities Acquisition (100%)
CPFL Energias Renovaveis SA Brazil 334.5 (DW estimate)
18. GasAtacama SA Chile Utilities Acquisition (50%)
Empresa Nacional de Electricidad SA (Endesa Chile)
Chile 309.0 (Official data)
19. Sonae Sierra Brasil SA Brazil Services Minority stake purchase (33.3%)
Alexander Otto - private investor Germany 283.0 (Official data)
20. JK Iguatemi shopping centre Brazil Services Acquisition (50%)
Iguatemi Empresa de Shopping Centers SA ; TIAA-CREF
Brazil; United States
267.3 (Official data)
Latin America and the Caribbean: Q1 2014

The largest IPO during the first three months of 2014 was of Bermuda-
registered, Latin America-focused oil & gas company GeoPark
Target Company Country of Target Industry Stake Deal Value (USD mn)
1. GeoPark Ltd Bermuda, Argentina Mining (incl. oil & gas)
23.5% 100.1 (Official data)
2. Petrolera Pampa SA Argentina Mining (incl. oil & gas)
50.0% 15.2 (Official data)
3. Margaritaville (Turks) Ltd Turks and Caicos Islands Services 31.3% 2.1 (Official data)
Latin America and the Caribbean: Q1 2014
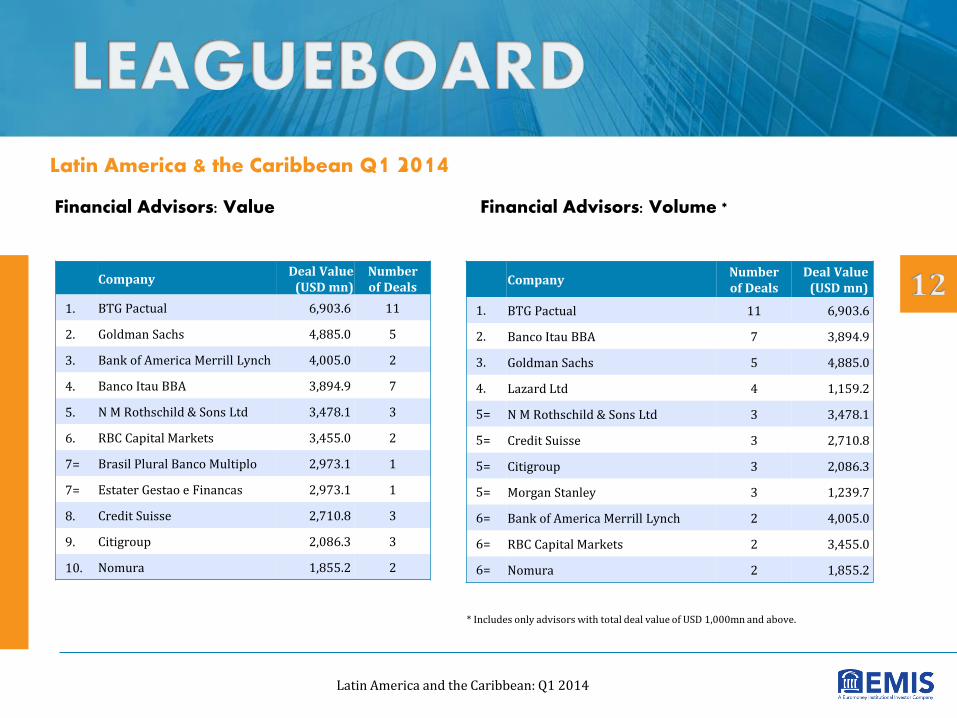
Financial Advisors: Value Financial Advisors: Volume *
Latin America & the Caribbean Q1 2014
Company Deal Value
(USD mn) Number of Deals
1. BTG Pactual 6,903.6 11
2. Goldman Sachs 4,885.0 5
3. Bank of America Merrill Lynch 4,005.0 2
4. Banco Itau BBA 3,894.9 7
5. N M Rothschild & Sons Ltd 3,478.1 3
6. RBC Capital Markets 3,455.0 2
7= Brasil Plural Banco Multiplo 2,973.1 1
7= Estater Gestao e Financas 2,973.1 1
8. Credit Suisse 2,710.8 3
9. Citigroup 2,086.3 3
10. Nomura 1,855.2 2
Company Number of Deals
Deal Value (USD mn)
1. BTG Pactual 11 6,903.6
2. Banco Itau BBA 7 3,894.9
3. Goldman Sachs 5 4,885.0
4. Lazard Ltd 4 1,159.2
5= N M Rothschild & Sons Ltd 3 3,478.1
5= Credit Suisse 3 2,710.8
5= Citigroup 3 2,086.3
5= Morgan Stanley 3 1,239.7
6= Bank of America Merrill Lynch 2 4,005.0
6= RBC Capital Markets 2 3,455.0
6= Nomura 2 1,855.2
* Includes only advisors with total deal value of USD 1,000mn and above.
Latin America and the Caribbean: Q1 2014
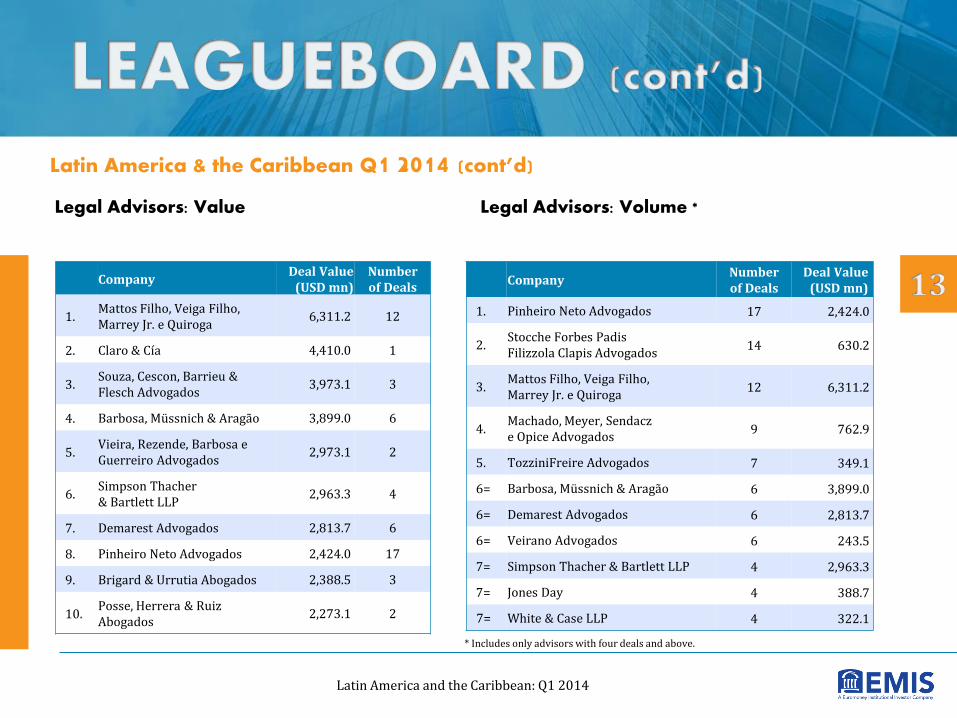
Legal Advisors: Value Legal Advisors: Volume *
Latin America & the Caribbean Q1 2014 (cont’d)
Company Deal Value
(USD mn) Number of Deals
1. Mattos Filho, Veiga Filho, Marrey Jr. e Quiroga
6,311.2 12
2. Claro & Cía 4,410.0 1
3. Souza, Cescon, Barrieu & Flesch Advogados
3,973.1 3
4. Barbosa, Müssnich & Aragão 3,899.0 6
5. Vieira, Rezende, Barbosa e Guerreiro Advogados
2,973.1 2
6. Simpson Thacher & Bartlett LLP
2,963.3 4
7. Demarest Advogados 2,813.7 6
8. Pinheiro Neto Advogados 2,424.0 17
9. Brigard & Urrutia Abogados 2,388.5 3
10. Posse, Herrera & Ruiz Abogados
2,273.1 2
Company Number of Deals
Deal Value (USD mn)
1. Pinheiro Neto Advogados 17 2,424.0
2. Stocche Forbes Padis Filizzola Clapis Advogados
14 630.2
3. Mattos Filho, Veiga Filho, Marrey Jr. e Quiroga
12 6,311.2
4. Machado, Meyer, Sendacz e Opice Advogados
9 762.9
5. TozziniFreire Advogados 7 349.1
6= Barbosa, Müssnich & Aragão 6 3,899.0
6= Demarest Advogados 6 2,813.7
6= Veirano Advogados 6 243.5
7= Simpson Thacher & Bartlett LLP 4 2,963.3
7= Jones Day 4 388.7
7= White & Case LLP 4 322.1
* Includes only advisors with four deals and above.
Latin America and the Caribbean: Q1 2014

Number of new deal intentions in Latin America & the Caribbean
› The number of buy side intentions has been
declining for four quarters in a row, reaching only
20 intentions in Q1 2014.
› Compared to the same quarter of last year, the
number slumped dramatically by 65%.
› Buy side refers to companies looking to acquire
other companies or assets. Sell side refers to
companies searching for potential investors.
› The number of new deal intentions includes
official statements by companies, market rumors
as well as exclusive information collected by our
analysts and journalists.
Latin America and the Caribbean: Q1 2014
57
47
34
27
20
54 57
47
34
27
0
25
50
75
Q1 2013 Q2 2013 Q3 2013 Q4 2013 Q1 2014
Buy side Sell side
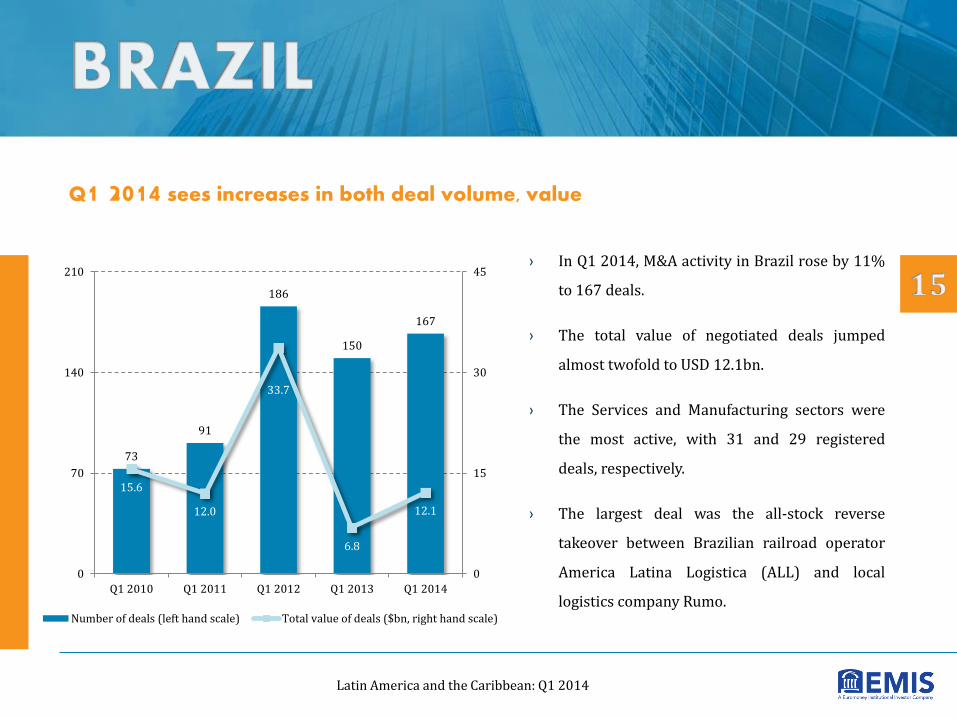
Q1 2014 sees increases in both deal volume, value
› In Q1 2014, M&A activity in Brazil rose by 11%
to 167 deals.
› The total value of negotiated deals jumped
almost twofold to USD 12.1bn.
› The Services and Manufacturing sectors were
the most active, with 31 and 29 registered
deals, respectively.
› The largest deal was the all-stock reverse
takeover between Brazilian railroad operator
America Latina Logistica (ALL) and local
logistics company Rumo.
Latin America and the Caribbean: Q1 2014
73
91
186
150
167
15.6
12.0
33.7
6.8
12.1
0
15
30
45
0
70
140
210
Q1 2010 Q1 2011 Q1 2012 Q1 2013 Q1 2014
Number of deals (left hand scale) Total value of deals ($bn, right hand scale)

Top 10 Deals Q1 2014
Target Company Industry Deal Type Buyer Country of Buyer
Deal Value (USD mn)
1. ALL - America Latina Logistica SA Transportation & Warehousing
Acquisition (100%) Rumo Logistica Operadora Multimodal SA
Brazil 2,973.1 (Official data)
2. 34 properties in Brazil Services Acquisition (100%) Global Logistic Properties Ltd Singapore 1,359.1 (Official data)
3. Block BC-10 in Campos Basin
Mining (incl. oil & gas)
Minority stake purchase (23%)
Qatar Petroleum Co Qatar 1,000.0 (Official data)
4. Grupo Notre Dame Intermedica Finance & Insurance
Acquisition (100%) Bain Capital LLC United States 861.2 (Market estimate)
5. BRF SA Food & Beverages
Minority stake purchase (3.8%)
GIC Pvt Ltd Singapore 644.7 (DW estimate)
6. B2W - Companhia Digital Wholesale & Retail Trade
Minority stake purchase (18.9%)
Tiger Global Management LLC United States 505.0 (Official data)
7. Santo Antonio Energia SA Utilities Minority stake purchase (10.3%)
Banco Modal SA Brazil 355.1 (Official data)
8. Dobreve Energia SA Utilities Acquisition (100%)
CPFL Energias Renovaveis SA Brazil 334.5 (DW estimate)
9. Sonae Sierra Brasil SA Services Minority stake purchase (33.3%)
Alexander Otto - private investor Germany 283.0 (Official data)
10. JK Iguatemi shopping centre Services Acquisition (50%)
Iguatemi Empresa de Shopping Centers SA ; TIAA-CREF
Brazil; United States
267.3 (Official data)
Latin America and the Caribbean: Q1 2014
The list does not include the alleged sale to Batista family of the equity interest held by Bertin family in Brazilian meat producer JBS SA, estimated to be worth some USD 2bn.

Value of negotiated deals drops three times in Q1 2014
› During the first three months, M&A in Mexico
saw a 28% increase in deal flow but the total
transaction value slumped to USD 1.6bn.
› The most active sector was Services, followed
by Manufacturing and Wholesale & Retail
Trade.
› The largest deal was the purchase of an
undisclosed majority stake in local gas
infrastructure company Grupo Fermaca by a
Swiss private equity fund for USD 750mn.
34
15
34 36
46
8.0
1.1
0.7
5.5
1.6 0
5
10
15
0
18
36
54
Q1 2010 Q1 2011 Q1 2012 Q1 2013 Q1 2014
Number of deals (left hand scale) Total value of deals ($bn, right hand scale)
Latin America and the Caribbean: Q1 2014
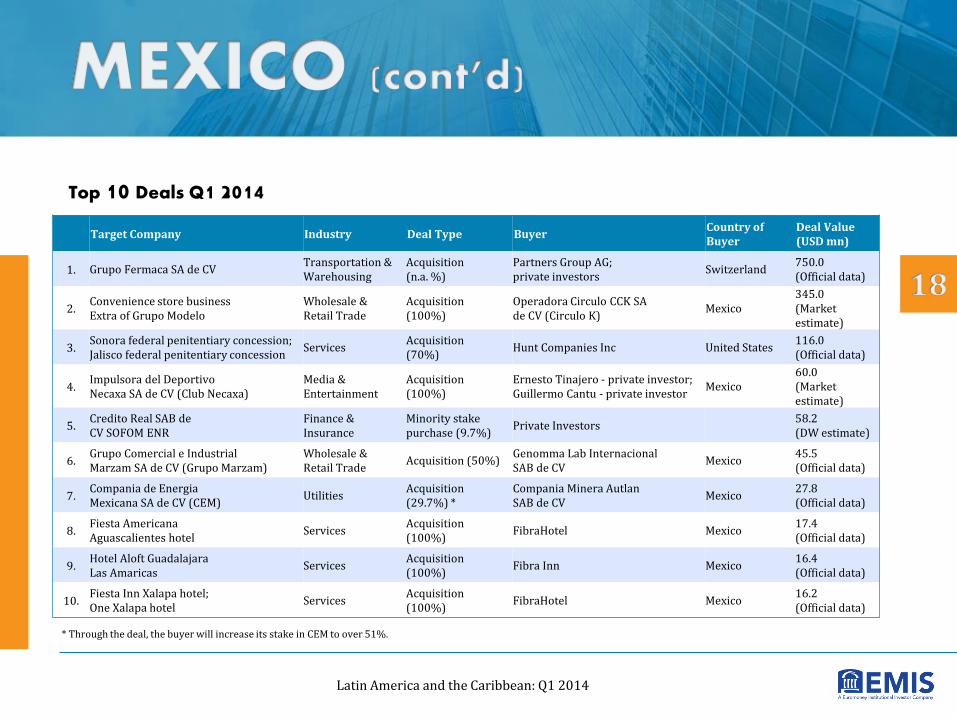
Target Company Industry Deal Type Buyer Country of Buyer
Deal Value (USD mn)
1. Grupo Fermaca SA de CV Transportation & Warehousing
Acquisition (n.a. %)
Partners Group AG; private investors
Switzerland 750.0 (Official data)
2. Convenience store business Extra of Grupo Modelo
Wholesale & Retail Trade
Acquisition (100%)
Operadora Circulo CCK SA de CV (Circulo K)
Mexico 345.0 (Market estimate)
3. Sonora federal penitentiary concession; Jalisco federal penitentiary concession
Services Acquisition (70%)
Hunt Companies Inc United States 116.0 (Official data)
4. Impulsora del Deportivo Necaxa SA de CV (Club Necaxa)
Media & Entertainment
Acquisition (100%)
Ernesto Tinajero - private investor; Guillermo Cantu - private investor
Mexico 60.0 (Market estimate)
5. Credito Real SAB de CV SOFOM ENR
Finance & Insurance
Minority stake purchase (9.7%)
Private Investors 58.2 (DW estimate)
6. Grupo Comercial e Industrial Marzam SA de CV (Grupo Marzam)
Wholesale & Retail Trade
Acquisition (50%) Genomma Lab Internacional SAB de CV
Mexico 45.5 (Official data)
7. Compania de Energia Mexicana SA de CV (CEM)
Utilities Acquisition (29.7%) *
Compania Minera Autlan SAB de CV
Mexico 27.8 (Official data)
8. Fiesta Americana Aguascalientes hotel
Services Acquisition (100%)
FibraHotel Mexico 17.4 (Official data)
9. Hotel Aloft Guadalajara Las Amaricas
Services Acquisition (100%)
Fibra Inn Mexico 16.4 (Official data)
10. Fiesta Inn Xalapa hotel; One Xalapa hotel
Services Acquisition (100%)
FibraHotel Mexico 16.2 (Official data)
Top 10 Deals Q1 2014
Latin America and the Caribbean: Q1 2014
* Through the deal, the buyer will increase its stake in CEM to over 51%.

Deal volume, value surges in first three months
› With 33 deals, Argentina registered a 50%
increase in deal activity y/y.
› The total value of negotiated transactions also
rose dramatically y/y to USD 1.1bn, a record
high for the period in the past 3 years.
› Mining (incl. oil & gas) was the most active
sector and also saw the most expensive deals
overall.
› The largest deal was the acquisition by
Argentinean oil & gas company YPF of the local
operations of U.S. peer Apache Corp for USD
800mn.
33 34
41
22
33
4.0
2.7
0.7 0.5
1.1
0
2
4
6
0
15
30
45
Q1 2010 Q1 2011 Q1 2012 Q1 2013 Q1 2014
Number of deals (left hand scale) Total value of deals ($bn, right hand scale)
Latin America and the Caribbean: Q1 2014

Target Company Industry Deal Type Buyer Country of Buyer Deal Value (USD mn)
1. Argentinean operations of Apache Corp
Mining (incl. oil & gas)
Acquisition (100%)
YPF SA Argentina 800.0 (Official data)
2. Three concessions and five JV contracts of YPF
Mining (incl. oil & gas)
Acquisition (100%)
Pluspetrol SA Argentina 217.0 (Official data)
3. Puesto Hernandez oil concession Mining (incl. oil & gas)
Minority stake purchase (38.5%)
YPF SA Argentina 40.7 (Official data)
4. Laboratorios Biagro SA Manufacturing Acquisition (100%)
Bayer AG United States 35.0 (Market estimate)
5. Trilenium SA Media & Entertainment
Acquisition (50%)
Cristobal Lopez – private investor
Argentina 15.8 (Official data)
Top 5 Deals Q1 2014
Latin America and the Caribbean: Q1 2014
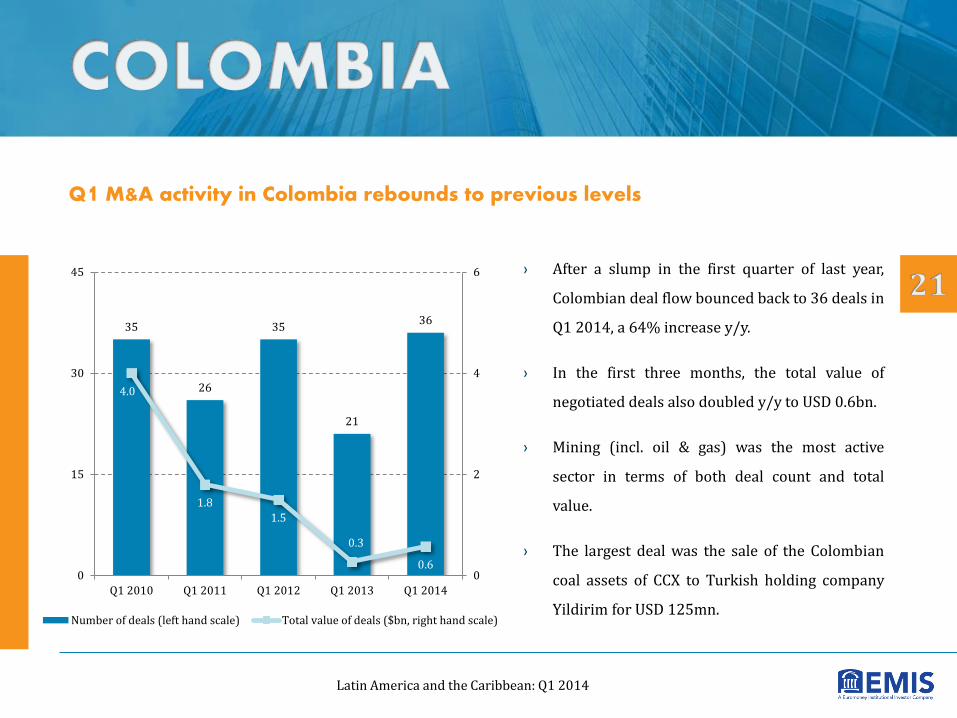
Q1 M&A activity in Colombia rebounds to previous levels
› After a slump in the first quarter of last year,
Colombian deal flow bounced back to 36 deals in
Q1 2014, a 64% increase y/y.
› In the first three months, the total value of
negotiated deals also doubled y/y to USD 0.6bn.
› Mining (incl. oil & gas) was the most active
sector in terms of both deal count and total
value.
› The largest deal was the sale of the Colombian
coal assets of CCX to Turkish holding company
Yildirim for USD 125mn.
35
26
35
21
36
4.0
1.8
1.5
0.3
0.6 0
2
4
6
0
15
30
45
Q1 2010 Q1 2011 Q1 2012 Q1 2013 Q1 2014
Number of deals (left hand scale) Total value of deals ($bn, right hand scale)
Latin America and the Caribbean: Q1 2014
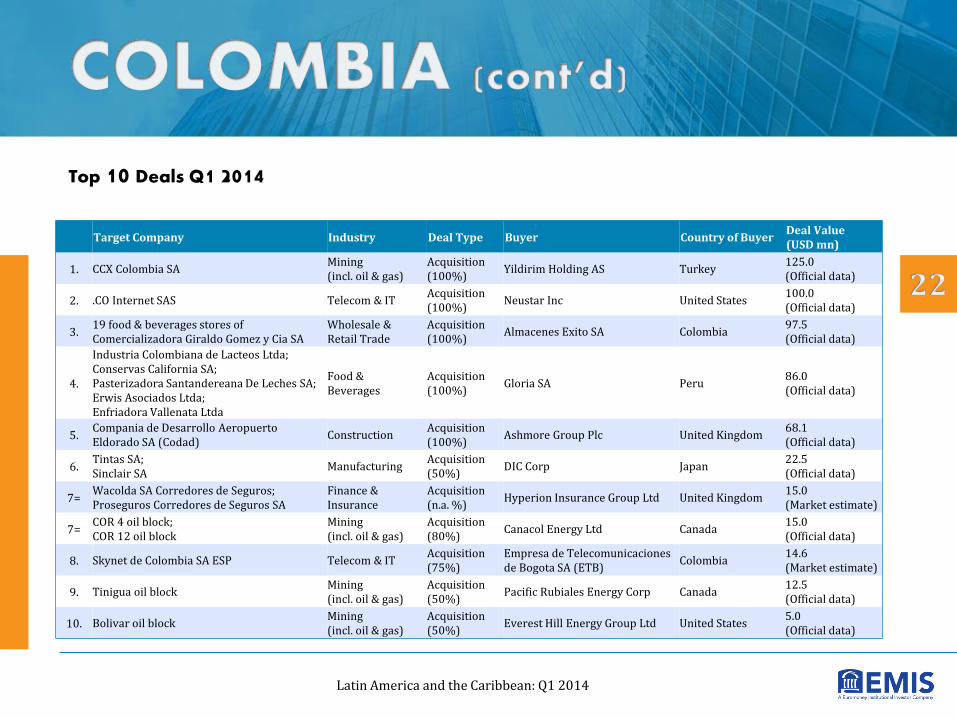
Target Company Industry Deal Type Buyer Country of Buyer Deal Value (USD mn)
1. CCX Colombia SA Mining (incl. oil & gas)
Acquisition (100%)
Yildirim Holding AS Turkey 125.0 (Official data)
2. .CO Internet SAS Telecom & IT Acquisition (100%)
Neustar Inc United States 100.0 (Official data)
3. 19 food & beverages stores of Comercializadora Giraldo Gomez y Cia SA
Wholesale & Retail Trade
Acquisition (100%)
Almacenes Exito SA Colombia 97.5 (Official data)
4.
Industria Colombiana de Lacteos Ltda; Conservas California SA; Pasterizadora Santandereana De Leches SA; Erwis Asociados Ltda; Enfriadora Vallenata Ltda
Food & Beverages
Acquisition (100%)
Gloria SA Peru 86.0 (Official data)
5. Compania de Desarrollo Aeropuerto Eldorado SA (Codad)
Construction Acquisition (100%)
Ashmore Group Plc United Kingdom 68.1 (Official data)
6. Tintas SA; Sinclair SA
Manufacturing Acquisition (50%)
DIC Corp Japan 22.5 (Official data)
7= Wacolda SA Corredores de Seguros; Proseguros Corredores de Seguros SA
Finance & Insurance
Acquisition (n.a. %)
Hyperion Insurance Group Ltd United Kingdom 15.0 (Market estimate)
7= COR 4 oil block; COR 12 oil block
Mining (incl. oil & gas)
Acquisition (80%)
Canacol Energy Ltd Canada 15.0 (Official data)
8. Skynet de Colombia SA ESP Telecom & IT Acquisition (75%)
Empresa de Telecomunicaciones de Bogota SA (ETB)
Colombia 14.6 (Market estimate)
9. Tinigua oil block Mining (incl. oil & gas)
Acquisition (50%)
Pacific Rubiales Energy Corp Canada 12.5 (Official data)
10. Bolivar oil block Mining (incl. oil & gas)
Acquisition (50%)
Everest Hill Energy Group Ltd United States 5.0 (Official data)
Top 10 Deals Q1 2014
Latin America and the Caribbean: Q1 2014

Deal volume remains flat y/y
› With 30 registered deals, M&A activity in Chile
remained flat y/y in Q1 2014.
› The total value of negotiated transactions,
however, surged more than three times to USD
4bn due to a couple of very large deals.
› Utilities was the most active sector and also
registered the most expensive deals on average.
› The largest deal was the purchase of 33.6% in
local bank CorpBanka by Brazil’s Itau Unibanco.
The all-equity transaction was estimated by
DealWatch at USD 2.2bn.
31
22
51
29 30
4.7
2.7 2.8
1.2
4.0
0
3
6
9
0
20
40
60
Q1 2010 Q1 2011 Q1 2012 Q1 2013 Q1 2014
Number of deals (left hand scale) Total value of deals ($bn, right hand scale)
Latin America and the Caribbean: Q1 2014
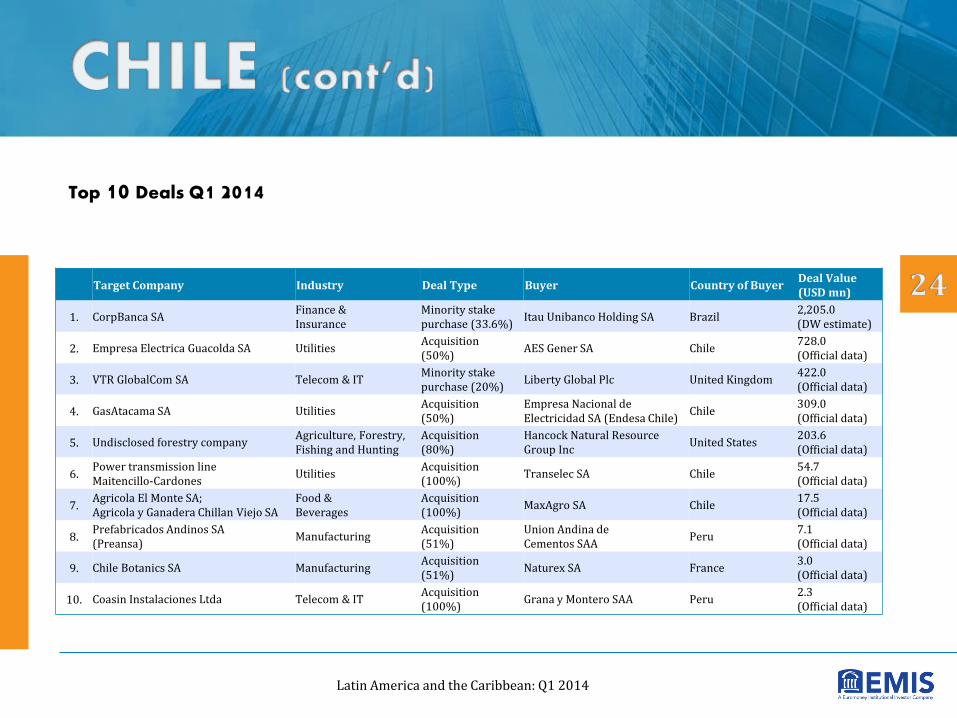
Target Company Industry Deal Type Buyer Country of Buyer Deal Value (USD mn)
1. CorpBanca SA Finance & Insurance
Minority stake purchase (33.6%)
Itau Unibanco Holding SA Brazil 2,205.0 (DW estimate)
2. Empresa Electrica Guacolda SA Utilities Acquisition (50%)
AES Gener SA Chile 728.0 (Official data)
3. VTR GlobalCom SA Telecom & IT Minority stake purchase (20%)
Liberty Global Plc United Kingdom 422.0 (Official data)
4. GasAtacama SA Utilities Acquisition (50%)
Empresa Nacional de Electricidad SA (Endesa Chile)
Chile 309.0 (Official data)
5. Undisclosed forestry company Agriculture, Forestry, Fishing and Hunting
Acquisition (80%)
Hancock Natural Resource Group Inc
United States 203.6 (Official data)
6. Power transmission line Maitencillo-Cardones
Utilities Acquisition (100%)
Transelec SA Chile 54.7 (Official data)
7. Agricola El Monte SA; Agricola y Ganadera Chillan Viejo SA
Food & Beverages
Acquisition (100%)
MaxAgro SA Chile 17.5 (Official data)
8. Prefabricados Andinos SA (Preansa)
Manufacturing Acquisition (51%)
Union Andina de Cementos SAA
Peru 7.1 (Official data)
9. Chile Botanics SA Manufacturing Acquisition (51%)
Naturex SA France 3.0 (Official data)
10. Coasin Instalaciones Ltda Telecom & IT Acquisition (100%)
Grana y Montero SAA Peru 2.3 (Official data)
Top 10 Deals Q1 2014
Latin America and the Caribbean: Q1 2014

This document covers the transactions recorded in the EMIS Professional M&A database that are fitting the following criteria:
• Geography: We have listed transactions with target companies located in the following countries: Argentina, Bolivia, Brazil, Chile, Colombia, Ecuador, Mexico, Paraguay, Peru, Uruguay, Venezuela and Central America & the Caribbean
• Deal Status: Announced or Closed
• Market: only M&A transaction are included; IPO deals are listed separately
• Excluded Deal Types: Restructurings within one holding (no change in ownership), joint ventures, IPOs, SPOs, buy-backs of shares and debt-to-equity swaps
• Deal Size: USD 1 million and above. In cases where not clearly indicated, it is assumed that the reported deal value does not include debt.
• Announcement Date: 01 January 2014 – 31 March 2014
If the deal value is not reported or estimated, it is considered to be zero in calculations. Top deals are selected by announced or estimated deal values.
For deals that involve targets operating in more than one country, the deal value is broken down and allocated across all countries involved. The allocation is done based on each country’s contributions to the overall revenues of the target company. The resulting allocated value is included in the volume of deals and the sector breakdowns for each profiled country and for Latin America.
The list of top deals for each country includes only deals where the target’s operations are restricted to the respective country. The list of top deals for Latin America may include deals where the target operates in multiple countries in the region.
LeagueBoard data is based on DealWatch intelligence and information provided by advisors. In the LeagueBoard we have taken into consideration the deals subject to the criteria described above, however geography was extended for deals with either a buyer, seller or a target located in Latin America.
Data collection was closed on 04 April 2014.
Contacts:
Web: www.emis.com
E-mail: [email protected]
Disclaimer:
The material is based on sources which we believe are reliable, but no warranty, either expressed or implied, is provided in relation to the accuracy or completeness of the information. The views expressed are our best judgment as of the date of issue and are subject to change without notice. EMIS and Euromoney Institutional Investor PLC take no responsibility for decisions made on the basis of these opinions.
Any redistribution of this information is strictly prohibited. Copyright © 2014 EMIS, all rights reserved. A Euromoney Institutional Investor company.
Latin America and the Caribbean: Q1 2014